
Abstract
Solar energy is abundant, and technological advances have made solar energy systems more affordable than ever before. Using photovoltaic (PV) systems could significantly reduce our reliance on fossil fuels, and facilitate sustainable energy uses. Solar power utilities, such as self-compacting disposal bins could be used to enhance waste management processes. This is particularly important in Canada, where $3.3 billion was spent on waste management systems in 2016. In this study, solar irradiance and climatic conditions at eight locations on a University campus in Regina, Saskatchewan, are studied. Results suggest that solar utilities with automatically adjusting PV receivers could increase energy capture between 18.7 – 27.5%. Temporally, solar irradiance was similar in June and July, but lower in August. Statistical analysis found that some locations tended to be more susceptible to shadow effects. The results highlight the importance of spatial allocations of these small smart disposal bin systems. Regression analysis found that temperature was the most significant factor when relating climate to solar irradiance. The use of smart disposal bins fits well with the University’s 2020–2025 Strategic Plan of reduction in ecological footprint.
Keywords
Introduction
The use of fossil fuels and non-renewable resources for energy has had a huge cost for humanity and the environment, ranging from air and water pollution due to nitrogen oxides to global warming due to greenhouse gas emissions.1,2 In 2019, about 80% of total primary energy production in the United States was provided by fossil fuels such as petroleum, natural gas, and coal. 3 Similar trends were observed in Canada, with 74% of primary energy supply provided by fossil fuels in 2016. 4 Solar energy is one of the most abundant energy source alternatives and its utilization helps to build a more sustainable society. The sun provides enough energy in one hour to satisfy the world’s yearly energy demand 5 ; meaning that harvesting 0.02% of all incoming solar radiation would theoretically meet the current energy needs of all civilizations. Furthermore, unlike fossil fuels, it won’t run out anytime in the foreseeable future. Technological advances in recent years have made solar energy system more affordable and therefore more versatile. In the United States, the use of solar and other renewable energy has reached 11.6 quadrillion Btu in 2019. 3
Since most energy production originates from fossil fuel, the use of solar Photovoltaic (PV) energy contributes to the reduction of greenhouse gases and other gaseous pollutants. 6 The use of solar PV energy also contributes to the evolution of consciousness towards environmental sustainability. 7 According to Natural Recourses Canada, PV systems in buildings are reliable energy sources that produced no on-site pollution or emissions. 8
In 2016, Canadians spent $3.3 billion on the operation of waste management systems, and spent over 41% budget on collection and transportation of waste. 9 Waste composition and physical characteristics such as waste density have been identified as important parameters in the efficiency of waste collection process.10,11 One possible way to minimize operating cost and improve waste collection efficiency is through the use of smart and self-compacting waste containers.12,13 However, traditional self-compacting containers require power connectivity from the gird, making them less cost-effective in outdoor environments and remote areas. The idea of using solar powered self-compacting disposal bins or containers is not new, as there are commercially available systems on market. 14 These smart waste and recyclable bin systems utilize solar power to compress wastes, and enhances the overall collection process. This is especially important in countries with relatively lower population densities such as Canada. A more efficient waste collection system will lessen the financial burden of the Canadian waste management system, allowing more resources to be allocated in the development of new recycling programs. Ultimately, it may help to improve waste diversion rates in Canada.15,16
Various studies have indicated that ground solar intensity is sensitive to meteorological conditions. Daut et al. developed a statistical model for predicting solar radiation using linear regression in Perlis, Northern Malaysia, and found that the average surface temperature is linearly correlated to solar radiation with a correlation coefficient equal to 0.75. 17 Ouali and Alkama used five meteorological parameters (sunshine hours, ambient temperature, air pressure, relative humidity and rainfall) to model global solar radiation in Bejaia City, Algeria. 18 Pepe et al. developed a parametric model to forecast PV generation using cloud cover data and successfully validated their simulation results. 19 Al-Aboosi proposed regression equations and site-specific coefficients to estimate hourly solar irradiance data under different cloud cover range. 20
The effects of climatic variables on solar irradiance and PV panels have been reported in multiple studies. In addition to the latitude and elevation of the site, the installation angle and orientation of PV panels, shading, and temperature are reported to be important parameters.21–26 A study in Korea found that the performance of semitransparent PV panels decreases by approximately 0.5% with each 1 °C increase in the PV panel temperature. 24 Yadav and Bajpai reported similar temperature dependency of PV panel performance. 27 Vasela and Iakovidisb studied the effect of wind direction on the performance of a solar PV plant in the UK by analyzing field data of a solar farm. It has been revealed that power production from the solar power plant increases significantly in southerly winds, keeping all other factors constant, and the increase in total electricity production reached up to 24%. 28 The enhanced power production due to the southerly wind was attributed to cooling of the PV panels and reduction of efficiency loss. Vasela and Iakovidisb concluded that PV plants in the northern hemisphere should be built on areas with strong and frequent winds from the south. 28
Compared to ground surface temperature, wind speed, and prevailing wind direction, cloud coverage is however more difficult to quantify by an observer due to the often broken and overcast clouds and differences in solar elevation angle. 29 Kazantzidis et al. adopted a whole sky imaging system to estimate total cloud coverage and to classify clouds classes using a commercially available digital camera with a fish-eye lens. 30 Their results compared favorably with measurements from a ground meteorological station. A 2-year study in the city of Thessaloniki, Greece, studied the effect of clouds on incident solar irradiance and found that the cloud radiative effect can reach -900 W/m2 to +200 W/m2. 31 They reported that the greatest cooling effects are when solar disk is obstructed by cloud cover. Smith et al. observed an hourly clear-sky index in the UK for over a million data hours and found notable differences in the distributions of clear-sky index between human and automated observations. 29
Recently, the use of remote sensing data and geographic information systems (GIS) tools in spatial analysis of waste studies is increasingly popular.32–36 Besides field measurements, solar irradiance can also be estimated using GIS approaches. Song and Choi used a digital elevation model in GIS to conduct shadow analysis and estimate the output of PV modules on buildings' rooftops at Pukyong National University campus in Busan, South Korea. 37 The calculations suggested that the system could produce over 300 MWh of energy annually. Baitule and Sudhakar conducted a feasibility study at the MANIT campus at Bhopal, India, using the Solar Advisory Model and concluded that their PV system could generate around 8,000 MWh per annum of energy and could meet 100% of the campus energy requirement. 38
Most published PV studies focus on reducing surface reflection and enhancing performance of the solar cells and PV module.39–42 However, building integrated PV and solar collectors are easily affected by shadows of surrounding objects.43–49 Unlike a full-size solar farm or a large scale industrial solar module, the spatially-isolated self-compacting waste container is especially vulnerable to building shadow and cloud coverage due to their miniature footprints. Currently there is no spatial study systematically examining the effects of building shadow and cloud coverage on solar powered waste bins. As such, this study intends to fill the knowledge gap in literature. The objectives of this study are to (i) investigate the spatial variation of solar irradiance with respect to nearby buildings and structures, and (ii) identify the relationships of the selected climatic factors on measured solar irradiance at a university campus. The use of solar-powered bins opens up exciting opportunities for safer waste management practices. For example, a UV light unit may be integrated into the bins to disinfect frequently touched surfaces to slow the spread of illness during the COVID-19 pandemic. The use of smart disposal bins also fits well with the University of Regina’s 2020–2025 Strategic Plan of a 25% reduction in ecological footprint.
Methodology
Study area and geographical locations of the observation spots
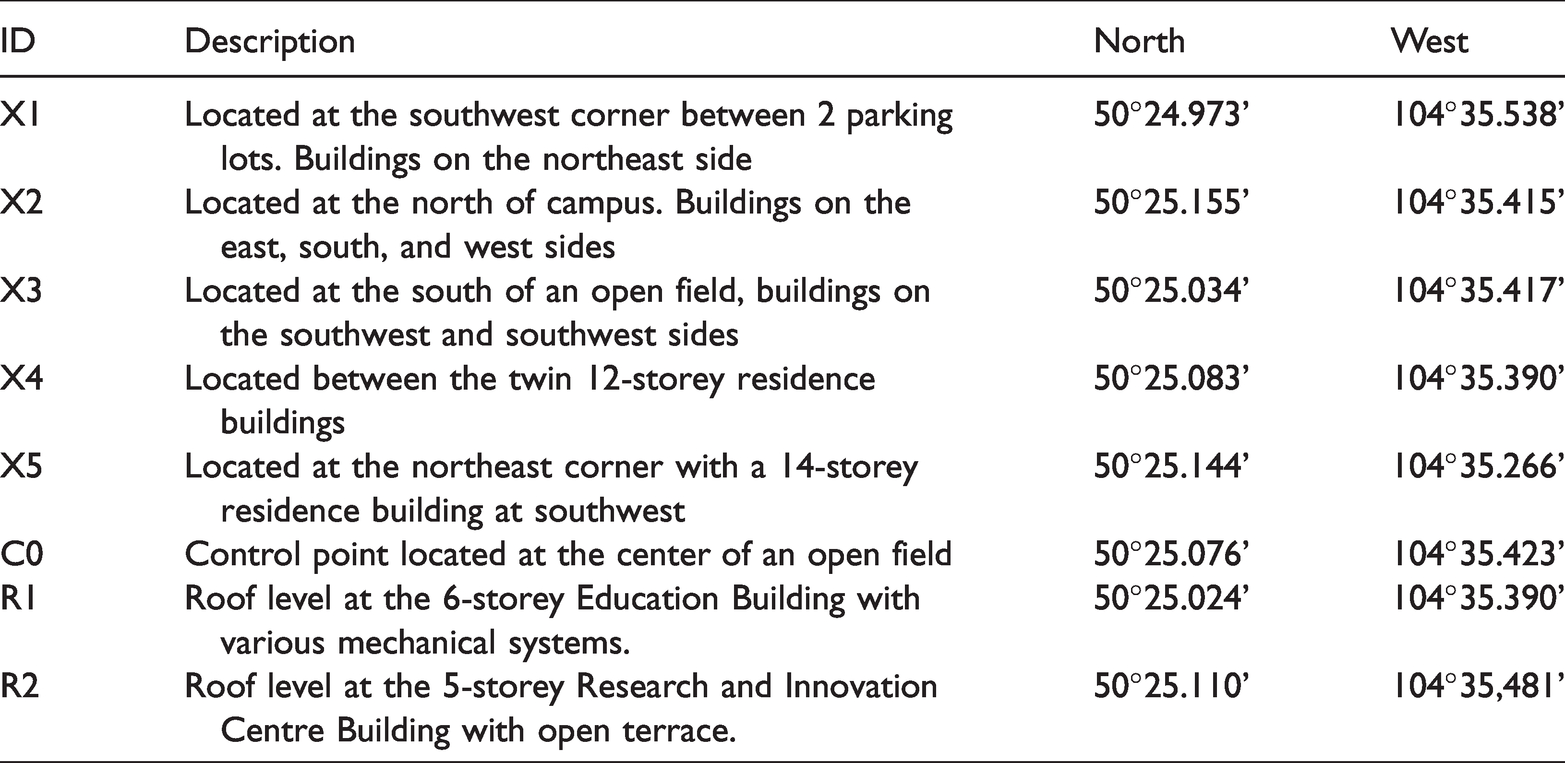
According to Canadian Energy Regulator, Regina, the capital city of Saskatchewan, has the highest average PV potential of 7.15 kW·h/m2 among major Canadian cities. 50 As such, the University of Regina main campus is selected as the study area. The campus is situated at 50.4155° N, 104.5878° W, with an elevation of about 577 m above sea level, and an approximate area of 30 ha. A preliminary study in summer 2016 measured solar irradiance at 23 different spots on campus and confirmed that solar irradiance is not consistent spatially. Given the close proximity of these spots, it is hypothesized that the solar irradiance differences are mainly due to reflection and overcast shadows from buildings and intermittent cloud coverage. Using the preliminary results, a total of eight observation spots were selected for solar irradiance measurements in 2019 at the University campus (Figure 1). They include a control (C0) located at the center of an open grass field with no observable effects of shadow and reflections, various spots with or without overcasting shadow and window reflections by nearby buildings (X1, X2, X3, X4, X5), and two spots at roof level (R1 and R2). Table 1 shows the coordinates for each spot measured using a handheld GPS device (Garmin GPSMAP 64 s). All eight observation spots are closely located from a meteorological point of view, and they are selected to spatially examine variations of solar irradiance with respect to shadow and reflections originating from nearby buildings and structures. Among them, X4 and X5 are most susceptible to overcasting shadow due to their locations in close proximity with multi-storey high-rise buildings.
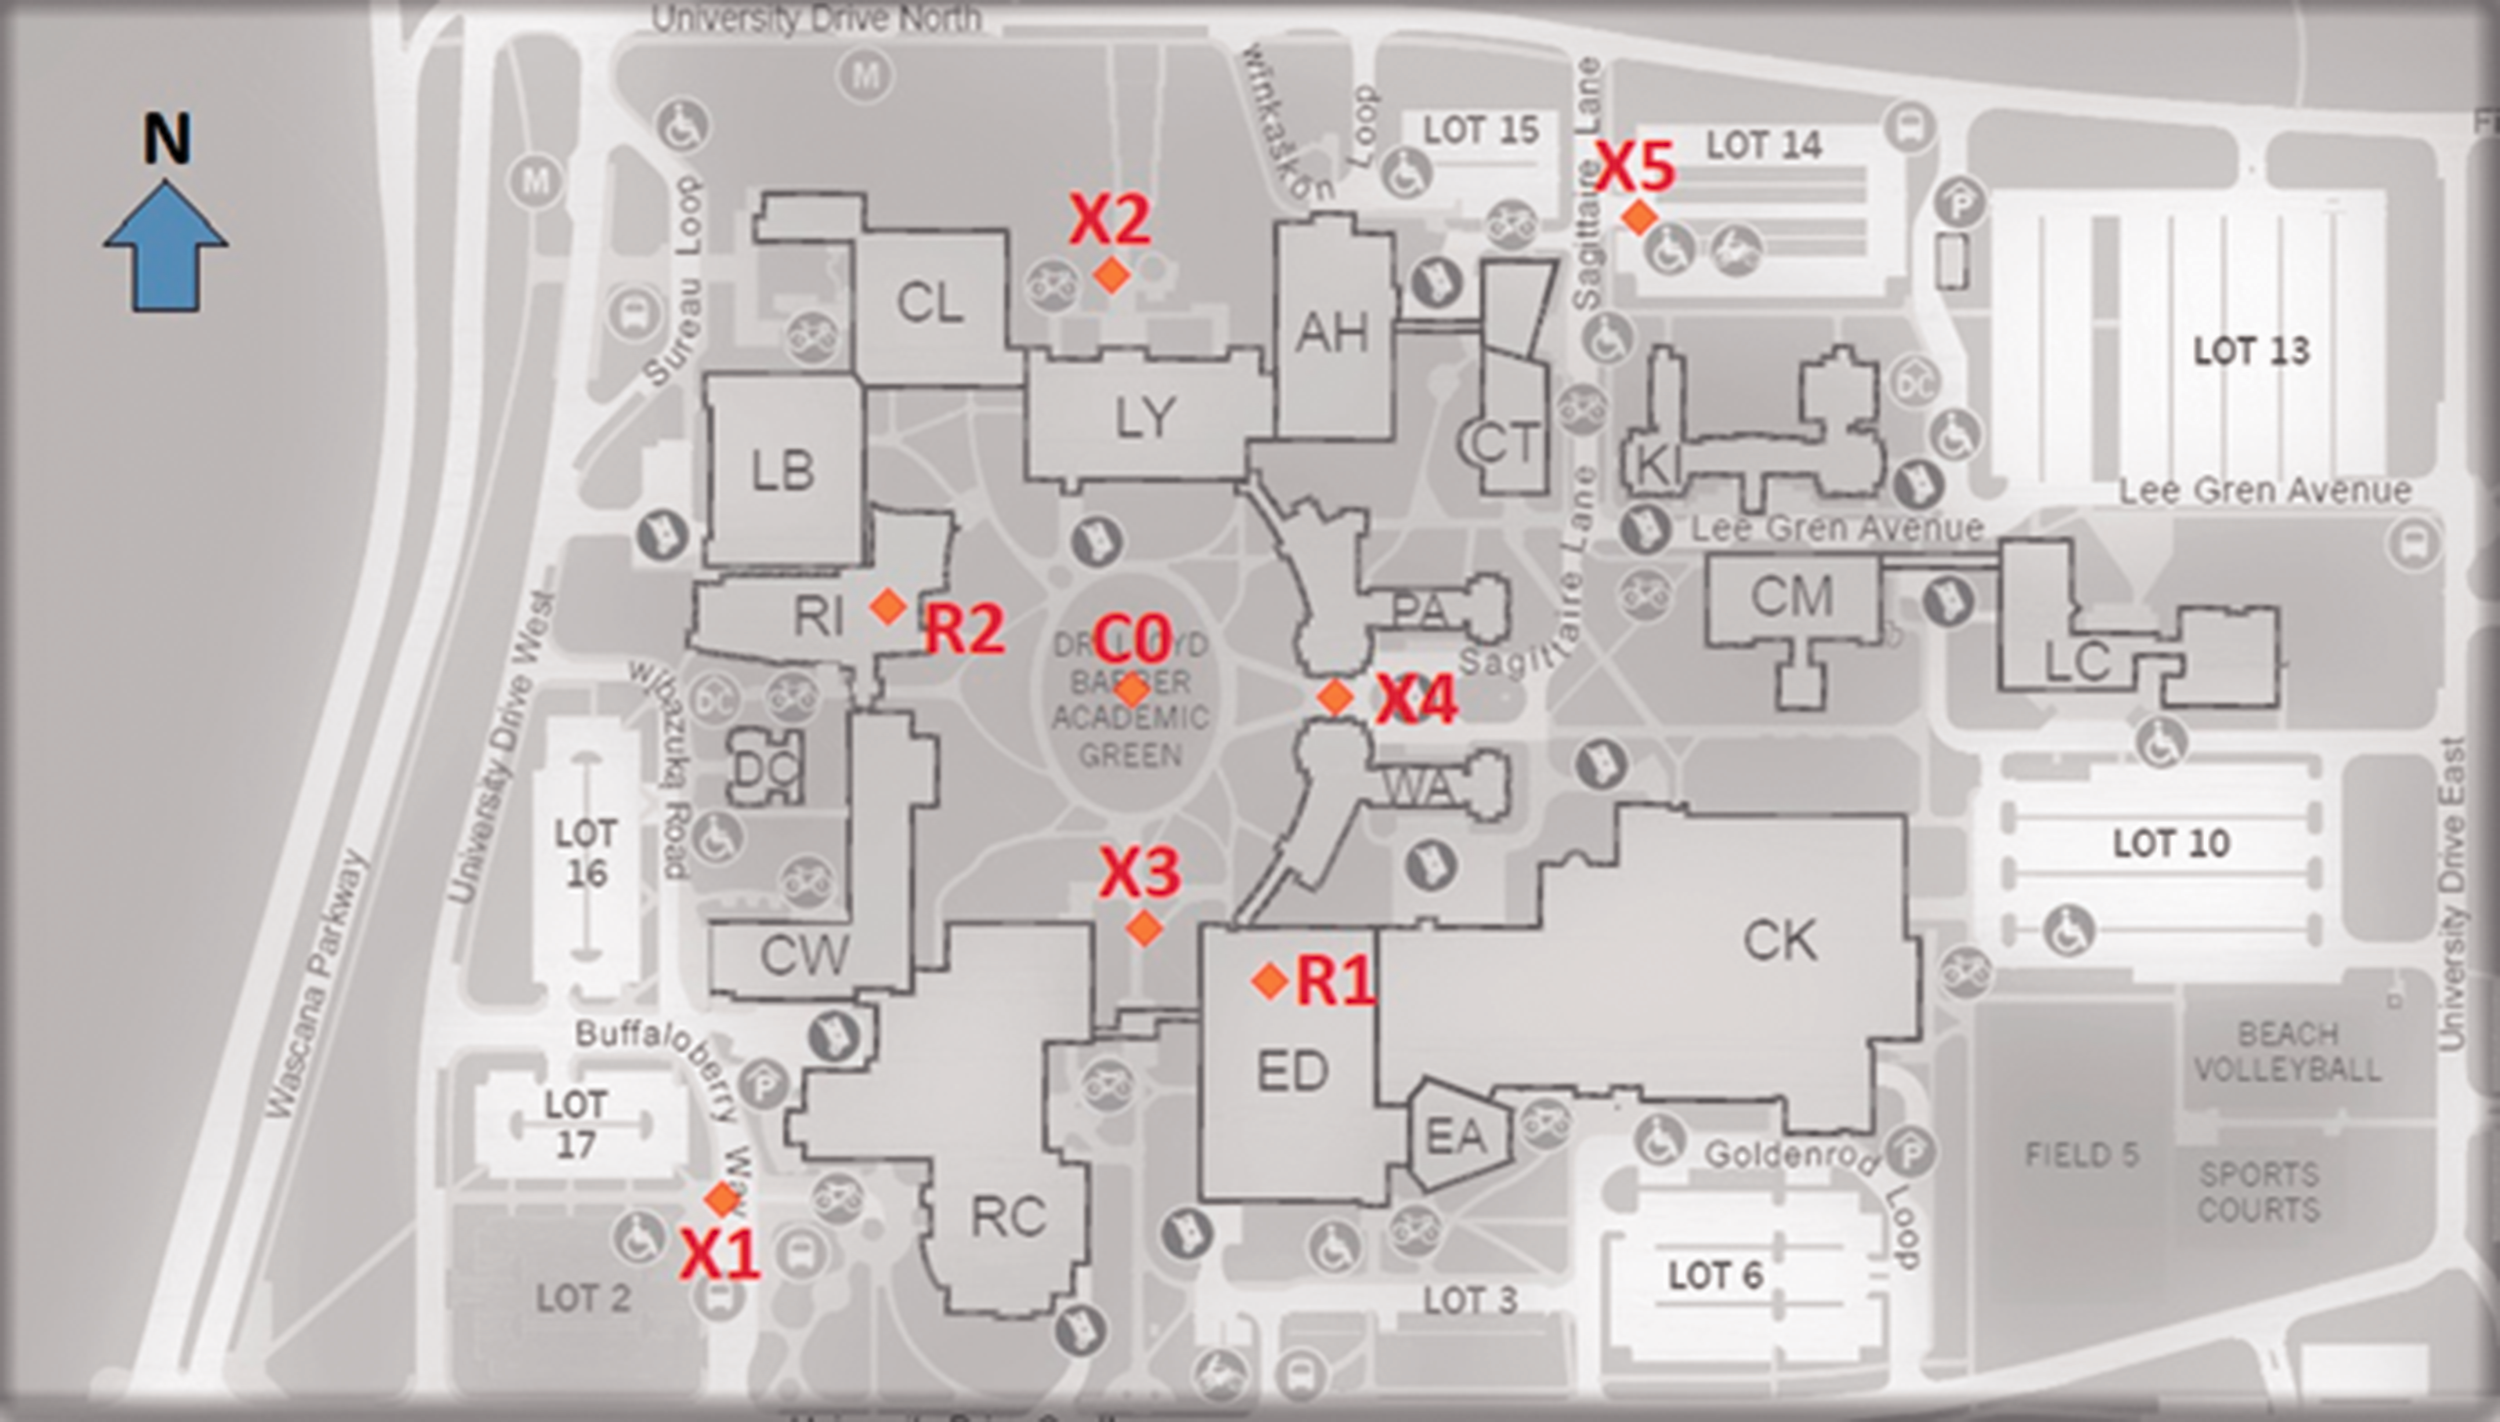
Approximate locations of the observation points on the University of Regina.
Coordinates of the eight observation points at the University of Regina.
Solar irradiance measurements
Solar irradiance is measured on selected days in both 2016 and 2019 summers to study temporal variations. The solar irradiance was measured by a handheld DrMeter SM206 (resolution 0.1 W/m2, with accuracy of ±5%) at each spot from May to August 2016, and from June to August 2019. Summers were selected for the field work to avoid falling and tripping hazards associated with icy paths and to minimize snow cover reflection typically encountered in winter. In both 2016 and 2019 field studies, two solar measurements were recorded at any given time and spot: one with the sensor pointing vertically upward, and one with sensor oriented for maximum irradiance measurement (i.e. pointing directly towards the location of the sun). A total of 552 solar data points were collected in the 2016 (preliminary) study, and a total of 912 solar data points were collected in 2019.
Climatic data and cloud coverage estimation
The climatic data (wind speed, temperature, humidity) was taken from real time data published on the Government of Canada website (https://weather.gc.ca/canada_e.html) using the Regina International Airport weather station, located approximately 5.5 km away from the study area. Climatic parameters were recorded online simultaneously with the solar irradiance measurement to facilitate meaningful correlation analysis.
Cloud coverage is difficult to measure accurately without sophisticated instruments due to broken and overcast clouds, inconsistent ambient light conditions, and the changing location of the sun in sky. In this study, a simplified approach using a cellular phone camera was adopted to estimate cloud coverage. A cellular phone was placed on level surface at a given observation spot and a picture was taken vertically upward using the phone’s back camera. Similar but more technologically advanced fixed-viewing-orientation cloud-relevant instruments are used at U.S. DOE Atmospheric Radiation Measurement facilities. 51 A picture was taken at each time the solar irradiance data was measured. The resulting photo was divided into eight exact rectangular divisions. Cloud cover was then visually quantified using an eight-point scale.29,52 Specifically, 0 Okta being a perfectly clear sky with no cloud visually identified, one Okta being one-eighth of the sky covered in cloud, and 8 Oktas meaning completely overcast.27,53–55 It is important to note that this simplified approach does not measure the actual cloud coverage with respect to surface solar radiation receipt due to its inability to identify cloud type and thickness. However, it allows a quick reference guide for each measurement for comparison purposes. Figure 2(a) and (b) show a cloud coverage of 0 Okta and 8 Oktas, respectively.
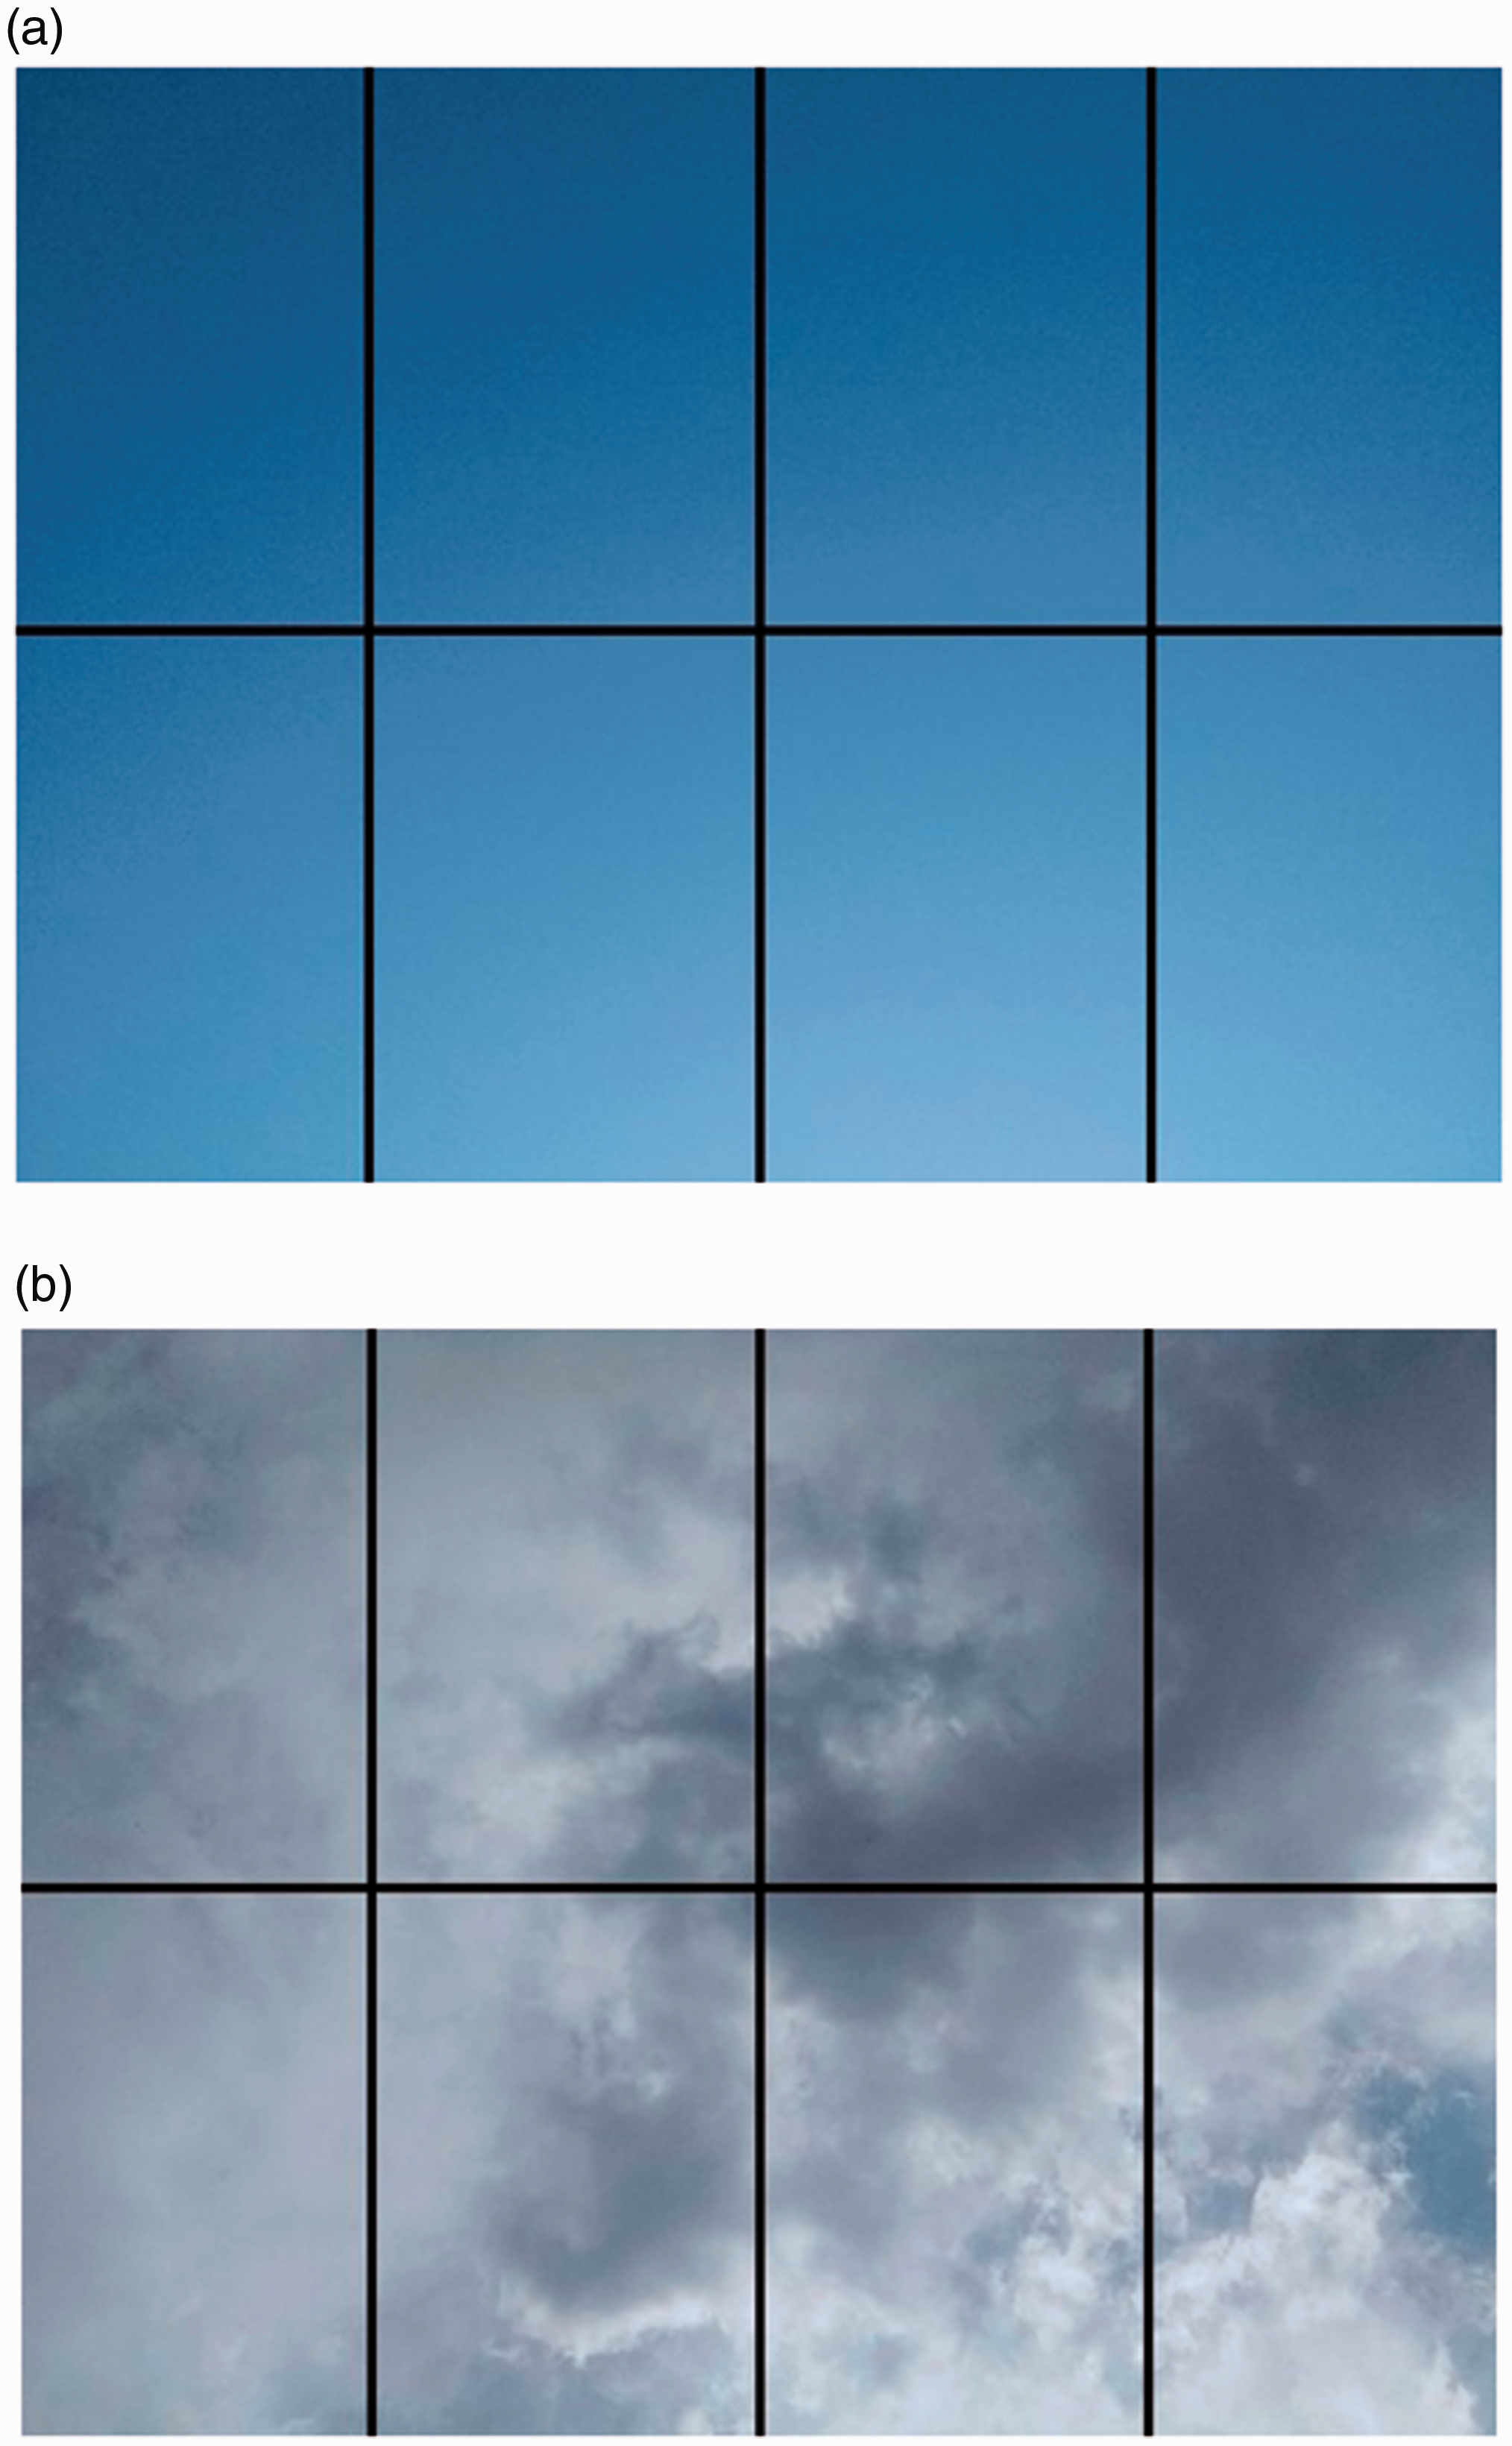
(a) A clear sky with no cloud identified with a 0-Okta rating. (b) A completely overcast sky with 8 Oktas.
Statistical and regression analysis
The preliminary study conducted in 2016 has helped us in the selection of the spatial distribution of the eight observation spots and the selection of the three climatic variables. A total of fifteen trials were conducted during the 2019 data collection campaign, with a total of 912 solar irradiance measurements. Unless otherwise stated, average solar irradiance is reported. A box plot is used to study the spread of the data. Multiple linear regression is conducted using a confidence level at 95%, and a bubble plot is used to examine the effects of cloud coverage on temperature and solar irradiance.
Results and discussion
Solar irradiance and orientation of receiver
The average solar irradiance measured in 2016 and 2019 were 622.1 W/m2 and 703.7 W/m2, respectively (Figure 3). In both cases, solar irradiance measurement increased considerably after manually adjusting the orientation of the meter’s sensor. The percentage differences between the vertical and optimized orientations in 2016 and 2019 are 18.7% and 27.5%, respectively. Most commercially available self-compacting garbage bins on market are equipped with permanent PV panel facing vertically upward. Field data at Regina campus however suggest that automatic adjusting receivers may allow better PV energy capture.
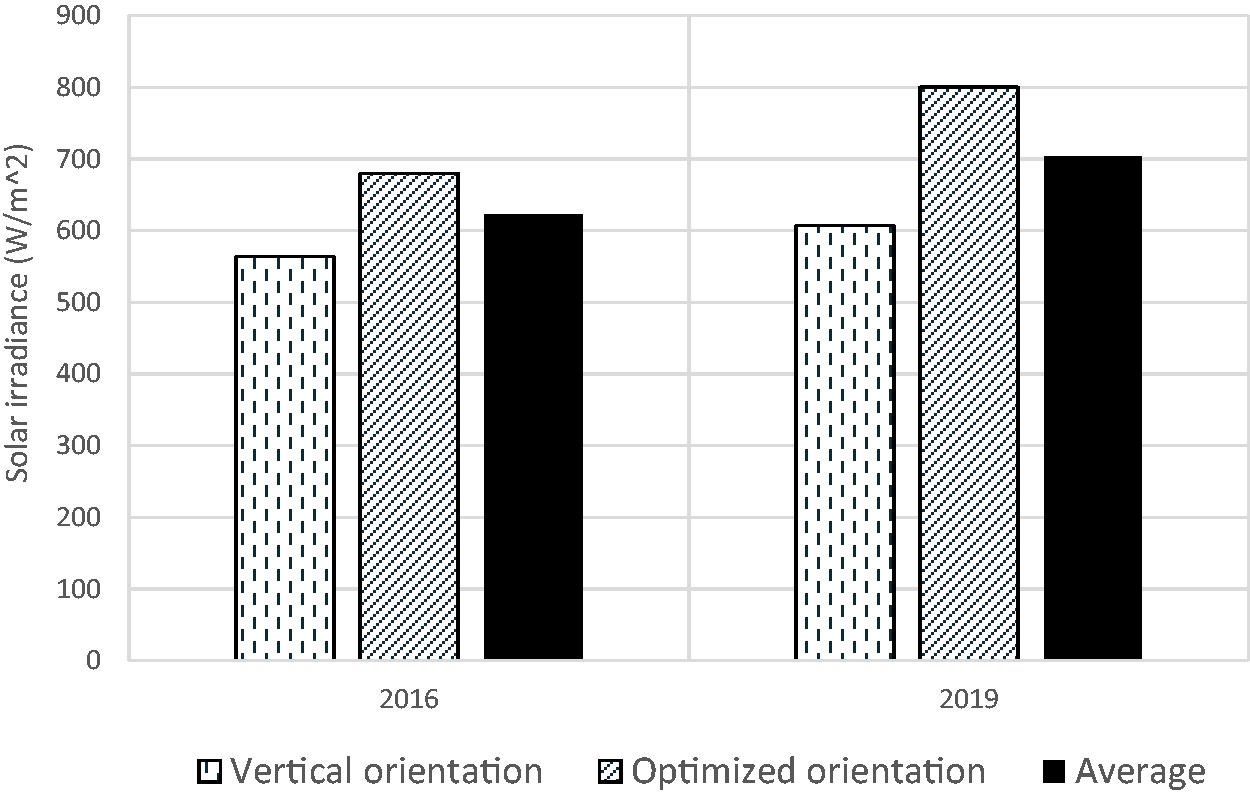
Solar irradiance for data collection campaigns in 2016 and 2019.
Figure 4 shows the temporal changes in the average solar irradiance in 2016 and 2019. Both minimum and maximum solar irradiances in the 2019 study were observed in July at the roof levels (R1 and R2 in Figure 1). The minimum solar irradiance measured was 39.0 W/m2, recorded both on July 3rd and July 18th at R1 between 9:15 and 9:35 am. The maximum solar irradiance measured was 1,413.5 W/m2, recorded on July 30th, 2019 at 12:41 pm at R2. In general, similar irradiance ranges were observed on campus in June and July for both data collection campaigns, but not in August. The unusually low average irradiance in August 2016 (402.6 W/m2) may be responsible for the overall low irradiance in 2016 (Figure 3).
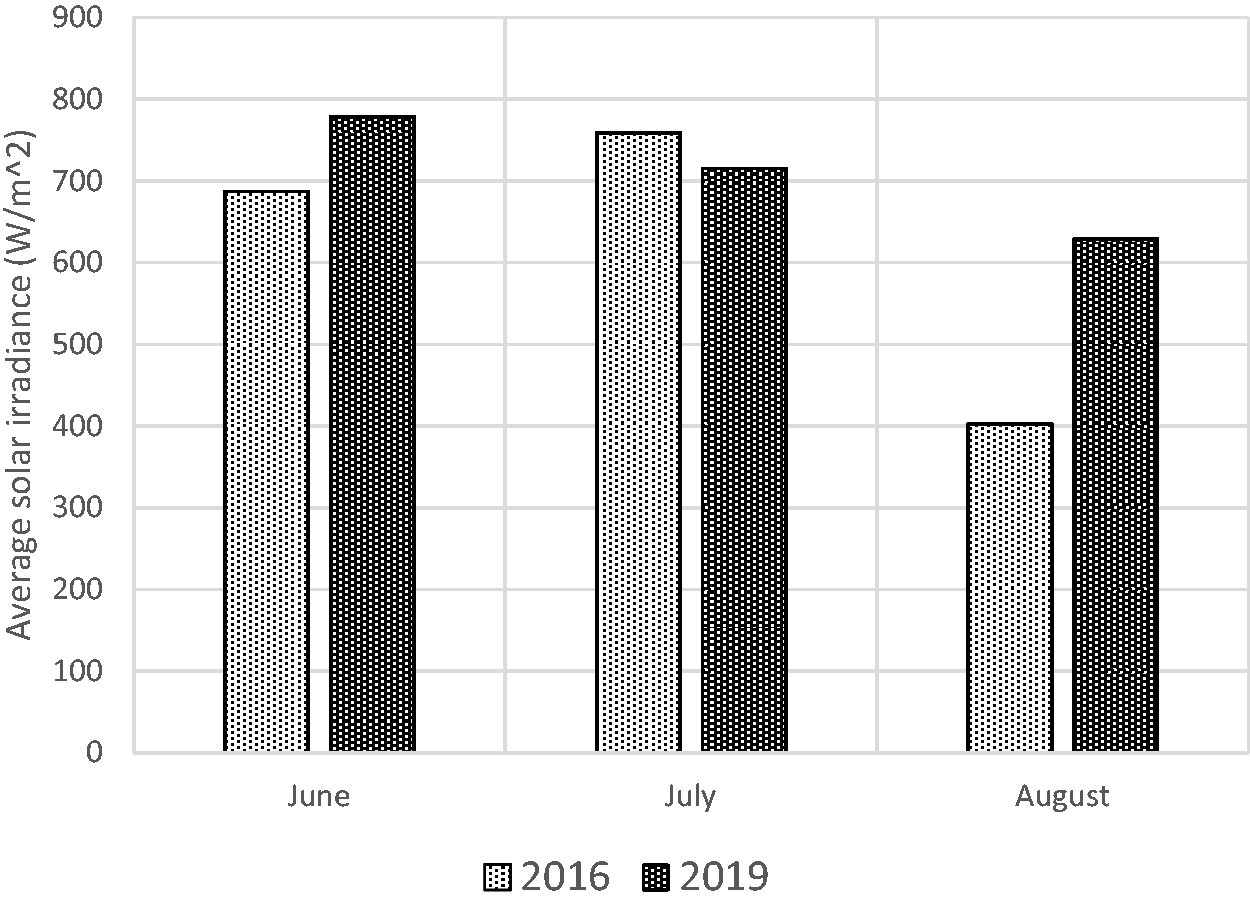
Average solar irradiance measurements in summer of 2016 and 2019.
Variability of solar irradiance and spatial analysis
Figure 5 investigates the effects of shadow and building reflection on solar irradiance. The central bar of the boxplot indicates the median, the bottom and top edges of the box represent the first and third quantile (i.e. 25th and 75th percentile) of each observation spot. Top and bottom whiskers denote the corresponding maximum and minimum values. The cross symbol represents the mean values. Given the close proximity of the eight observation spots (Table 1, Figure 1), the data variability is generally similar. The control (C0) is the least susceptible to possible effects of shadow and reflections, and has the lowest spread. It is believed that the spread observed at C0 is primarily due to variability in cloud coverage. The effects of shadow from buildings may be more important than reflections, as the irradiance mean at other spots are all less than the control at 806.6 W/m2.
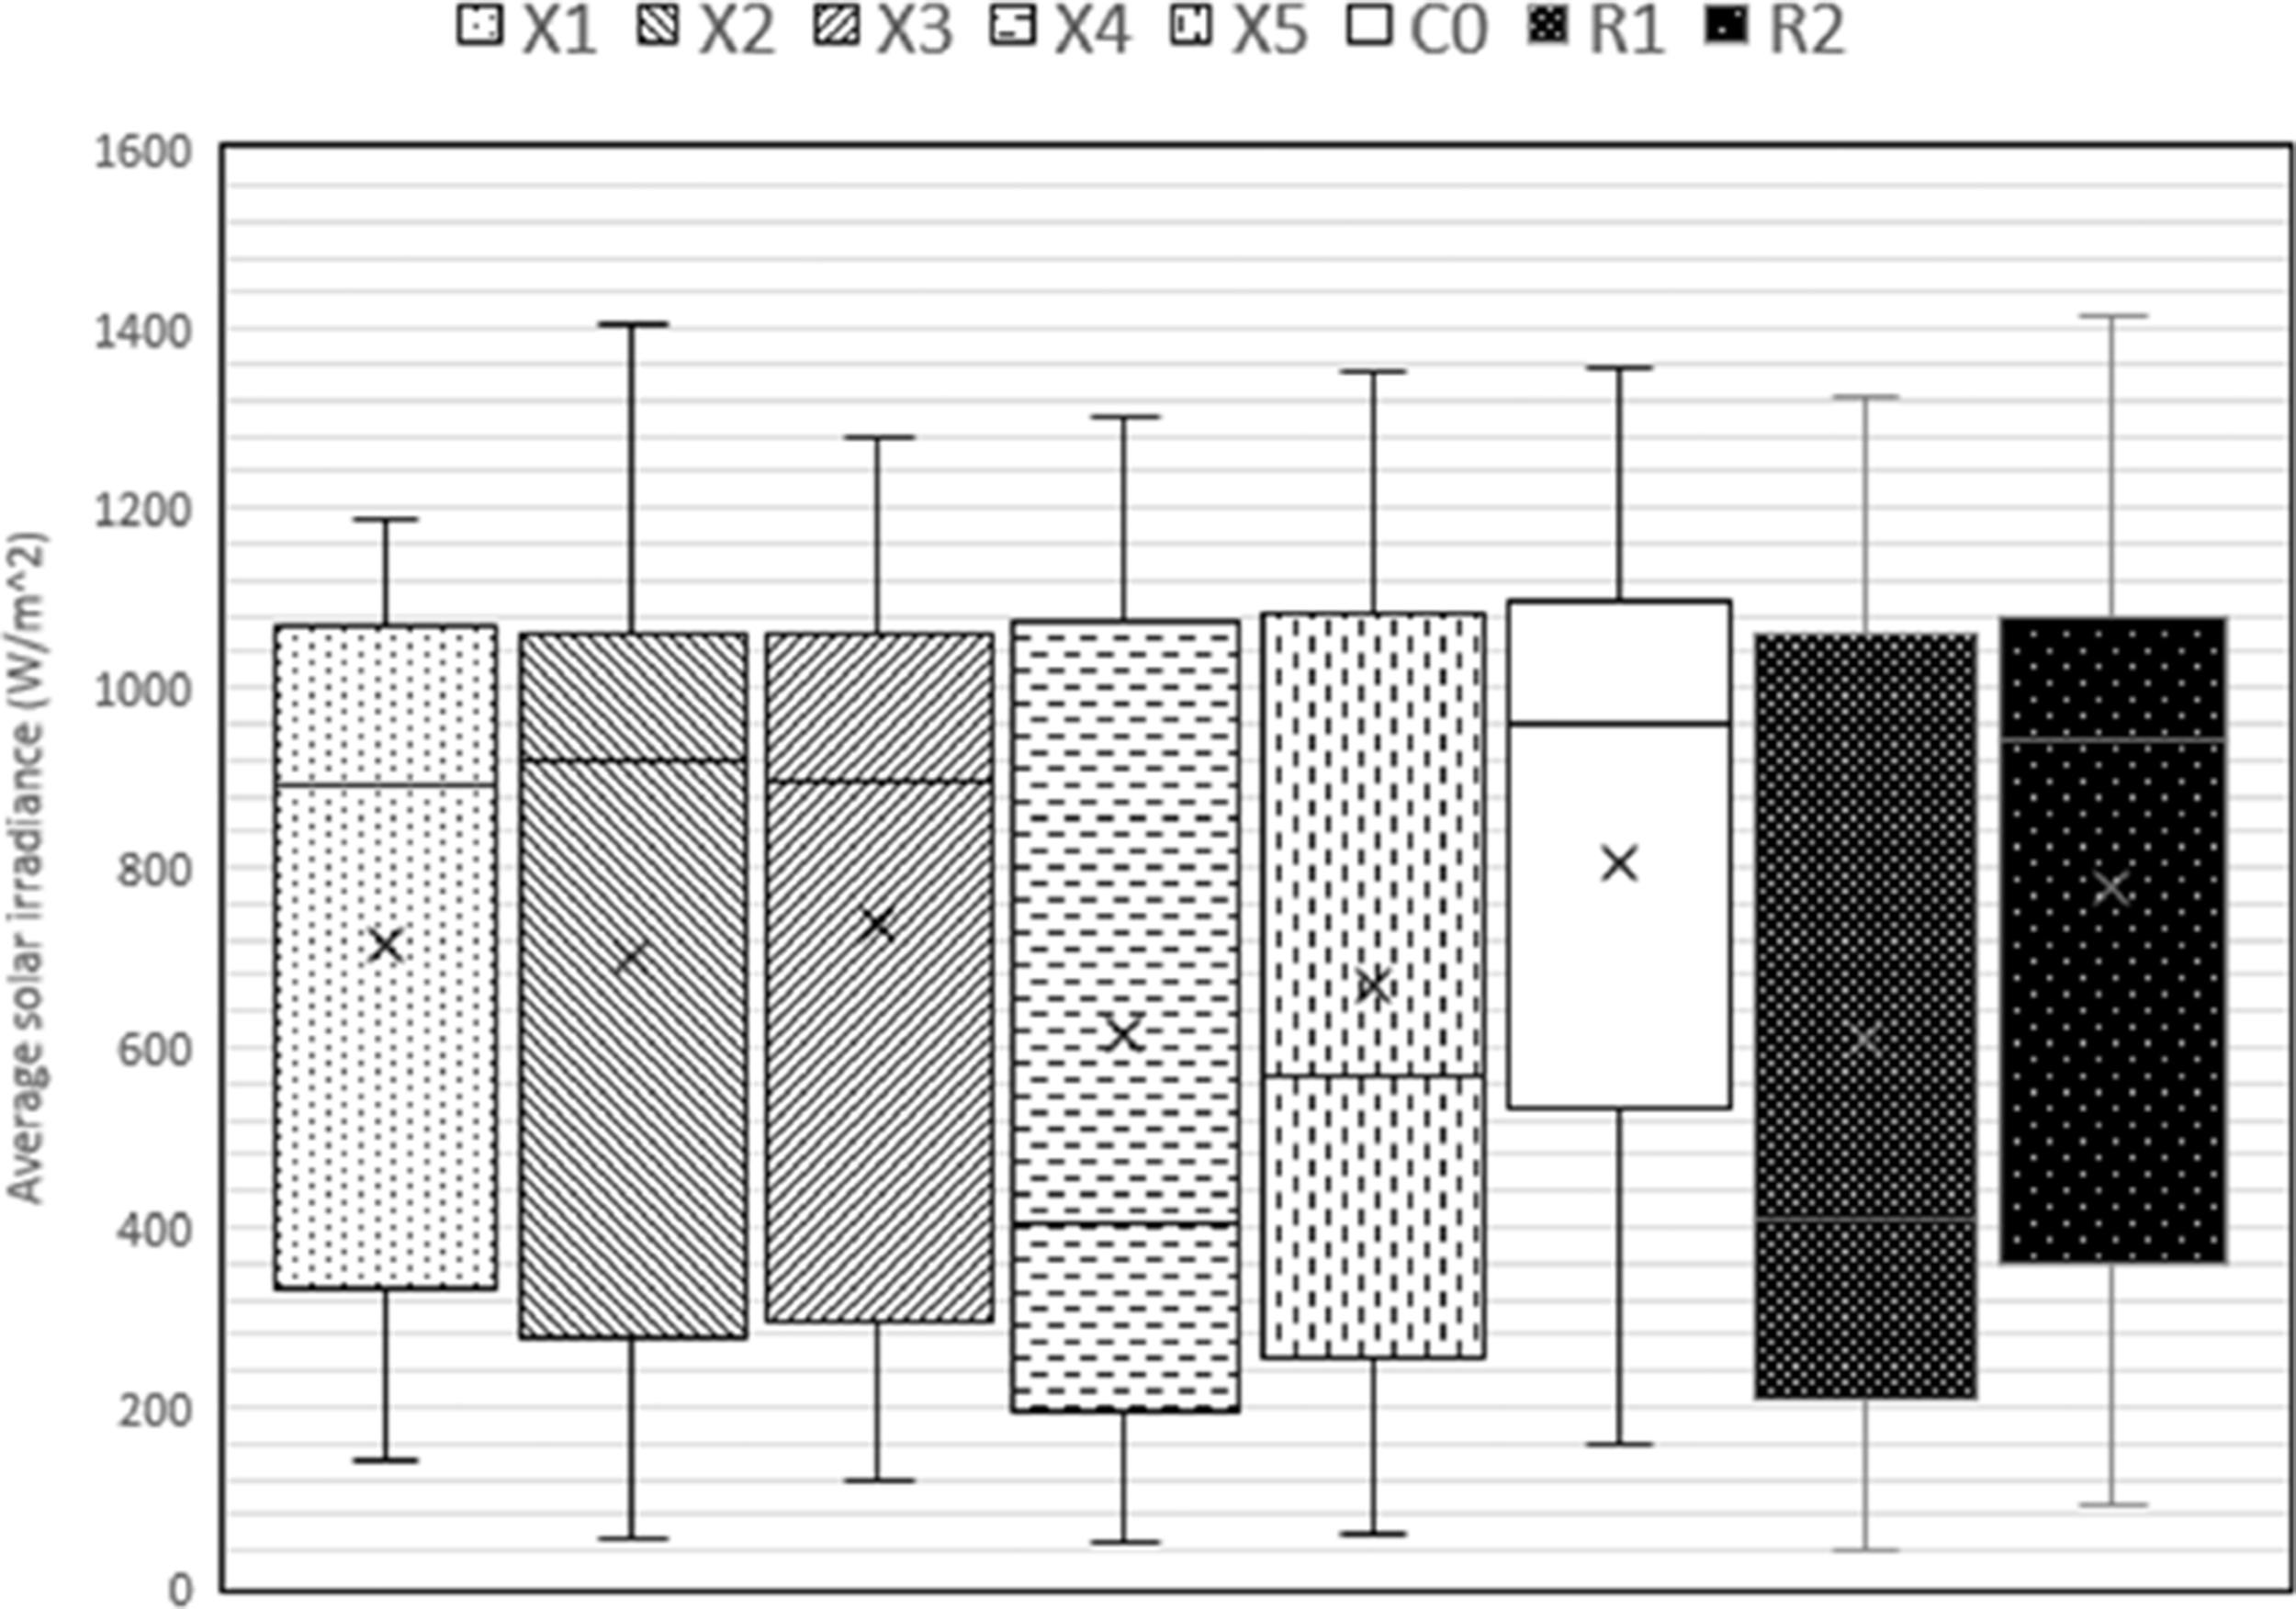
Spatial analysis of solar irradiance in 2019.
X1, X2, and X3 have similar average and median values, as well as similar spread patterns (Figure 5). X1, X2, and X3 have slightly higher spread than C0, suggesting some possible shadow and reflection from nearby buildings. X4 has the largest spread from Q1 to Q3, and is also heavily skewed. The median (405.0 W/m2) is substantially less than the mean (613.6 W/m2), suggesting a few high-level irradiance records during a small time window with direct sunlight or through reflections of the glassy exteriors of the 12-storey twin towers located on the campus. Results suggested that smart disposal bins located at or near X4 should be provided with a larger battery pack for stable energy input. X5 has slightly lower mean (667.8 W/m2) than X2, probably due to overcast shadow from the 14-storey Kīšik Towers located at the south (KI on Figure 1). R1 has the lowest mean value in the study (608.3 W/m2) due to overcast shadow from numerous mechanical structures on the roof. R2, on the other hand, has a large and open roof area for optimal solar irradiance. The maximum solar irradiance of the study (1,413.5 W/m2) was measured at R2. One would generally expect higher irradiance measurements at building roof, however, the average and median irradiance values at R1 and R2 are all less than the control (C0). This is probably due to the negligible height advantages of the 6-storey buildings at ED (R1) and the RI (R2).
X4 and R1 appear sensitive to building shadows, and since overcast shadow depends on the relative position of the sun and buildings, solar irradiance is plotted with respect to the time of day (Figure 6). It is clear that the majority of higher-level irradiance (> 900 W/m2) at X4 was observed in the mornings. More scatterings of extreme values are observed in the afternoon at both X4 (solid triangle) and R1 (solid diamond). There are very few mid-range irradiances (400–900 W/m2) recorded at X4 and R1 throughout the day.
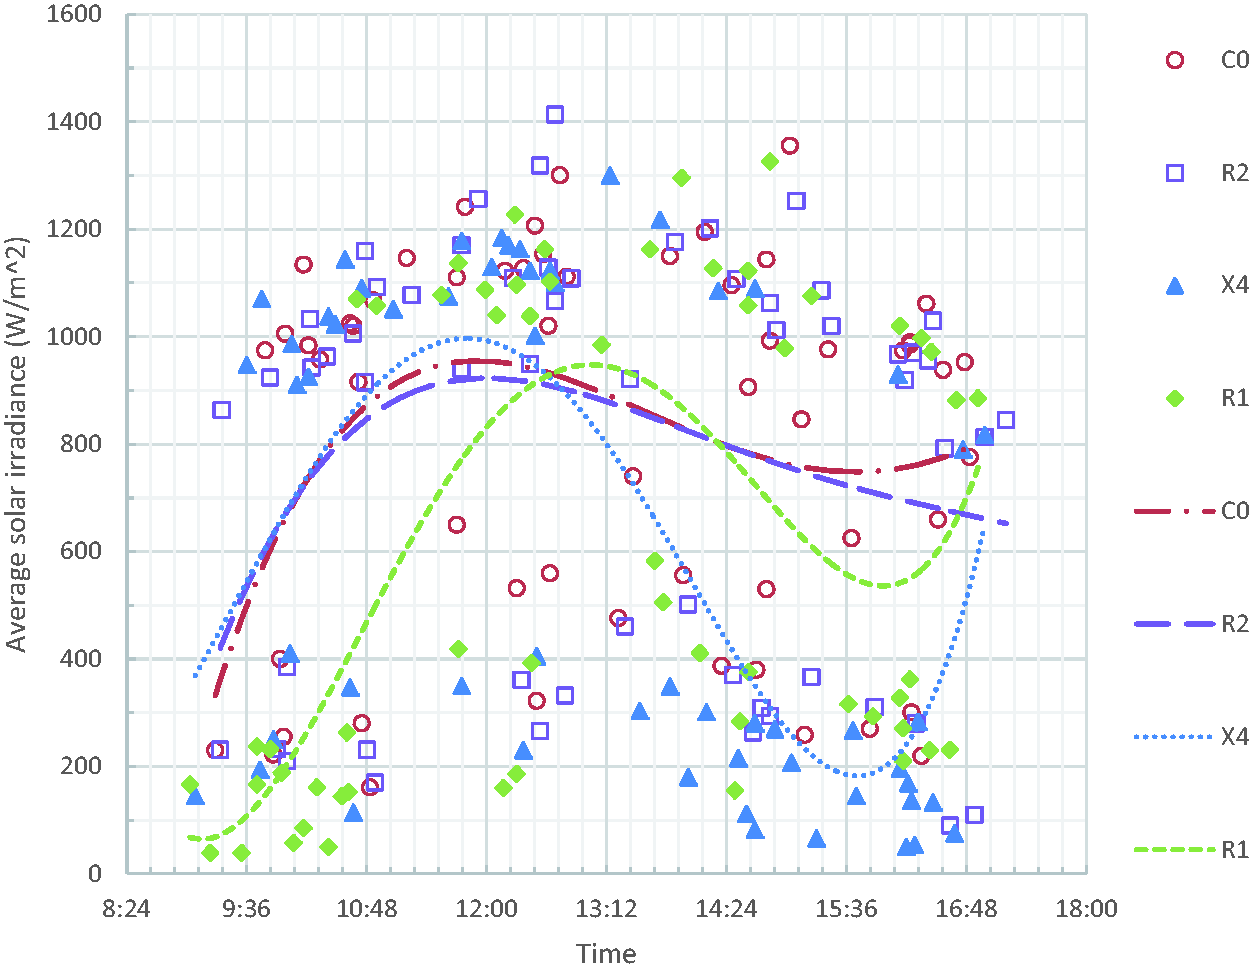
Temporal changes of solar irradiance in 2019.
C0 (open circle) and R2 (open square) are also included for comparison in Figure 6. Irradiance at C0 appears less sensitive to time and is evenly distributed throughout the day. Given the scattering nature of the solar irradiance data, 4th order polynomials are used to visualize the trends. Compared to others, X4 and R1 tended to have higher data variability with respect to average solar irradiance, with R2 of 0.40 and 0.36, respectively. With the exception of R1, the fitted curves peaked at around 11:40–11:55.
Regression and correlation analysis of climatic variables on solar irradiance
A statistically significant multiple linear regression model is developed using the three climatic variables in 2016 and 2019. Temperature is found positively correlated to solar irradiance, and humidity and wind speed are found weakly correlated to solar irradiance:

Where T is ambient temperature measured in degree Celsius, H is the relative humidity in percentage, and W is the windspeed in kilometer per hour. Solar irradiance depends on multiple factors, and equation (1) only captures a few of them with R2 value of 0.166. The regression model is built using field data and should only be used to estimate solar irradiance at sites near the study area with similar climatic conditions.
Equation (1) suggested that temperature is highly correlated to solar irradiance on campus. The best fit linear curve in Figure 7 shows a weak negative relationship between temperature and cloud coverage. In other words, the temperature tends to be lower on cloudy days. The area of the circle represents the magnitude of solar irradiance. Surprisingly, no obvious trend is observed between solar irradiance and cloud coverage. A closer look at the bubbles reveals that 54.8% observations were made on cloudy days (8 Oktas, complete overcast, see Figure 2(b)), skewing the overall results. Since a simplified method adopted in the present study is not capable of identifying cloud type and thickness, a more sophisticated quantification method is recommended in future studies.
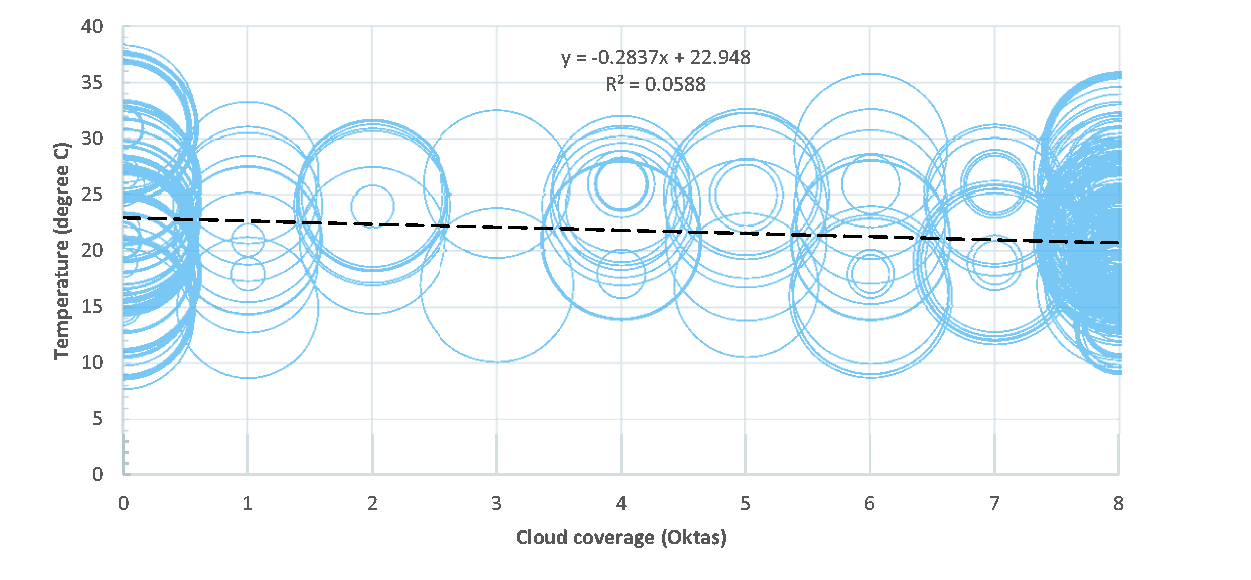
Effects of cloud coverage on temperature and solar irradiance in 2019.
Discussion and limitations
The present study was conducted in summer months. Snow accumulation in winter months is not uncommon in Saskatchewan. Snow cover can have a considerable impact on the performance of solar panels and can either block or reflect sun rays. 50 Pitt et al. did a case study on the costs and benefits of distributed solar energy in Virginia, US; and reported that the stakeholders failed to reach consensus on solar energy policy. 56 The campus community and janitorial crew members may be reluctant to accept new disposal bins, and the purchase and installation cost of solar-powered smart bins must be fully studied before project implementation. Nonetheless, smart disposal bins fit well with the University’s 2020–2025 Strategic Plan of a 25% reduction in ecological footprint. The use of solar-powered bins also opens up other opportunities for safer waste management practices. For example, a UV light unit may be integrated into the bins to disinfect frequently touched surfaces to slow the spread of illness during and after the COVID-19 pandemic.
Conclusion
Fossil fuels continue to be the major fuel for primary energy production around the world. Burning fossil fuels has significant negative impacts on human and the environment. However, renewable resources such as solar energy are abundant, and technological advances have made solar energy systems affordable and cost-effective. The goal of this short study was to assess the spatial variation of solar irradiance with respect to nearby buildings and structures at a University campus, and to identify the relationship between select climatic factors on measured solar irradiance. Conventional self-compacting containers require gird connectivity, rendering them less applicable in outdoor environments and remote areas. On the other hand, the use of self-compacting waste containers is advantageous, as these smart bins utilize solar power to compress wastes, minimize operating cost. and improve waste collection efficiency.
Eight locations on the University of Regina main campus were studied. The average solar irradiance measured in 2016 and 2019 were 622.1 W/m2 and 703.7 W/m2, respectively. Results suggest that taking into account the orientation of the solar receiver could allow increases in energy capture of between 18.7 and 27.5%. Minimum solar irradiances were observed between 9 and 10 am, while maximum solar irradiances were observed between 12 and 1 pm. A 4th order polynomials are used to visualize the trends, the fitted curves generally peaked at around 11:40–11:55. The results further suggest that ground irradiances on campus were similar in June and July, but significant decreases were observed in August. Locations where shadows may negatively impact PV receivers were identified. The regression analysis found that temperature was the most important factor in forming a relationship with solar irradiance, and the proposed solar irradiance model is only valid for the specified location. In this study, no obvious trend is observed between solar irradiance and cloud coverage. Cloud cover posed significant issues with the regression model, nonetheless it provides a sound qualitative method for a preliminary analysis such as the work presented herein. In the future, a study over the entire year is recommended in order to fully understand the temporal distribution of solar irradiance at the University of Regina campus. The results of this study provide valuable data on the use of smart bins on campus, and help implement new data-driven policy regarding sustainable waste management.
Footnotes
Declaration of conflicting interests
The author(s) declared no potential conflicts of interest with respect to the research, authorship, and/or publication of this article.
Funding
The research reported in this paper was supported by a grant from the Natural Sciences and Engineering Research Council of Canada (RGPIN-2019-06154) to the corresponding author (K. T. W. Ng). The 2016 field study was conducted by Ivan Hue, and was partly sponsored by the Sustainability and Community Engagement Fund (SCEF) at the University of Regina. The lead author (Z. Behi) was also supported by a Mitacs Globalink research award. The authors are grateful for their support. The views expressed herein are those of the writers and not necessarily those of our research and funding partners.