
Abstract
An axial flow fan is designed for dry cooling of a sCO2 Brayton cycle for a CSP plant, and a scaled model of the fan is manufactured and tested experimentally in an ISO 5801:2017 Type A fan test facility. While the design procedure’s estimate of the total-to-static efficiency at the design flow rate is relatively high, at 74.4%, the experimental fan efficiency was found to be only 50.6%. This paper details an investigation into the causes of fan performance degradation, using both experimental and numerical methods. The investigation finds that the hub configuration, tip clearance size, and scale of the test fan is responsible for the reduced performance. Two alternative hub and casing configurations are identified which improve the fan’s performance significantly.
Introduction
A number of research projects are aimed at improving the competitiveness of concentrated solar power (CSP). One of the most active research fields currently considers the use of supercritical carbon dioxide (sCO2) power cycles in CSP plants. One example is that of Deshmukh et al. 1 which investigates an air-cooled heat exchanger (ACHE) system for a 100 MWe CSP plant using an sCO2 Brayton cycle. While this cycle could theoretically provide many improvements over a steam Rankine cycle, very little detail can be found in the literature regarding the configuration and behaviour of the required cooling systems, and in particular their cooling fans.
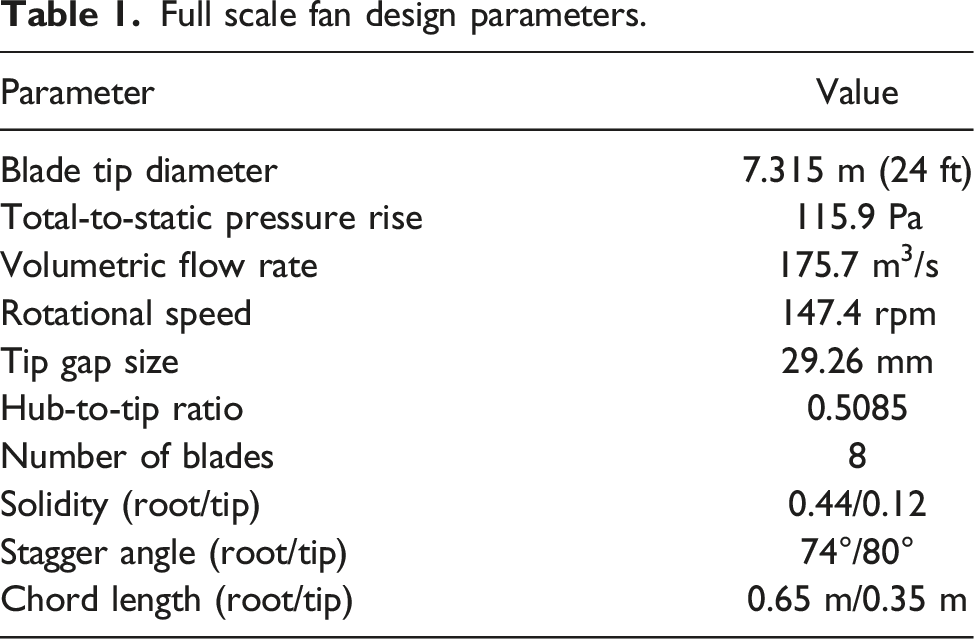
Full scale fan design parameters.
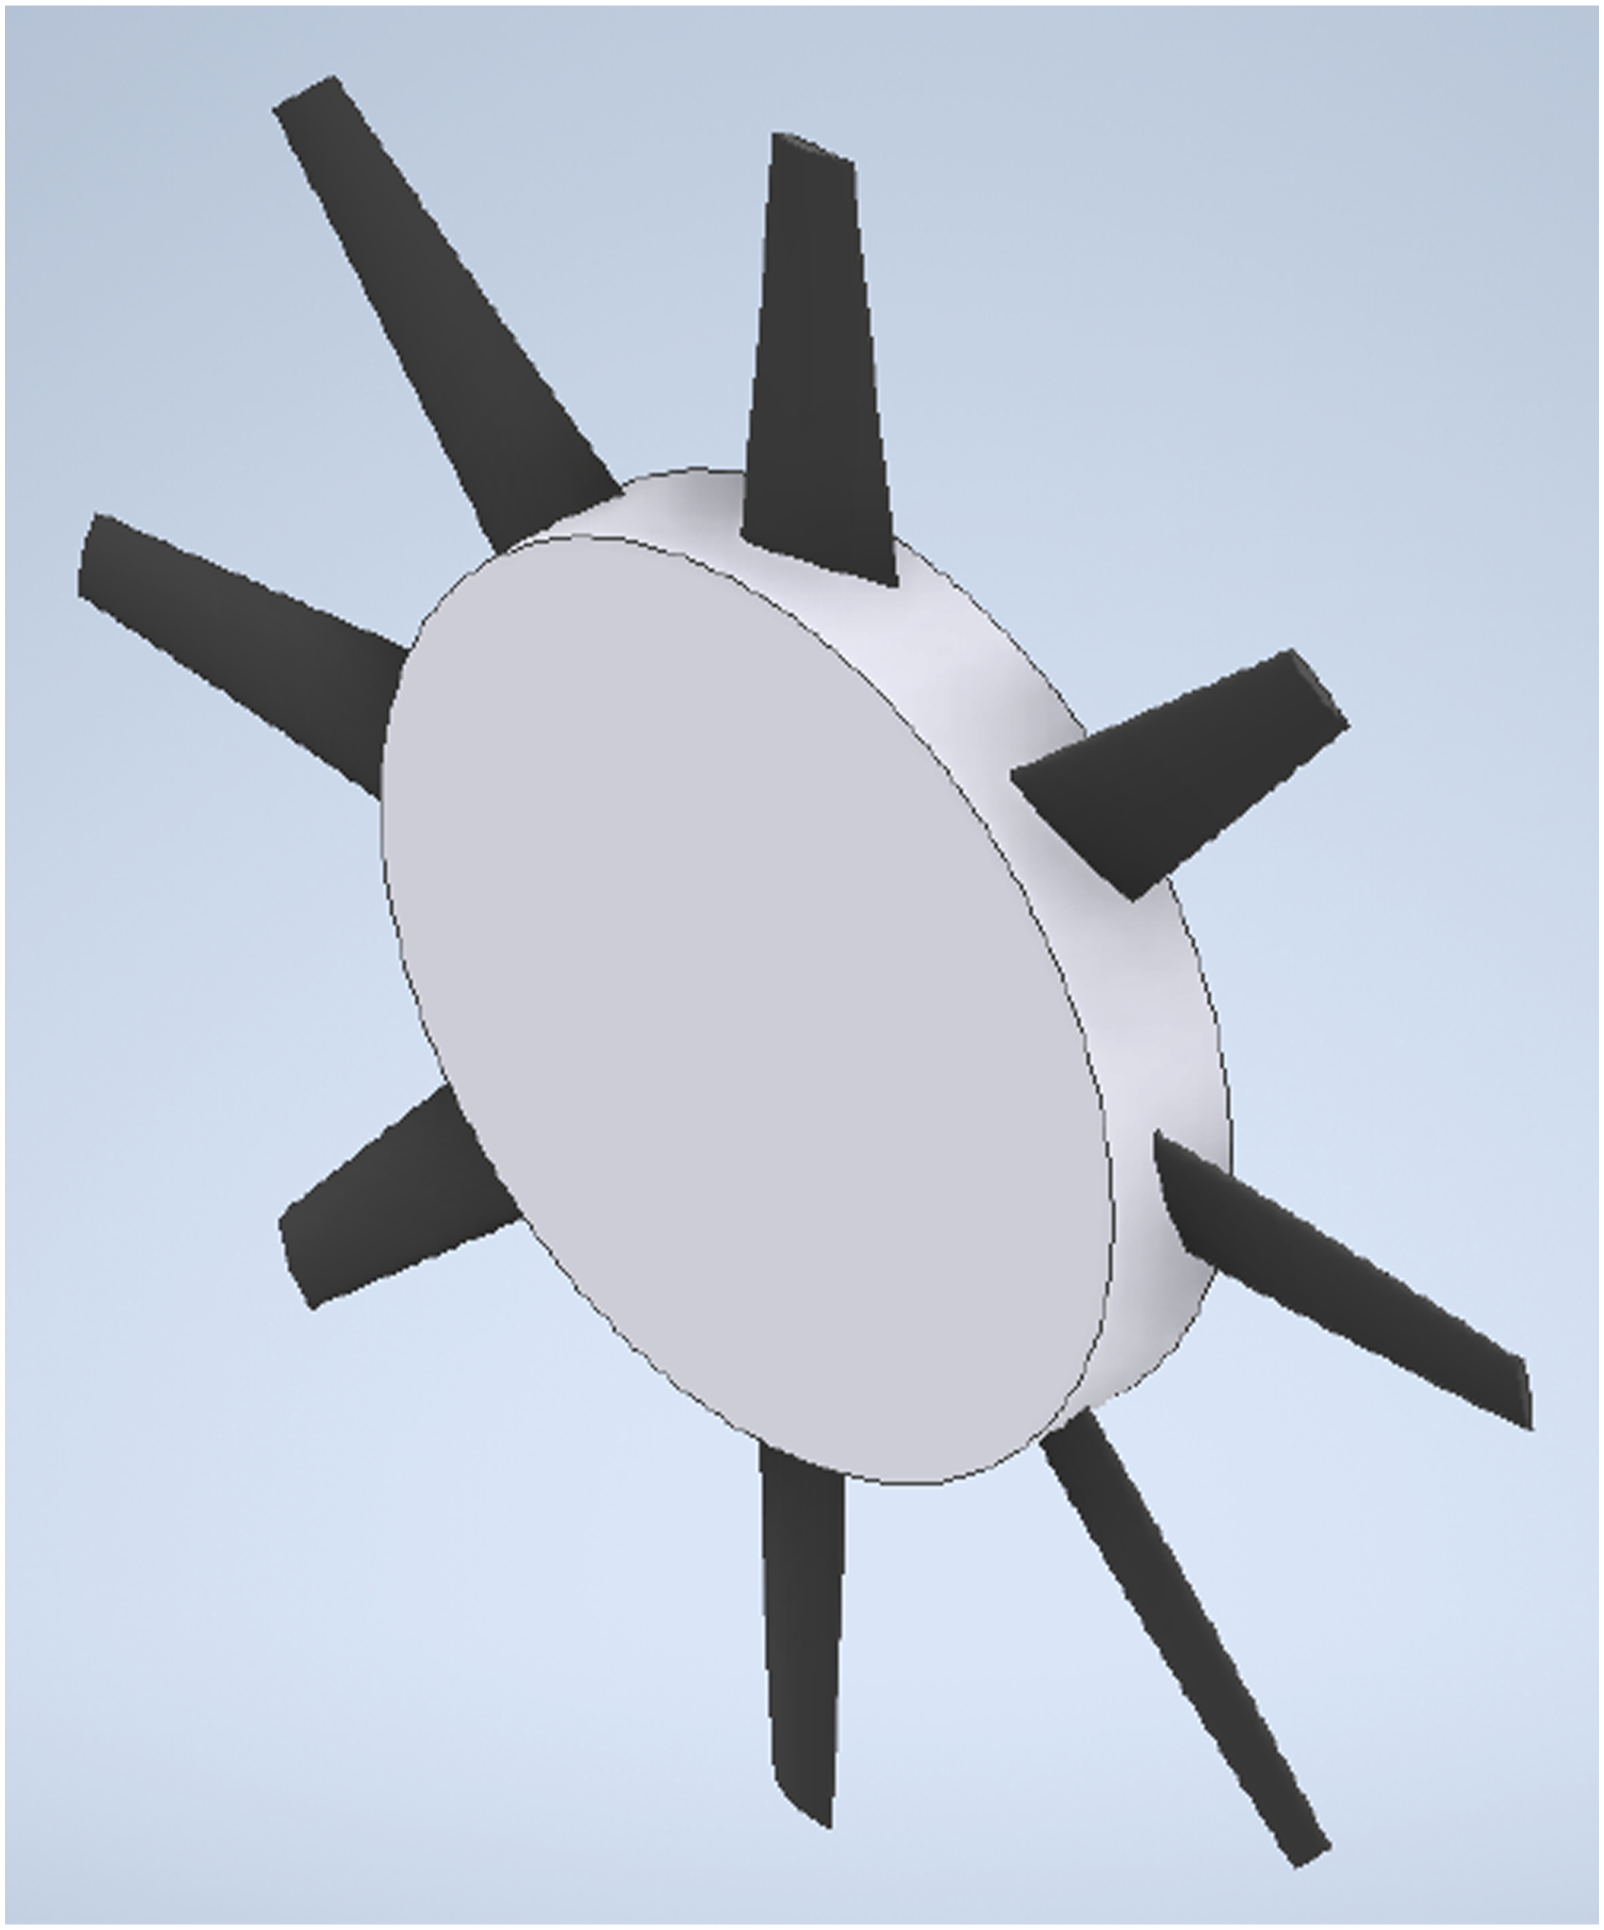
Model of fan showing large, cylindrical box hub.
The fan was then simulated and tested experimentally, using a cylindrical box hub configuration. While the design procedure predicted a high total-to-static efficiency of 74.4%, the experimental fan performance was found to be drastically lower, at only 50.6%. This difference suggests that the design procedure used is not well suited to the unusual operating point of the sCO2 power cycle. It is unclear what causes this reduced performance, and how it can be brought closer to the optimal value predicted by the design procedure.
Previous authors3–5 demonstrate that using a large tip gap size reduces the pressure rise and efficiency of a fan. However, it was found that the tip clearance size used with the new fan does not fully explain the reduced performance. Bamberger et al. 6 and Meiring et al. 7 compares a variety of fan hub configurations, and demonstrates that certain configurations can reduce fan performance significantly. However, the cylindrical box hub configuration is generally seen to result in the best performance. It is therefore still unclear what causes the poor fan performance.
This paper investigates the flow field near the fan, aiming firstly to identify the cause of the reduced performance, and secondly to provide methods of improving its performance, such that the general-purpose fan design procedure can be used more effectively for future sCO2 power cycle applications.
Nomenclature
Variables
c Absolute velocity (m/s)
d Diameter (m)
N Rotational speed (rpm)
P Power consumption (W)
p Pressure (Pa)
Re Reynolds number
s Tip gap size (mm)
T Rotor torque (N⋅m)
u Blade speed (m/s)
Greek symbols
α Angle (°)
ρ Density (kg/m3)
Δ Difference
η Efficiency (%)
Ω Rotational speed (rad/s)
Subscripts
1 Upstream
2 Downstream
attack Angle of attack
d Dynamic
F Fan
r Radial
s Static
t Total (pressure), tip (speed or diameter)
ts Total-to-static
x Axial
θ Tangential
Method
The investigation uses Computational Fluid Dynamics, with a method referred to as the Periodic Three-Dimensional Model (P3DM), to solve the flow field near the fan. This model is implemented in ANSYS Fluent 2021 R1. Experimental results are presented first, and are used to demonstrate the accuracy of the CFD model. The setup and procedures used for the experimental tests and P3DM are given below.
Experimental testing
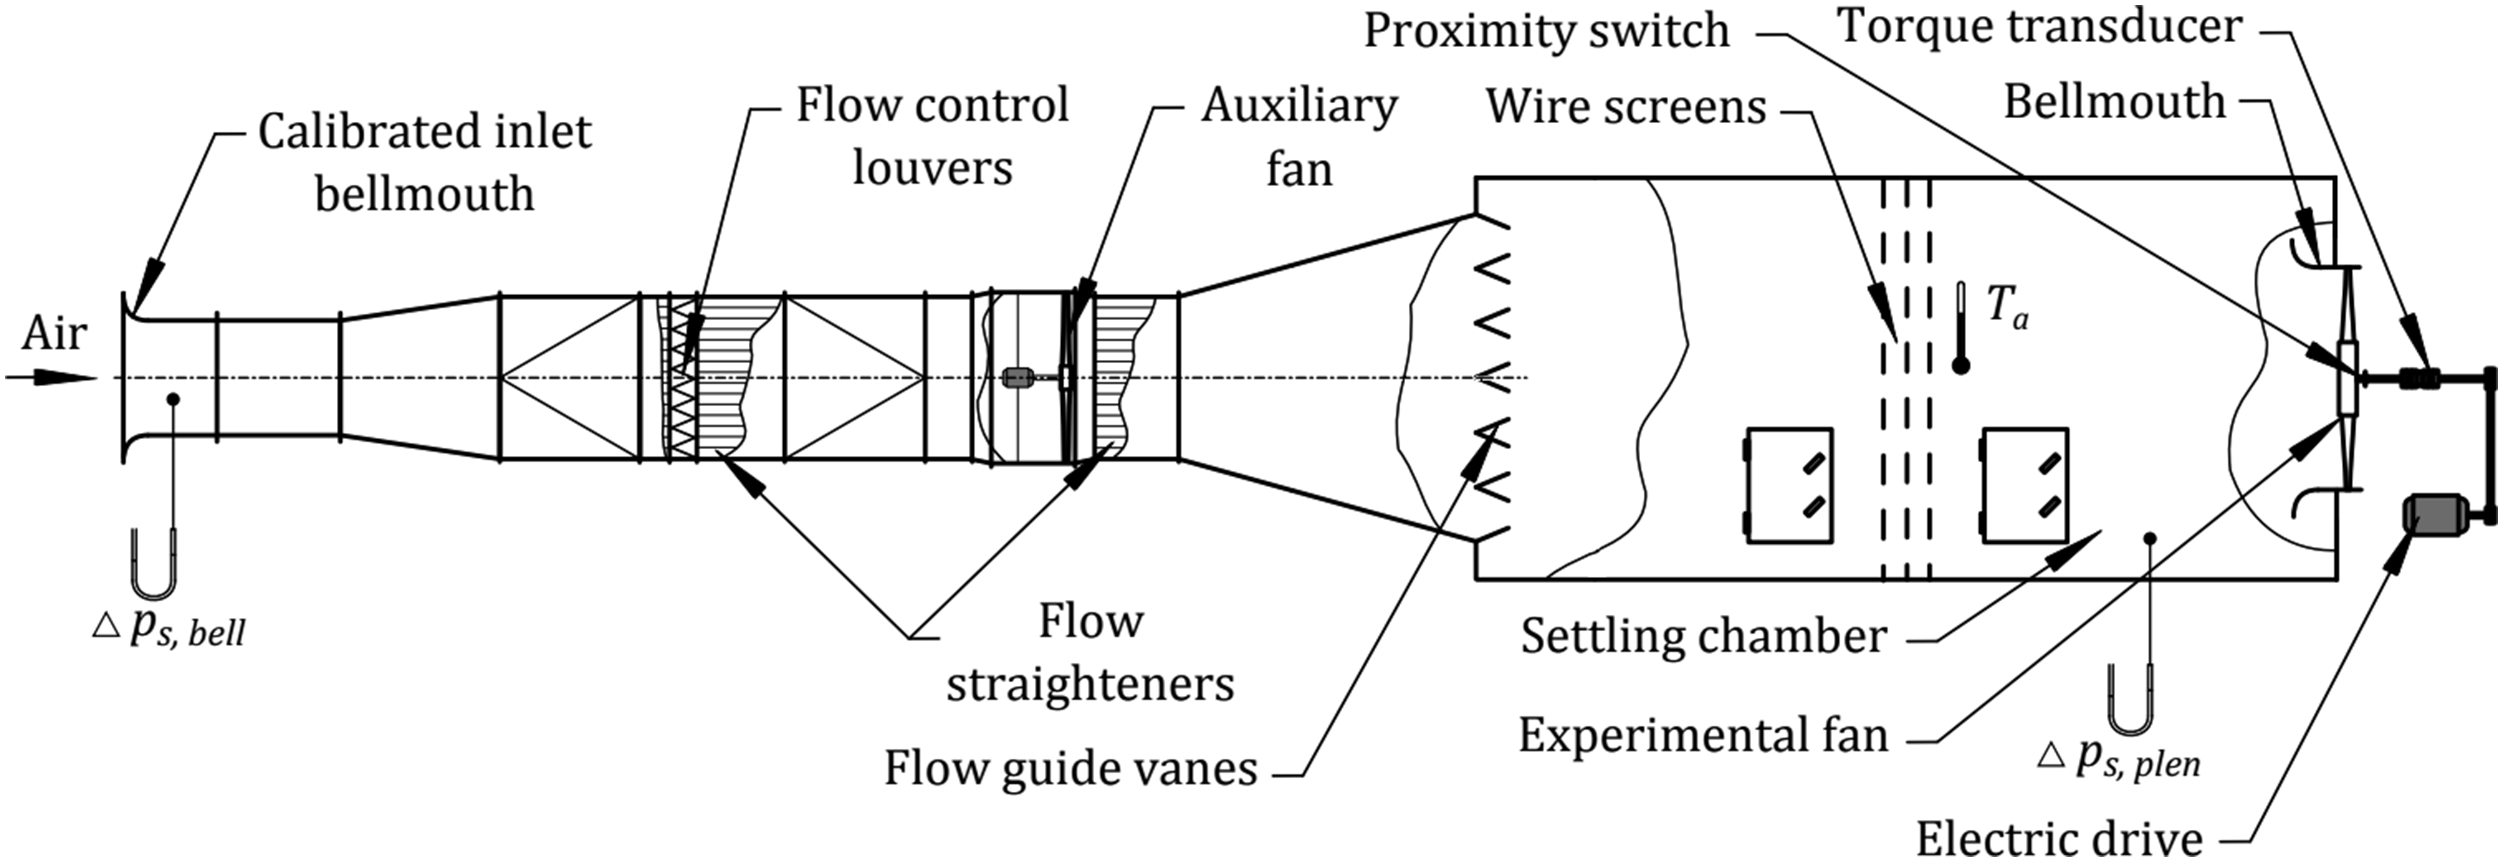
A 1:4.78 scale fan was manufactured at Stellenbosch University and tested in the ISO 5801:2017 fan test facility, with layout shown in Figure 2. A variable speed drive is used to set the test fan speed, which induces flow through the test facility. The volumetric flow rate through the facility is controlled using flow control louvres, while an auxiliary fan is used to overcome flow resistances in the facility for testing at high flow rates. ISO 5801:2017 Type A fan test facility, adapted from.
8
Before and after each test, the ambient temperature and pressure is measured using a thermometer and a mercury barometer. These readings are used to calculate the prevalent air density during the test, using linear interpolation between the pre- and post-test values. At each flow rate setting during the test, four measurements are taken: the calibrated inlet bellmouth and settling chamber pressure is measured using two Endress & Hauser Deltabar S differential pressure transducers, with a range of 0 to 1000 Pa, and an accuracy of 0.5%. The fan rotational speed is measured using an inductive proximity sensor. The fan torque is measured using an HBM T22 torque transducer, with a range from -100 to 100 Nm, and a nominal rated sensitivity of ± 0.2%. These readings are used to calculate the fan total-to-static pressure rise, shaft power consumption and total-to-static efficiency at each flow rate setting.
The fan was tested at a range of tip gap sizes for comparison to the simulated results. For each configuration, the fan tests were repeated three times, and the average curves calculated from these results.
Periodic three-dimensional model
The P3DM considers the geometry of only a single blade, while periodic boundary conditions are used to include the effects of adjacent fan blades. The near-blade meshes are generated using ANSYS Turbogrid (structured hexahedral mesh), while the large inlet and outlet domains are generated using ANSYS Meshing (tetrahedral meshes which are later converted to polyhedral meshes in ANSYS Fluent).
The reference frame is specified to be rotating at the fan’s design rotational speed of 147.4 rpm (at full scale) or 699.3 rpm (at test scale). This means that flow is considered steady in the reference frame relative to the blade. A mass flow inlet boundary condition is used to set the flow rate through the fan, while a pressure outlet boundary is used to model the atmosphere downstream of the fan. The k-epsilon Realizable turbulence model 9 is used with ANSYS Fluent’s Enhanced Wall Treatment option. This model was previously shown to agree well with results obtained using experimental fan tests. 5
Two computational domains are used, shown in Figure 3: firstly, a simple annulus extending upstream and downstream of the fan rotor, named the Annular Domain. This domain is used since it results in a flowfield similar to that assumed by the design procedure. It therefore represents the “ideal” conditions for the fan. The second domain, named the Type A domain, represents the fan test facility at Stellenbosch University, which is in accordance with the ISO 5801:2017 Type A configuration.
10
This domain represents more realistic operating conditions for an ACHE cooling fan. Annular domain (left) and Type A domain (right), showing location of fan installation with a dot.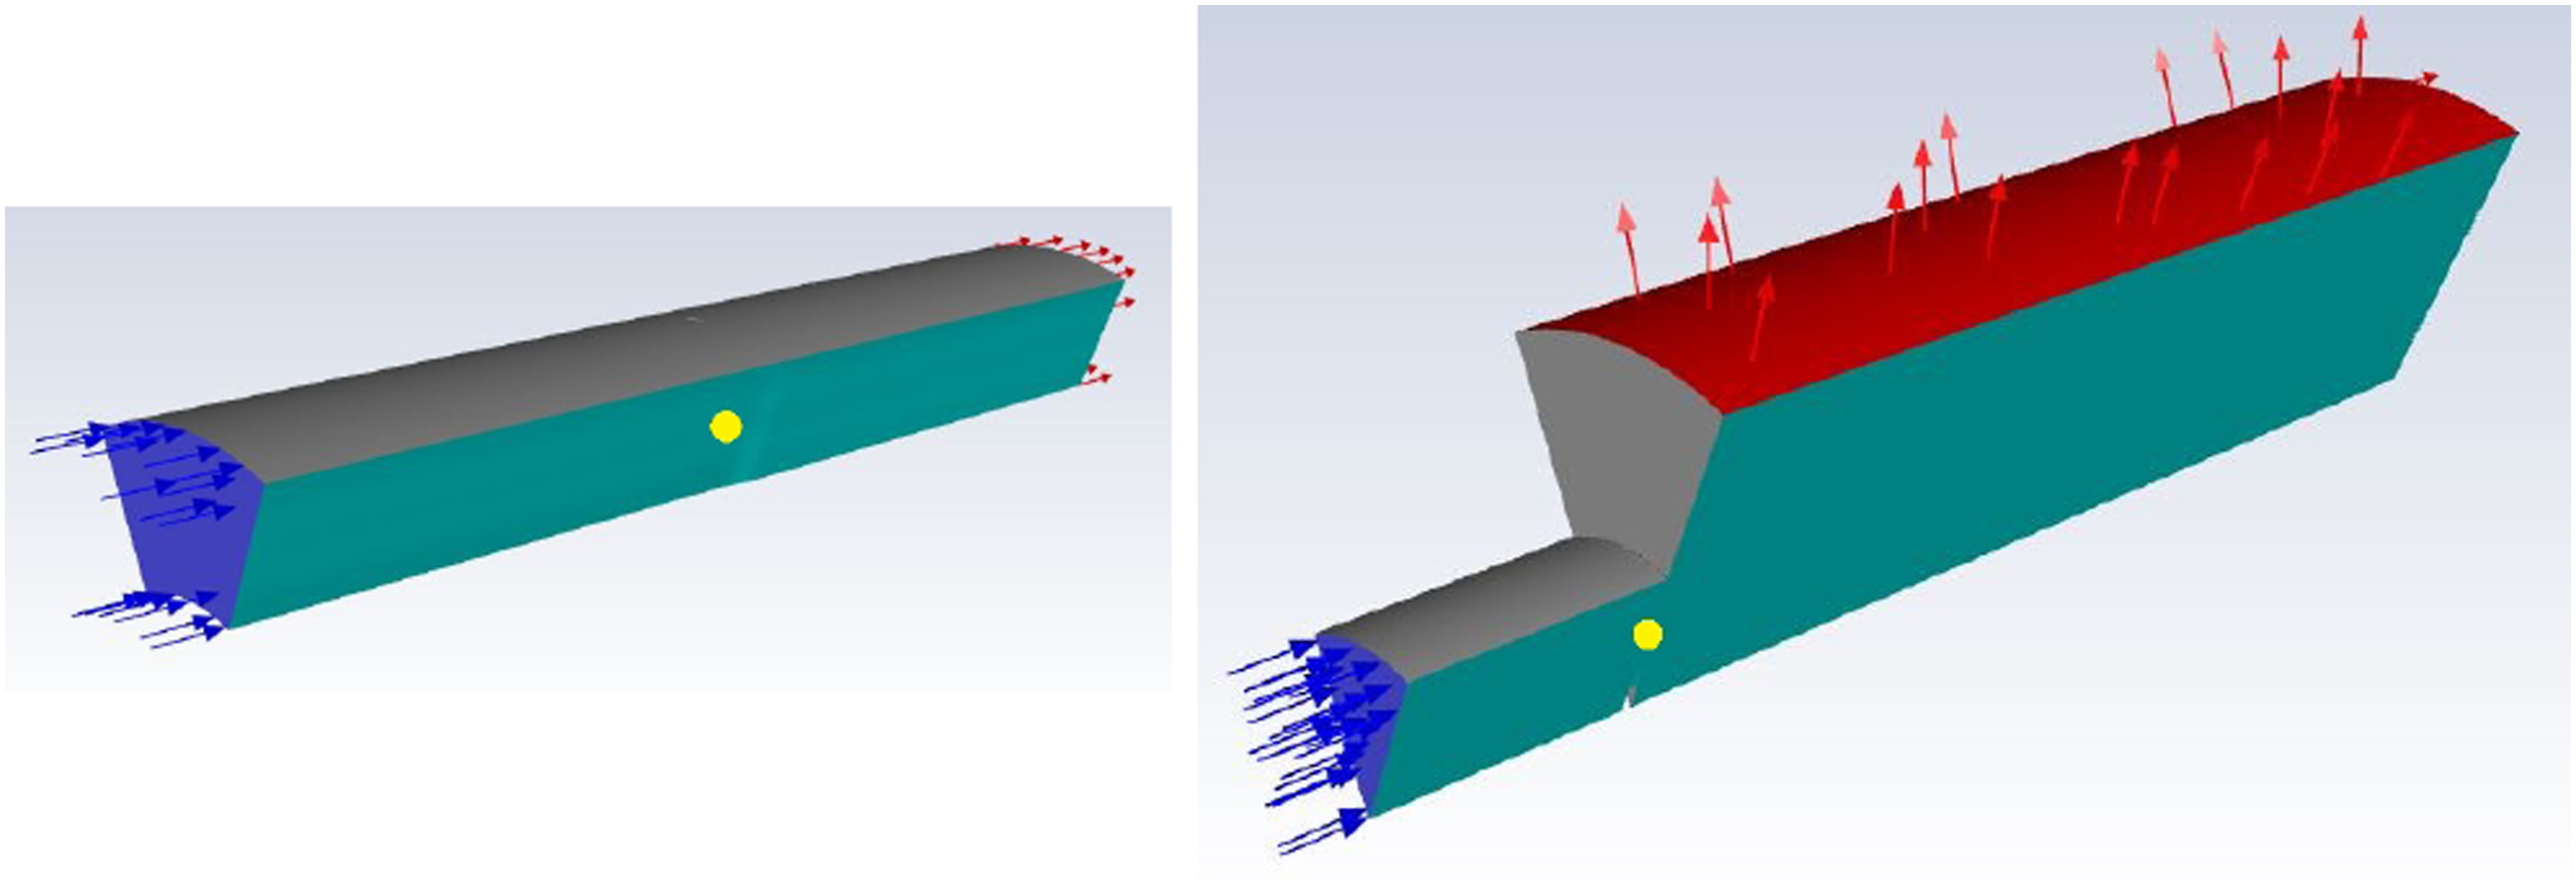
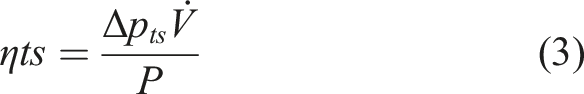
From the solved flowfield, the mass-averaged pressures on the inlet and outlet boundary surfaces are found and used to calculate the fan total-to-static pressure rise. The pressure and shear forces on the blade and hub surfaces are used to find the torque exerted by the fan rotor on the flowfield. These values are then used to calculate the fan power consumption and total-to-static efficiency, according to

Results
Comparison of experimental and simulated results
The experimental and scaled down Type A domain results are compared in this section, with the aim being to demonstrate the accuracy of the P3DM method itself. Due to the difficulty of setting the exact tip gap size for the experimental tests, the simulated and experimental tip gaps differ slightly. The simulated and experimental tip gaps obtained include: • Zero tip gap (no experimental test) • 2 mm (2.2 mm experimental test) • 3.25 mm (3.5 mm experimental test) • 4.5 mm (4.6 mm experimental test) • Design tip gap, 6.1 mm (5.9 mm experimental test)
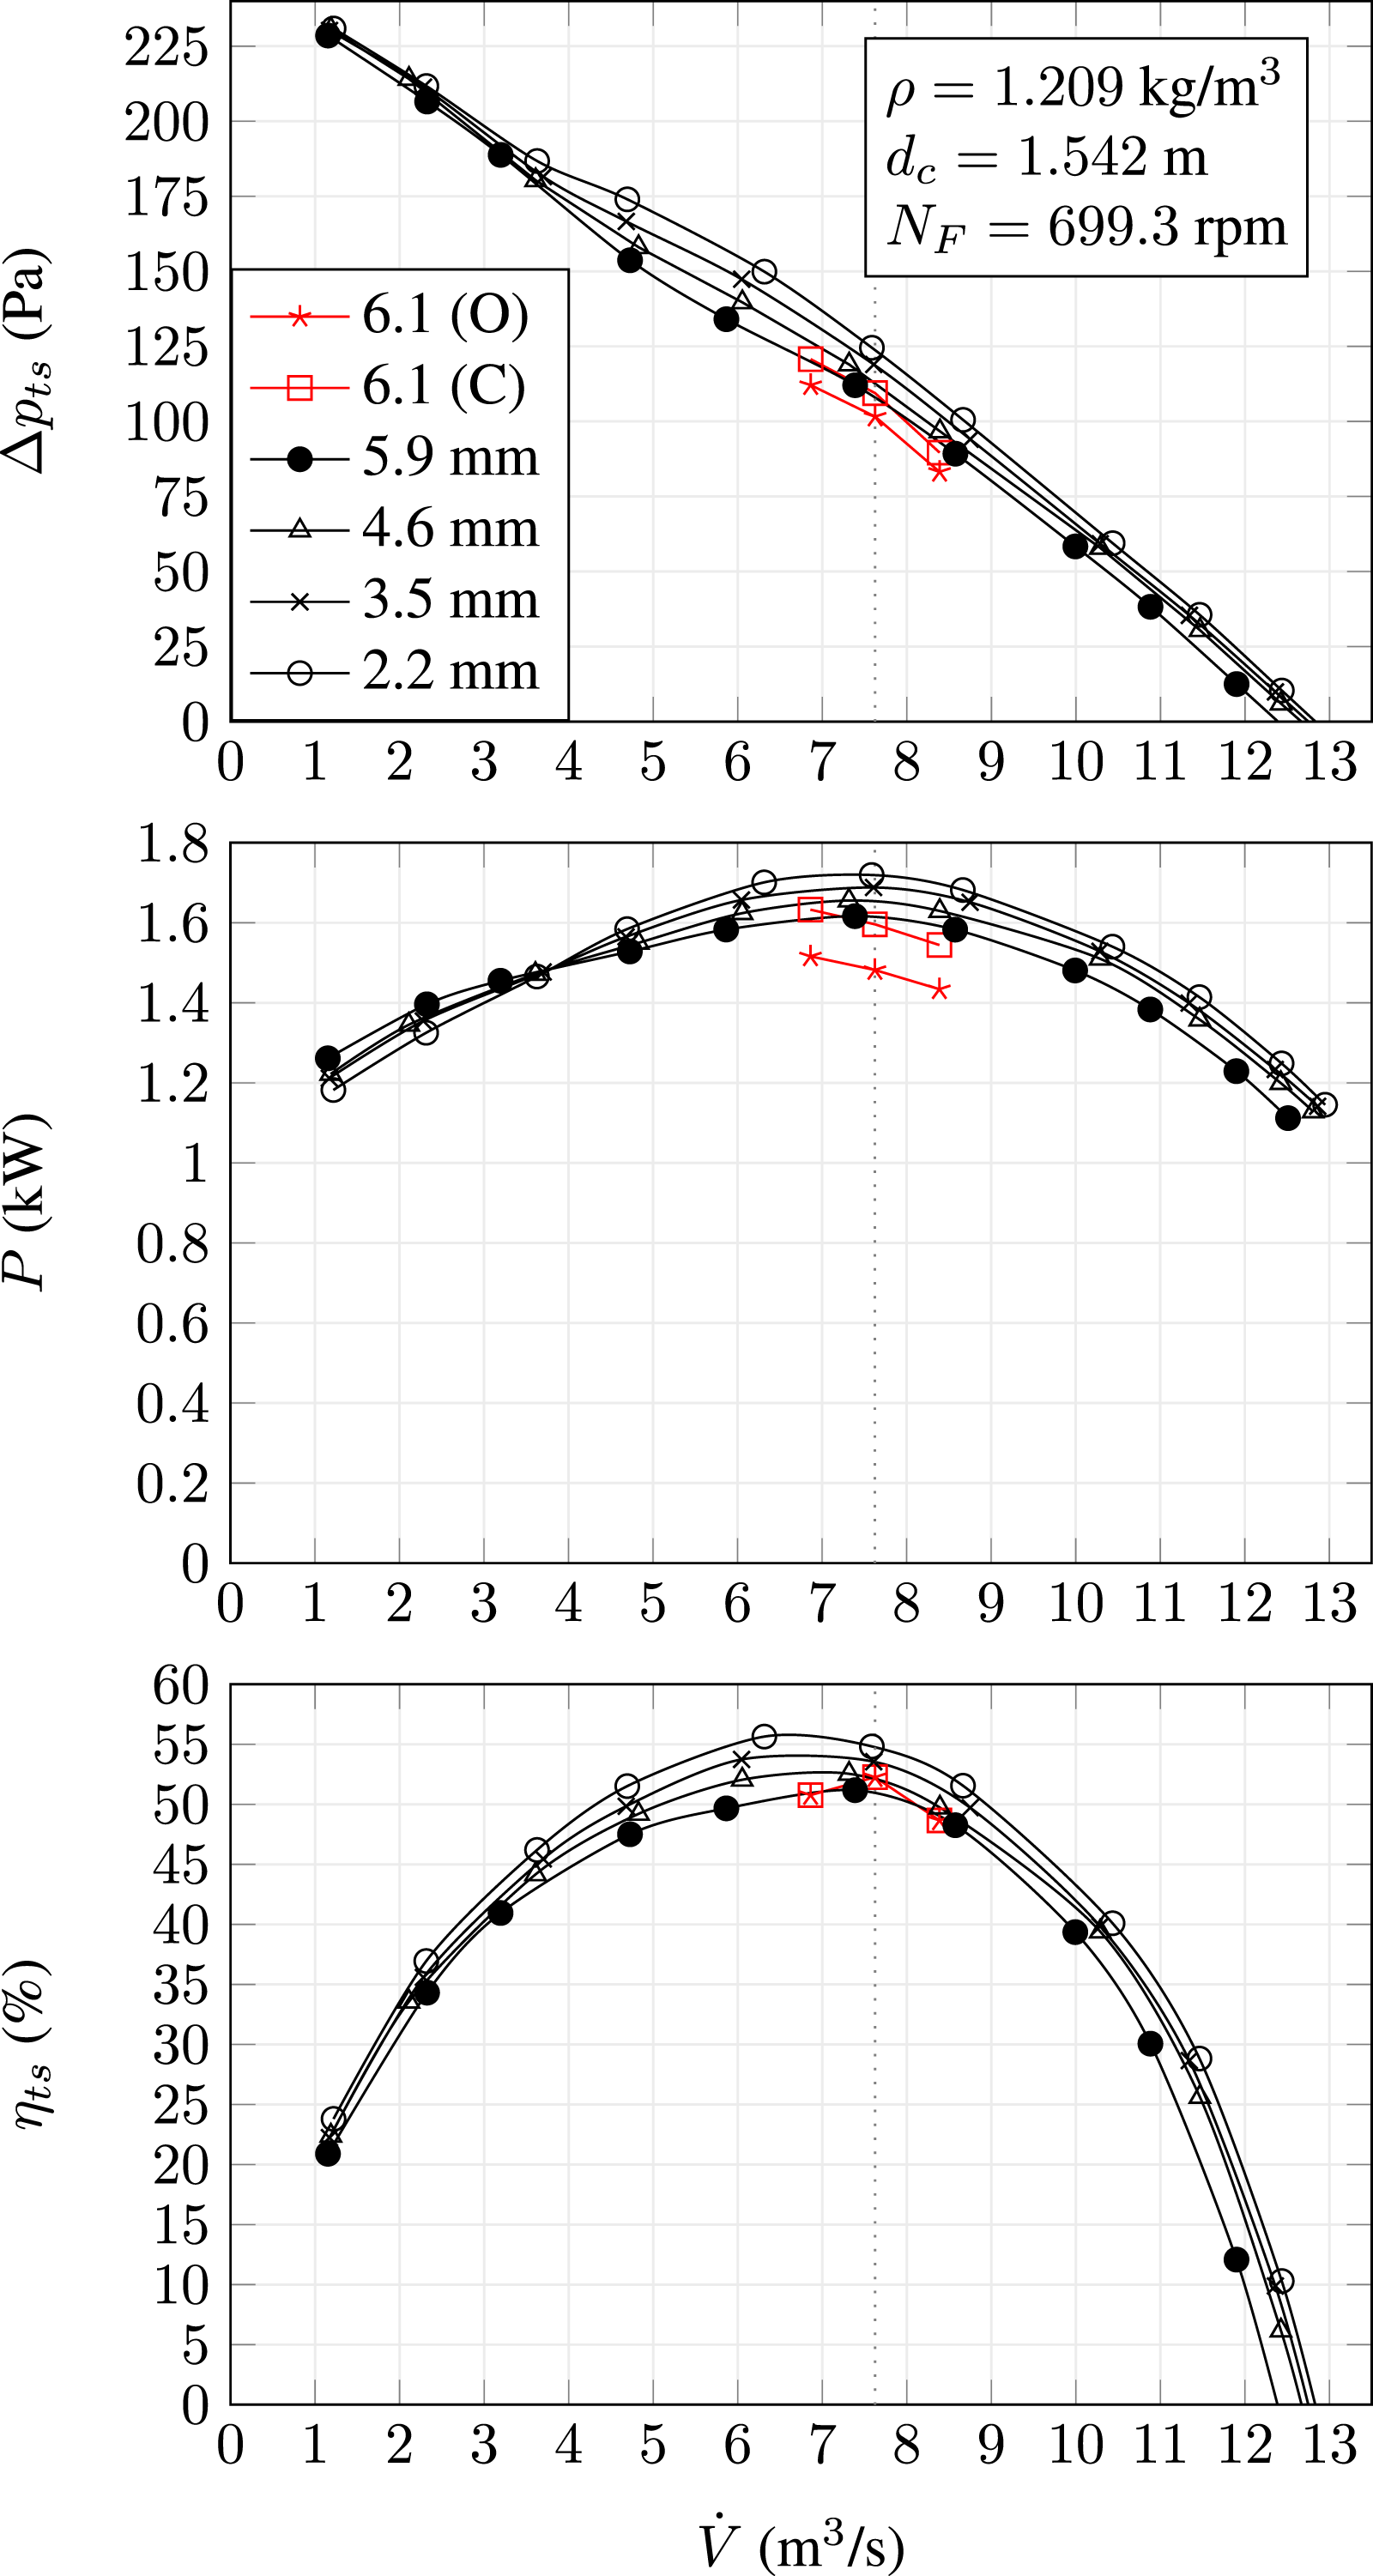
Figure 5 gives the fan performance only at the design flow rate, as a function of the tip gap size. Figure 6 gives the total-to-static pressure rise, power consumption and total-to-static efficiency as a function of the flow rate. Both figures demonstrate good overall agreement between the P3DM and experimental results. However, the experimental pressure and power curves are seen to be offset above the original simulated P3DM values.
After investigation into possible causes of this offset, it was found that a modification made during the manufacturing of the fan increased the lift coefficient of the airfoil profiles used. This modification involved the increase of the trailing edge cuttoff size across the entire blade span to 2 mm, as shown in Figure 4. This was done to accommodate the thickness of the two carbon fibre skins used to form the blade, each of which have a thickness of 1 mm. The midspan airfoil performance (for both the original and opened trailing edge airfoil profiles) were then compared in XFoil.
11
Airfoil with original and 2 mm trailing edge.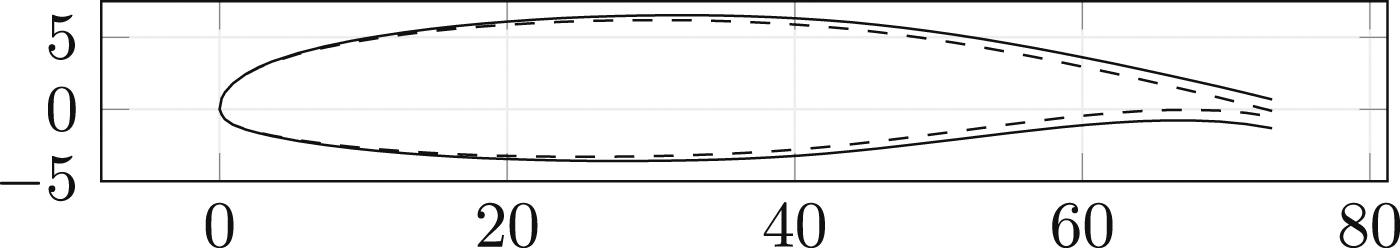
It was found that the opening of the trailing edge increases the lift coefficient of the airfoil from 0.7554 to 0.8132, or an increase factor of 1.077, while having a negligible effect on the drag coefficient. When the scaled down Type A domain pressure rise and power consumption values are multiplied by this 1.077 increase factor, the corrected P3DM and experimental fan performance characteristics are seen to agree well (see Figures 5 and 6). Note that, since equation (3) uses both the pressure rise and power consumption to calculate the efficiency, the increases cancel out and no change in efficiency is expected. Fan performance versus tip gap size at the design flow rate, showing original P3DM (O), corrected P3DM (C) and experimental results. Fan performance versus flow rate for various tip gap sizes, showing original P3DM (O), corrected P3DM (C) and experimental results.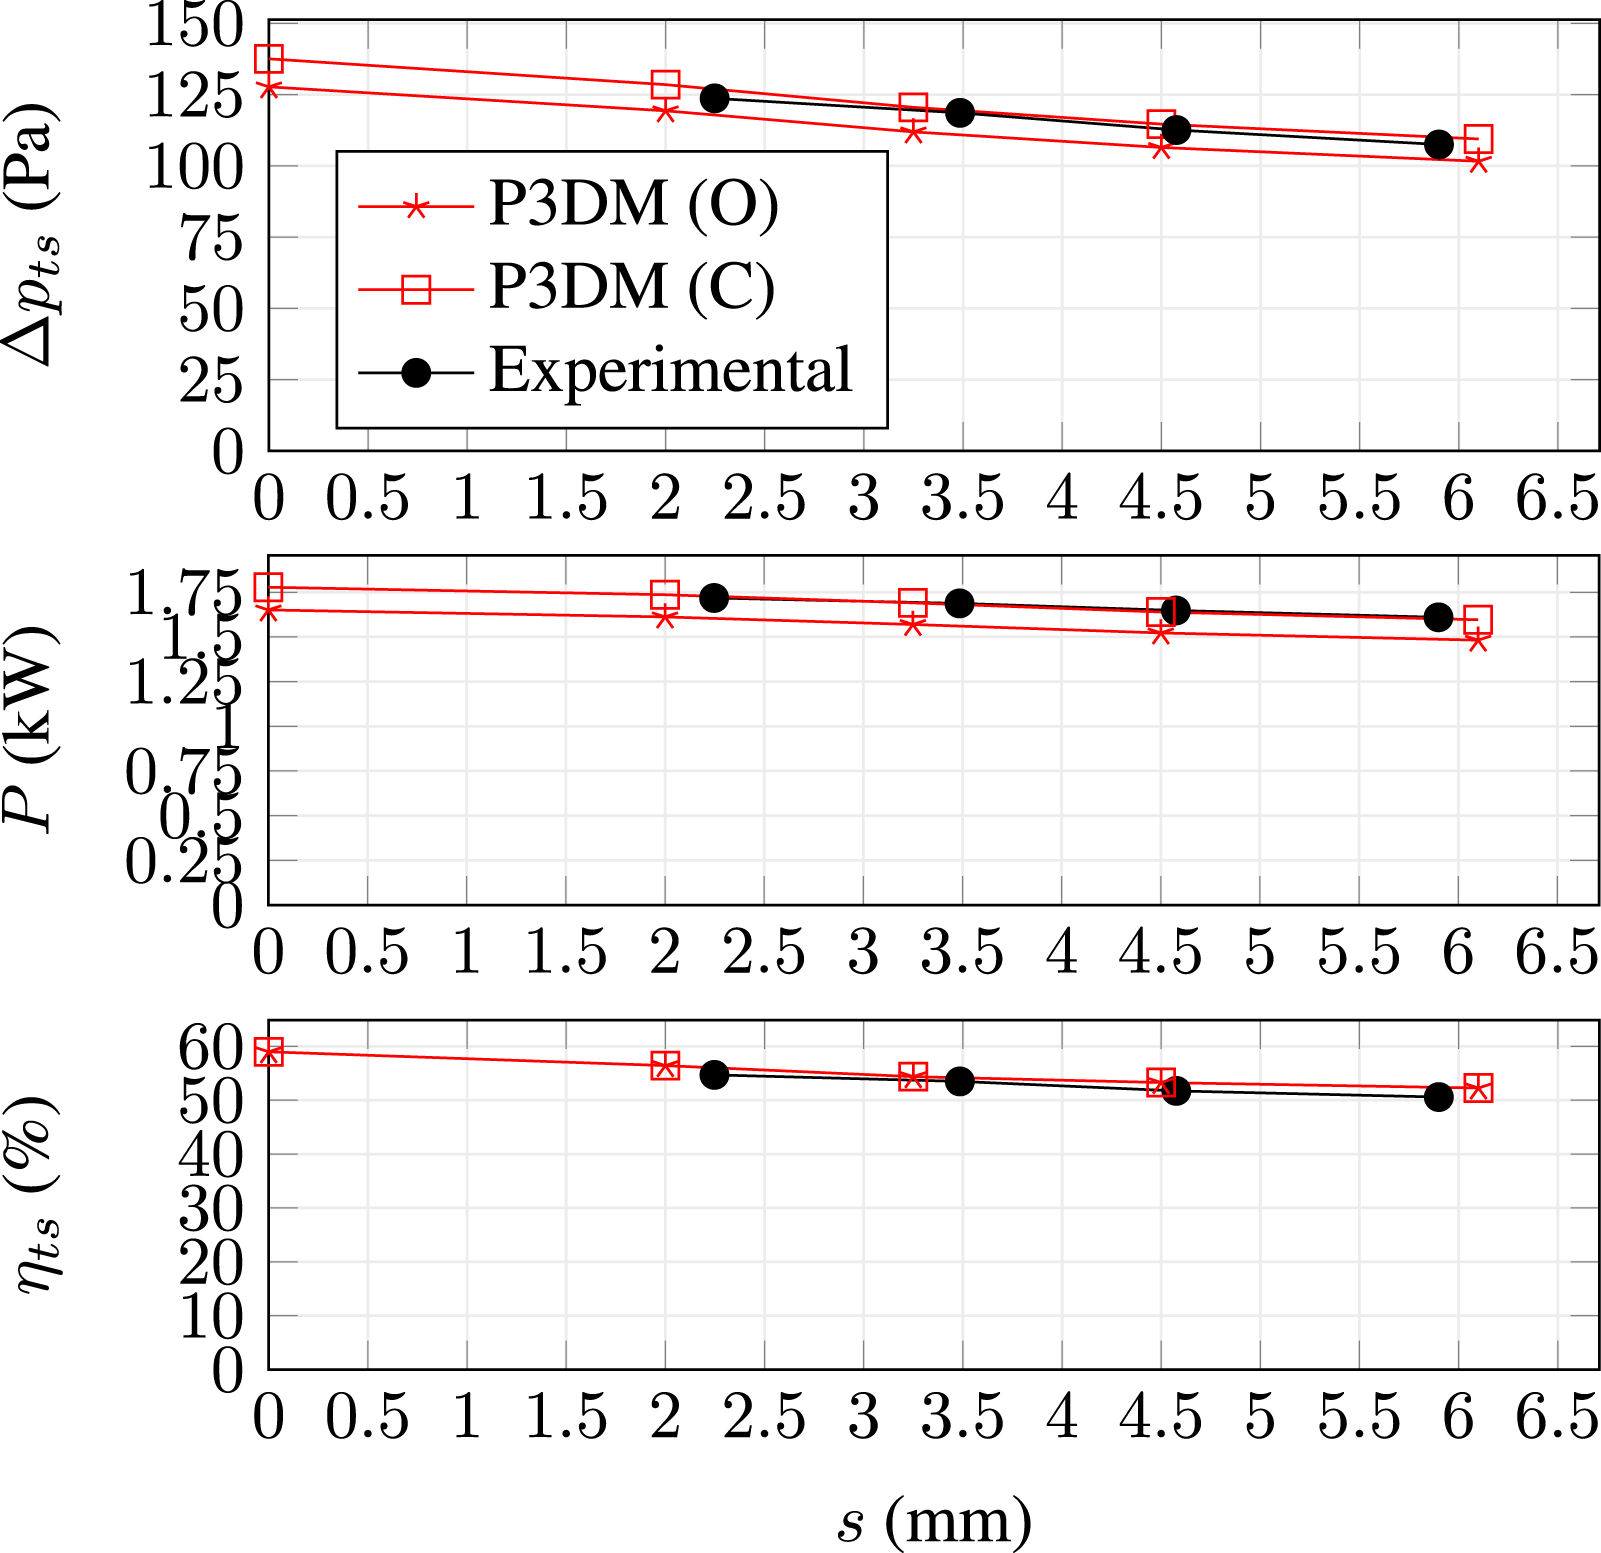
Effect of hub and casing configuration on fan performance
The effect of the fan hub and casing configuration is demonstrated using the full scale P3DM results for the zero tip gap cases, at the design point flow rate of 175.7 m3/s. Four sets of results are presented: • The overall fan performance results are reported in tabular form. • The streamlines of the air flowing through the domain are illustrated using simulation plots from ANSYS Fluent. • The pressure rise, loss and recovery of the air flowing through the fan is illustrated using the mass-averaged pressure values along the axial direction. Negative values on the horizontal axis represent the distance upstream of the fan rotor mid-plane, while positive values represent the downstream distance. • Finally, the flowfield directly upstream and downstream of the rotor is illustrated using the circumferentially-averaged, radial distributions of the velocity, angle of attack and pressure rise on surfaces directly upstream and downstream of the rotor. Fan performance results for the zero tip gap and design flow rate cases.
Table 2 gives the fan performance estimates obtained from the design code, annular domain P3DM and Type A domain P3DM. The annular domain estimates are seen to agree well with the design code. However, a significant drop in performance is seen in the Type A domain results. Note that the power consumption of the fan is also slightly lower in the Type A domain.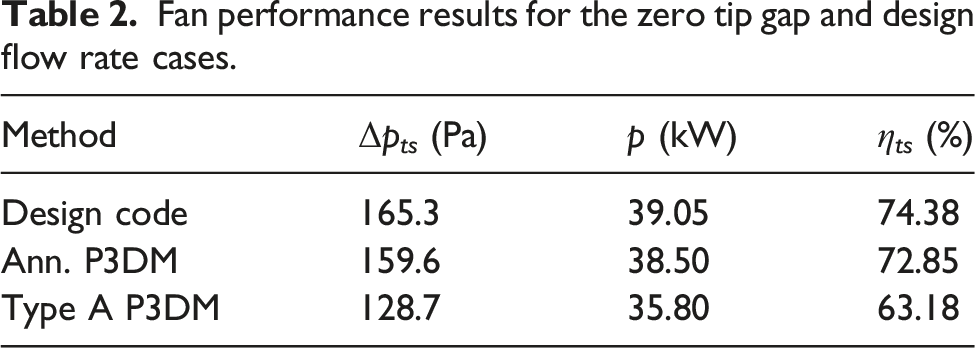
The streamlines of the air flowing through the annular domain are shown Figure 7, where flow is seen to be entering uniformly and exiting with a swirl component, as expected. Figure 7 also shows the streamlines for the Type A domain, where flow is contracted from the large inlet domain to the small fan annulus, and expands into the outlet domain, also as expected. Annular (top) and Type A (bottom) domain streamlines.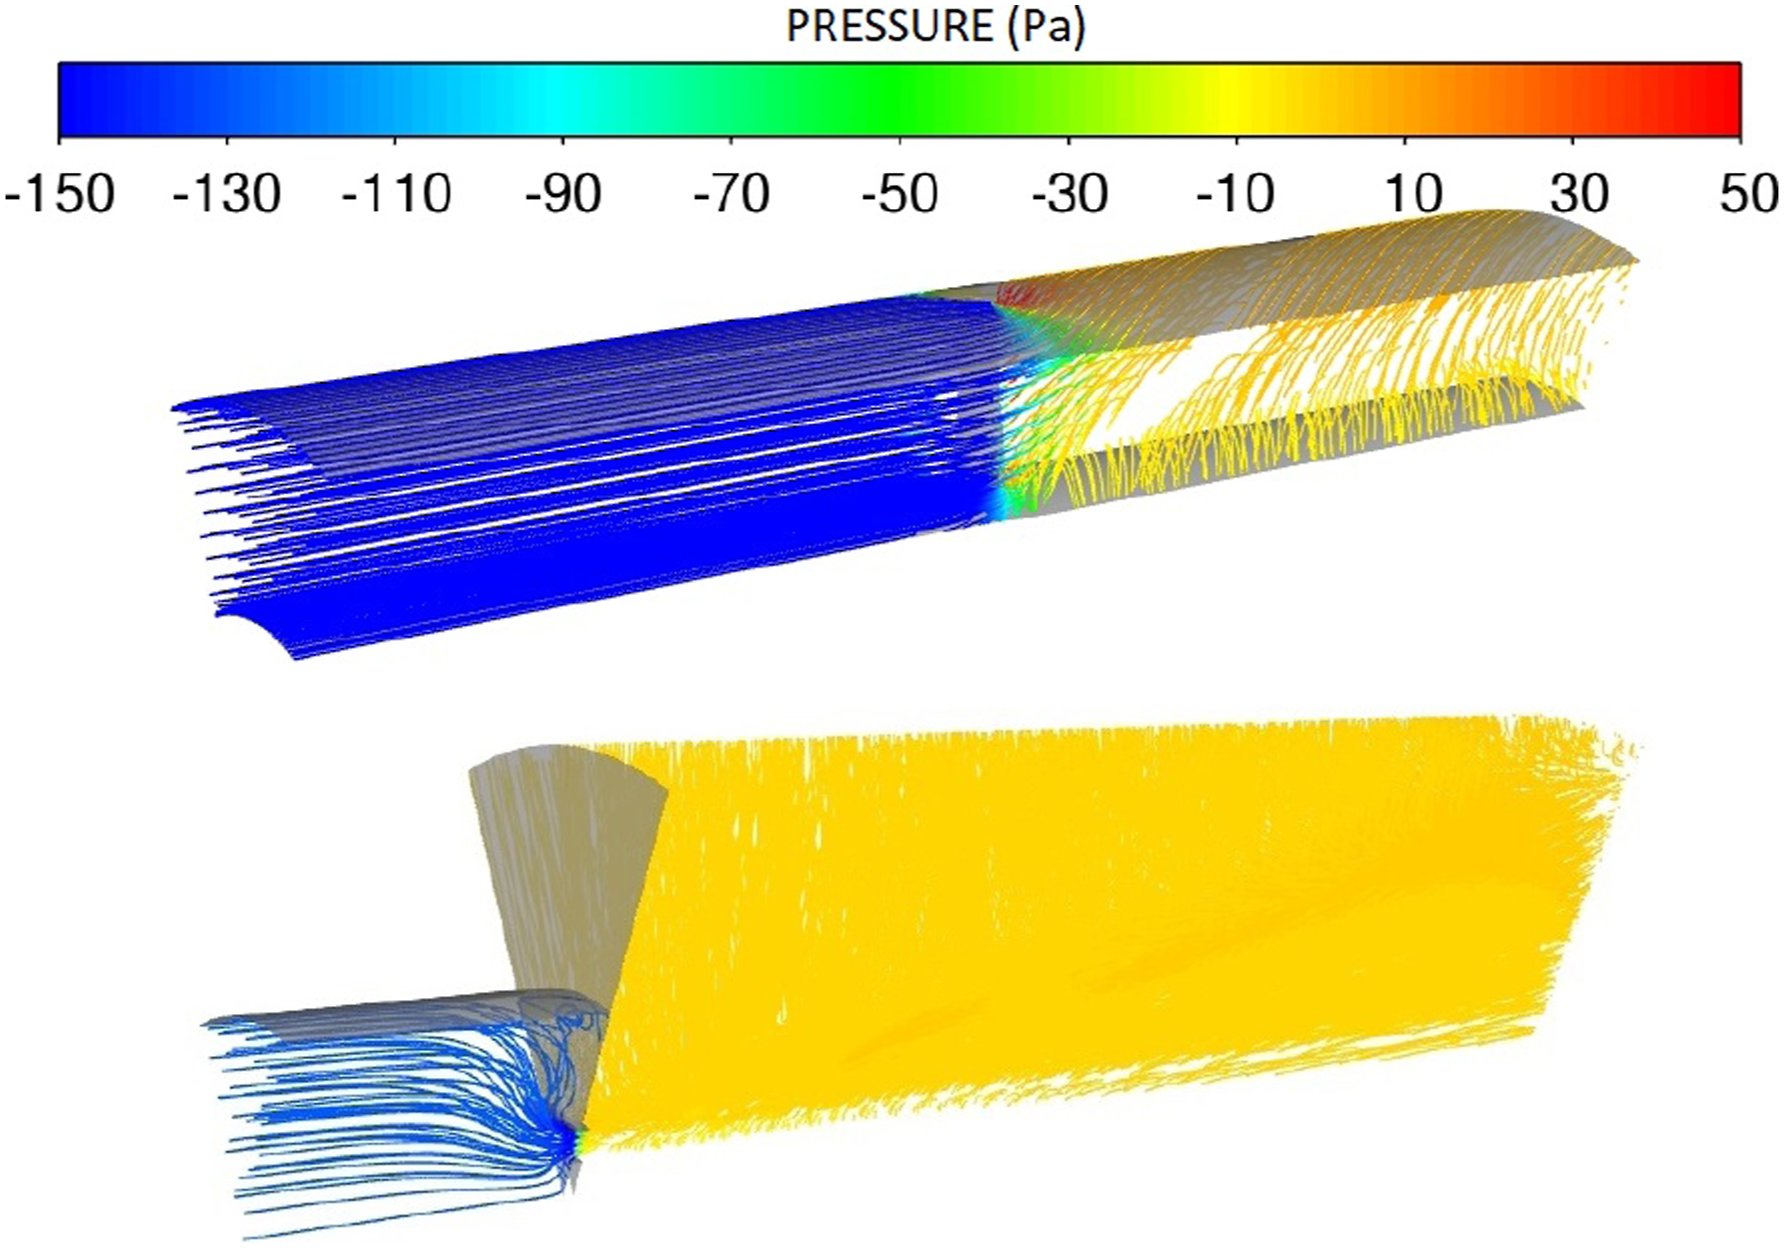
Figure 8 illustrates the pressure distributions of the air flowing through the annular and Type A domains. The annular domain air pressure is seen to increase as air flows through the fan, but otherwise remains constant upstream and downstream of the fan. Axial distribution of pressure for the annular (top) and Type A (bottom) domains.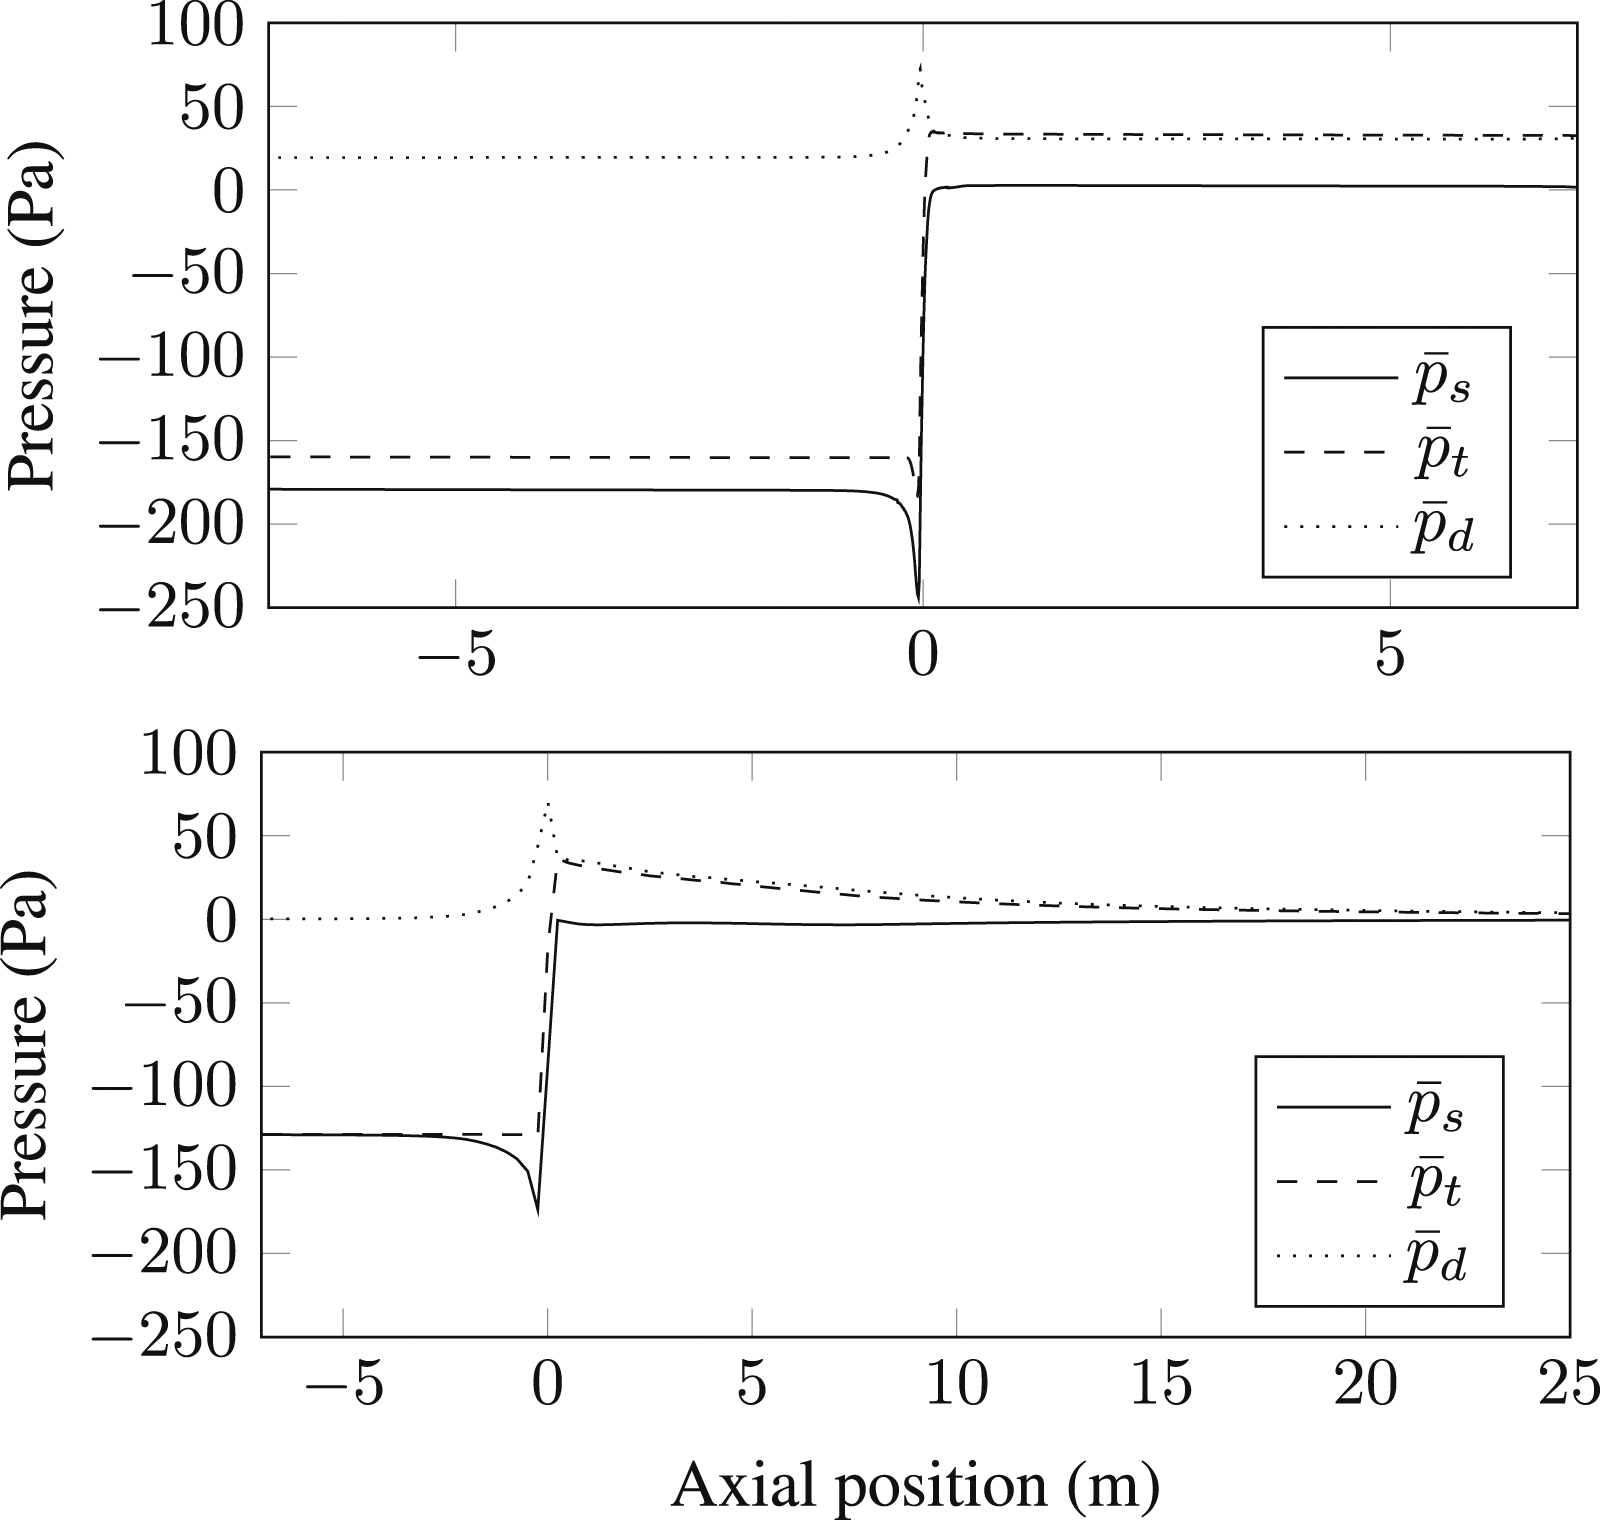
For the Type A domain, Figure 8 shows no significant changes in total pressure directly upstream of the fan, where air must flow around the large hub. This indicates that the flow having to pass around the large hub does not result in any significant losses. Furthermore, the dynamic and total pressure is seen to decrease downstream of the fan, while the static pressure remains relatively constant. This indicates that the dynamic pressure component is dissipated as air enters the atmosphere downstream of the fan, as expected for the Type A configuration. However, the use of the total-to-static pressure rise definition already implies that the dynamic pressure component will be dissipated. Therefore, if the reduction in fan total-to-static pressure rise is not caused by losses in the Type A inlet or outlet sub-domains, it must be due to the fan pressure rise itself being lower in the Type A domain.
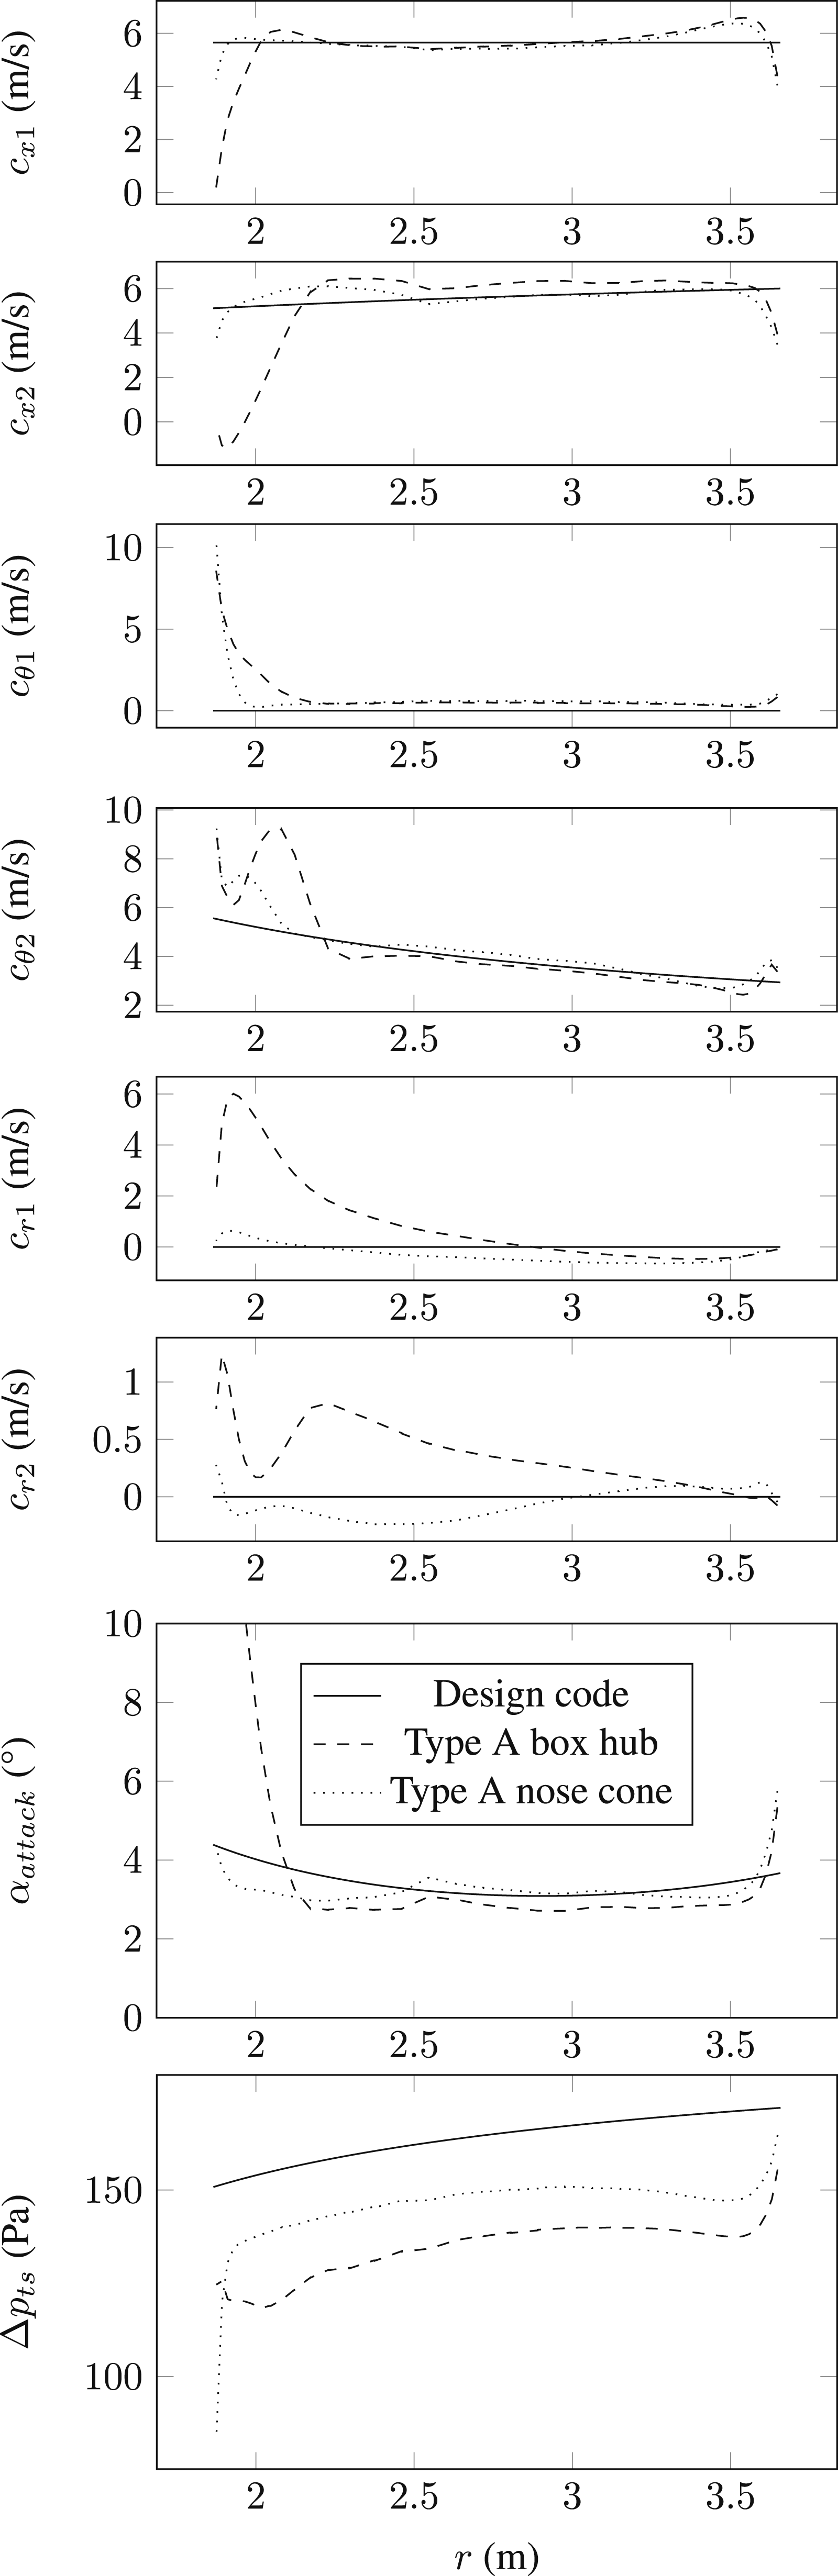
To help explain the reduction in fan pressure rise, a closer look at the flowfield near the fan is required. For this purpose, the velocity, angle of attack and pressure rise distributions directly upstream and downstream of the rotor are given, in Figure 9. The distributions are calculated using the circumferentially-averaged values at various radial positions. Radial distribution of velocity components directly upstream and downstream of fan blade, and the resulting angle of attack and pressure rise distributions, with no tip gap present.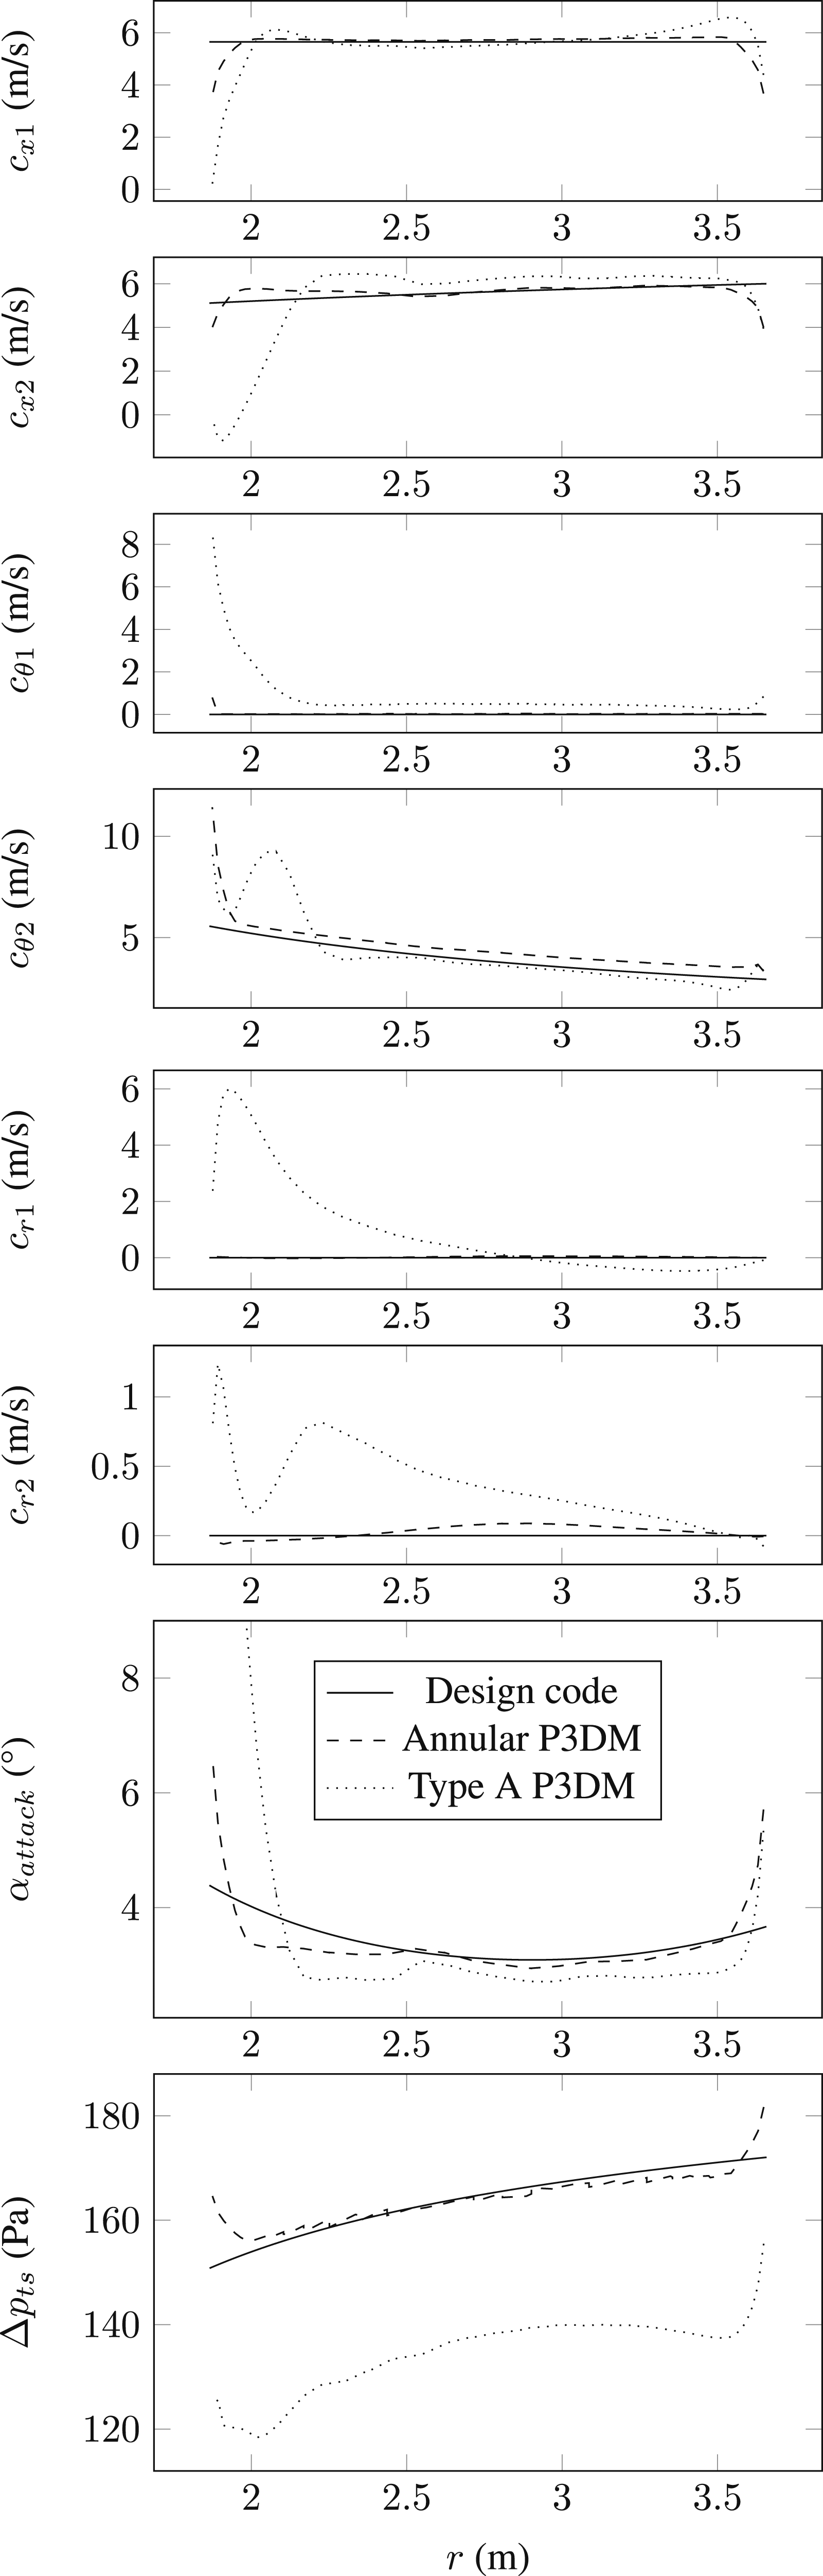
The design code and annular domain distributions are quite similar, except for the near-wall regions at the hub and tip. This confirms that the annular domain represents the ideal flow conditions assumed by the design procedure: a near-uniform inlet velocity profile and negligible radial flow.
The Type A domain distributions are however drastically different from the design code and annular domain distributions, especially near the hub. Due to the box hub configuration, flow near the hub has large radial and tangential components. Since the fan has a relatively large hub, the effect of this on the rest of the blade is prominent. The fan is supplied with a non-uniform inlet velocity profile, resulting in a lowered angle of attack distribution across most of the blade. This lower angle of attack explains the reduced pressure rise and power consumption seen in the Type A domain results.
This demonstrates that if the hub configuration does not supply the fan with a uniform velocity profile upstream of the blades, the fan performance will be signicantly reduced.
Effect of tip gap size on fan performance
Fan performance results for the full scale Type A domain P3DM.
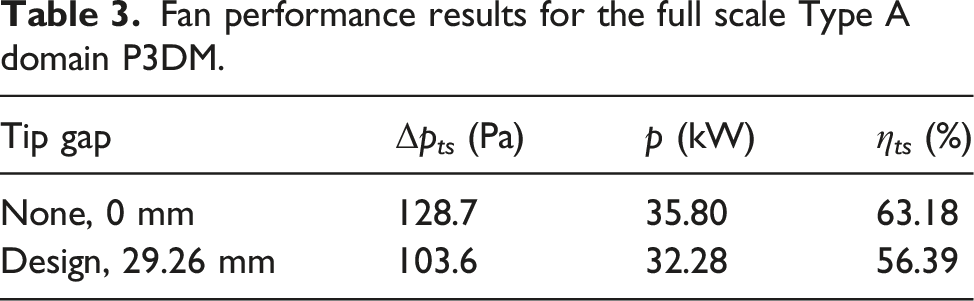
Figure 10 illustrates the tip leakage vortex caused by backflow from the high pressure side of the blade to the low pressure side. Tip leakage vortex.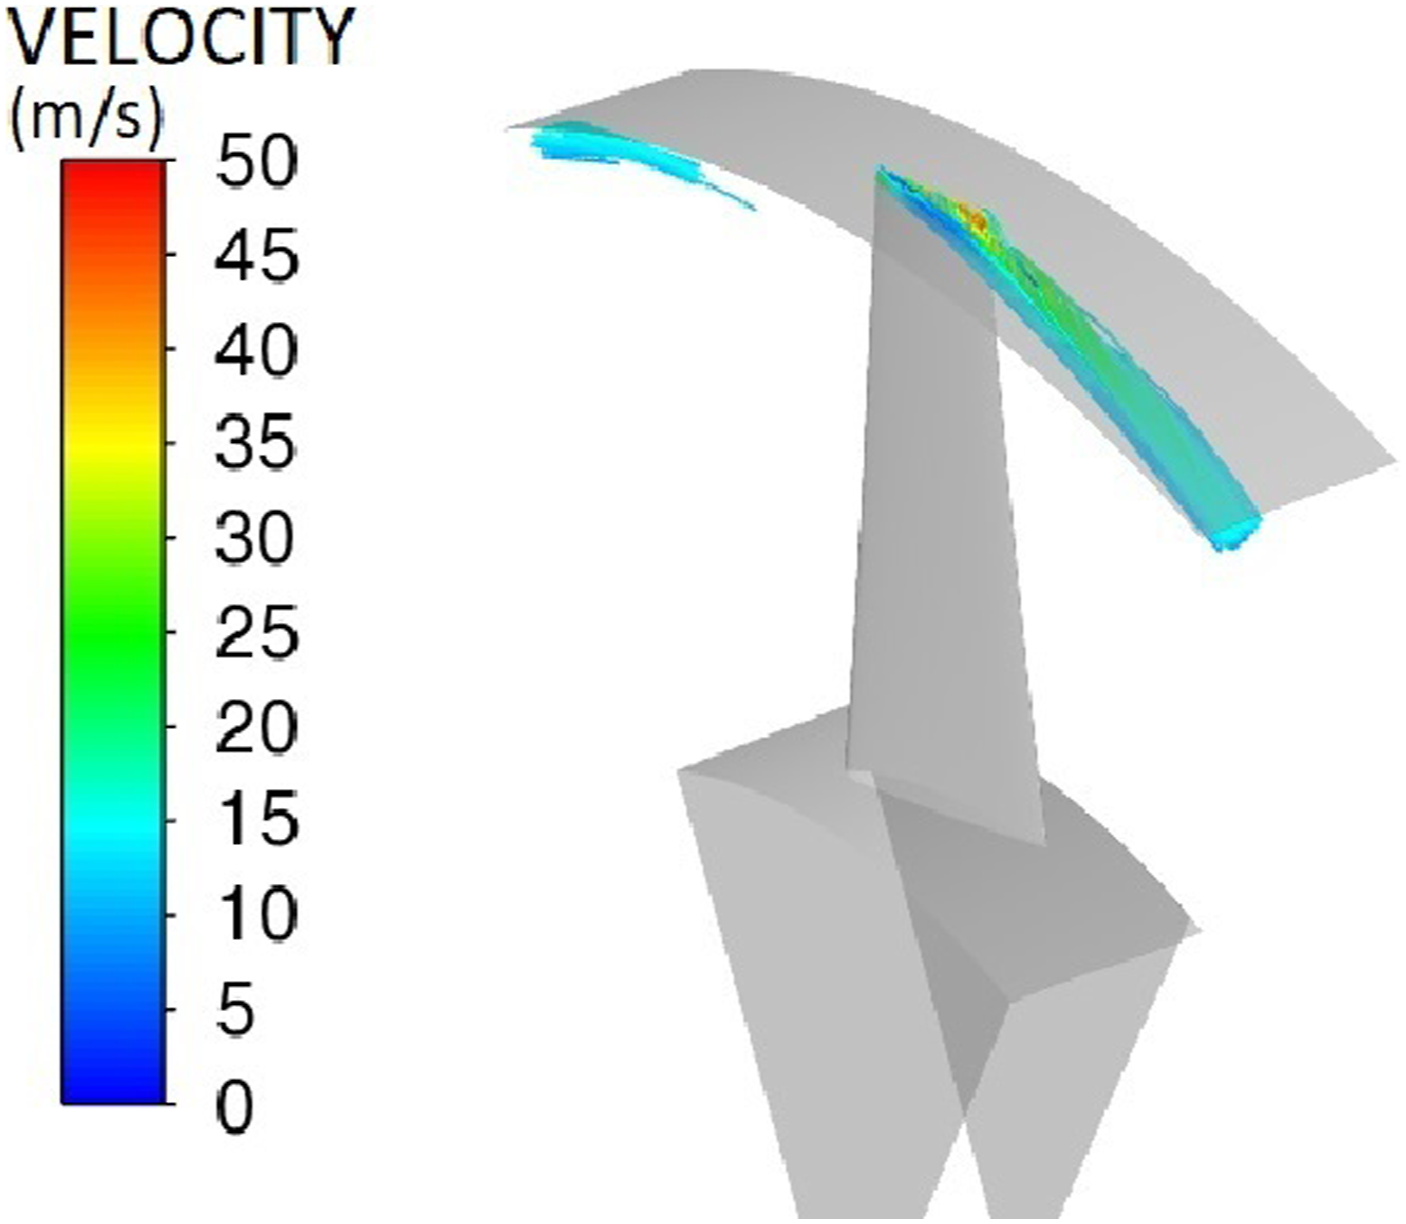
Figure 11 illustrates the pressure of the air flowing through the domain with the design tip gap present. While this distribution seems similar to that seen in the zero tip gap case, a notable difference is that the total-to-static pressure rise is significantly lower. A fraction of the dynamic pressure is also shown to be recovered, slightly increasing the static pressure downstream of the fan. This is likely due to the high speed tip leakage vortex expanding into the atmosphere. Axial distribution of pressure components for the Type A domain with the design tip gap size present.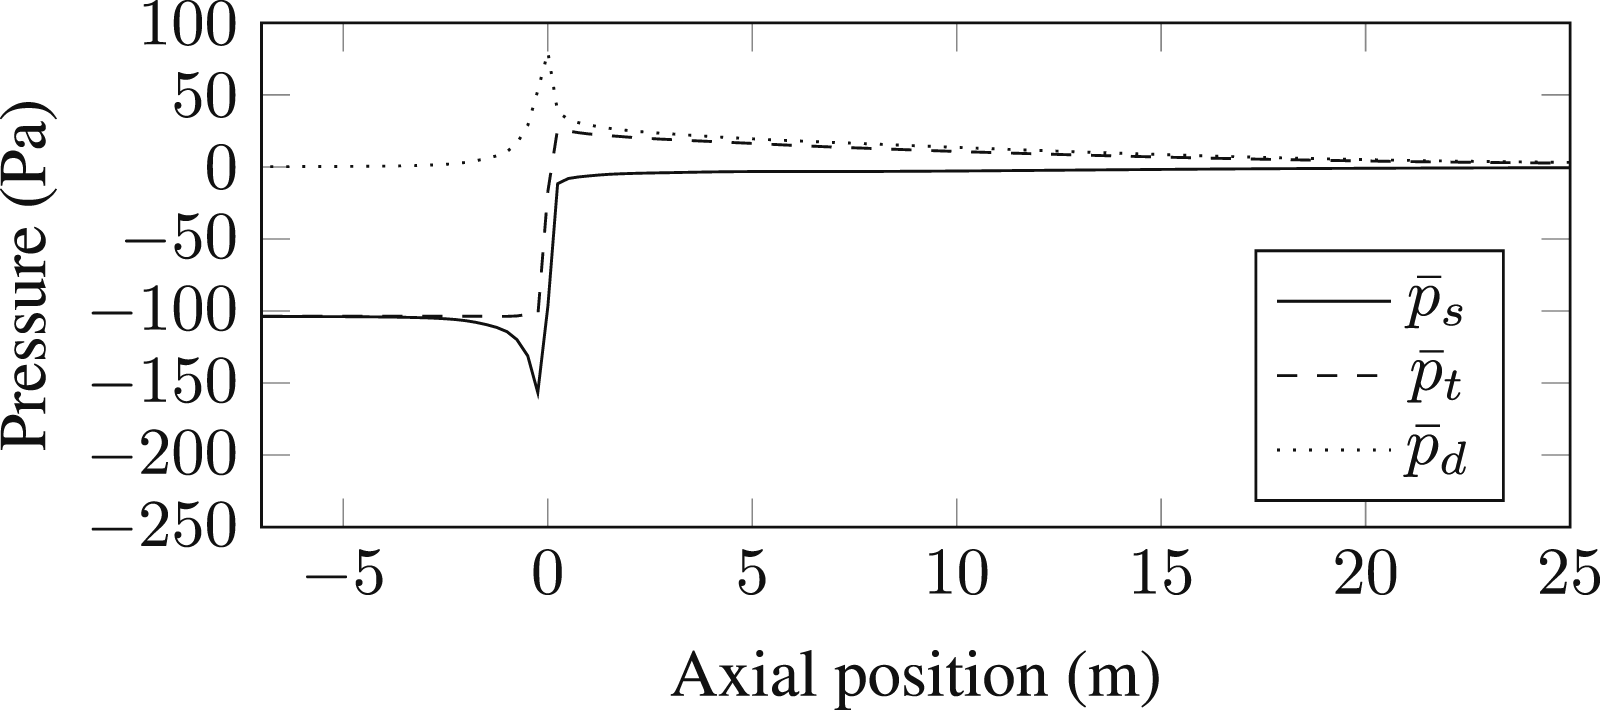
Finally, Figure 12 illustrates the velocity, angle of attack and pressure rise distributions directly upstream and downstream of the blades, with no tip gap and the design tip gap size present. The results demonstrate that the inclusion of the tip gap significantly influences the flowfield through the fan, resulting in an even further distorted angle of attack distribution and lowered pressure rise distribution. Radial distribution of velocity components directly upstream and downstream of fan blade, and the resulting angle of attack and pressure rise distributions, with the design tip gap size present.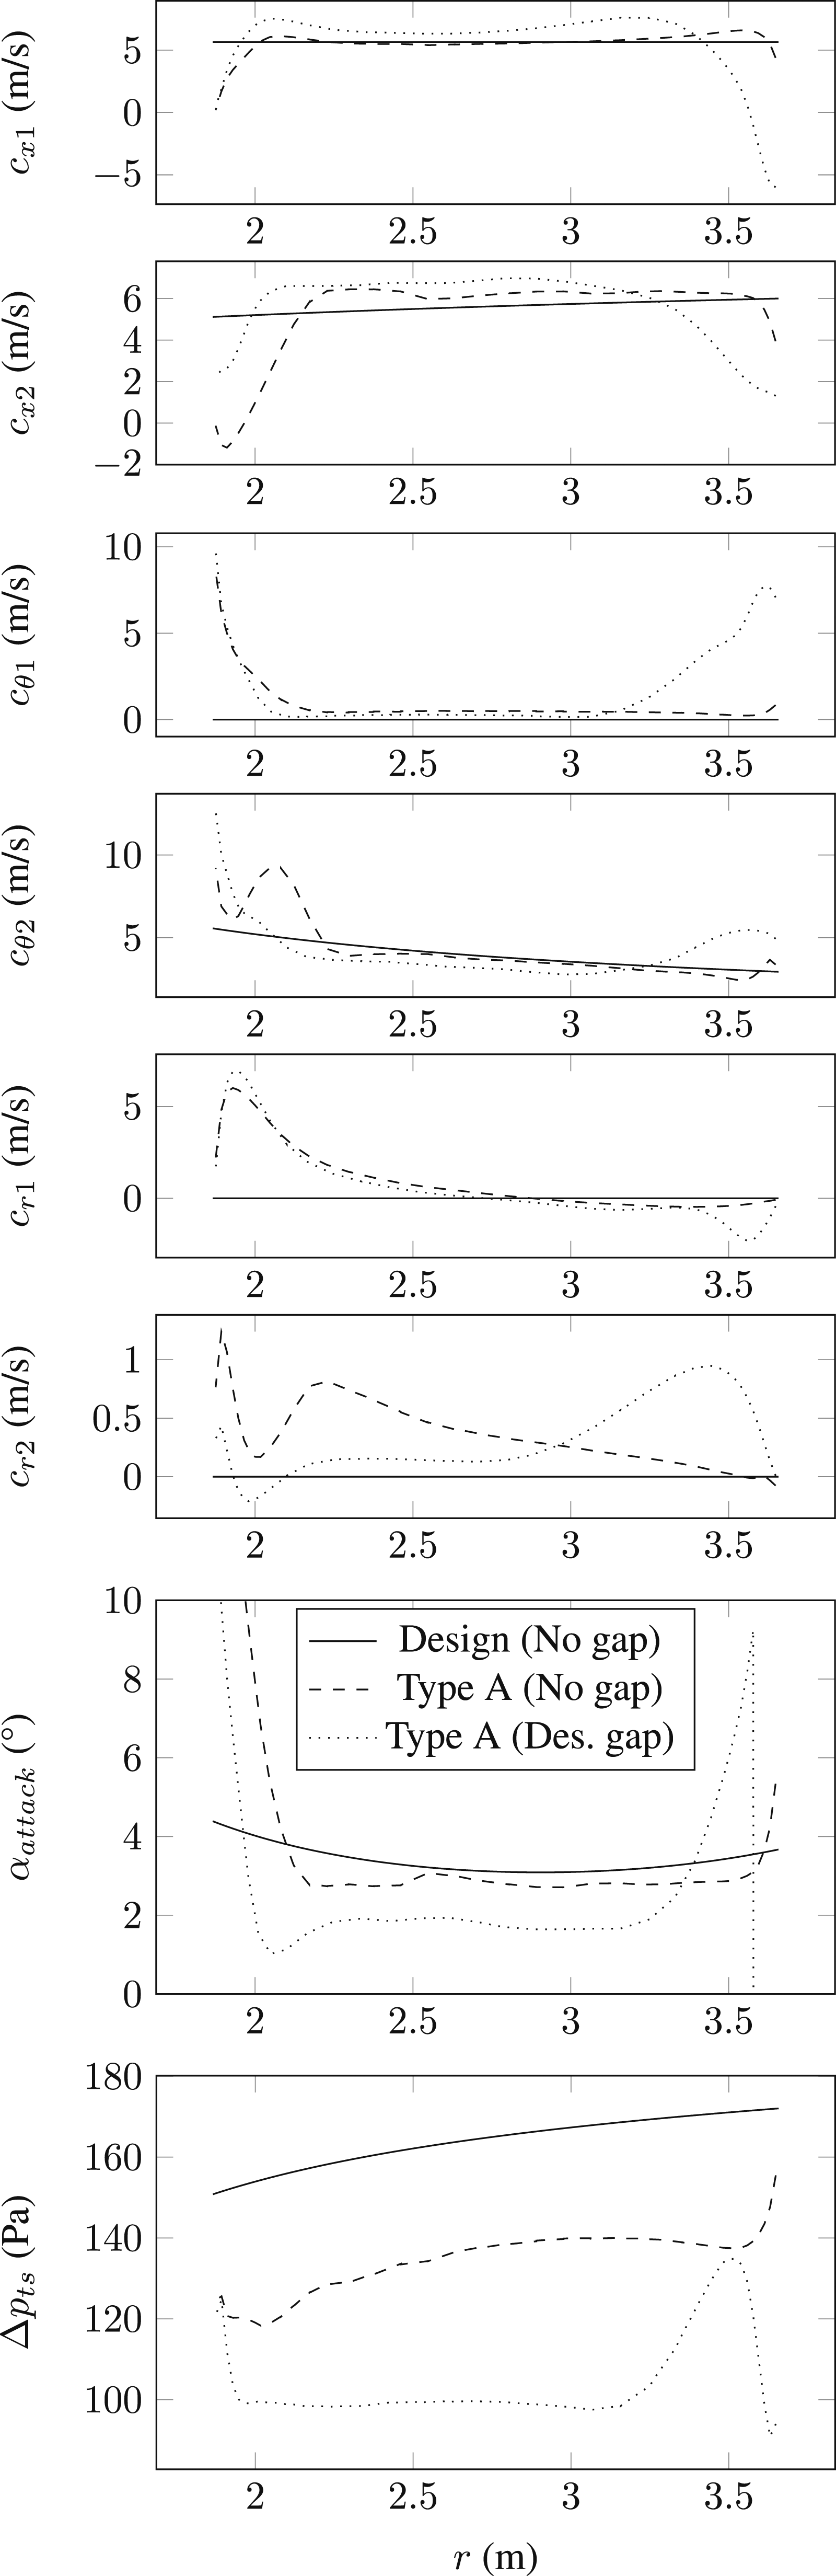
Effect of scaling on fan performance
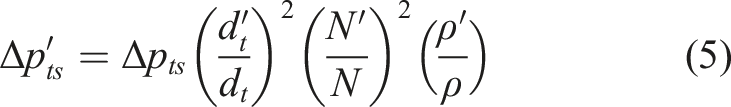
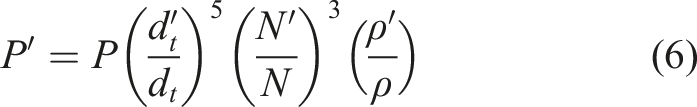
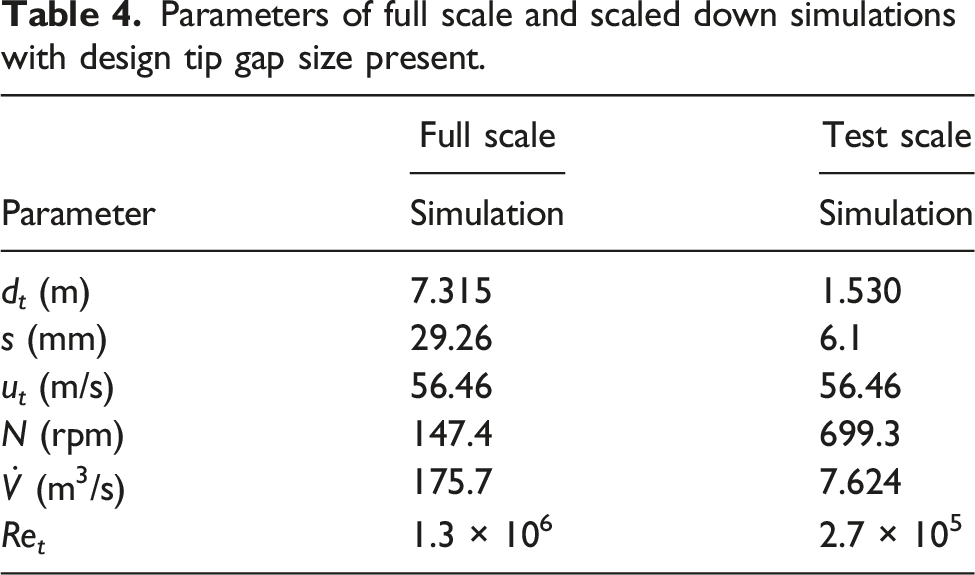
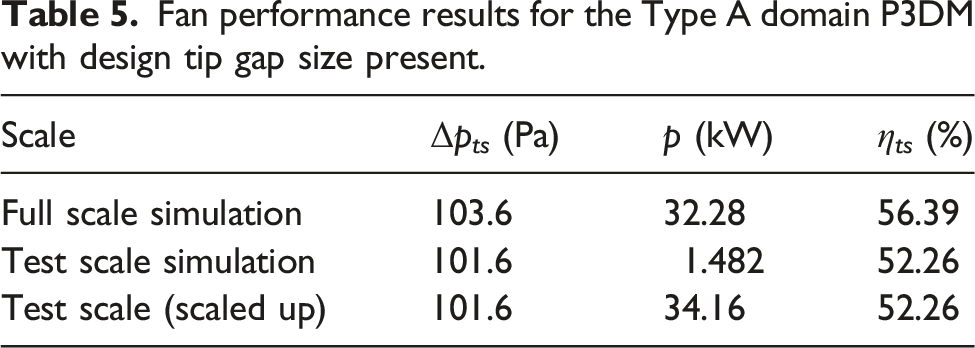
To demonstrate the effect of scaling down from the full scale to the experimental test scale, the Type A domain and fan geometry was also scaled down and simulated. The same blade tip speed is used as the full scale fan. All required parameters are then calculated using the fan scaling laws: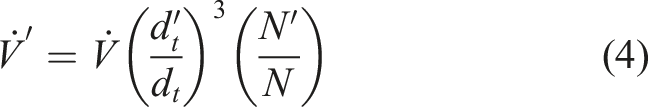
Parameters of full scale and scaled down simulations with design tip gap size present.
Fan performance results for the Type A domain P3DM with design tip gap size present.
Discussion
By comparing the design code and annular domain P3DM results, it is seen that the design procedure accurately predicts the fan’s performance if flow enters the fan uniformly. However, the Type A configuration includes the large hub, which significantly reduces the uniformity of the flow entering the fan. The fan’s performance can therefore be improved by providing a more uniform inlet flow profile, using configurations other than the cylindrical box hub. Two such configurations are demonstrated in the following sections.
Spherical nose cone
A commonly used method of improving fan performance is to place a spherical nose cone upstream of the hub, as shown in Figure 13, which can either rotate with the hub, or be held stationary. Spherical nose cone configuration, with R representing rotating surfaces, and S representing stationary surfaces.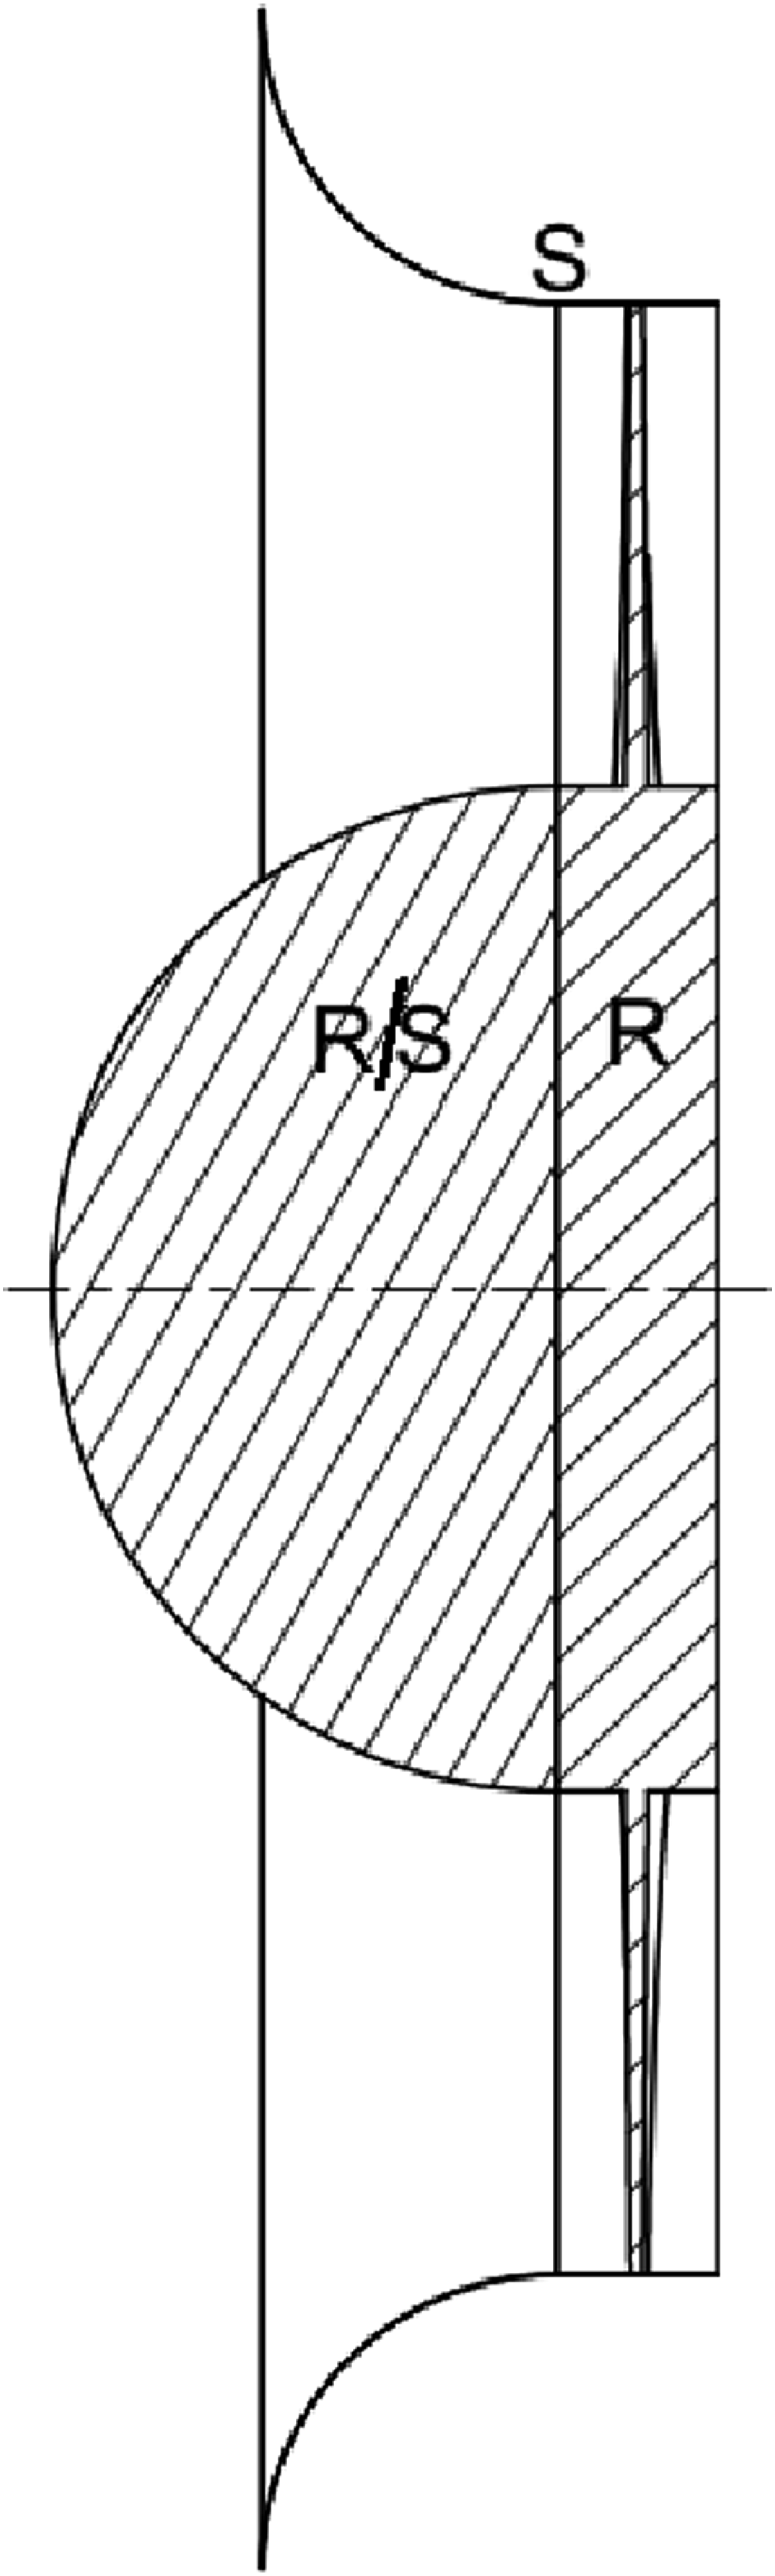
Flow field improvement
Figure 14 illustrates the streamlines obtained around such a nose cone, rotating with the hub, for the full scale Type A domain and no tip clearance. The nose cone gradually directs flow around the large hub, resulting in a more uniform inlet flow profile. This uniformity brings the fan closer to its intended, design operation. Figure 15 illustrates the improved angle of attack and pressure rise distributions, which are seen to be closer to the design code estimates. Type A domain with nose cone streamlines. Radial distribution of velocity components directly upstream and downstream of fan blade, and the resulting angle of attack and pressure rise distributions, for the rotating nose cone configuration with no tip gap present.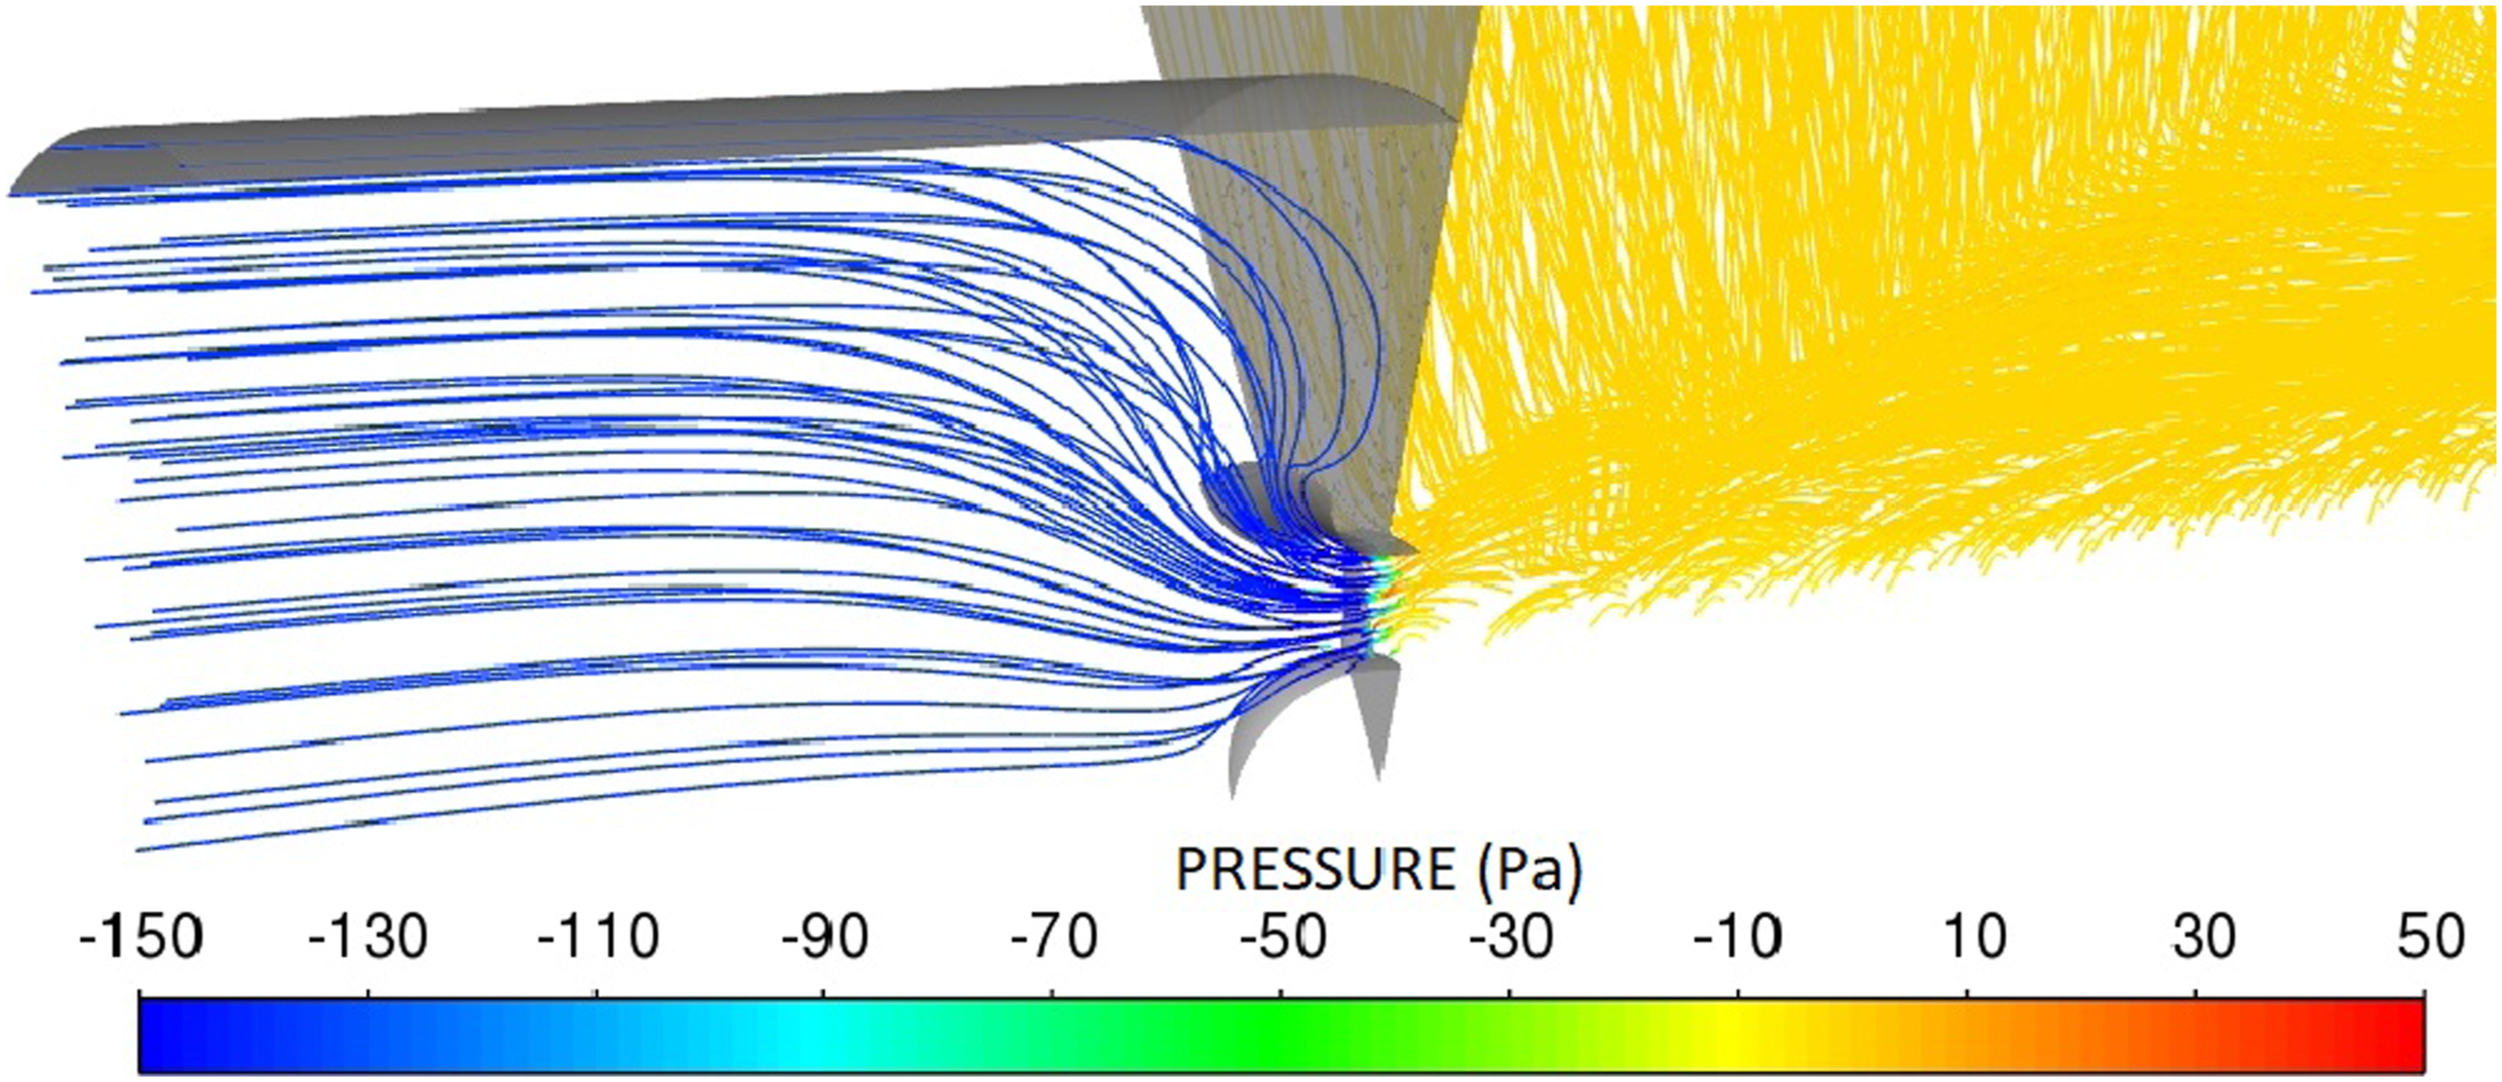
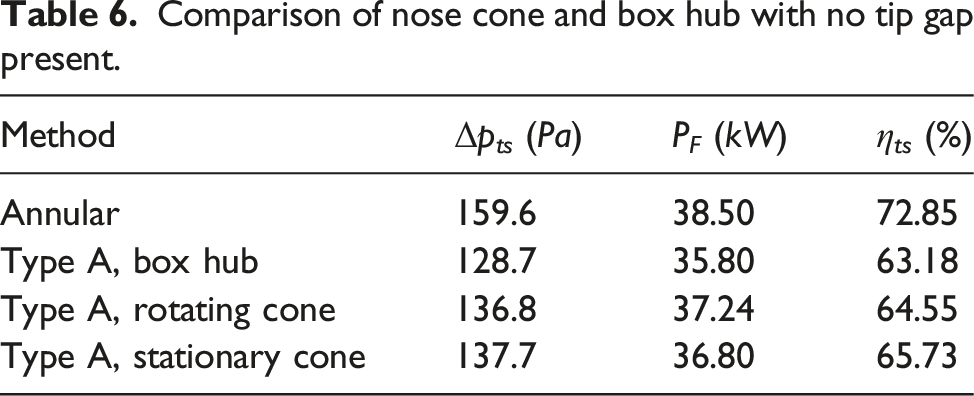
Comparison of rotating and stationary nose cone alternatives
Comparison of nose cone and box hub with no tip gap present.
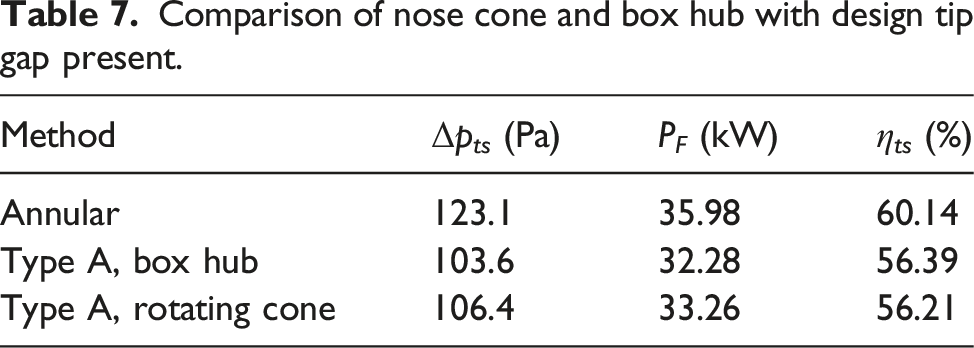
Effect of tip gap size
Comparison of nose cone and box hub with design tip gap present.
Extended annulus
As mentioned previously, the nose cone method provides a gradual contraction of the flow around the hub to provide a more uniform inlet flow profile compared to the box hub. Another method is to simply allow the contracted flow to settle and even out before coming into contact with the blade. This is done by extending the box hub and casing forwards, effectively extending the annulus upstream of the fan. The box hub and casing can also be extended backwards to ensure the pressure distribution downstream of the fan develops as intended by the design procedure, which limits radial flow.
2
The resulting configuration, shown in Figure 16, provides flow closer to that of the annular domain. Extended annulus configuration, with R representing rotating surfaces, and S representing stationary surfaces.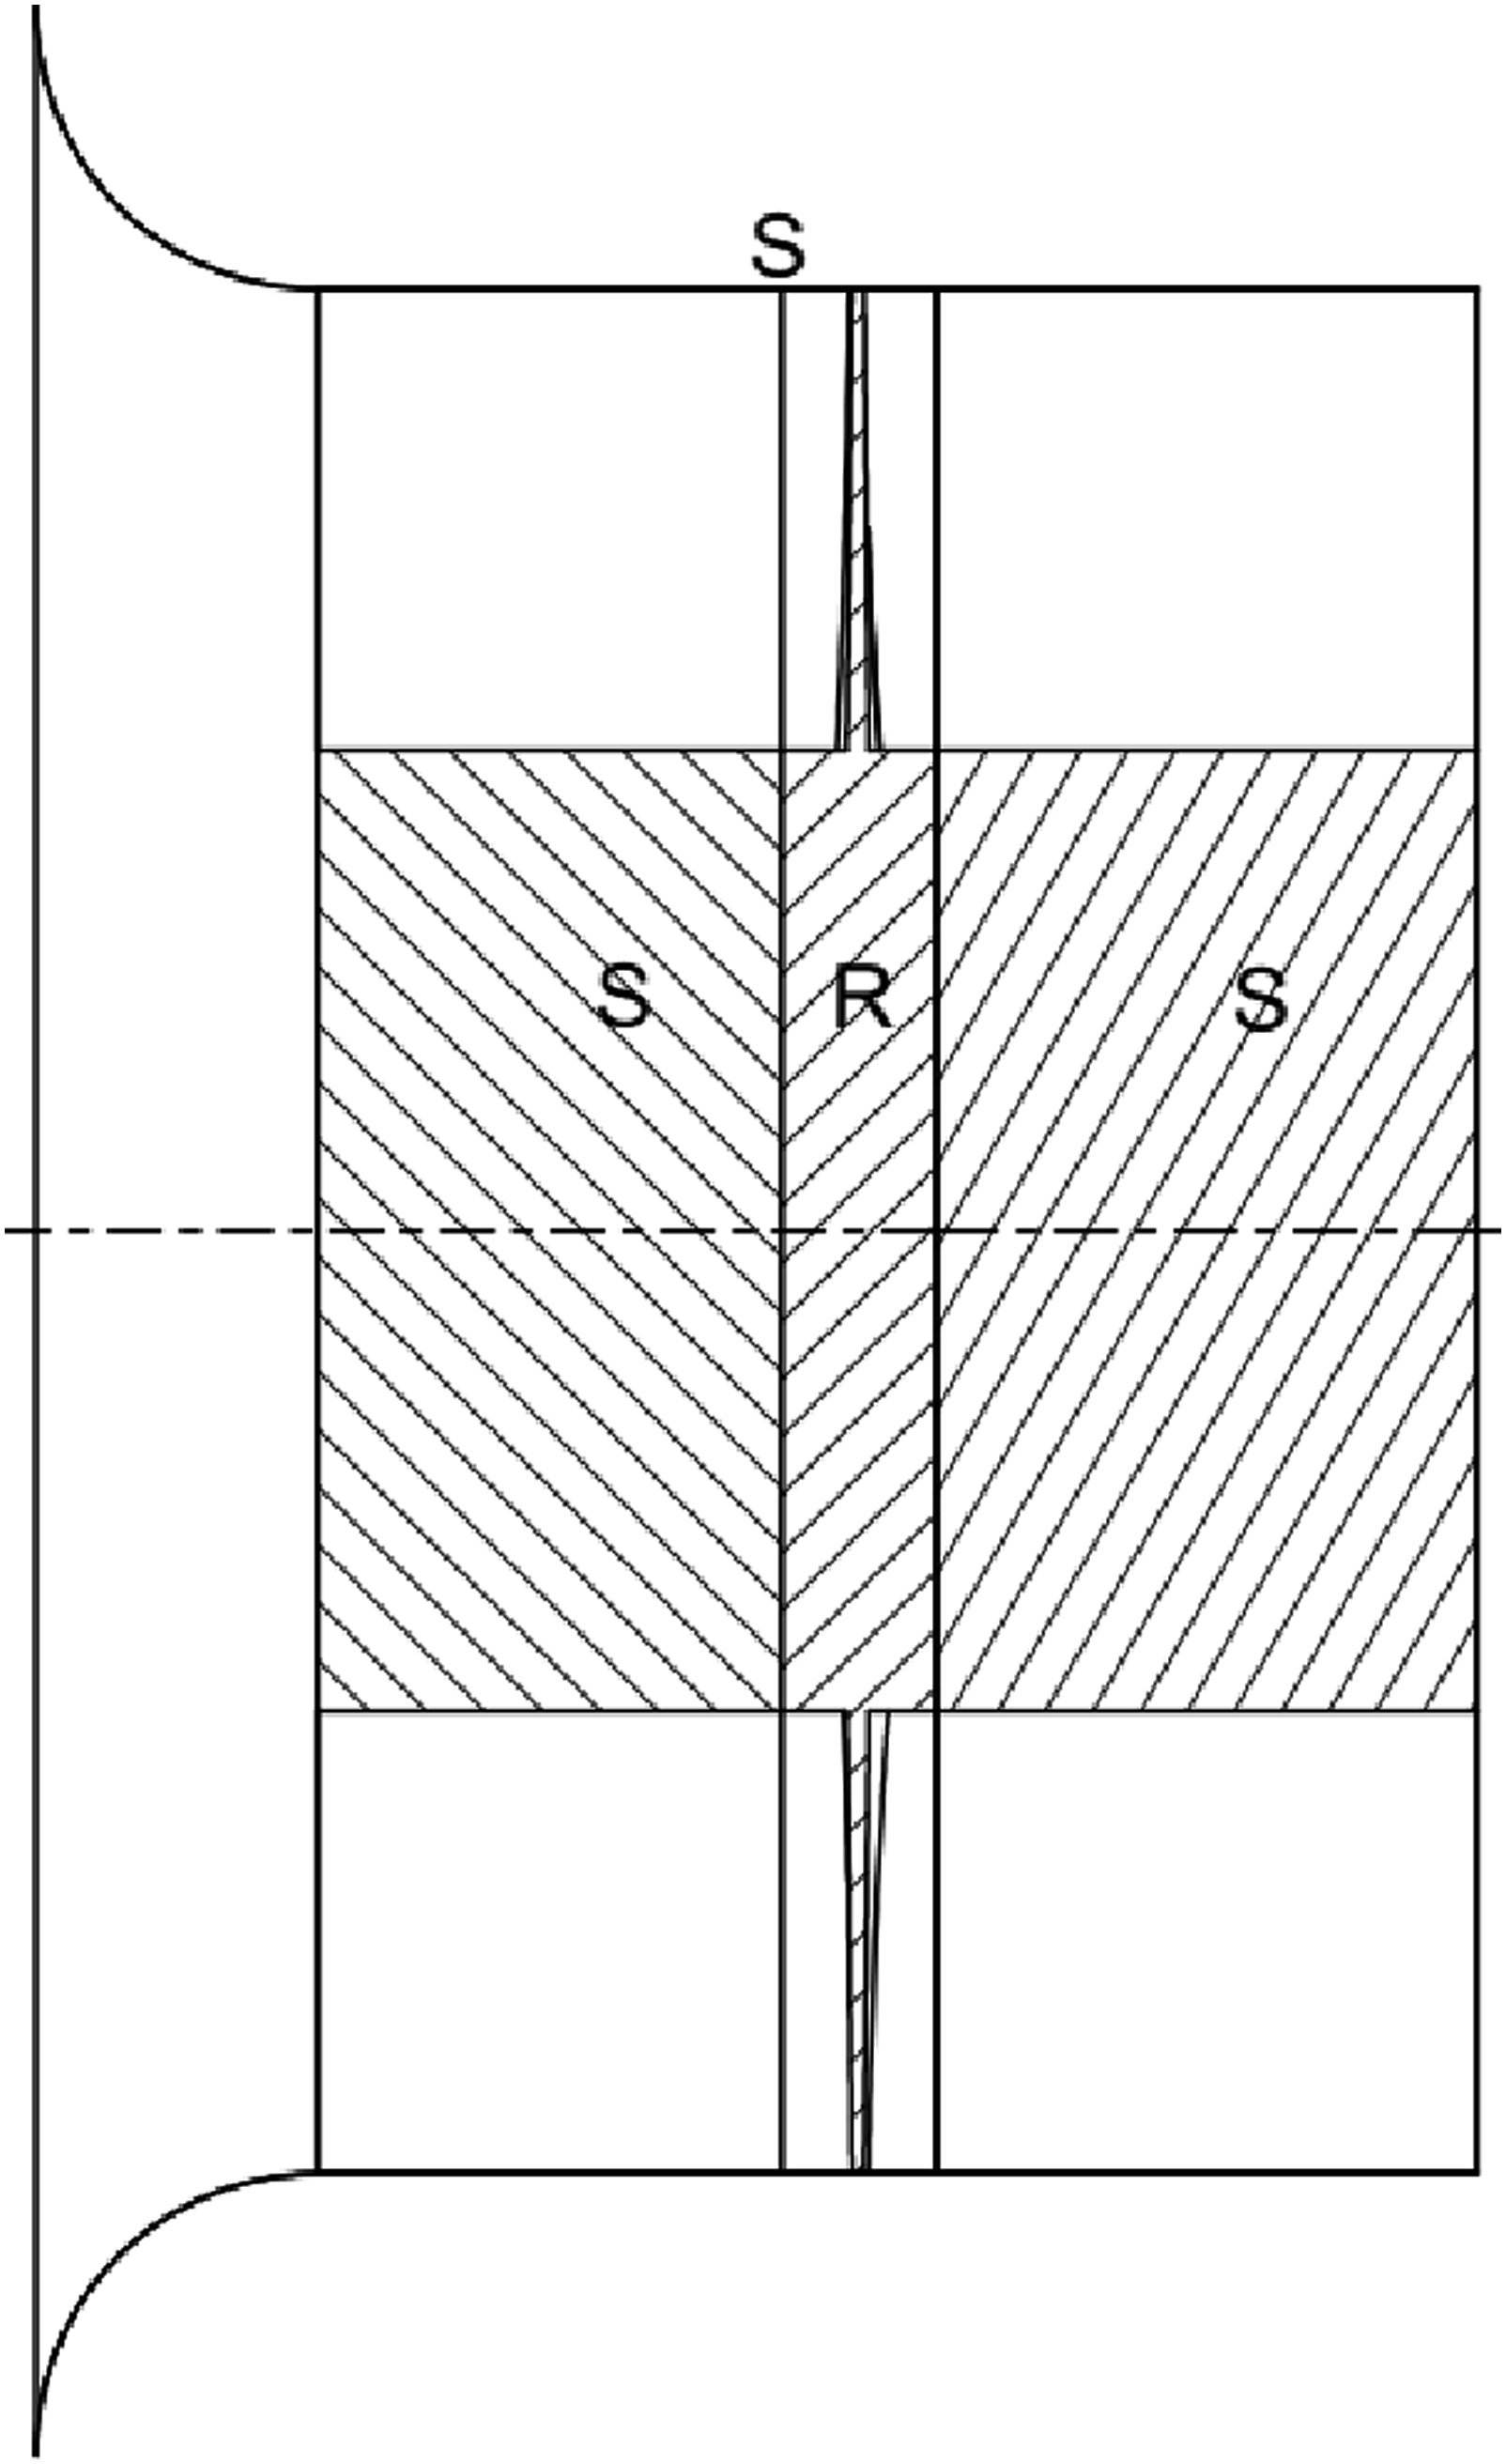
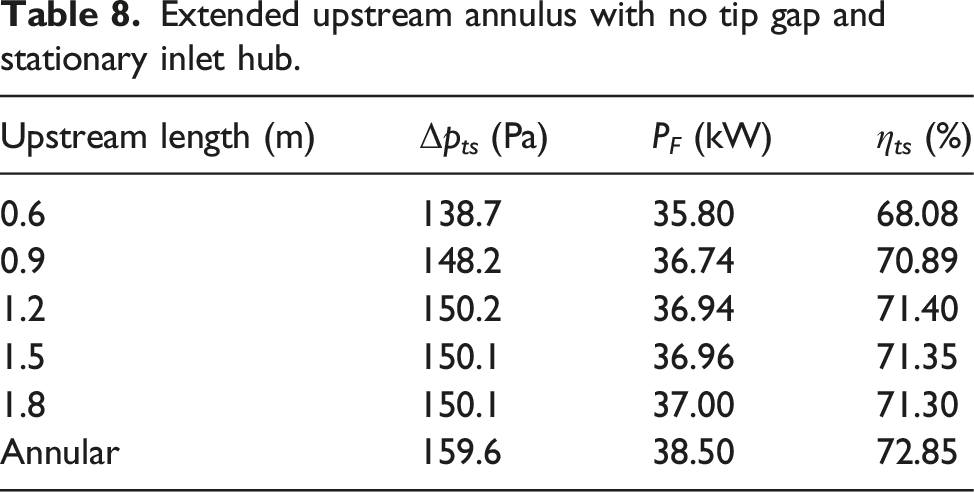
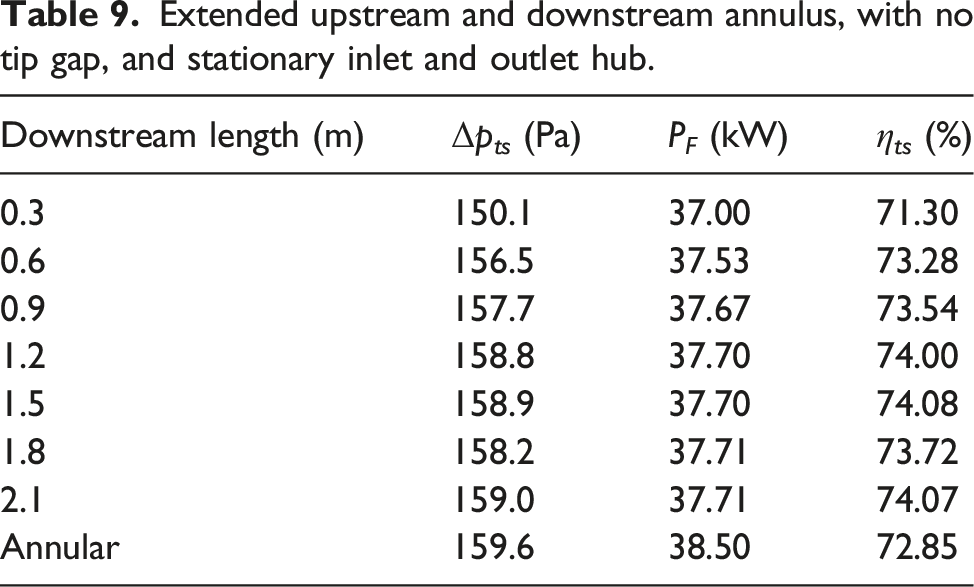
Upstream extension only
Extended upstream annulus with no tip gap and stationary inlet hub.
Upstream and downstream extension
Extended upstream and downstream annulus, with no tip gap, and stationary inlet and outlet hub.
Flow field improvement
Figure 17 gives the velocity, angle of attack and pressure rise distributions directly upstream and downstream of the blade. It is clear that the upstream tangential and radial flow is reduced significantly, resulting in an improved angle of attack and pressure rise distribution. Radial distribution of velocity components directly upstream and downstream of fan blade, and the resulting angle of attack and pressure rise distributions, for the Type A extended annulus configuration with no tip gap present.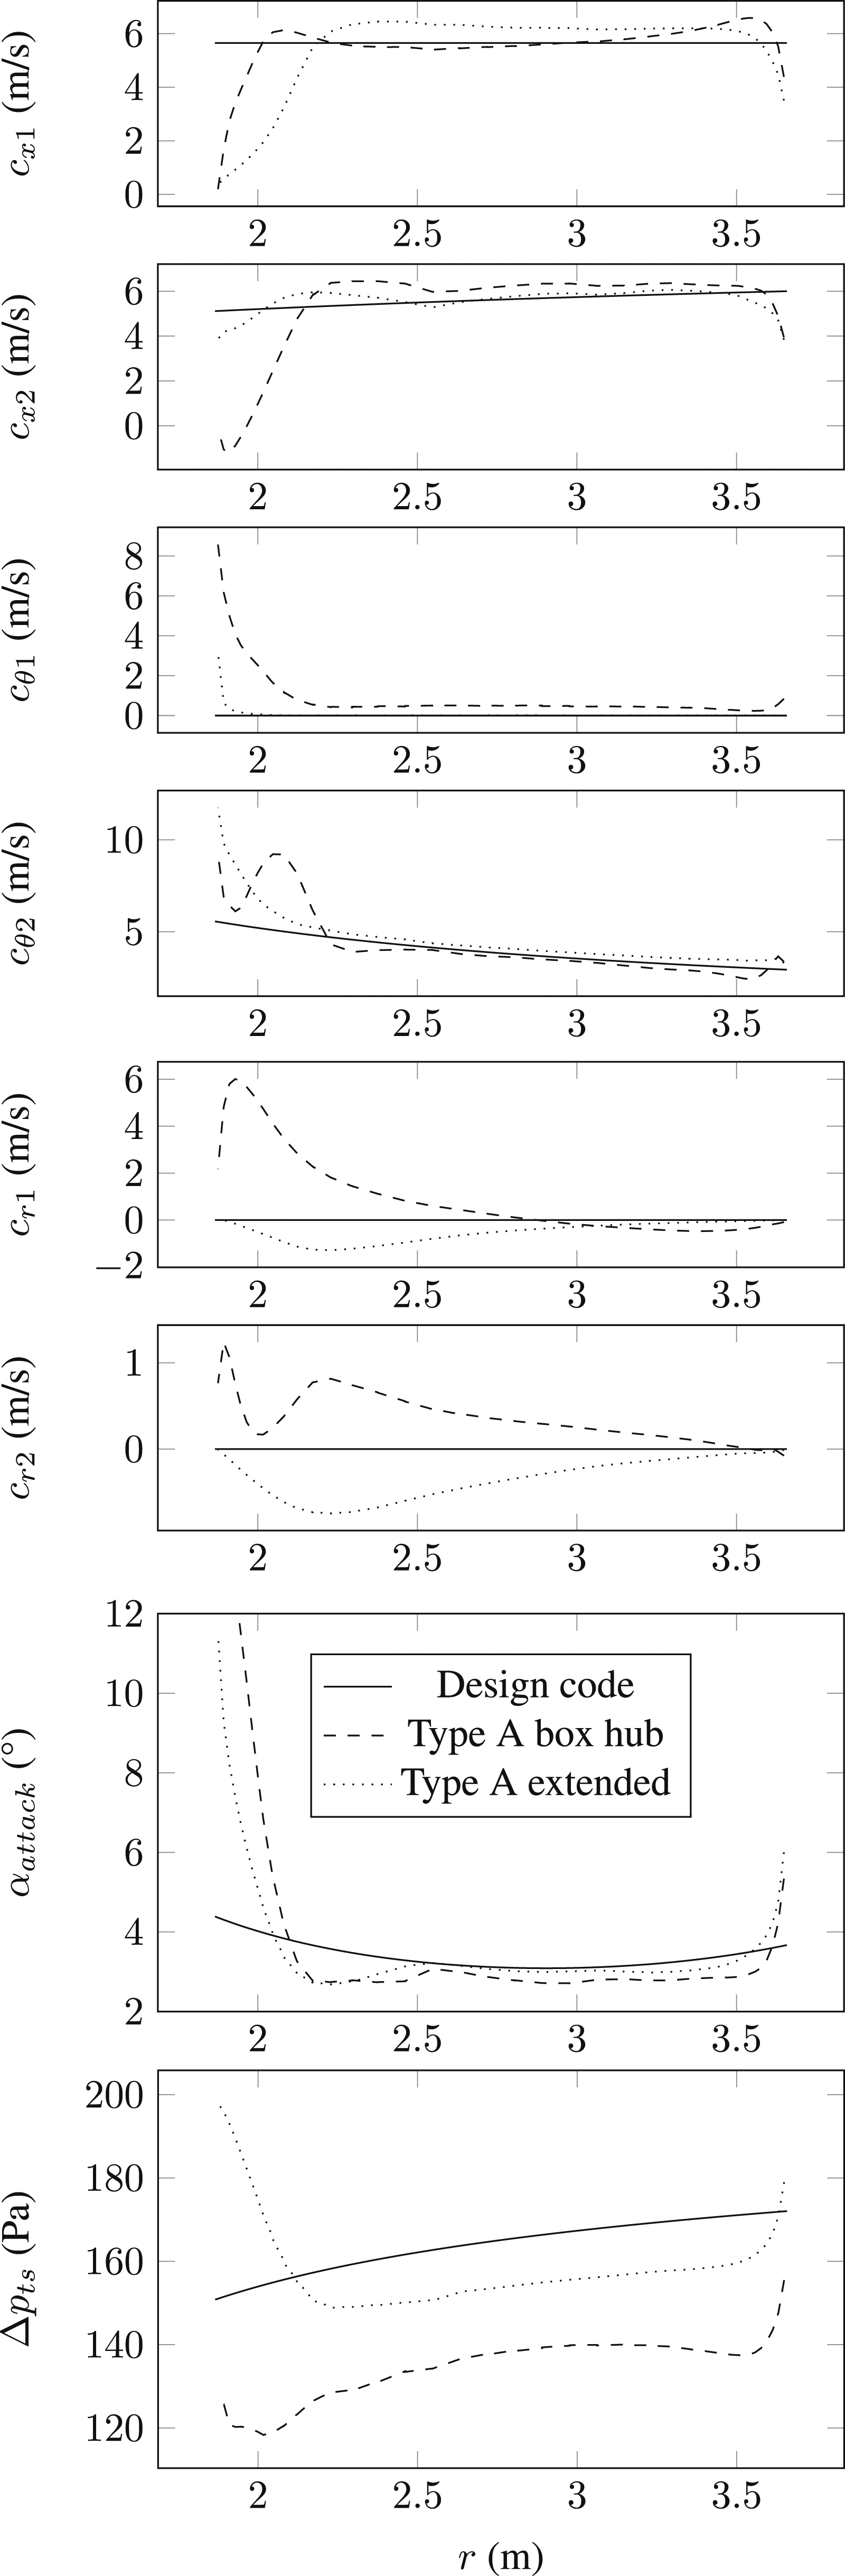
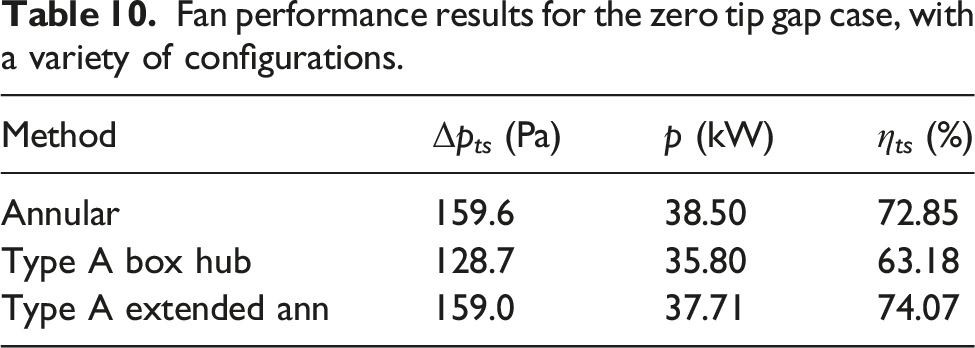
Effect of tip gap size
Fan performance results for the zero tip gap case, with a variety of configurations.
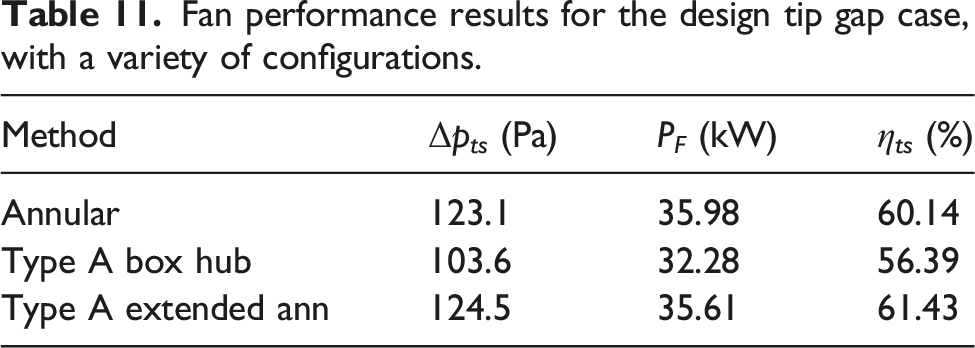
Fan performance results for the design tip gap case, with a variety of configurations.
Conclusion
An axial flow fan has been designed for a specific sCO2 CSP plant. Due to the unusual operating point required, the general-purpose design procedure used produces a fan with an unusually large hub. The fan’s performance was then found to be far below its intended operation, likely due to the design procedure not accounting for this unusual hub configuration. This paper details an investigation into the fan’s performance to identify the causes and potential solutions for this reduced performance, using experimental methods and CFD.
The investigation identifies four factors which affect the observed fan performance. When the CFD model includes each of these factors simultaneously, the results are seen to agree well with the experimental results over a range of flow rates and tip gap sizes, demonstrating the accuracy of the CFD method. Two of these factors are related to the fan configuration, and will therefore affect the operation of the full scale fan. These are the hub and casing configuration, and the tip gap size used. When the fan is simulated in the Type A domain, which considers the hub and casing configuration, the design point fan pressure rise is reduced by 30.9 Pa and the efficiency by 9.7% compared to the annular domain, which represents the ideal case. When the design tip gap size is introduced instead of the no tip gap assumption, the pressure rise is reduced by a further 25.1 Pa and the efficiency by 6.8%.
The remaining factors identified by the investigation are related to the modifications made to the fan for manufacturing and experimental testing, and will therefore only affect the experimentally measured fan performance. These are the scaling of the fan geometry to the test scale, and the modifications to the trailing edge of the scaled blade during manufacturing. When the domain is scaled down to the test fan scale, the pressure rise is reduced by a further 2.0 Pa and the efficiency by 4.1%. It is also found that the offset in the experimental pressure rise and power consumption curves is caused by the opening of the trailing edge of the blade during manufacturing, which increases the lift coefficient of the airfoil profile by about 7.7%. These factors should be considered in the future when experimental fan tests are conducted.
Finally, two alternate hub and casing configurations are provided, which are shown to improve the uniformity of the flow entering the fan, and the pressure distribution downstream of the fan. These configurations significantly improve the fan’s performance, since the flow through the fan is closer to that intended by the design procedure. These configurations can be considered for future fan designs which require a similar, large hub, allowing the general purpose fan design procedure to be used even with the unusual operating points found in sCO2 power cycles.
Footnotes
Acknowledgments
The authors would like to acknowledge the Solar Thermal Energy Research Group (STERG) at Stellenbosch University for their support during the completion of this work.
Declaration of conflicting interests
The author(s) declared no potential conflicts of interest with respect to the research, authorship, and/or publication of this article.
Funding
The author(s) received no financial support for the research, authorship, and/or publication of this article.