
Abstract
To reveal the energy loss mechanism of the centrifugal pump, numerical simulation and experimental investigation are conducted to obtain the complex flow field of a single-stage centrifugal pump under various flow conditions. Particular emphasis is focused on the qualitative and quantitative analysis of the distribution and variation characteristics of irreversible loss in the pump model. The results show that the energy loss in the centrifugal pump mainly originates from the entropy generation caused by the turbulent dissipation and wall friction, which are typically generated in the volute and impeller domains. It is worth noticing that the energy loss in the volute is closely associated with non-uniform velocity distribution and the evolution of the shedding vortices from the impeller exit whilst the energy loss in the impeller are greatly affected by unstable flow phenomena such as flow separation, backflow, and jet-wake pattern. At the overload operating conditions, the wall entropy generation possesses a substantial influence on energy loss, which is mainly related to the wall shear stress. Meanwhile, the influence of the rotor-stator interaction and inflow impacting on the energy loss is enhanced with increasing flows. Finally, the omega method captured the vorticity structures near the tongue at partial flow conditions, thereby, revealing the relationship between the high magnitude of flow loss and the evolution of different scales of strong vorticity sheets.
Introduction
As a universal hydraulic machine, centrifugal pumps are widely applied in many industrial sectors, such as agriculture irrigation, chemical production, petroleum exploitation, water supply, etc. 1 During the operation of the centrifugal pump, the impeller converts mechanical energy to kinetic energy and static pressure energy of the pumping fluid, thereby elevating the head of the fluid. However, the internal flow in centrifugal pumps is characterized by an extremely complex three-dimensional unsteady pattern considering the intense rotation and curvature effect of the impeller, especially at off-design conditions. Unstable flow structures such as flow separation, secondary flow, and vortex shedding often occur,2,3 meanwhile, the vibration and noise effect caused by these phenomena significantly affect the stable operation of the pump units, and in extreme cases, they consume extra electrical energy. Hence, investigating the unsteady flow structure and energy loss mechanisms of the centrifugal pump is vital to enhance the efficiency and stability of the pump units.
Recent advancements in Computational Fluid Dynamics (CFD) have enabled many scholars to carry out in-depth research on the unsteady internal flow mechanisms, particularly flow separation and vortex generation in centrifugal pumps. Zhang et al. 4 explored the internal flow pattern of a low specific speed centrifugal pump by using the large eddy simulation (LES) method. In his studies, stress was laid on the connection between the evolution of vortical structure and pressure pulsation. The results showed that the pressure amplitude is positively correlated with the corresponding vorticity magnitude. Wu et al. 5 experimented to analyze the relationship between flow instabilities and pressure pulsations. The findings showed that unstable separation vortices generated in the impeller flow passages at a small flow rate could lead to higher intensive broadband pressure pulsations. Based on the vortex identification method, Wang et al. 6 obtained the transient vortex structure inside the centrifugal pump at the design point. They observed that the shedding vortex from the impeller exit would periodically slap the tongue, which induced significant pressure pulsation. By using the DDES approach to capture the unsteady flow field of the centrifugal pump, Zhang et al. 7 revealed a similar conclusion. Furthermore, they also found that the interaction between the wake vortex and the tongue is more obvious at higher flow rates. Kye et al. 8 performed a numerical simulation to investigate the flow characteristics in a volute-type centrifugal pump. The results showed that a high adverse pressure gradient exists near the blade pressure side at the off-design condition, resulting in the formation of strong flow separation. Ye et al. 9 applied the two-dimensional Lagrangian coherent structure (LCS) to reveal the separation flow in impeller passages, and found that the separation flow occurs at the blade suction side and develops from the leading edge to the main passage in the impeller under partial load conditions. Li et al. 10 applied the PIV technique to examine the quantitative relationship between the local Euler head distribution and the internal flow in a centrifugal impeller. They found that the local Euler head at the inlet and outlet of the impeller was strongly affected by the vortex structures. In addition, a novel method was put forward to predict the flow patterns in the flow passages.
To have a better insight into the energy transfer mechanism in fluid machinery, the entropy generation method based on CFD has attracted the particular attention of many researchers. Compared to the traditional method of pressure drop, the entropy generation method could provide a prediction exactness of the location of energy loss.11,12,13,14 Li et al. 15 focused on the velocity and entropy generation distribution in a single-stage centrifugal pump to investigate the flow instability features of head-flow curves. The findings revealed that a counter-rotating vortex was developed near the blade trailing edge under partial load conditions, leading to a drastic increase in the entropy generation rate (EGR) on the pressure surface and in the flow passages. Zhao et al. 16 combined the entropy generation theory and pressure fluctuation spectra to analyze the energy dissipation inside a three-bladed impeller. They found that the strength of entropy generation near the trailing edge of the suction side increases with the increase of discharge, whilst the high entropy region exhibits an apparent tendency of periodic variation. Li et al. 17 numerically investigated the relationship between vapor distribution and entropy generation fields. They found that the EGR swiftly increases after the cavitation has fully developed, and the tendency of total EGR within the impeller coincides with the pump head-drop curve. Yang et al. 18 conducted in-depth research on the clocking effect between the inducer and the impeller of a high-speed centrifugal pump. The results revealed that the clocking effect on the pump performance mainly originates from the turbulent dissipation in the impeller and diffuser. Feng et al. 19 applied entropy generation theory to explore the energy loss of a centrifugal pump during an accidental power outage. The findings indicated that the energy loss is closely related to unsteady flow phenomena such as flow separation, reflux, and the vortical flow inside the flow field. Zhang et al. 20 explored the flow loss in a side channel pump based on the entropy generation method, and pointed out that the high entropy losses in the impeller domain are mainly associated with the irregular velocity fields. The above studies have indicated the applicability of the entropy generation theory to provide a reliable prediction of the energy loss characteristics in various hydraulic machines. Nevertheless, most of the researches mainly focus on the energy loss in the impeller, while the distribution of energy loss in the volute domain, especially near the irregular tongue, is rarely discussed. Furthermore, the influence of unstable structures on energy loss has not been investigated in depth, the qualitative and quantitative relationship between the two is still incomprehensive and needed to be clarified further.
The current study intends to reveal the distribution and variation characteristics of energy loss in a centrifugal pump. The paper is organized as follows: section 2 introduces the entropy generation theory and the relevant measurement method in CFD software. Section 3 describes the research model and numerical method, the experimental setup is also briefly introduced. Section 4 discusses and compares the internal flow characteristics and energy loss under various flow conditions based on entropy generation theory, and section 5 gives the main conclusions of the study.
Entropy generation theory
According to the second law of thermodynamics, mechanical energy loss is always generated during the operation of hydraulic machines, leading to increased entropy. The irreversible energy loss mainly derives from the friction-induced dissipation effect and heat transfer caused by limited temperature difference. In this paper, the entropy generation caused by heat transfer can be negligible considering the greater specific heat capacity of water.
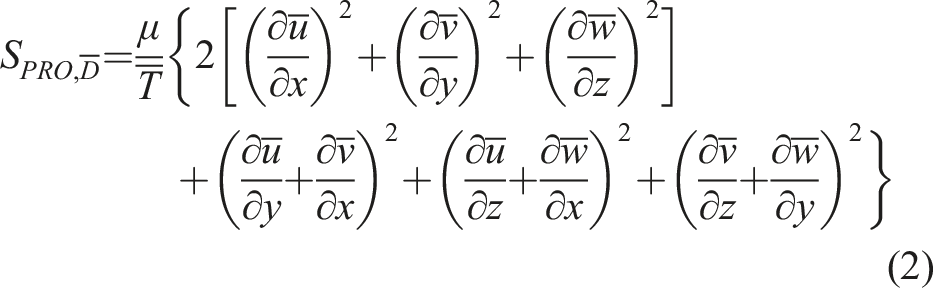
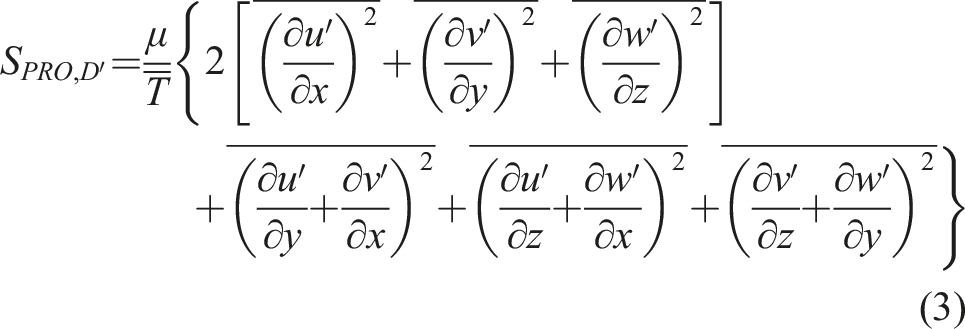
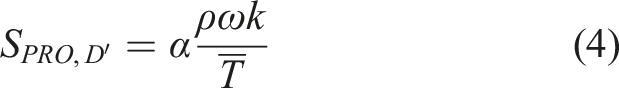
For turbulent flow based on Reynolds Averaged equations, the local viscous dissipative entropy generation rate (LEGR)

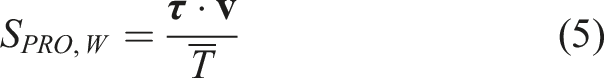
Kock et al.21,22,23 pointed out that a larger velocity gradient occurs near the wall due to the viscous effect of the fluid medium, thus bringing calculation errors when applying the existing entropy formula. Zhang et al.
24
proposed an equation of the entropy generation rate caused by the wall effect as illustrated in equation (5).
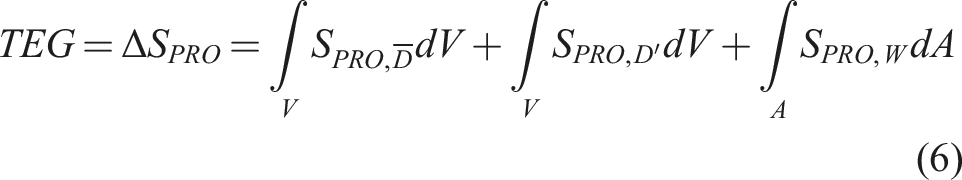
Total entropy generation (TEG) for the entire system is the summation of the integration of the three types of entropy generation rates in the computational domains given by equation (6). The total energy loss
Numerical methods
Pump geometry
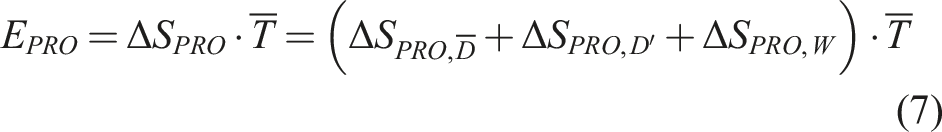
Main geometrical parameters of the model pump.
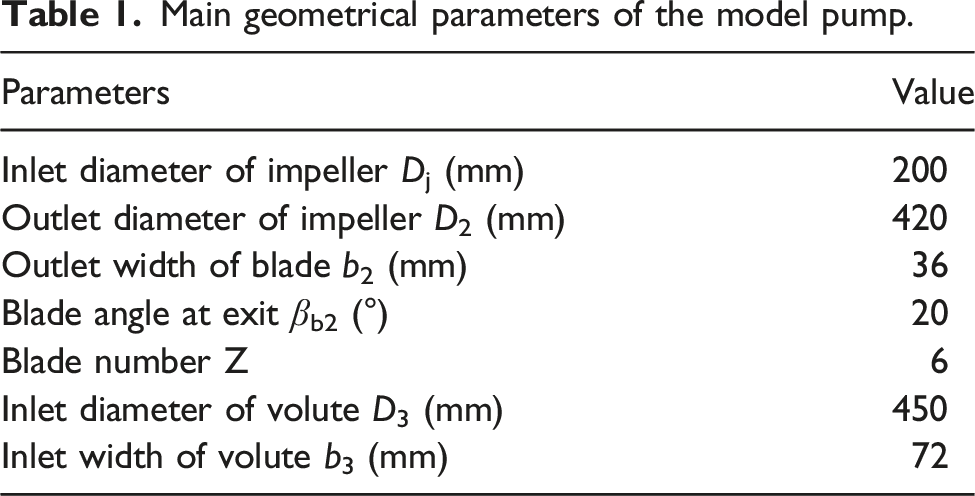
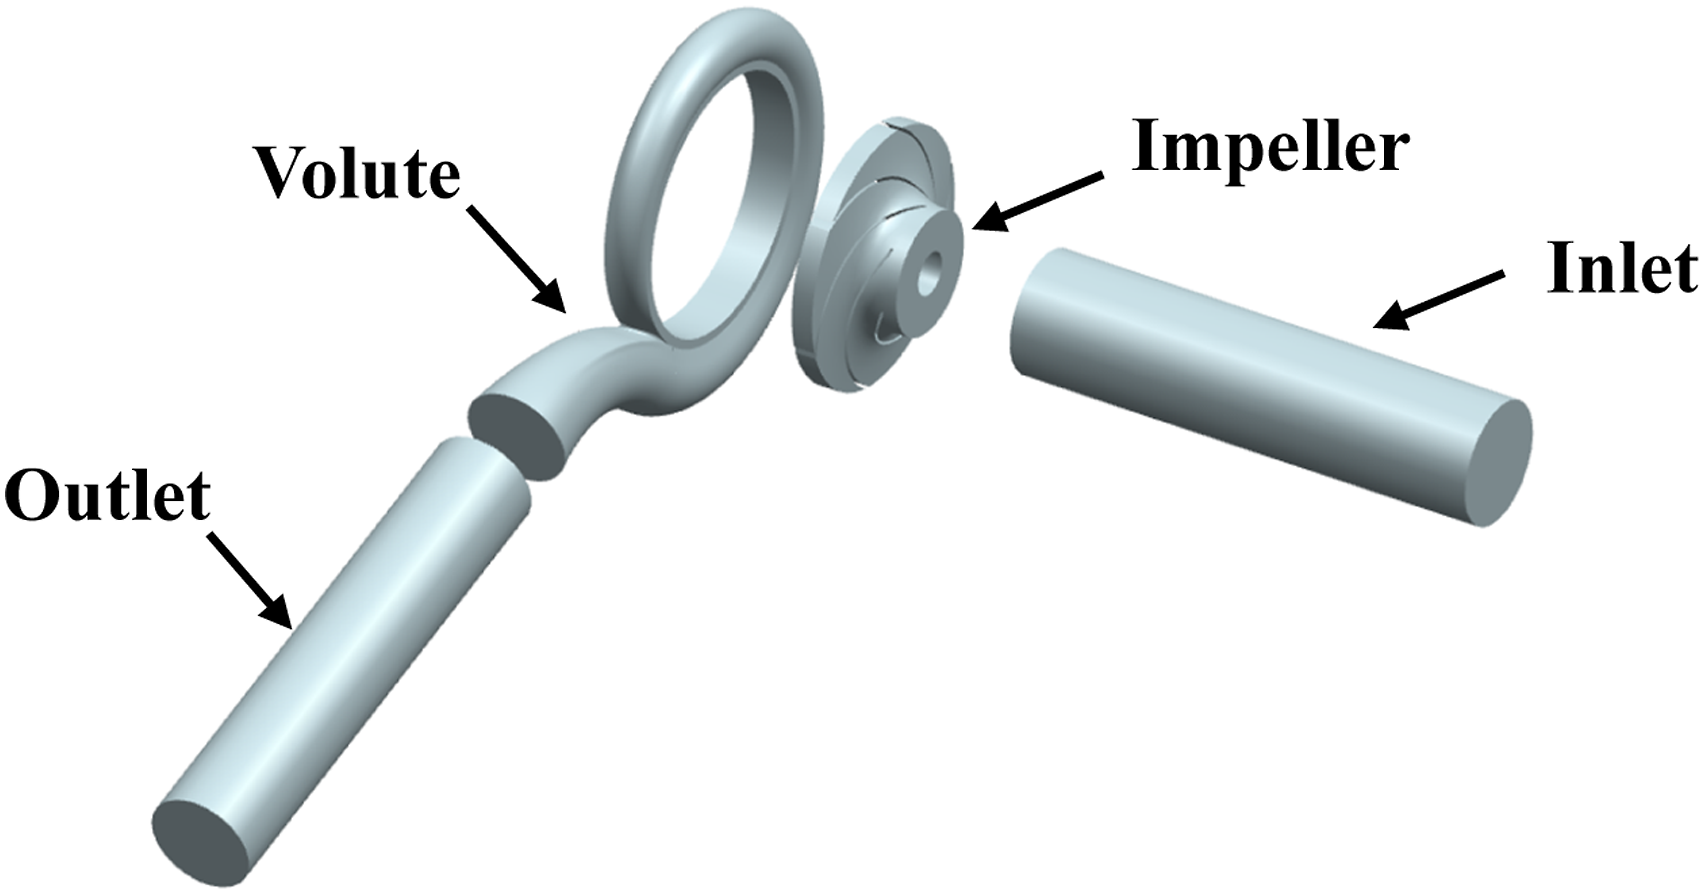
Computational domains of the model pump.
Mesh generation
The mesh quality of the computing domains has a significant impact on the simulation results. To acquire high precision, the structured grids were applied for all the domains using the ICEM CFD software. Considering that the SST k-ω model is highly affected by the mesh quality of the boundary layer, the refined grids were applied near the wall, especially on the blade surfaces with complex flow structures. The height of the first layer grid was about 0.05mm, and the maximum y+ value of the impeller was about 60. The structured grids of the volute and impeller domain are given in Figure 2. Structured grids of the volute and impeller.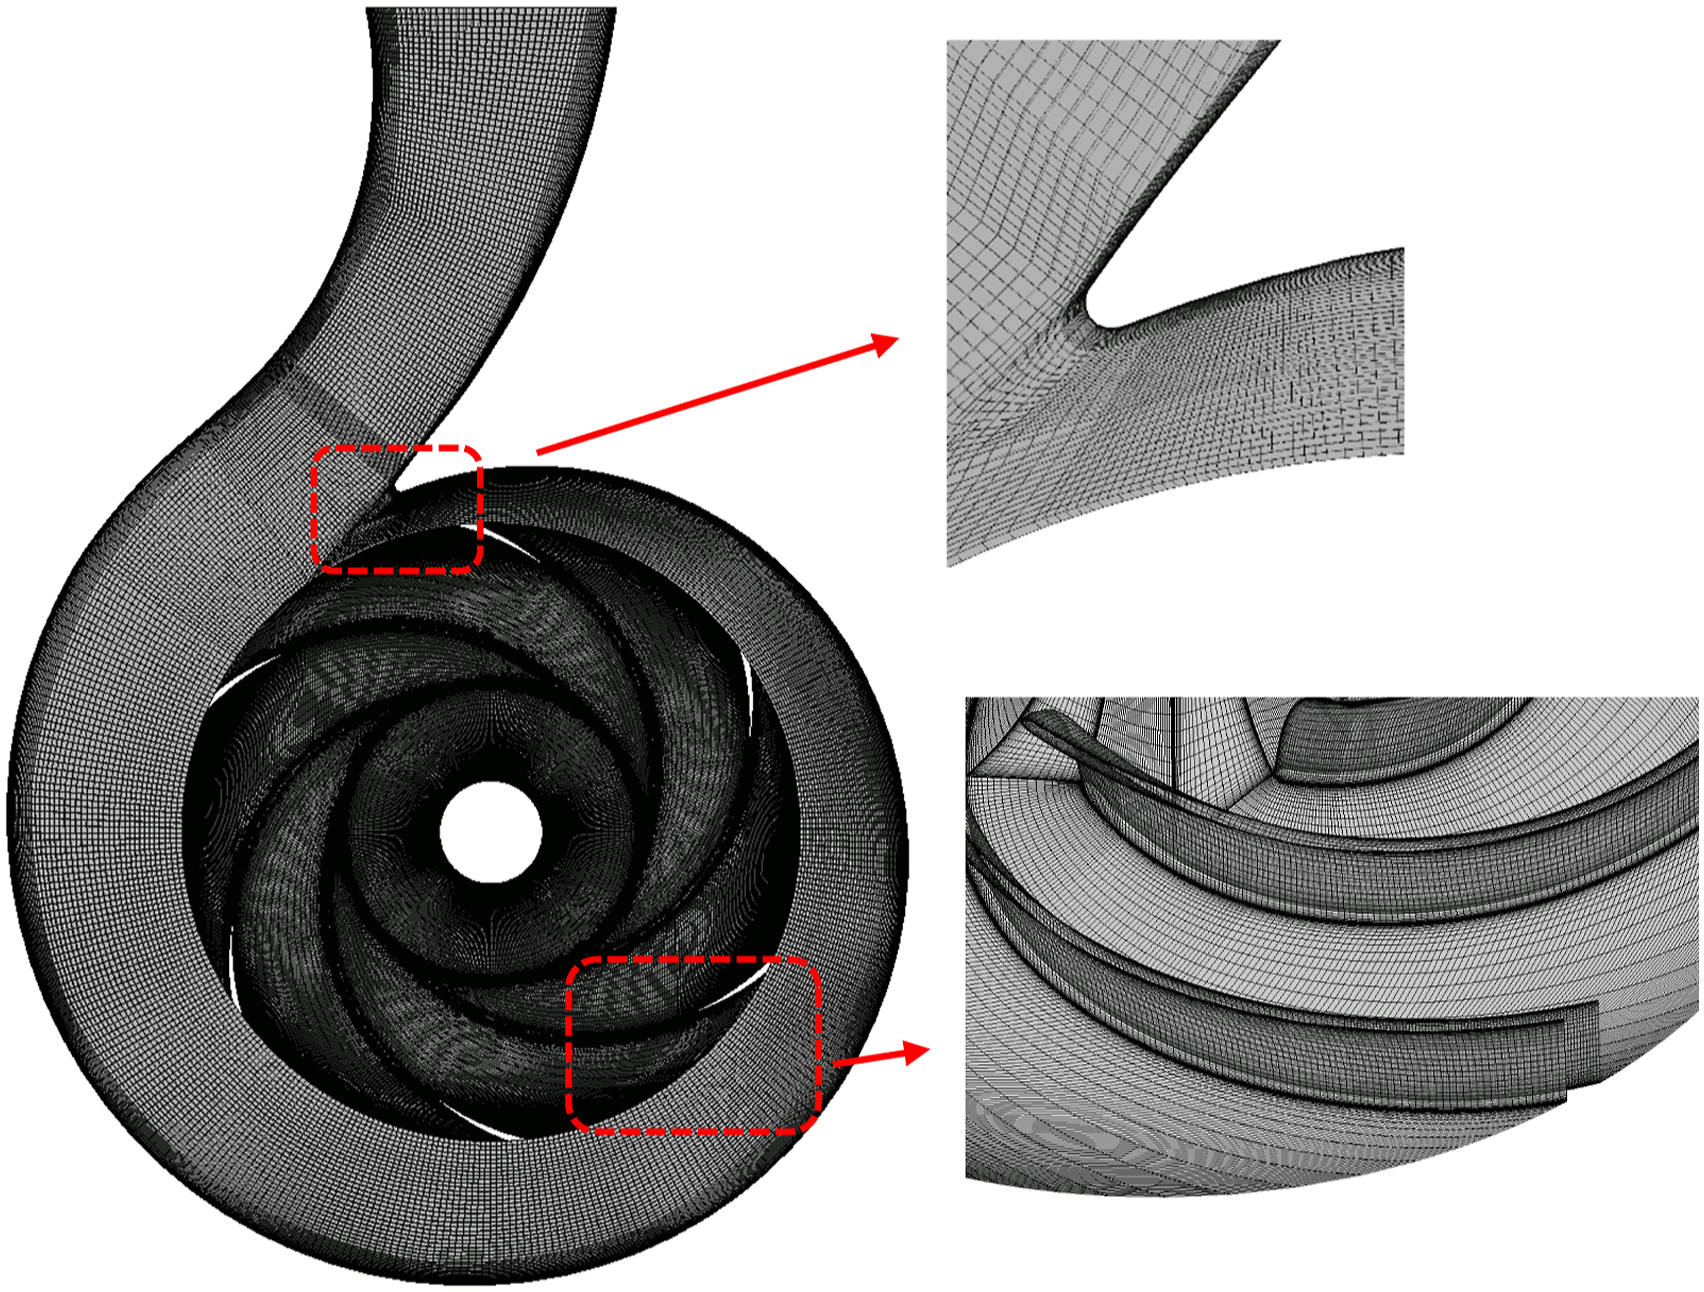
Mesh independent analysis
To avoid the solution error caused by the number of meshes, five different grids were generated at the design point. Figure 3 presents the head-efficiency curves of the pump under different mesh elements by using the same grid topology. It shows that the head and efficiency tend to be stable with the increasing mesh elements. Considering the cost and precision, the mesh number of 5.11×10⁶ was chosen to carry out the following simulation. Verification of mesh independence.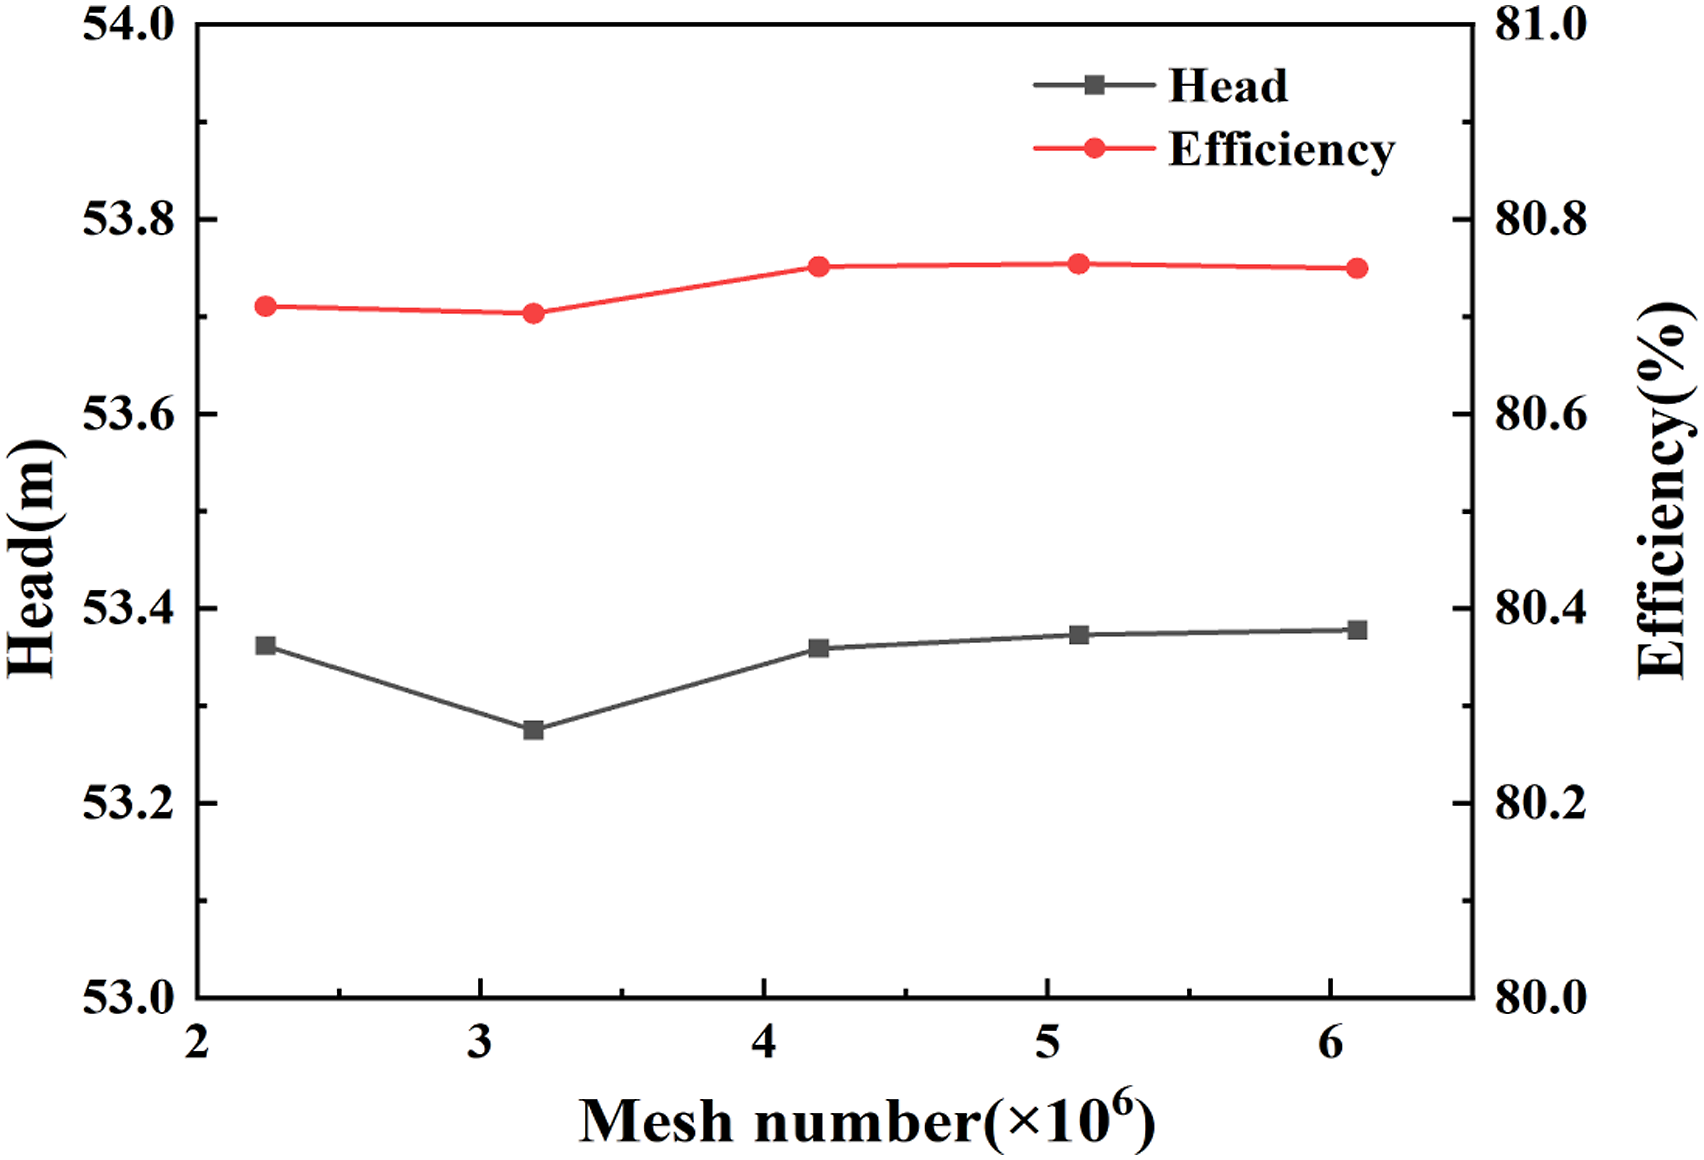
Turbulence models and boundary conditions
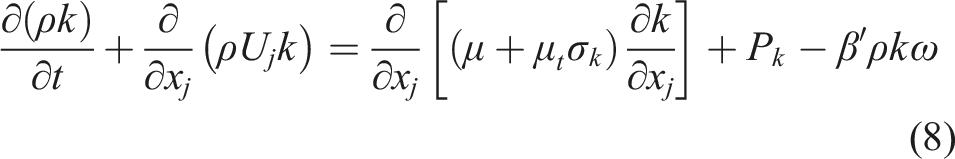
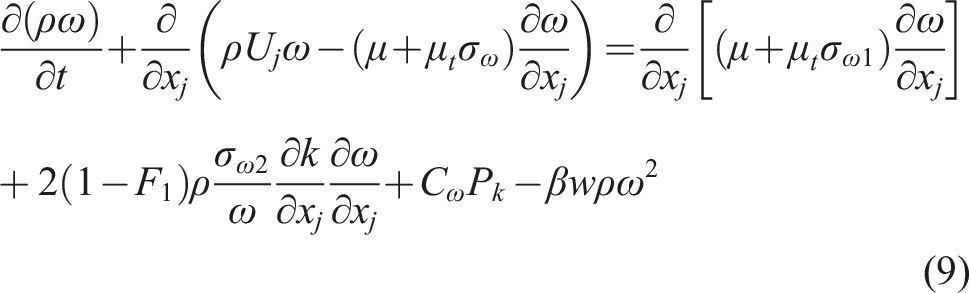
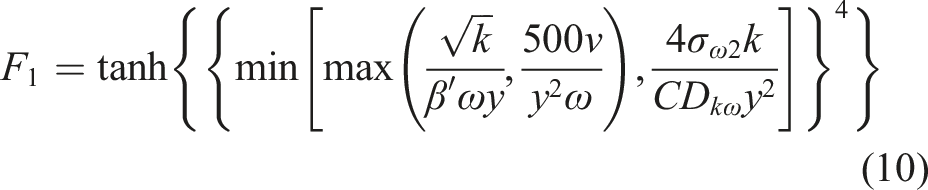
The turbulent flow field inside the centrifugal pump was solved by the CFD software ANSYS CFX. The SST k-ω turbulence model can effectively describe the influence of pressure gradient on turbulence and give a better prediction on flow separation issues under the inverse pressure gradient. Therefore, the standard SST k-ω turbulence model was adopted in the current paper, which are expressed by the following equations:
25
The inlet boundary condition was set as total pressure, the outlet boundary was set as mass-flow rate, and all physical surfaces of the pump were set as no-slip walls. The Frozen-rotor model was adopted in steady simulation, and the Transient rotor-stator model was adopted in unsteady simulation. The steady simulation results were used as the initial result of transient simulation, and the time steps were set to
Experimental setup
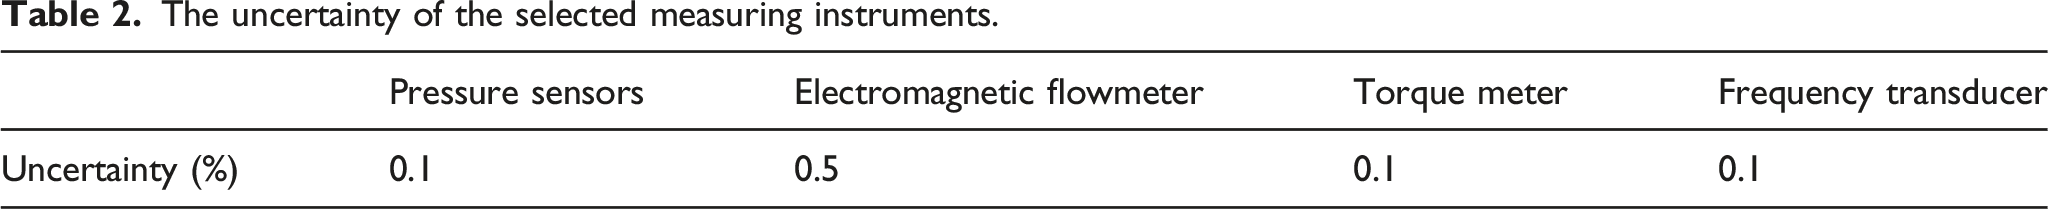
The closed hydraulic test rig was built to obtain the performance parameters of the model pump. As shown in Figure 4, the measuring system includes a water tank to provide a continuous supply of water. The flow rate of the pump was measured by an electromagnetic flowmeter and a butterfly valve was used to adjust the flowrate in the pipes. Two pressure sensors were installed at the inlet and outlet of the pump, which were connected to the data acquisition system for continuous monitoring of the pressures. Meanwhile, a frequency transducer was used to ensure the pump operated at the rotating speed of 1450 rpm. During the operation of the pump, all the data measured by the sensors are converted into digital values by DAQ device. The uncertainty of the selected measurement instruments is shown in Table 2. Diagram of the experimental test rig. The uncertainty of the selected measuring instruments.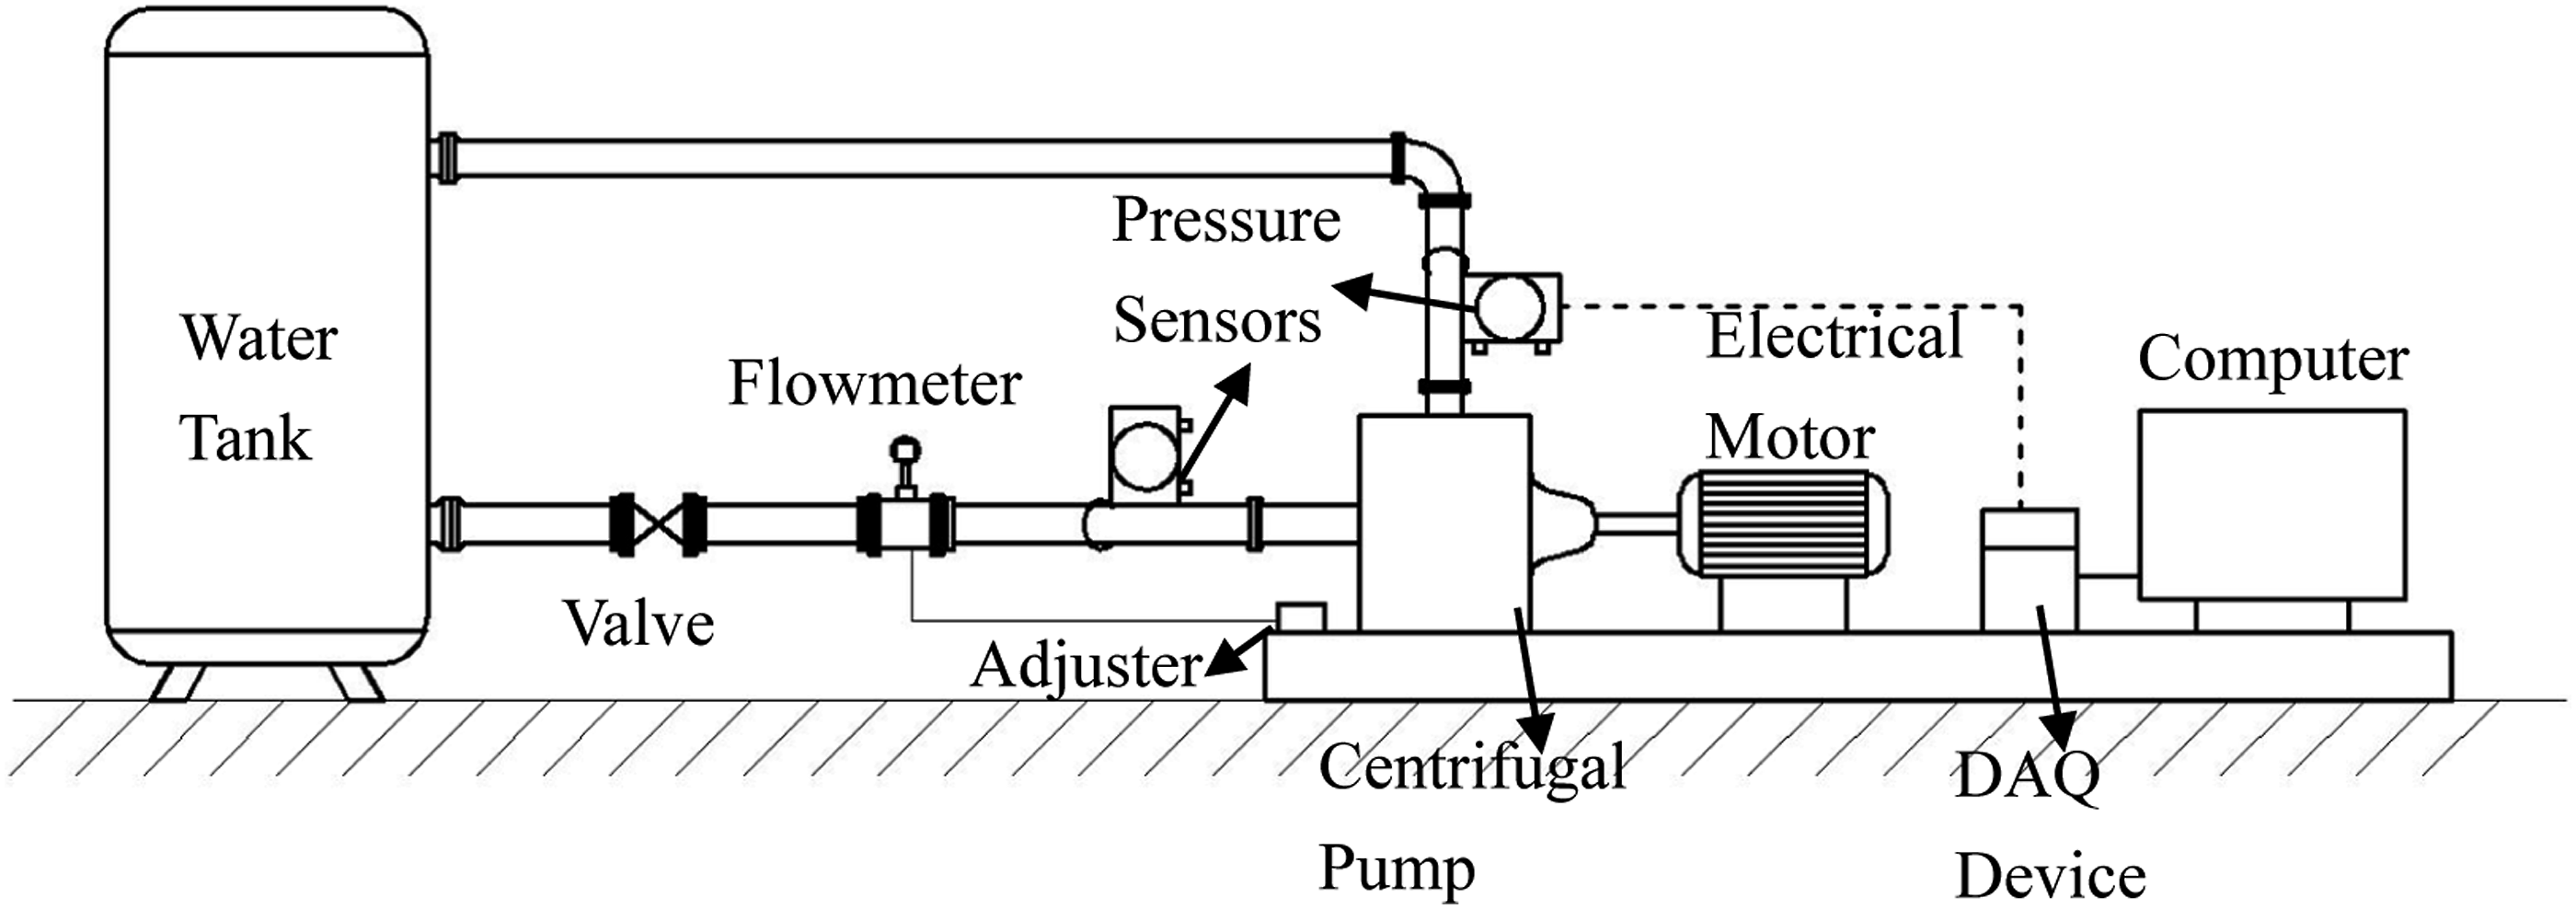
Results and discussions
Performance characteristics curves
To validate the accuracy of the numerical calculation, the hydraulic performance data obtained from simulation and experiment are compared as revealed in Figure 5. It is observed that the numerical head and efficiency are basically in agreement with the experimental values. Below 0.6Qn, the simulated head and efficiency are smaller than the experimental results, which is probably caused by the complicated flow structures under part-load conditions. Meanwhile, the simulated results are higher than the experimental values under design and over-load conditions. The error could be attributed to the neglect of leakage losses and mechanical losses. In total, the global error between the simulation and experiment is lower than 4.28%, demonstrating the accuracy of the calculation. Therefore, further analysis will be conducted based on the simulation. Hydraulic performance curves of the pump.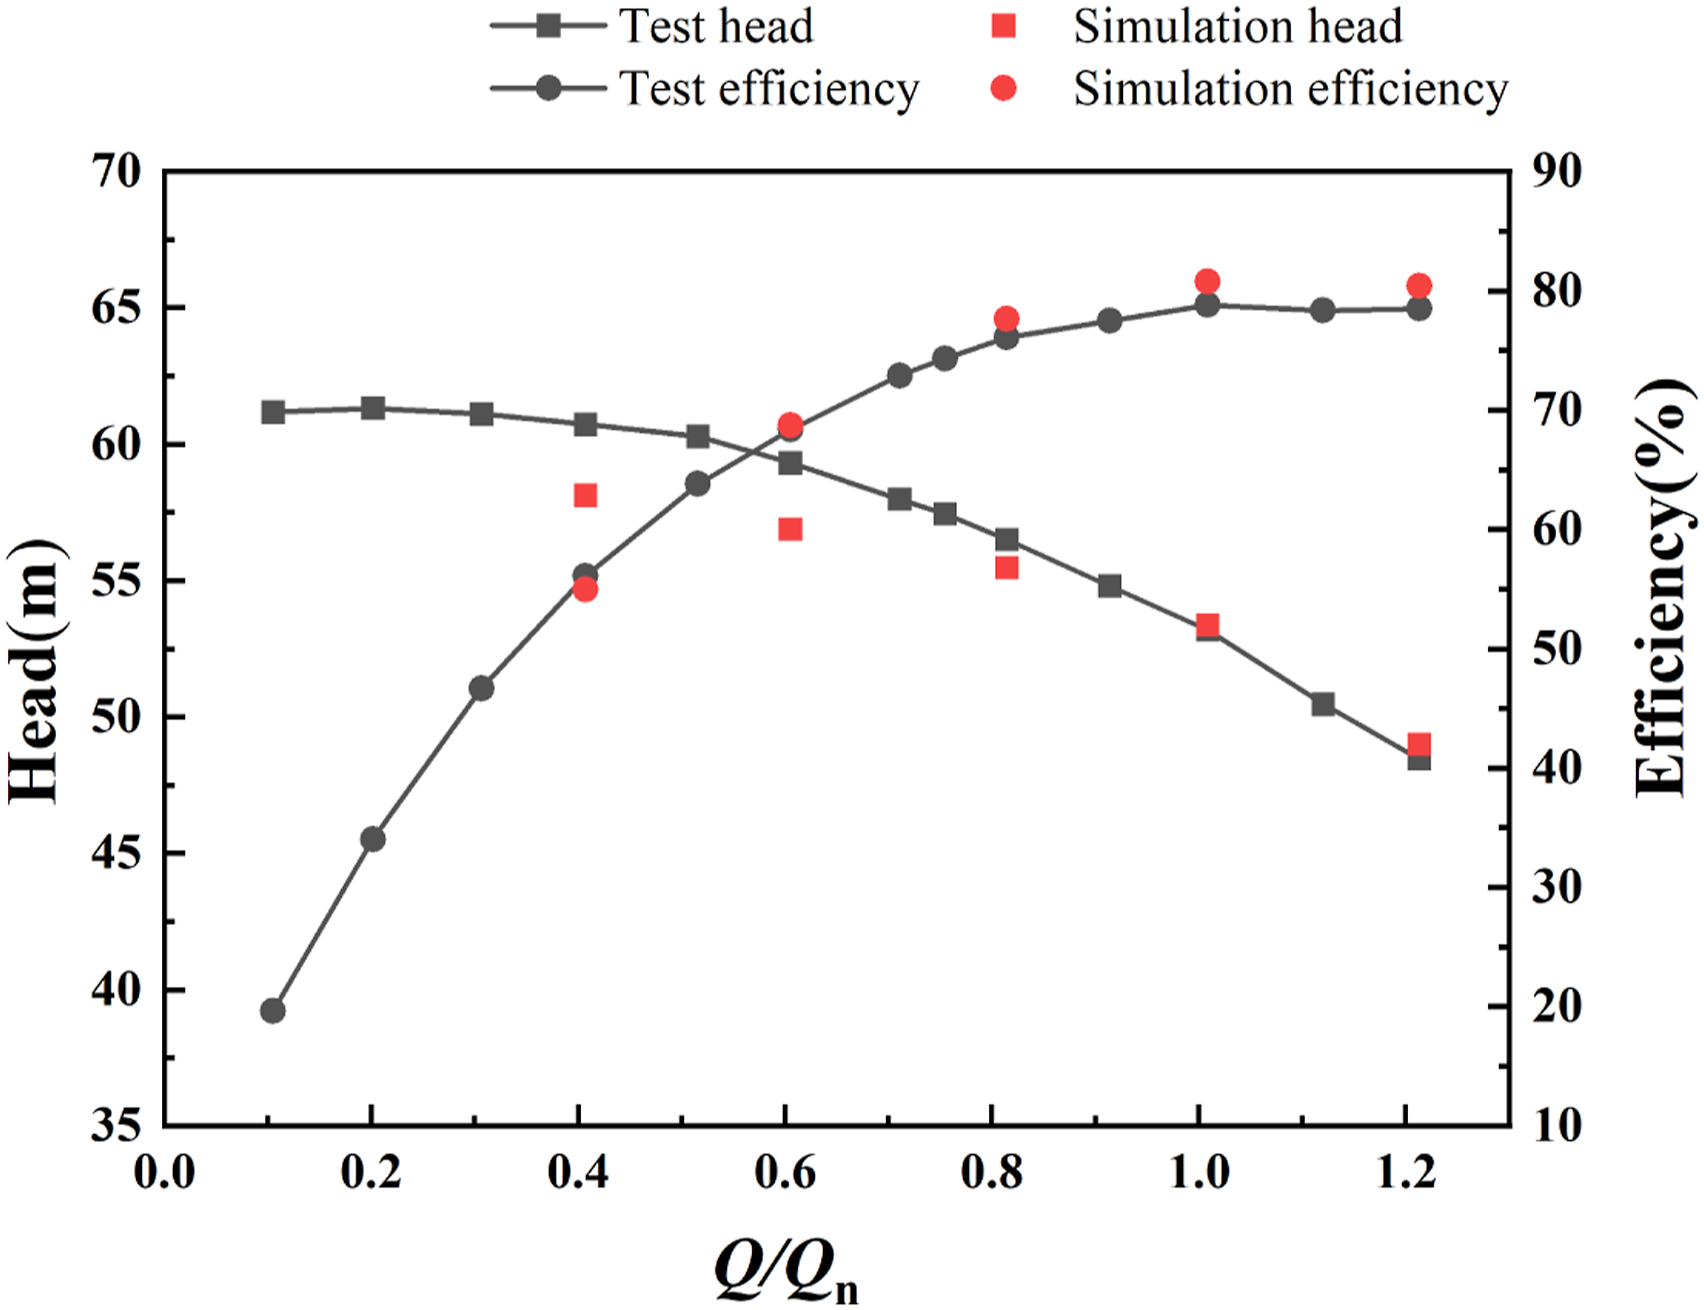
Analysis of energy loss in the centrifugal pump
The change of efficiency during a rotation period is presented in Figure 6. Averagely, the rated flow condition records the highest value of efficiency with the smallest amplitude. As the flow rate deviates from the optimal flow condition, the energy loss of the pump increases whilst the efficiency decreases consequently. At large flow rate, the fluctuation amplitude of efficiency grows evidently, which is mainly induced by the periodic shocking effect of the fluid. When the flow rate drops below 0.8Qn, unstable flow structures manifest within the centrifugal pump accompanied by intense energy loss, leading to a drastic decline in efficiency. Additionally, the efficiency curve exhibits a violent fluctuation pattern, which could be attributed to the evolution of the unstable flow structures. Efficiency fluctuations under a rotation period.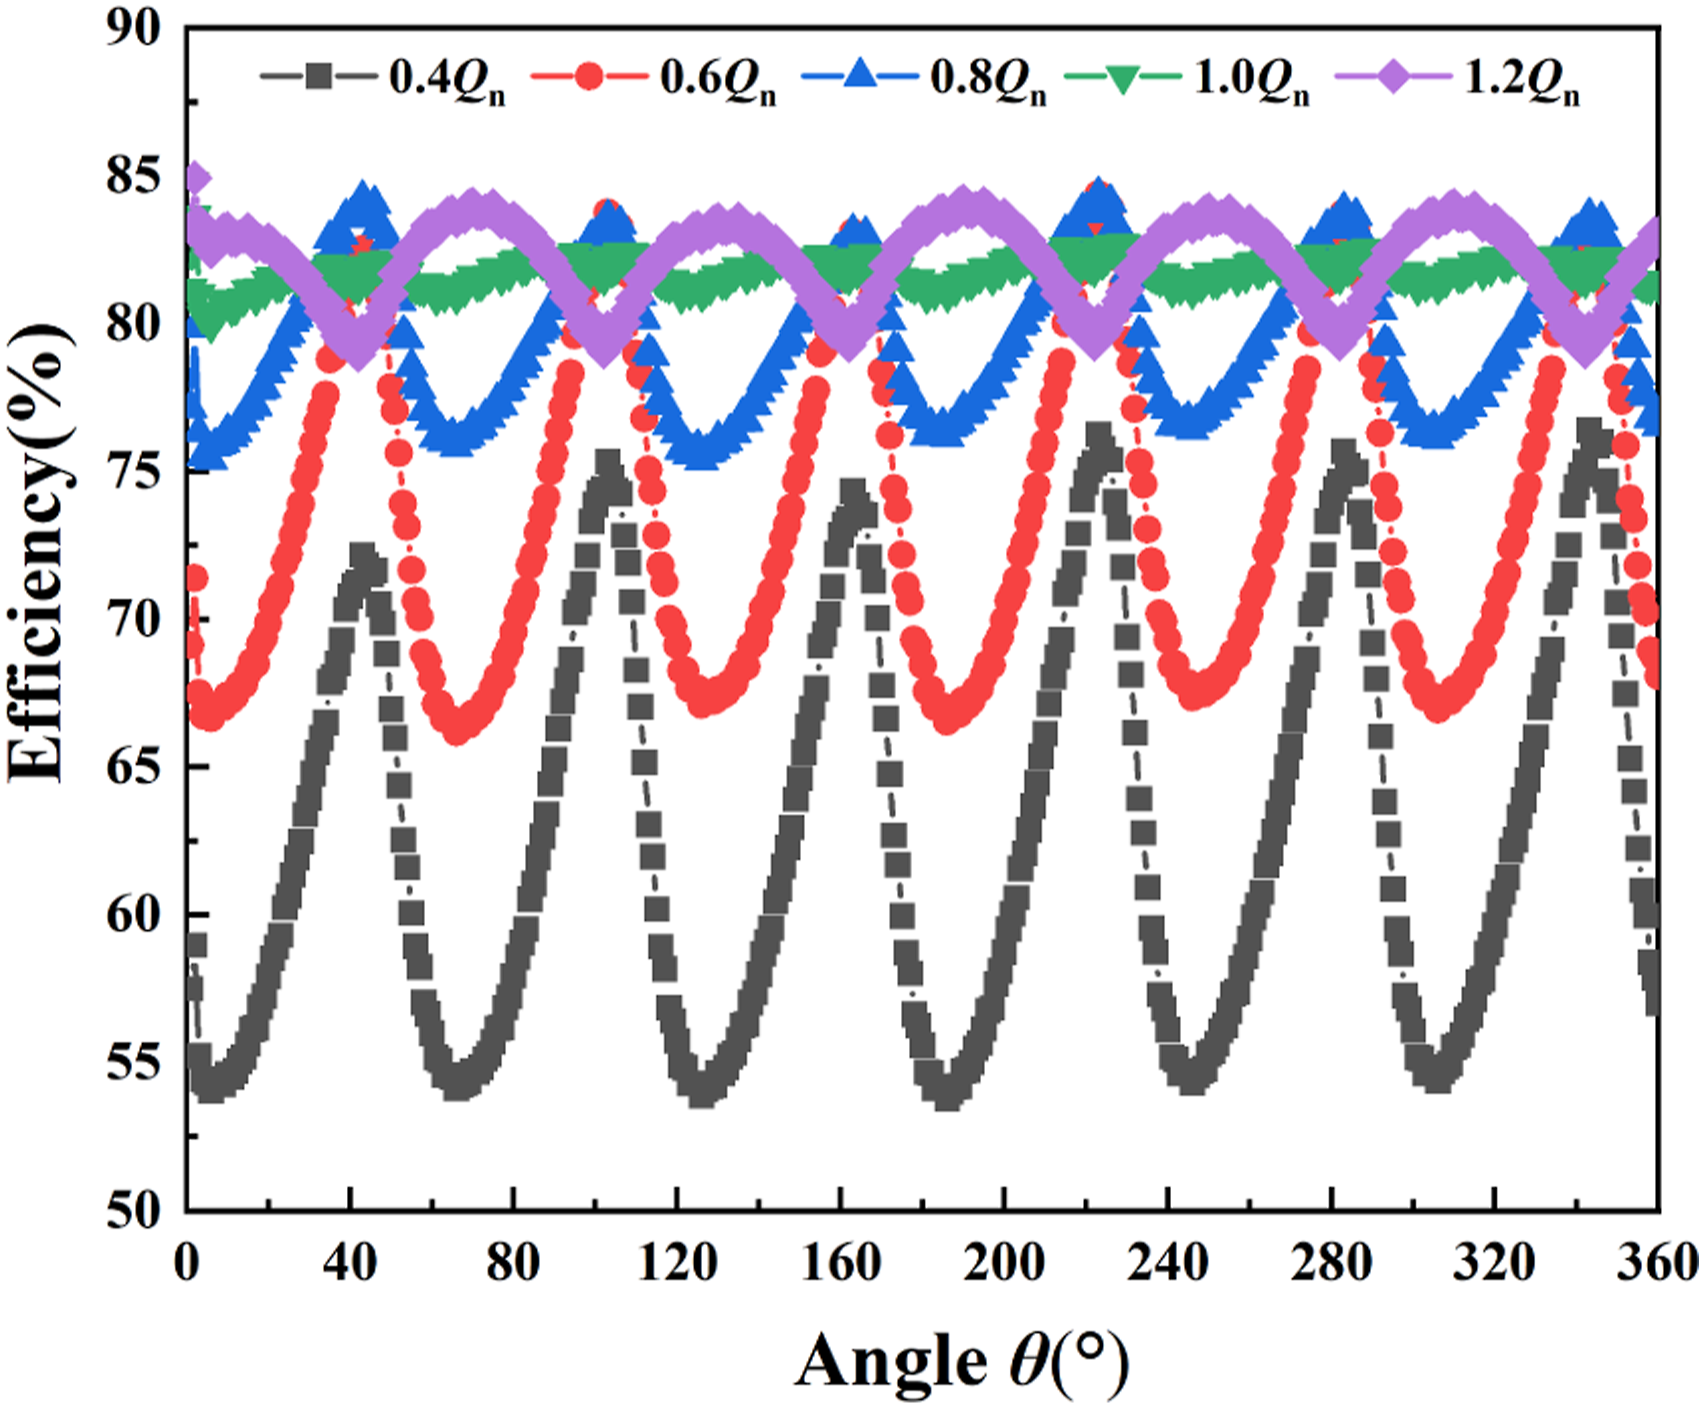
Figure 7 presents the total energy loss of each component under various flow rates. The irreversible loss is mainly generated in the impeller and volute domain, accounting for about 87.5%-95.3% of the total loss altogether. The energy loss in the impeller has no significant variation at all operating conditions, while the loss in the volute changes drastically. At 0.6Qn, the energy loss in the volute is about 3 times that of the impeller, which indicates that the impeller and volute do not match well, thus emanating to a disordered flow pattern. It is worth recognizing that the total energy loss of the pump exhibits a decreasing tendency as the flow rate increases from 0.4Qn to the optimal working condition and attains a minimum value at the design condition. At over-load operating conditions, the total energy loss increases apparently. The changing trend of the total energy loss is corresponding to that of the efficiency fluctuation curve, therefore, it can be concluded that energy loss has a negative correlation with the efficiency of the pump. Energy loss of different components at different flow rates.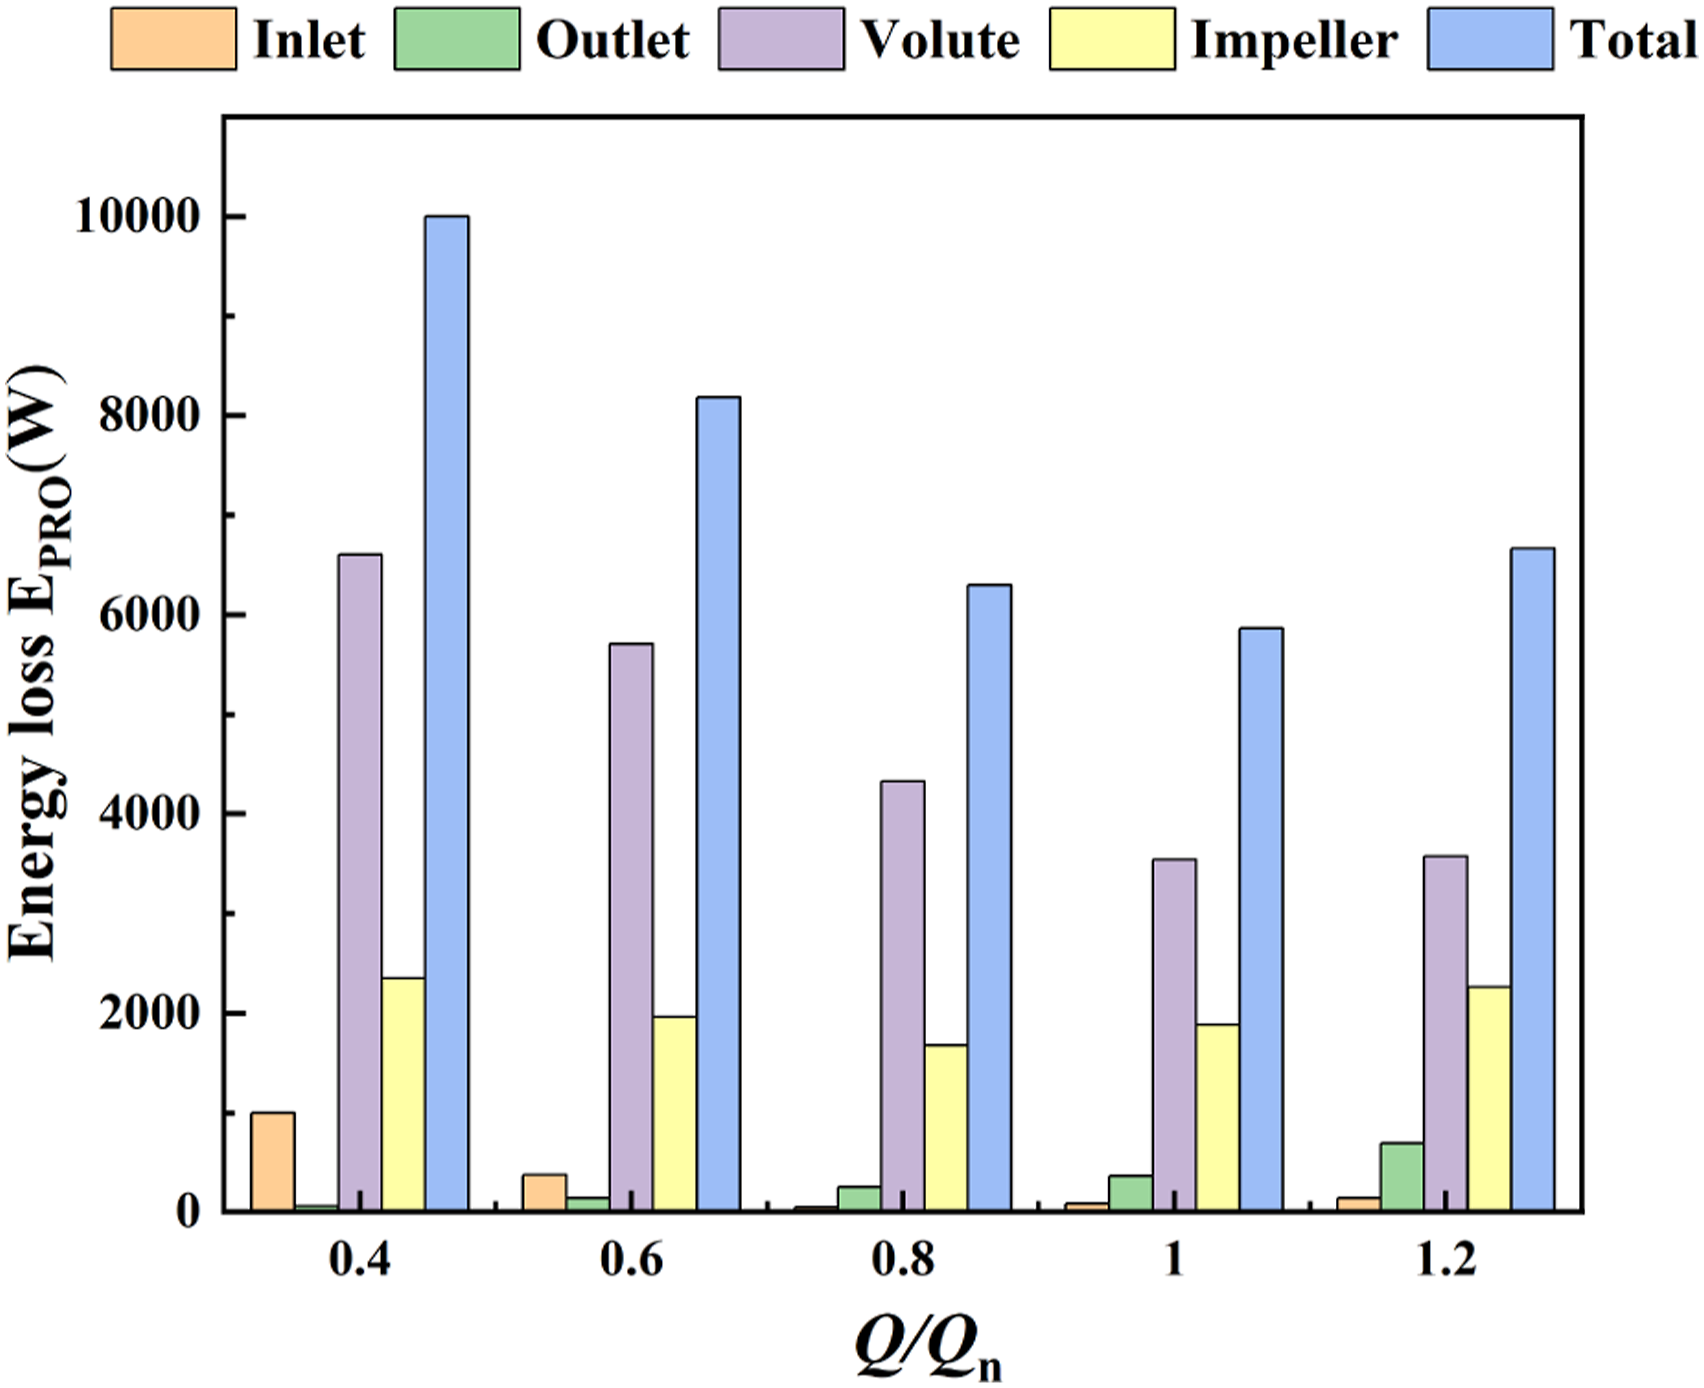
Figure 8 displays the proportion of three types of entropy generation in the pump. It reveals that the entropy generation caused by direct dissipation is quite small with the value ranging from 0.13% to 0.46%. Hence, it will be neglected in the succeeding analysis. Meanwhile, at 0.4Qn, the entropy generation caused by turbulent dissipation has the utmost impact on the energy loss of the pump, which accounts for about 82.48% of the total entropy generation. As illustrated in Figure 8, Proportion of entropy generation at different flow rates.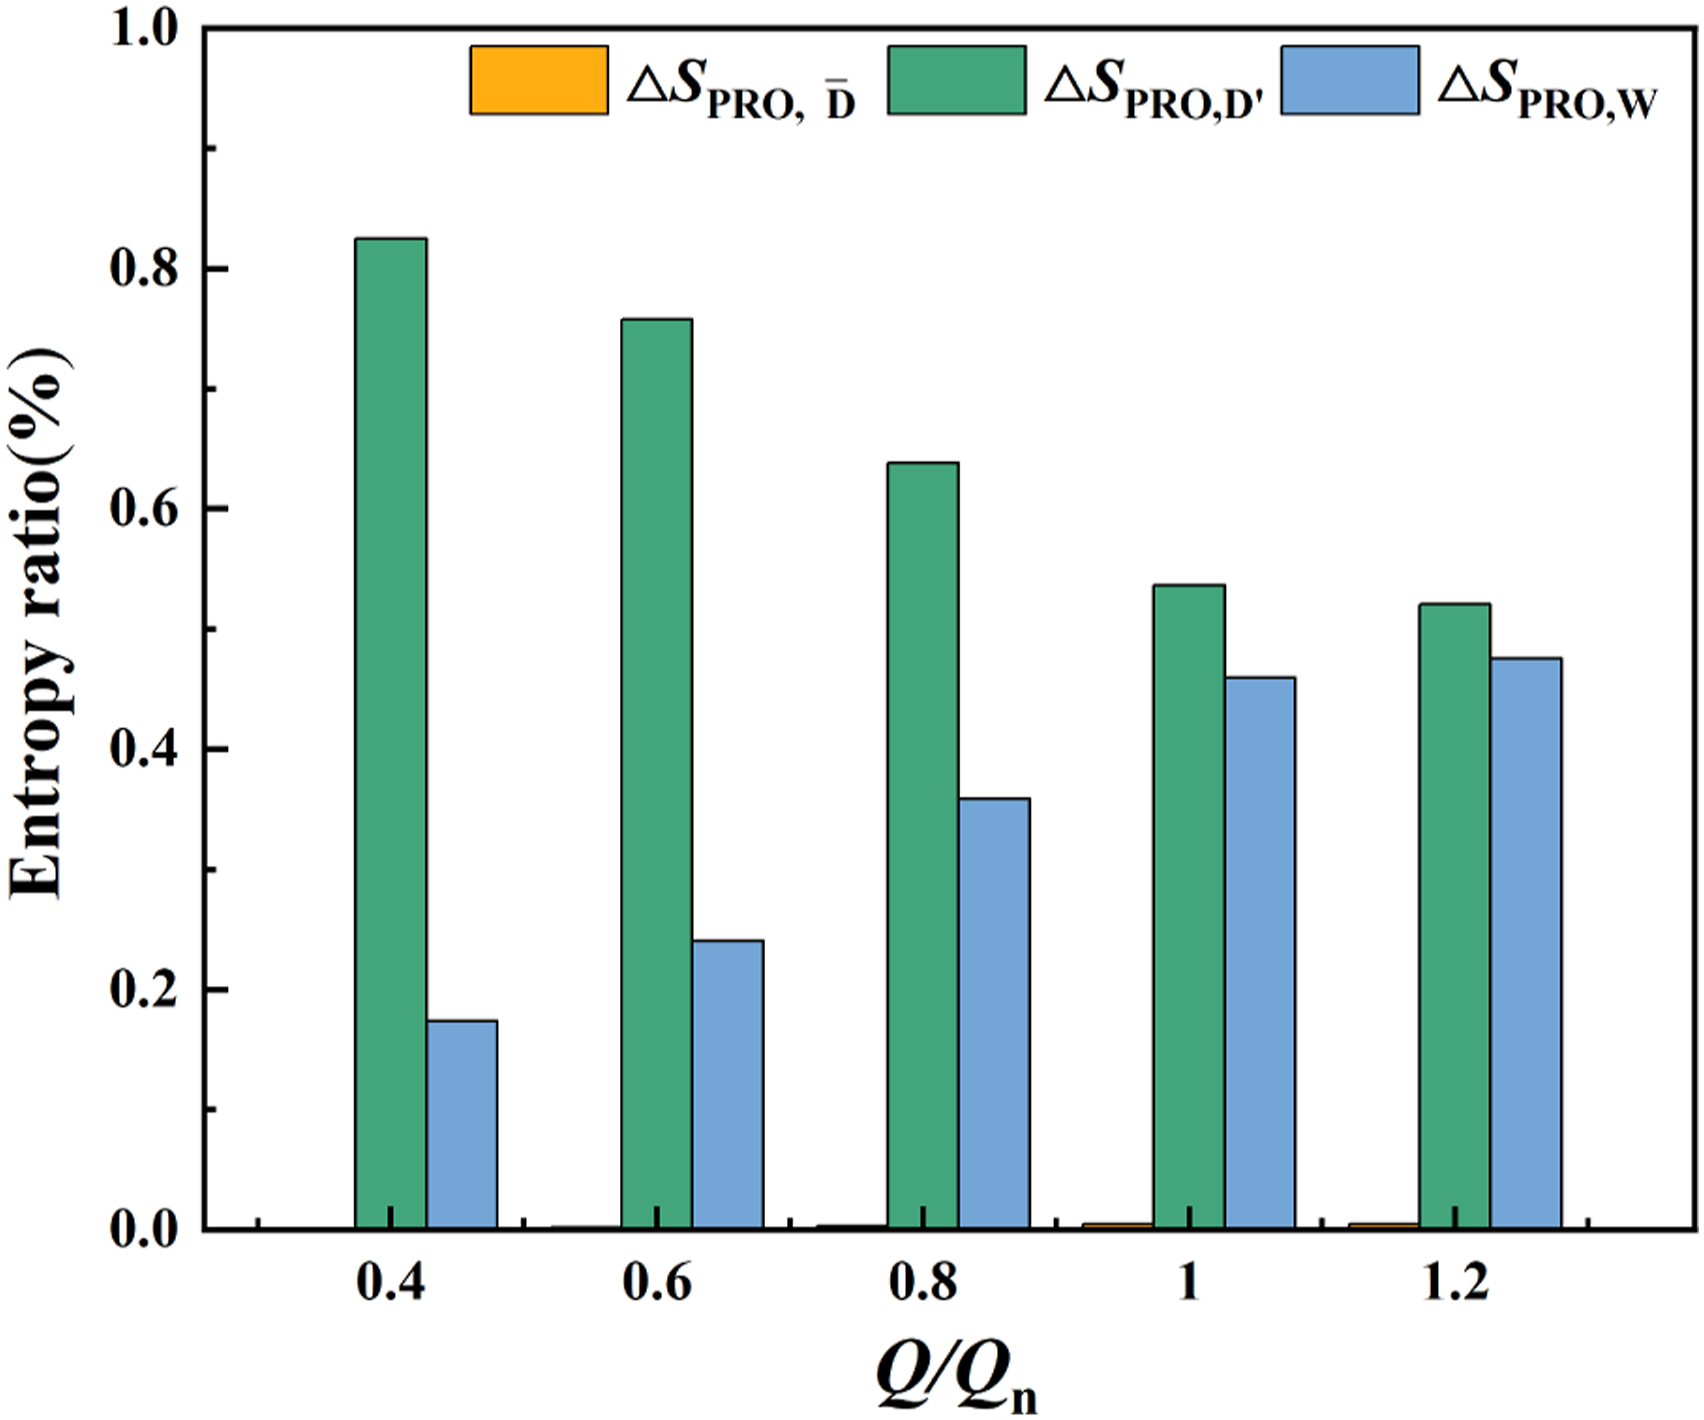
Analysis of local entropy generation rate in the centrifugal pump
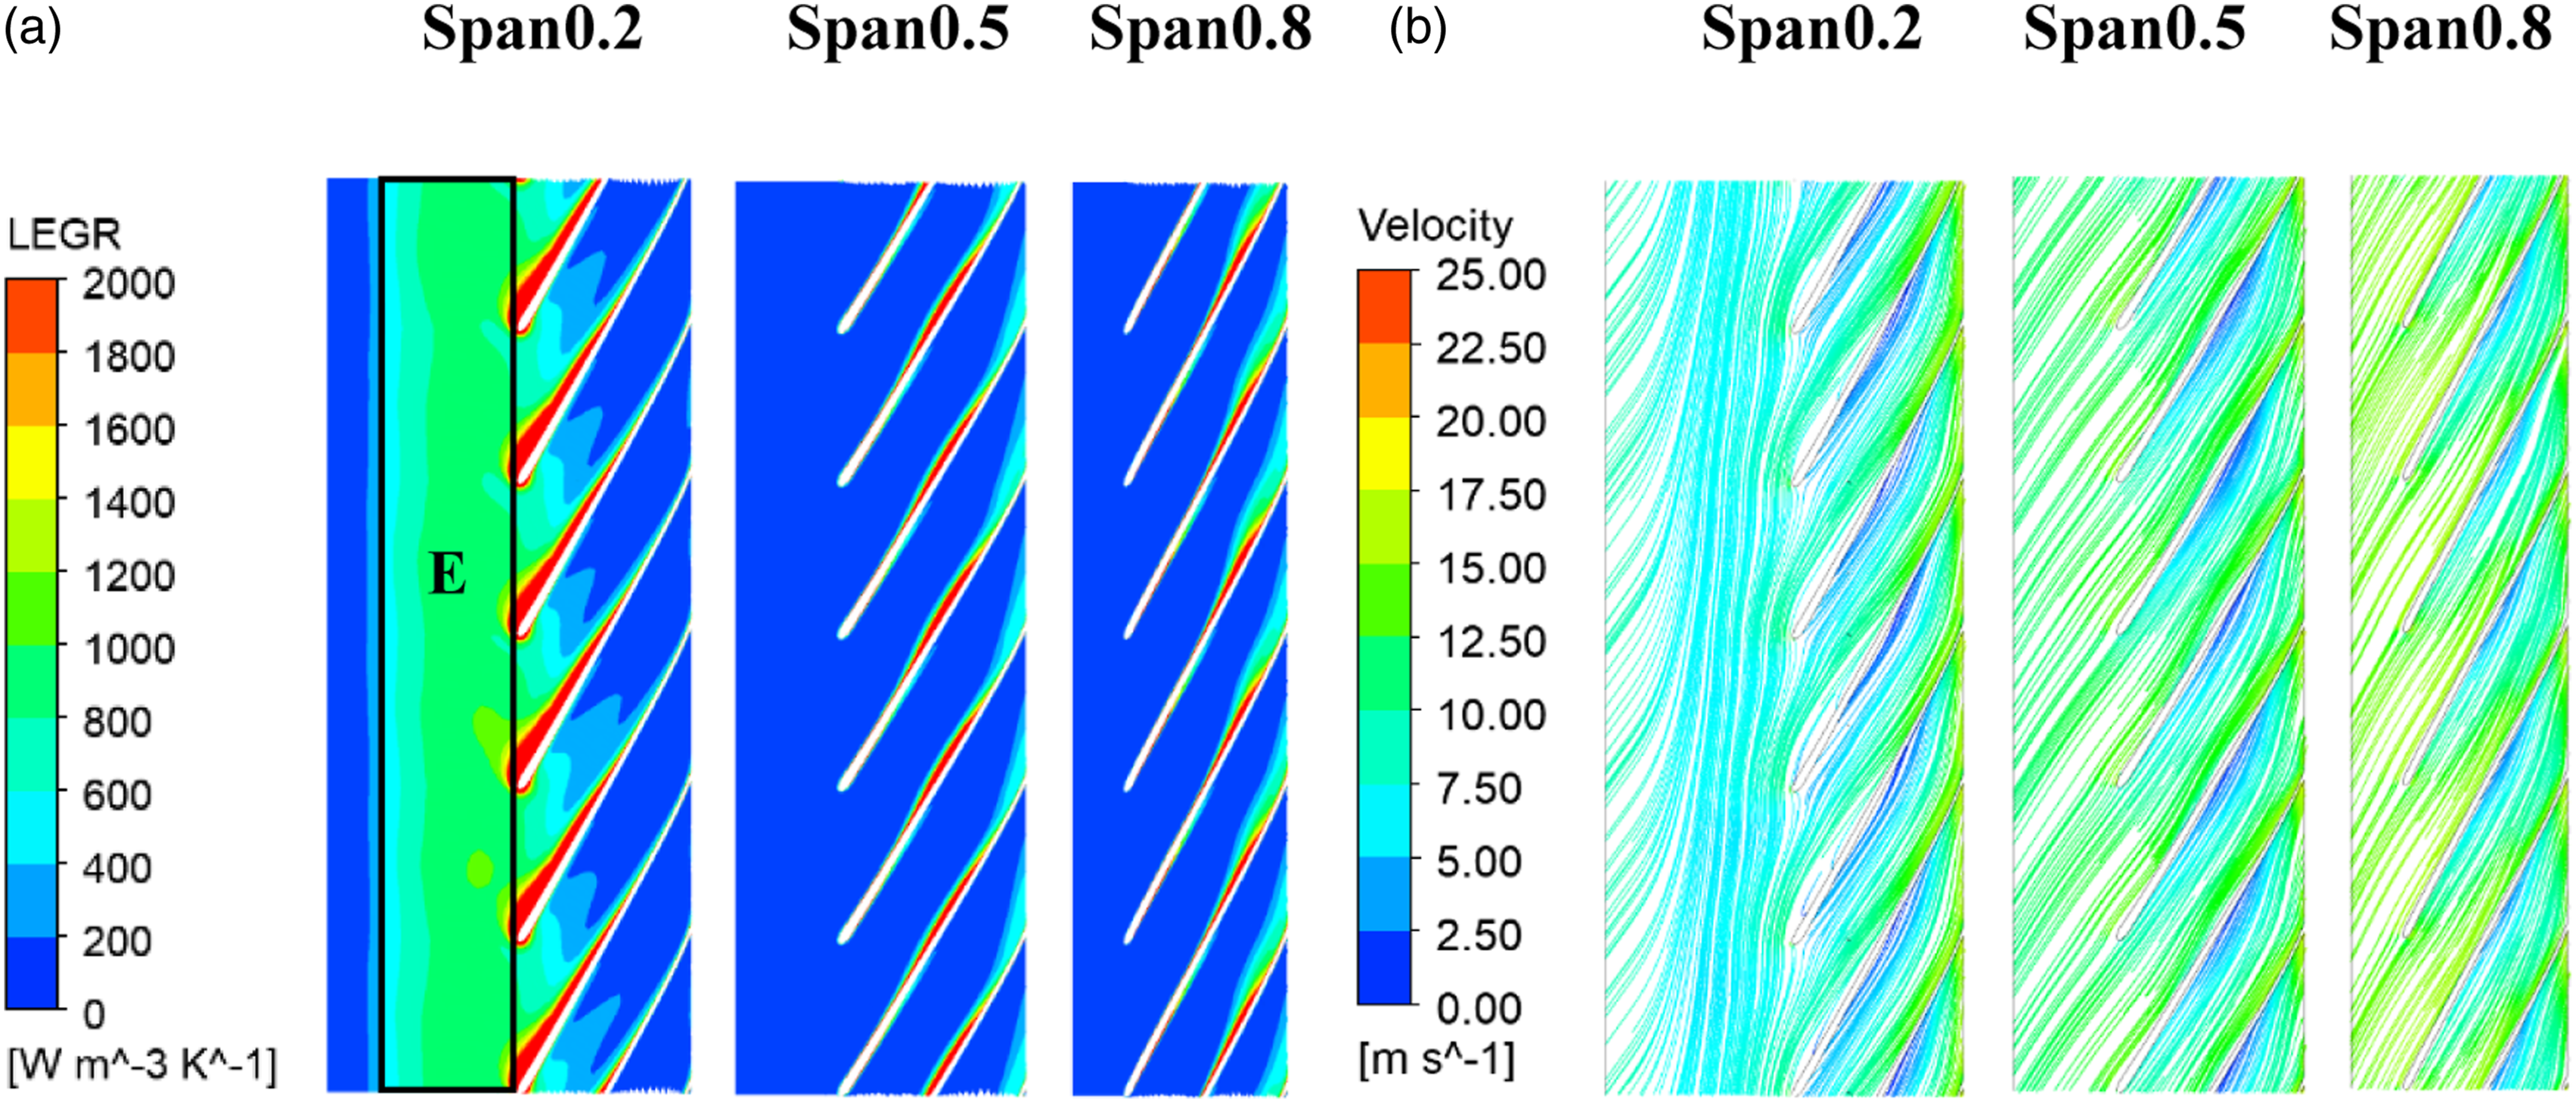
Figures 9–11 present the LEGR and streamlines distribution on three spanwise surfaces (Span 0.2, Span 0.5, and Span 0.8) of the impeller at different operating points (namely 0.6 Qn, 1.0 Qn, and 1.2 Qn). Span 0.2 is the surface near the hub, span 0.5 is the middle surface, and span 0.8 is the surface near the shroud. LEGR distributions and streamlines in different spans of impeller at 0.6 Qn. (a) distributions of the LEGR, (b) distributions of the streamlines. LEGR distributions and streamlines in different spans of impeller at 1.0 Qn. (a) distributions of the LEGR, (b) distributions of the streamlines. LEGR distributions and streamlines in different spans of impeller at 1.2 Qn. (a) distributions of the LEGR, (b) distributions of the streamlines.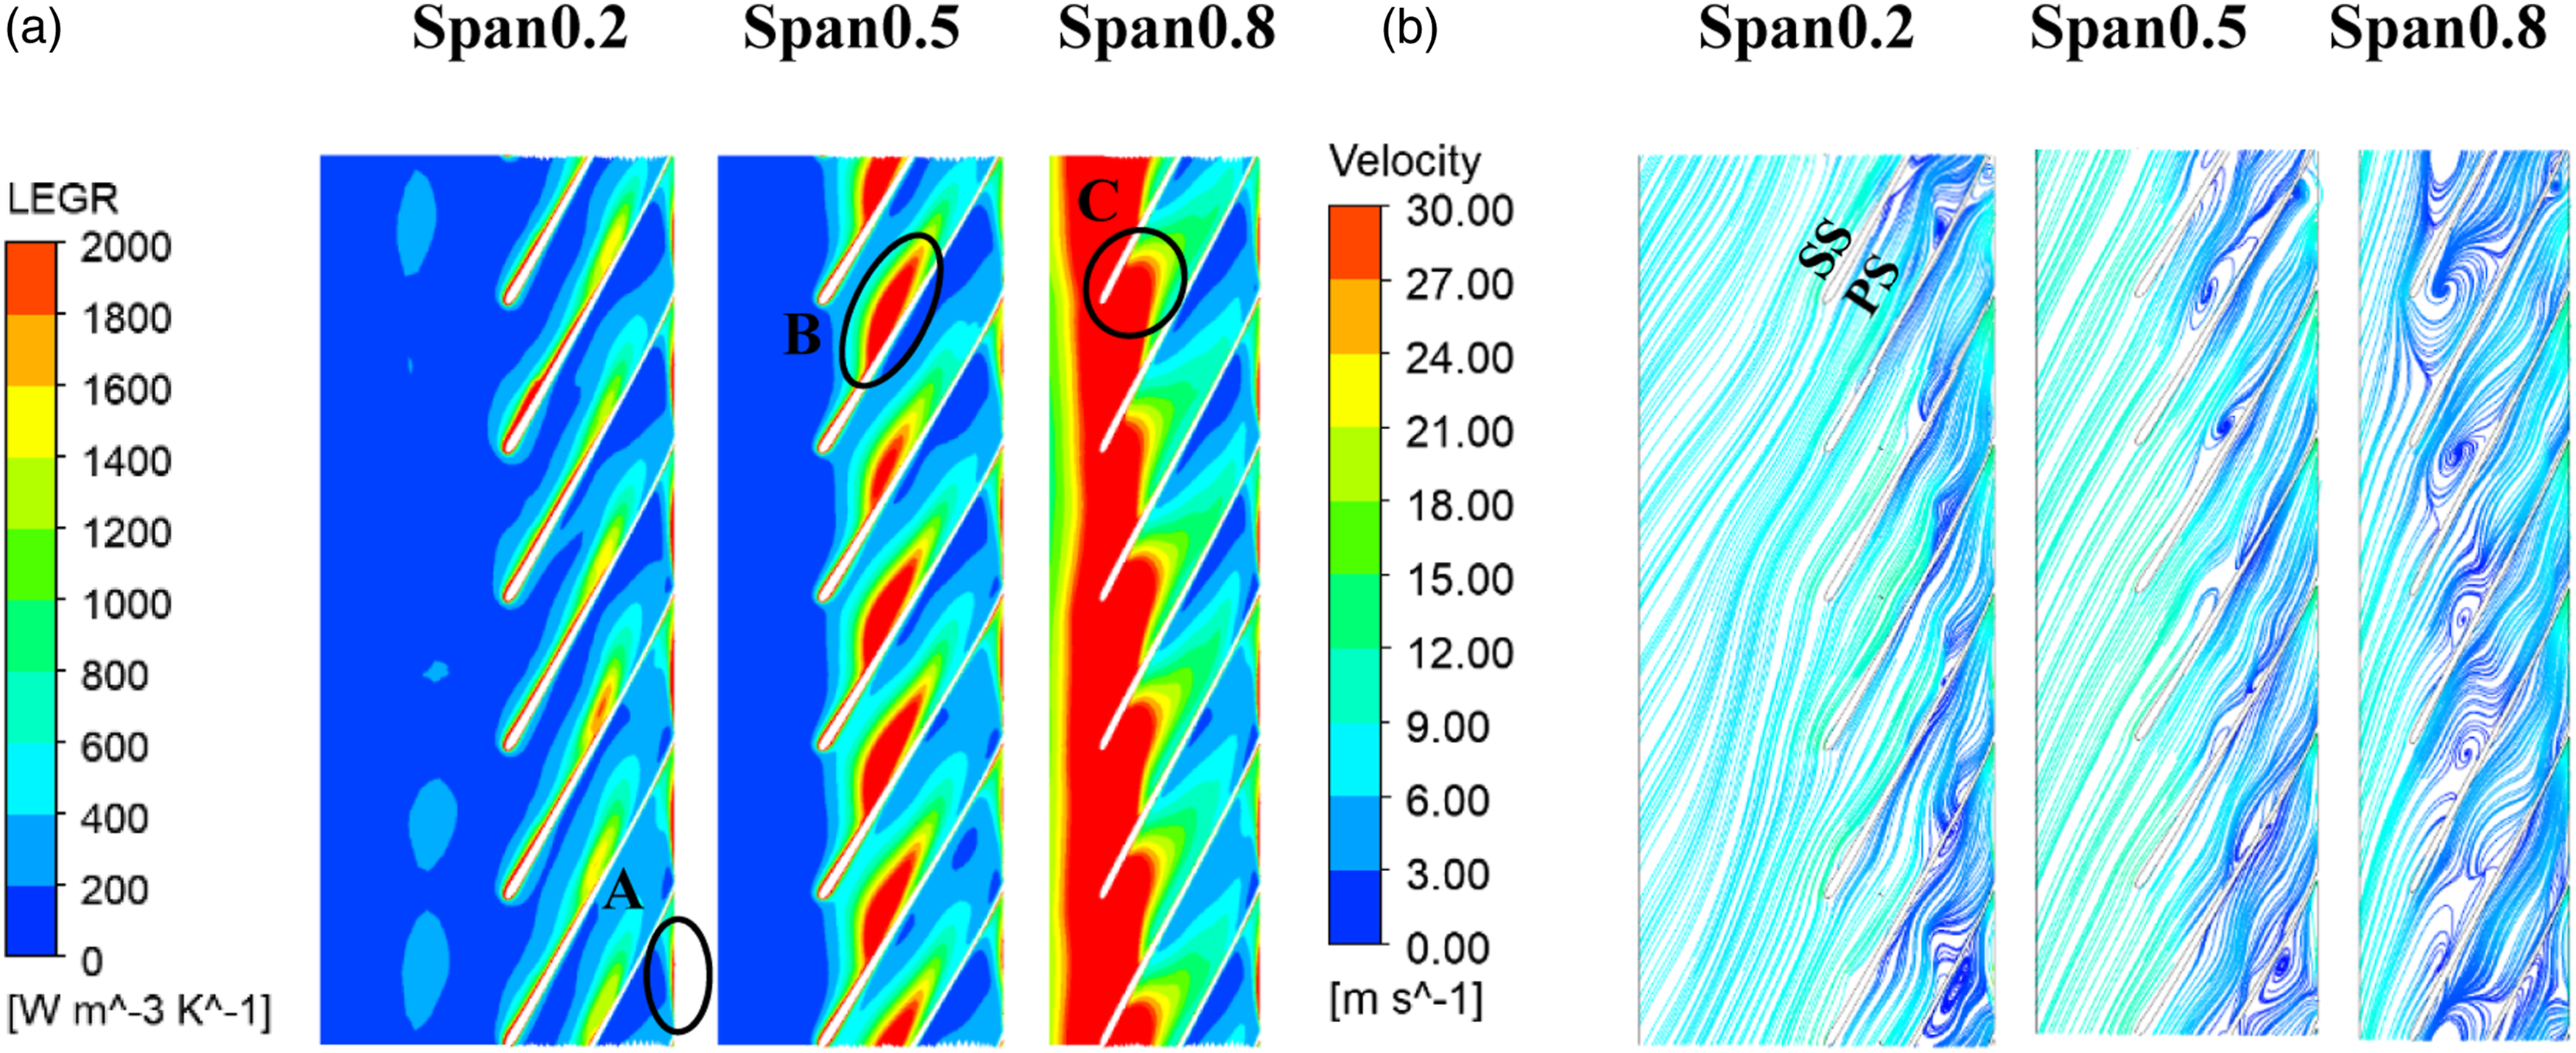
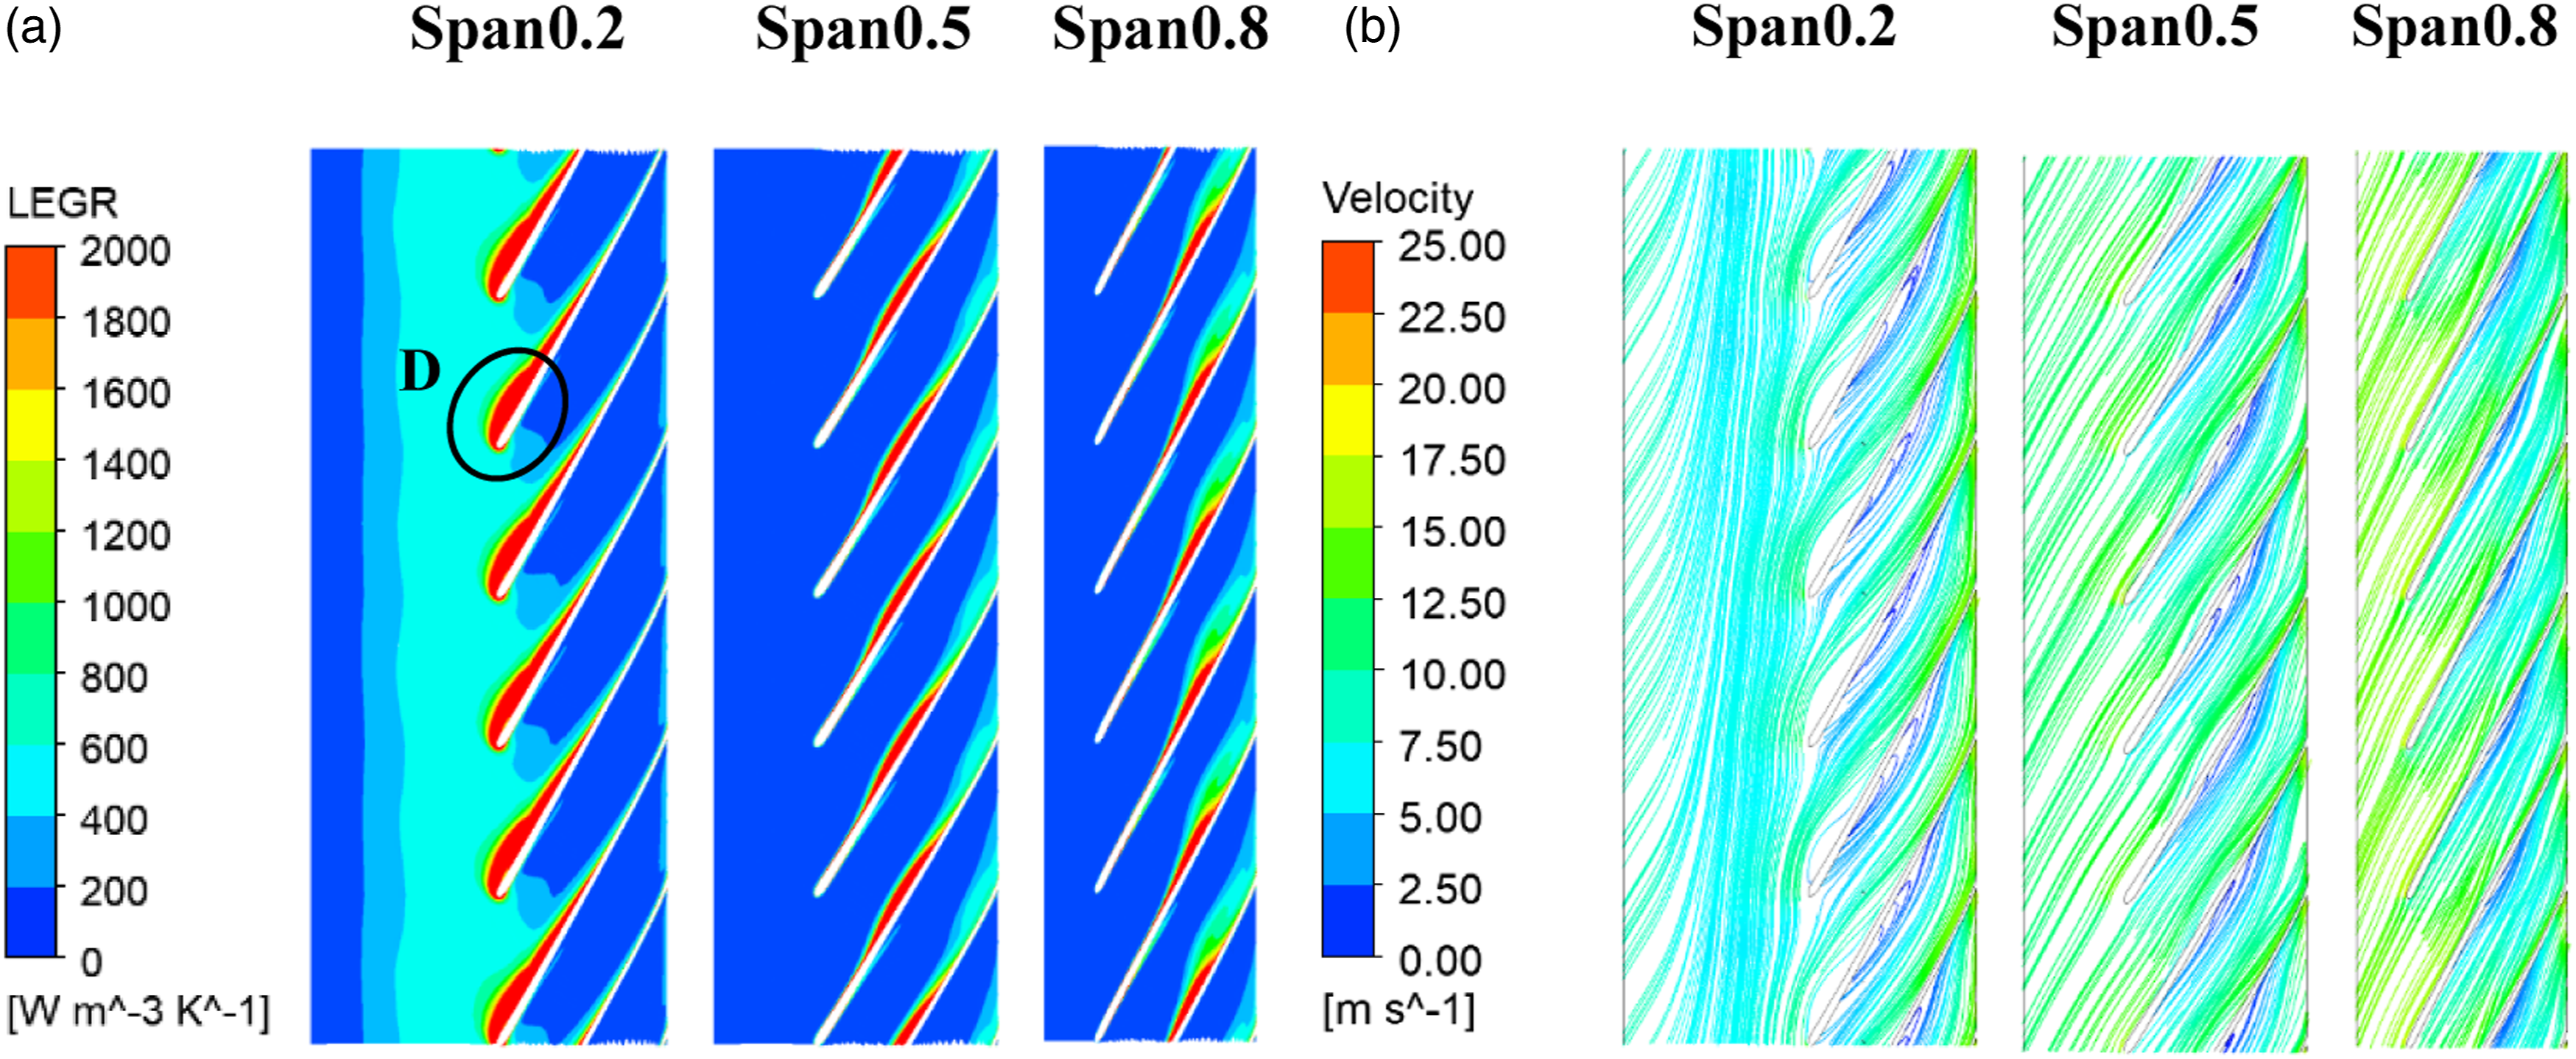
At 0.6Qn, the regions associated with high LEGR in the impeller passages are mainly concentrated on the blade suction side and the impeller exit. As evident in Figure 9(b), it is observed that the incoming flow angle is smaller than the blade placement angle, and the inflow tends to move toward the blade pressure side, resulting in significant flow separation and vortex structures appearing on the blade suction surfaces. The unstable flow pattern becomes more severe in high-span surfaces. Especially at span 0.8, the separation vortex blocks the inlet of the flow channel and spreads along the flow direction to the entire suction surface. This could be attributed to the unevenness between the Coriolis force and the pressure gradient between the shroud and hub at a small flow rate. As a result, the boundary layer deviates to the region close to the shroud, where the unsteady flow structures are more susceptible to generate, 26 thus giving rise to higher losses here.
Furthermore, at part-load working conditions, three typical regions presenting high LEGR are observed on spanwise surfaces, denoted as region A, region B, and region C, respectively. To elucidate the mechanism of high values of LEGR, Figure 12 shows the vector distribution of these regions. Region A locates at the interface of the impeller and volute, due to the interaction between the jet-wake structures and the tongue, the velocity gradient here grows and forms a jet-wake shear layer, which increases the LEGR of region A. It is glaring from Figure 12(b) that severe flow separation appears and a distinct separated vortex forms at region B, the vortex dissipates energy constantly, thus leading to high turbulent loss. As for Region C, a large backflow vortex occurs here, the vortex not only increases the turbulence intensity and friction loss of the fluid, but prevents the fluid from entering the blade channel to obtain kinetic energy. Therefore, region C presents higher LEGR. Vector distributions at (a) region A, (b) region B, (c) region C, (d) region D.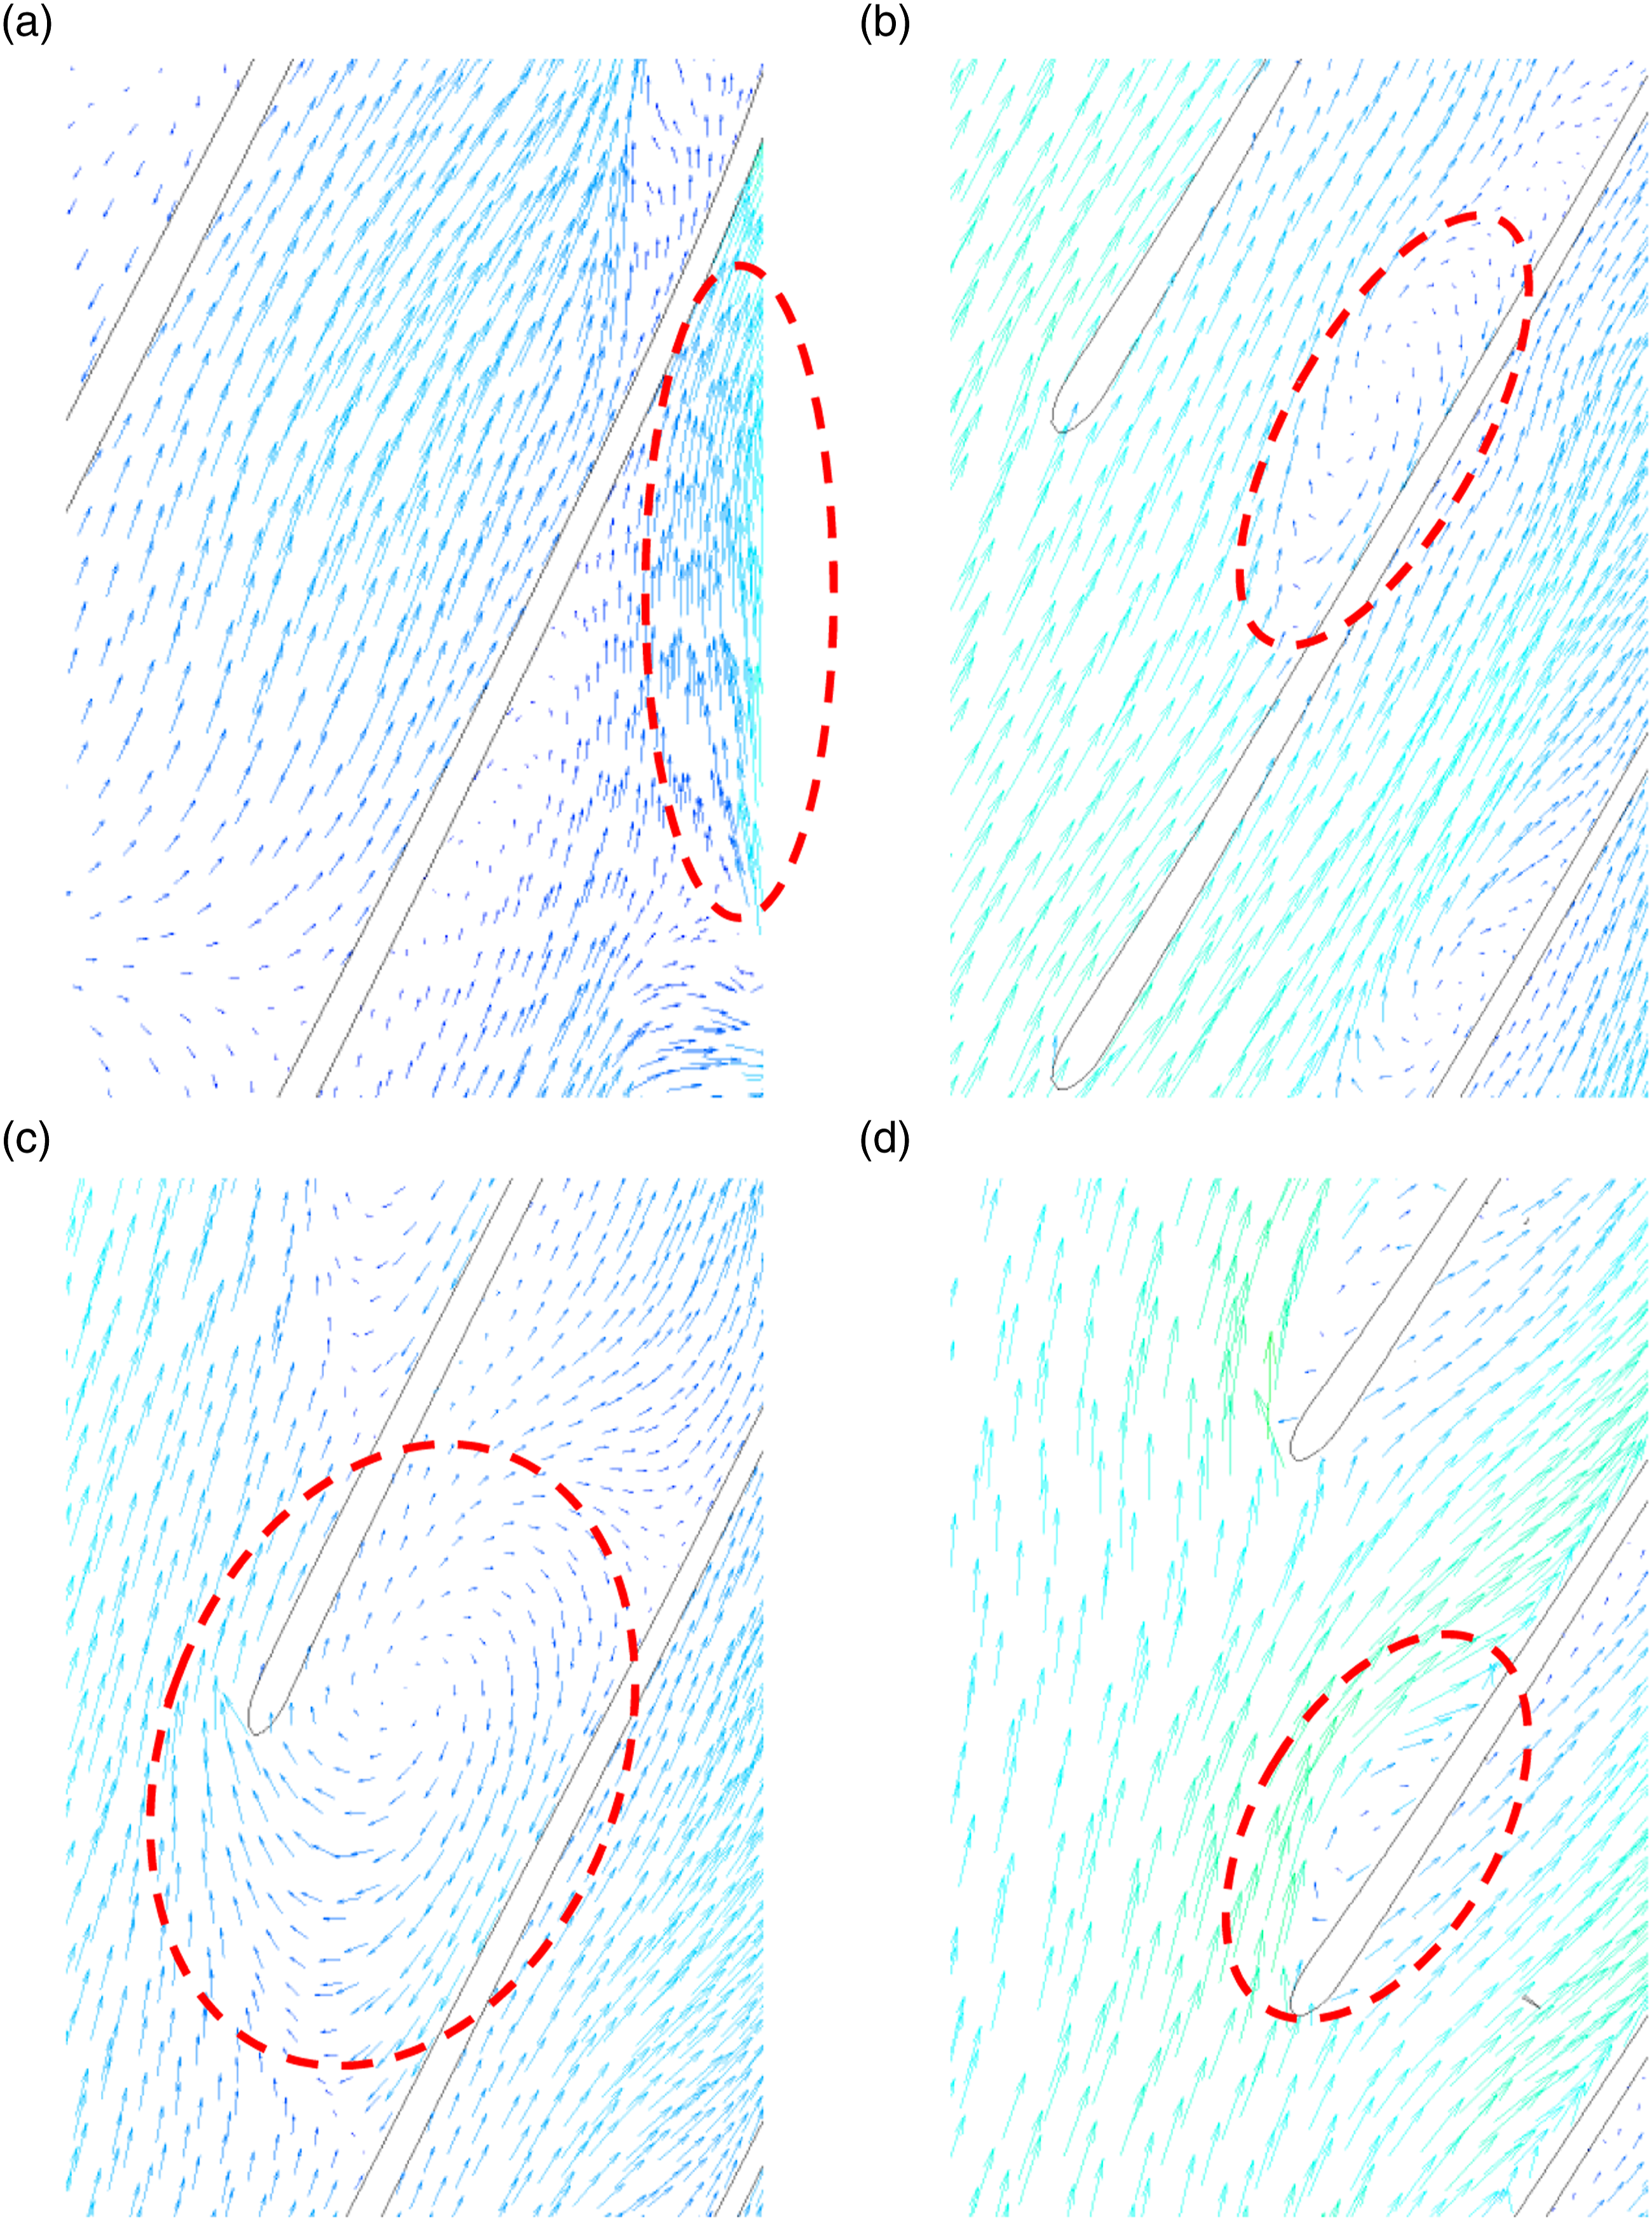
At the nominal flow rate, the low-velocity region on the blade suction surfaces disappears as the flow angle increases, while another significant low-velocity region forms on the pressure side covering about two-thirds of the chord of the blade. The internal flow pattern becomes more stable compared to that at 0.6 Qn, hence the area of the high LEGR region is significantly reduced. At the same time, another high LEGR region D could be noticed around the vicinity of the inlet of the suction surface. According to the vector distribution of region D presented in Figure 12(d), the energy loss of this region is mainly attributed to the impacting effect at the impeller inlet, where significant flow separation occurs at the leading edge of the suction side.
The energy loss is induced by the strong momentum exchange between the low-velocity vortical flow and the high-velocity fluid at the inlet of the impeller. Moreover, as the span decreases, the location of the high LEGR region gradually approaches the leading edge of the suction surface, with its area increasing slightly. Therefore, it can be concluded that higher loss will generate near the hub under the rated flow conditions.
The streamline distribution grows more uniform as the incoming flow angle coincides with the blade placement angle on Span 0.5 and Span 0.8 surfaces at 1.2Qn, and the flow separation zone on the blade pressure surface basically disappears. As shown in Figure 11(a), the energy loss in the corresponding blade passages is the lowest at this point. However, with increase in flow rate, the circumferential velocity of the fluid increases, and the shearing effect of the fluid in the circumferential direction also increases, thus leading to moderate LEGR distribution in region E.
Figure 13 depicts the wall EGR distribution on the blades under three working conditions. It can be found that the regions possessing high wall EGR mainly emanate at the leading edge of suction surfaces and the trailing edge of pressure surfaces. The strength of the wall EGR increases notably with increasing flow rates, and the distribution range gradually spreads from the leading edge to the entire suction surface. Besides, there is a strong correlation between the wall EGR and wall shear stress according to Tang et al.
27
At high flow rate conditions, the impingement effect of fluid on the wall is intensified and accompanied by enhanced wall shear stress, which gives rise to the wall EGR. Wall EGR distributions of blades at (a) 0.6 Qn, (b) 1.0 Qn, (c) 1.2 Qn.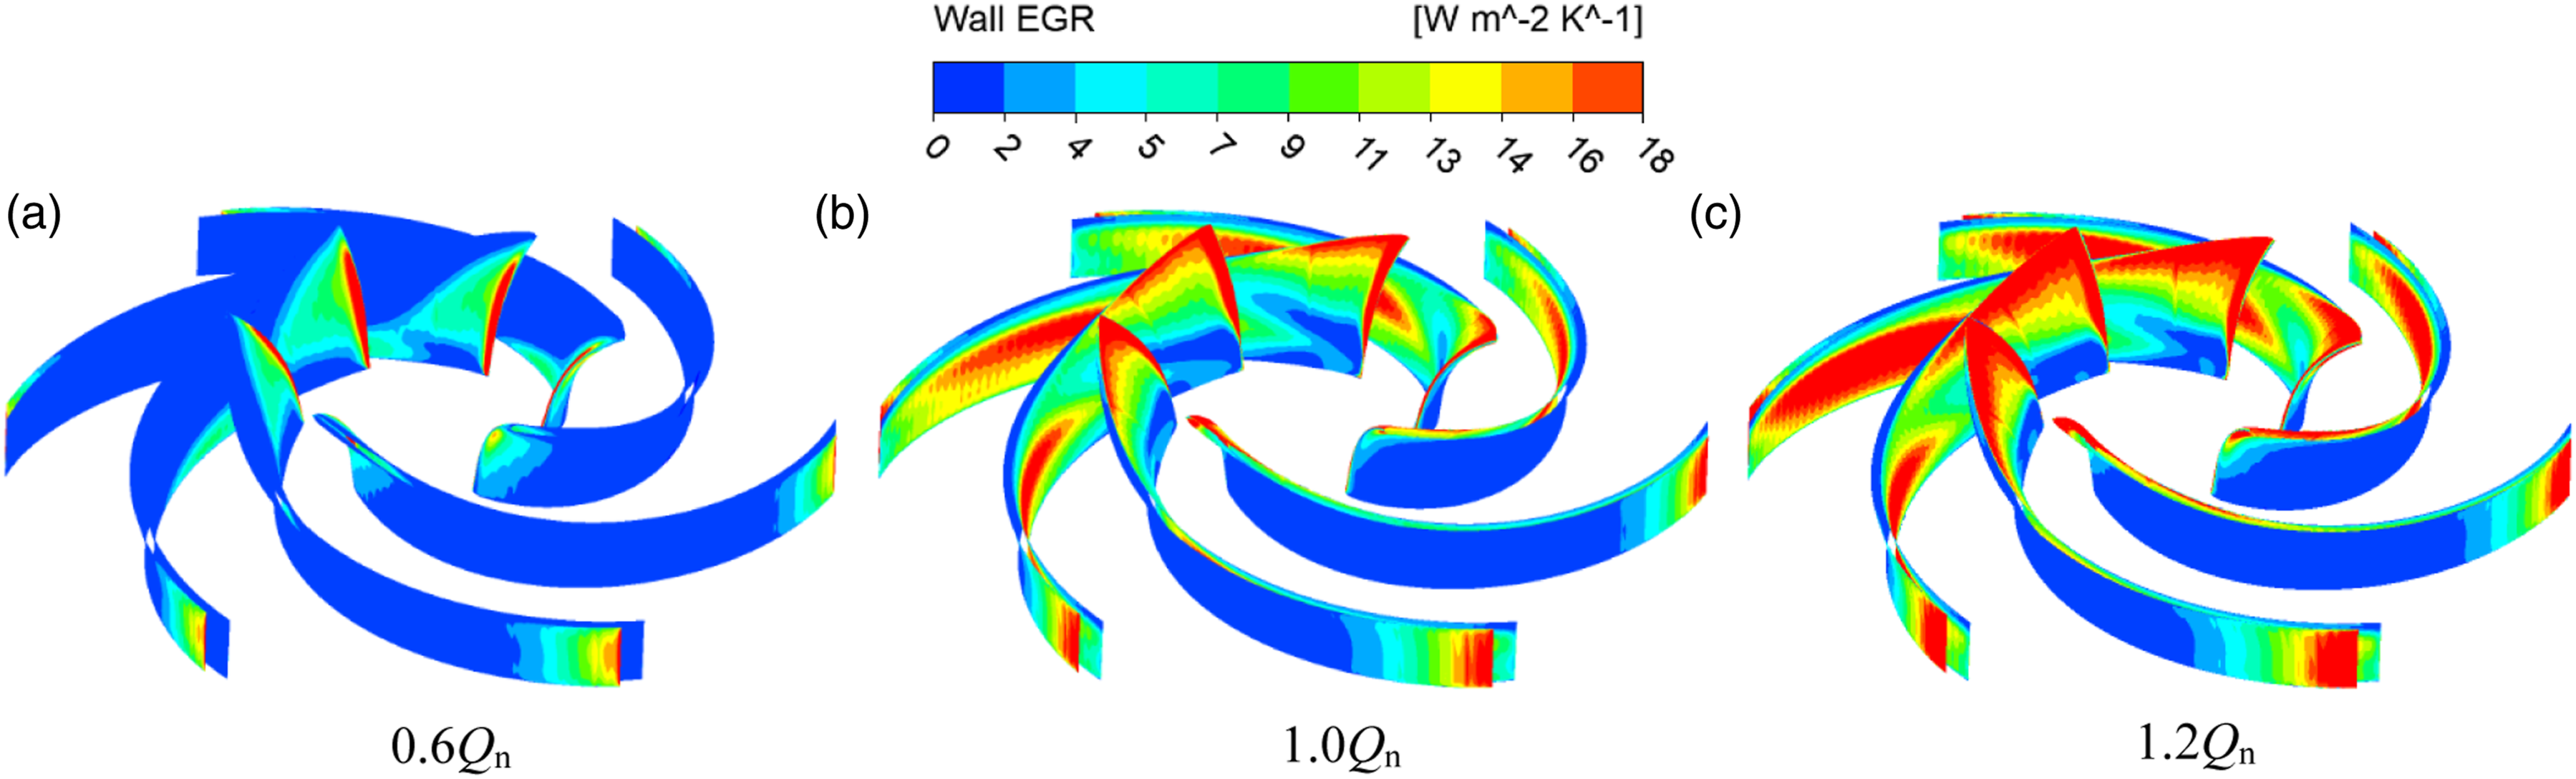
The flow field inside rotating machinery is extremely complex characterized by various vortices with different scales. To capture the vortex structures, plenty of vortex identification methods have been proposed in the past few decades.28,29,30 However, these methods usually depend on the selection of threshold and could give inaccurate results sometimes. Recently, Liu et al.
31
proposed a new Omega (Ω) vortex identification method, which not only can capture both strong and weak vortices in the flow field, but has the advantage of insensitivity to the threshold. The Omega method has been applied in current research on vortical flow analysis in fluid machinery.32,33,34 As given in Ref,
31
Ω is expressed as follows: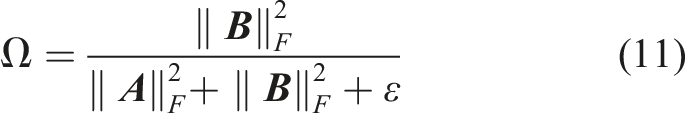
To have a better understanding of the distribution of energy loss in the volute, eight cross-sectional planes are chosen in the circumference direction of the volute, as shown in Figure 14(a), plane I, III, V, VII are selected for the subsequent analysis. Definition of the circumferential parameters of the volute. (a) different Cross-sectional planes, (b) different circumferential positions.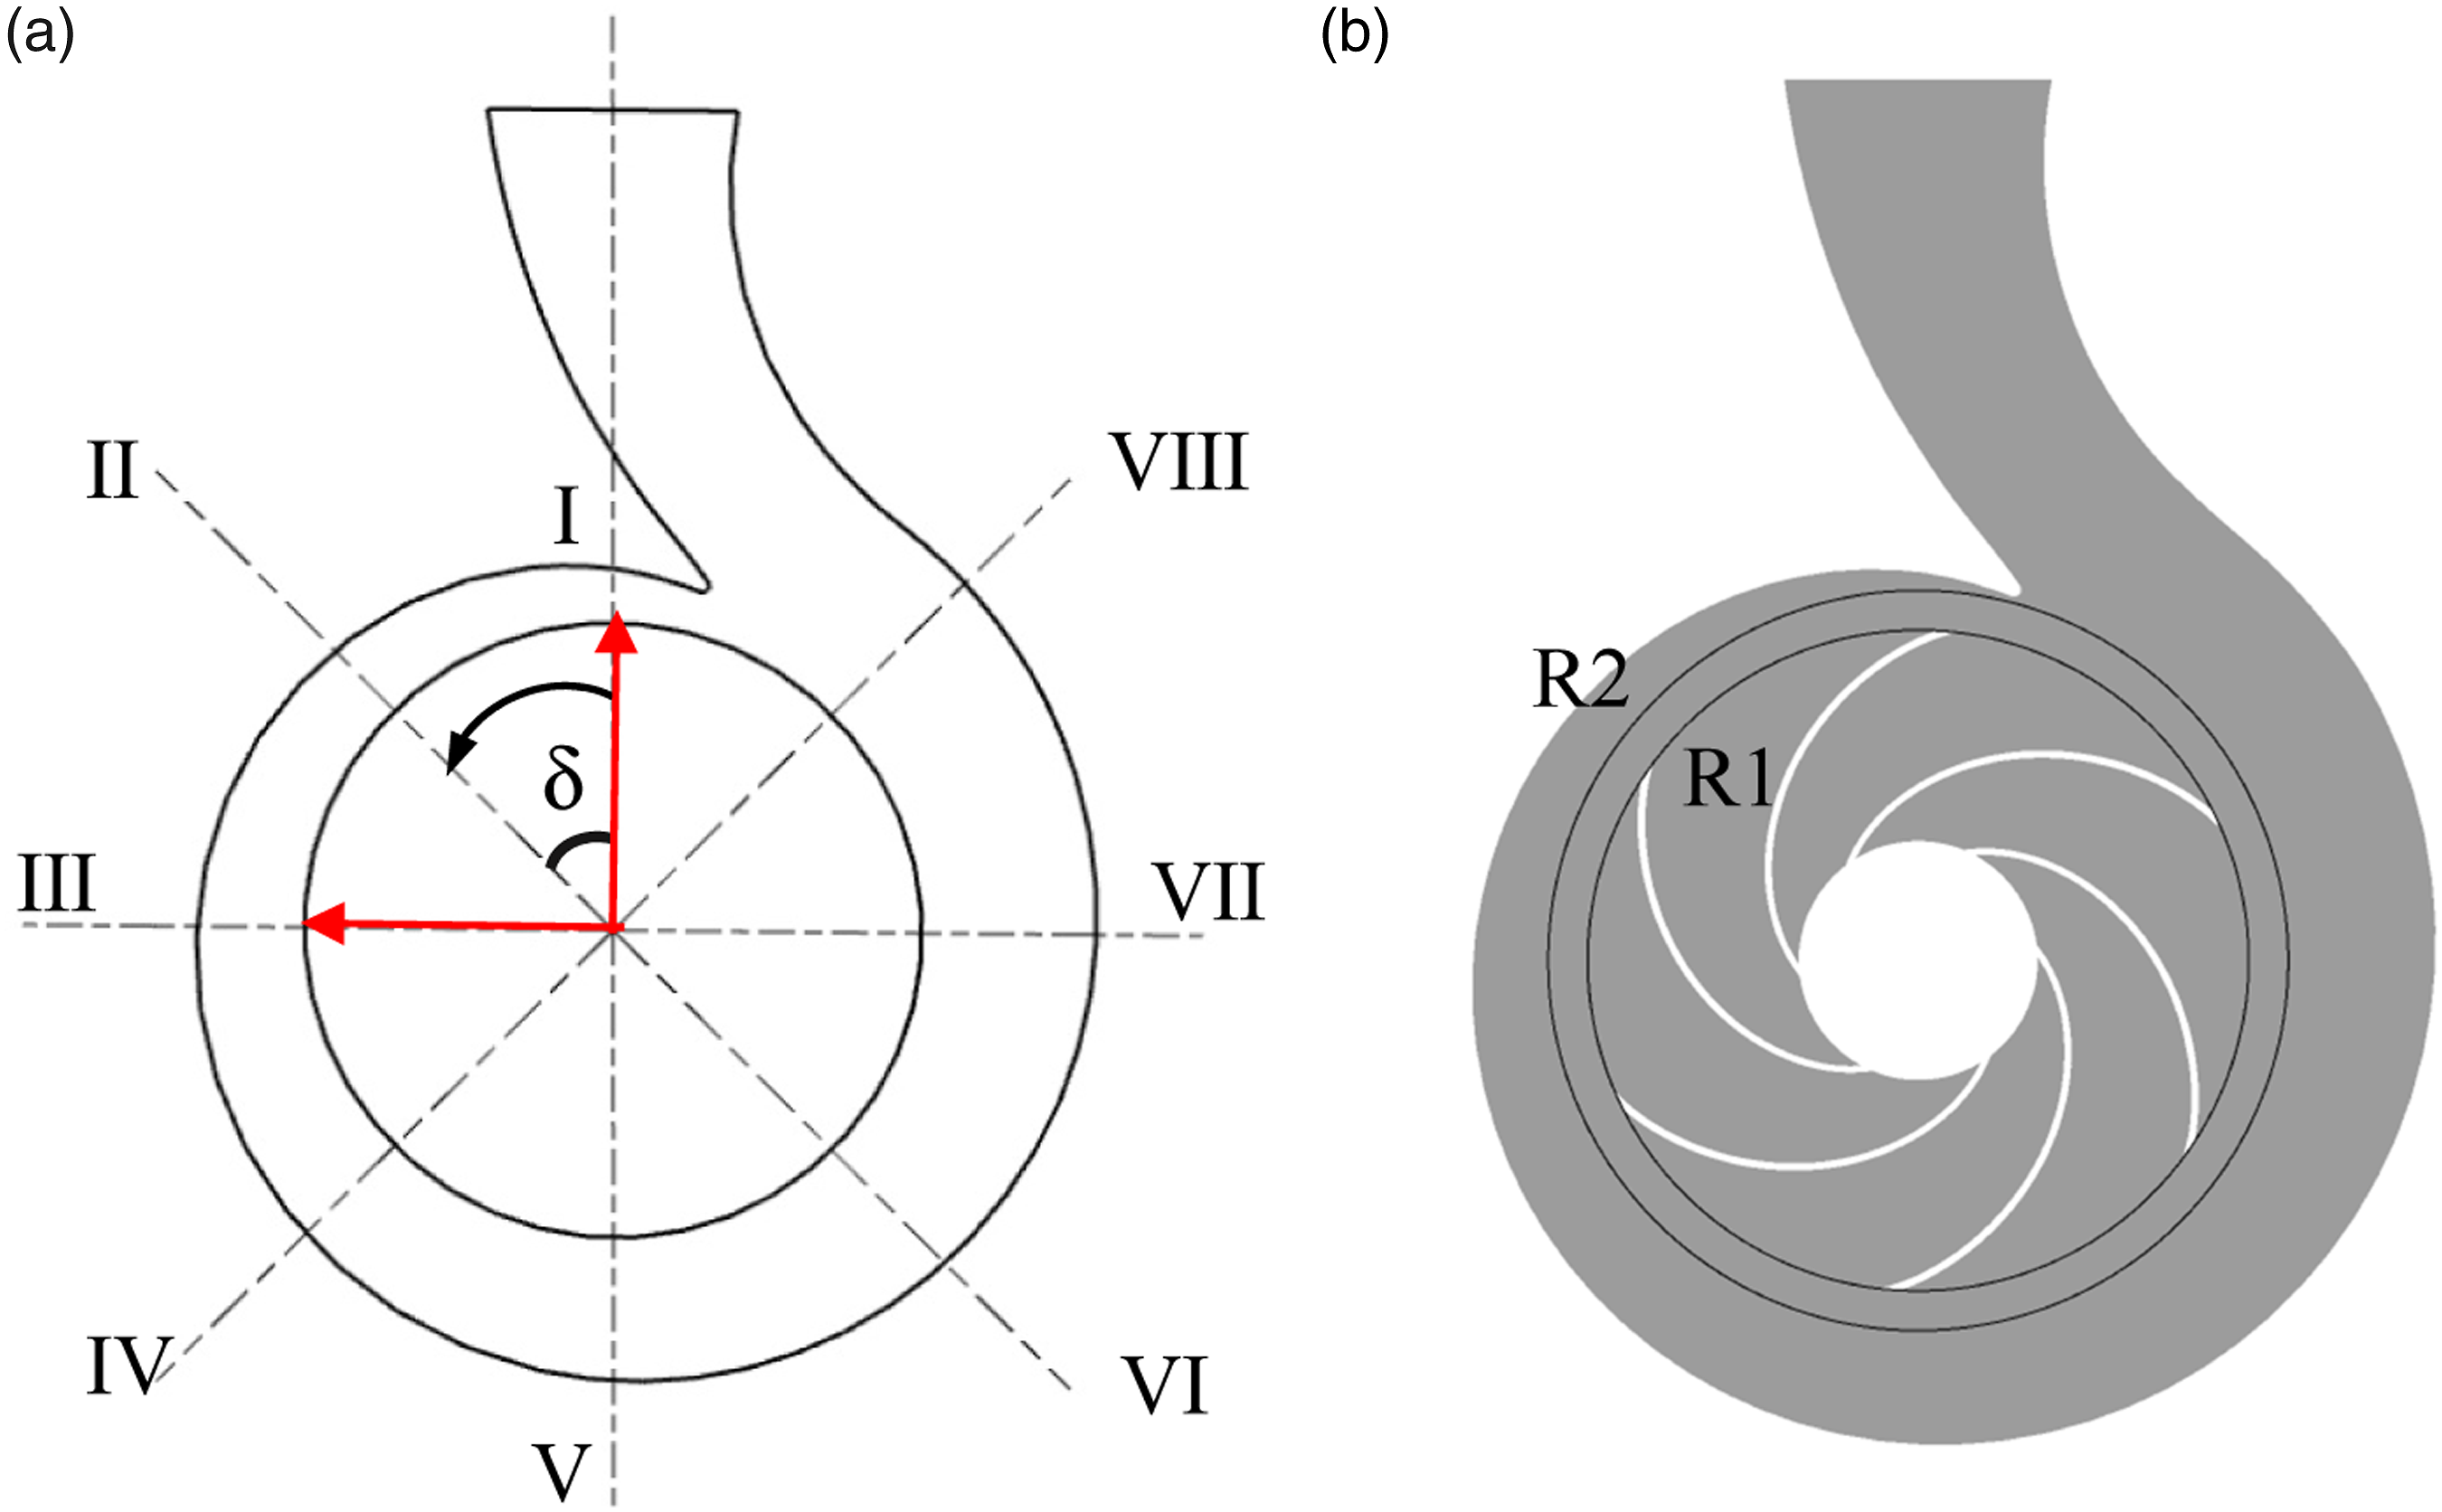
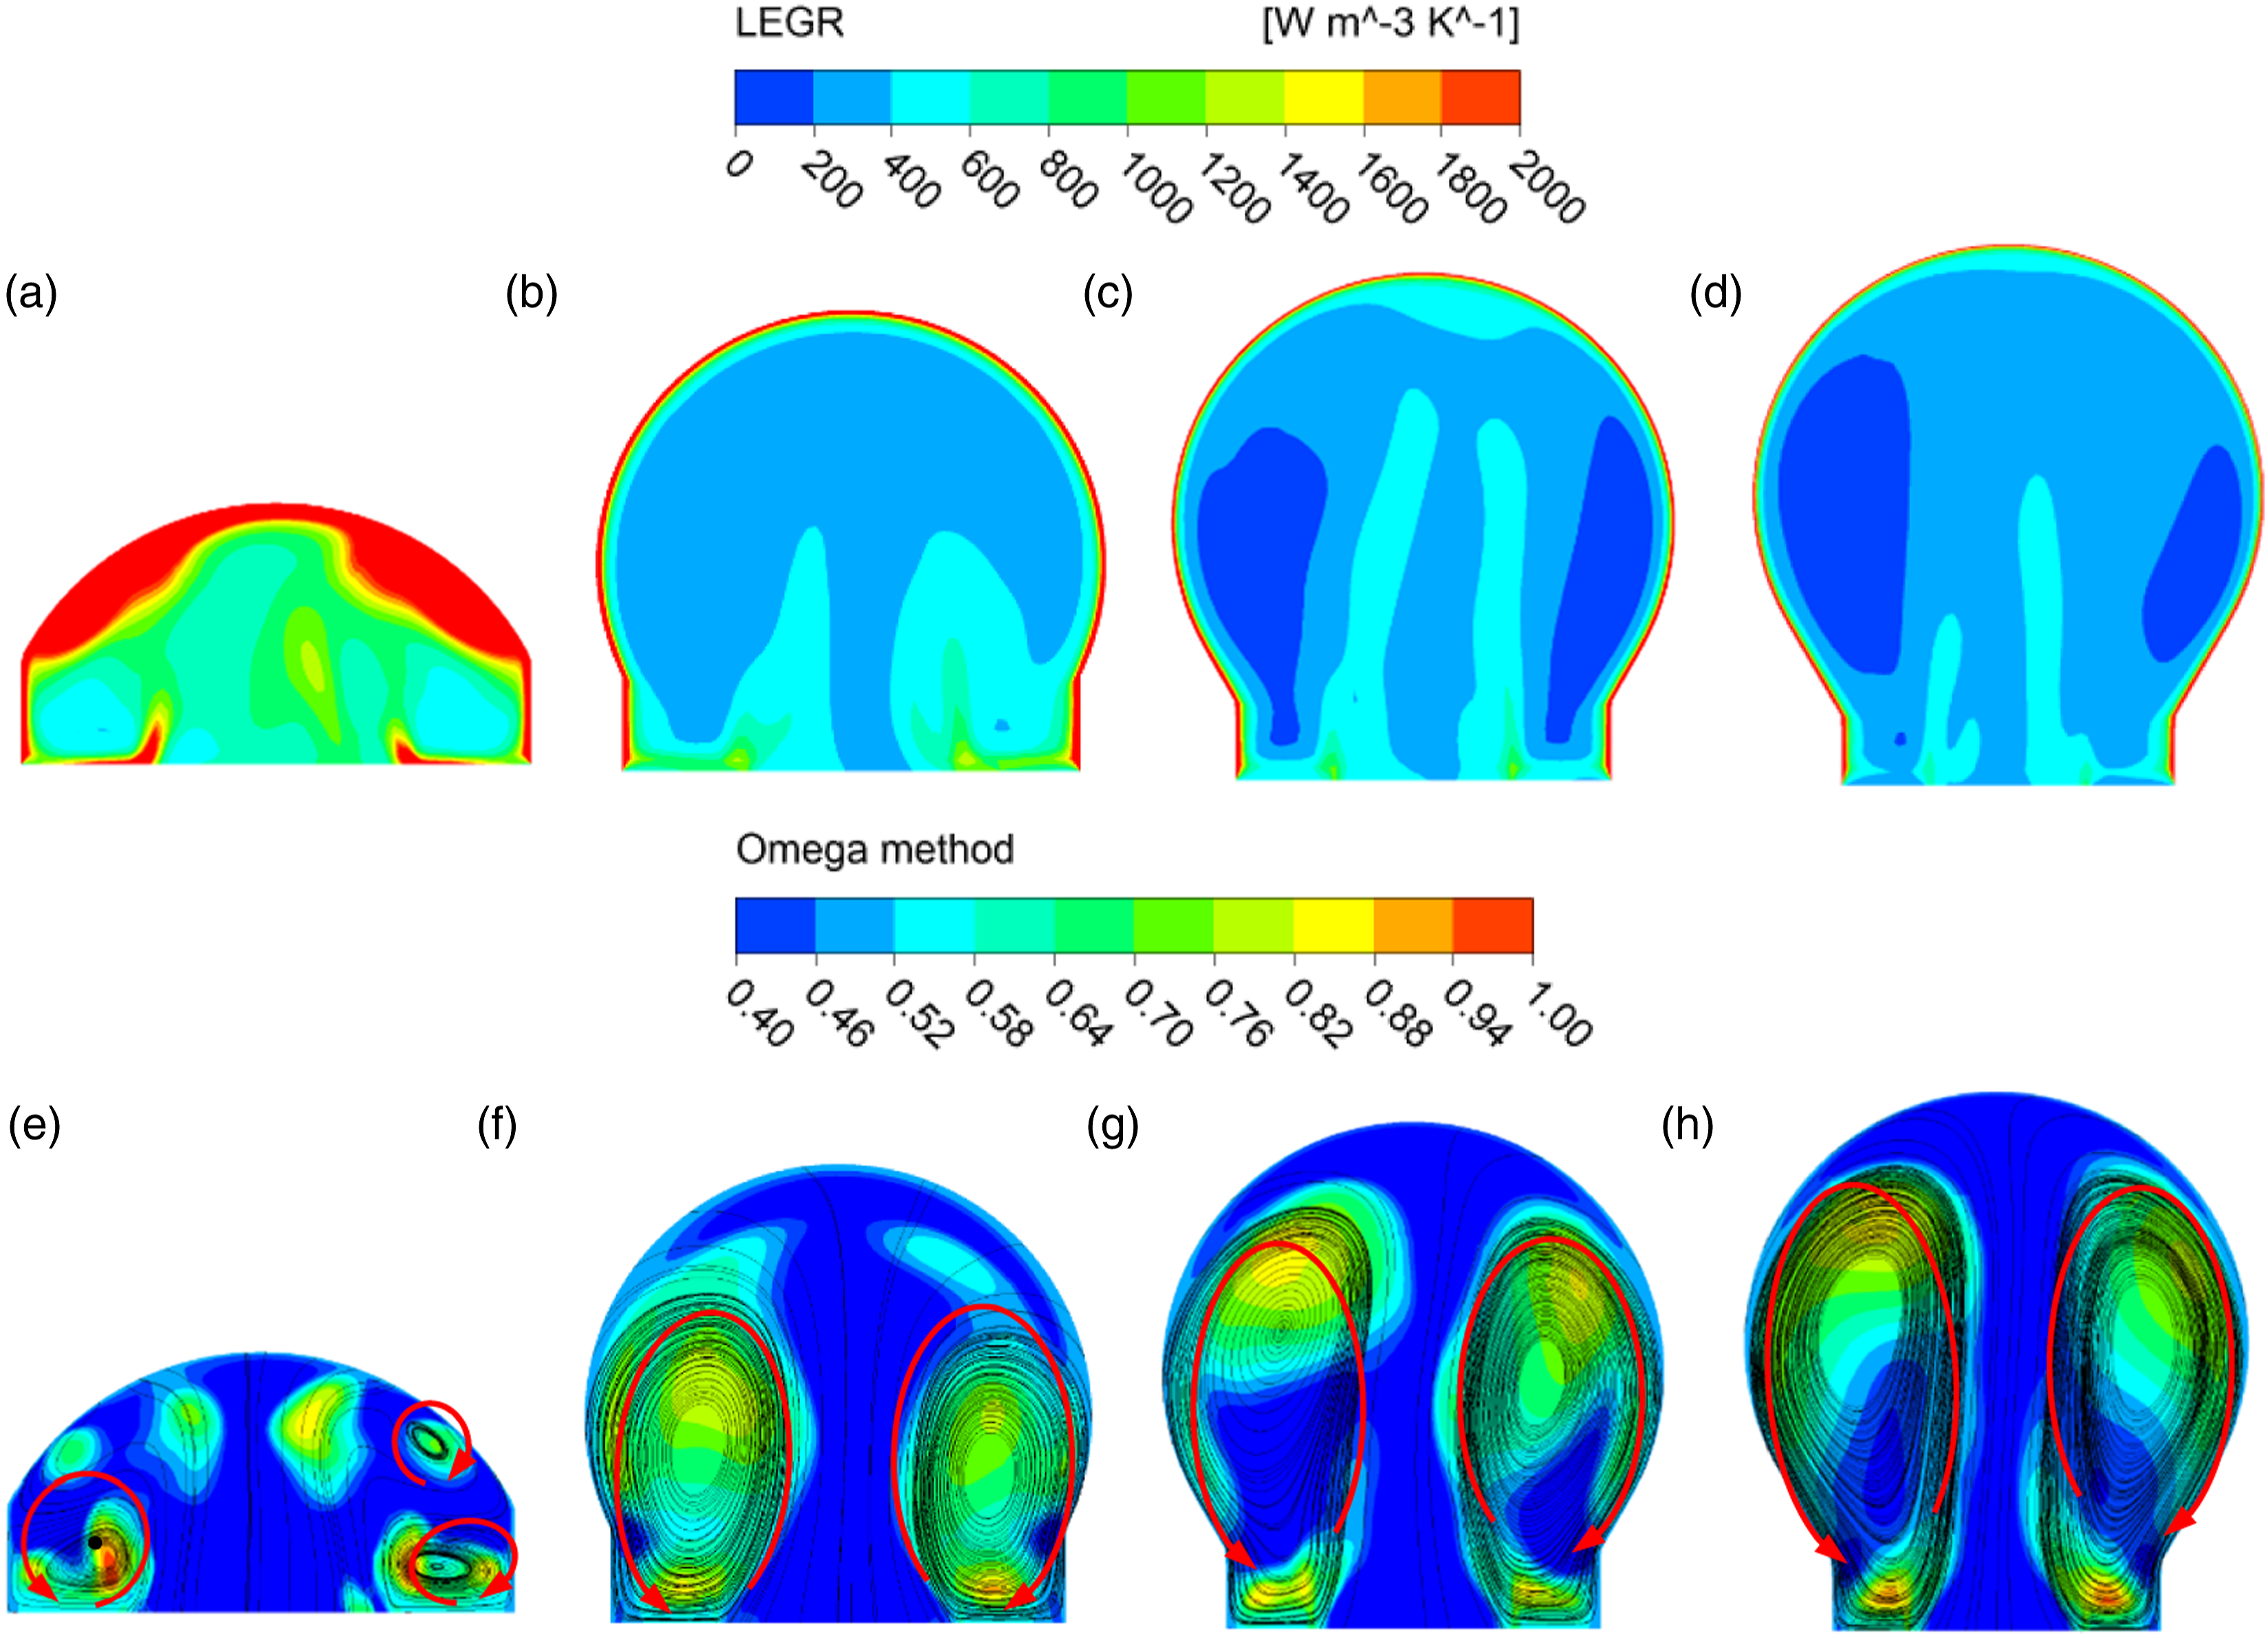
Figures 15–17 present the distribution of LEGR and Omega strength at the selected cross-sectional planes of the volute under different flow conditions. It is obvious from the Omega contours that the regions with high Omega values coincide with the vortices in streamline distribution, indicating that the Omega method can accurately predict the unstable flow structures in the centrifugal pump. LEGR distributions at : (a) plane Ⅰ, (b) plane Ⅲ, (c) plane Ⅴ, (d) plane Ⅶ and Omega strength distributions at : (e) plane Ⅰ, (f) plane Ⅲ, (g) plane Ⅴ, (h) plane Ⅶ at 0.6 Qn. LEGR distributions at : (a) plane Ⅰ, (b) plane Ⅲ, (c) plane Ⅴ, (d) plane Ⅶ and Omega strength distributions at : (e) plane Ⅰ, (f) plane Ⅲ, (g) plane Ⅴ, (h) plane Ⅶ at 1.0 Qn. LEGR distributions at : (a) plane Ⅰ, (b) plane Ⅲ, (c) plane Ⅴ, (d) plane Ⅶ and Omega strength distributions at : (e) plane Ⅰ, (f) plane Ⅲ, (g) plane Ⅴ, (h) plane Ⅶ at 1.2 Qn.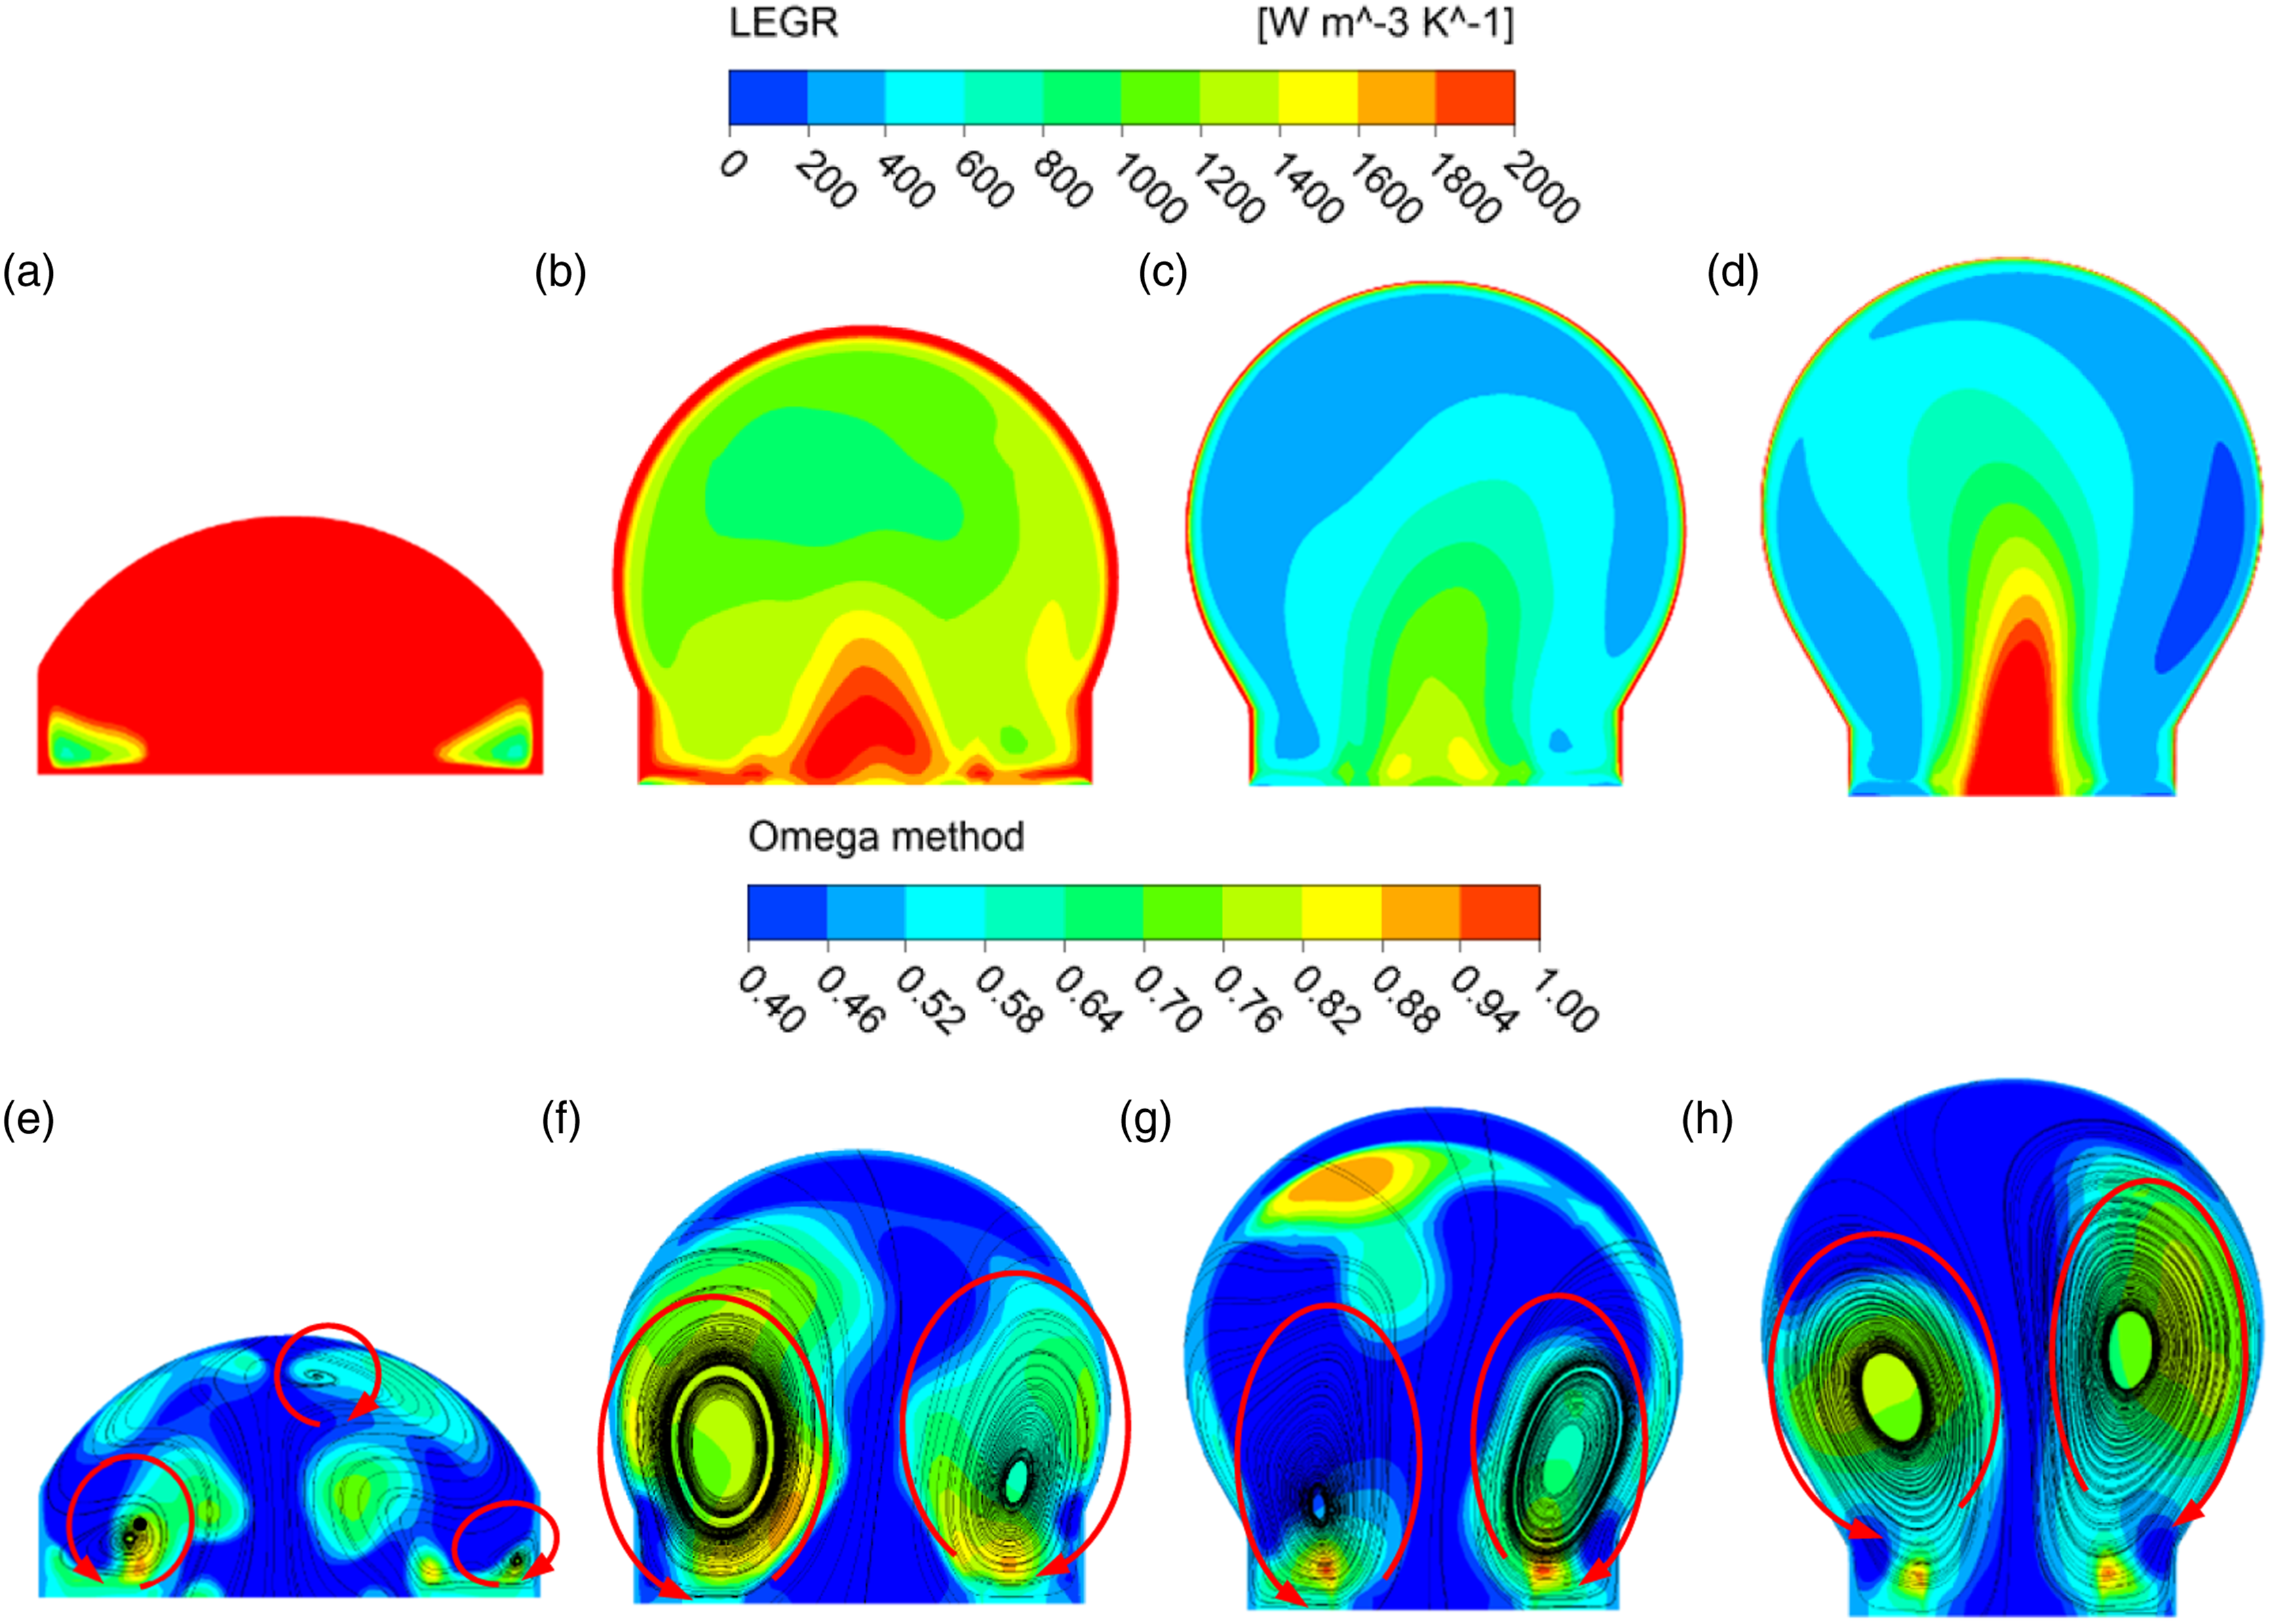
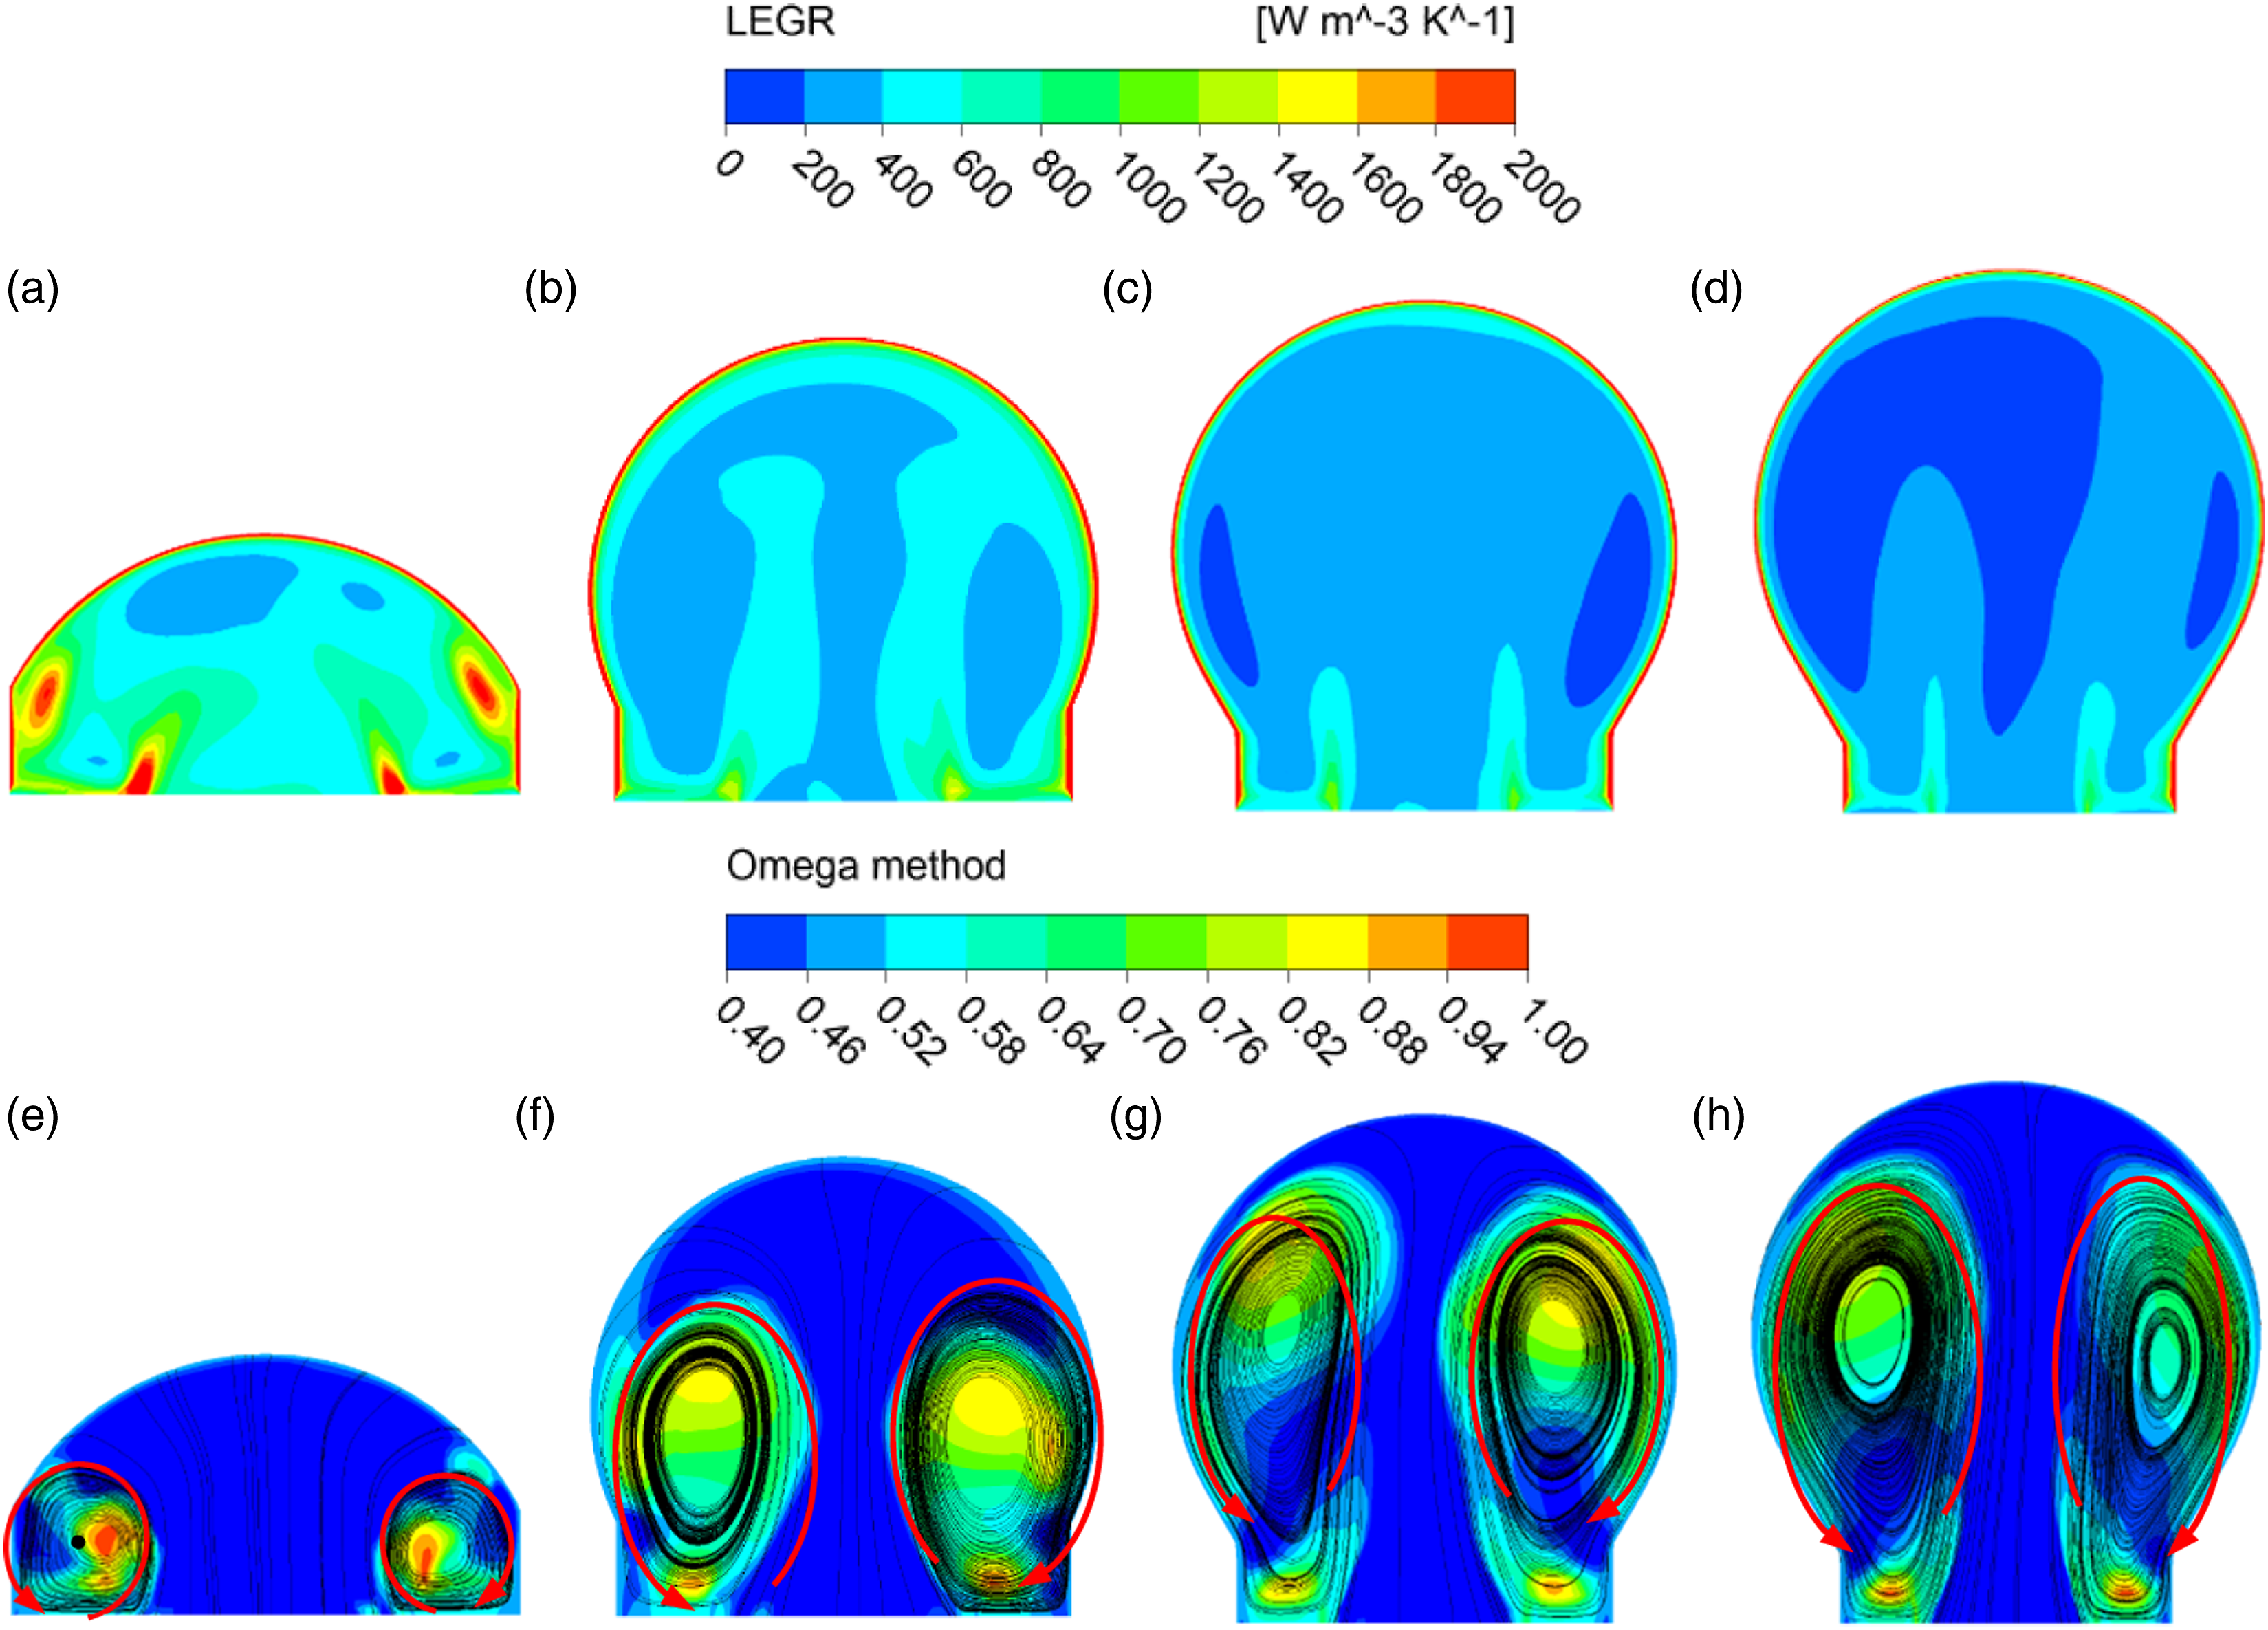
Under different flow conditions, the distribution pattern of LEGR in volute is similar, which is, the regions possess high LEGR are mainly located at the wall of the volute and near the interface between the dynamic and static components. Since the flow field in the volute is more irregular at small flow rate, the intensity of LEGR on each plane is significantly higher than that under other flow conditions.
Comparatively, plane I possesses the highest magnitude of LEGR, plane I is close to the tongue and is more susceptible to be influenced by the irregular structure of the tongue, thus resulting in stronger turbulence effect. It can be seen from Figure 15(e) that a pair of shedding vortices with opposite directions develops and breaks up on plane I. Compared with Figure 15(a), it is obvious that the location of the vortices is highly consistent with the distribution of LEGR. Interestingly, the magnitude of LEGR in the vortex core is low, indicating that the energy loss mainly comes from the shearing effect between the low-speed vortical fluid and the surrounding high-speed fluid. As the flow rate increases, the distribution of the vortices becomes more uniform with its area decreasing moderately. As a result, the energy loss on plane I gradually decreases.
Cross-section V is the plane far away from the tongue, under the part load conditions, the energy loss on plane V is the lowest. As revealed in Figure 15(g), a pair of vortices with opposite directions are also observed on plane V, which consists of the shedding vortices from the impeller and the upstream vortices from the volute casing. It is found that the streamlines in the upper area of plane V are deflected apparently, which would compress the vortices in the volute casing. As a result, the vortex core locates at the middle and lower part of plane V. The vortices exchange energy with the surrounding fluid, causing higher energy loss at the corresponding position. With the increase of the flow rate, the vortices exhibit an orderly distribution, part of the vortices concentrate on the middle and upper part of plane V, which is also the position of the vortex core. This part of the vortices mainly evolved from the upstream vortex pair. The rest part of the vortices locates at the bottom of plane V, which is mainly caused by the shedding vortices slapping the inner wall of the volute. At higher flow rates, the region with high magnitude of LEGR is mainly distributed at the bottom of plane V. It is suggested that the impact effect of the shedding vortices on energy loss of plane Ⅴ enhanced with increase in flow rate.
Figure 18 shows the magnitude of LEGR on the curve of R=210 mm and R=235 mm under various working conditions. The parameter δ, as shown in Figure 14(a), is introduced to represent the angle of the point from the vertical axis. Plane Ⅰ locates at the position of δ=0°, and the tongue locates at the position of δ=345°. It is evident that the strength of LEGR at partial flow rates is much greater than that at the nominal and large flow rates. So here just takes the data of part-load condition for example to explain the distribution of energy loss in the circumferential direction of the volute. LEGR magnitude at (a) R1 = 210 mm, (b) R2 = 235 mm when pump works at various flow rates.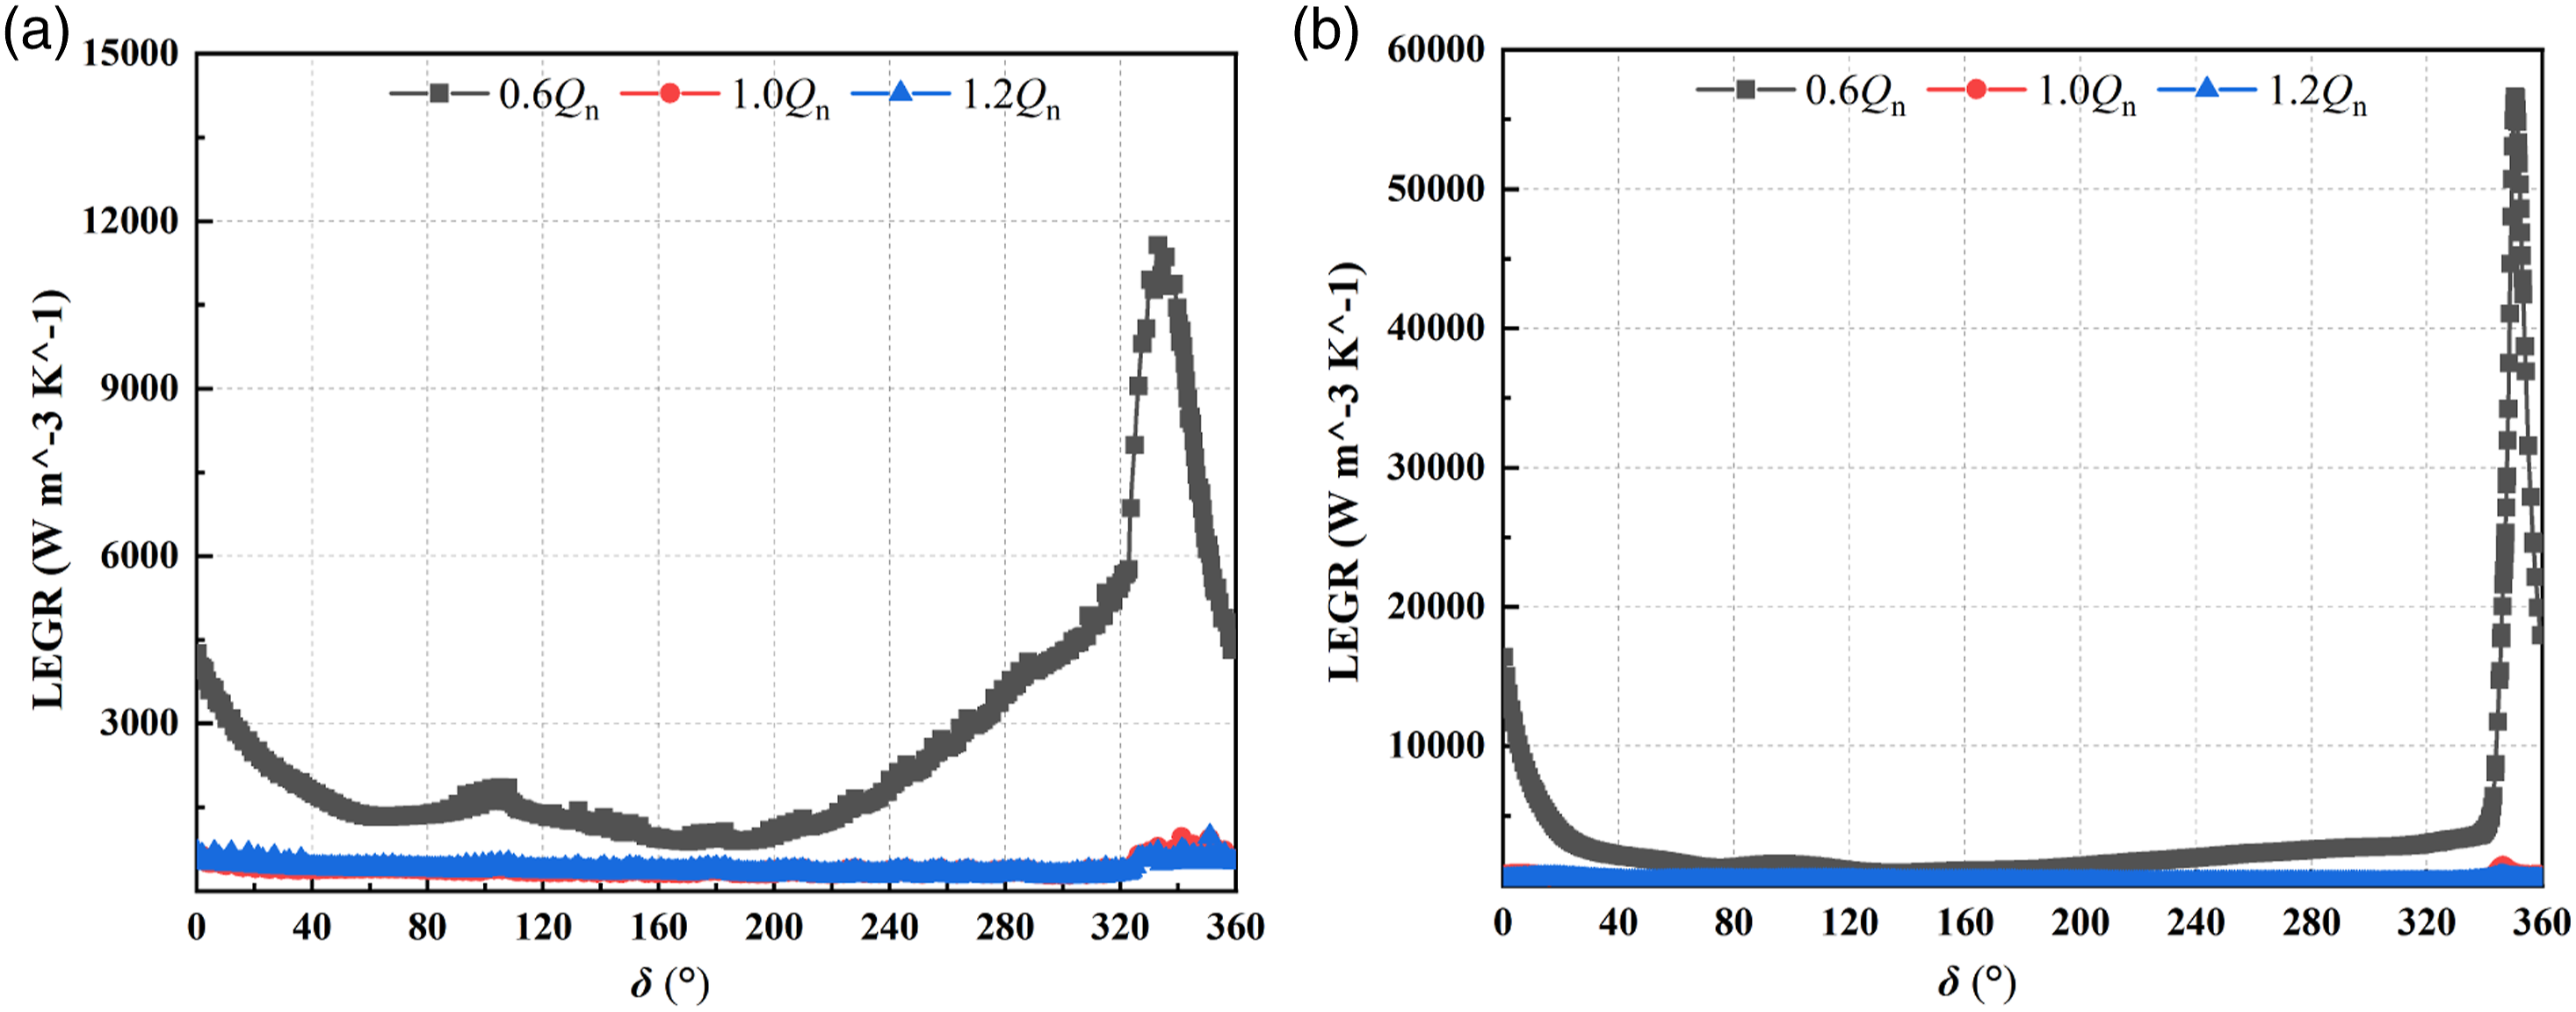
On the curve of R1=210 mm, the strength of LEGR is closely related to the circumferential position. Within the angle of δ=0° to δ=180°, points on the curve gradually move away from the tongue, and the magnitude of LEGR drops accordingly with slight fluctuation. Within the angle of δ=180° to δ=330°, points on the curve move towards the tongue steadily, leading to a surge in the magnitude of LEGR. Surprisingly, when the points get closer to the tongue, the magnitude of LEGR on the curve falls rapidly as shown in Figure 18(a).
The change rule of LEGR on the curve of R=235 mm is similar to that of R=210 mm, yet the location of the peak value moves from δ=330° to δ=350°. Moreover, the curve of R=235 mm is closer to the wall of the volute, where the intensity of energy loss increases significantly.
Figure 19 demonstrates the wall EGR distribution in the volute casing under different operating conditions. The distribution of wall EGR in volute is quite uneven at the part-load flow rate. The region featuring high EGR is mainly predominant on the left-hand side of the volute near the tongue, while the regions on the right-hand side of the volute near the outlet possess fairly small wall EGR. With the increase of flow rate, the distribution of wall EGR grows more uniform, and the strength of wall EGR on the entire casing increases notably. Besides, the local high EGR region gradually moves towards the diffusion section along the impeller rotating direction which justifies that the total wall EGR in the volute increases to some extent. In the radial direction, high wall EGR primarily originates around the region near the interface, which is probably affected by the impact of fluids from the impeller exit. Wall EGR distributions of the volute at (a) 0.6 Qn, (b) 1.0 Qn, (c) 1.2 Qn.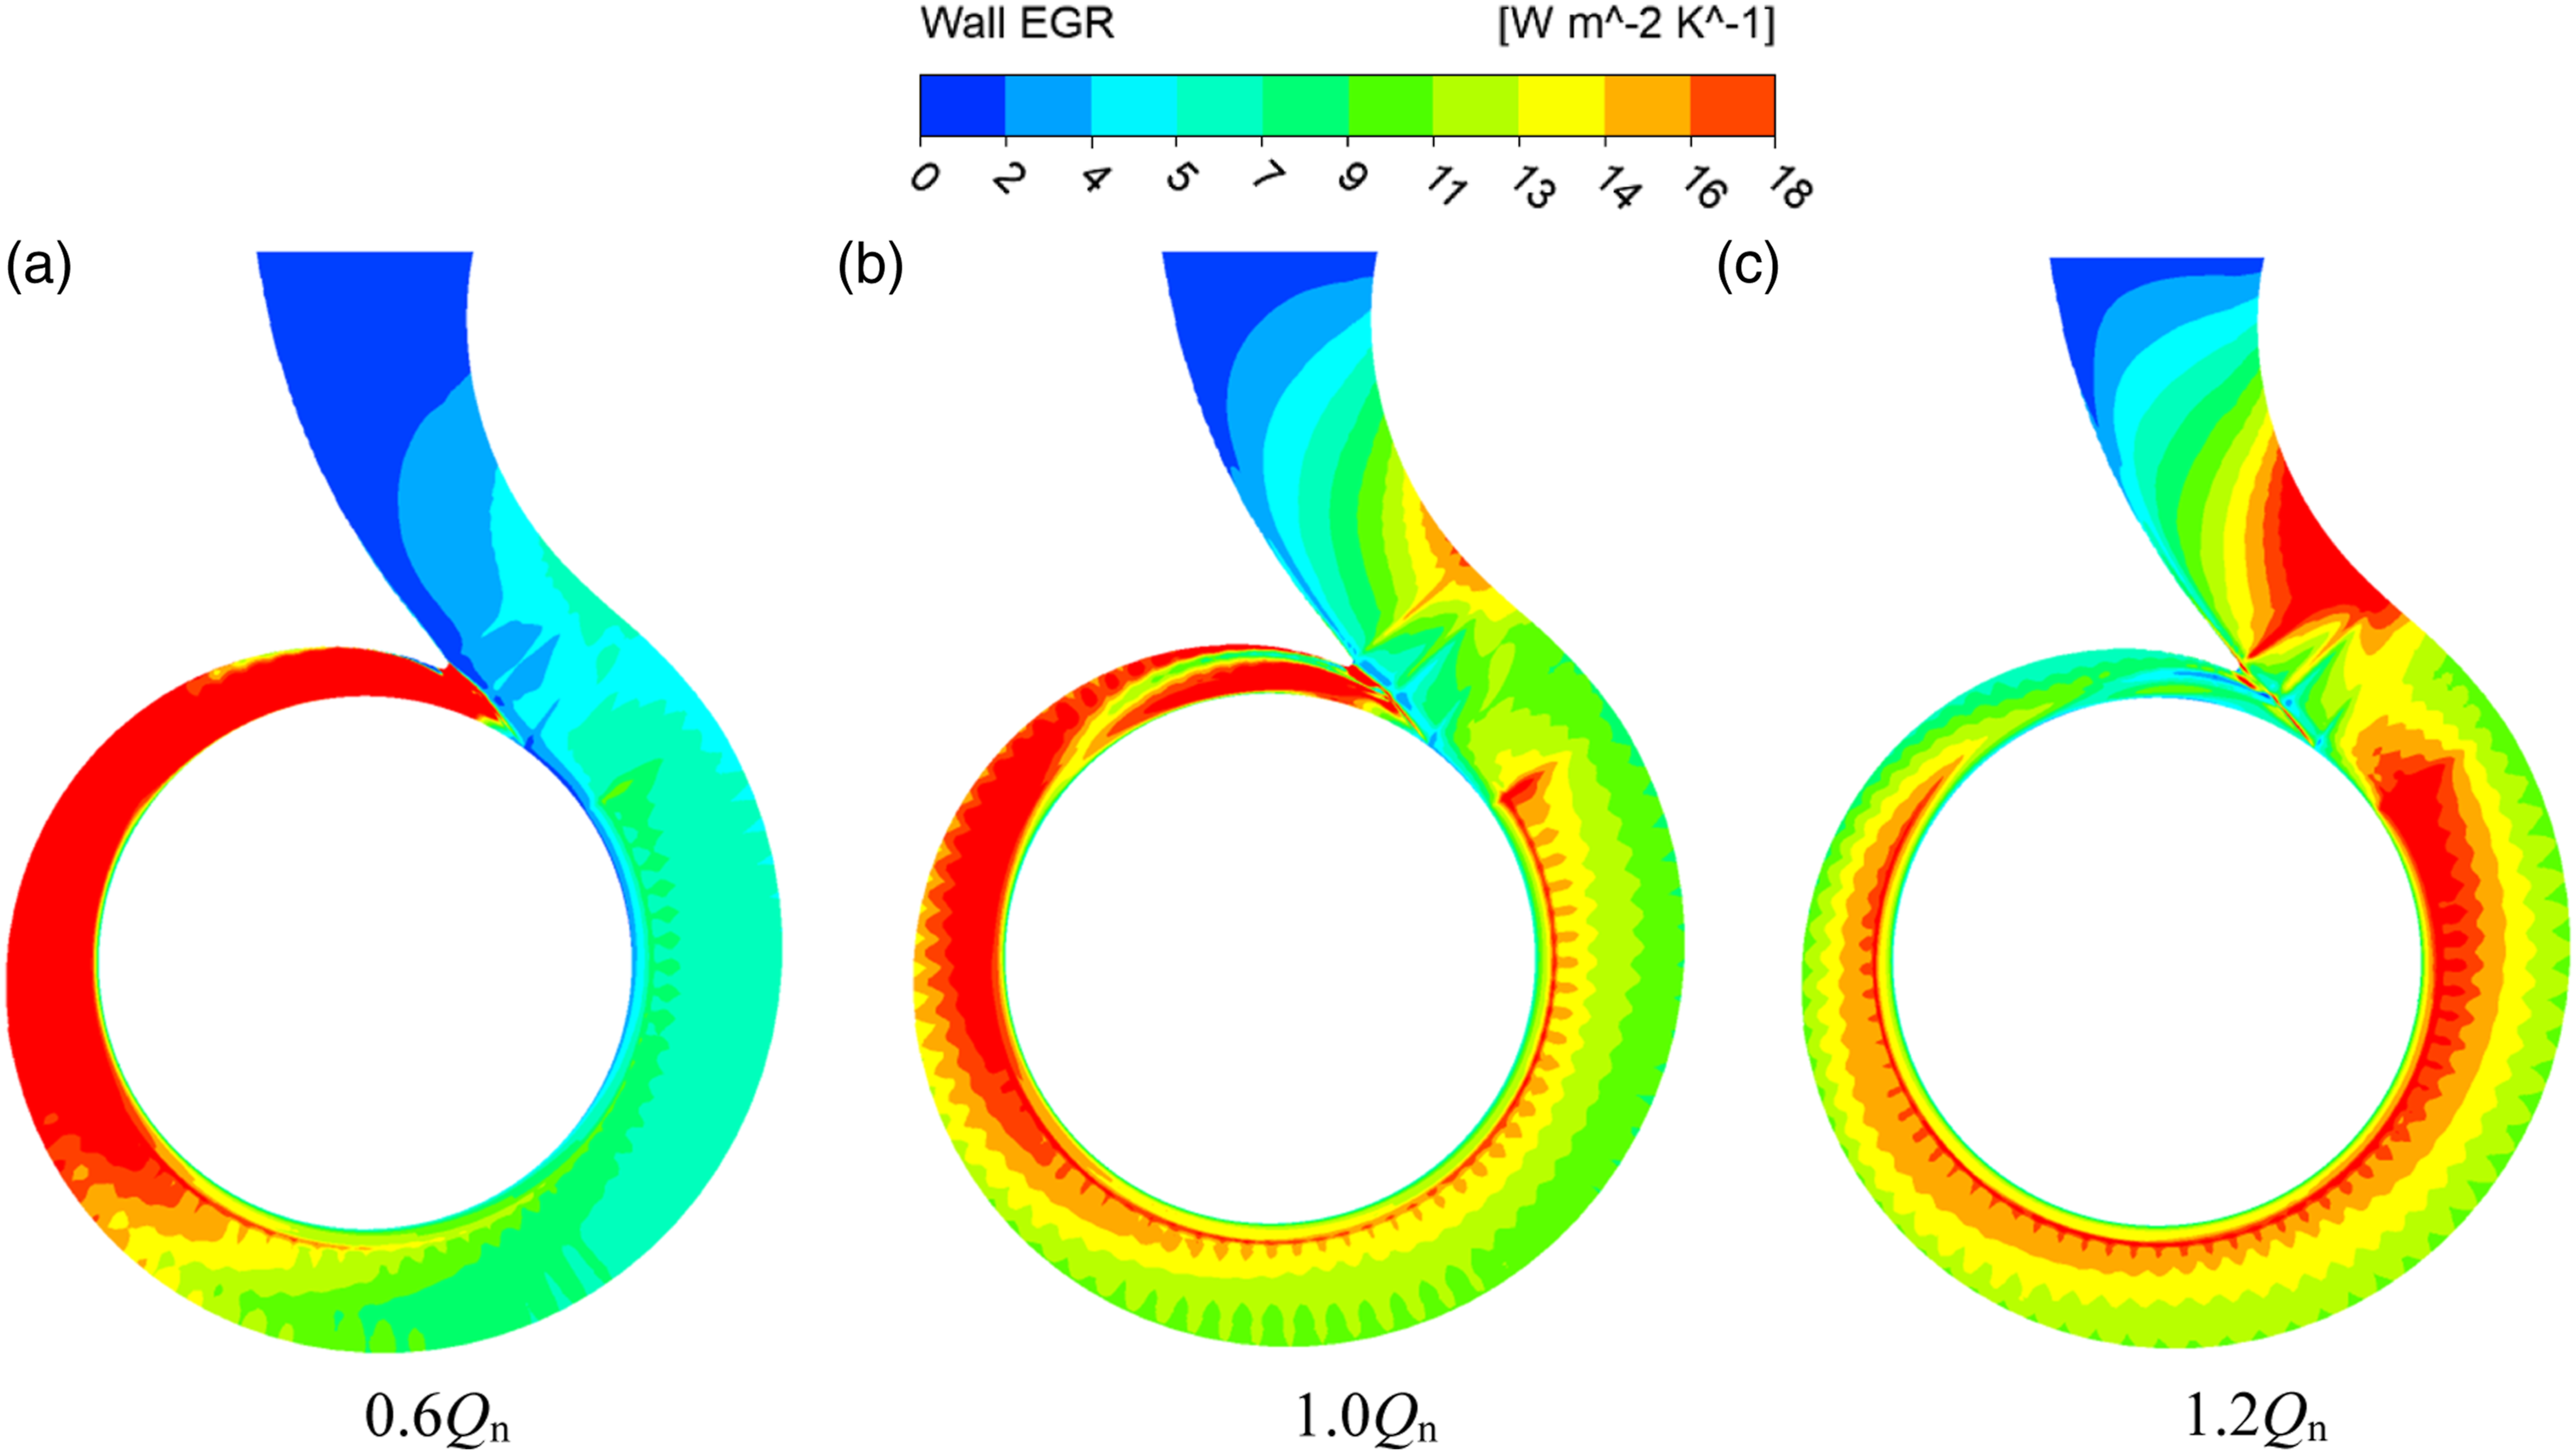
In summary, the variation law of wall EGR is totally different from the turbulent EGR. Under the combined effect of both conditions, the total energy loss in the centrifugal pump reaches the minimum at the design point, which corroborates with the findings shown in Figure 5.
Change trend of turbulent dissipation loss
In the previous analysis, It is found that turbulent dissipation entropy accounting for a relatively large proportion of total entropy production at all flow rates. To clearly present the variation characteristics of internal flow loss in the pump, a dimensionless loss coefficient is defined by normalizing the turbulent dissipation term as expressed in equation (12):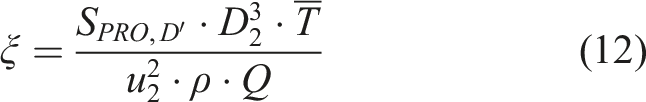
Taking four monitoring points at the high LEGR region of the impeller and volute as shown in Figure 20(a), (b) respectively. The flow loss at these points was recorded at the mid-span of the pump. Monitoring points at high EGR region in (a) impeller, (b) volute.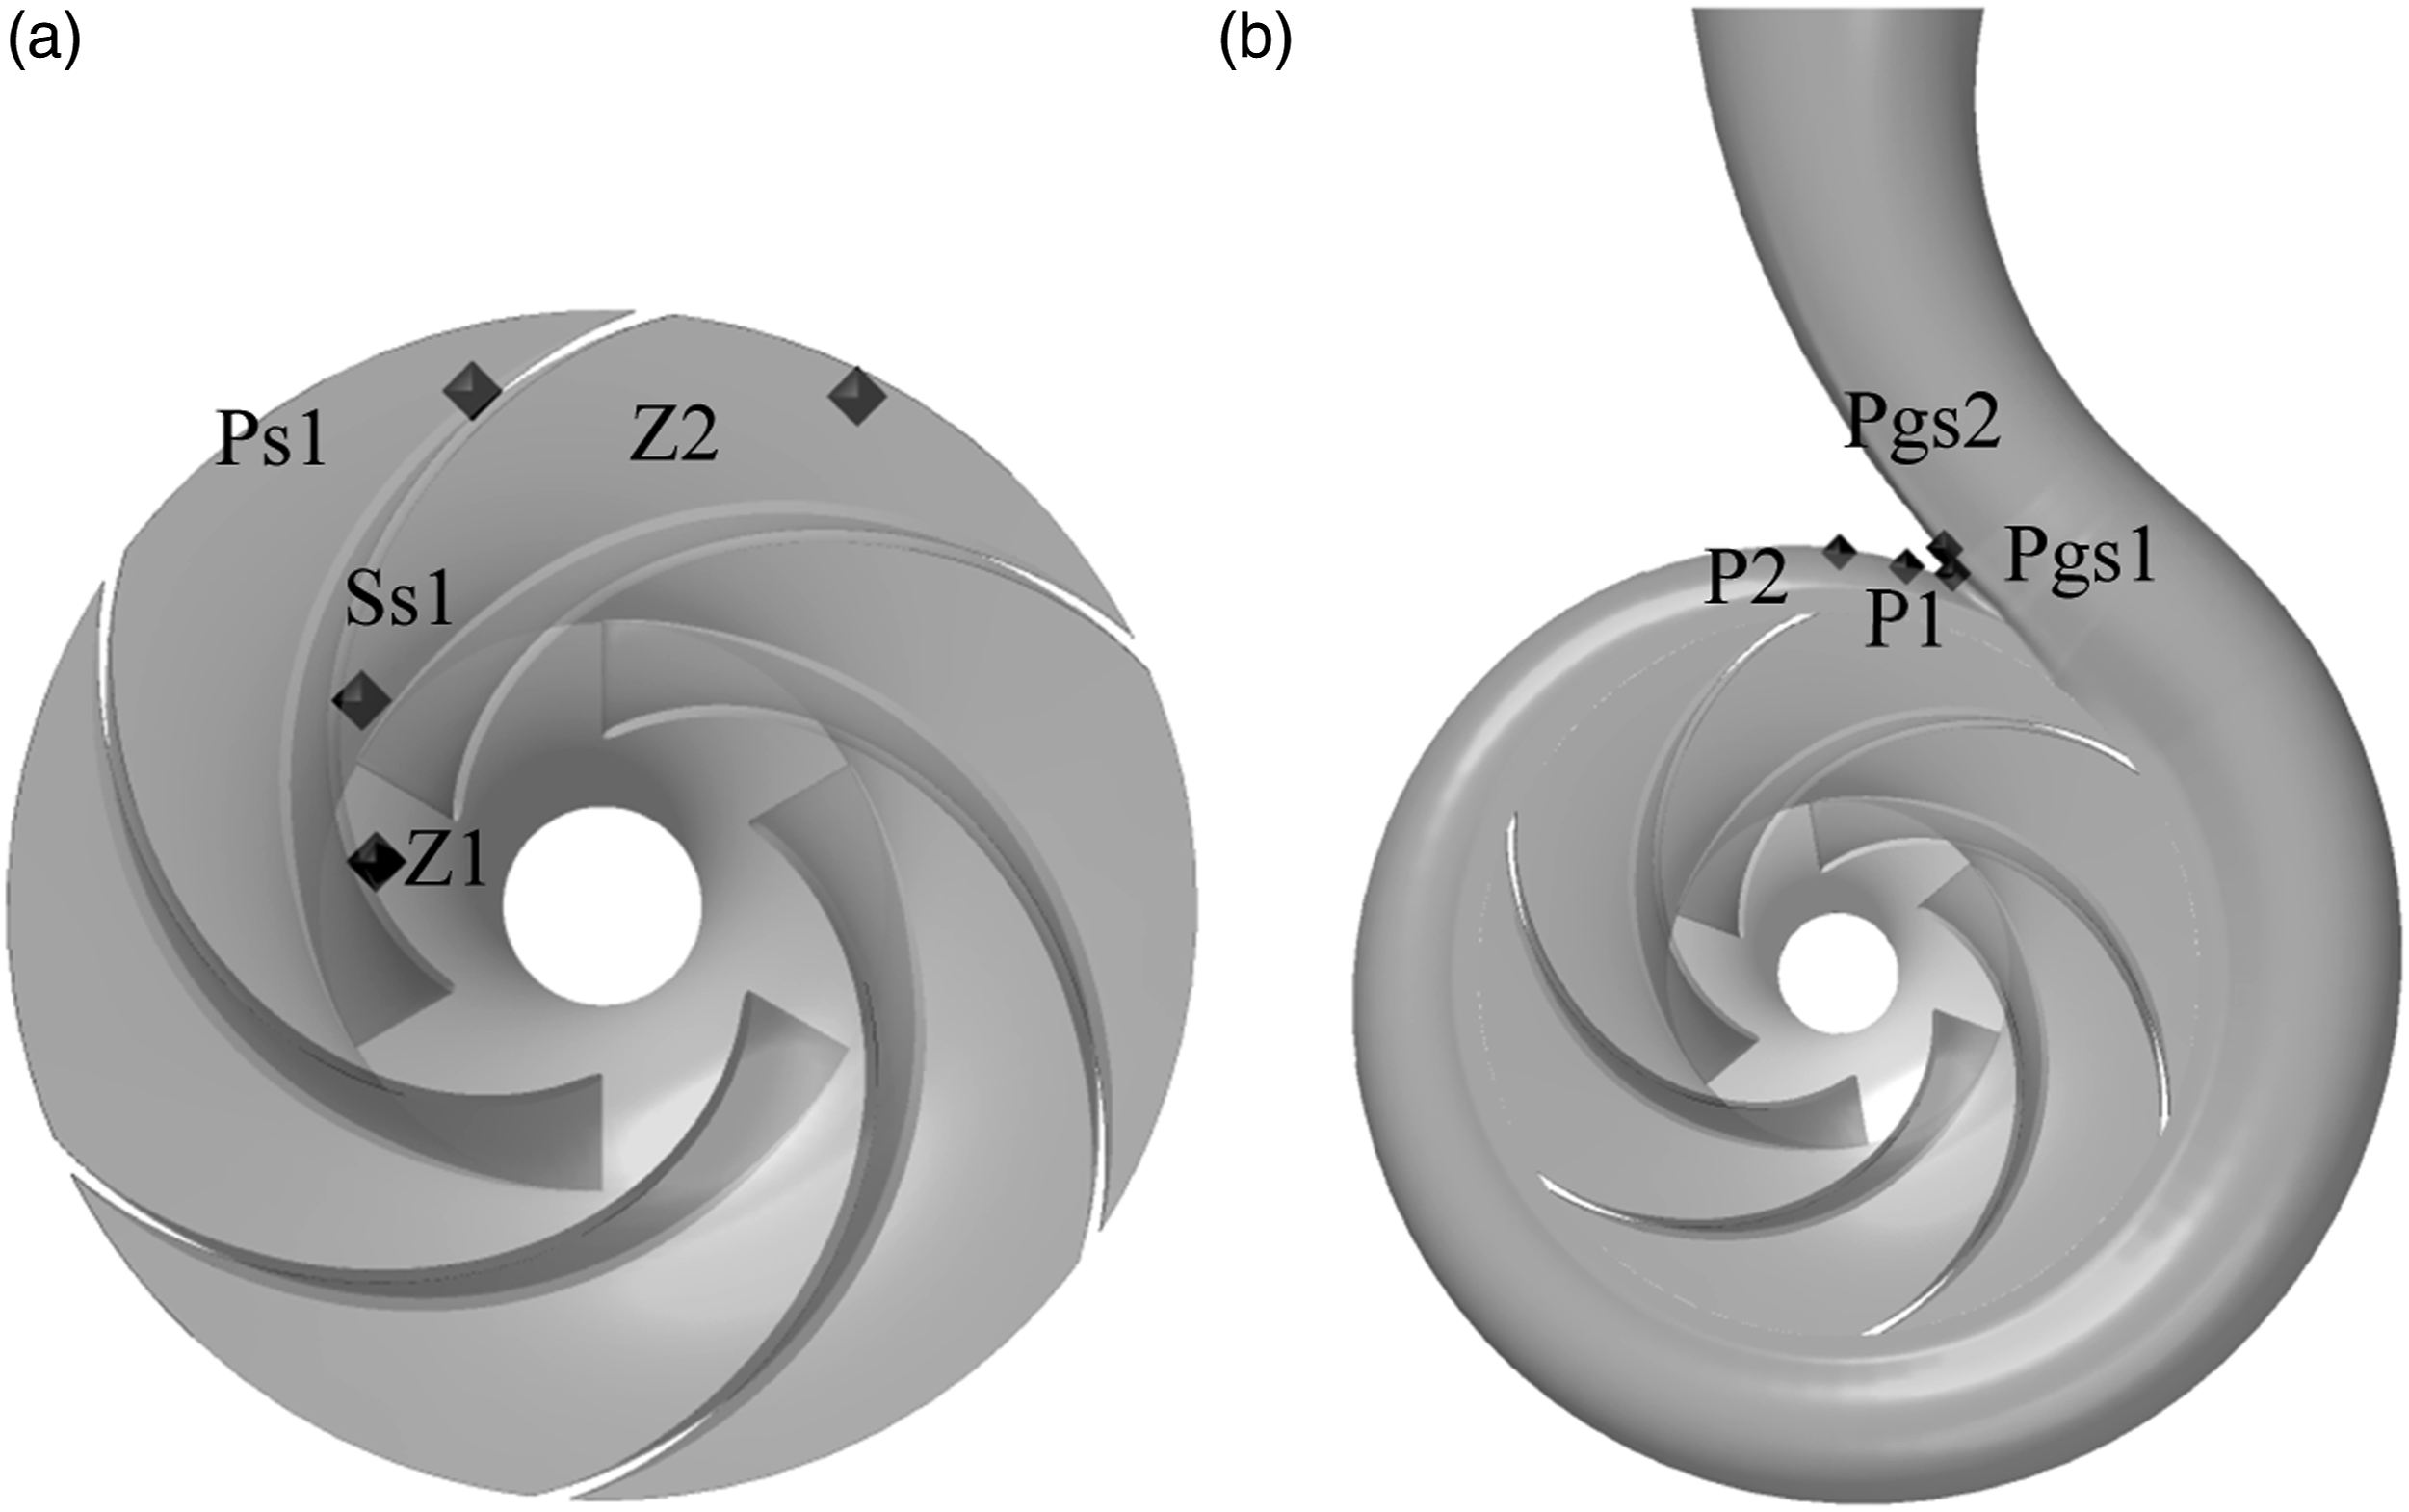
During a rotation period of the impeller, the loss coefficient Turbulent loss at the monitoring points in the impeller at (a) 0.6 Qn, (b) 1.0 Qn, (c) 1.2 Qn.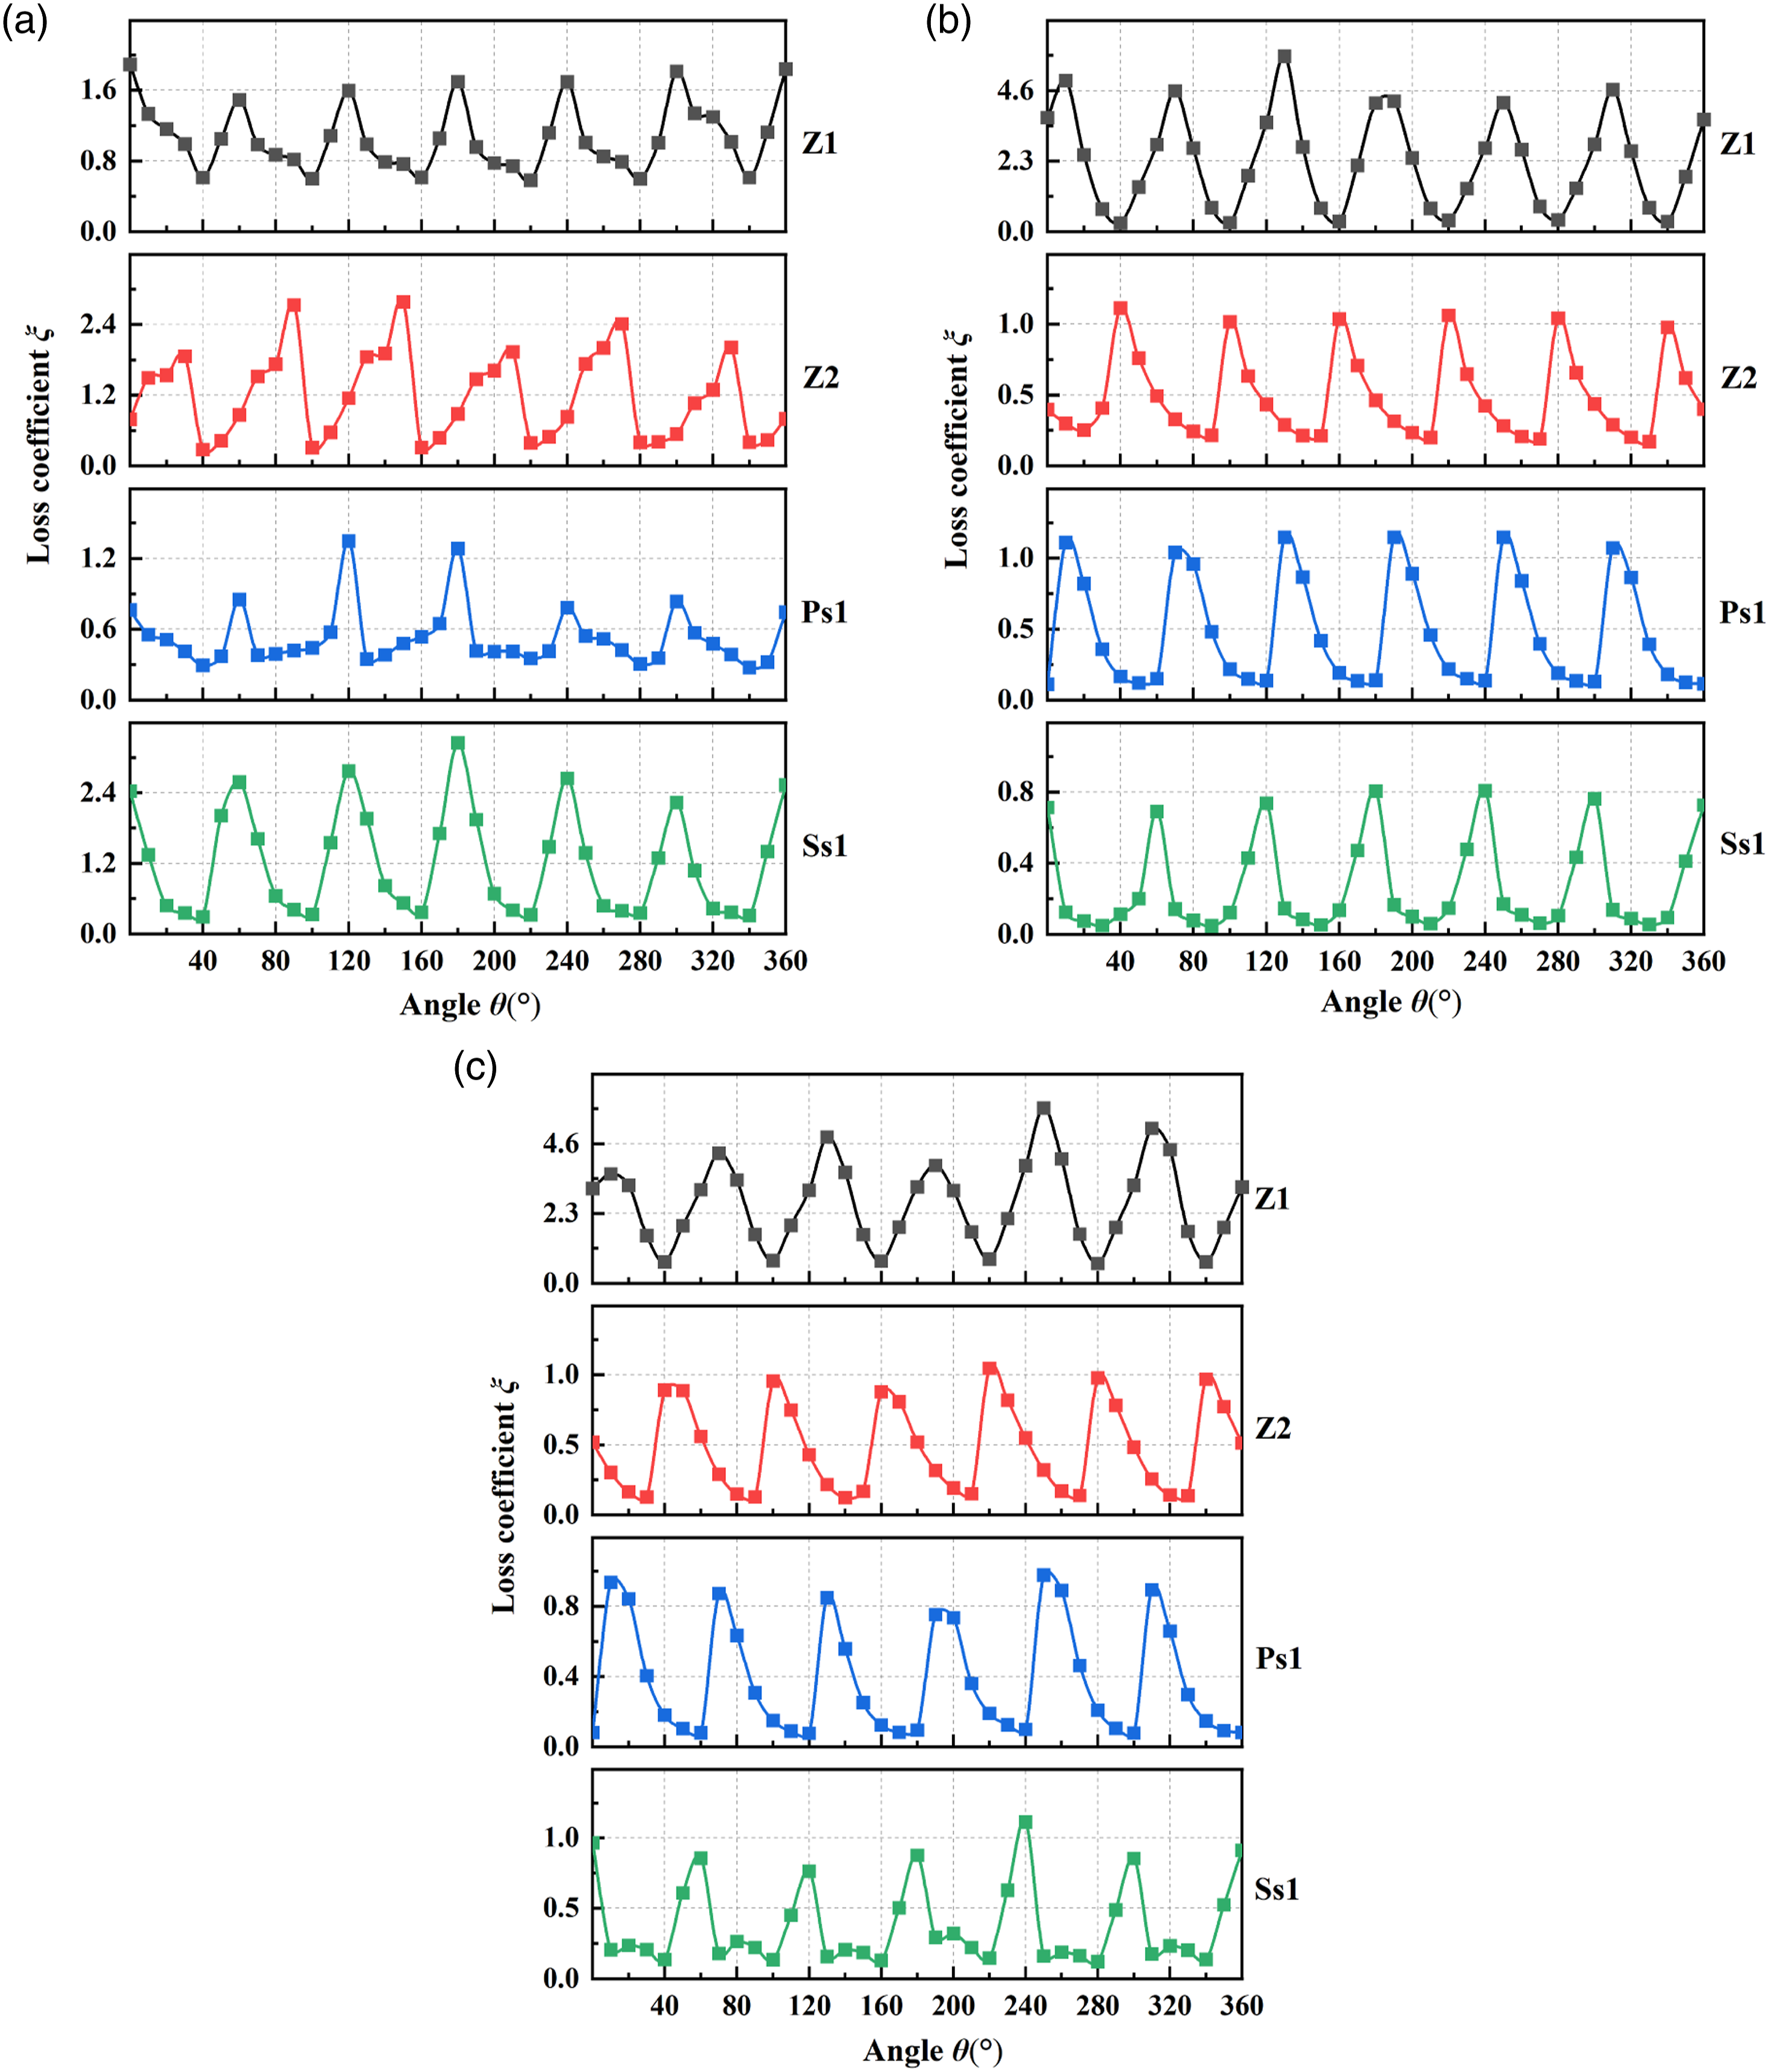
It is evident that the
When the flow rate raises to 1.0Qn, the variation trend of
Figure 22 displays the loss coefficient Turbulent loss at the monitoring points in the volute at (a) 0.6 Qn, (b) 1.0 Qn, (c) 1.2 Qn.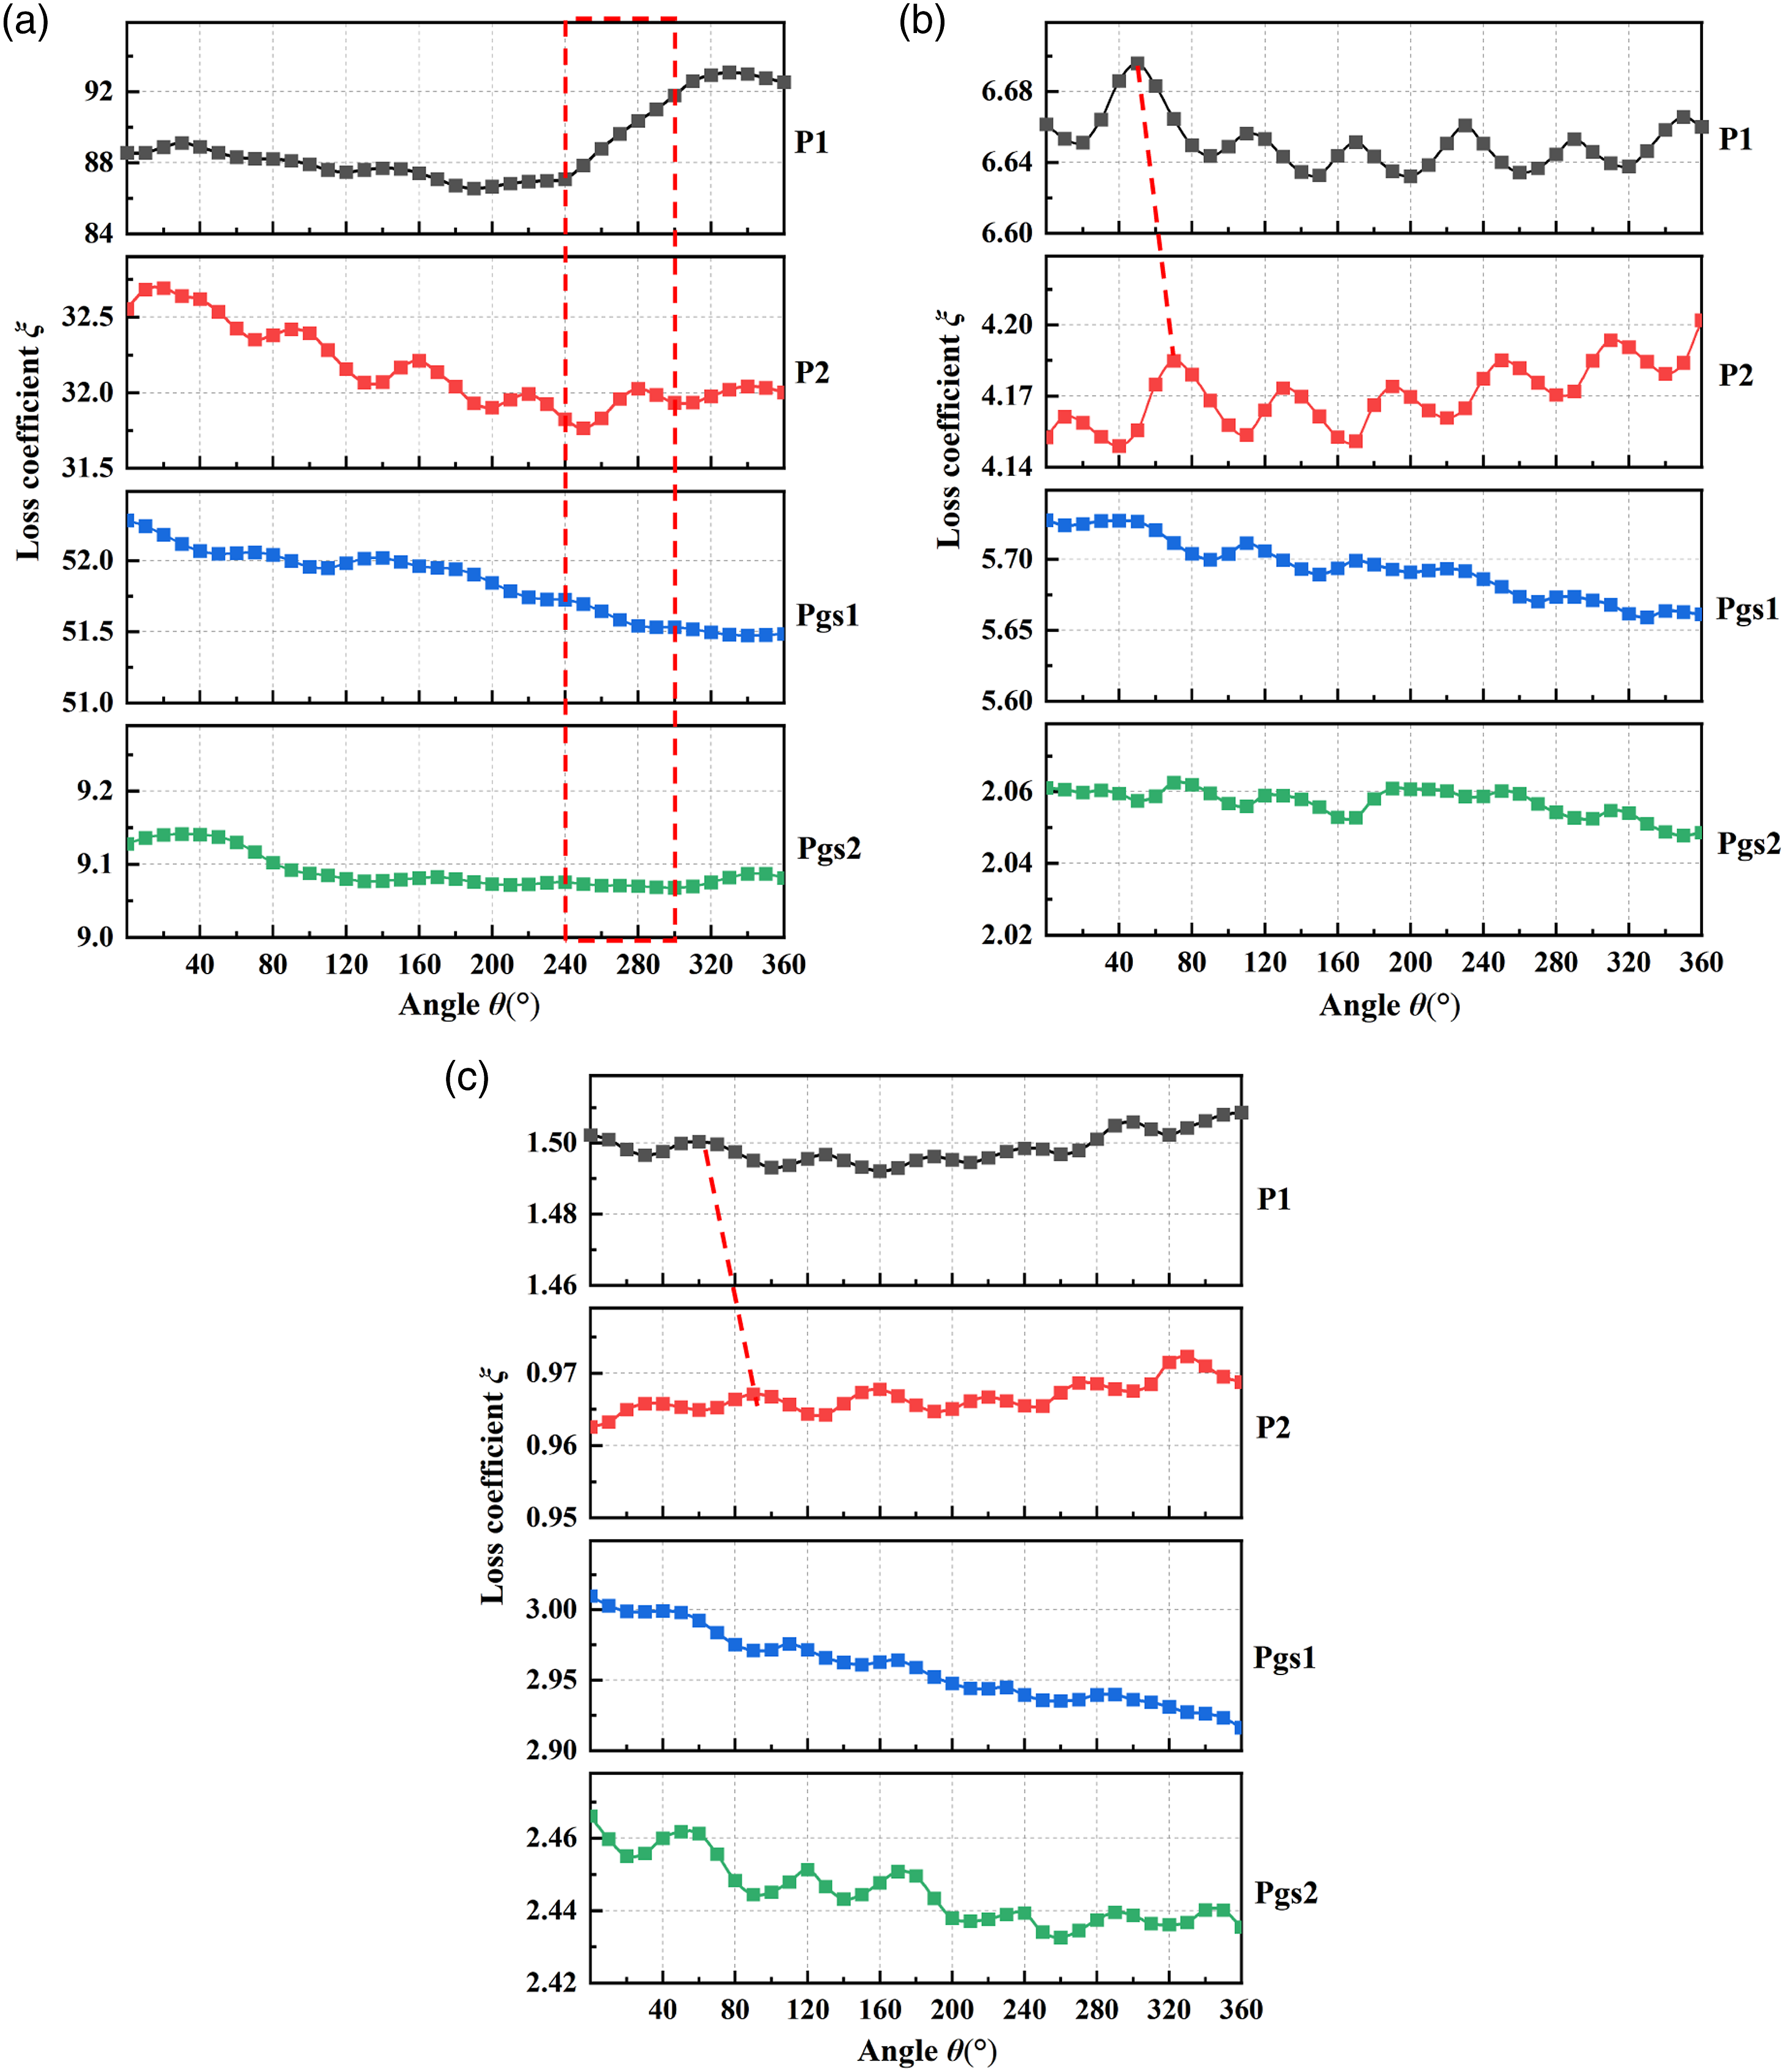
At the nominal flow rate, the magnitude of
As the flow rate continued to increase from 1.0 Qn to 1.2 Qn, the flow loss in the volute presents different patterns. The strength of
In summary, at both rated and over-load operating conditions, the loss coefficients of all monitoring points revealed relatively small amplitude which are periodic. At partial load conditions, the periodicity of
Vorticity distribution and evolution processes at 0.6 Qn
The isosurface of Omega=0.52 on the pump during a blade passing period is displayed in Figure 23. During the period of blade rotate from 250° to 300°, the vortex clusters α is constantly stretched and divided into two parts by the tongue as seen in the β region and γ region. With the impeller rotating, vorticity region β flows towards the diffusion section with lower velocity. It can be seen that the velocity of the fluid in the diffusion section is relatively uniform, which explains the lower flow loss at Pgs2 under part load working conditions. Vorticity region γ flows back to the downstream channel of the volute and gains higher velocity. The high-speed vorticity sheet γ mixes and exchanges momentum with the low-speed vorticity sheet δ from the impeller, resulting in high flow loss at the relevant locations as mentioned above. Meanwhile, the high-speed vortical fluid constantly approaches the wall and increases the velocity of the vortices near the wall, thus causing the flow loss of P1 to undergo a constant increasing trend from the initial instant. Omega isosurface of the pump for six consecutive angle positions at 0.6 Qn. (a) T = 0°, (b) T = 10°, (c) T = 20°, (d) T = 30°, (e) T = 40°, and (f) T = 50°.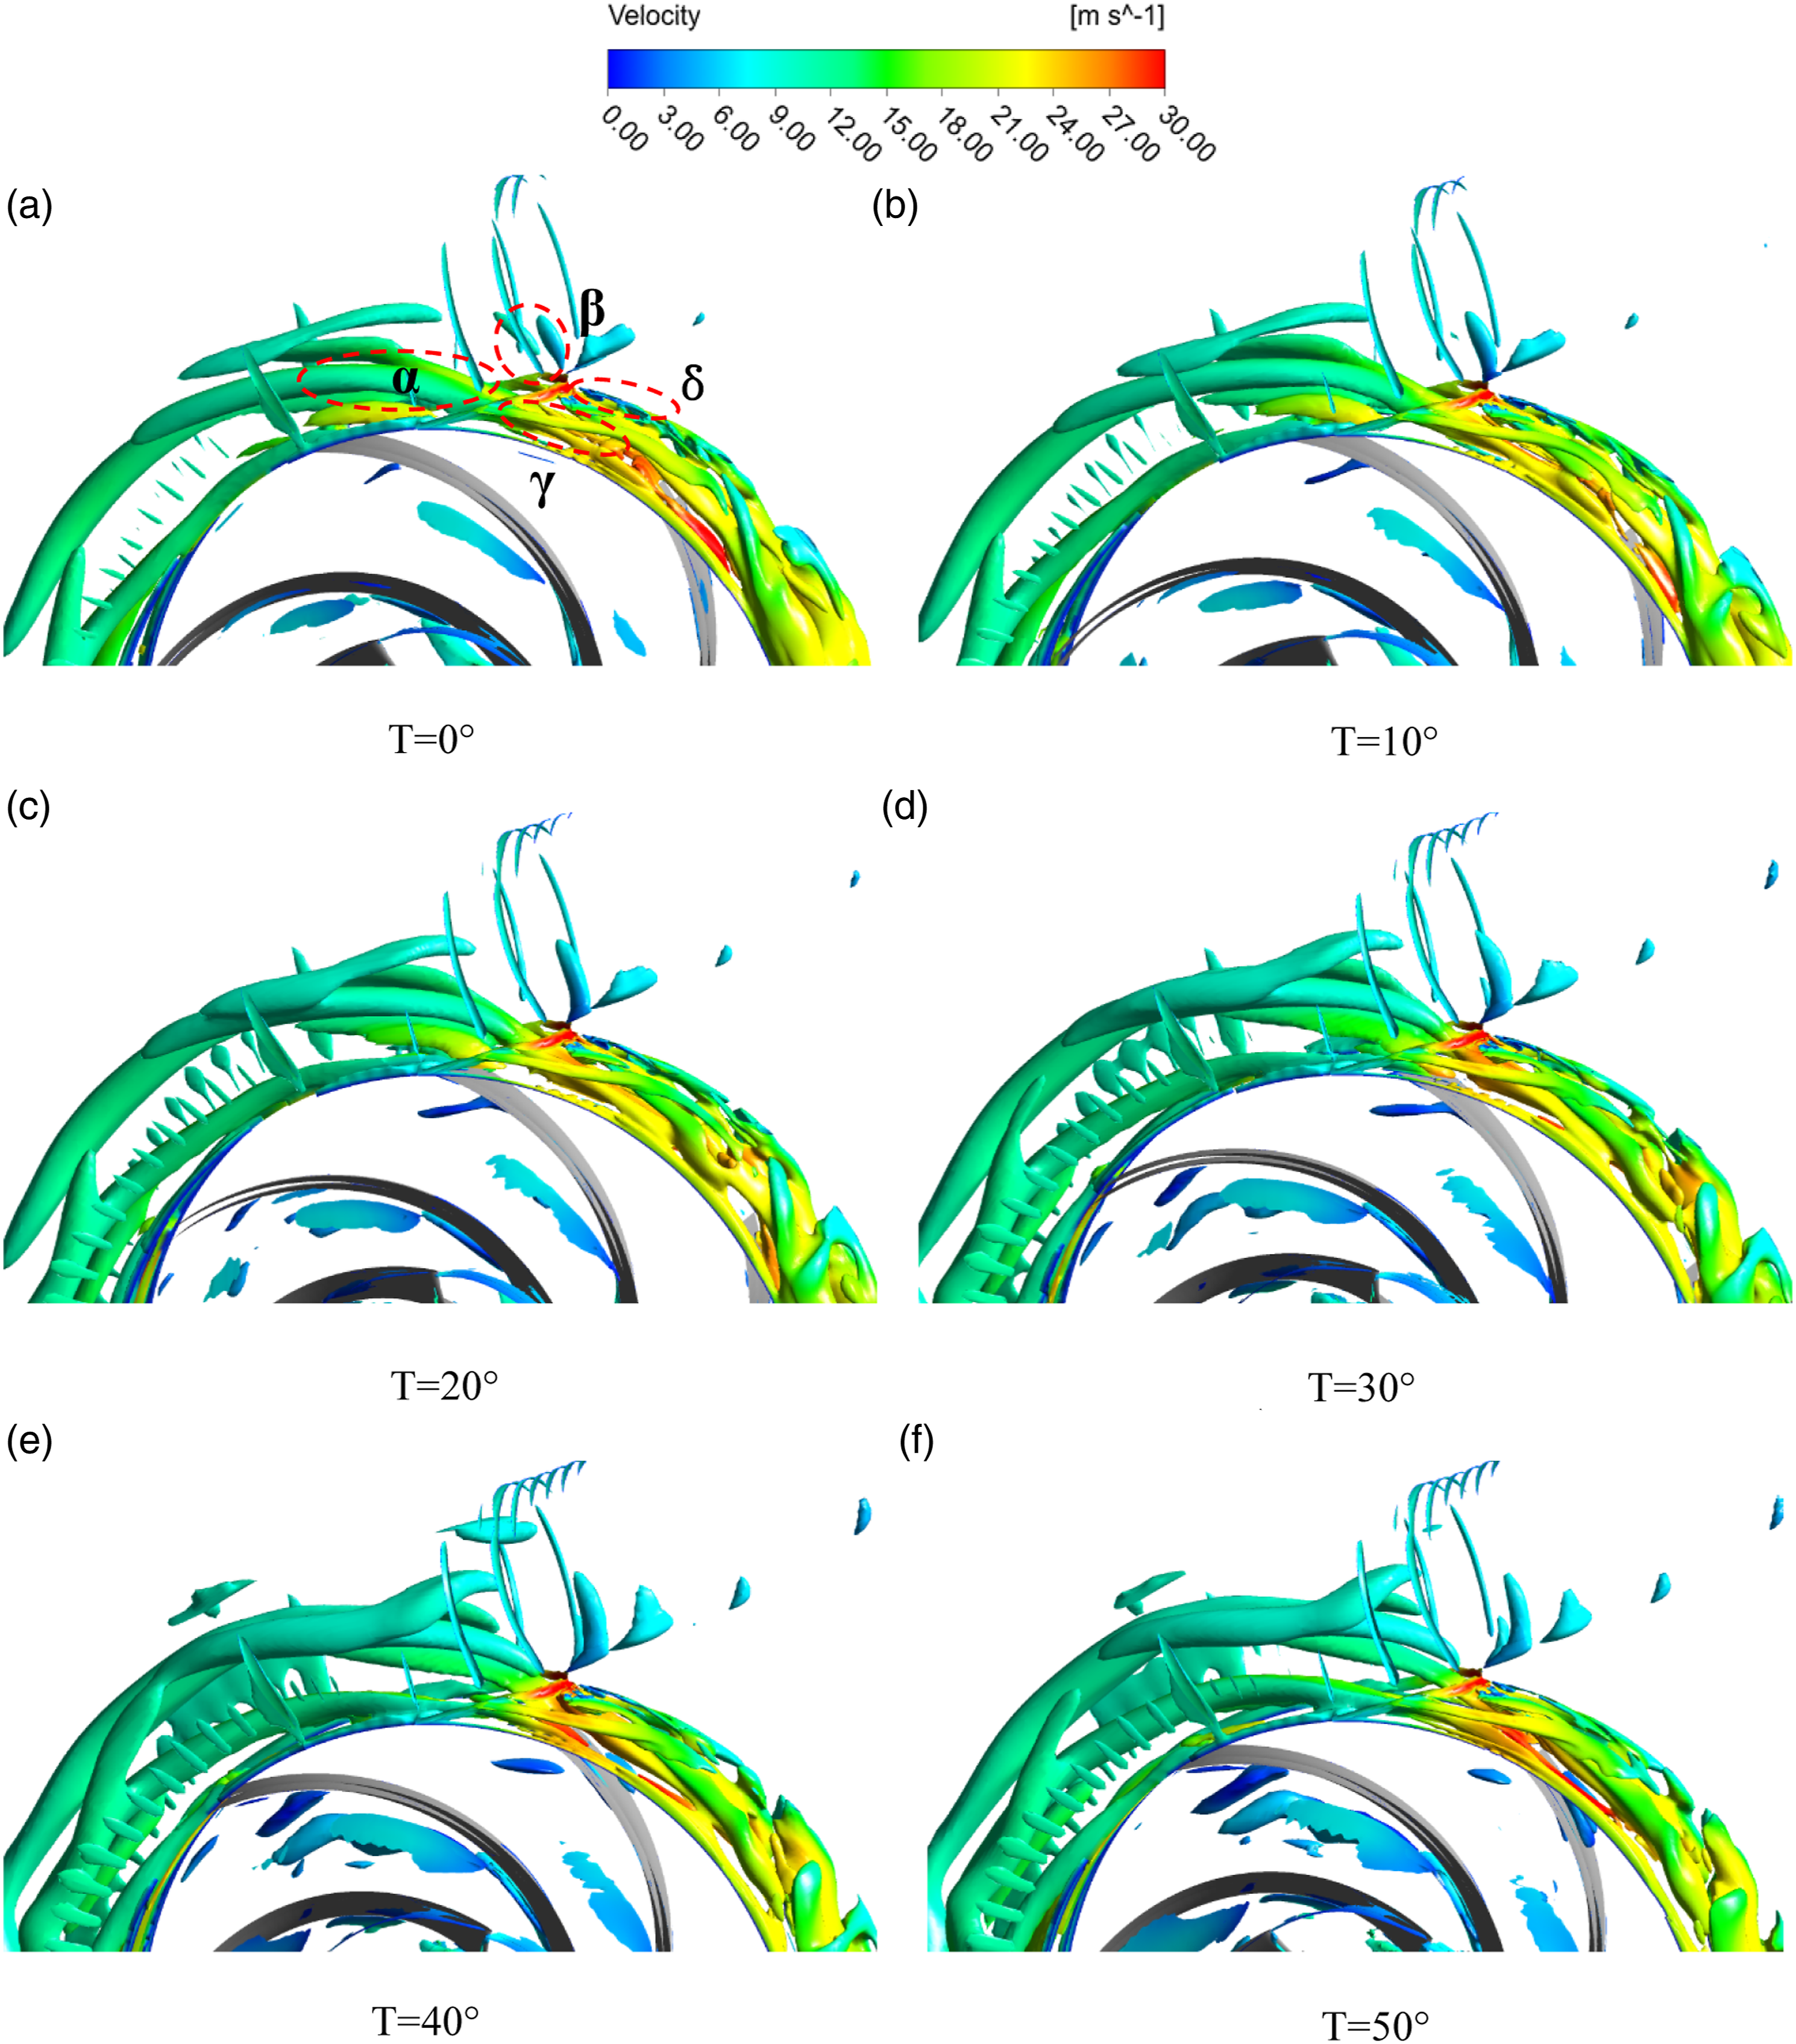
From T=0° to T=30° instants, the low-speed vortices δ at P1 continuously fall off and interacts with the fluid at P2, resulting in a slight increase in flow loss at P2 as shown in Figure 22. With the blade moving to T=40° and T=50° instants, the area of vorticity sheet δ decreases slightly, and the shed vortices moves away from P2, As a consequence, the magnitude of flow loss at P2 gradually decreases during this period. It can be concluded that the high-loss regions in the pump are closely associated with the periodic evolution of the vortex at the partial flow rate. Therefore, the flow pattern of the pump can be enhanced by optimizing the geometry of the volute tongue and blade trailing edge, which could effectively reduce the energy loss of the pump.
Conclusions
In this study, the distribution of energy loss in the main components within the centrifugal pump was investigated based on entropy generation theory. Attention is attracted on the relationship between the change characteristics of entropy generation and unstable flow structure, which can provide theoretical evidence for the design and optimization of centrifugal pumps. The main conclusions can be drawn as follows: (1) The energy loss in the centrifugal pump is mainly associated with the entropy generation caused by turbulent dissipation and wall viscous friction. At 0.6 Qn, the entropy generation caused by turbulent dissipation and wall friction accounts for about 75.77% and 24.06% of the total entropy generation. When the flow rate increases to 1.2 Qn, the proportion of the two attains 52.03% and 47.51%, respectively. Therefore, the entropy generation caused by direct dissipation could be ignored in the present study. (2) The volute and impeller are the main components that generate the dominant irreversible loss in the centrifugal pump. The regions characterizing high LEGR in the volute mainly emanate at the wall of the volute and near the tongue, which are induced by non-uniform velocity distribution and the shedding vortices from the impeller exit. Notably, the vortex core possesses fairly low LEGR, which indicates that the energy loss mainly comes from the shearing effect between the low-speed vortical fluid and the surrounding high-speed fluid. Under partial load conditions, the regions with high LEGR occur at the blade suction side and the impeller exit close to the tongue, which is greatly influenced by unstable structures such as flow separation, backflow, and vortex detachment in the passages. When the flow rate increases to the design point and beyond, the effect imposed by the inflow impacting and fluid shearing on flow loss is enhanced, thus resulting in higher entropy generation at the corresponding regions. (3) The wall entropy generation possesses a greater contribution to the energy loss with increasing flow rate. Under partial load conditions, the distribution of wall EGR in the volute is quite uneven, and the regions presenting high EGR are mainly dominant on the left-hand side of the volute near the tongue. However, this phenomenon was immensely improved under overload conditions. With regards to the impeller, the regions with high wall EGR primarily distribute around the leading edge of the blade suction surfaces and the trailing edge of the pressure surfaces. Additionally, the strength and distribution range of the wall EGR increases notably as the flow rate increases. (4) Under both nominal and over-load flow conditions, the flow loss at all monitoring points exhibits a more significant periodicity with lower strength. However, at the part-load operating conditions, the loss of the monitoring points near the tongue grows drastically and shows an irregular changing trend. By analyzing the internal vorticity field of the model pump, it is observed that the magnitude of the loss coefficient at the mentioned monitoring points is greatly affected by the evolution of several strong vorticity sheets near the tongue.
Footnotes
Acknowledgements
The experiment was conducted on the Shang Hai Kai Quan Pump Industry(Group) Co.,Ltd. We would like to thank for their kind support.
Declaration of conflicting interests
The author(s) declared no potential conflicts of interest with respect to the research, authorship, and/or publication of this article.
Funding
This research is supported by National Natural Science Foundation of China (Grant No.52279086) and Yunnan Provincial Ranking the Top of the List for Science and Technology Projects of China (Grant No. 202204BW050001).