
Abstract
The forward-curved multi-blade centrifugal fan, also termed as Sirocco fan, is characterized by its complex characteristics of internal flow within the impeller and volute. Currently most of the fans are designed with modifications or optimizations for certain geometric parameters which could not ensure the well compatibility of flow in the impeller and volute, thus it is difficult to improve the aerodynamic performances of the fans. In this paper, we performed a multi-parameter design of a Sirocco fan with optimizations on the geometric parameters of the impeller and volute. The geometric parameters of the volute were designed based on analysis of the internal flow patterns, and the influence from the impeller is also considered. Optimization on the geometric parameters was carried out using the steepest descent method to improve the static pressure rise and efficiency under the designed flow rate by taking into account the relevance of flow in the impeller and volute. The effect of the parametric optimization is evaluated and analyzed by large-eddy simulation (LES). It was found that the static pressure rise and efficiency of the optimized model increase by 1.8% and 5.0% compared with the baseline model, respectively. The static pressure rise fluctuates in a regularly periodic manner. The optimized model reduces the area of low-pressure recirculating flow at the center of the fan and the separated flow on the suction surface of the blades. The near-wall flow on the volute surface is more stable, and the pressure fluctuation around the volute tongue is reduced. The outflow of the volute exhibits better uniformity than the baseline model.
Introduction
The forward-curved multi-blade centrifugal fans, which are also termed as Sirocco fans, are widely used in circumstances of ventilation, air supply and conditioning, etc. The aerodynamic performances of the fan, such as static pressure rise and efficiency, reflect the capability of the fan in driving the air circulating in the ventilation system, thus are important and improved in the design and optimization of the fans.
The characteristics of internal flow in the Sirocco fans were investigated in a number of numerical and experimental works to explore the effect of specific geometric features of the impeller. Ni et al. 1 studied the influence of installation angle of V-shaped blades on the aerodynamics performances of a Sirocco fan. The V-shaped blades were designed and installed in parallel with the shaft of the fan. The optimized value for the installation angle was obtained. Lee and Lim 2 performed an experimental and numerical study to compare the geometry of blades, i.e., S-shaped, straight, and ribs on the leading and trailing edges of the blades, on the performance of the fan. It was found that the blades with ribs at the leading edges produce the best operational performance. Kim et al. 3 conducted a numerical study on the internal flow of a centrifugal fan with splitter blades. The results showed that by changing the number of main blades and splitter blades, the area of recirculating flow in the blade passages can be effectively reduced. Wang et al. 4 proposed a blade trimming technique focusing on axial modification of blade inlet in an attempt to improve the flow condition within the impeller and aerodynamic performance of the fan. Both full trimming and part trimming are applied. It was found that the blade trimming with proper parameter enables the fan to achieve higher aerodynamic performance in terms of total pressure efficiency and static pressure rise. Similar technique was also applied for a high-pressure compressor. 5 More et al. 6 numerically and experimentally studied the influence of blade thickness and rotational speed on the impeller performance. The results showed that blades with appropriate thickness reduce the noise and vibration of the impeller under maximum rotational speed. Walsh et al. 7 explored the effect of diameter and width of the impeller and evaluated the applicability of conventional similarity theorem as the shape and size of the impeller are scaled. Karanth and Sharma 8 numerically and experimentally studied the effect of radial clearance of the impeller. The data showed that with optimal radial clearance, the efficiency of the fan can be improved. Tai et al. 9 proposed a method to redesign the impeller and its inlet passage, which satisfies the pressure requirement and also reduces the power by 8.8%. Kim et al. 10 conducted a parametric optimization study on the impeller of the forward-curved blade centrifugal fan. Fan et al. 11 carried out an orthogonal optimization design for several parameters including the inlet angle, outlet angle and inflation angle of the blade. The efficiency and total pressure are significantly improved after optimization. Wu et al. 12 found that the vortices in the blade passages and exiting flow at the blade outlet are significantly determined by the angle of attack of the blade, and the performances of the fan can be improved by choosing appropriate values of the angle of attack. Wang et al. 13 proposed a novel representation technique for a quantitative description of the flow velocity distributions at the impeller inlet and outlet to aid a heuristic analysis of the complex flows in squirrel cage fan. The representation technique is capable of effectively measuring the circumferentially non-uniform flow conditions at both the impeller inlet and outlet. Yu et al. 14 performed numerical investigation on the influence of blade inlet angle and the clearance between impeller and inflow section on the performance of the fan, and a set of optimal solutions were found to improve the static pressure rise and efficiency. Heo et al. 15 studied the flow in a squirrel cage fan and optimized the parameters of inlet-outlet diameter ratio of the impeller and blade outlet angle for improved aerodynamic efficiency.
The geometry of the volute also has great influence on the internal flow of the Sirocco fan. A number of geometrical specifications, such as the geometry of the cross-section and its circumferential variation, the geometry of the collector and volute tongue. Zhou and Li 16 performed an optimum design of the spiral case of the volute based on momentum distance correction method, and found obtained more uniform radial velocity field at the outlet of the fan. Lu et al. 17 proposed an optimization method for the volute to reduce the vibration and noise of the centrifugal fan. Hariharan and Govardhan18,19 carried out a numerical study on the aerodynamic performance and flow characteristics of an industrial centrifugal blower with different volutes. The numerical data suggest that the volute with parallel walls improves the efficiency of the centrifugal fan and reduces energy consumption. In the work of Baloni et al., 20 the performance of centrifugal blower is enhanced with an optimization process on the volute using Taguchi method and ANOVA approach. Lv et al.21,22 found that the volute width should be comprehensively determined according to other parameters. An appropriate width could improve the uniformity of the flow field within the fan and the fan performance. A design method for the volute radius with flow-correcting coefficients and an area factor was proposed. Moreover, there were a number of researches on the design and optimization of the volute profile and the reverse design of the volute of centrifugal fans.23–27
The literatures reviewed above demonstrate the attempts in the design and optimization of impeller and volute in various types of centrifugal fans based on the understandings of the characteristics of internal flow. Since there are multiple blades in the impeller, the blade passages are narrow with notable restriction on the through-flow, thus complex flow phenomena such as jet-wake structure, secondary flow and reversed flow form, and the exiting flow of the impeller also interacts with flow in the non-axisymmetric volute. The complex interaction of internal flow of various parts of the fan may generate energy loss and deteriorate the aerodynamic performances. So far most of the design of centrifugal fans only considers the optimization of a certain individual part, while the matching of the geometric specifications of multiple significant parts, i.e., impeller and volute, is not always taken into consideration, thus could not ensure the well capability of internal flows within those components.
In this work, we performed a parametric optimization of a Sirocco fan in which the matching between the impeller and volute are considered. The geometric specifications of the impeller are first analyzed; the steepest descent method is used to calculate the optimized blade installation angle under the designed flow rate. The profile of volute is determined based on the Archimedes spiral to be compatible with the geometry of the impeller, and to obtain the maximum static pressure efficiency. We carried out large-eddy simulations for the internal flow of the baseline and optimized Sirocco fans. The aerodynamic performances and characteristics of internal flow are presented and quantitatively analyzed in terms of the three-dimensional fields of pressure and velocity, the flow separation in the blade passages and the near-wall flow in the volute. The fluctuation of pressure and its propagation within the volute are also explored.
The paper is organized as follows. In the section of numerical methods, the physical model, mathematical model, solution method, grid independence study and validation are provided. In the section of parametric optimization of the impeller and volute, the procedures of parametric optimization of the impeller and volute, and the aerodynamic performances of the baseline and optimized models are exhibited. In the section of results and discussion, the characteristics of internal flow are analyzed in various aspects. Some conclusions are given in the last section.
Numerical methods
Model of baseline Sirocco fan
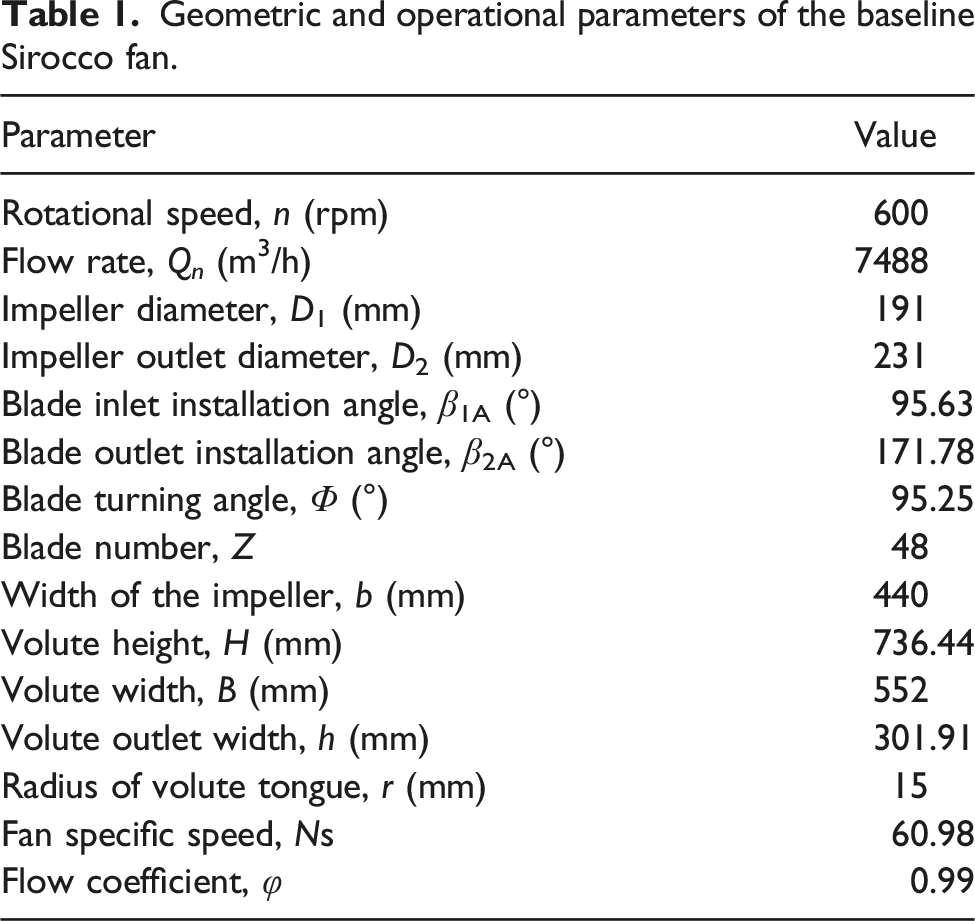
A Sirocco fan with multiple forward-curved blades is used in this work which has already been applied in ventilation circumstances. The Sirocco fan is shown in Figure 1 along with the physical model used in the following simulations. The air enters the fan from the collectors on the two lateral walls and exits from the fan at the outlet of the volute. The main geometric and operational parameters are listed in Table 1. Model of the baseline Sirocco fan: (a) Product; (b) Physical model. Geometric and operational parameters of the baseline Sirocco fan.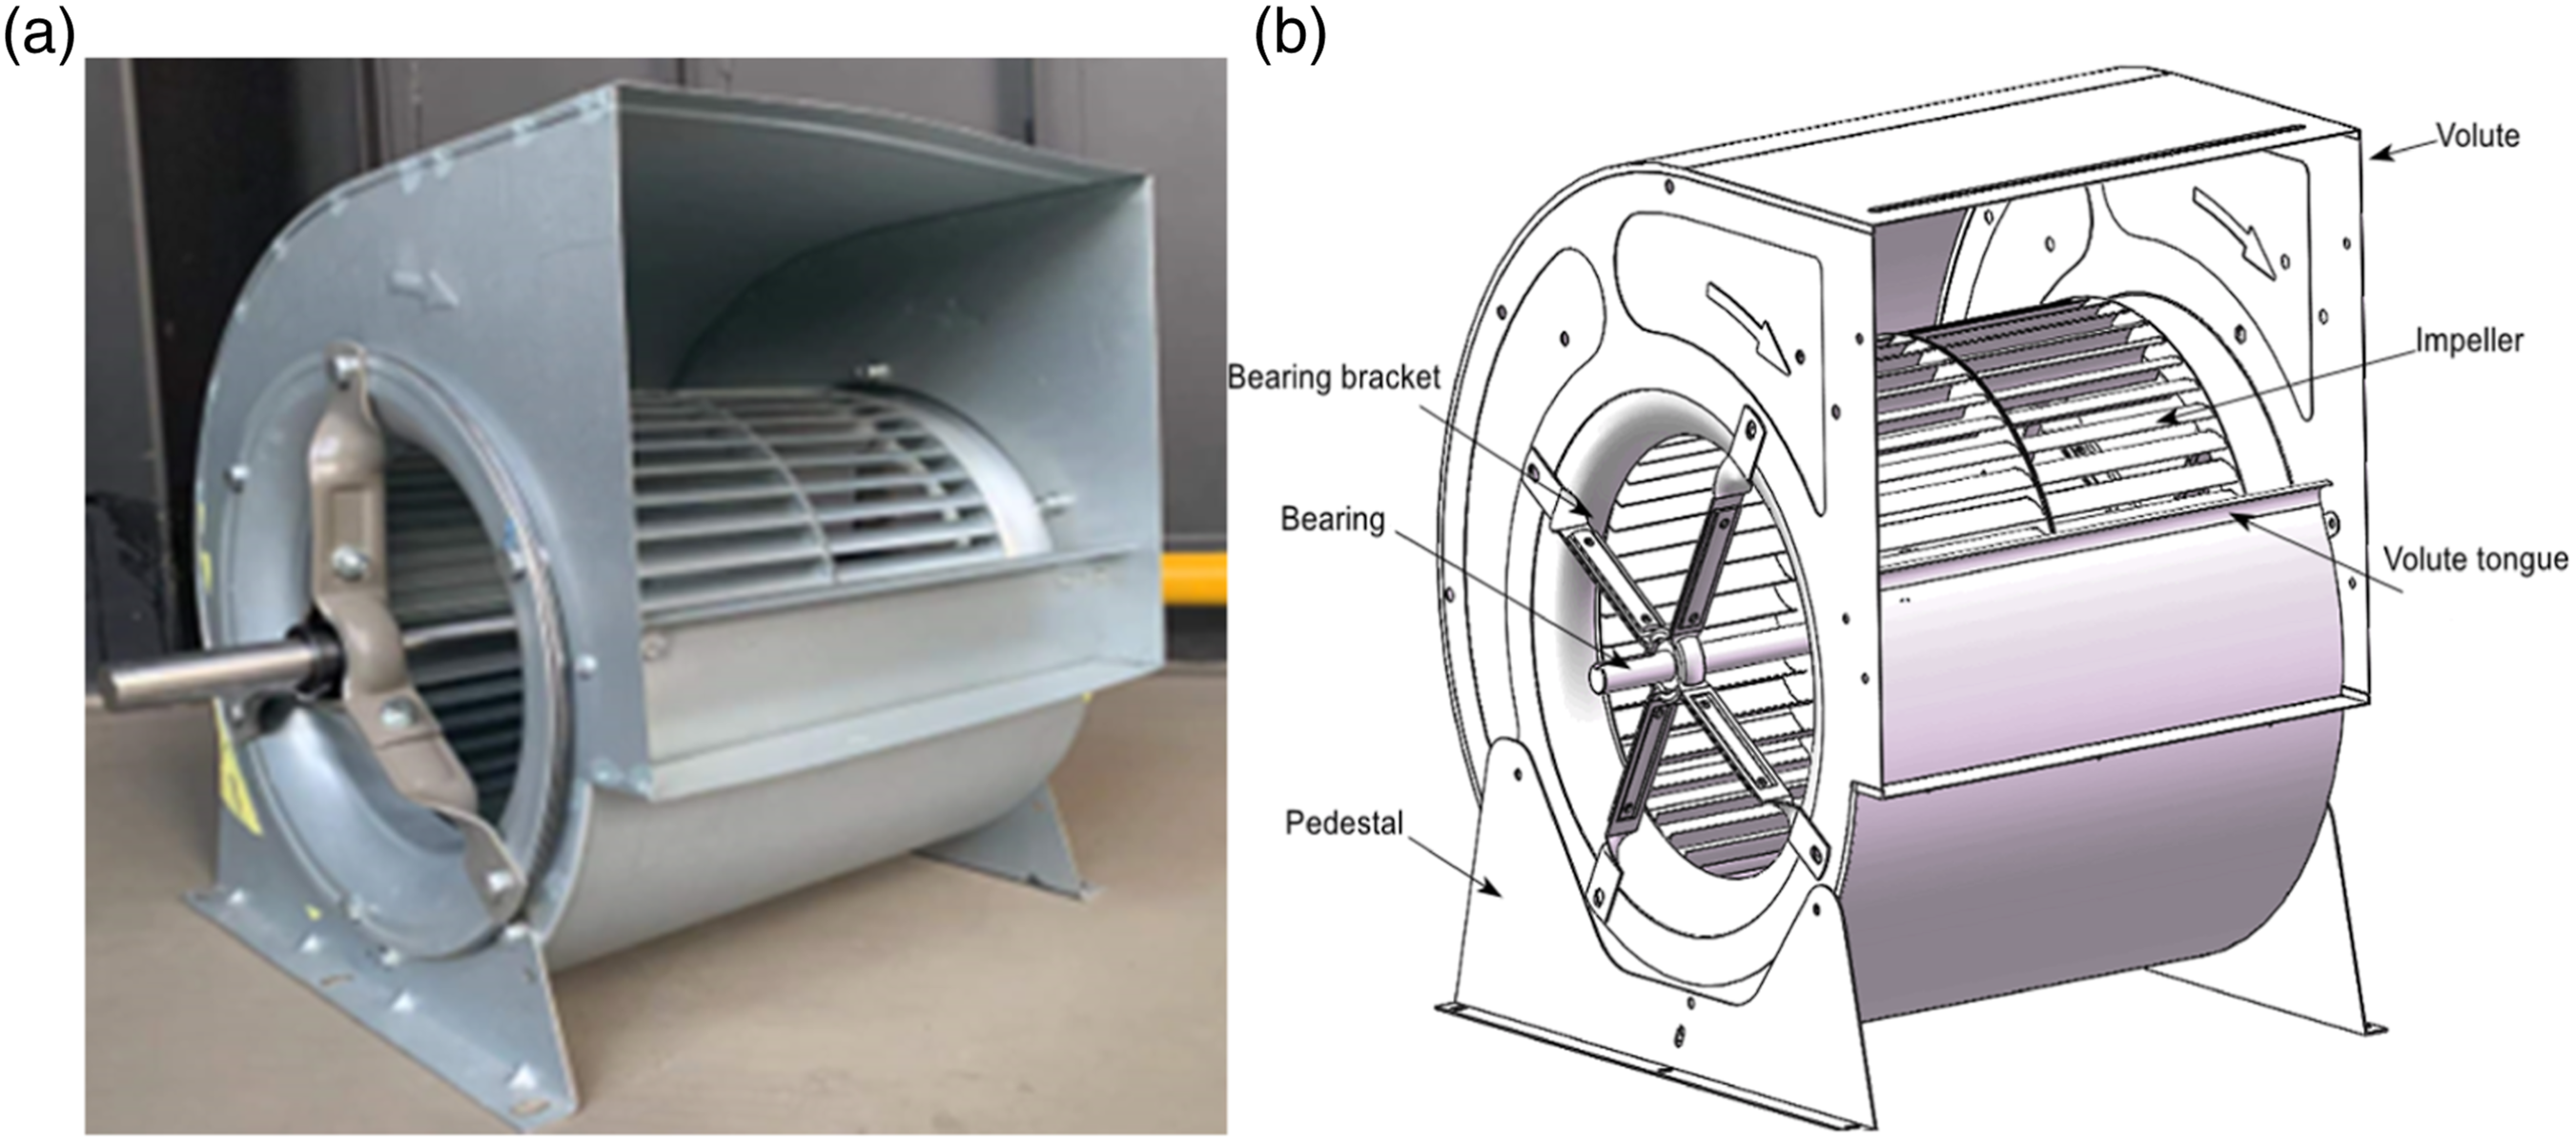
Governing equations and solution method
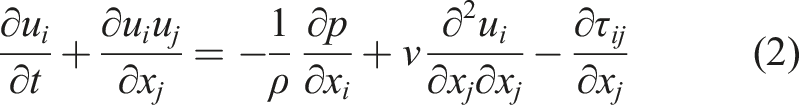
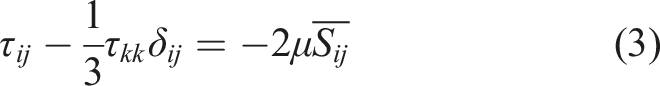
The large-eddy simulation is used to numerically analyze the internal flow of the fan. The governing equations are the conservations of mass and momentum of incompressible flow: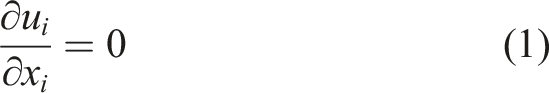
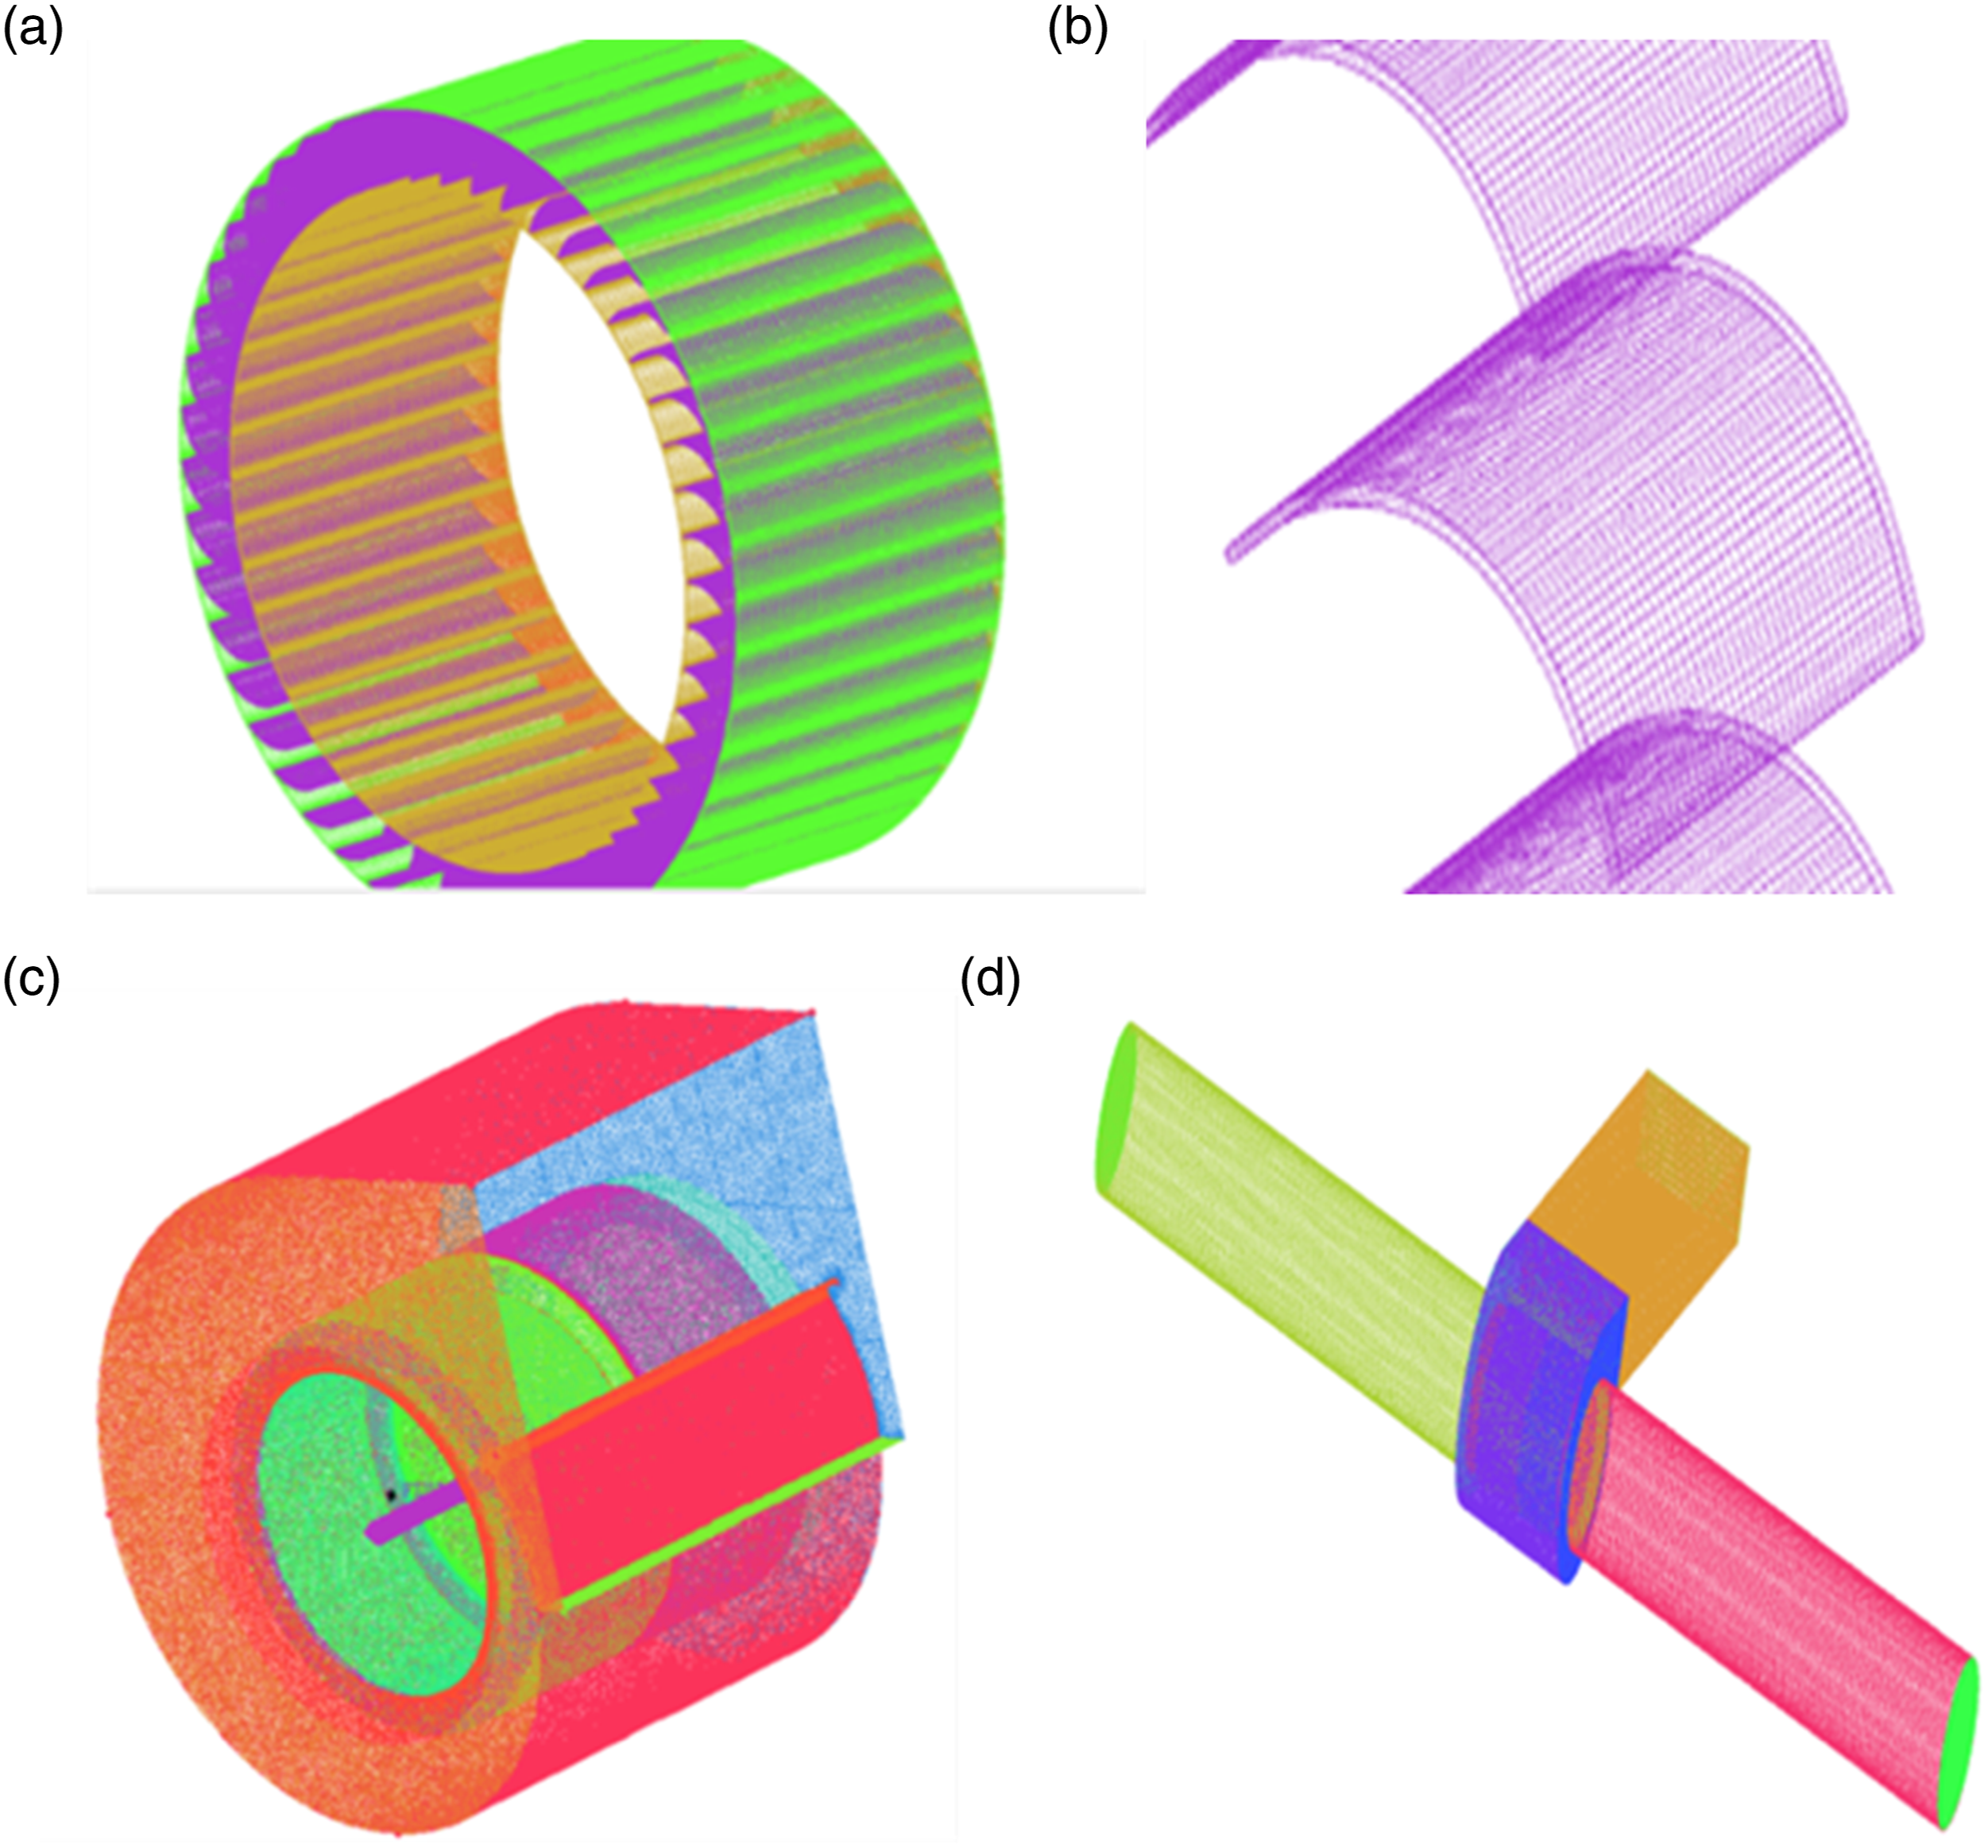
We performed the large-eddy simulations for the internal flow in the Sirocco fan using the commercial software ANSYS-Fluent. The computational domain consists the rotating sub-domain of impeller, and stationary sub-domains of volute, inflow and outflow sections. The inflow and outflow sub-domains extend to about 5D2 away from the inlet and outlet of the Sirocco fan, as shown in Figure 2, for the development of non-uniform and unsteady flow to avoid their interference on the internal flow of the fan. The computational domain is discretized by a hybrid structured and unstructured grids using ANSYS-TurboGrid, as shown in Figure 3. The blade passages in the impeller and inflow and outflow sub-domains are discretized by block-structured grid, while the volute is discretized by unstructured grid considering its irregular geometry. The grid is refined on all solid surfaces by a number of 10 layers as set in the software to resolve the boundary layer flow, and the Jacobian ratio of grid is larger than 0.3 for the whole computational domain. Computational domain of the Sirocco fan: (a) Impeller; (b) Volute; (c) The whole domain consists the impeller, volute, and inflow and outflow sub-domains. Schematic of the grid: (a) Impeller; (b) Enlarged view for grid on the blade surface; (c) Volute; (d) Grid for the whole computational domain.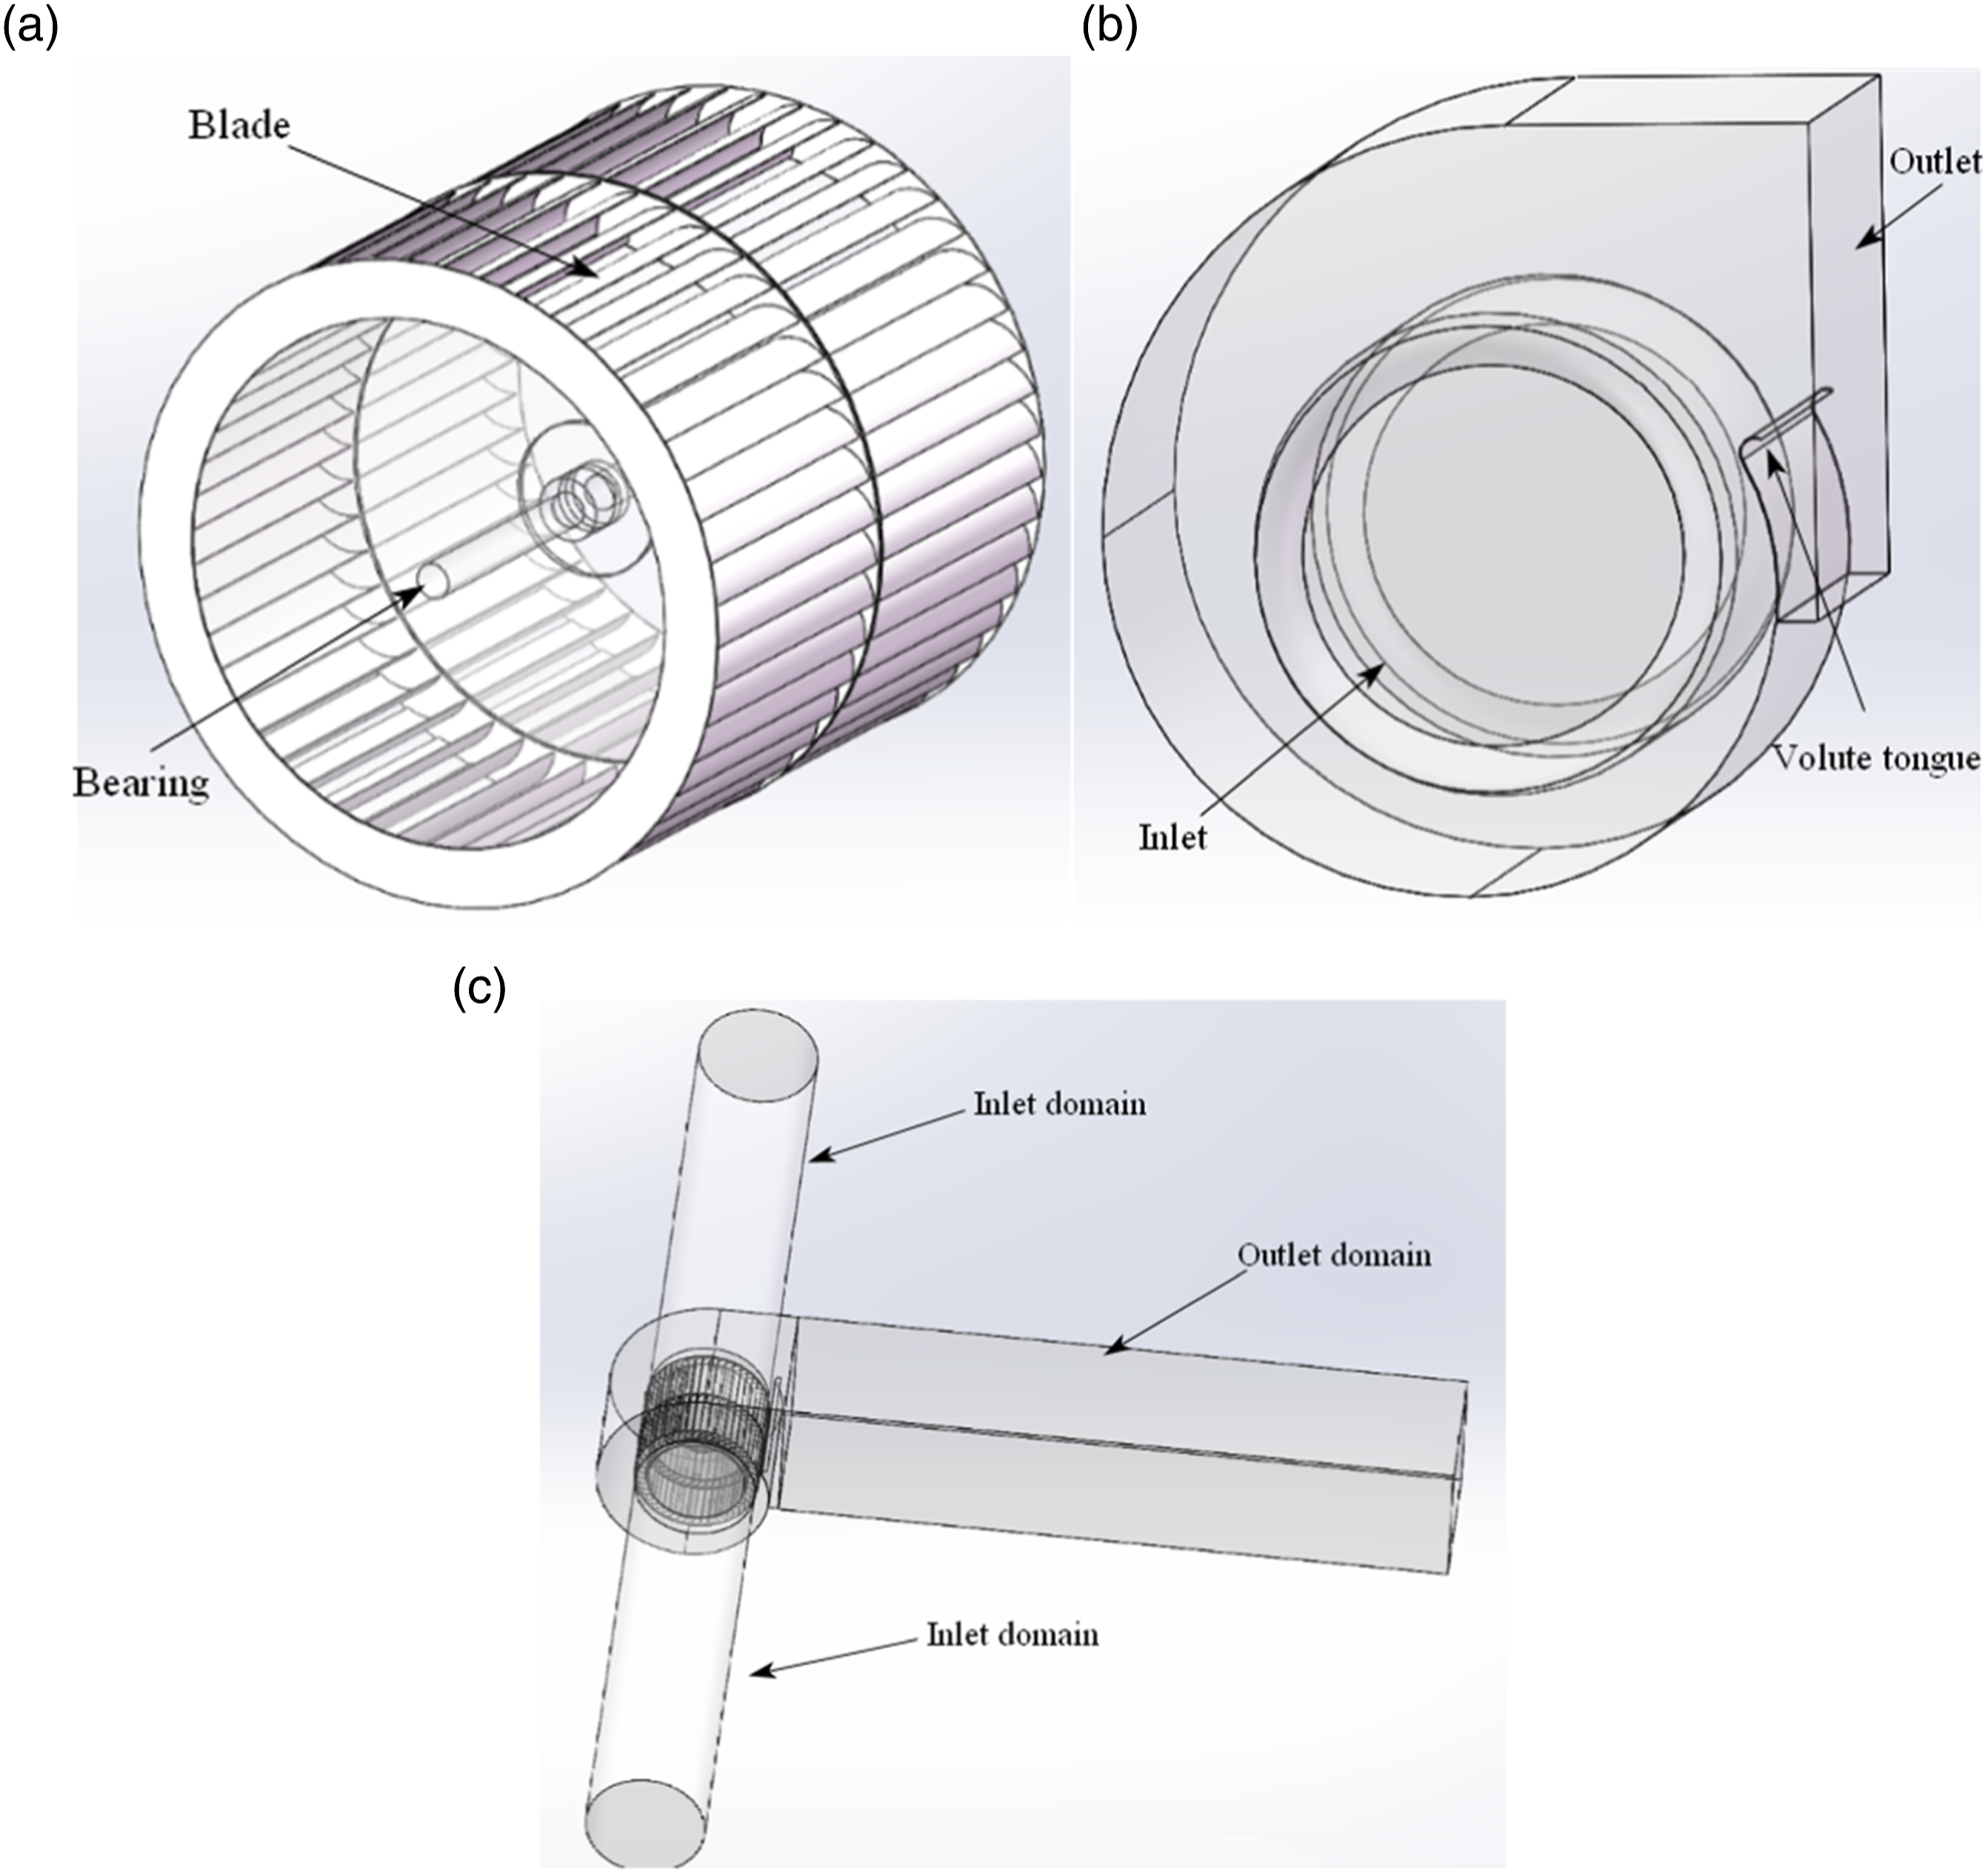
The governing equations are spatially discretized using the second-order upwind scheme. The PISO algorithm is applied to couple pressure and velocity during the solution. The multi-reference-frame (MRF) approach is used to treat the rotating and stationary sub-domains. In the simulations, constant mass flow is applied at the inlet of the inflow section according to the flow rate of the Sirocco fan, and zero gauge pressure is prescribed at the outlet of the outflow section. No-slip condition is applied for velocity components on all solid walls. A steady-state Reynolds-averaged Navier-Stokes (RANS) simulation is first performed under the same working conditions, and the result is used as the initial condition of the following unsteady large-eddy simulation. The size of physical time step is set as the impeller rotates for one degree, i.e., 360 physical steps per one revolution; the maximum number of inner iterations is 20 and convergence criterion is 10−3 for all discretized equations. The simulation continues as the impeller rotates for eight revolutions in which the data recorded in the last revolution is used for following analysis.
Grid independence study and validation
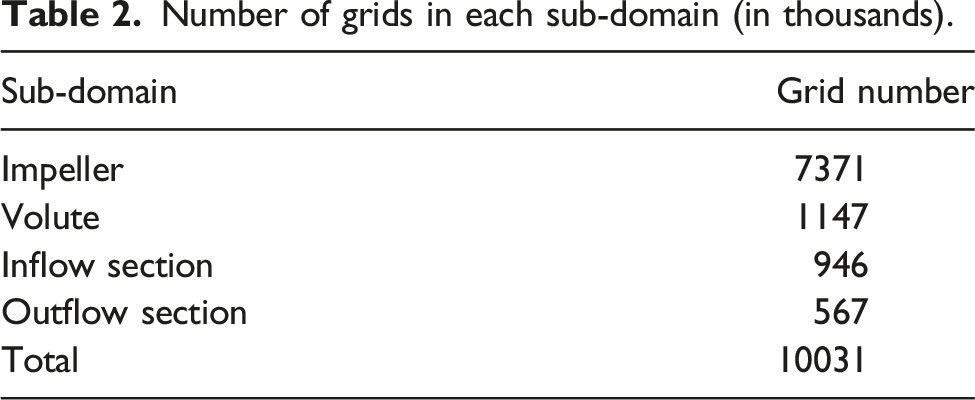
The grid independence study was performed to ensure that spatial resolution is sufficient to produce accurate numerical result. Six sets of grid are generated for the numerical simulation at designed flow rate, with the total number of grid 3.6 million, 5.4 million, 7.3 million, 9.8 million, 12.4 million and 16.8 million for the impeller, respectively, and the number of grid for the volute and inflow and outflow sub-domains are kept unchanged. The variation of static pressure rise with the number of grids is given in Figure 4. It is seen in the figure that as the number of grids for the impeller exceeds 7.3 million, the static pressure rise approaches to a constant value and further increasing of grid number hardly affects. Therefore, we confirm that 7.3 million grids for the impeller are sufficient for the fan and will be used in the following simulation, and the numbers of grid for each sub-domain are listed Table 2. Variation of static pressure rise with grid number. Number of grids in each sub-domain (in thousands).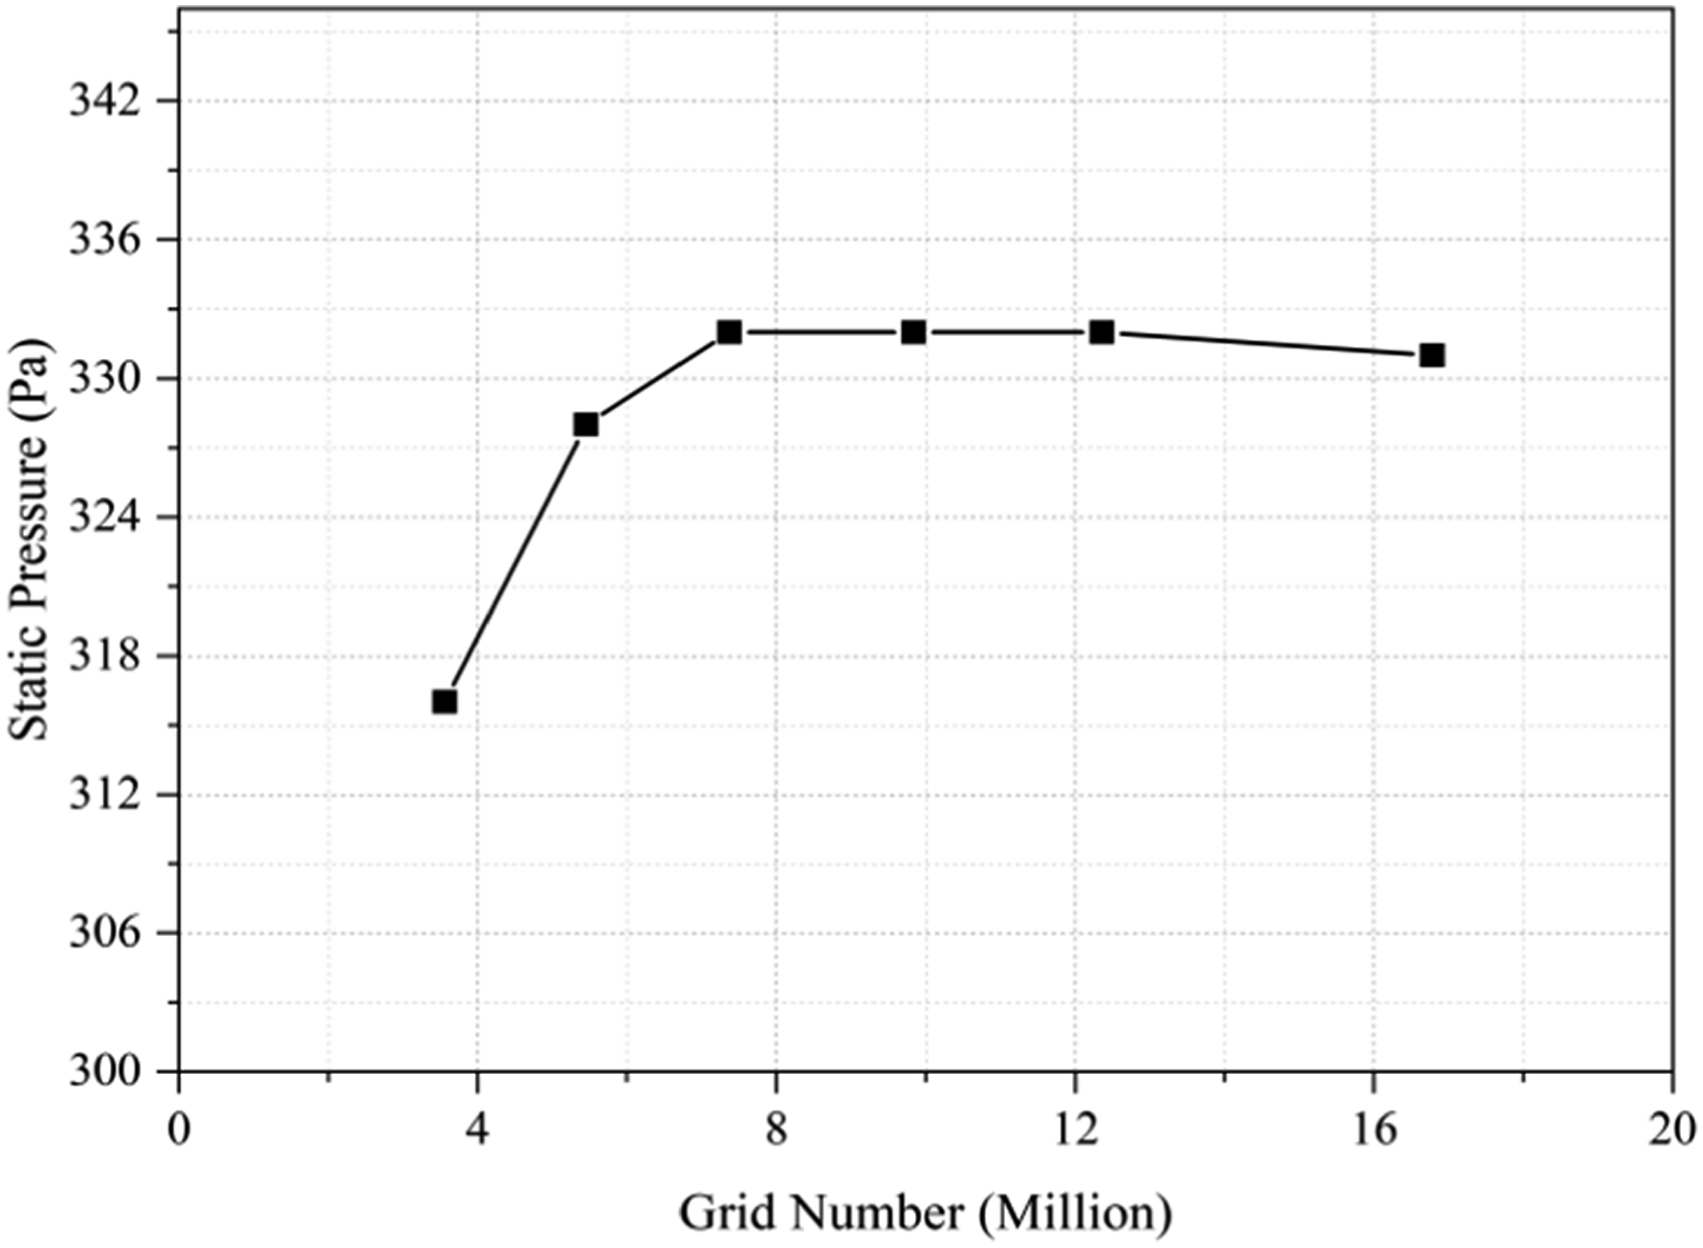
The reliability of numerical simulations is evaluated by validation against experimental data for the baseline Sirocco fan operated under various flow rates. The variation of static pressure rise and static pressure efficiency with flow rate are presented in Figure 5. At the designed flow rate 7488 m3/h, the static pressure rise and efficiency obtained by numerical simulation are 4.7% and 6.0% higher than those of the experimental values. The discrepancy is smaller for small flow rates but only slightly vary for the medium and large flow rates. The numerical data could generally explain the variation patterns of aerodynamic performances. In the following section, we performed the design of the fan and numerical simulation of the internal flow under the designed flow rate 7488 m3/h. Comparison of aerodynamic performance quantities obtained by simulation and experiment: (a) Static pressure rise; (b) Static pressure efficiency.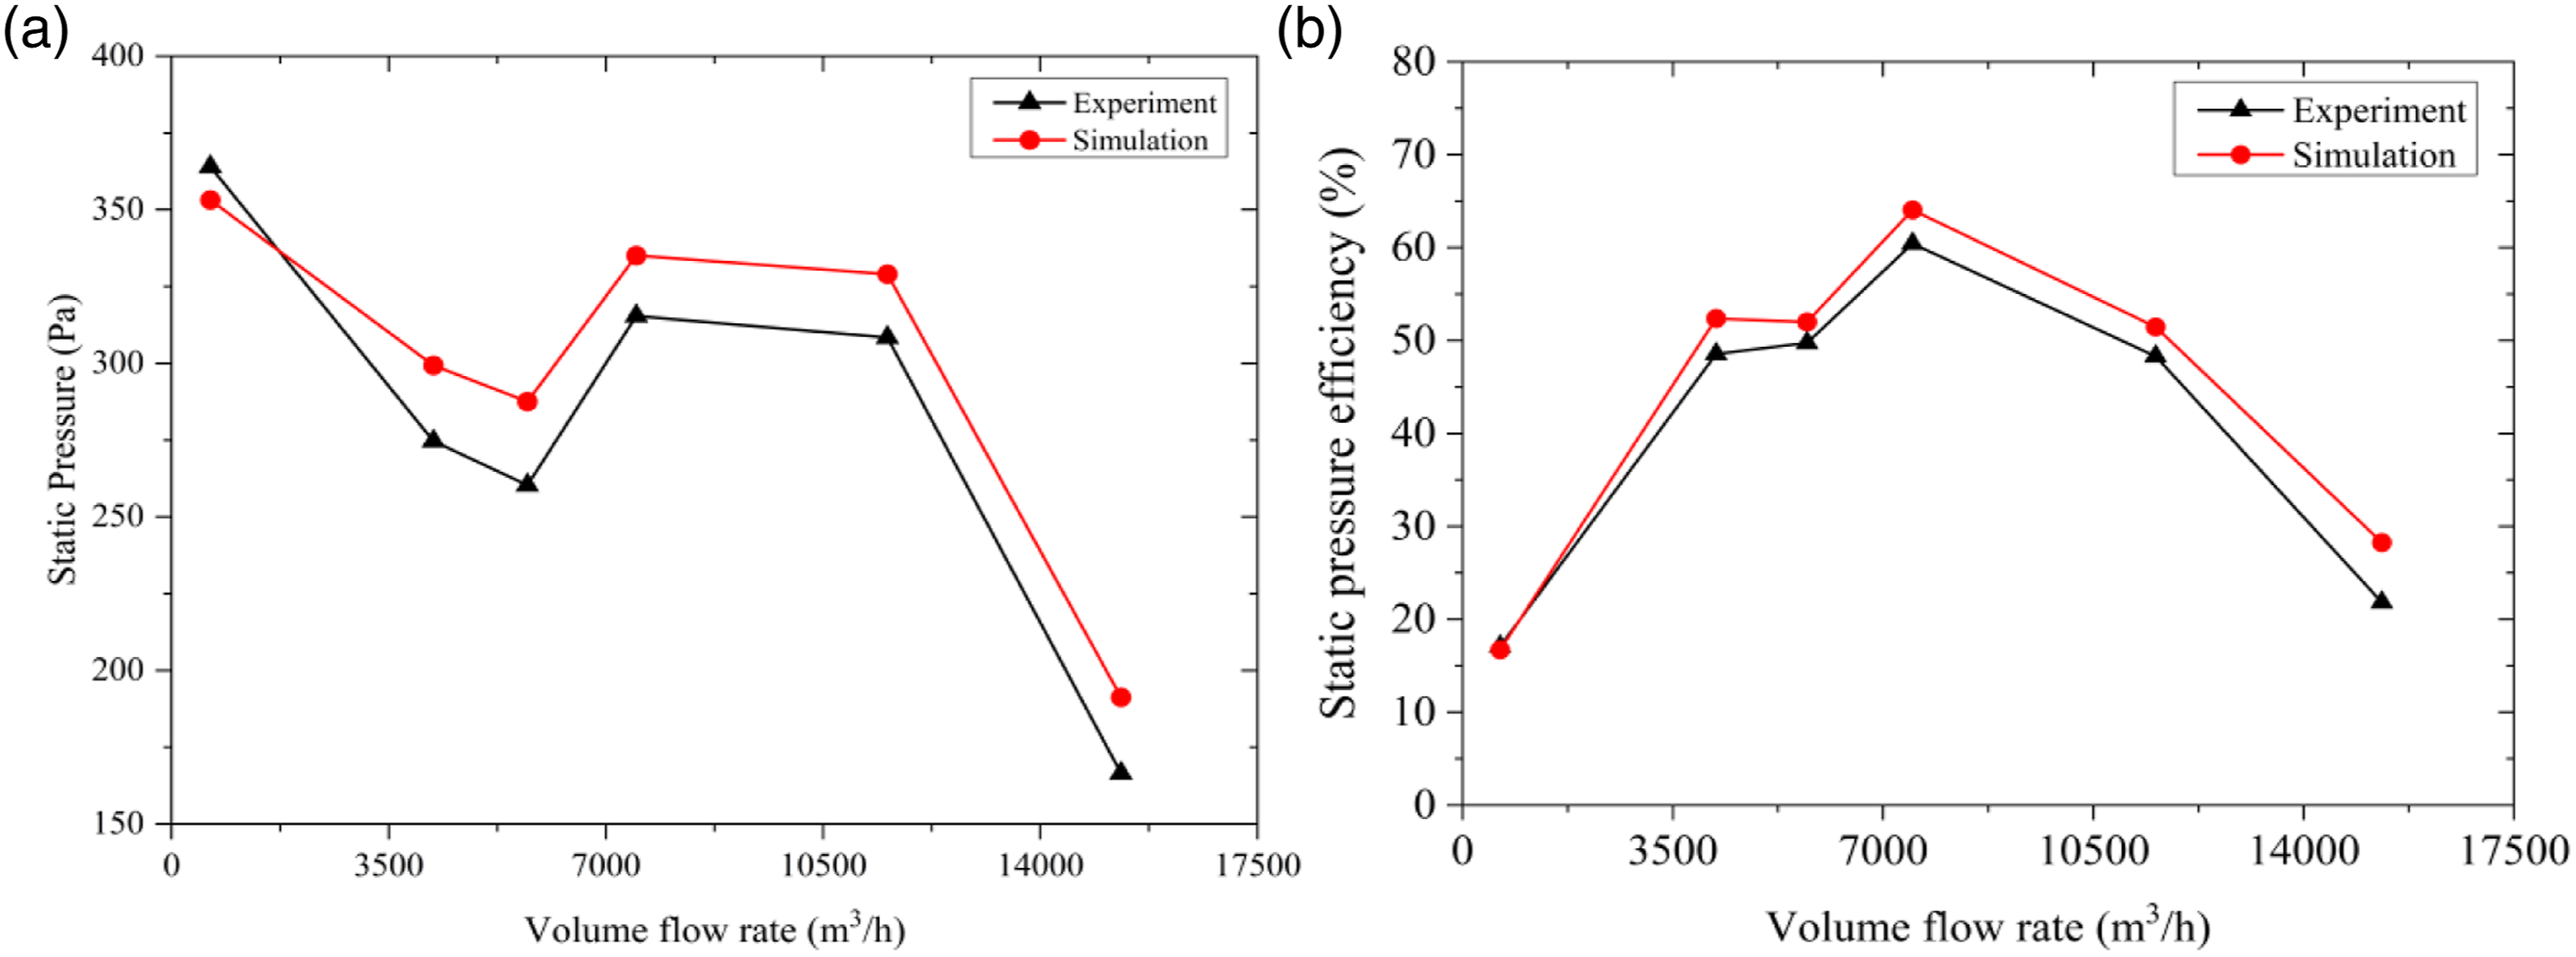
Parametric optimization of the impeller and volute
Parameterization and optimization technique
In this work, both the impeller and volute of the Sirocco fan are optimized to improve the static pressure rise of the fan which is significant in applications. The orthogonal parametric optimization is performed for only a certain number of geometric parameters while others are kept unchanged as those listed in Table 1.
For the impeller, the outlet installation angle (β2A) and turning angle (Φ) of the blade, and number of blade (Z) are set to be optimized. The inlet installation angle is also a key parameter, however, since it is geometrically related with β2A and Φ, we keep it constant without modification. For the volute, we propose a velocity correction coefficient (η) which is defined as the ratio between the magnitude of averaged velocity at the outlet of the volute and the cross-sectional area of the outlet of the volute. This parameter reflects the diffusion capability in converting the kinetic energy of the fluid to pressure energy. The profile of the volute is designed based on Archimedes spiral equation. The four parameters to be optimized (β2A, Φ, Z, η) are geometrically independent, but the characteristics of internal flow are determined by the joint influence of these parameters. The optimization is carried out by varying one parameter while fixing the values for the remained parameters. The optimal value for the single parameter is determined using the steepest descent method. The levels of the above parameters are determined based on experience and certain geometric restrictions. In the present orthogonal optimization, the levels are not significantly changed to guarantee that there is no difficulty in the manufacturing of the mold. The number of blades of the impeller (Z) should be an even number and is divisible by 360° that the angular gap between neighboring blades is an integer.
Orthogonal optimization and aerodynamic performances
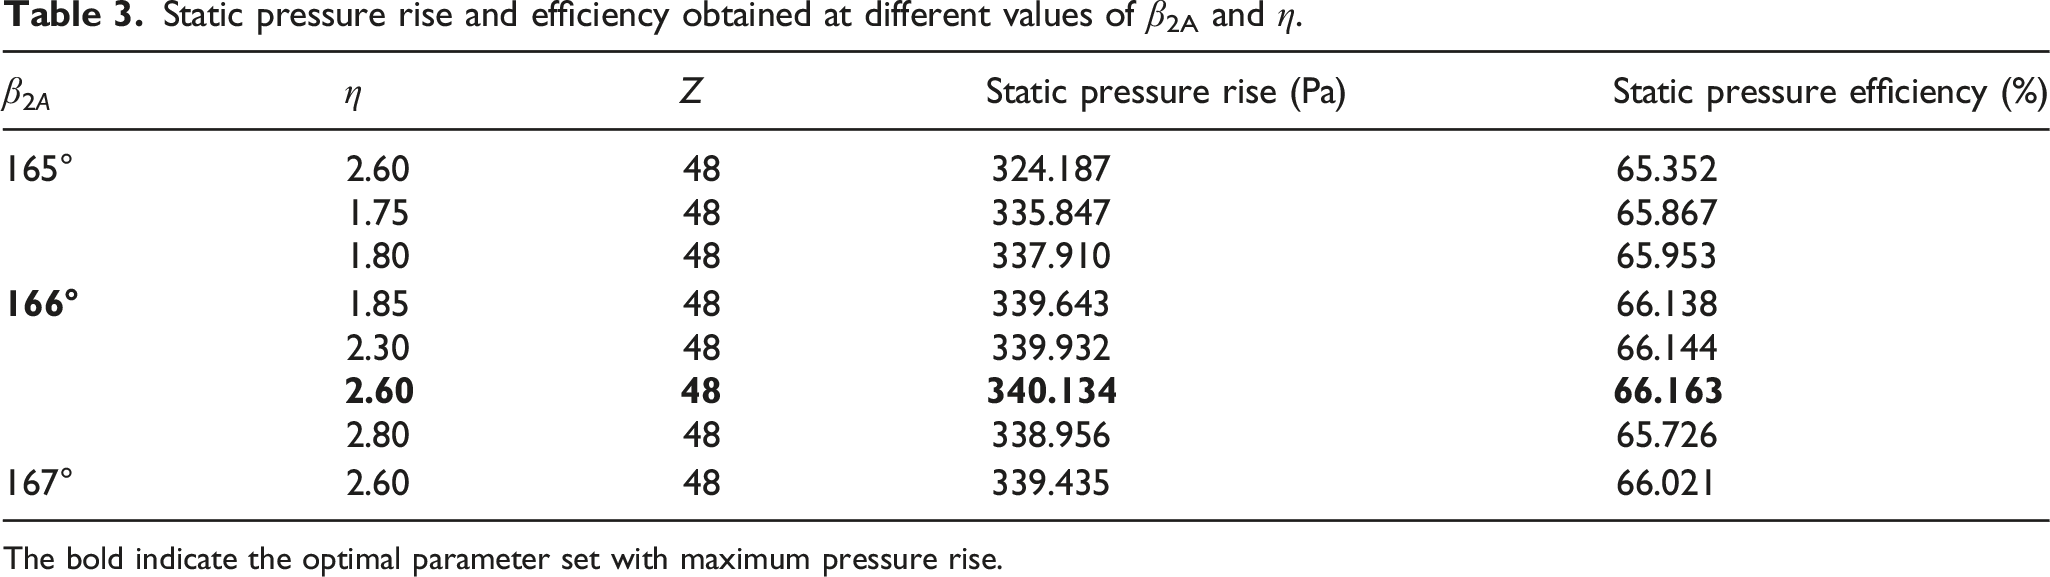
We first performed parametric optimization on the outlet installation angle of the impeller blade (β2A) and velocity correction coefficient of the volute (η), and the profile of volute is consequently varied, as schematically shown in Figure 6. The variations of the two parameters are set as 165° < β2A < 167° and 1.75 < η < 1.80. Table 3 presents the variations of static pressure rise and efficiency with the outlet installation angle of the impeller blade and velocity correction coefficient of the volute. For the current value of the blade number (Z = 48), the maximum static pressure rise is obtained at β2A = 166° and η = 2.60. It is also noticed as β2A increases or decreases while η keeps unchanged, the static pressure rise always reduces in magnitude. Schematic of the outlet installation angle of the impeller blade (a) and profile of the volute (b). Static pressure rise and efficiency obtained at different values of β2A and η. The bold indicate the optimal parameter set with maximum pressure rise.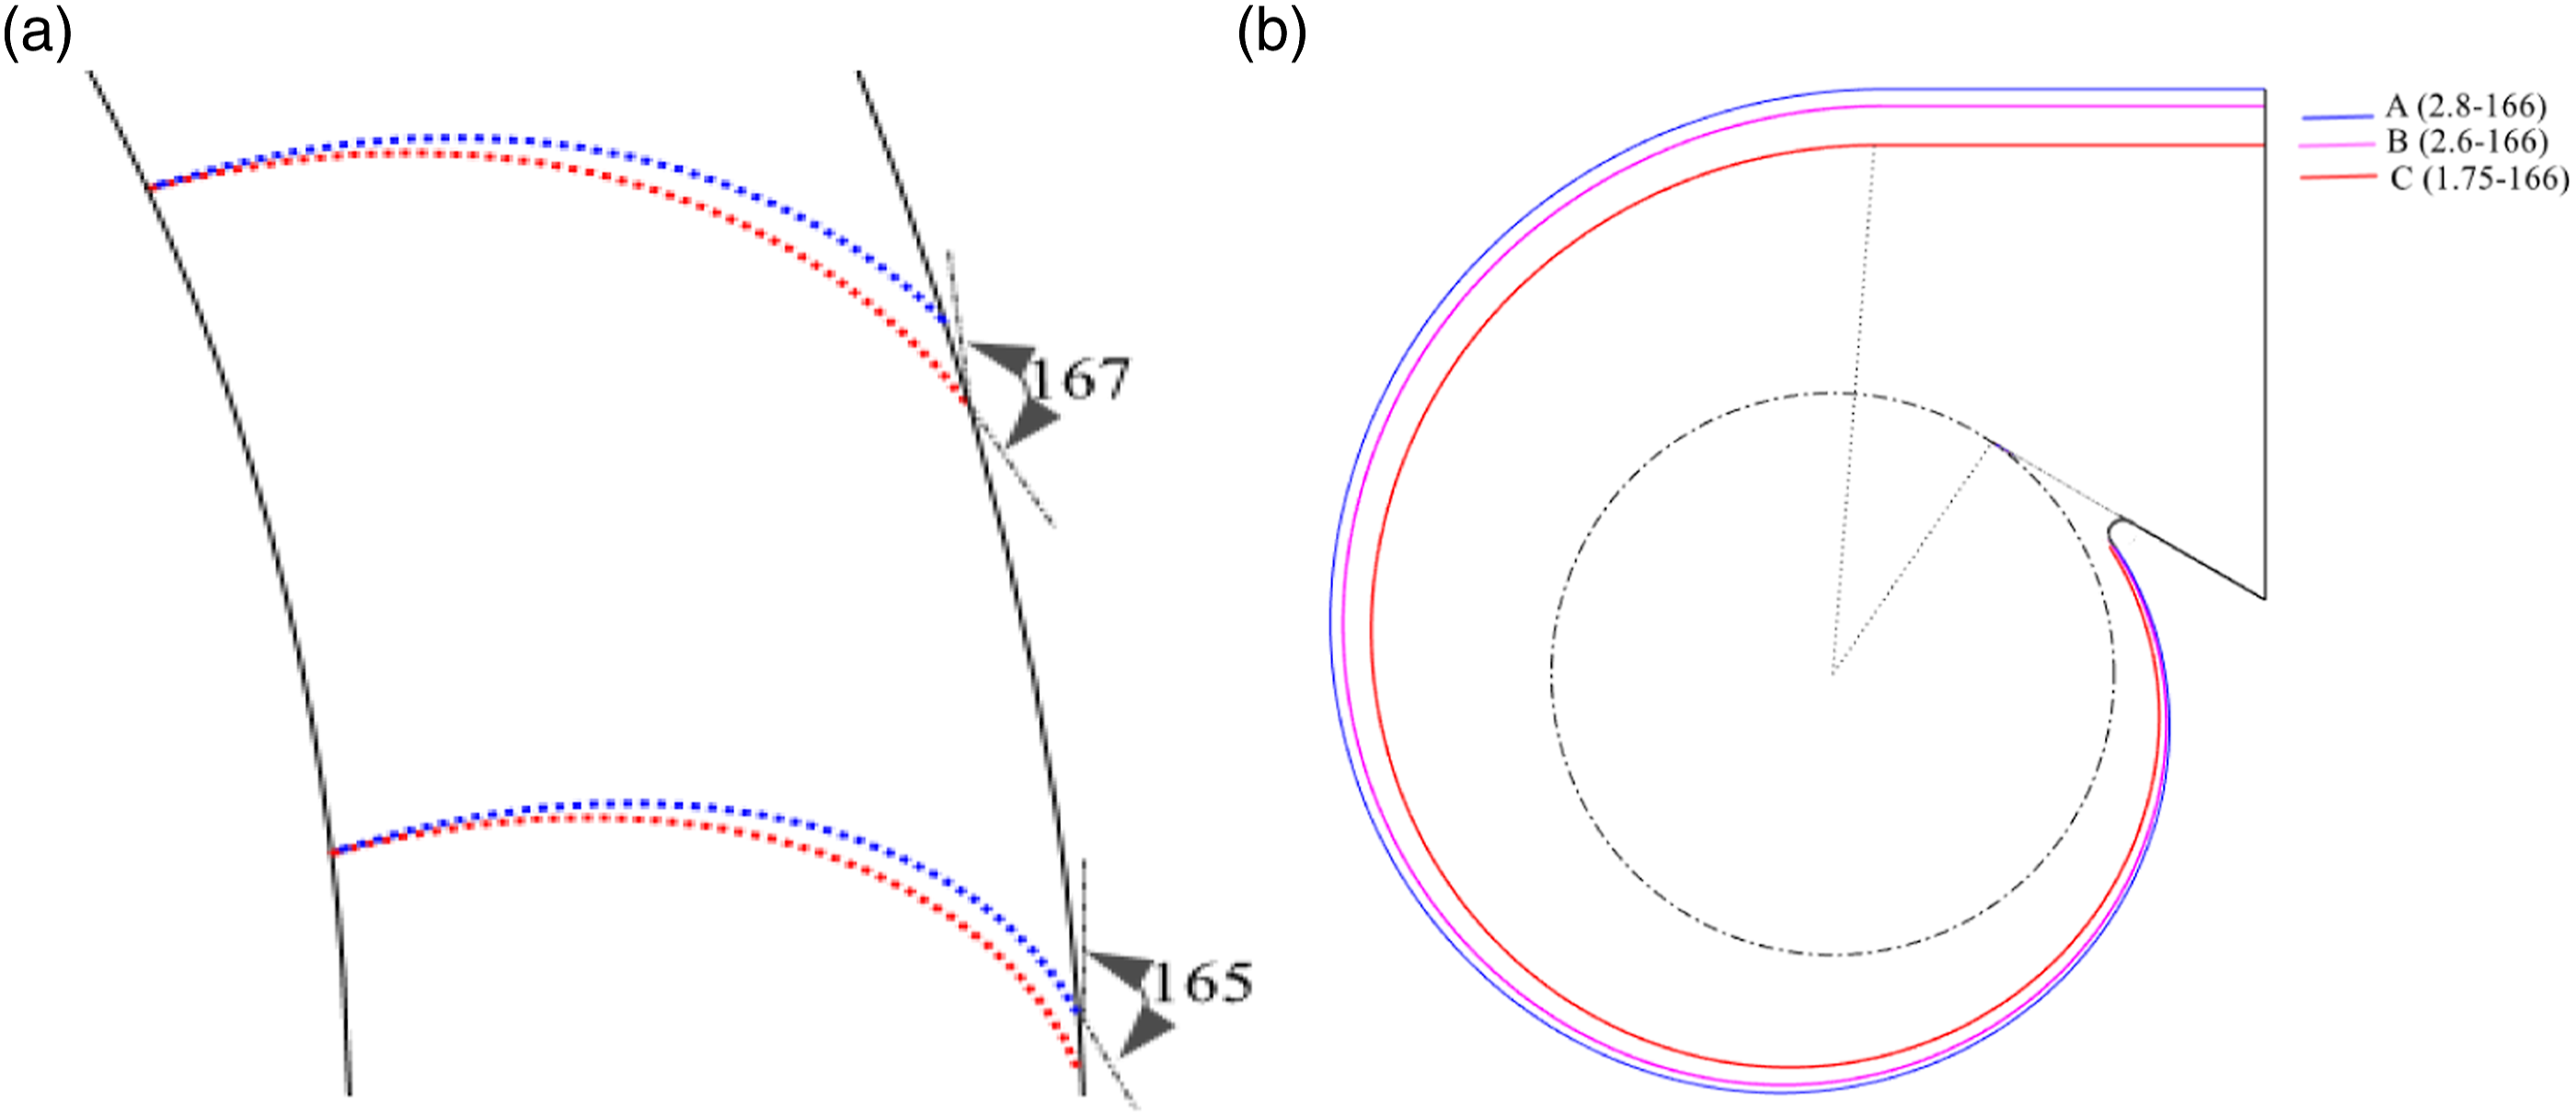
Static pressure rise and efficiency obtained at different values of Z and β2A.
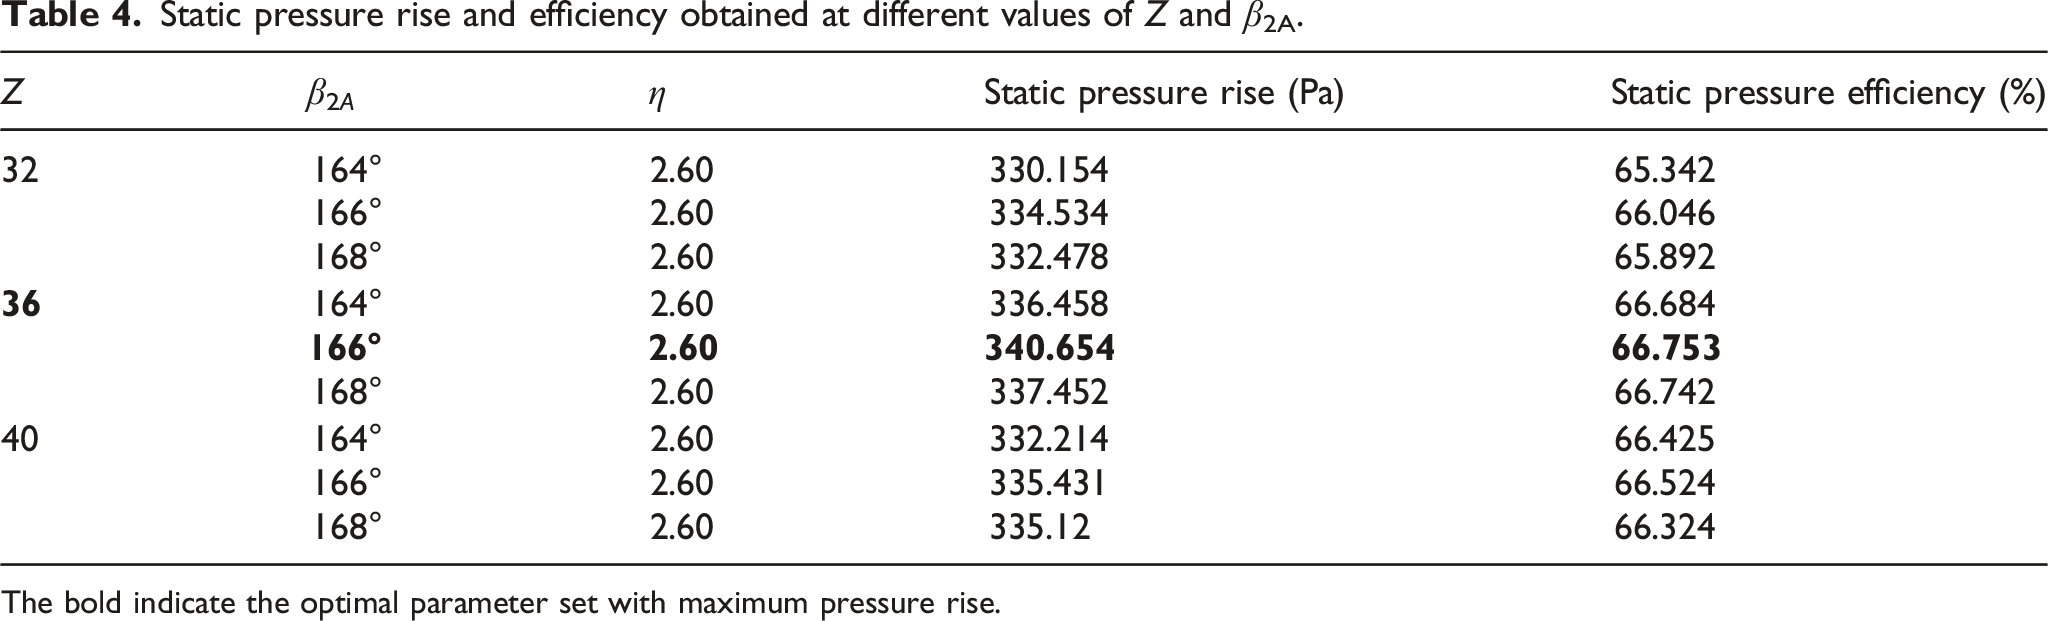
The bold indicate the optimal parameter set with maximum pressure rise.
Static pressure rise and efficiency obtained at different values of Z and Φ.
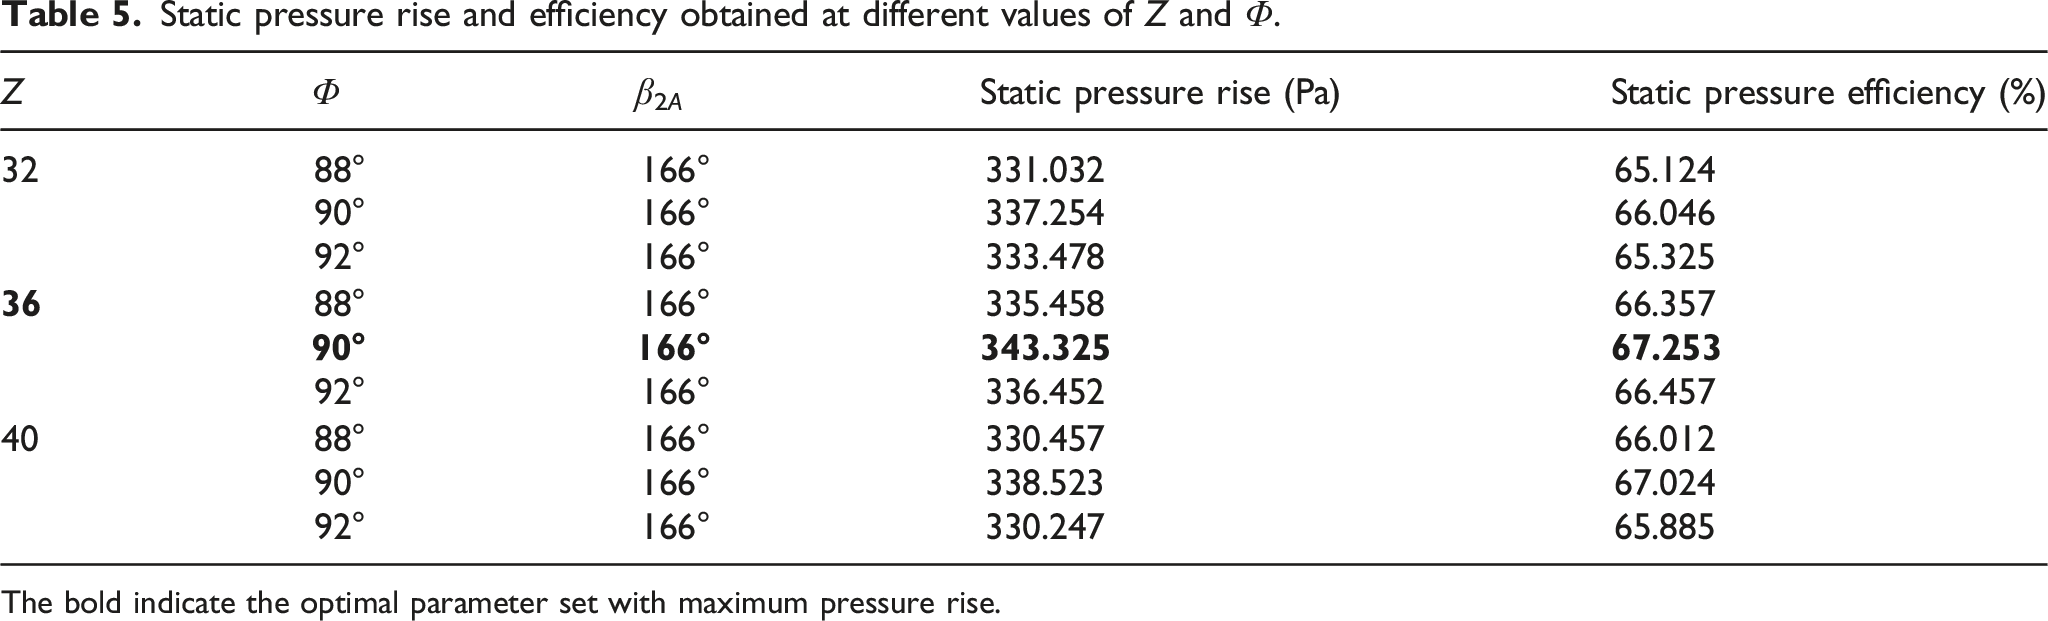
The bold indicate the optimal parameter set with maximum pressure rise.
Aerodynamic performances of the optimized Sirocco fan
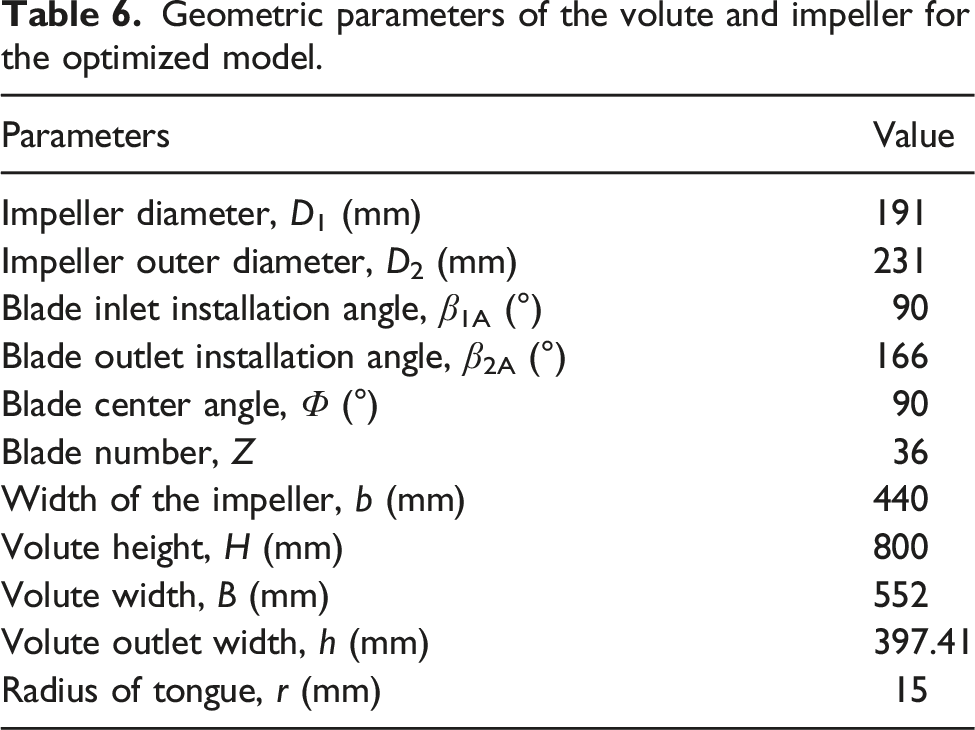
The parametric optimization in the previous section shows that the aerodynamic performance of the Sirocco fan at designed flow rate is improved for the optimized model with β2A = 166°, η = 2.6, Z = 36 and Φ = 90°. The geometries of the baseline and optimized volute, and the optimized impeller are shown in Figure 7 with the main geometric parameters listed in Table 6. Schematic of the volute and impeller: (a) Baseline and optimized models of the volute; (b) Optimized impeller. Geometric parameters of the volute and impeller for the optimized model.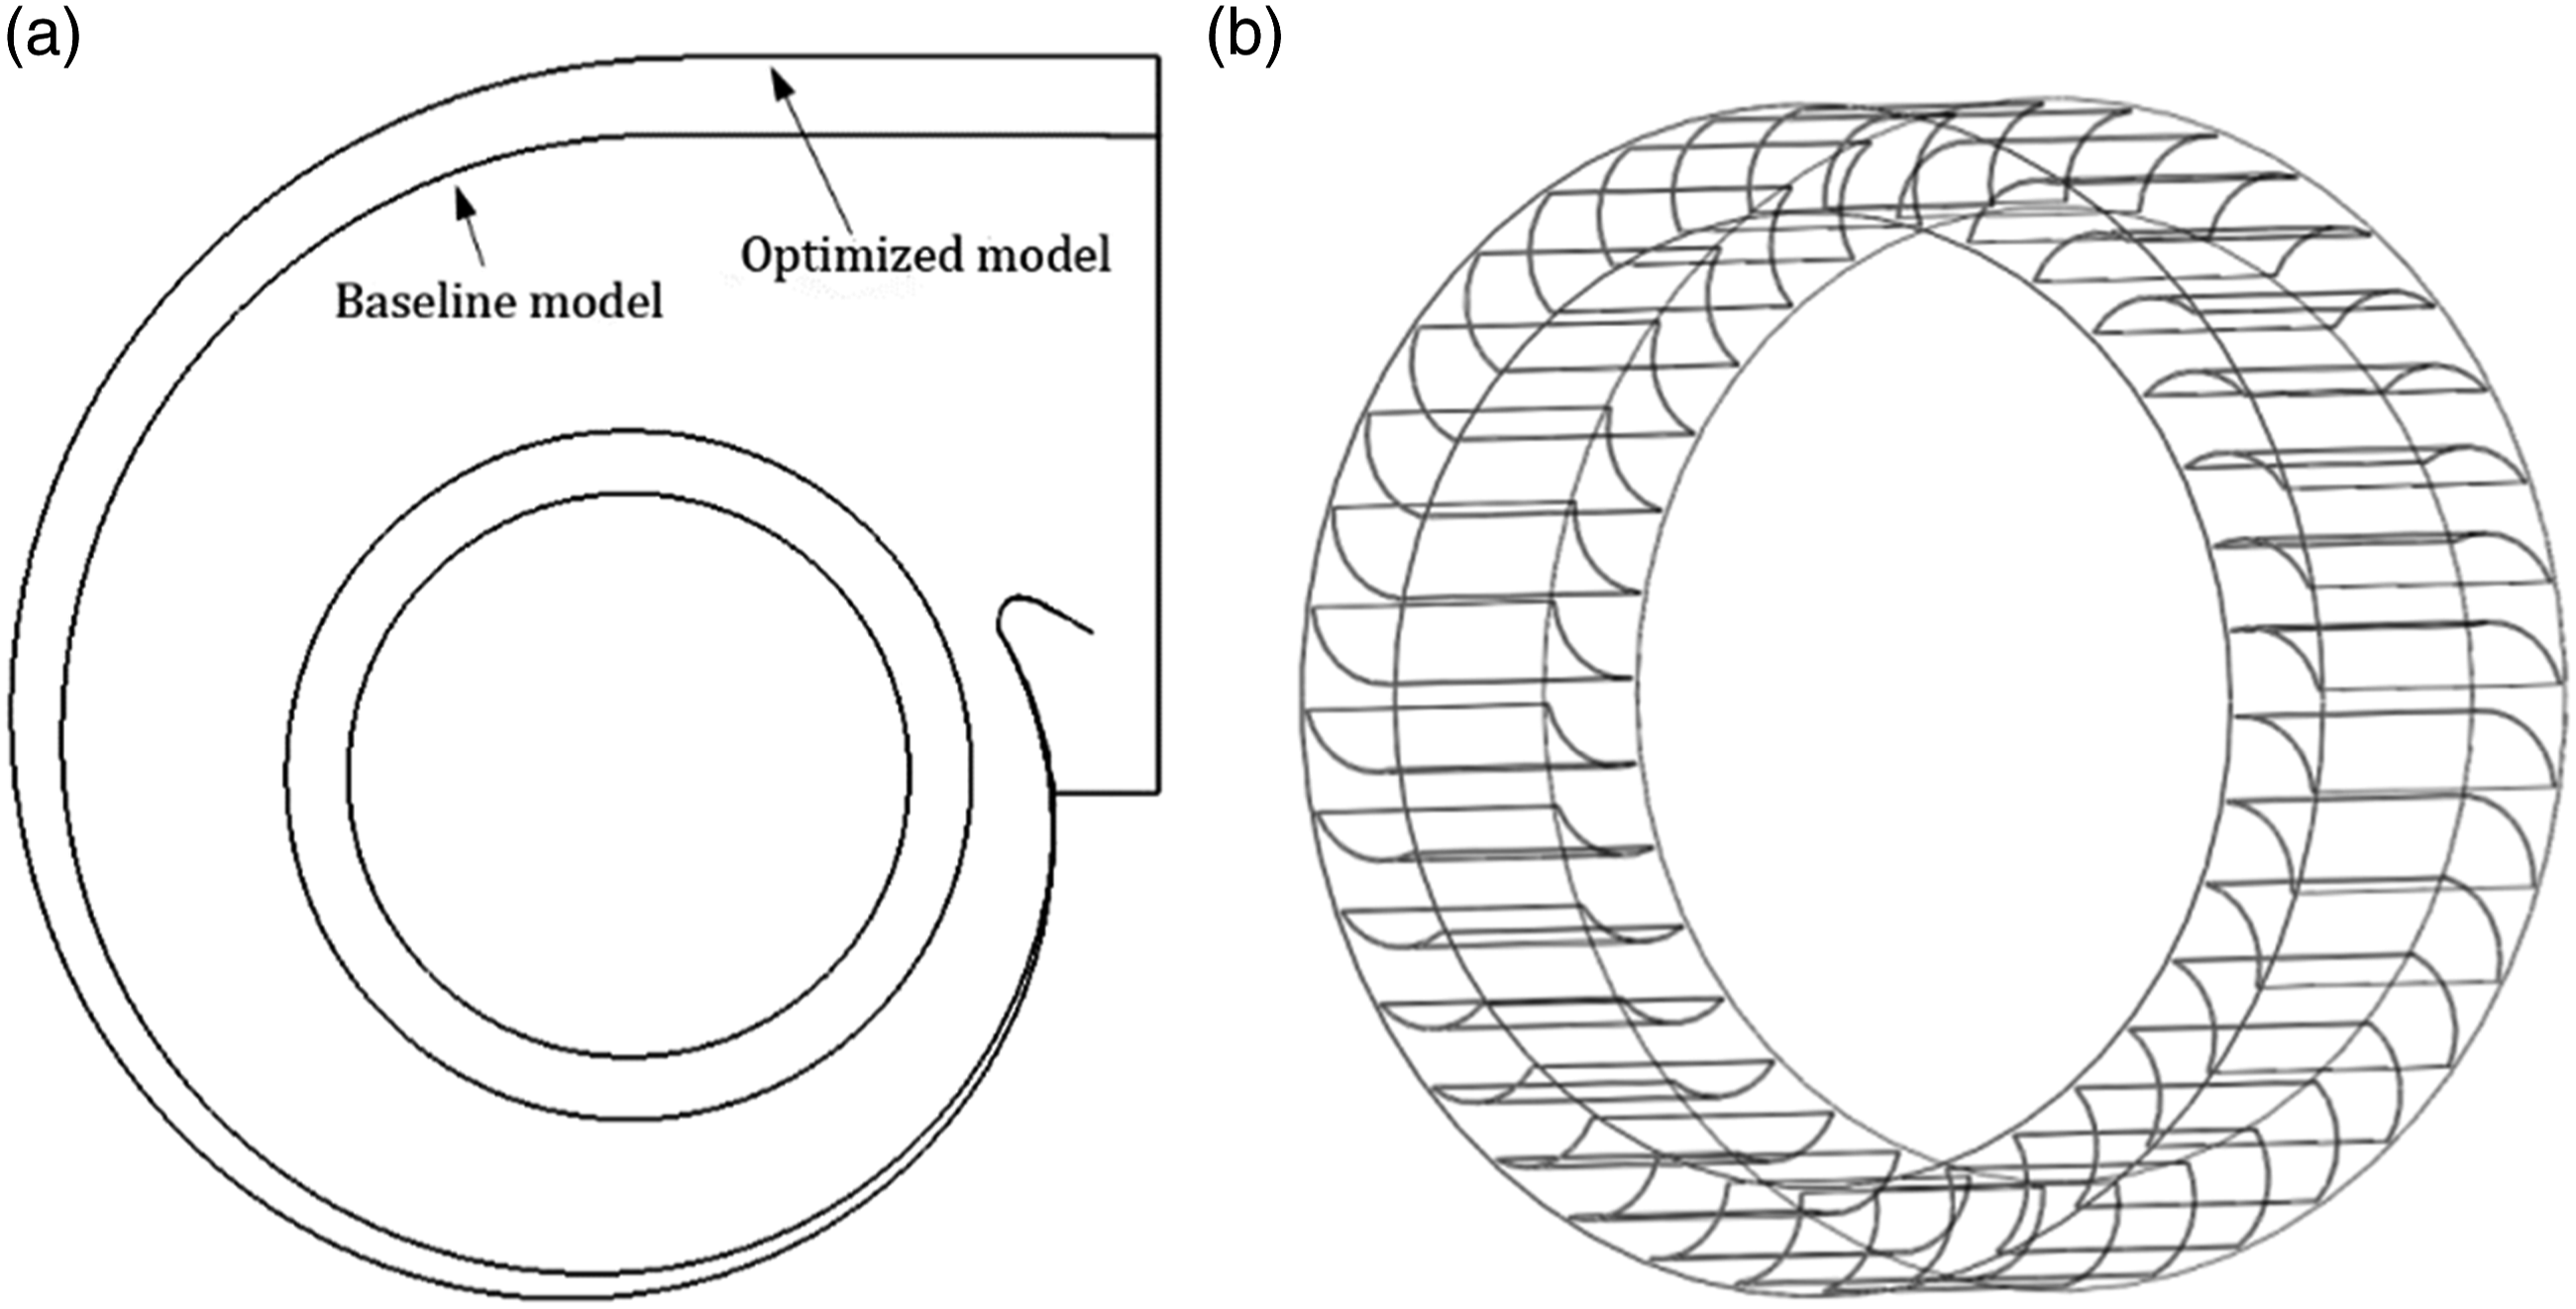
In order to evaluate the aerodynamic performance of the Sirocco fan for different flow rates, we performed simulations for the internal flow of the fan from small to large flow rates, and the data of static pressure rise and efficiency are compared with those of the baseline model as shown in Figure 8. The static pressure rise of the optimized fan is 6% lower than that of the baseline fan at small flow rate 3500 m3/h, while it is 1.8% higher at the designed flow rate 7488 m3/h and the efficiency is also about 5% higher. It is confirmed that the optimized fan could improve the performance of the fan to some extent around the designed flow rate. Comparison of aerodynamic performances of the baseline and optimized fan models: (a) Static pressure rise; (b) Static pressure efficiency.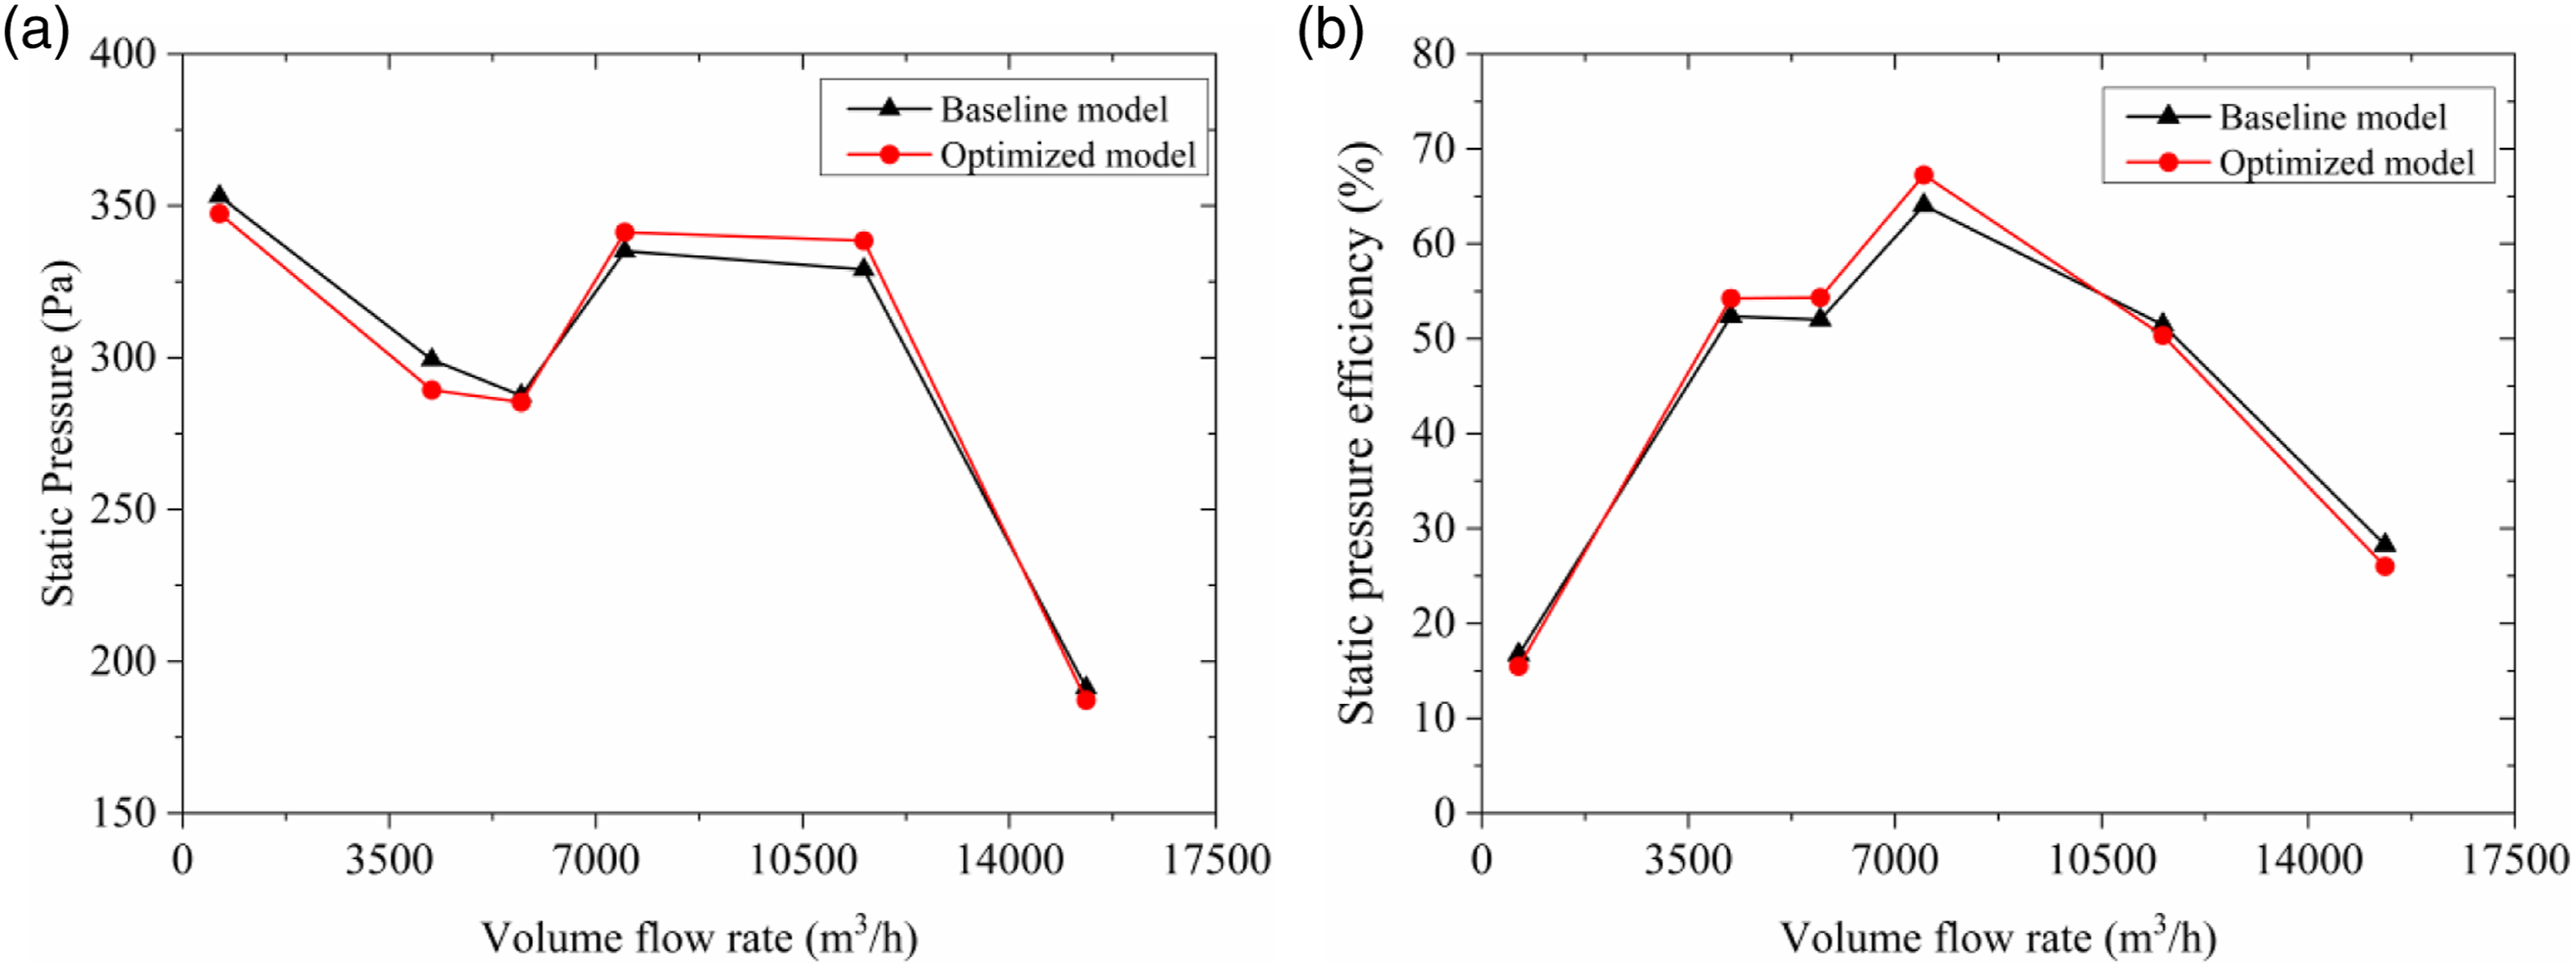
Results and discussion
The characteristics of internal flow of the baseline and optimized Sirocco fans are analyzed at the designed flow rate 7488 m3/h based on the numerical results to reveal how they are influenced by the geometries of the volute and impeller. The velocity and pressure fields in terms of temporal variations within the volute and impeller, and also the near-wall flow of the volute are presented.
Static pressure rise
Since the modification of geometries of the volute and impeller would affect the interaction of internal flow within the fan, we first investigate the temporal fluctuation of static pressure rise of the baseline and optimized Sirocco fans. The time histories of the static pressure rise obtained by the steady-state RANS and unsteady LES simulations are presented along with the experimental data for the baseline fan, as shown in Figure 9. The magnitude of gauge pressure at the inlet of the fan, which is negative since the gauge pressure at the outlet of the fan is set to zero, is exhibited as the impeller rotates for eight revolutions. It is seen in Time history of static pressure rise of baseline and optimized fans: (a) Baseline fan; (b) Optimized fan. The negative value denotes the surface-averaged static pressure obtained at the inlet of the inflow section.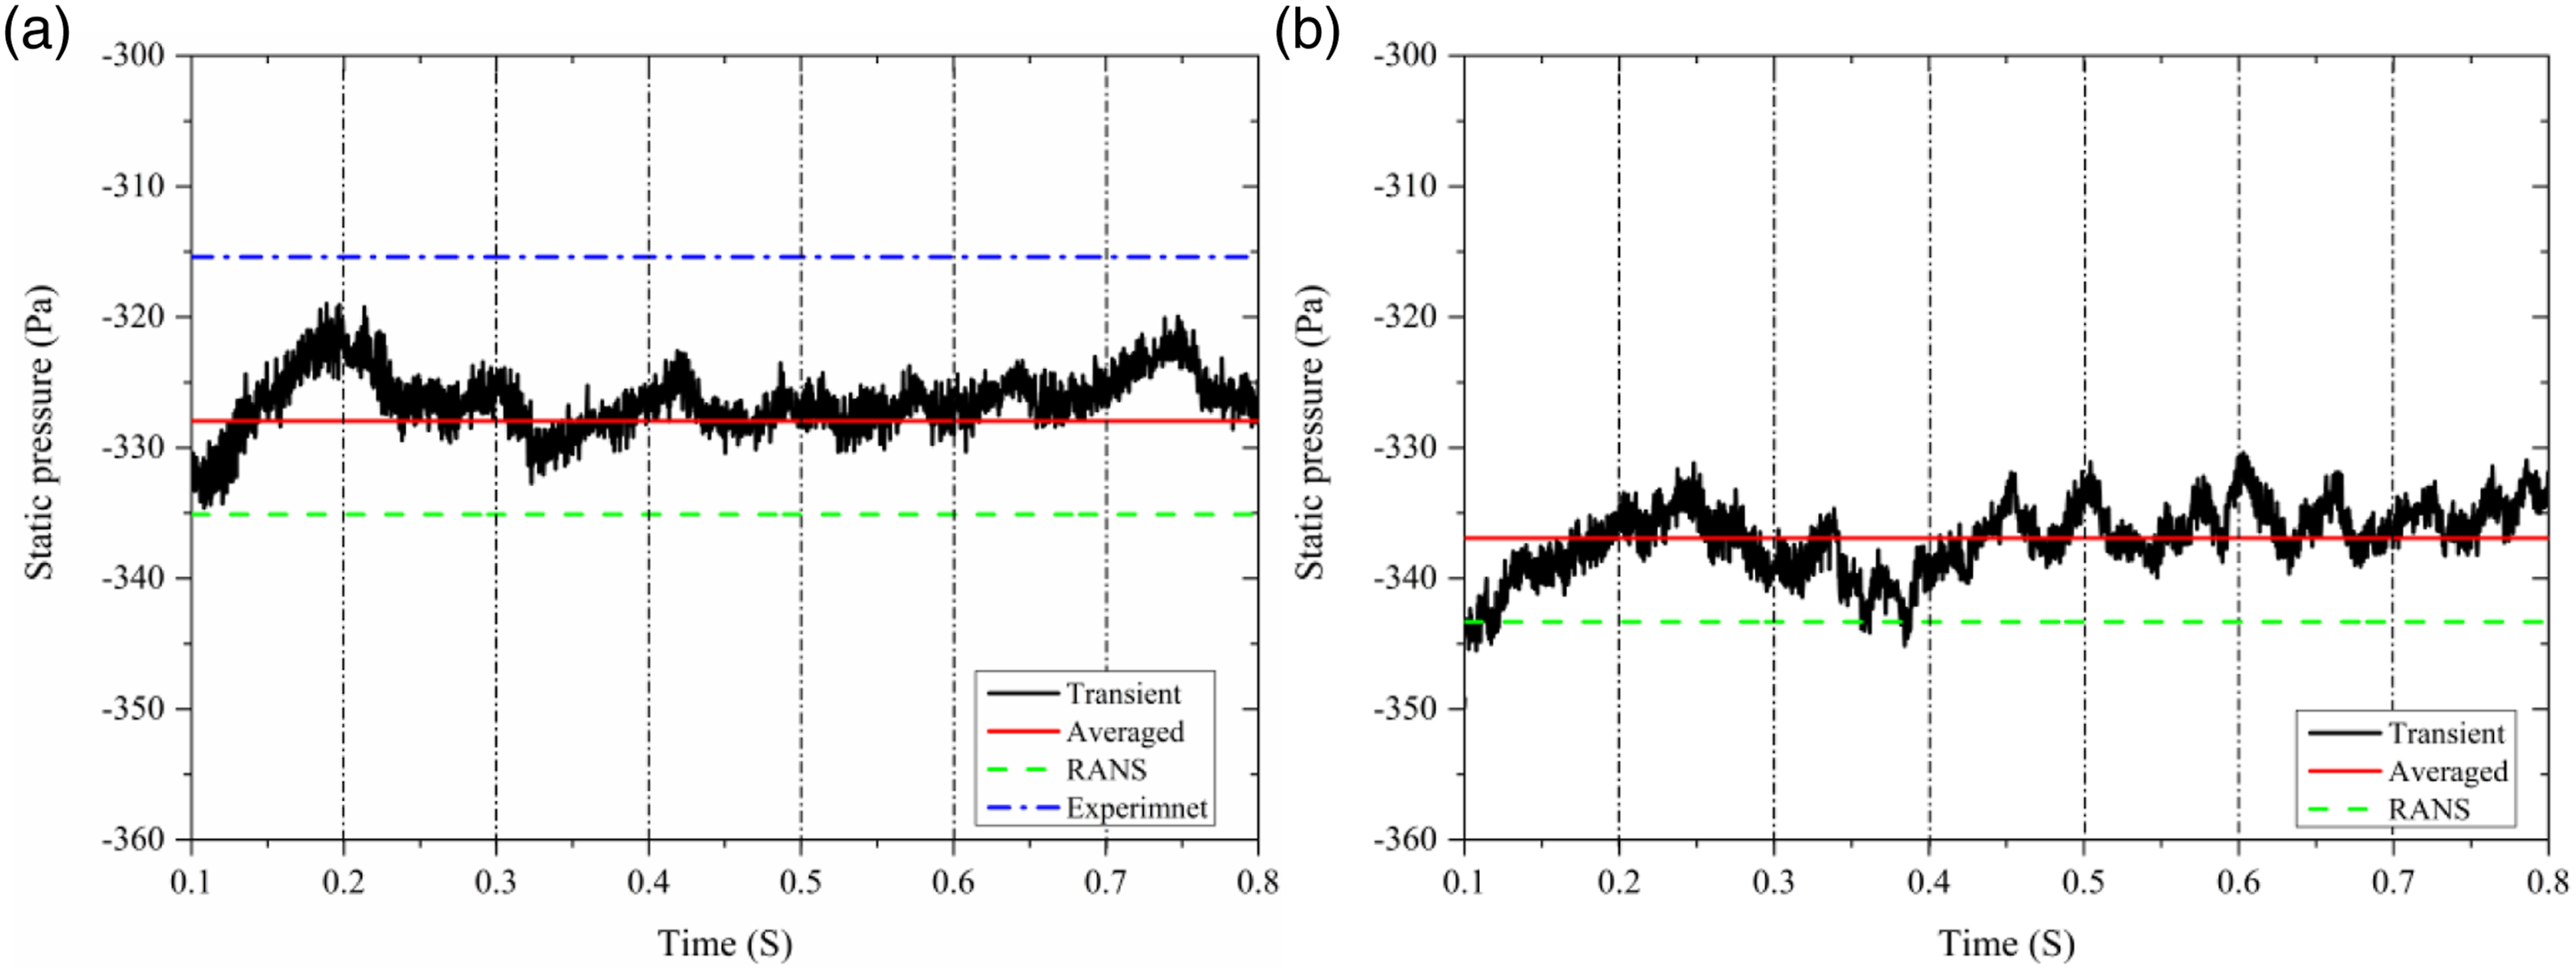
Figure 9(a) that the mean static pressure obtained by LES is different from that of the steady-state RANS with a relative difference of about 2.11%, and is larger in magnitude than the experimental data by about 3.83%, which reflects the strong fluctuating behaviors of the internal flow. The difference is also observed for the optimized model, the mean static pressure obtained by LES is 1.86% in magnitude smaller than that of steady-state RANS. It is noticed that the mean static pressure of the optimized model is 2.73% larger than the baseline model. Regular periodic fluctuation of static pressure emerges roughly from the fourth cycle with high frequency modulation, and the fluctuation is more remarkable than the baseline fan. It is concluded that optimized fan induces stronger fluctuating flow than the baseline fan.
General characteristics of flow within the fan
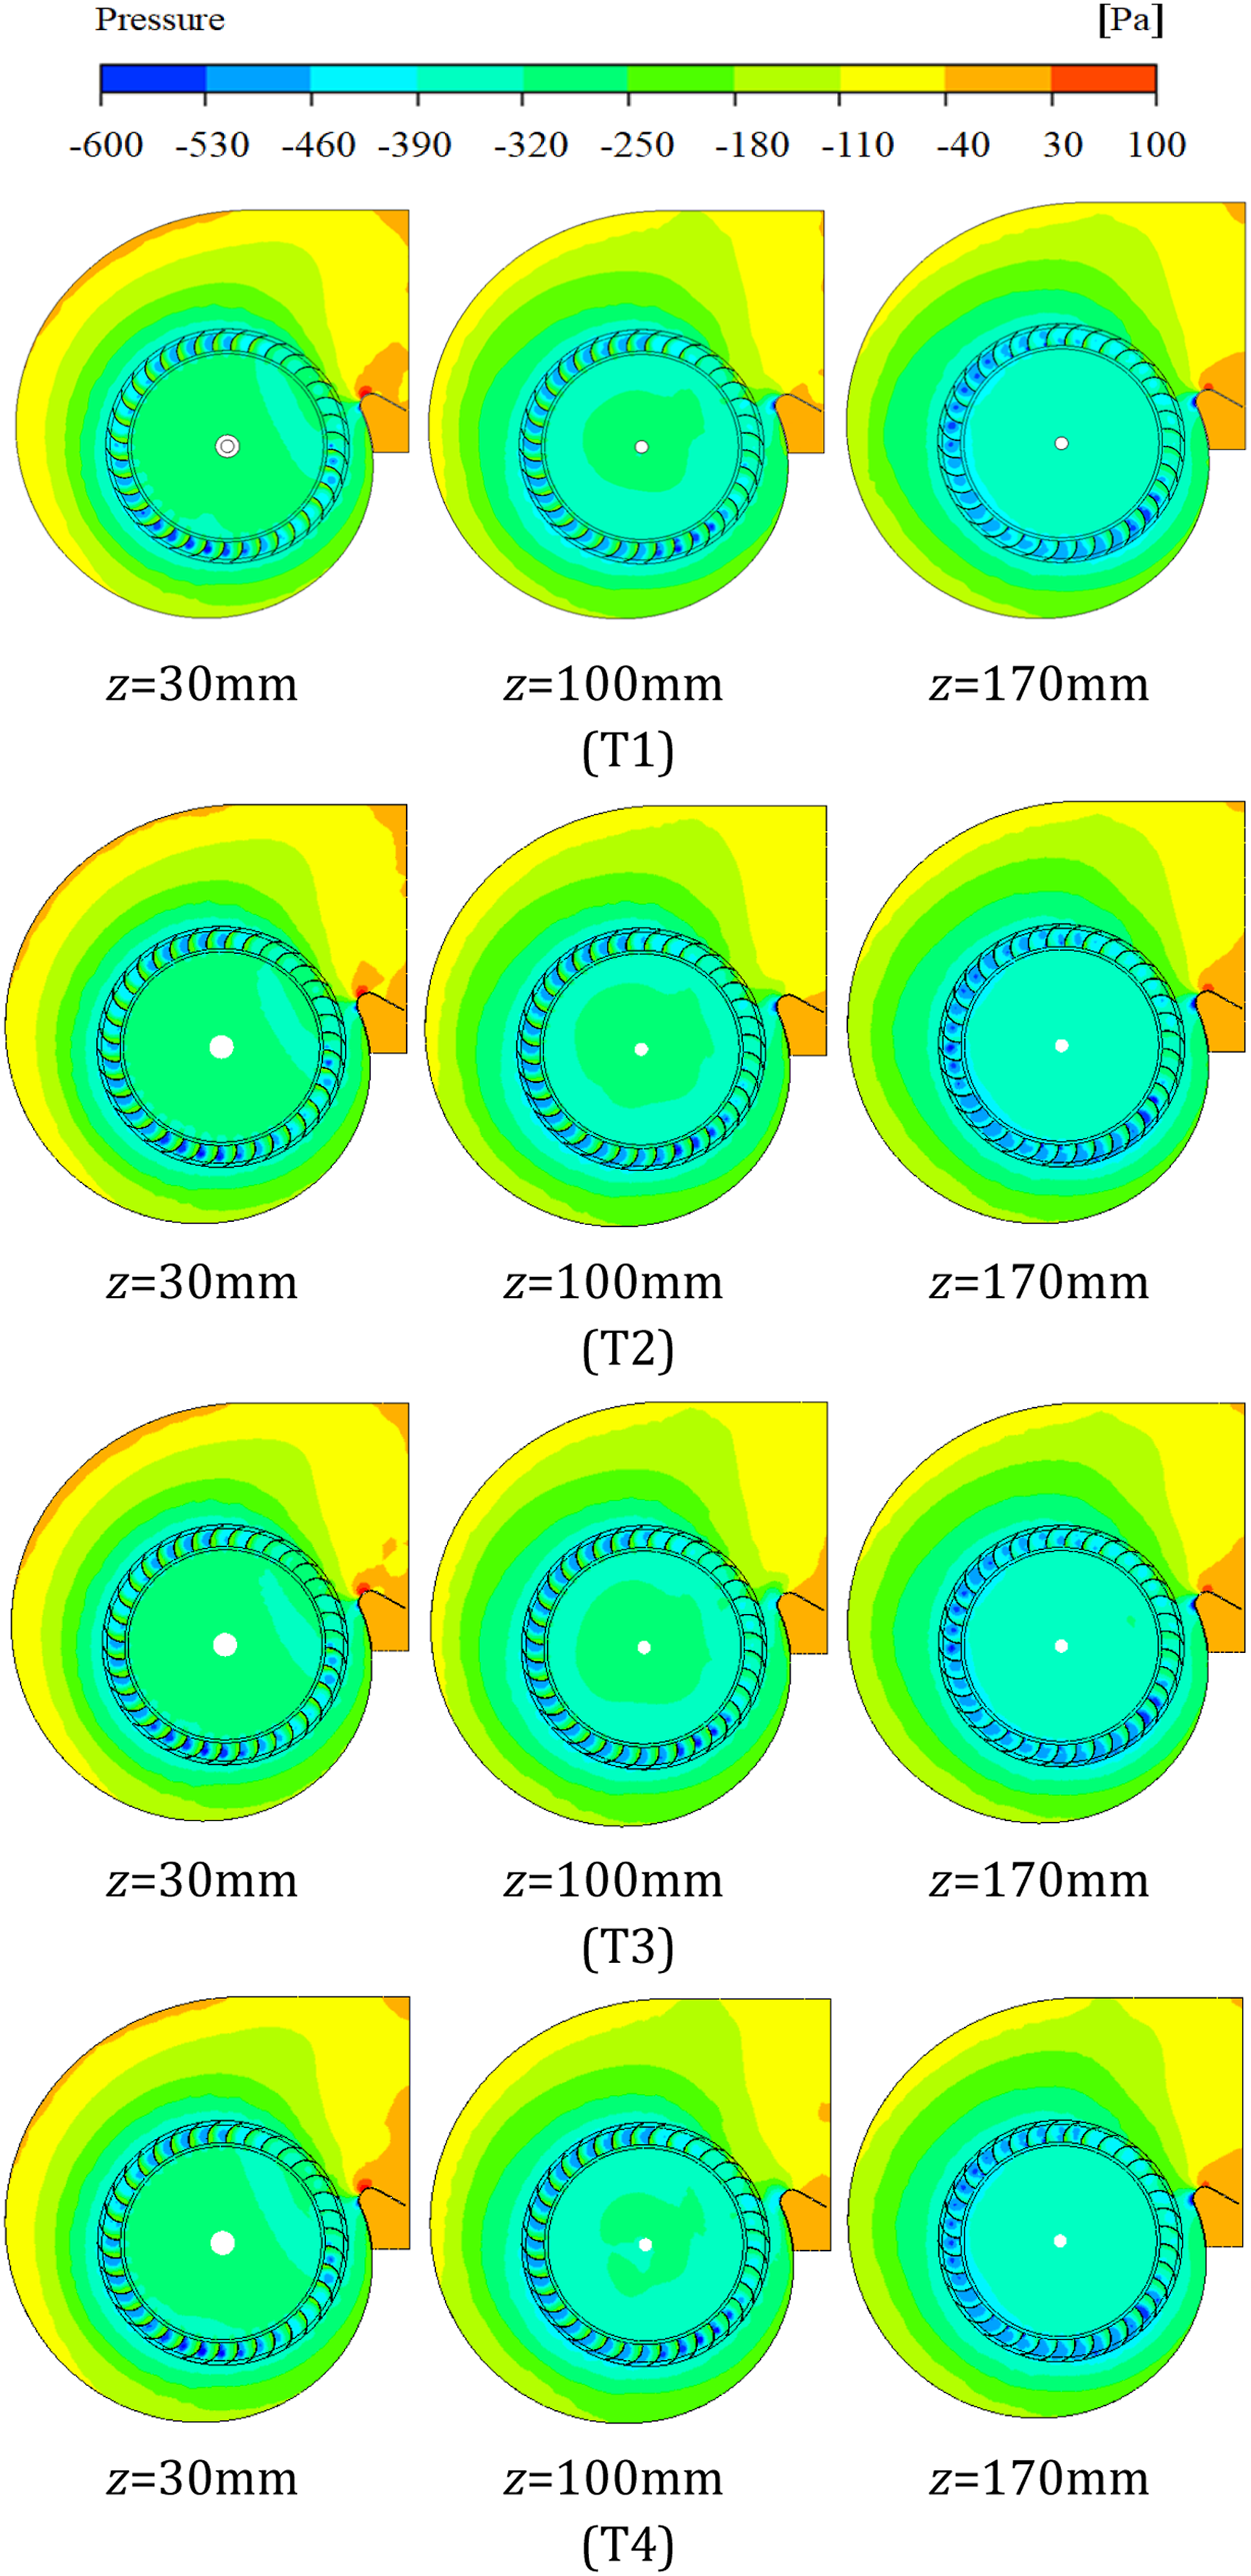
The effect of the optimization on the fan is analyzed by the general characteristics of internal flow. We present the distributions of instantaneous pressure and streamlines on three cross-sections, i.e., close to central disc at z = 30 mm, in the central region of the impeller at z = 100 mm, and close to inlet of the impeller at z = 170 mm, respectively, as shown in Figure 10. Positions of the cross-sections normal to the axis of the fan.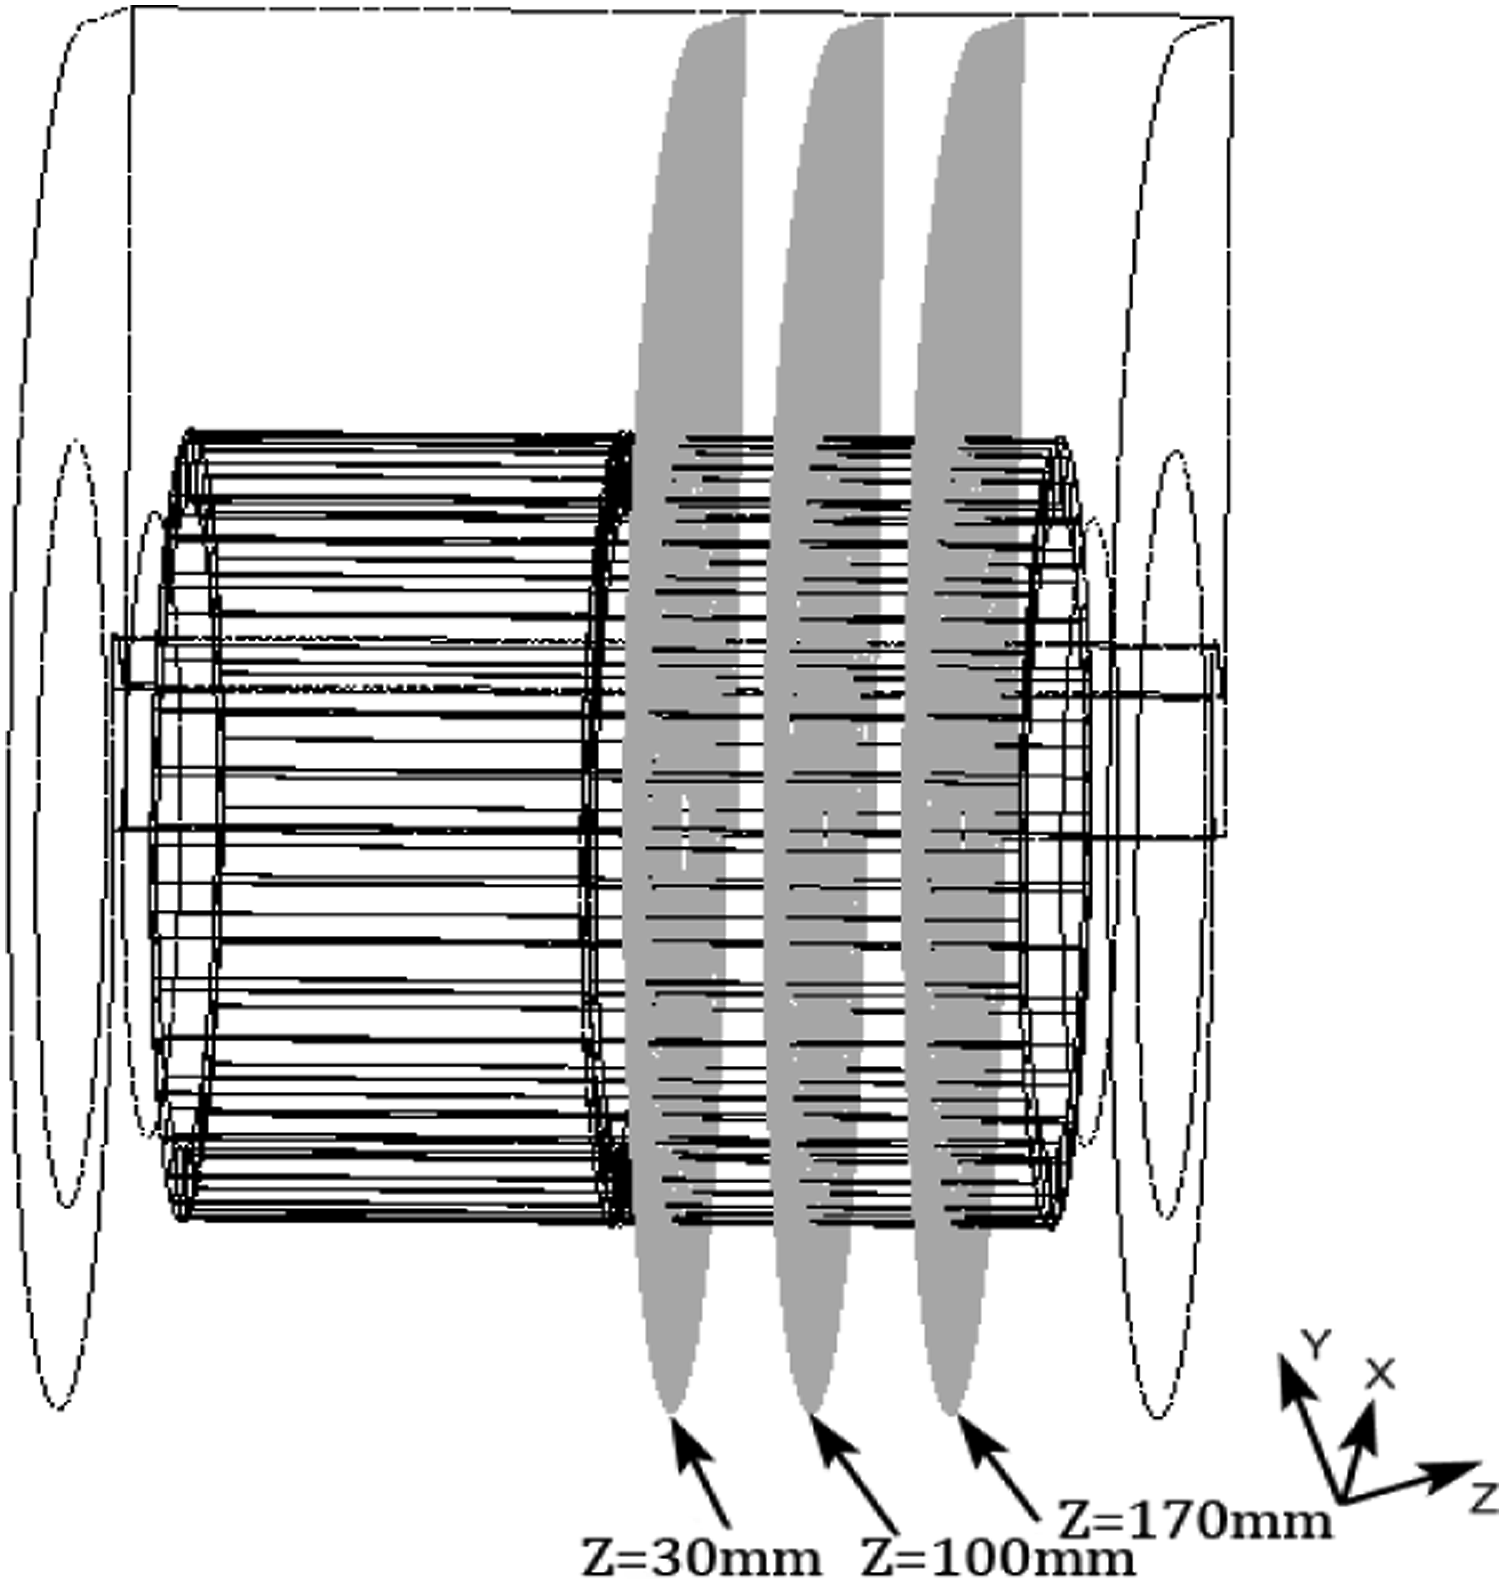
The characteristic quantities obtained from simulation are shown at four moments T1, T2, T3, and T4 as the fan rotates for 90° between two consecutive moments. The temporal variations of static pressure on the three cross-sections are shown in Figure 11 for the baseline fan. No significant difference is observed for pressure on the various cross-sections and at different moments except for flow within the central interior of the impeller; the low-pressure region slightly increases in area for flow close to the central disc. A high-pressure region is observed at the volute tongue on the z = 30 mm cross-section for all four moments, which is weakened for the z = 100 mm and 170 mm cross-sections; this phenomenon should be attributed to the deflection of direction of flow exiting from the impeller around the central disc. The temporal variations of static pressure for the optimized fan are shown in Figure 12 in which the difference is still negligible. On the z = 30 mm cross-section, the low-pressure flow is only observed within several blade passages, while it extends in area on the z = 100 mm and 170 mm cross-sections. The low-pressure flow is mainly observed in the region away from the volute tongue. Comparing the distributions of static pressure for the baseline and optimized fans, it is seen that the temporal variation has the same tendency, i.e., the internal flow within the fan is relatively stable especially in the region within the impeller. The pressure gradient at the outlet of the fan is higher for the optimized fan. Due to the reduced number of blades for the optimized fan, the low-pressure flow occupies more blade passages, while its pressure increases as a result of the improved capability of the fan in transforming kinetic energy to pressure energy. Distribution of instantaneous static pressure on the cross-sections for the baseline fan (from left to right): z = 30 mm, 100 mm and 170 mm. Distribution of instantaneous static pressure on the cross-sections for the optimized fan (from left to right): z = 30 mm, 100 mm and 170 mm.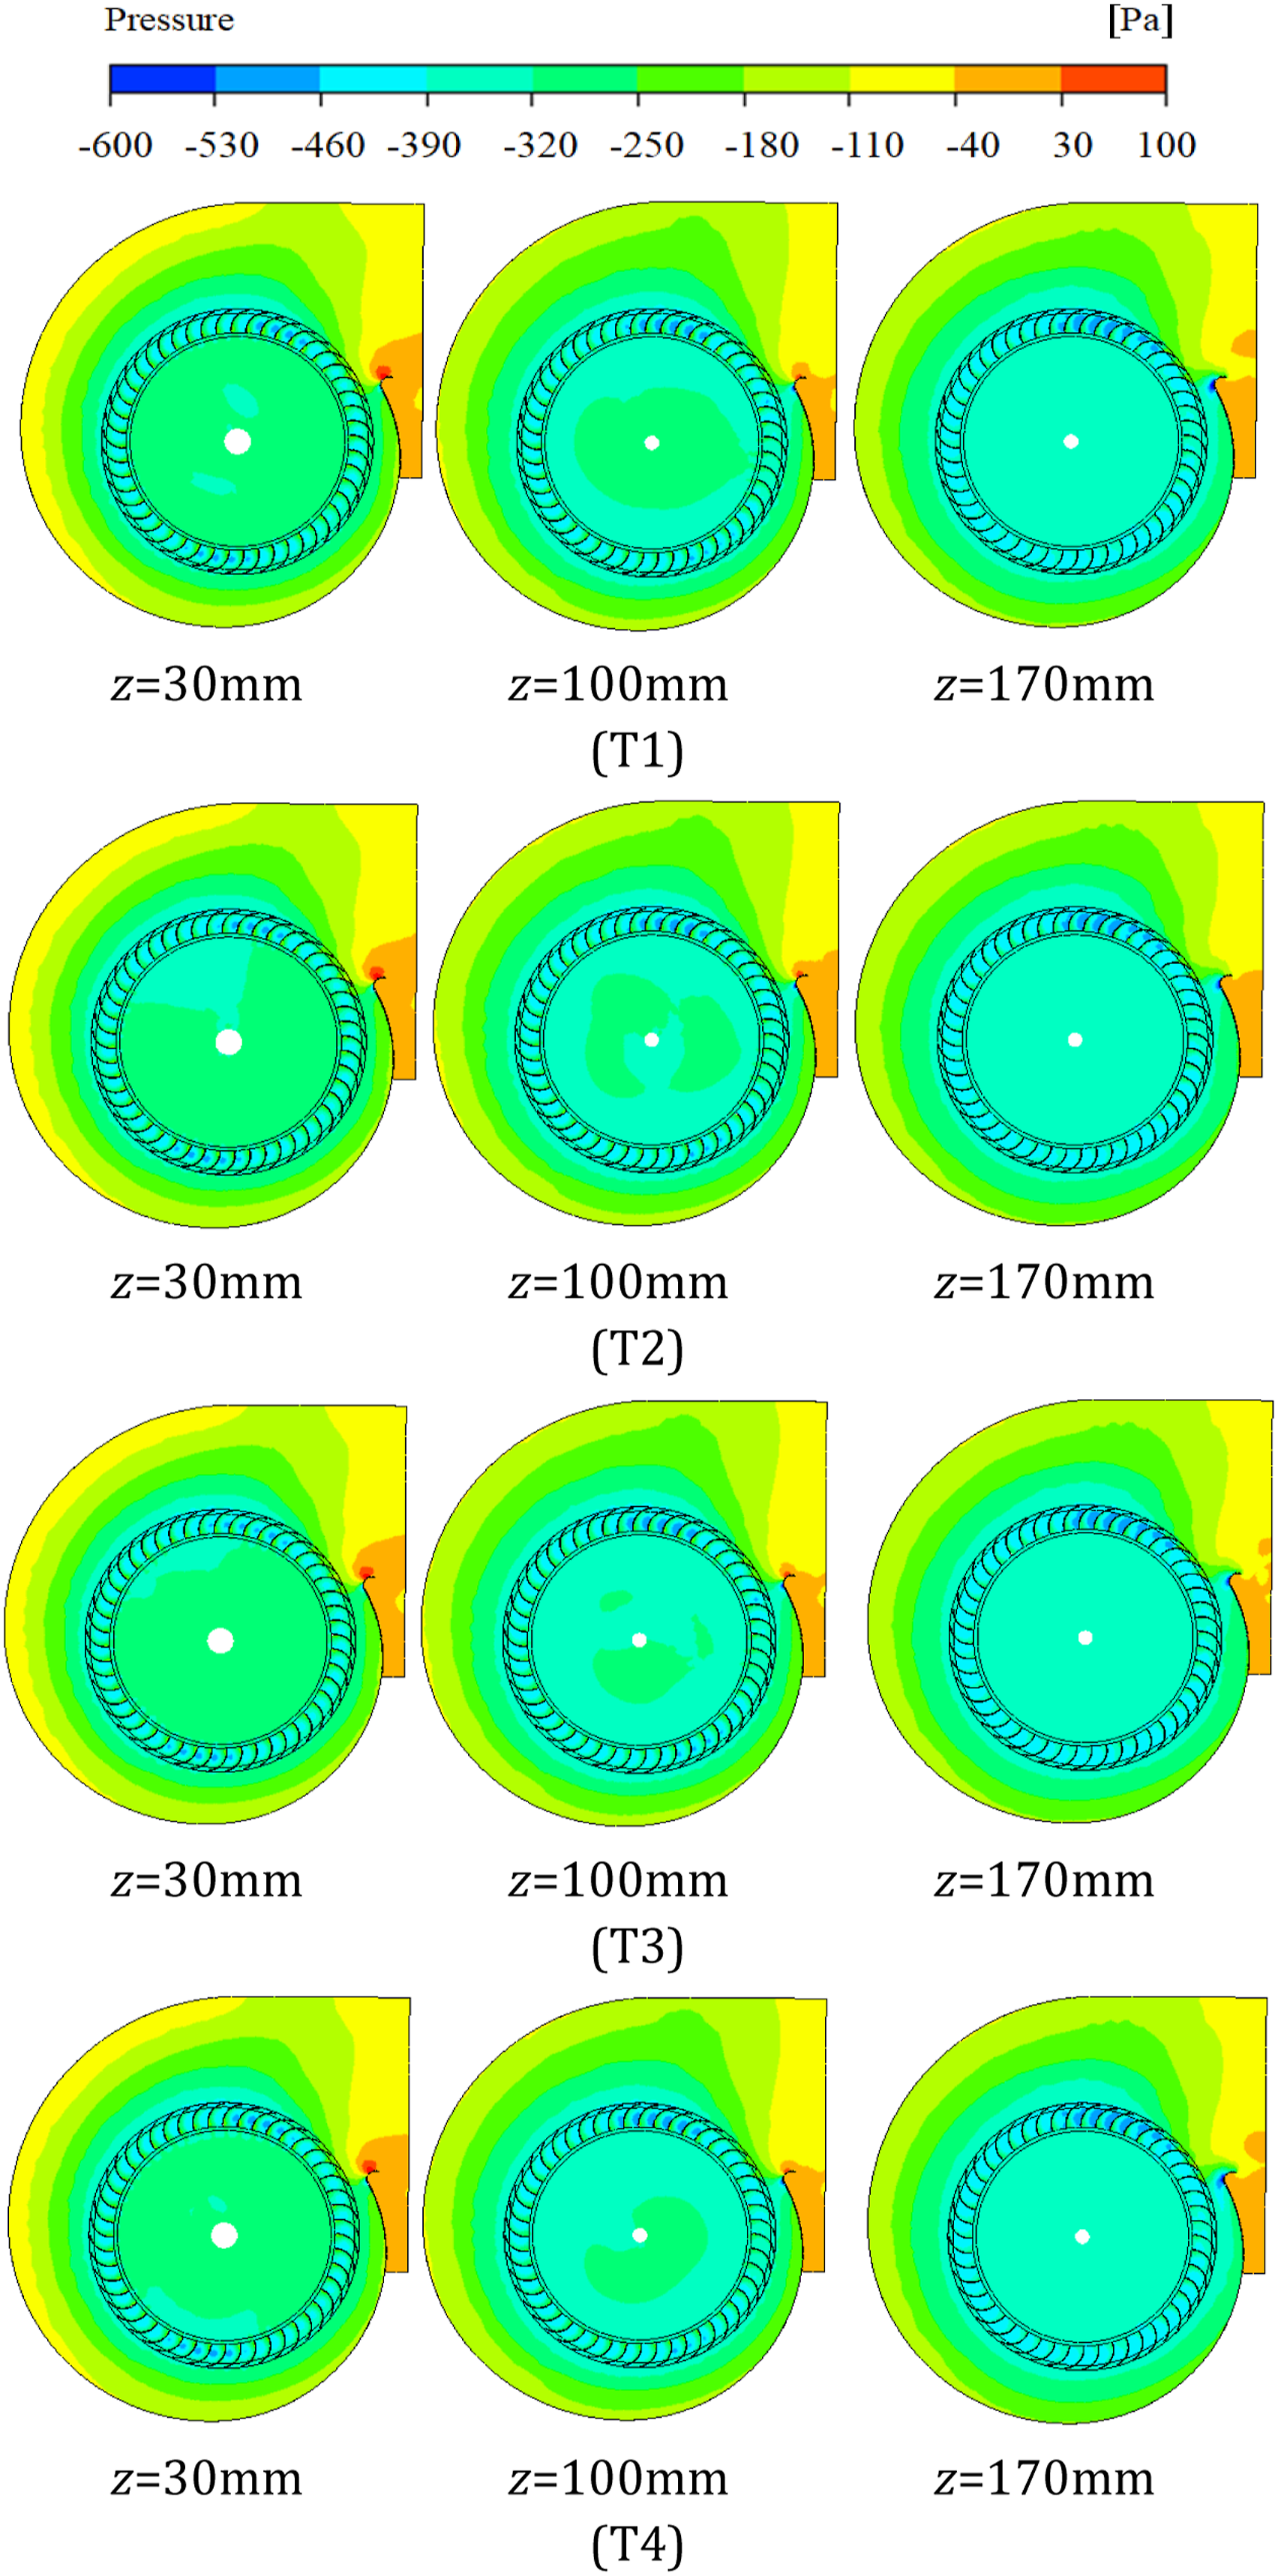
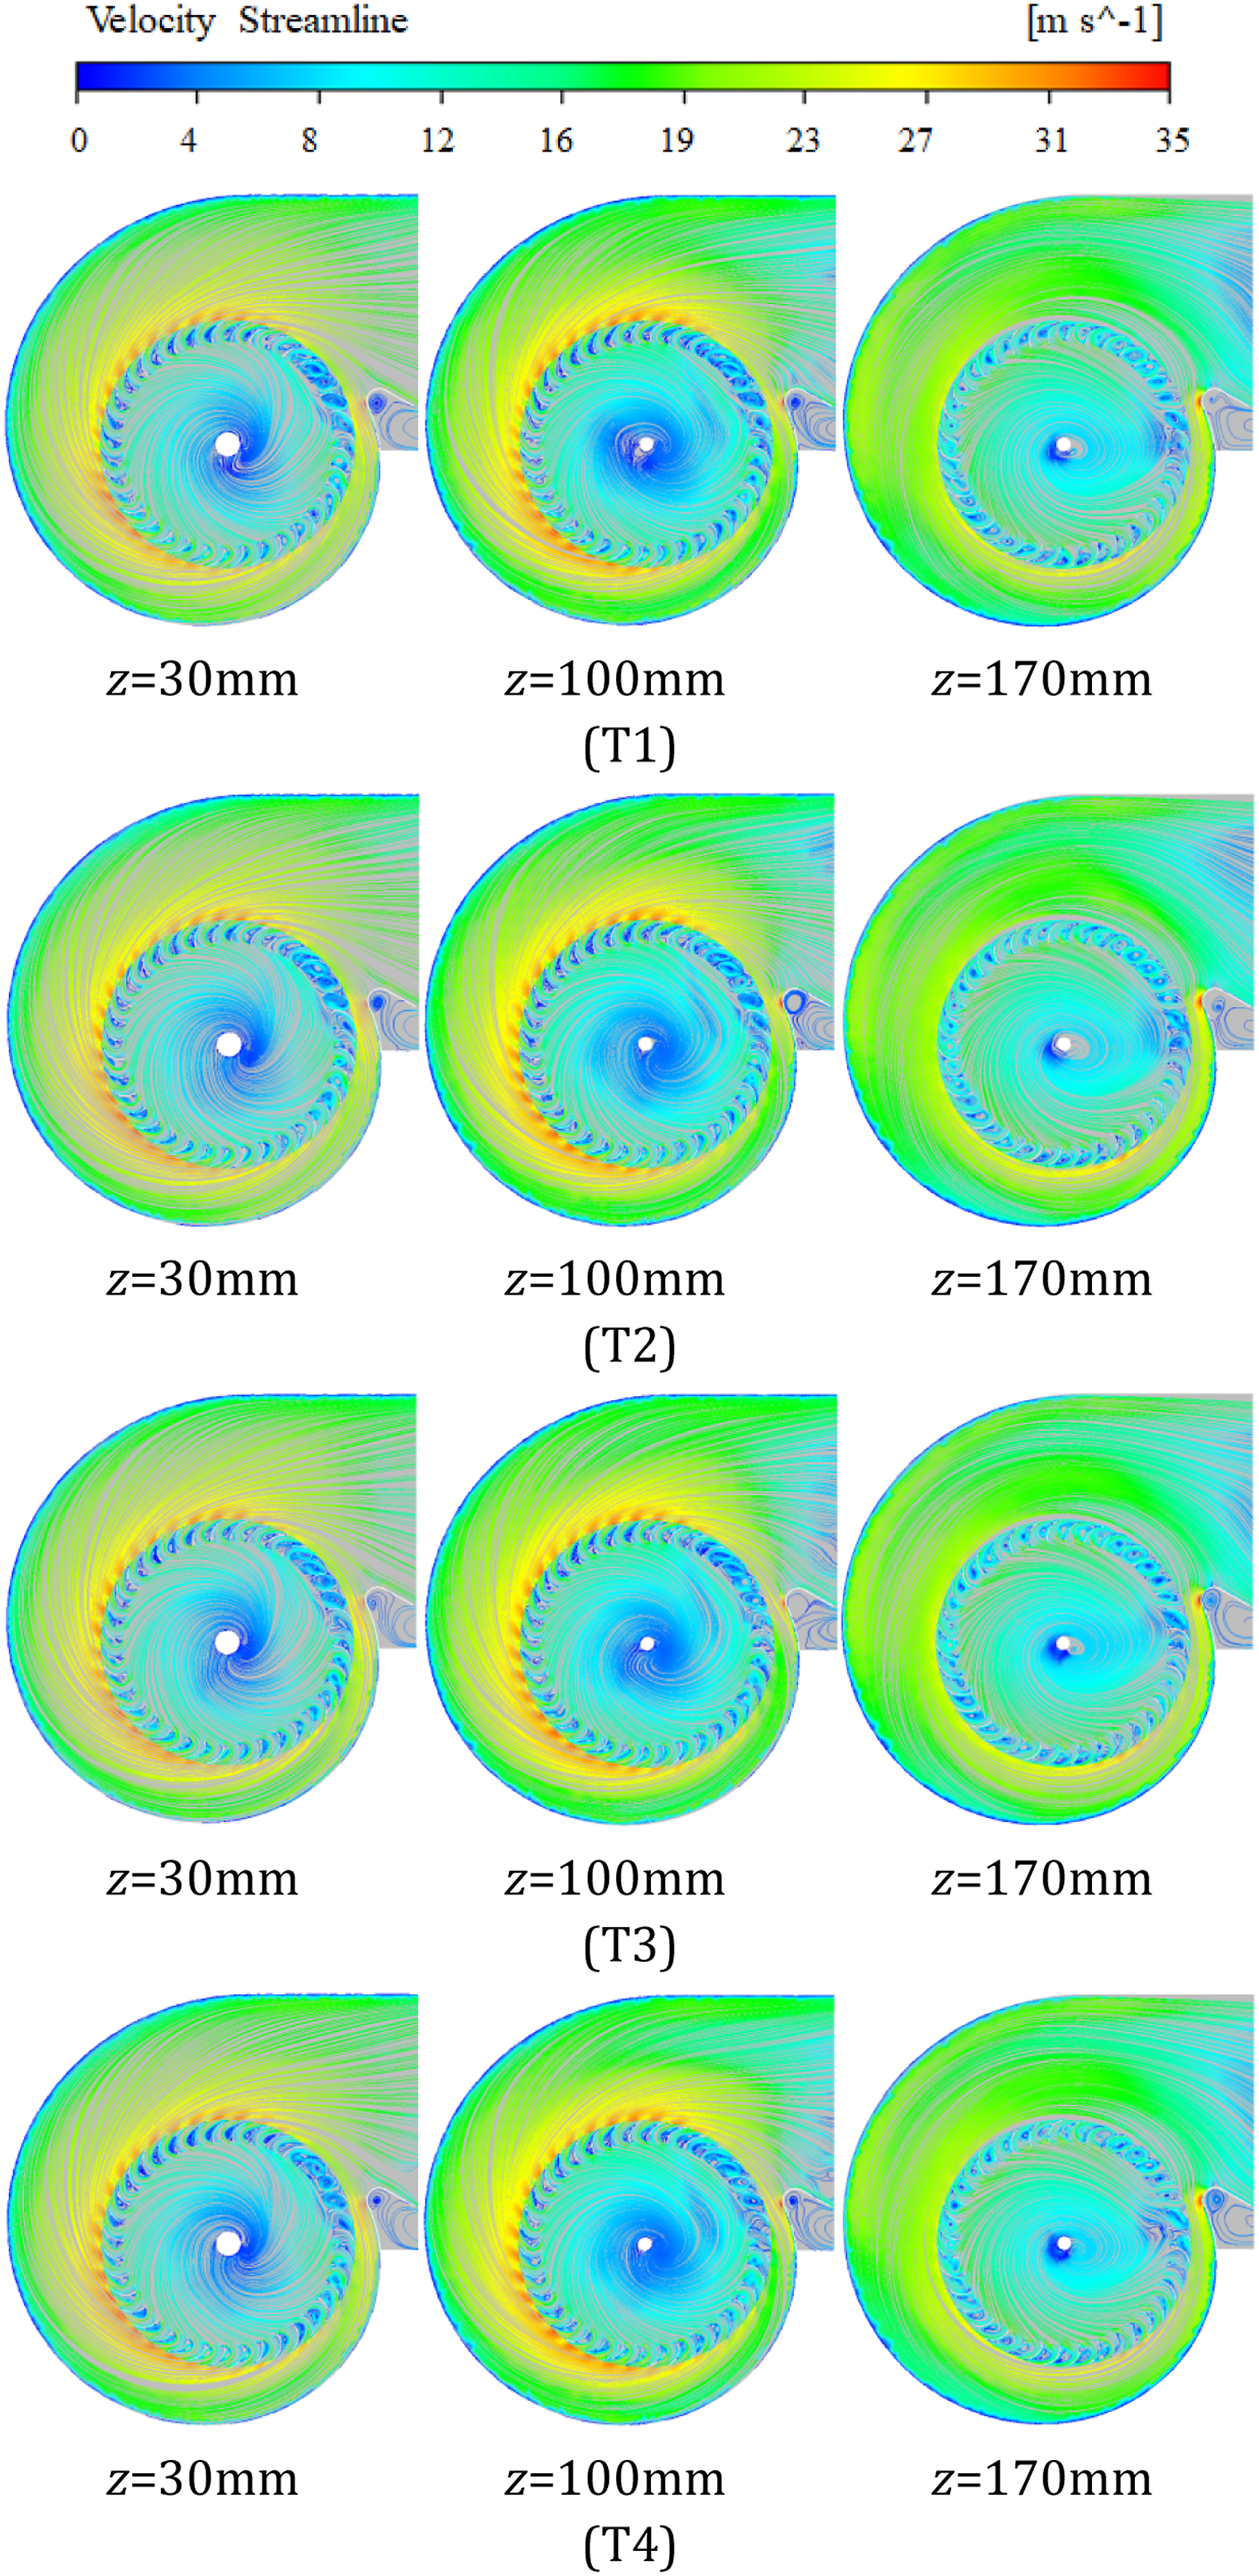
The distribution of streamlines at several moments is presented in Figures 13 and 14 for the baseline and optimized fans, respectively. The magnitude of velocity is the highest in the region above the impeller and is the lowest in the central interior of the impeller. Recirculating vortices are clearly observed in the blade passages as well as in the central interior of the impeller, and more vortices form in the blade passages near the fan inlet on the z = 170 mm cross-section, however, the recirculating flow around the shaft of the impeller is greatly reduced. From the distribution of streamlines, it is seen that the recirculating flow occupies the majority part of the blade passages and blocks the through-flow, thus the velocity of flow within the volute is low and is strongly non-uniform around the volute tongue. Compared with the baseline fan, the recirculating flow is generally observed around the volute tongue and is inconspicuous in other blade passages, which alleviates the blockage effect; the fluid flow in the volute is also comparably temporarily stable and uniform especially at the outlet of the fan. The magnitude of velocity of flow is notably affected by the parameter variations. The magnitude of flow at the outlet of the impeller is higher for the optimized fan for the various moments and on three cross-sections. On the z = 30 mm cross-section, the magnitude of velocity for the recirculating flow is generally higher at the central interior of the impeller and also in the blade passages, which improves the performance of through-flow. Distribution of instantaneous streamlines on the cross-sections for the baseline fan (from left to right): z = 30 mm, 100 mm and 170 mm. The color of the streamlines denotes the magnitude of velocity. Distribution of instantaneous streamlines on the cross-sections for the optimized fan (from left to right): z = 30 mm, 100 mm and 170 mm. The color of the streamlines denotes the magnitude of velocity.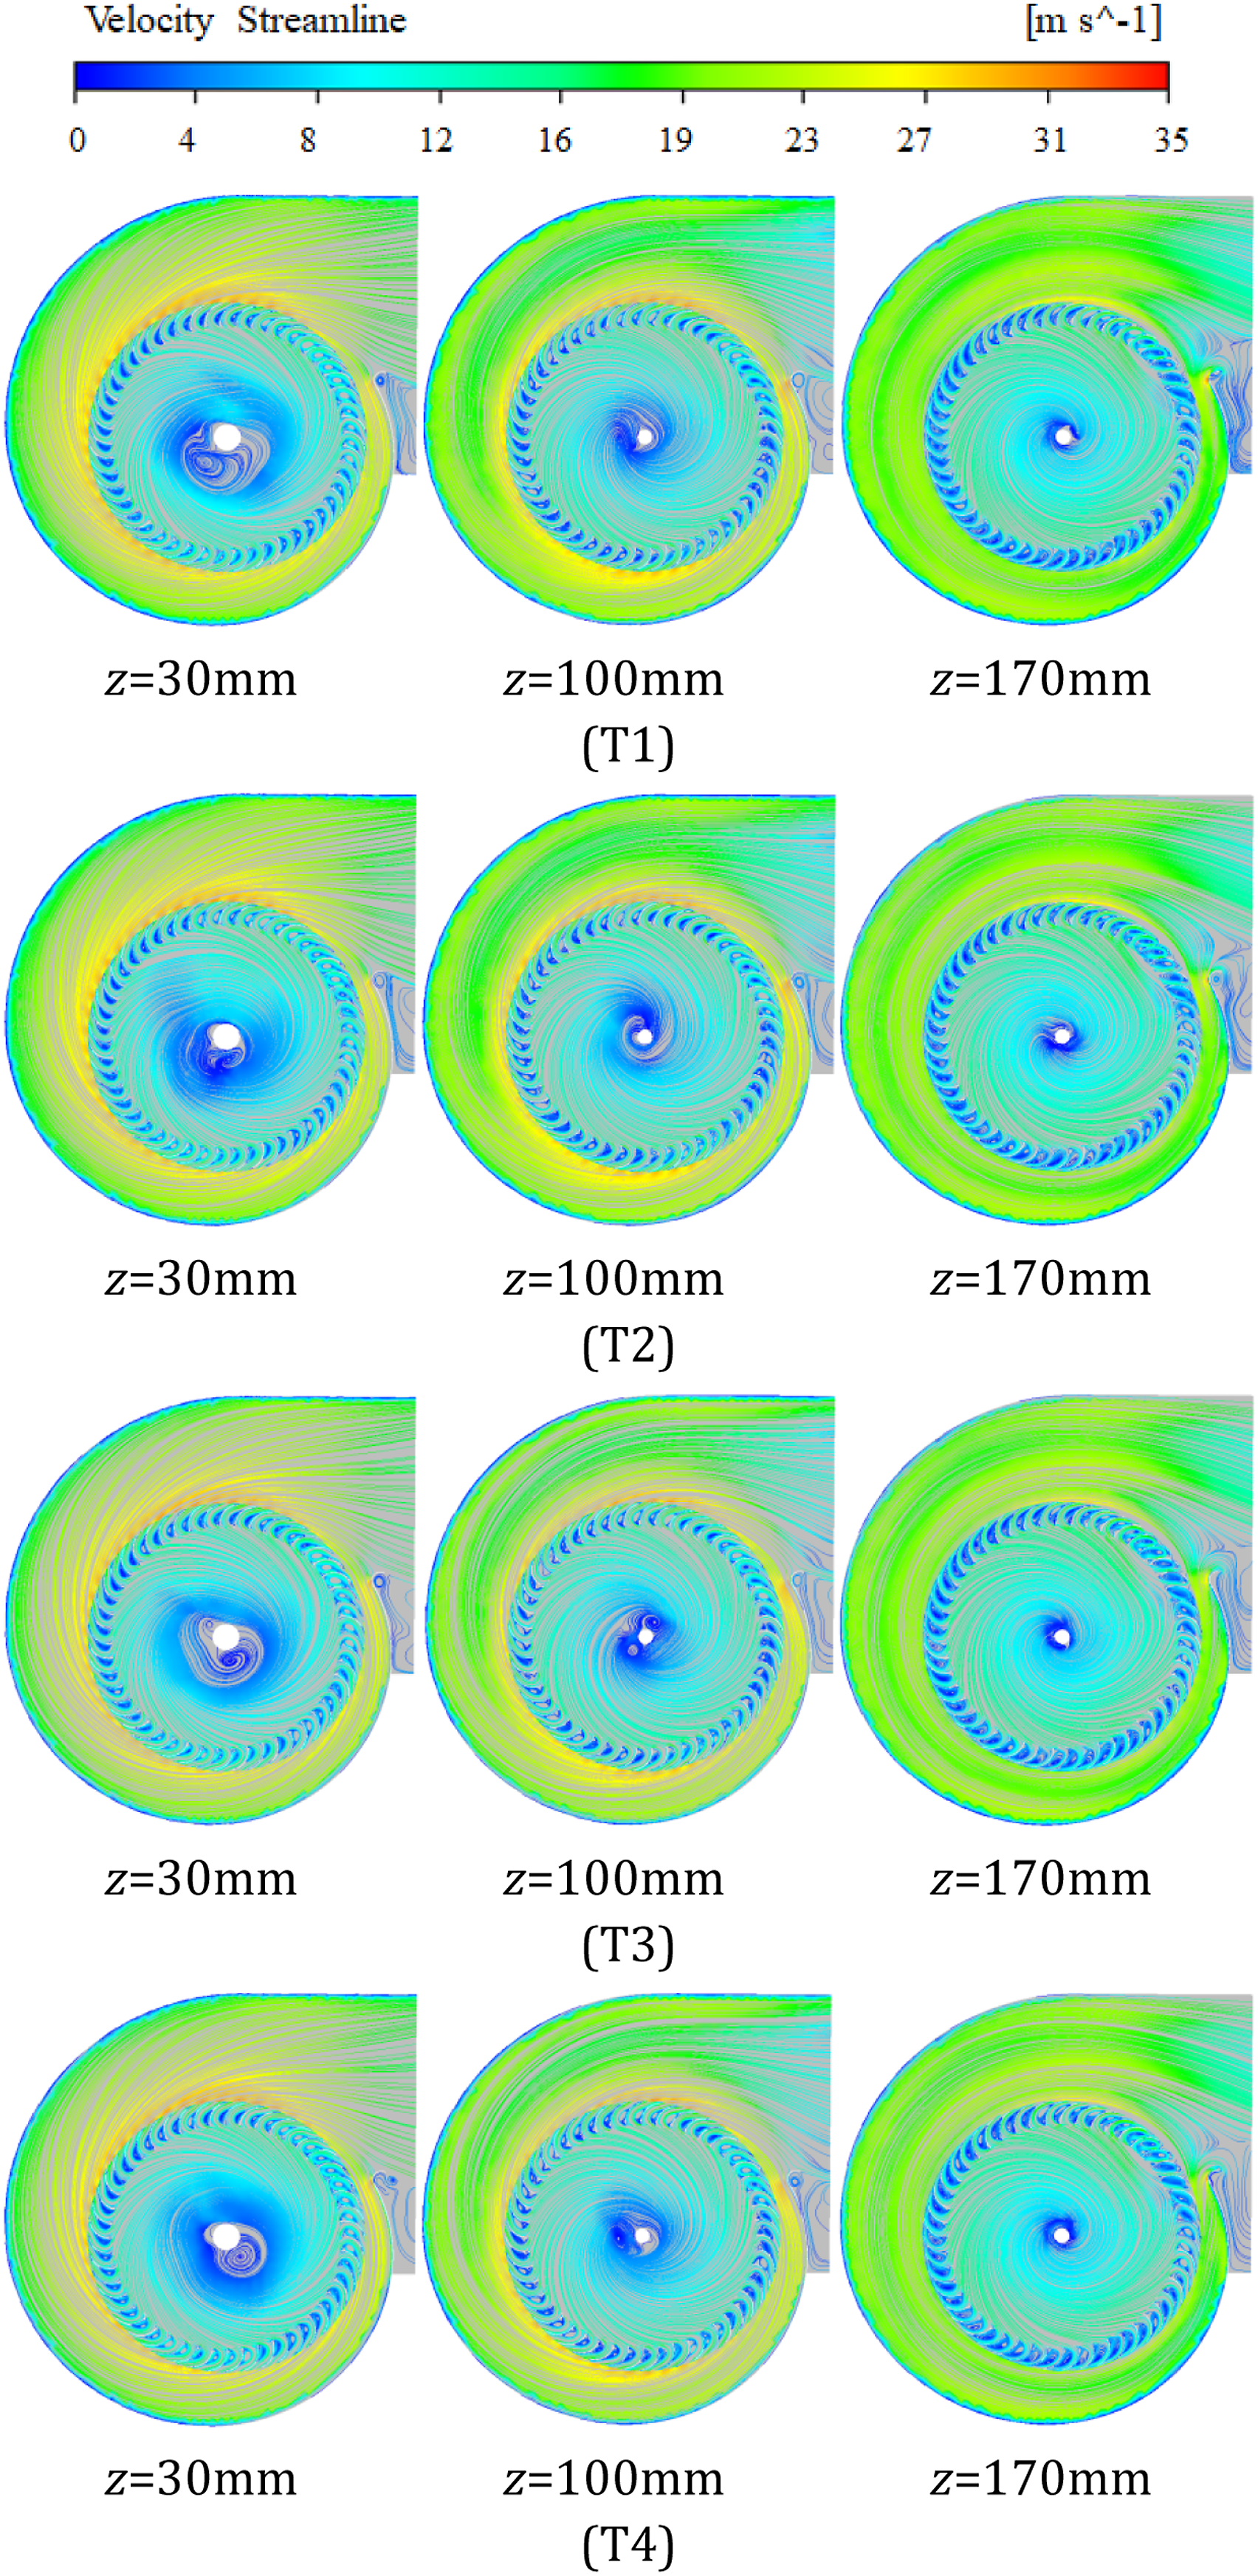
Characteristics of flow in the impeller
The non-axisymmetric volute restrains the exiting flow of the impeller, and thus affects the through-flow within the impeller via the mechanism of pressure propagation, thus local reversed flow may form in the passages of the impeller. In this section, we analyze the characteristics of flow at the inlet and outlet of the impeller on the three cross-sections, i.e., z = 30 mm, 100 mm and 170 mm, as given in Figure 10. The locations denoting the inlet and outlet circumferences of the impeller are shown in Figure 15. Since the diameter of the impeller at the leading and trailing edges of the blades are at r = 190 mm and 229 mm, respectively, we choose the circumference at r = 188 mm as the inlet and r = 231 mm as the outlet of the impeller. A circumferential angle is defined in the figure which starts from the positive-y direction and directs along the clockwise direction. The circumferential distribution of instantaneous radial velocity at the inlet and outlet of the impeller is presented in Figures 16 to 18 for the three constant-z cross-sections. The velocity vectors are shown at both the inlet and outlet circumferences, and the magnitude of radial velocity is also presented. Definition of locations of the inlet and outlet circumferences of the impeller. Circumferential distribution of instantaneous velocity vector and magnitude of radial velocity at the inlet and outlet circumferences of the impeller on the z = 30 mm cross-section: (a) Baseline fan: velocity vector; (b) Optimized fan: velocity vector; (c) Baseline fan: magnitude of radial velocity; (d) Optimized fan: magnitude of radial velocity. Circumferential distribution of instantaneous velocity vector and magnitude of radial velocity at the inlet and outlet circumferences of the impeller on the z = 100 mm cross-section: (a) Baseline fan: velocity vector; (b) Optimized fan: velocity vector; (c) Baseline fan: magnitude of radial velocity; (d) Optimized fan: magnitude of radial velocity. Circumferential distribution of instantaneous velocity vector and magnitude of radial velocity at the inlet and outlet circumferences of the impeller on the z = 170 mm cross-section: (a) Baseline fan: velocity vector; (b) Optimized fan: velocity vector; (c) Baseline fan: magnitude of radial velocity; (d) Optimized fan: magnitude of radial velocity.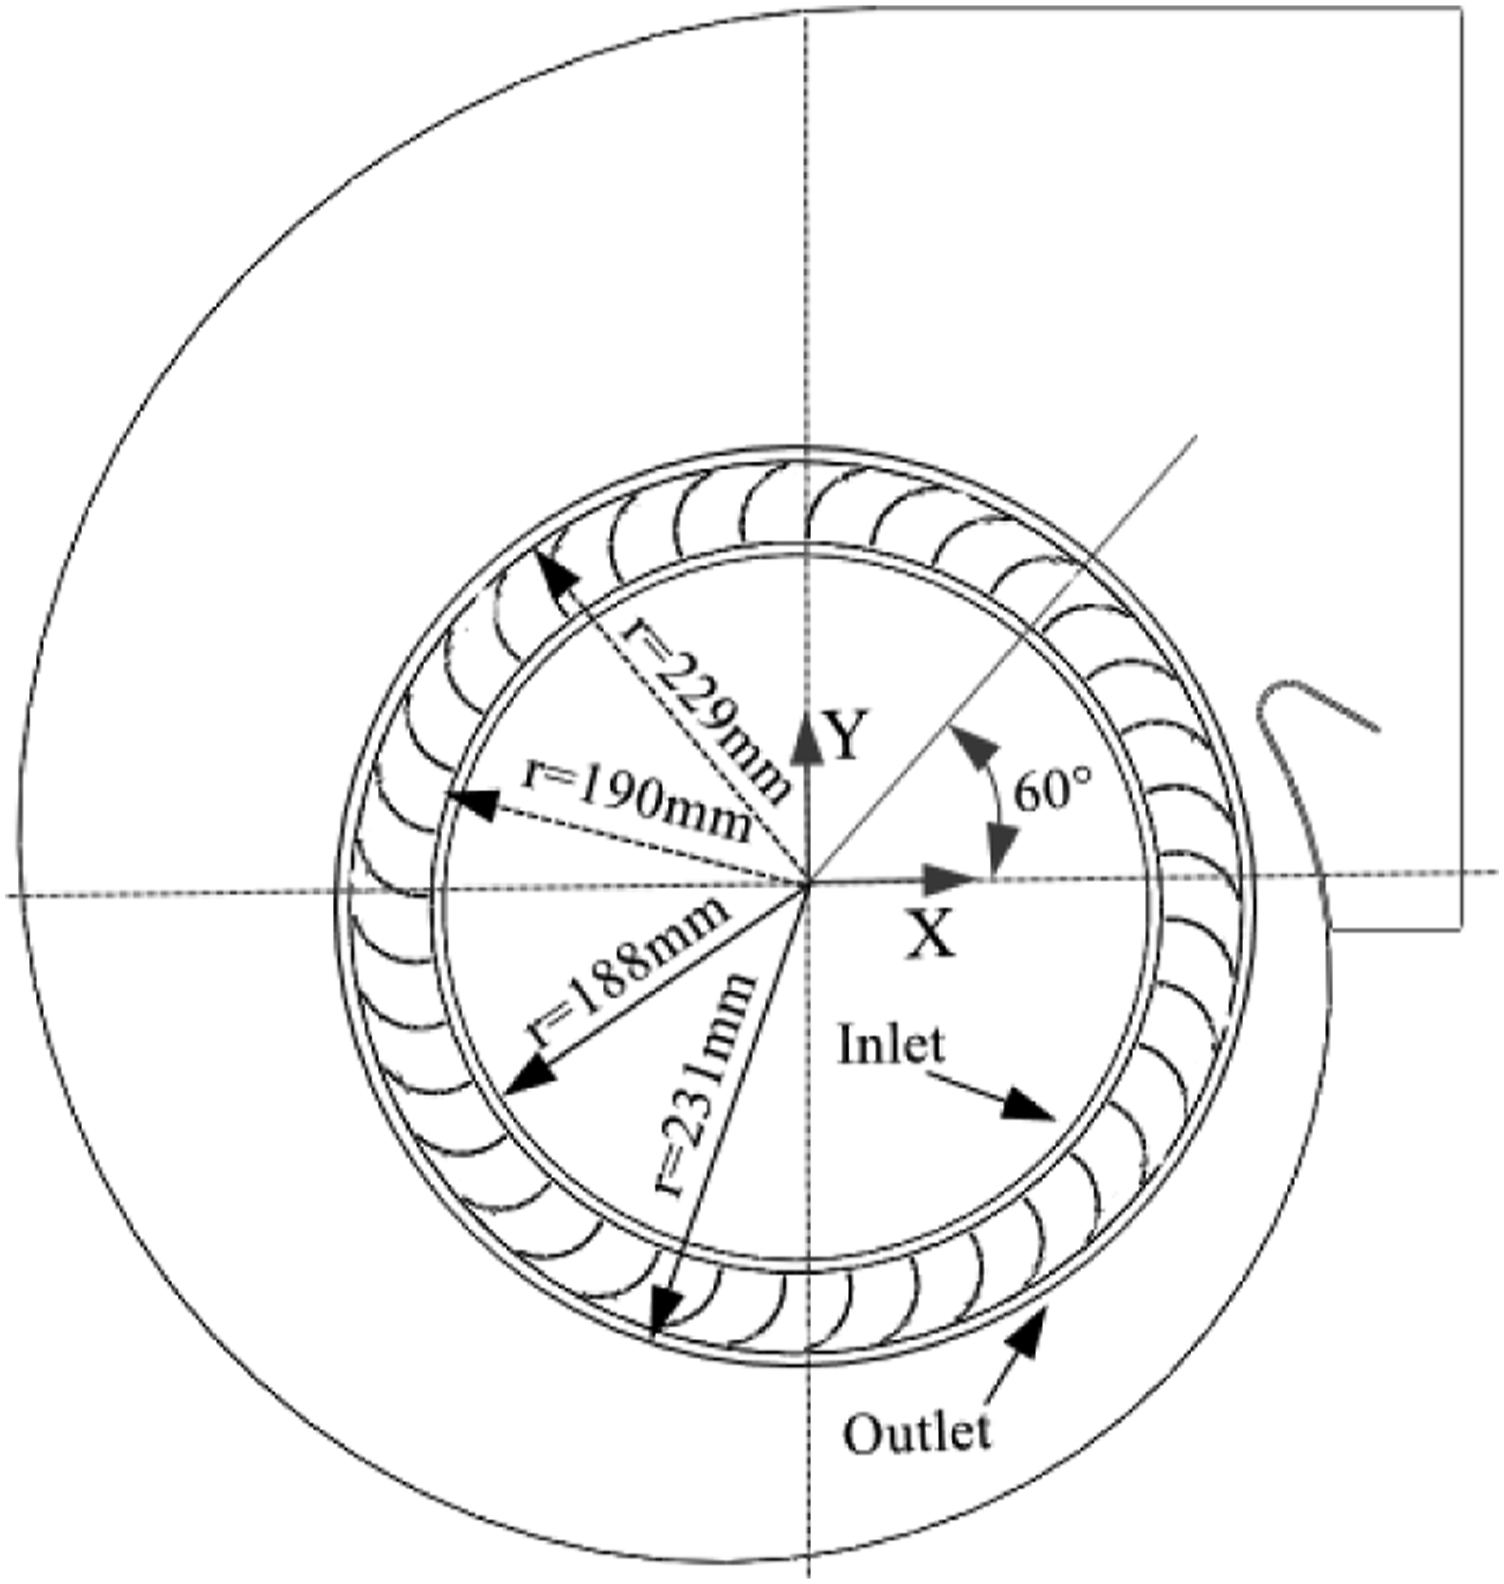
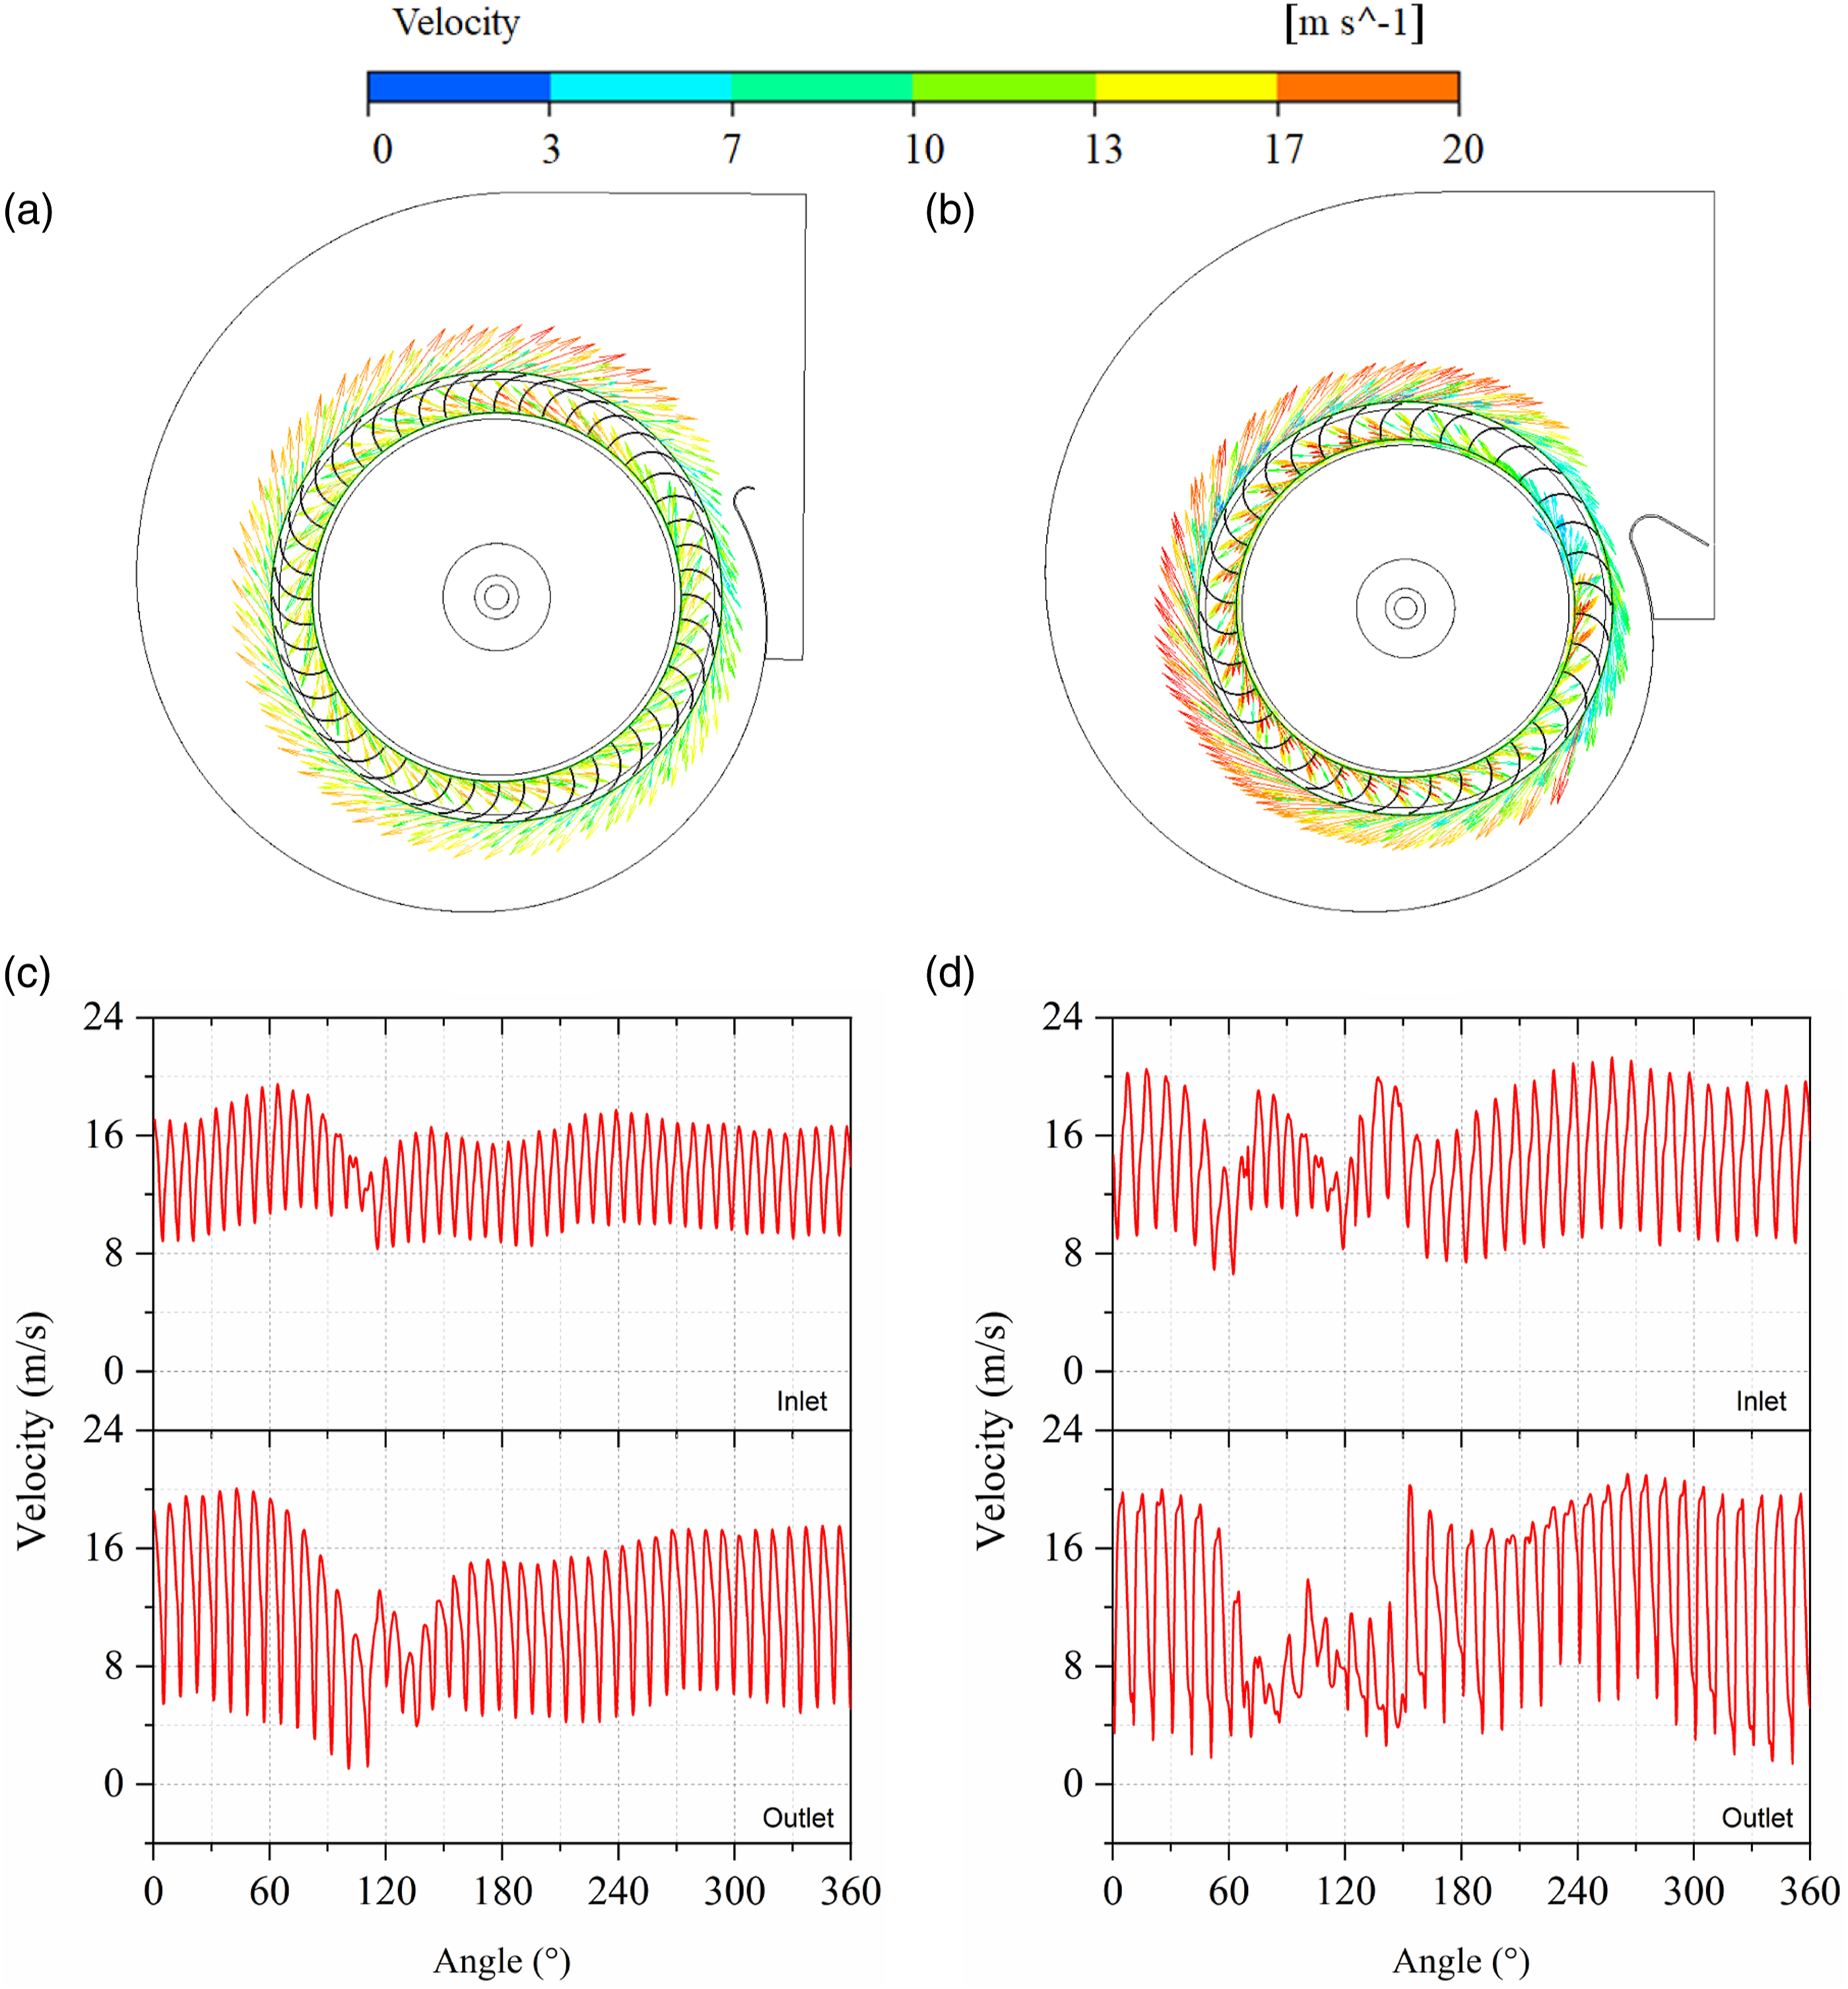
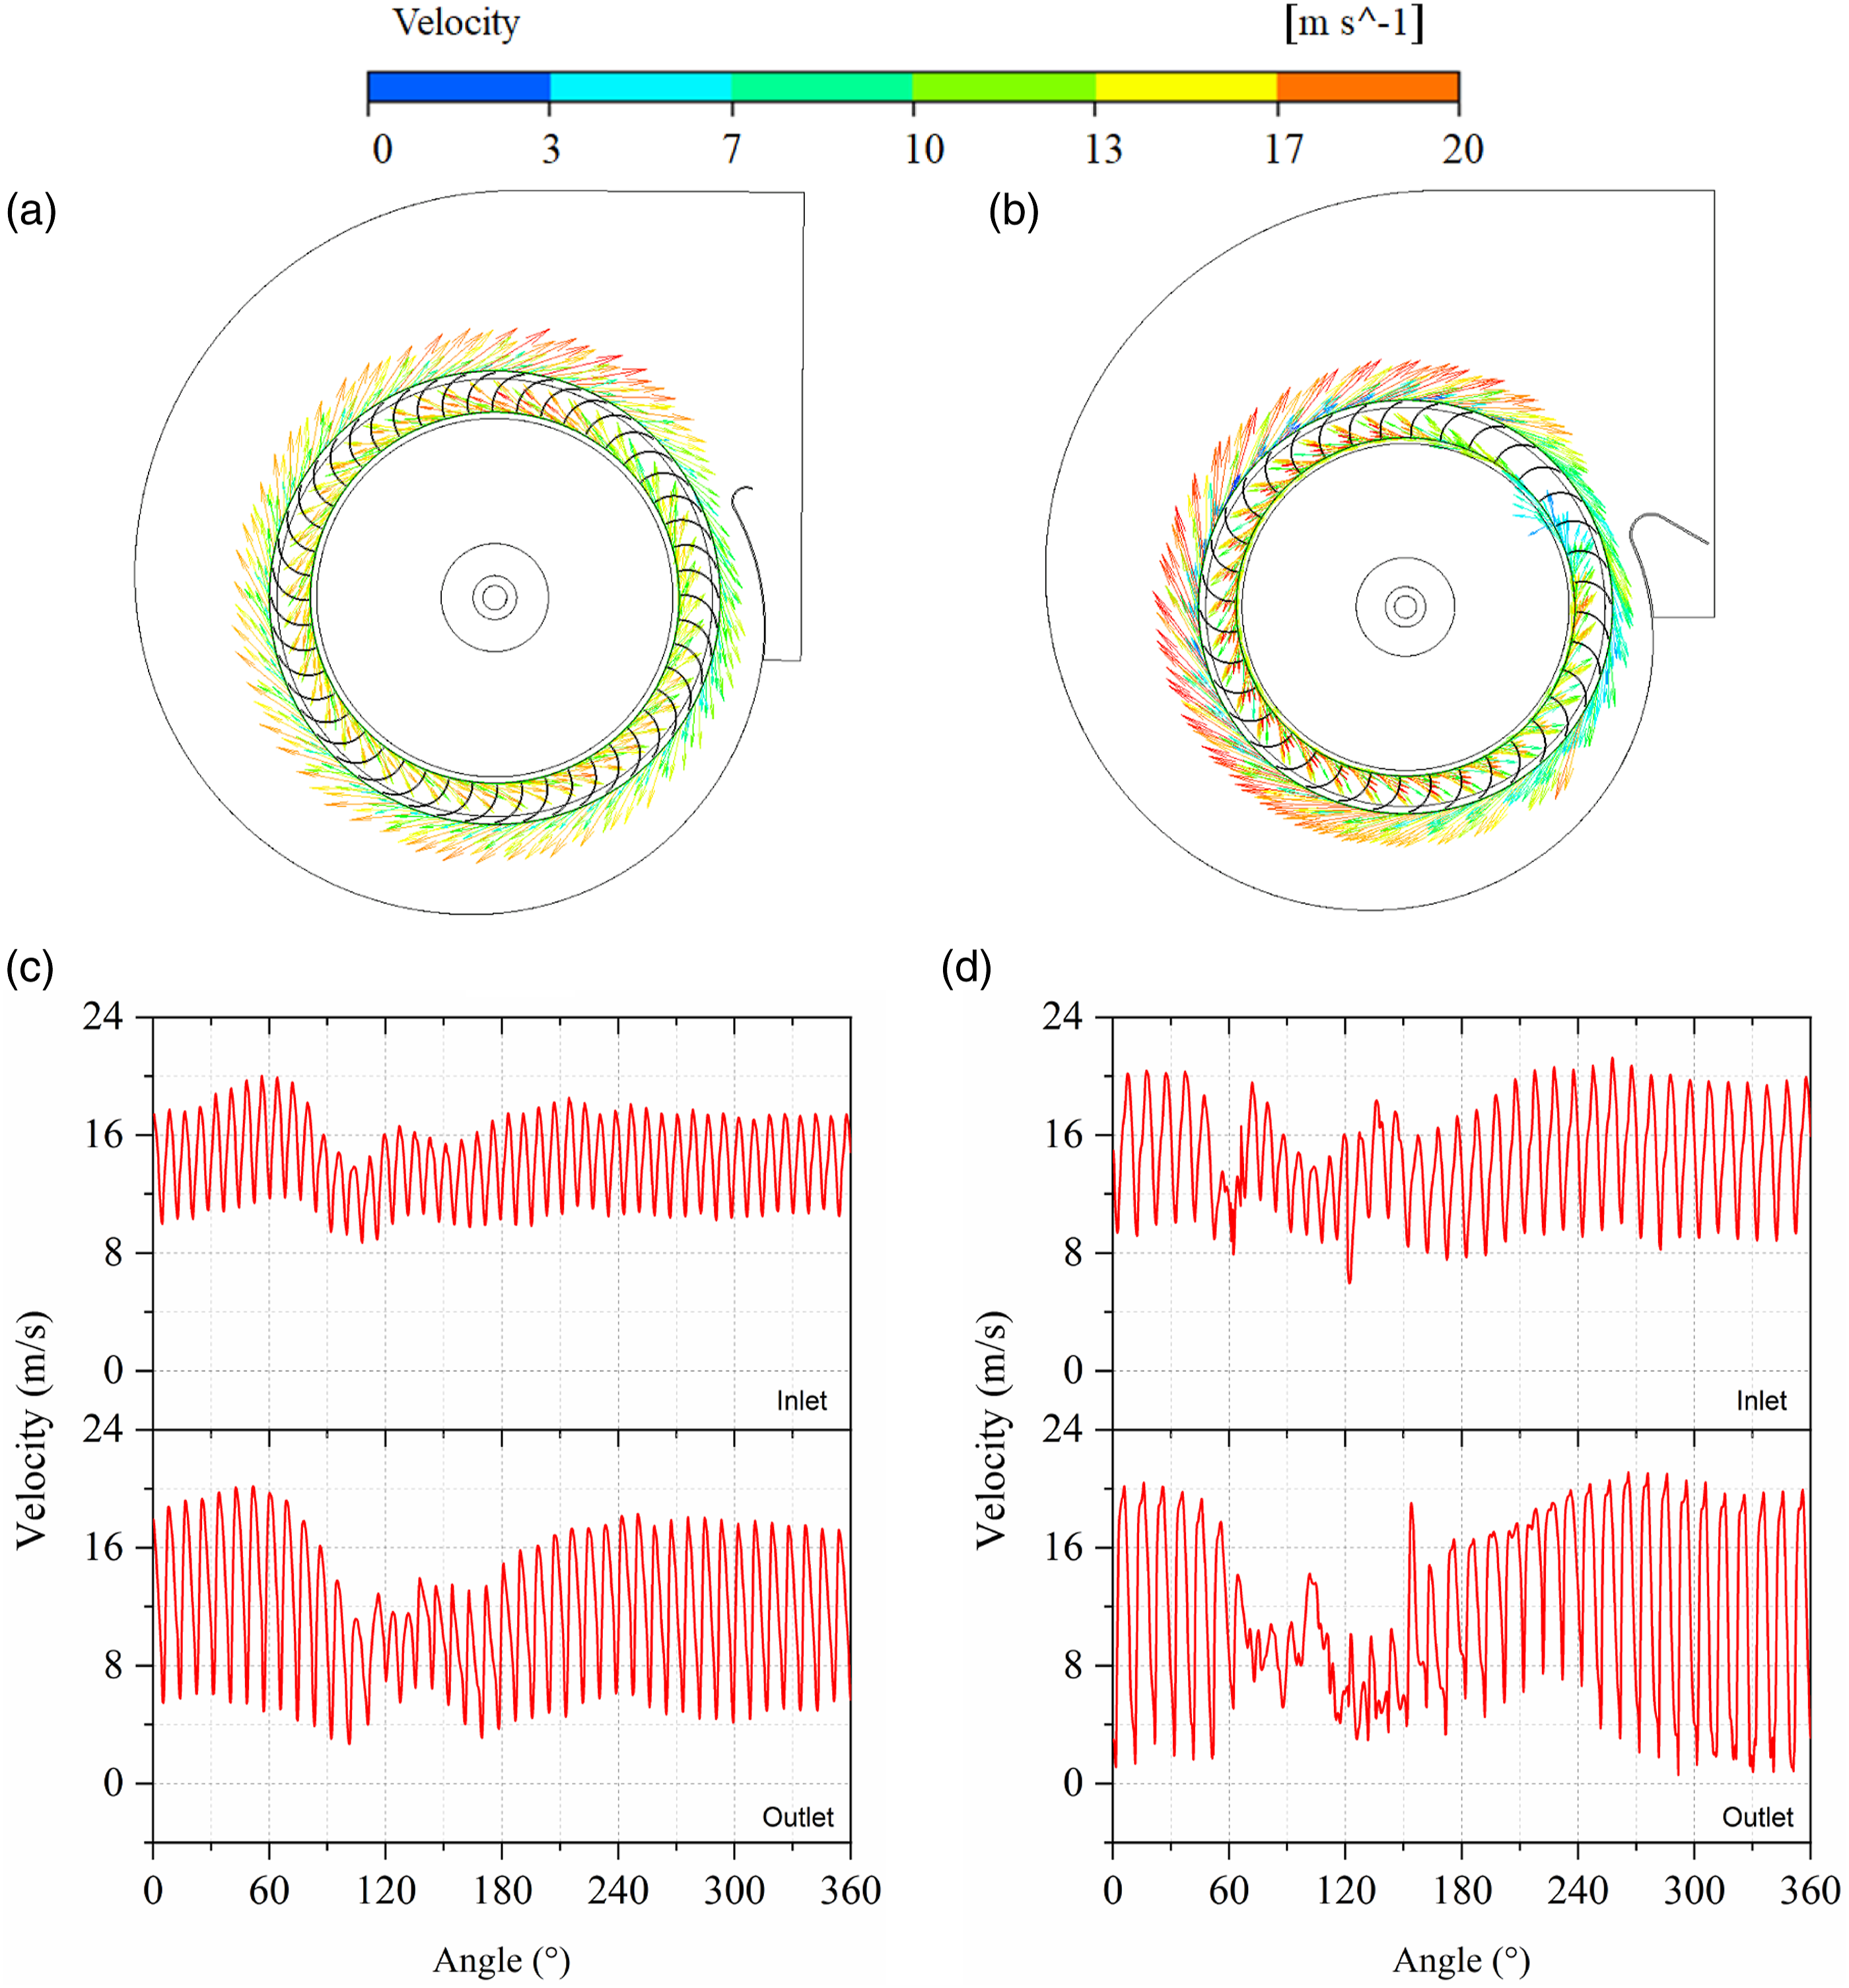
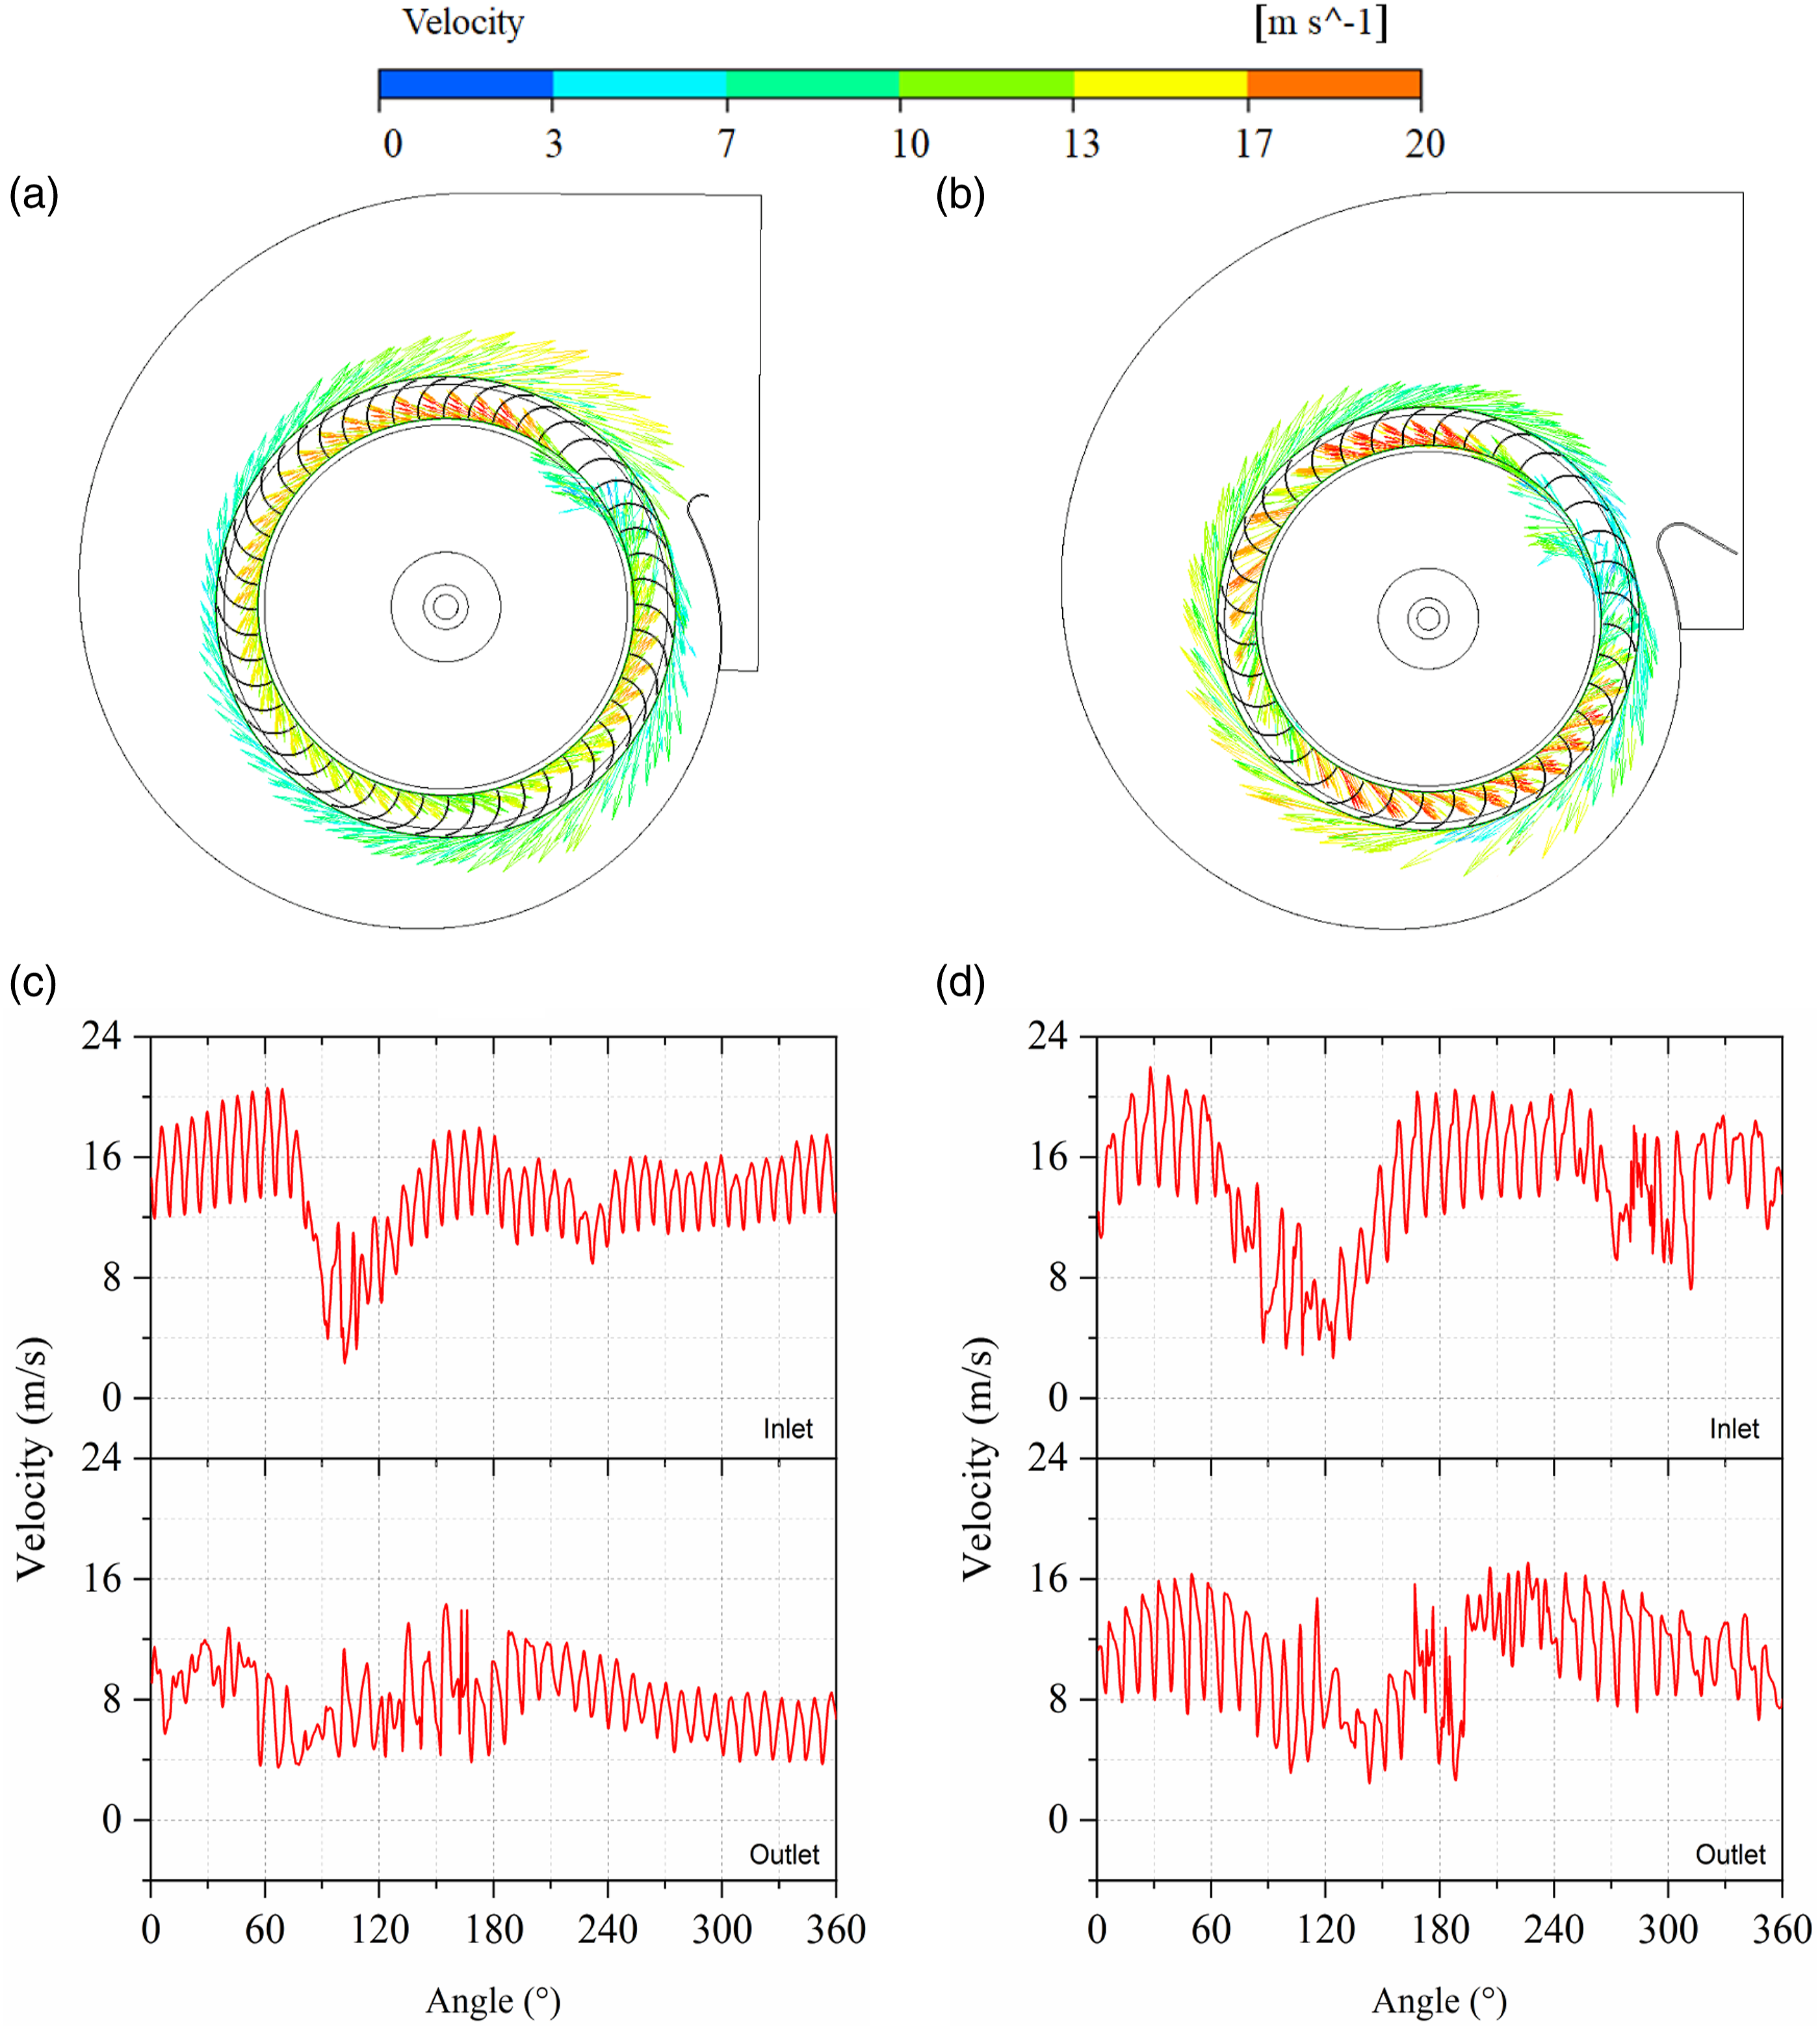
It is seen in the figures that the flow presents a generally regular fluctuation as a result of the multiple inter-blade passages, while large-scale and low-frequency modulation is observed in the region around the volute tongue. The fluctuation of velocity at the inlet circumference of the impeller is similar, i.e., in terms of the maximum and minimum magnitude, for the baseline and optimized models in the range 0°–60° where the flow is close to the outlet of the volute and the interference from the volute surface is weak. The flow at the inlet and outlet of the impeller is significantly lowered in magnitude in the range 60°–150° due to the restraint imposed by the volute tongue. The fluctuation of velocity for the optimized model is more pronounced than that of the baseline model since the height of the volute outlet is reduced. In the range 150°–360°, the velocity keeps at almost constant at the inlet circumference but presents a remarkable fluctuation at the outlet circumference especially for the optimized model in which the minimum magnitude approaches to zero.
By comparing the circumferential distributions of radial velocity at the inlet and outlet of the impeller on the three cross-sections, it is found that the maximum and minimum magnitudes do not vary much for the whole circumference on the z = 30 mm and 100 mm cross-sections except for the region around the volute tongue. The amplitude of velocity fluctuation is larger for the optimized model which demonstrates stronger flow instability that may deteriorates the stable operation of the fan. For flow on the z = 170 mm cross-section which is close to the inlet of the impeller, the radial velocity presents notable irregular distribution around the whole circumference that the difference between the largest and smallest magnitude is great. The destabilized flow around the volute tongue is especially substantial at the inlet of the impeller and the mean velocity is smaller, indicating that the modification of the geometries of impeller and volute imposes more significant influence on the inflow of the impeller. The irregular fluctuation is more obvious in the range 150°–360° for the optimized model in which the mean radial velocity is larger as the amount of energy transferring from the impeller to the flow is more. In conclusion, we can say that the influence of modified impeller and volute on the flow is strong in the central region and close to the inlet of the impeller, while the capability of impeller in transferring energy to the fluid is stronger for the optimized model.
Characteristics of flow in the impeller
In this section we analyze the influence of optimized model on flow in the inter-blade passages of the impeller. A number of monitors are set on the z = 30 mm, 100 mm and 170 mm cross-sections in the middle of the passages with a radius of 210 mm, as shown in Figure 19; more monitors are set around the volute tongue since the patterns of local flow are irregular. The velocity components of flow at these monitors are recorded, and the absolute velocity and radial velocity are calculated. (a) Positions of the monitors in the inter-blade passages of the impeller; (b) Notations for the several characteristic points on the surface of the volute.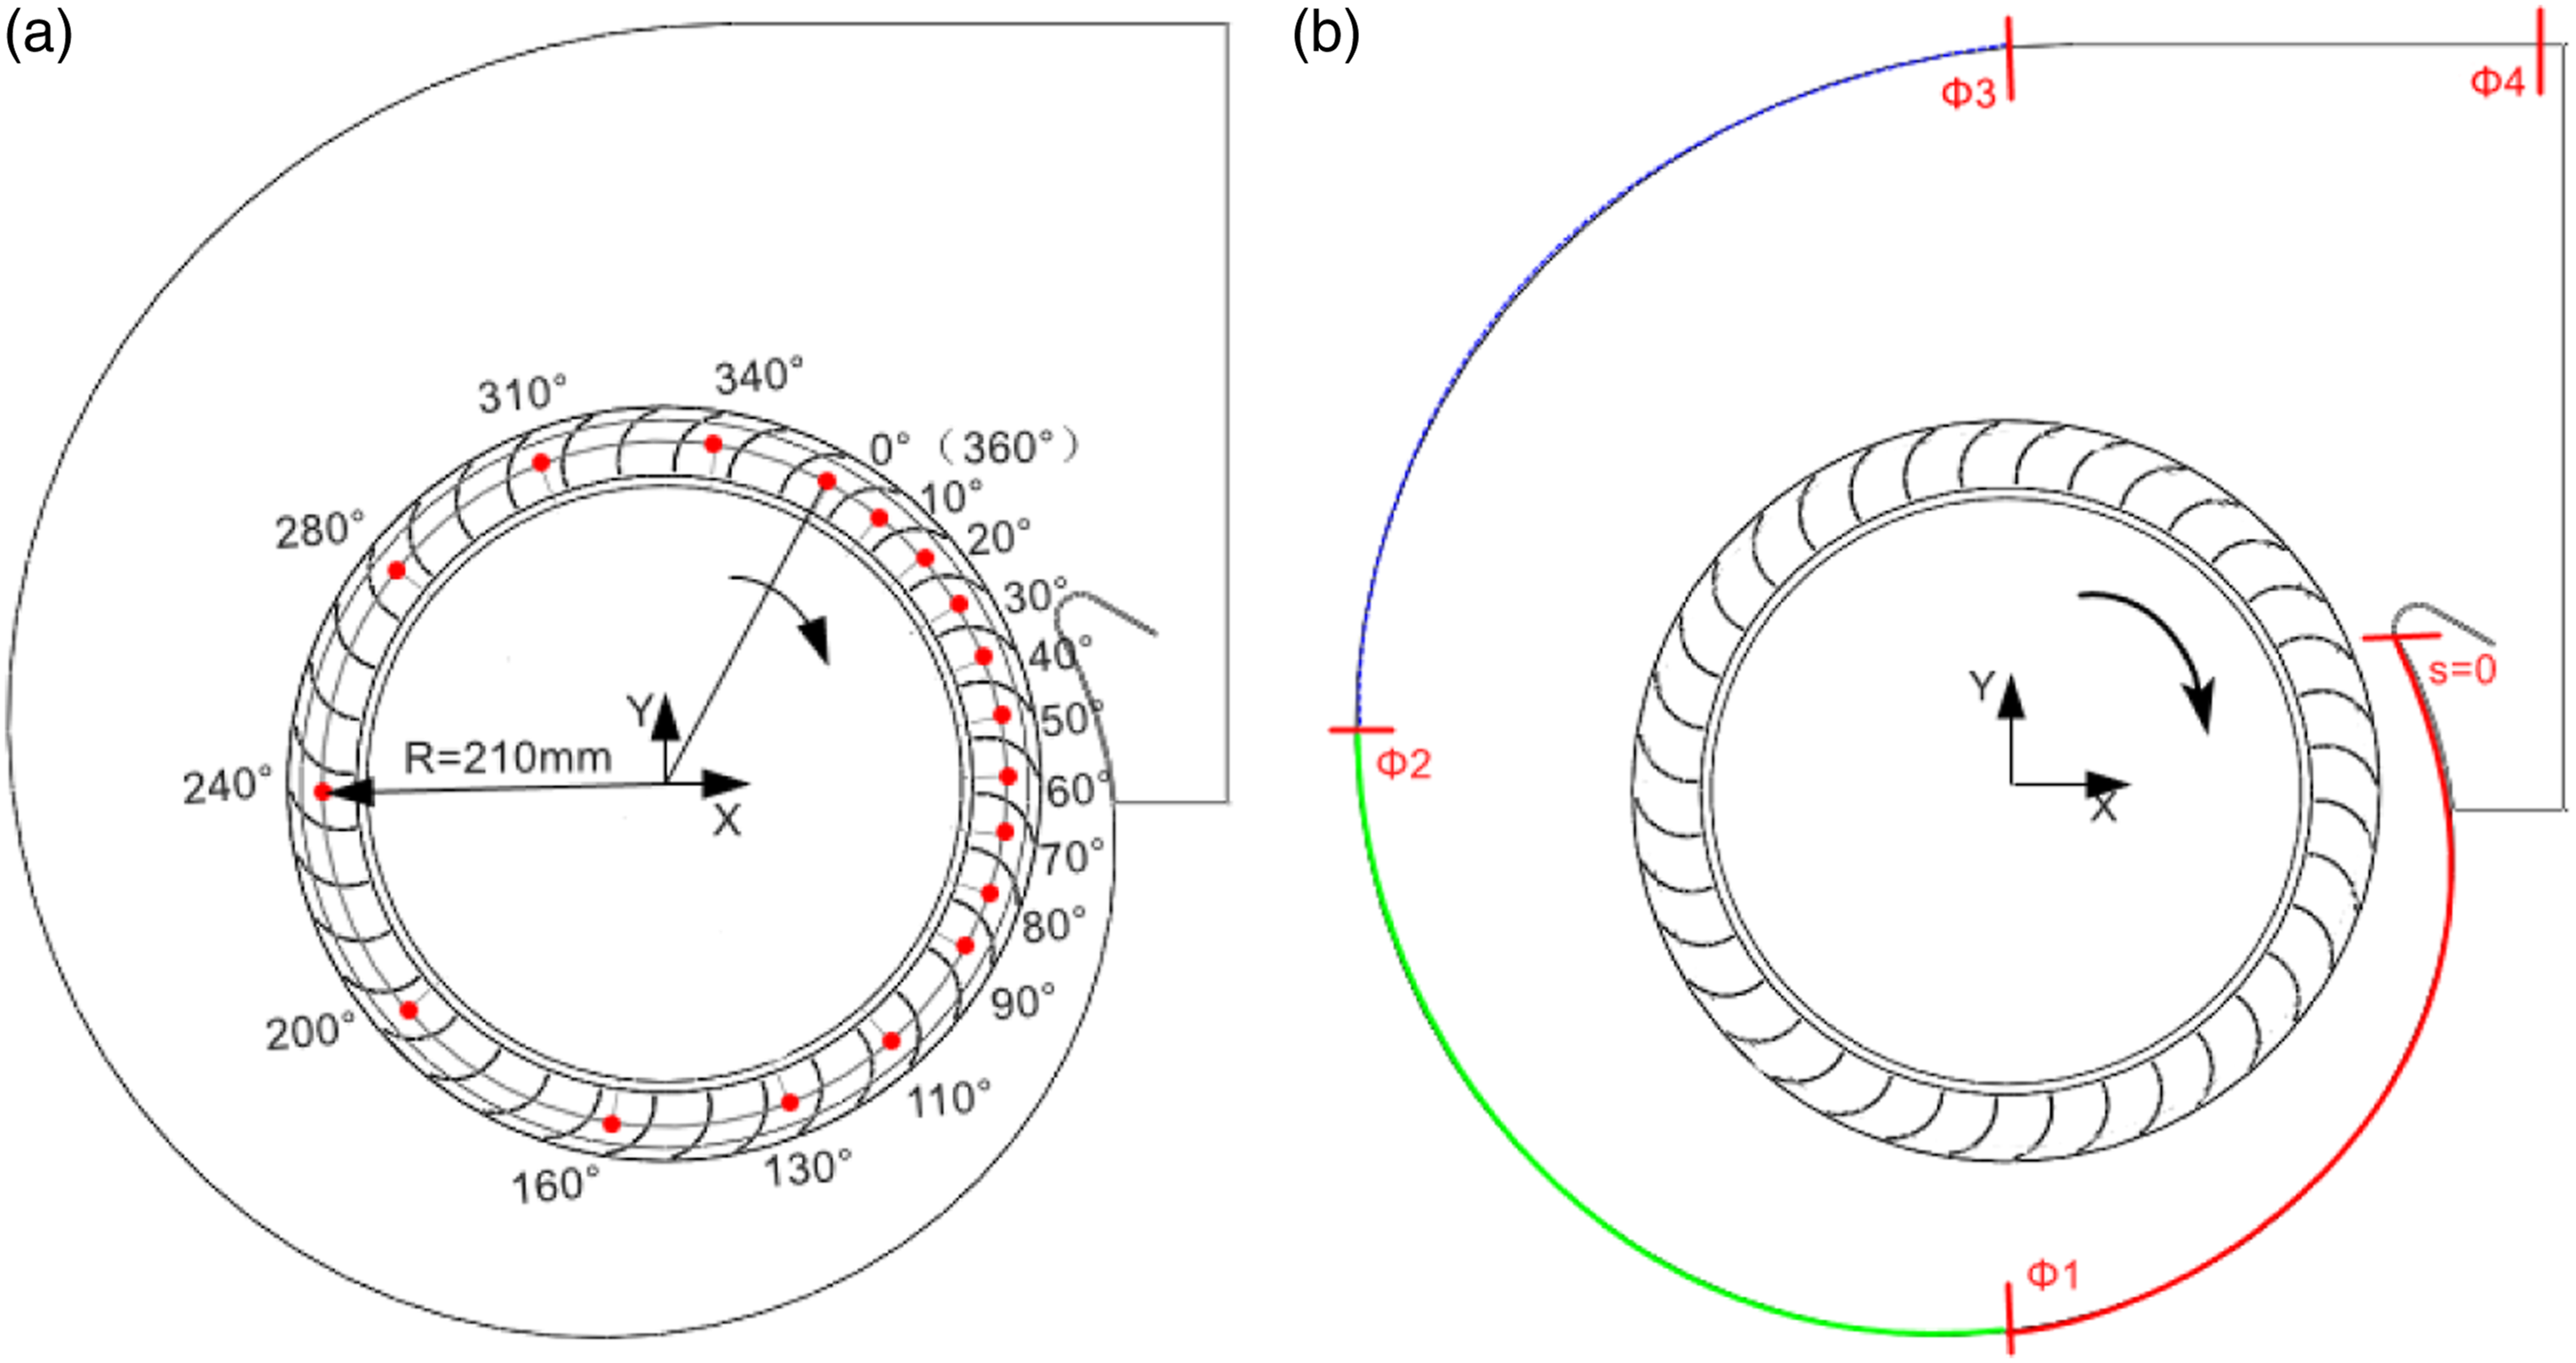
The circumferential distribution of magnitude of absolute velocity is given in Figure 20. Circumferentially non-uniform flow is clearly observed for both baseline and optimized fans. In the region 0°-60° around the volute tongue, the magnitude of absolute velocity is relatively lower and keeps almost unchanged for the three cross-sections. However, the magnitude varies significantly in the remained region without consistent patterns; the maximum velocity magnitude of optimized fan appears at around 160° for the z = 30 mm cross-section but gradually moves towards the volute, i.e., at around 120° for the z = 100 mm cross-section and 80° for the z = 170 mm cross-section, and the magnitude apparently reduces almost around the whole circumference. It is also seen that the circumferential non-uniformity is weak for flow on the z = 170 mm cross-section for the baseline fan, while the optimized fan increases the magnitude of velocity and produces a notable non-uniform flow around the whole circumference on all three cross-sections. Circumferential distributions of magnitude of instantaneous absolute velocity recorded at the monitors on the cross-section at: (a) z = 30 mm; (b) z = 100 mm; (c) z = 170 mm.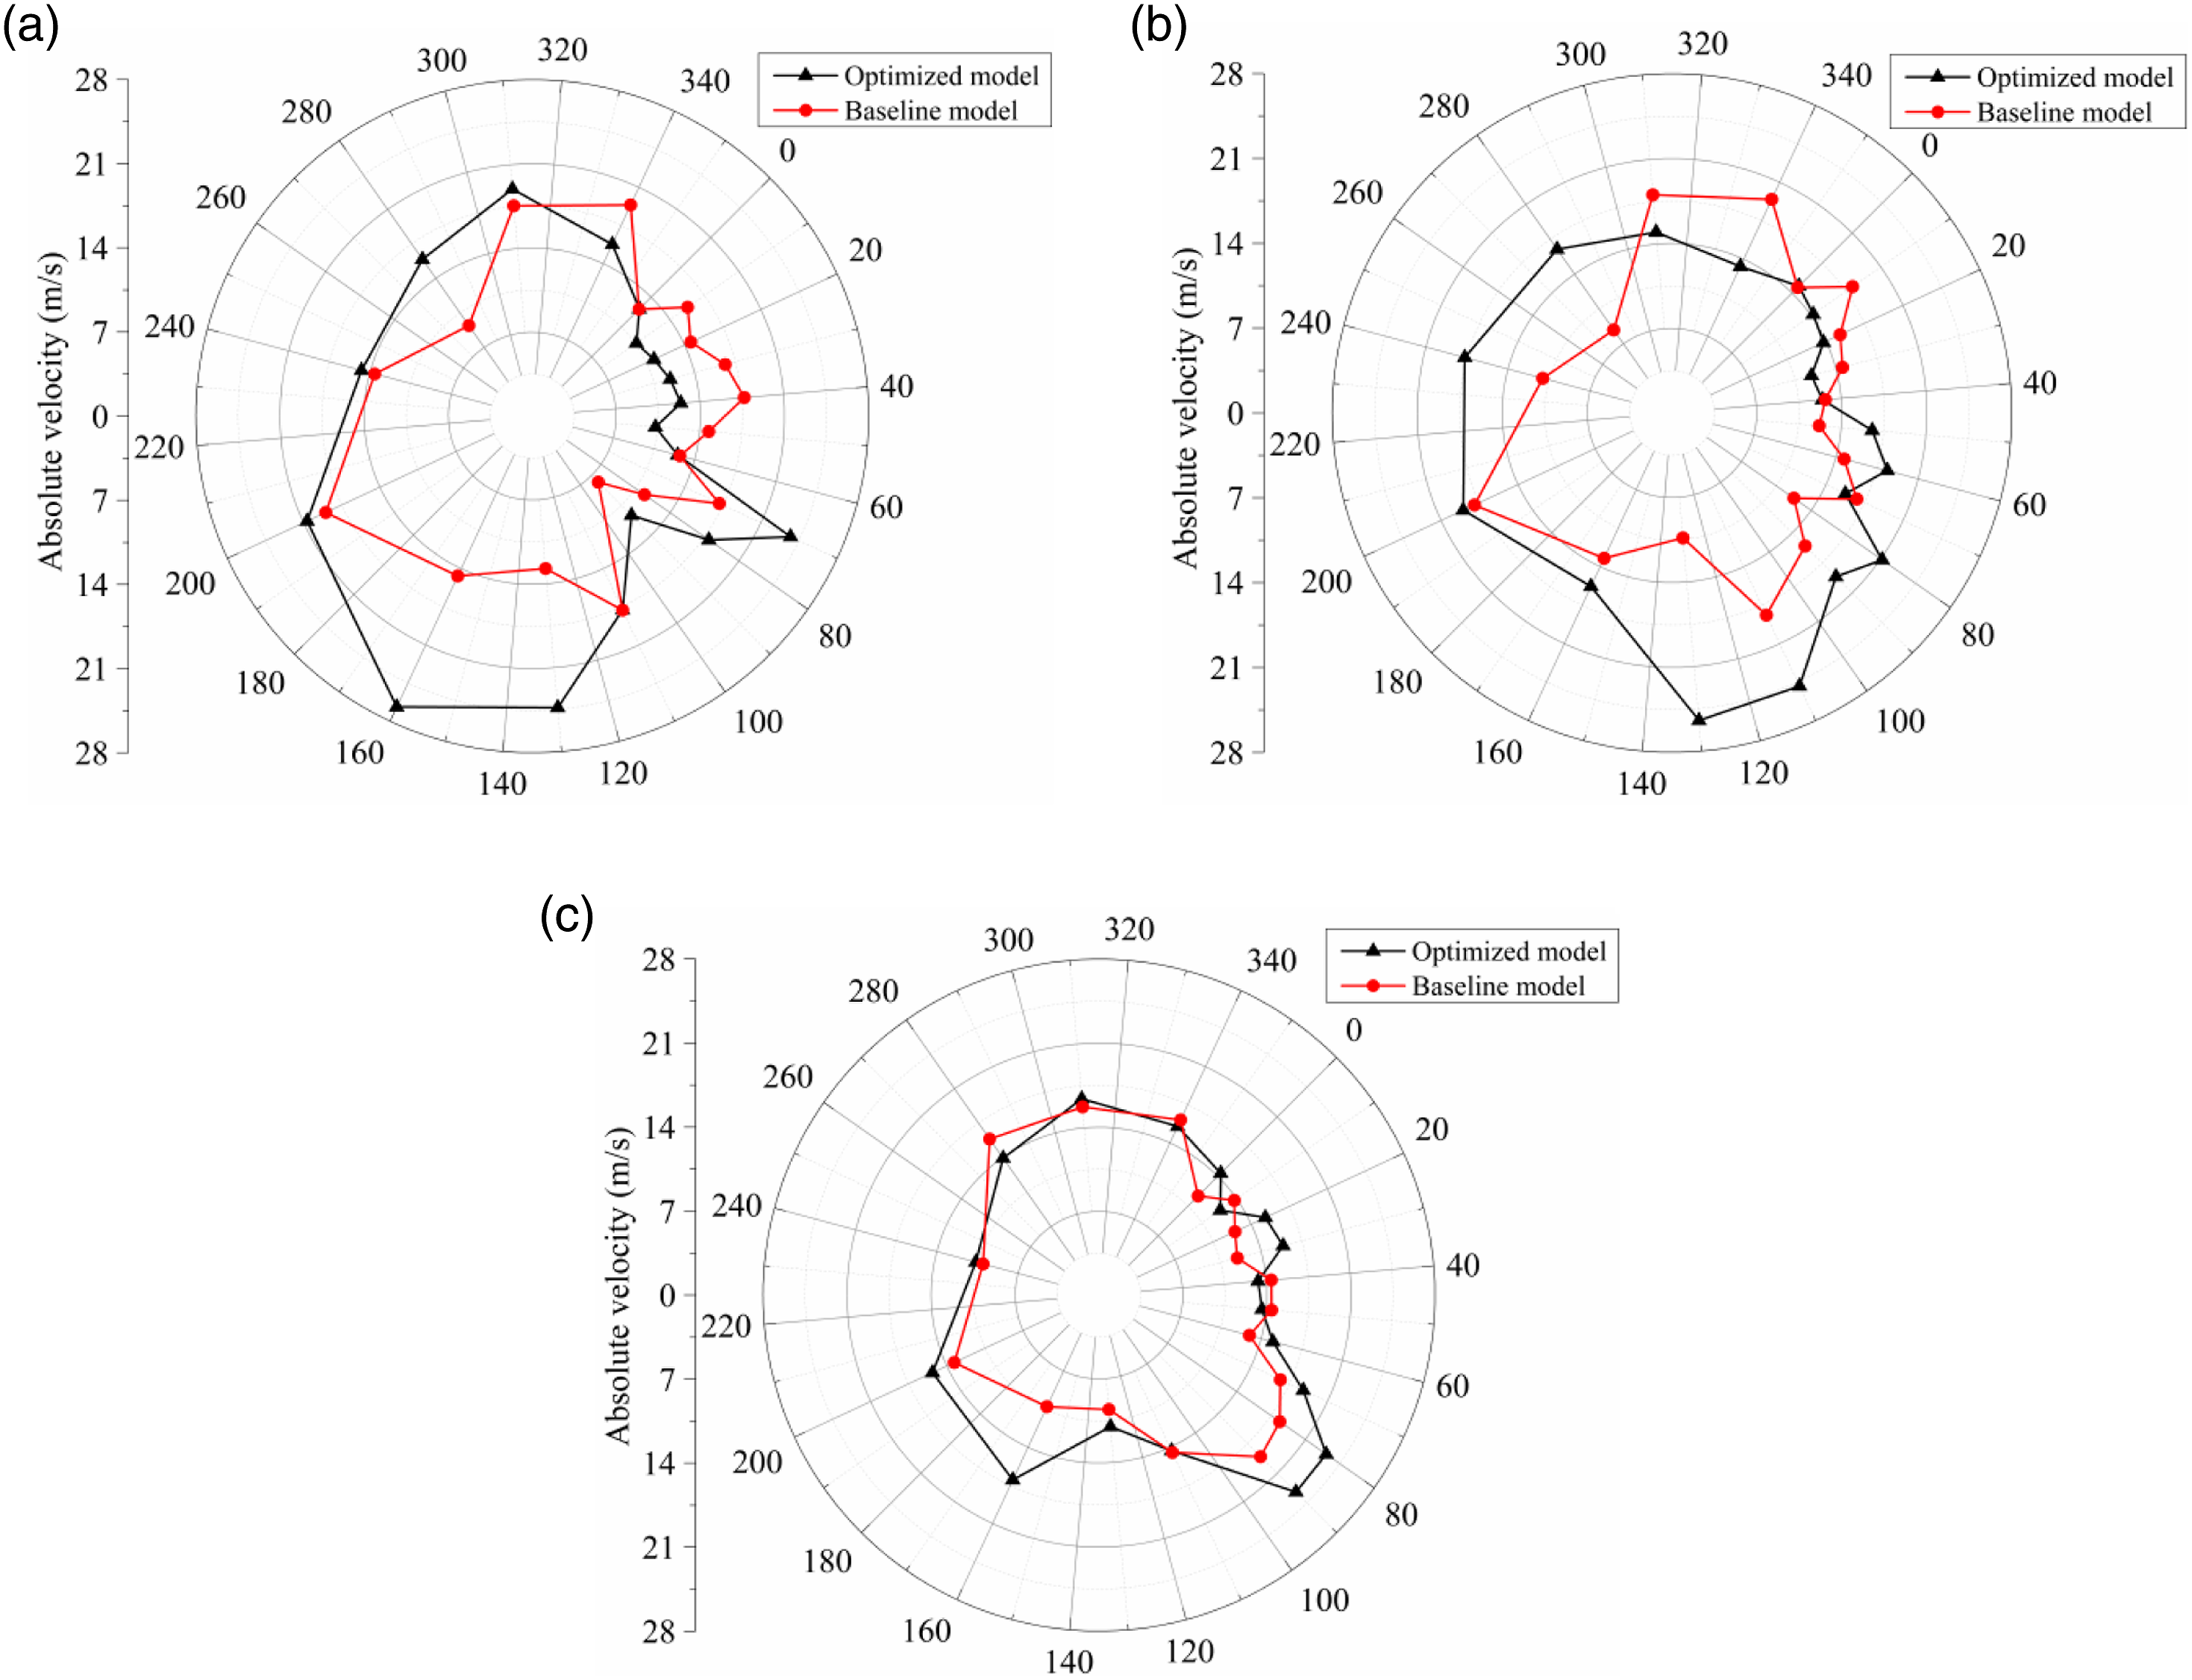
Although the absolute velocity reflects the general patterns of fluid motion within the inter-blade passages, its magnitude could not demonstrate the capability of the impeller in transferring energy to the flow since there are axial and circumferential components of the velocity that are tangential to the local cross-section. The circumferential distribution of the instantaneous radial velocity on the three cross-sections is exhibited in Figure 21. Although the radial velocity could not accurately quantify the kinetic energy of the through-flow due to the curved blades, it generally reflects the motion of fluid from the inlet to outlet of the impeller which is significant to the present Sirocco fan. Circumferential distributions of instantaneous radial velocity recorded at the monitors on the cross-section at: (a) z = 30 mm; (b) z = 100 mm; (c) z = 170 mm.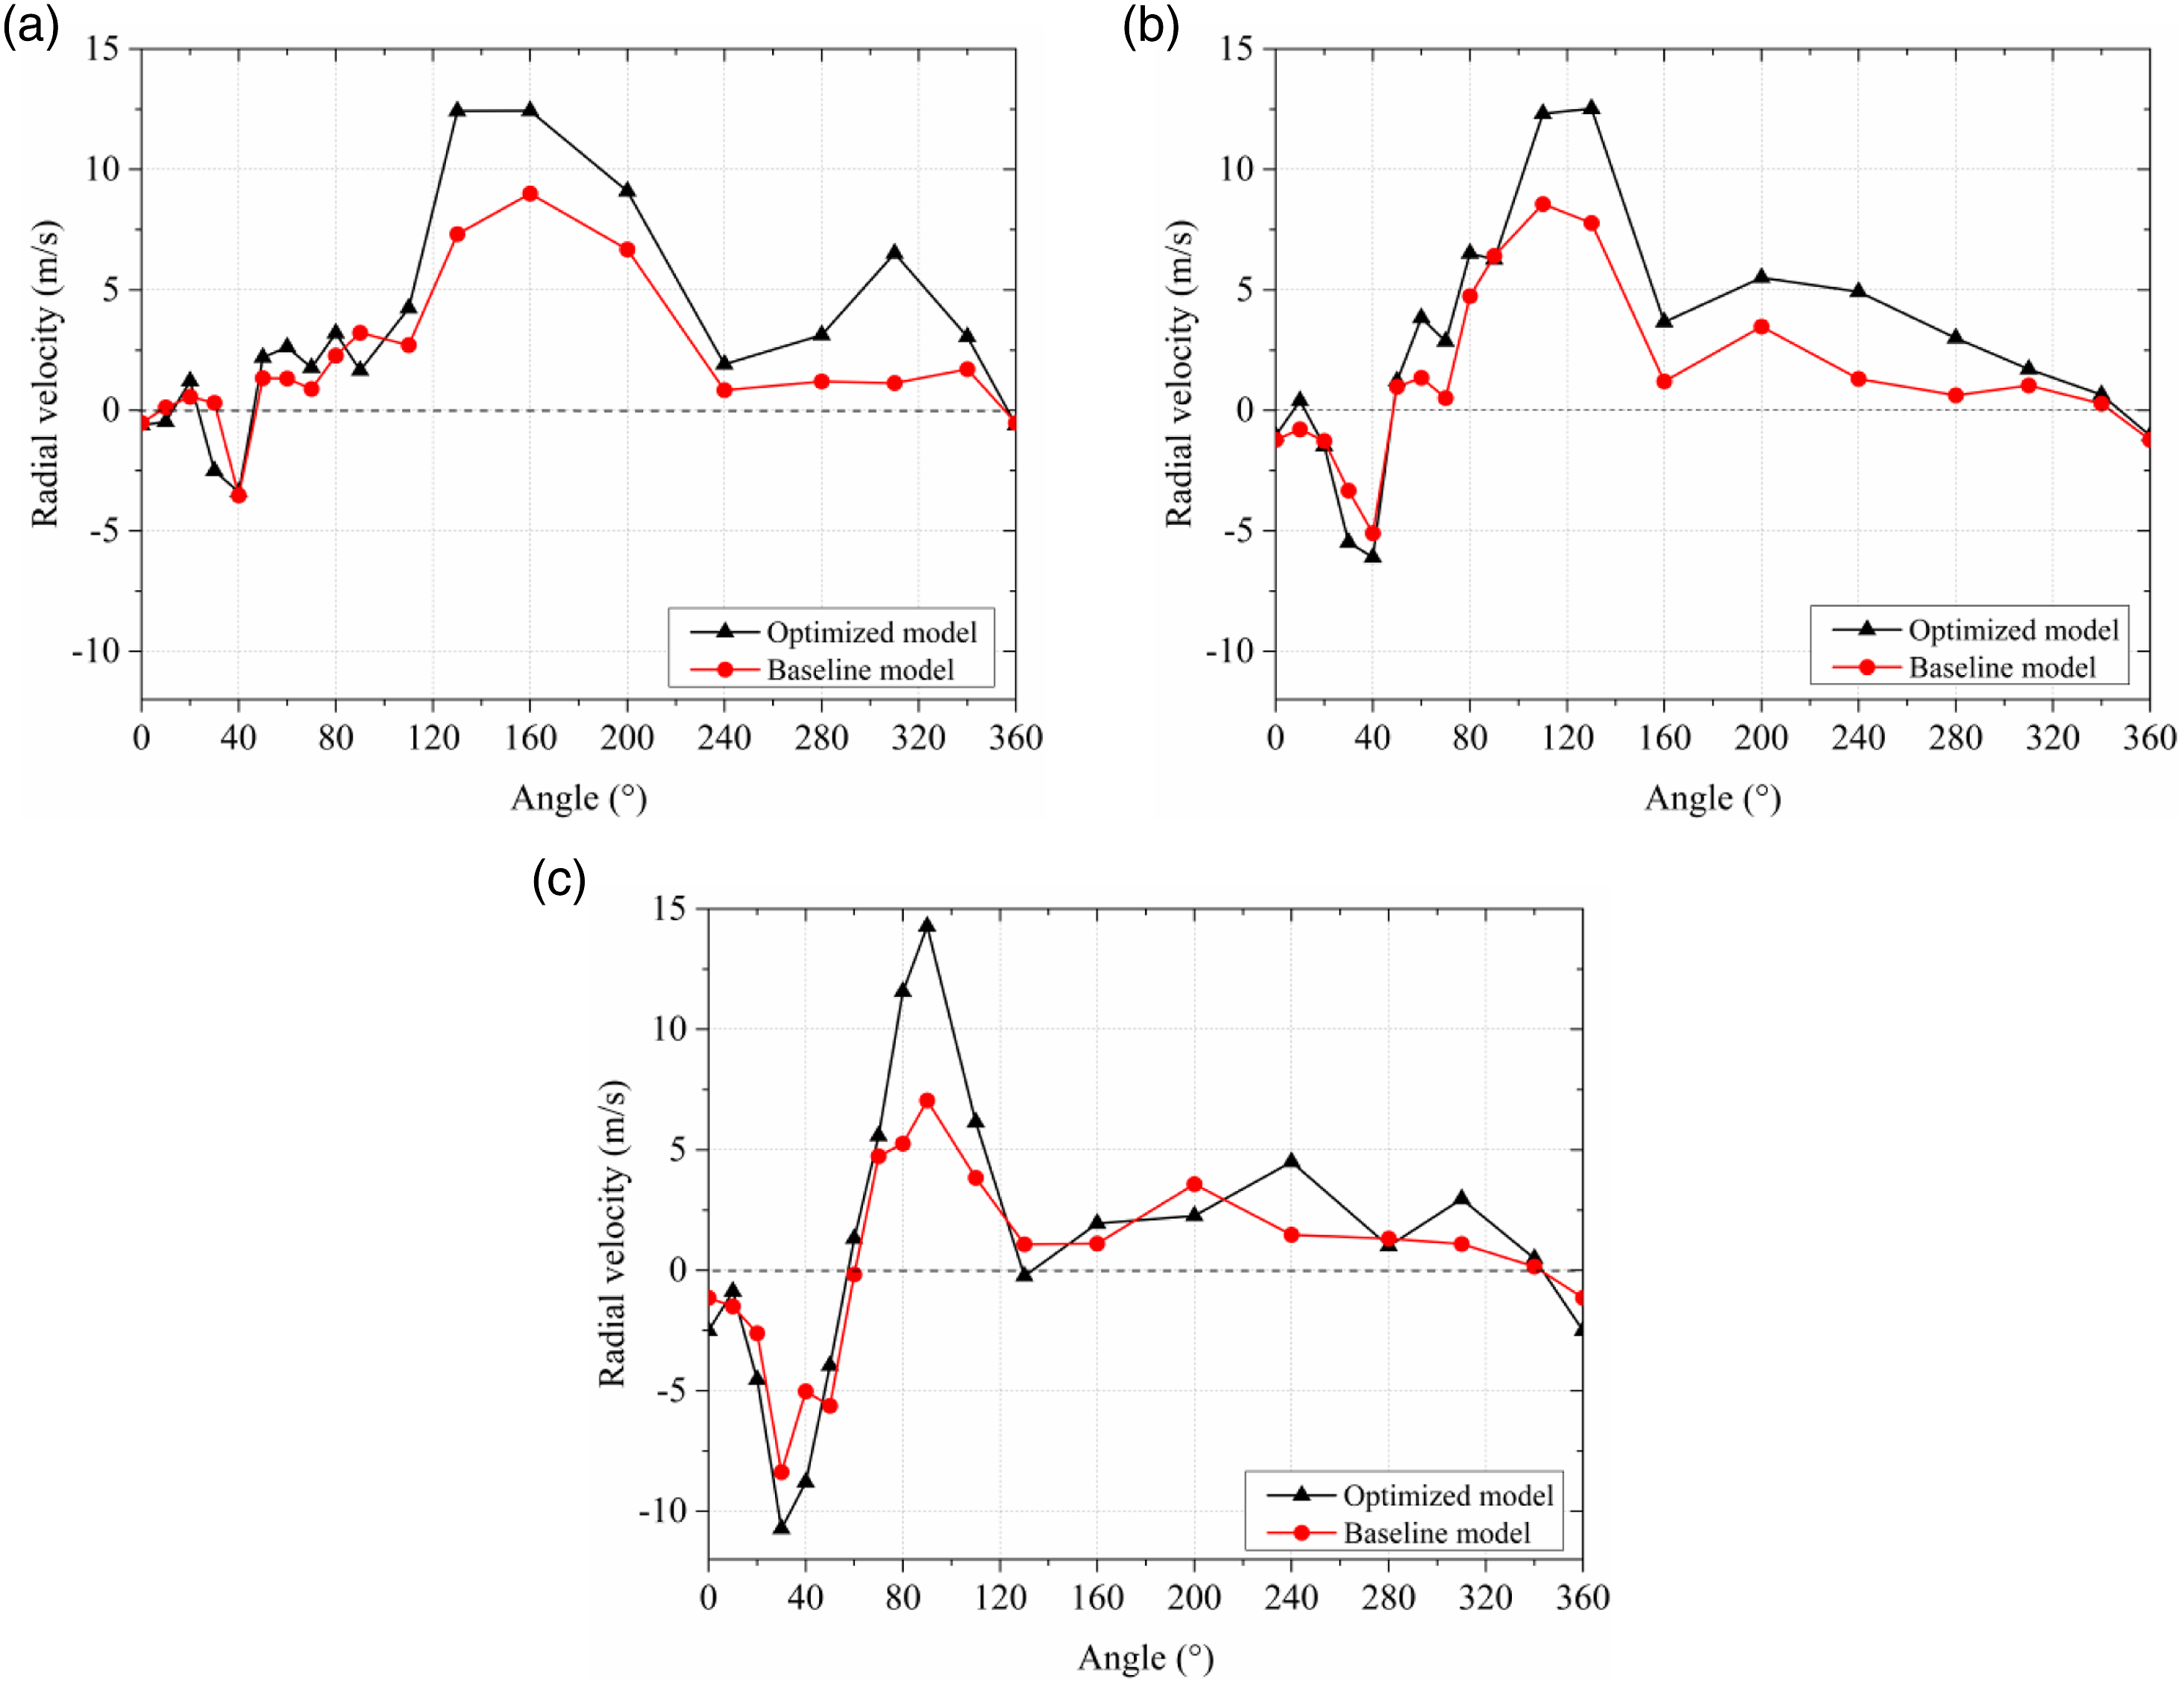
The flow in the blade passages is directly confined by the blades and indirectly affected by the volute via pressure propagation mechanism, thus the distribution of radial velocity presents irregular patterns. It is seen from the profiles in the figure that the velocity first decreases and then increases in the range 20°–60°, i.e., around the volute tongue, and negative velocity appears around 40° as a result of reversed flow which is consistent with the findings in Figures 16 to 18. The reversed flow gets stronger for flow close to the front disc of the impeller, as seen by the gradually larger magnitude of negative velocity on the z = 100 mm and z = 170 mm cross-sections compared with that on the z = 30 mm cross-section. The intensified reversed flow demonstrates that the flow around the volute tongue is destabilized close to the inlet of the impeller. For flow away from the volute tongue in the region 60°–360°, the magnitude of radial velocity reaches maximum at around 60° for the z = 30 mm and z = 100 mm cross-sections but appear at 85° for the z = 170 mm cross-section. By comparing the profiles for the baseline and optimized fans, it is found that the optimized fan generally decreases the radial velocity for almost the whole circumference of the impeller including both the reversed flow region and forward flow region. Considering that the outlet installation angle and turning angle of the blades are modified, the decreased radial velocity indicates that as the incoming flow experiences a transition of direction after entering the impeller, and the blades of the optimized fan is less capable in redirecting the fluid compared with the baseline fan.
Characteristics of the near-wall flow in the volute
Since the height of the volute is modified for the optimized fan, the fluid exiting from the impeller interacts with the inner surface of the volute and presents different patterns compared with the baseline fan, and the interaction also affects the pressure recovery as the fluid moves towards the outlet of the volute. Here we present the patterns of near-wall flow of the volute and analyze how they are changed by the geometry modification.
The distribution of instantaneous pressure coefficient (C
p
) on the surface of the volute is shown in Figure 22 for flow on three cross-sections at z = 30 mm, 100 mm and 170 mm. We set a local coordinate system along the surface of the volute as given in Figure 19(b); the coordinate system starts at the volute tongue and directs along the clockwise direction till the outlet of the volute, and several points denoting the key positions on the volute surface are labeled as Φ1, Φ2, Φ3 and Φ4. The profiles are plotted at four moments T1–T4 in which the impeller rotates for 90° between two consecutive moments. Distribution of pressure coefficient on the surface of the volute on the three cross-sections. The left and right columns denote the baseline fan and optimized fan, respectively. (a) z = 30 mm. (b) z = 100 mm. (c) z = 170 mm.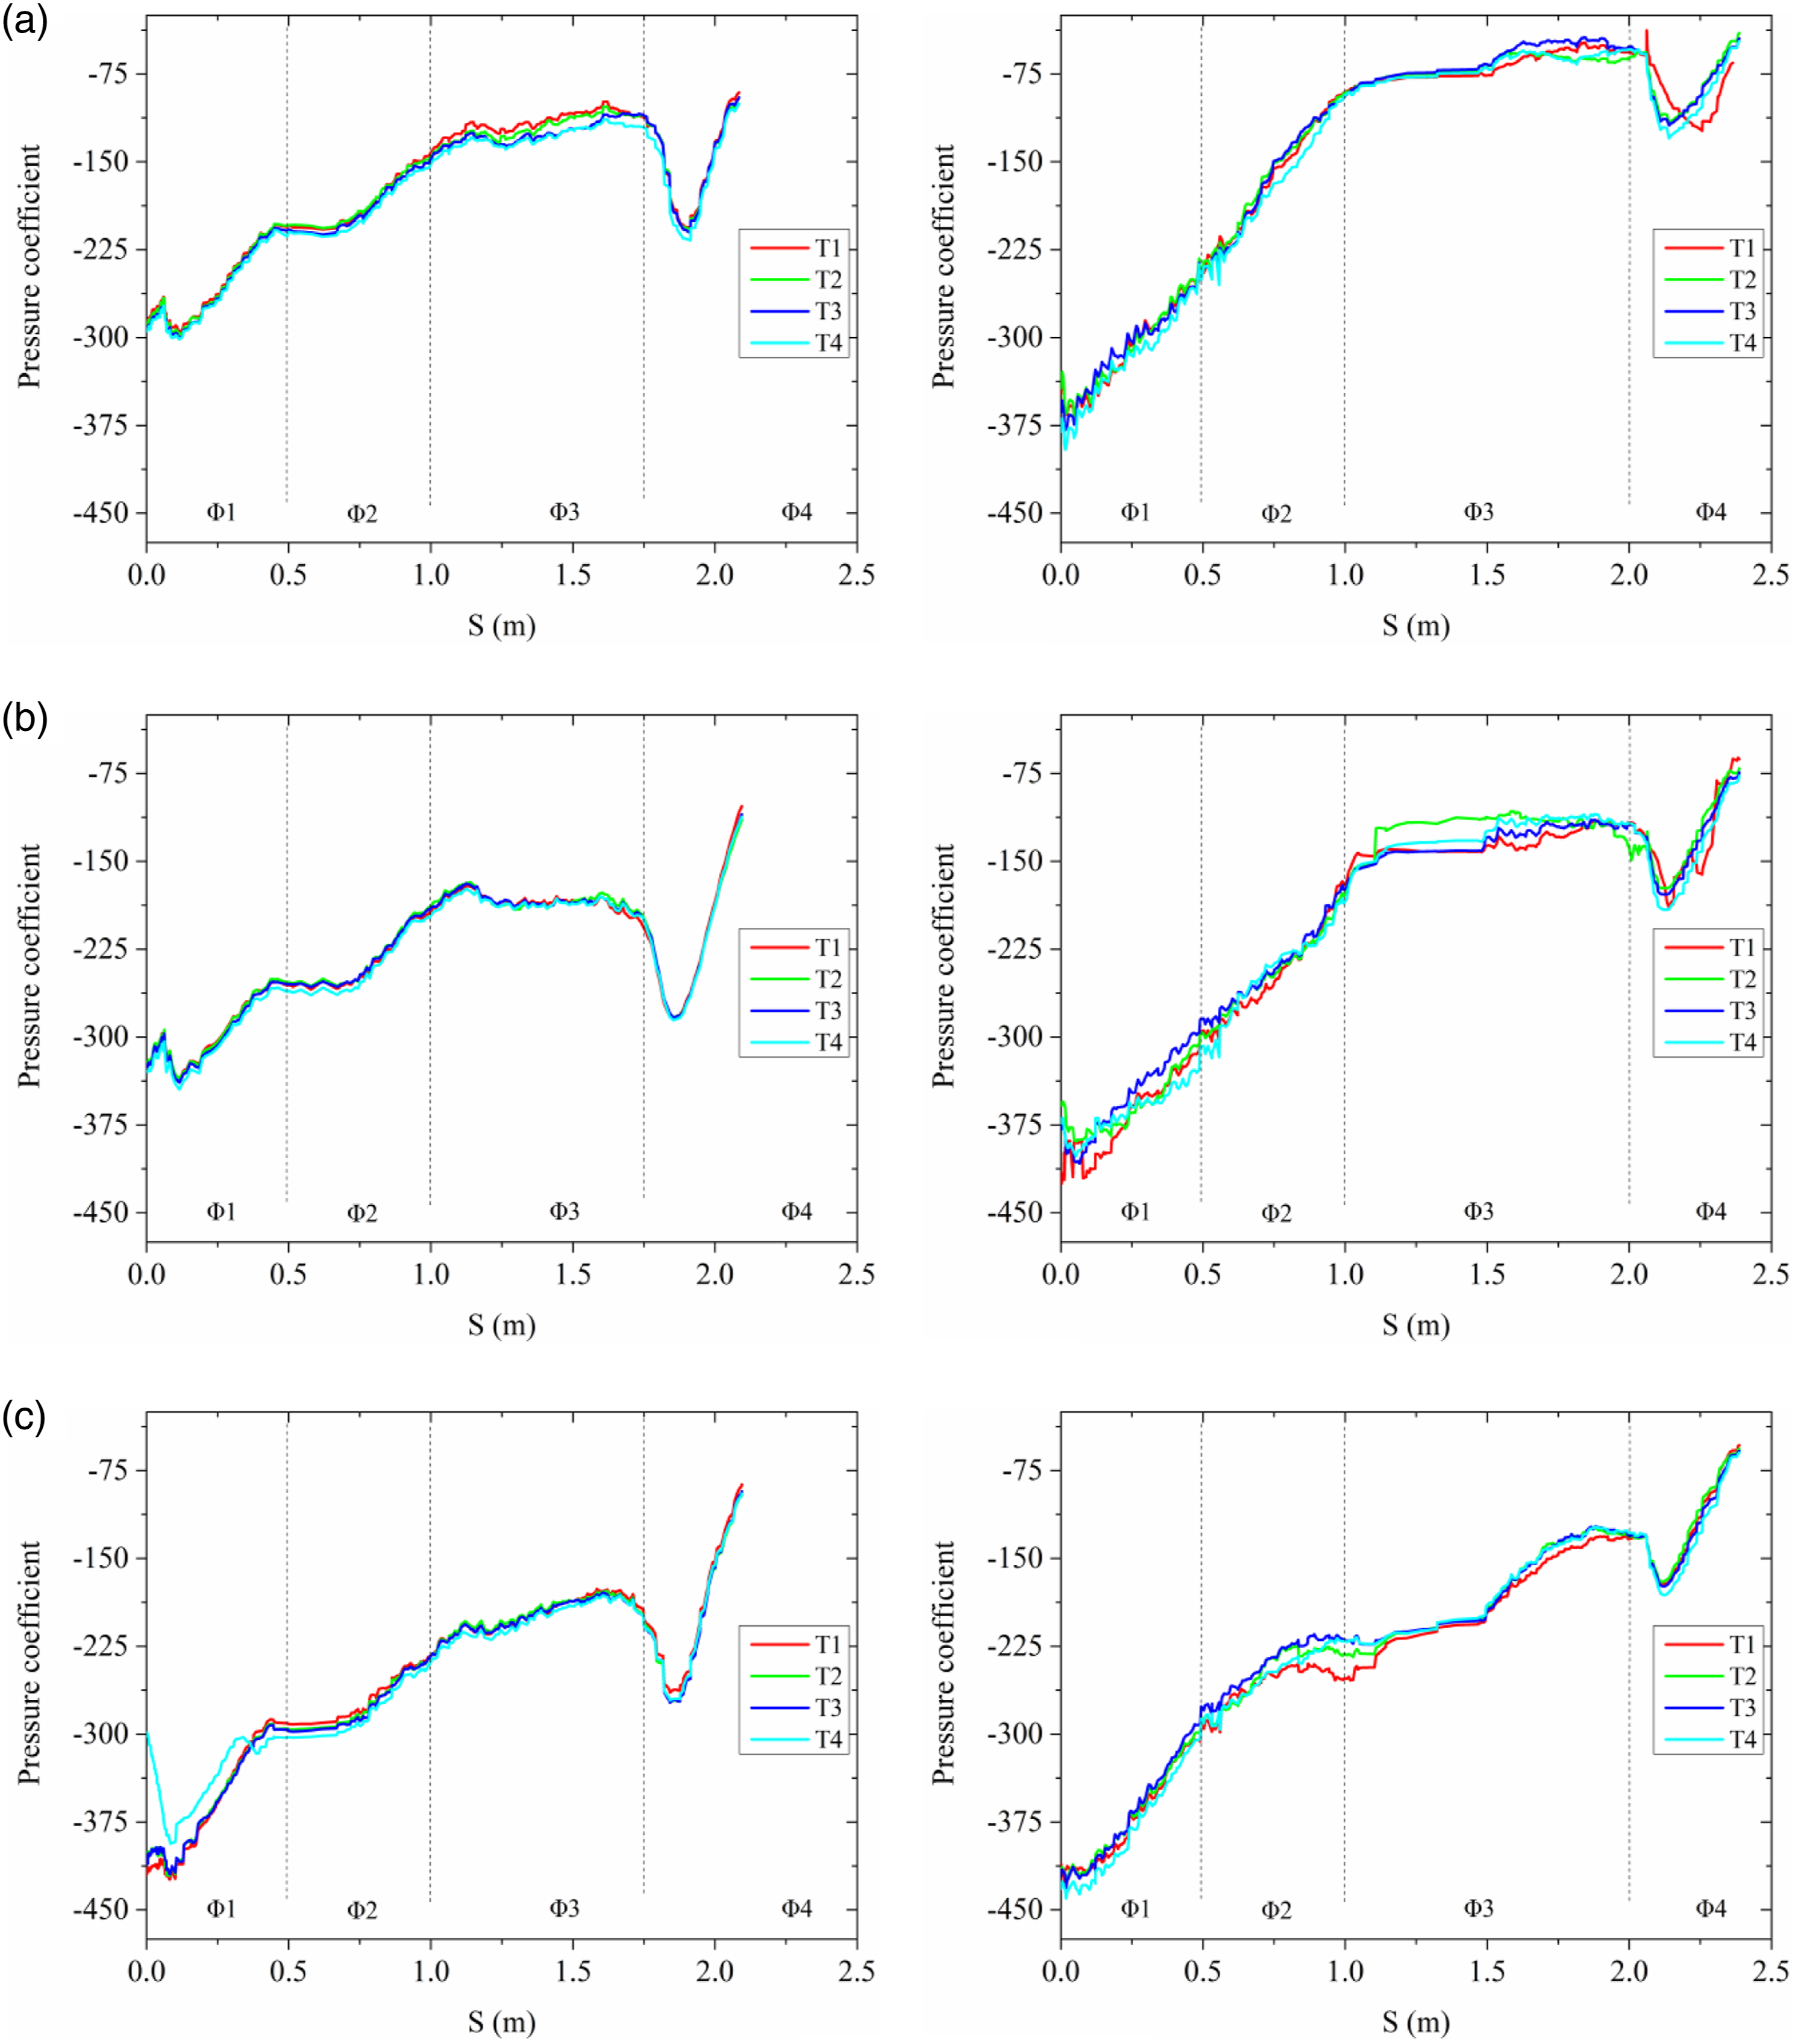
It is seen in the figures that the distributions of C p on the same cross-section is quite consistent at the four moments for the majority of the circumference, i.e., no pronounced transient behaviors. The pressure coefficient for the baseline fan is generally higher than the optimized fan in the region from the volute tongue to the volute bottom (0 < s < Φ1); there is a slight increasing-decreasing transition right around the volute tongue for the baseline fan, indicating that the larger outlet height generates local recirculating flow which is nearly stationary in this region. In the region Φ1 < s < Φ2, the pressure keeps recovering and kinetic energy of the fluid is transformed to pressure energy, and the recovering rate is much higher for the optimized fan especially on the cross-sections z = 30 mm and 100 mm which are located at the center and near the central disc of the fan. The pressure recovery is weak in the region Φ2 < s < Φ3 for both fans on the cross-sections z = 30 mm and 100 mm, while it is still observable for flow on the z = 170 mm cross-section. In the region Φ3 < s < Φ4 close to the outlet of the volute, the pressure coefficient exhibits a significant decreasing-increasing variation for both the baseline and optimized fans, and the variation is more notable on the z = 170 mm cross-section that the pressure coefficient reaches highest right at the outlet of the volute. The decrease of pressure coefficient is partially resulted from the exiting flow from the impeller that there is weak separation of flow on the volute surface, while the pressure then increases because of the deceleration of flow.
The fluctuation of pressure coefficient on the volute surface is different in the various regions and is determined by the geometry of the fan, including the impeller and volute. It is found in the figures that the temporal fluctuation, as reflected by the deviation of the several curves, is remarkable for the optimized fan almost for the whole circumference. Since the geometry of the volute is mainly modified in the region Φ1 < s < Φ4 which is away from the volute tongue, the intensified fluctuation is due to the destabilized flow exiting from the impeller which changes the patterns of near-wall flow of the volute surface. It is also concluded that the optimized fan presents a better pressure recovery in the region 0 < s < Φ3 that the pressure continuously increases, while there is pressure plateau for the baseline fan the pressure coefficient keeps almost unchanged in certain regions, thus the optimized volute is better in converting kinetic energy to pressure energy.
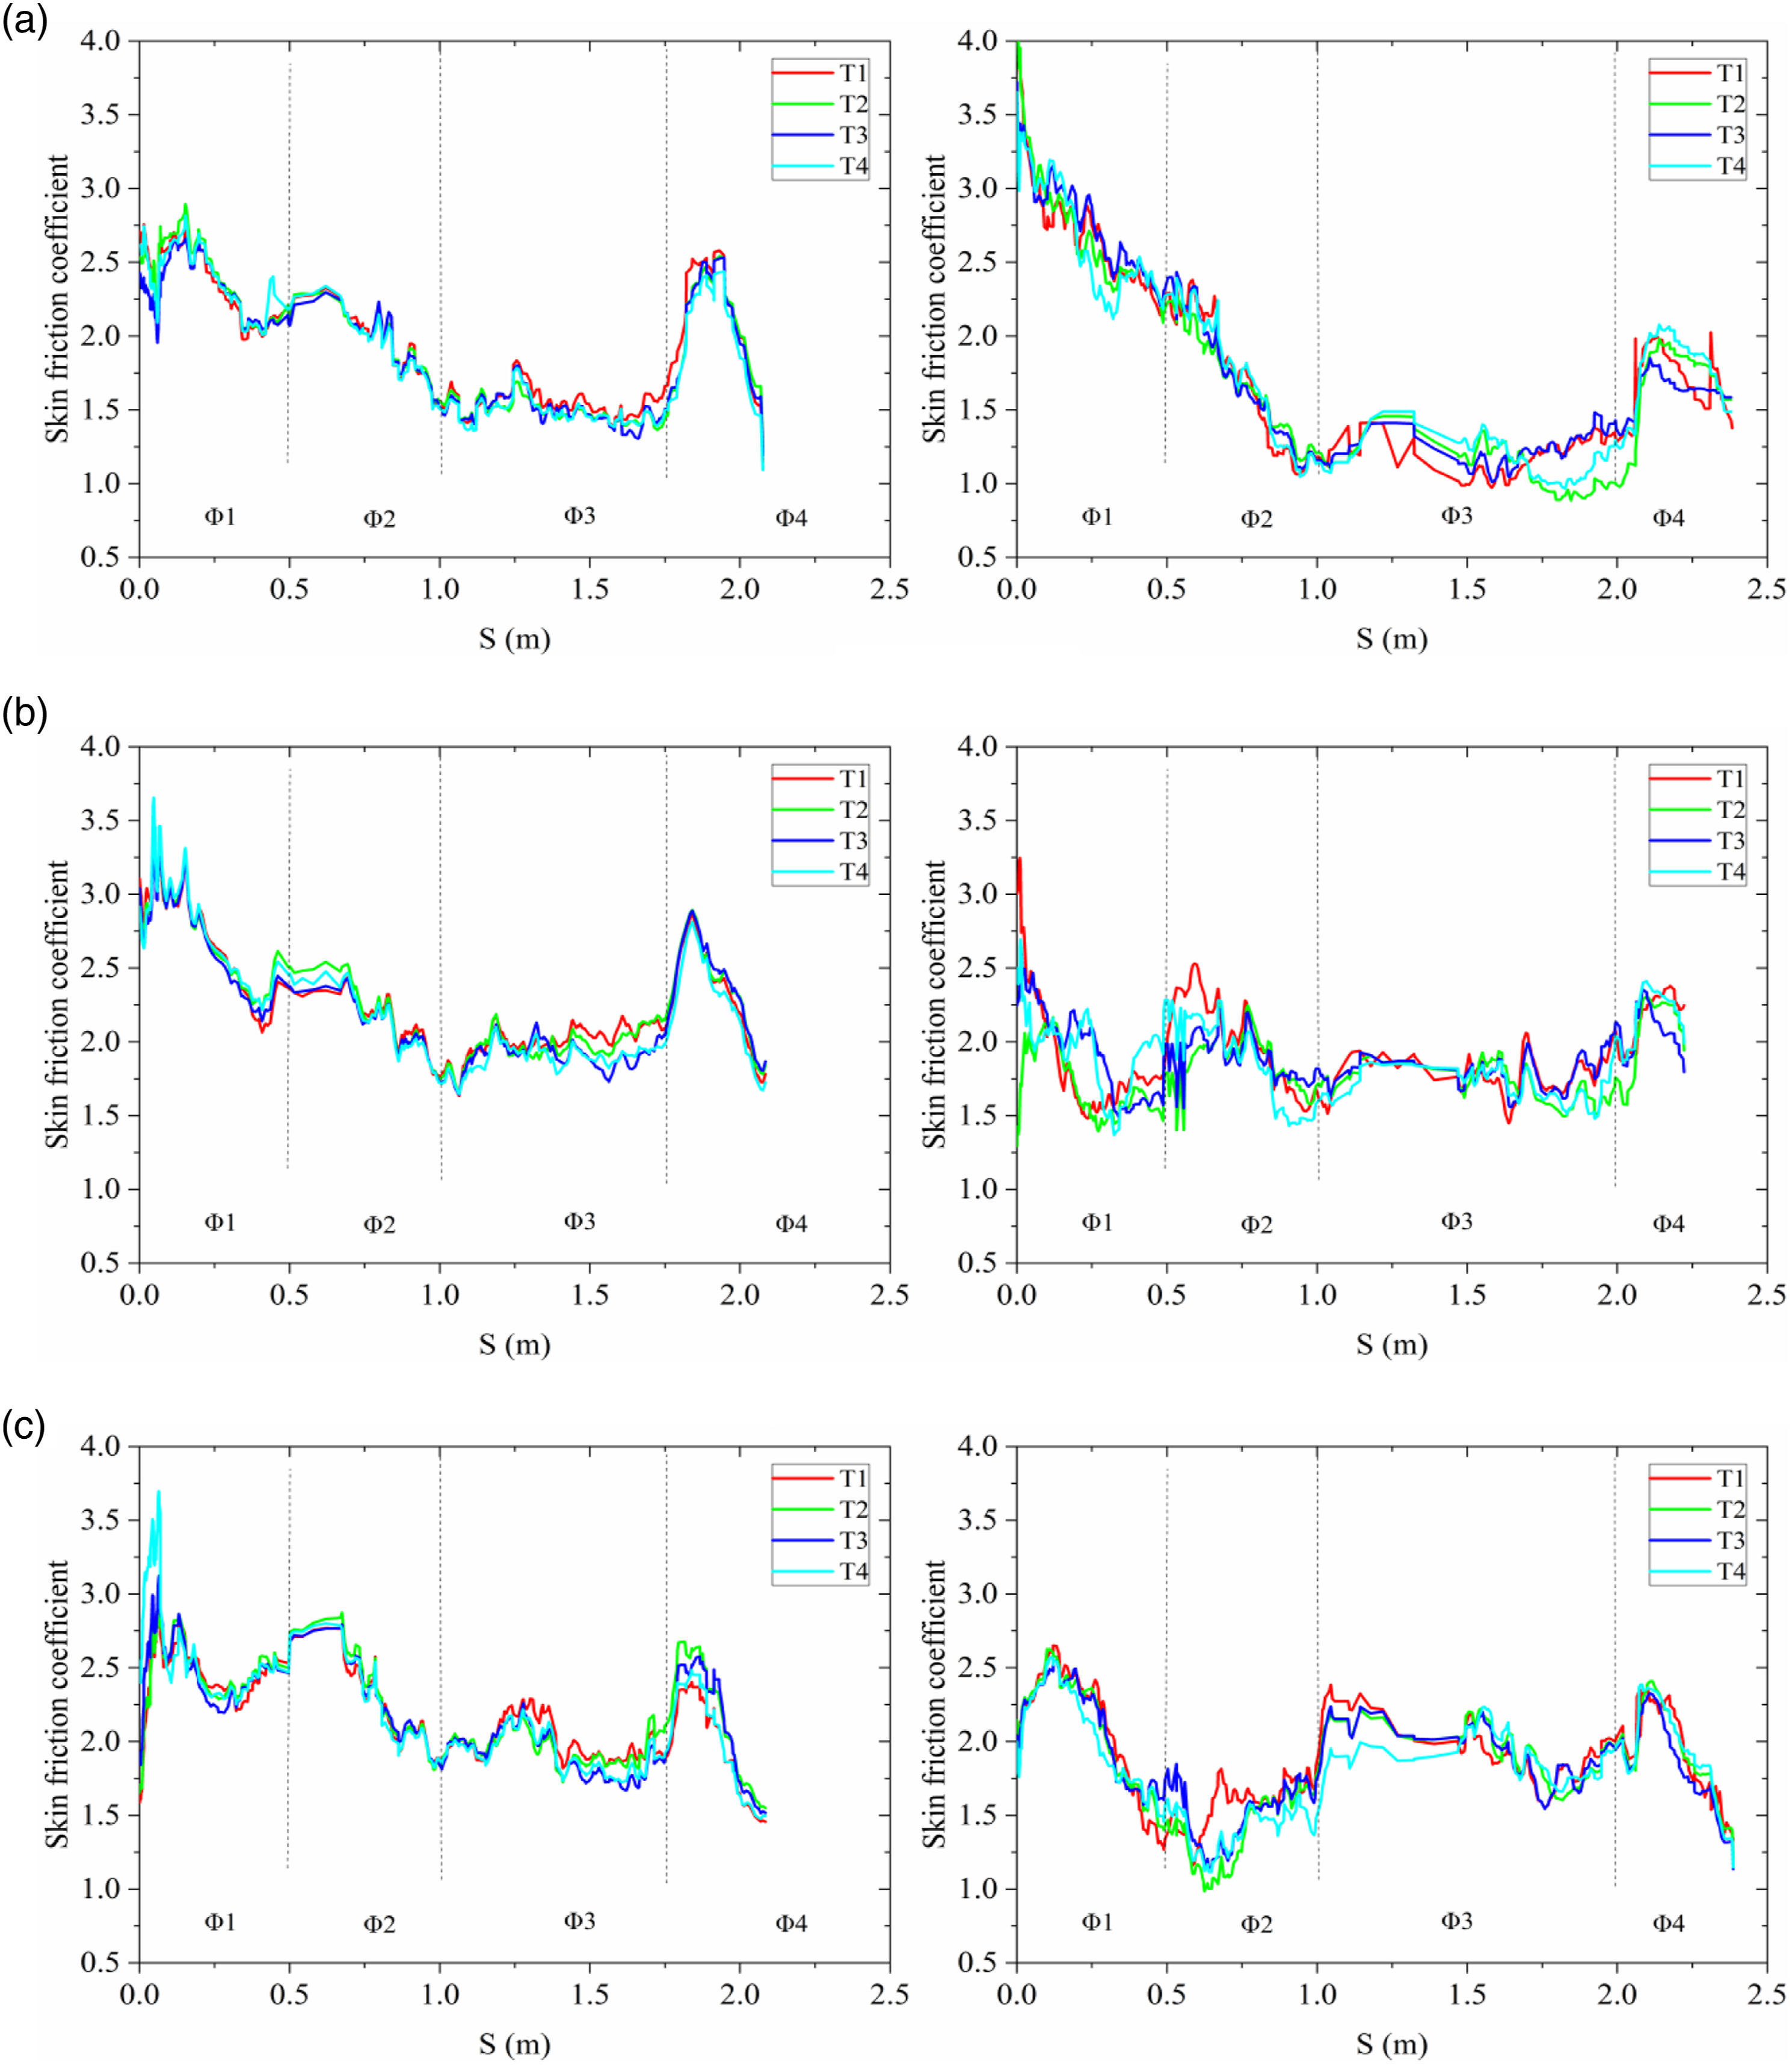
The characteristics of velocity of near-wall flow on the volute surface are demonstrated by the skin friction coefficient C
f
as given in Figure 23. The skin friction coefficient is defined as: Distribution of skin friction coefficient on the surface of the volute on the three cross-sections. The left and right columns denote the baseline fan and optimized fan, respectively. (a) z = 30 mm. (b) z = 100 mm. (c) z = 170 mm.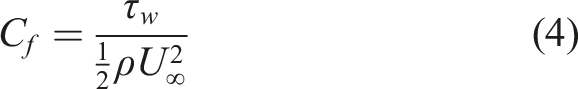
Characteristics of pressure fluctuation
The fluctuation of static pressure is used to demonstrate the instability and unsteadiness of the internal flow of the fan. We set several groups of monitors on the z = 100 mm cross-section in the volute and record the time history of static pressure, as shown in Figure 24. The E1/E2/E3 monitors are placed in the gap between the volute tongue and impeller, and G1/G2/G3 monitors to the other side of the impeller; the D1/D2/D3 and F1/F2/F3 monitors are placed to the top and bottom sides of the impeller. The D1/E1/F1/G1 monitors are located on the outer circumference of the impeller, and D3/E3/F3/G3 adjacent to the volute surface, while D2/E2/F2/G2 locate between these two groups. Positions of monitors placed in the volute on the z = 100 mm cross-section.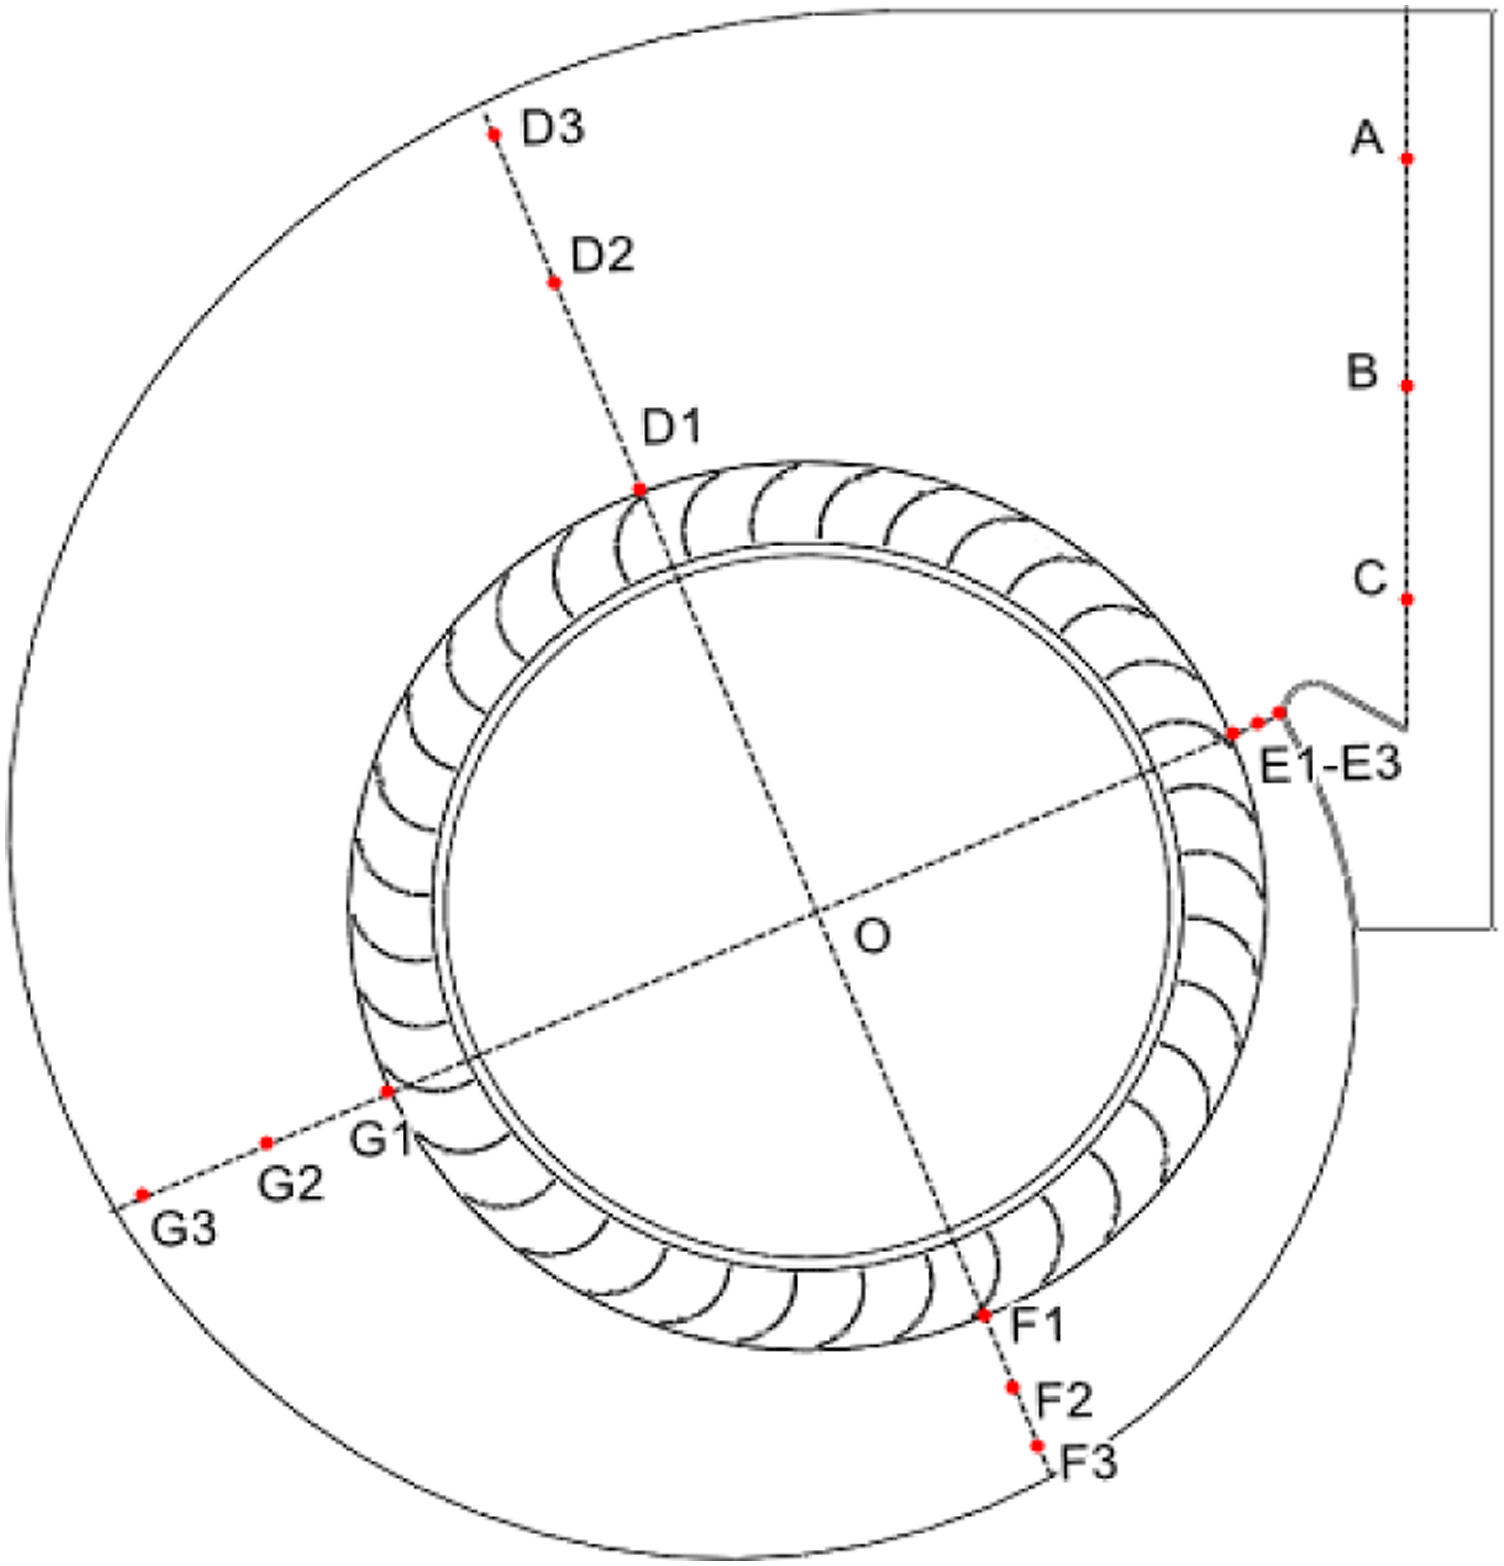
The time history of static pressure and the time-averaged value for all monitors are presented in Figure 25. The time-averaged value and fluctuating amplitude are dependent on the position of the monitor. It is seen that the time-averaged pressure is highest for monitor-E1 and lowest for monitor-E3 for both baseline and optimized fans, and the fluctuating amplitude significantly increases for flow close to the volute tongue. However, for the other sets of monitors D1/D2/D3, E1/E2/E3 and F1/F2/F3, the static pressure is always highest in magnitude for flow close to the volute surface due to pressure recovery as the fluid moves away from the impeller, while the fluctuating amplitude is the largest for flow at the outer circumference of the impeller where the exiting flow is highly perturbed. By comparing the profiles for the baseline and optimized fans, it is seen that the optimized fan greatly attenuates the pressure fluctuation around the volute tongue for all the monitors E1/E2/E3. Since the geometry of volute tongue is roughly unchanged, the attenuation of fluctuation is primarily attributed to the modification of impeller. The patterns of flow around the volute tongue significantly determines the aerodynamic performance of the fan in terms of the recirculating flow in the gap, and also the aero-acoustic performance in terms of sound level, thus the optimized fan has positive performance over the baseline fan. Time history of static pressure recorded at the several sets of monitors. The left and right columns denote the baseline and optimized fans, respectively. (a) Monitors D1/D2/D3. (b) Monitors E1/E2/E3. (c) Monitors F1/F2/F3. (d) Monitors G1/G2/G3.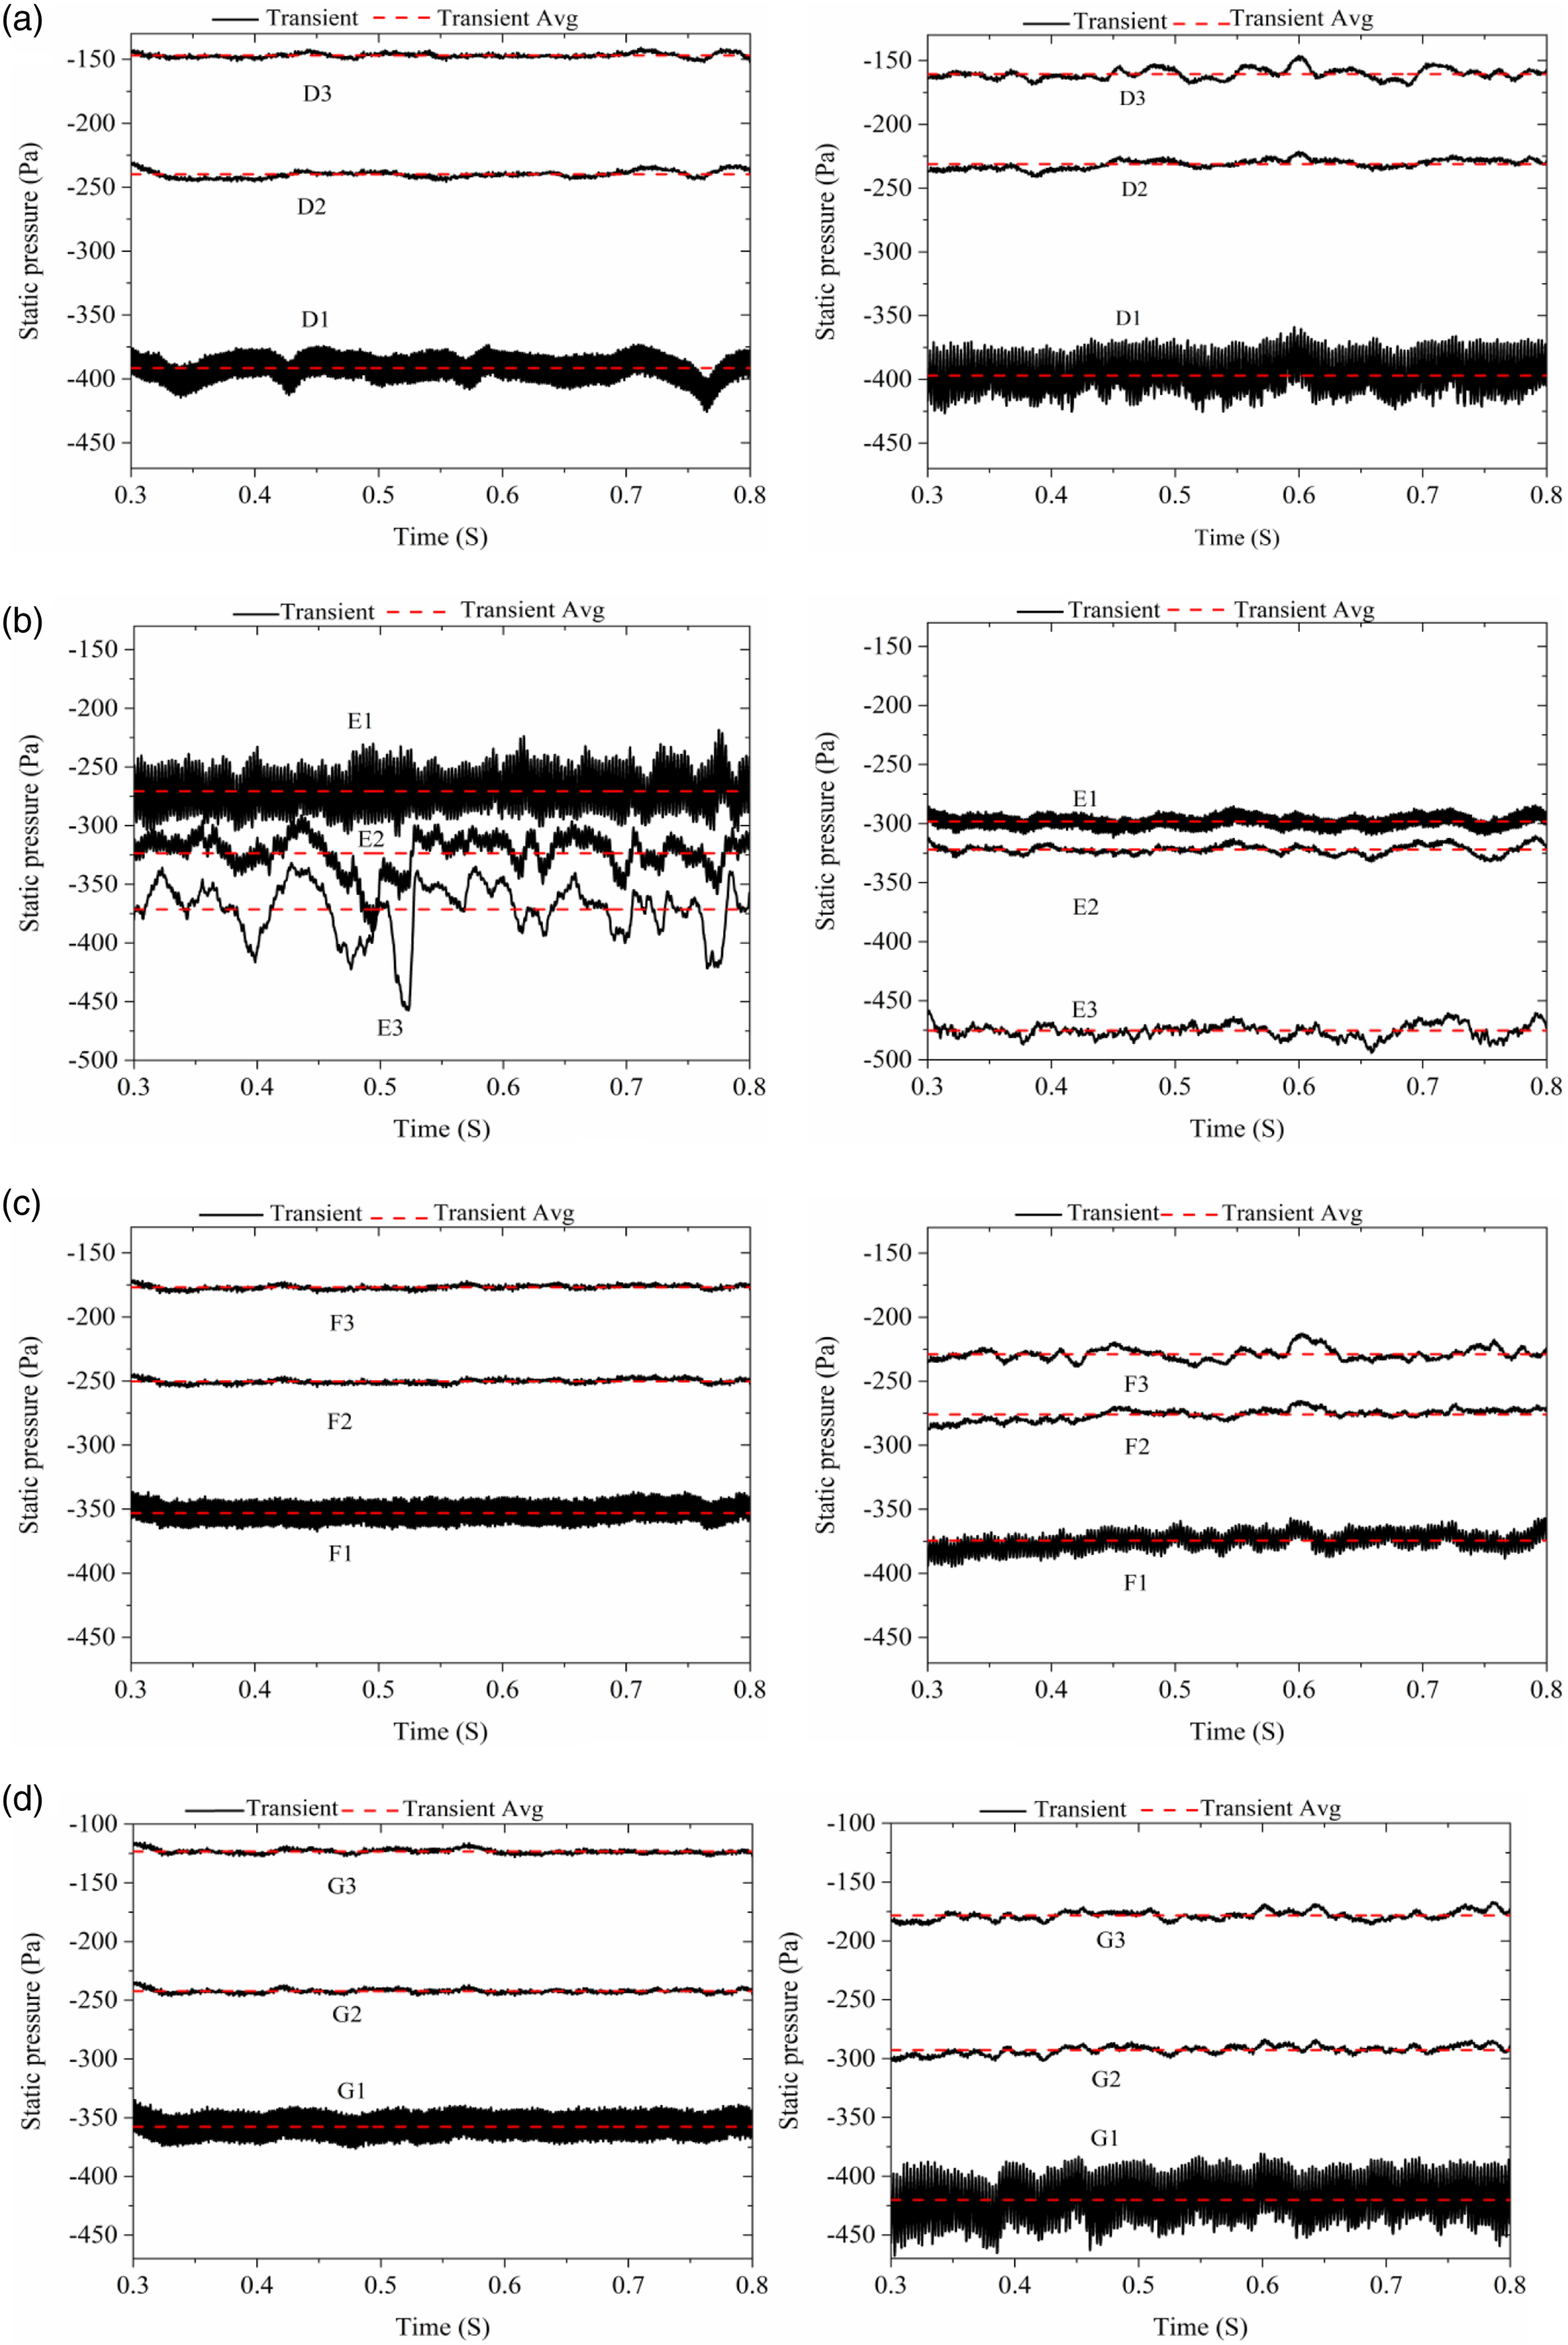
The temporal fluctuation of static pressure recorded at the several sets of monitors is analyzed through spectral transformation, and the distribution of magnitude with frequency is presented in Figure 26. The base frequency is clearly observed in the figures which transits from 480 Hz to 360 Hz as the number of blades decreases. Low frequency fluctuation is remarkable for the monitors E1/E2/E3 and F1/F2/F3 as the flow is still greatly affected by the voltue surface, while it is weak for the monitors D1/D2/D3 and G1/G2/G3 as the gap between the impeller and volute is large. For flow away from the impeller, the fluctuation at fundamental frequency get much weaker. Distribution of spectral magnitude of the pressure fluctuation on the monitors. The left and right columns correspond to the baseline and optimized fans, respectively. (a) Monitors D1/D2/D3. (b) Monitors E1/E2/E3. (c) Monitors F1/F2/F3. (d) Monitors G1/G2/G3.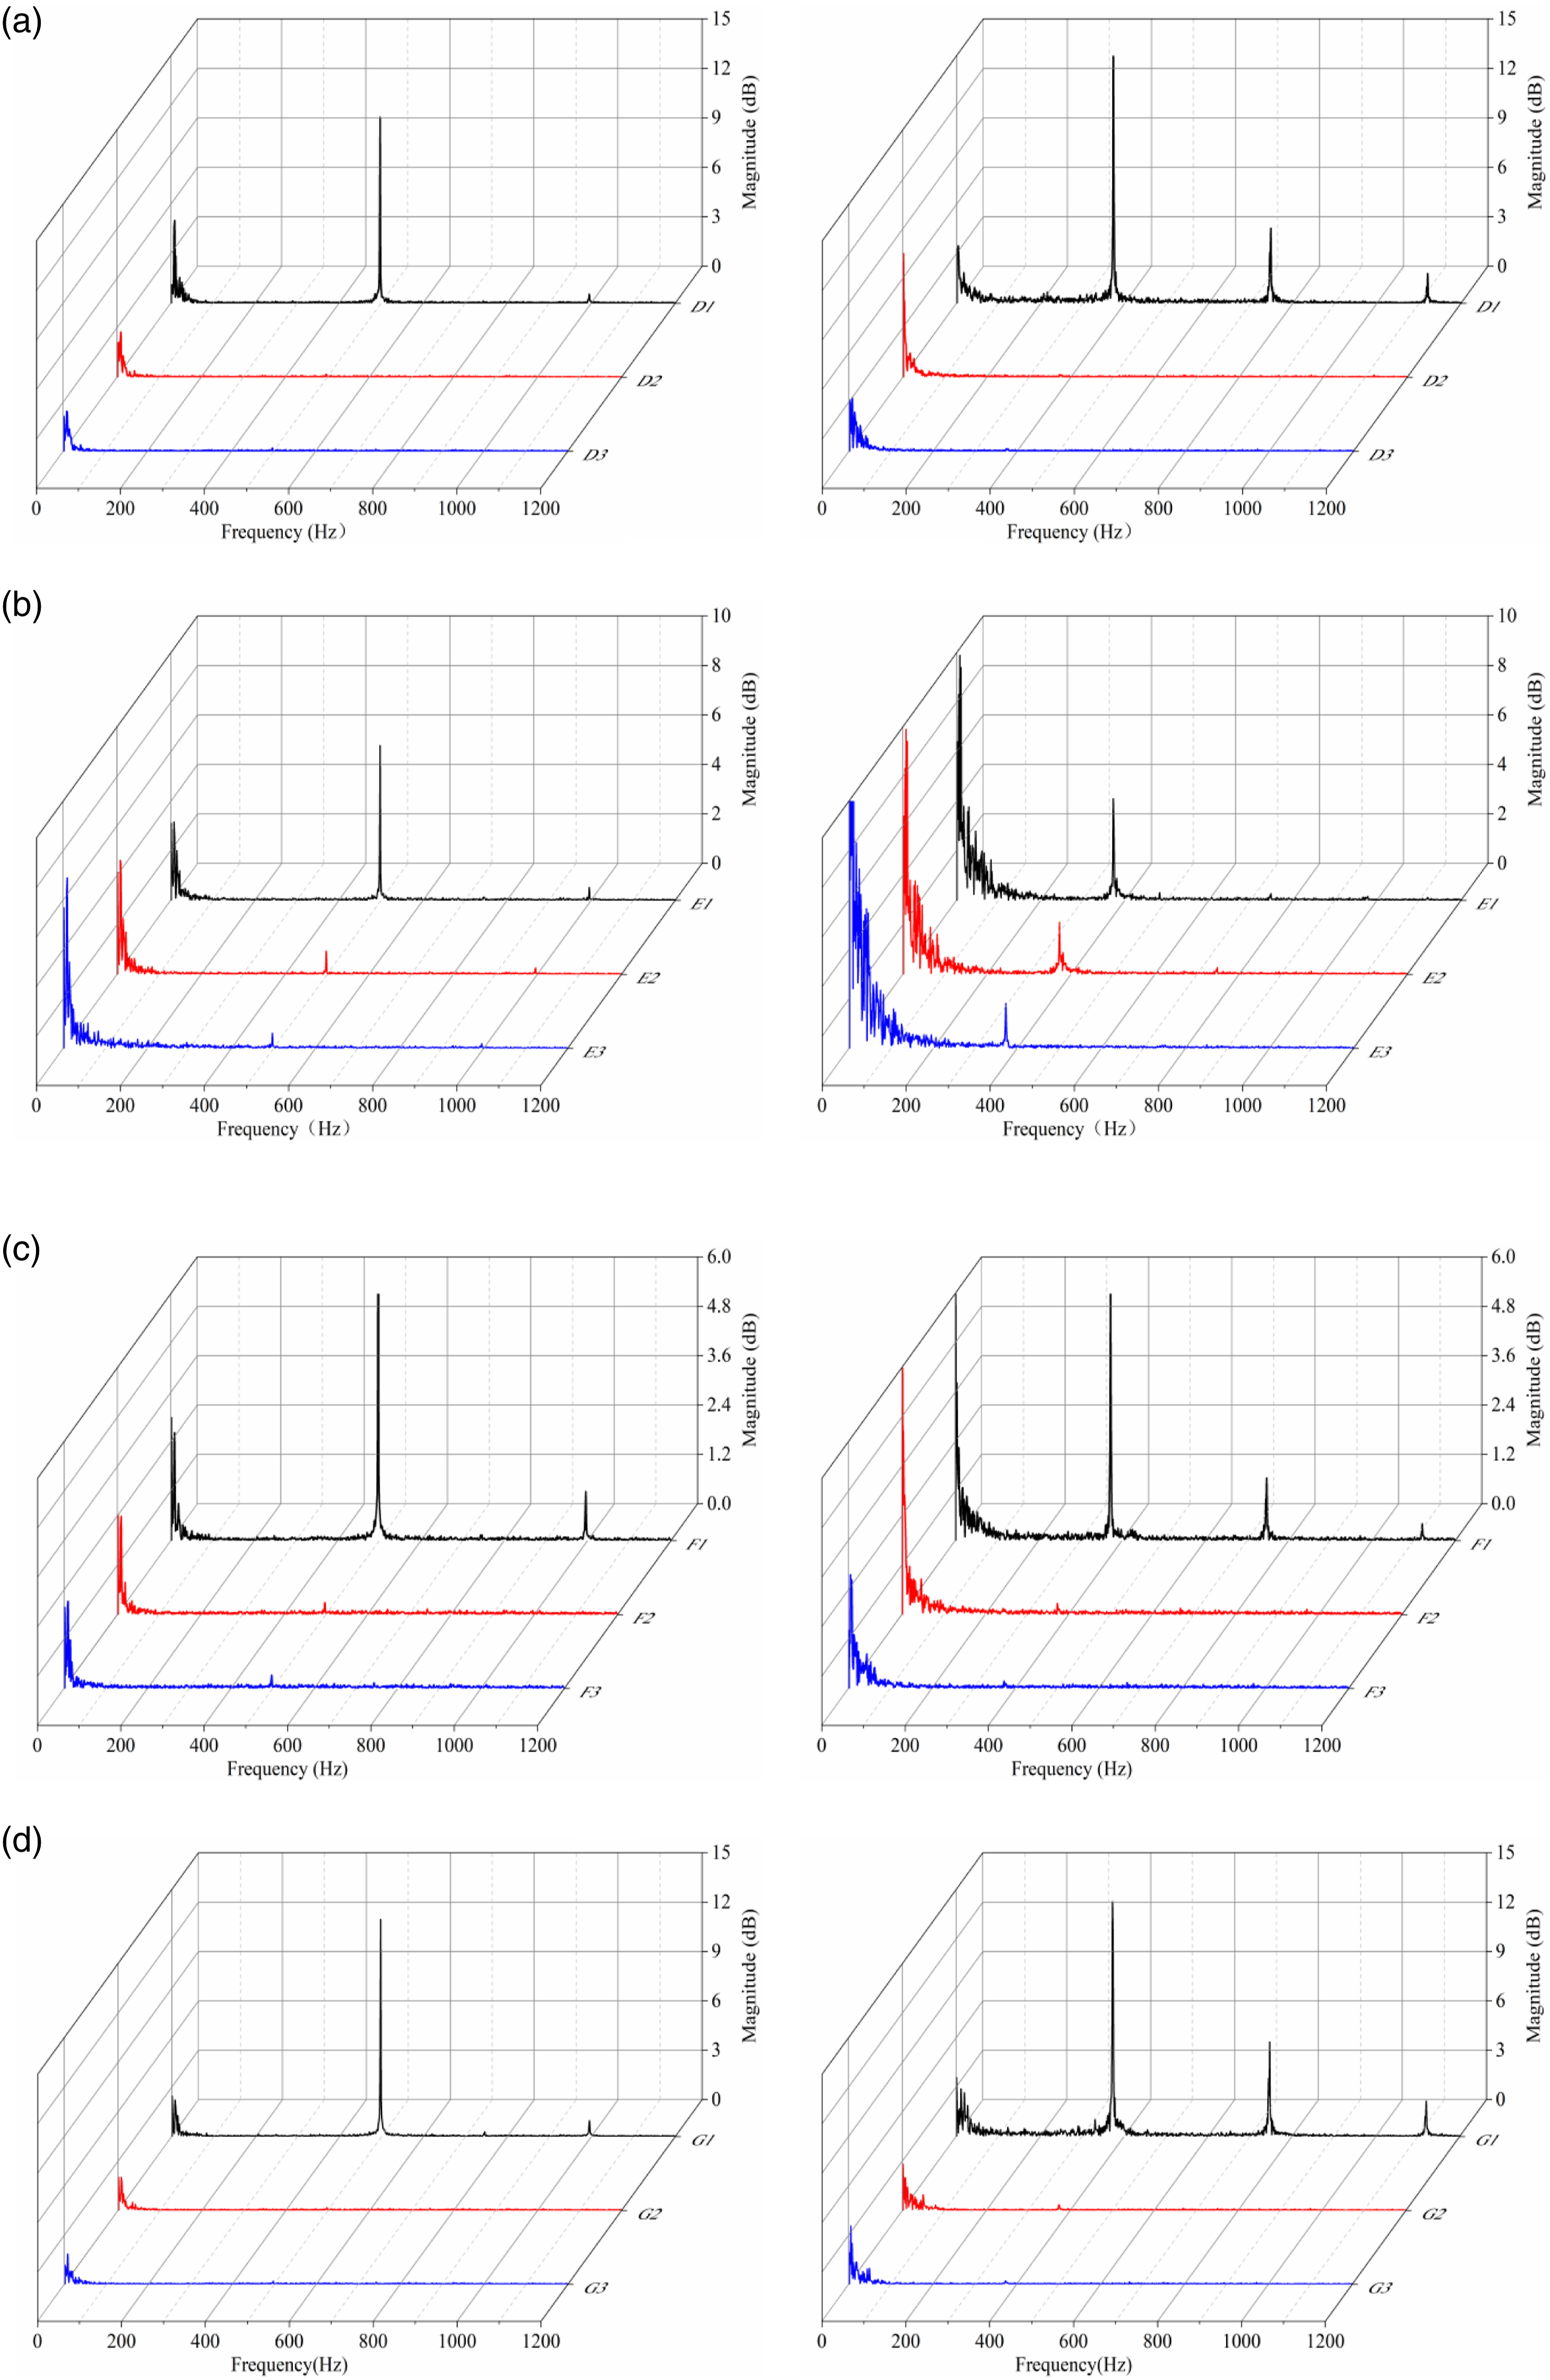
Conclusions
This work presents a parametric optimization of a Sirocco fan and numerical investigation on the characteristics of the internal flow. The geometric parameters of the fan, including the blade number and blade installation angle of the impeller, and profile of the volute are optimized. The unsteady flow in the fan is explored by large-eddy simulation, and the time-averaged and transient characteristics of the internal flow, such as the flow patterns, flow in the impeller and volute, and pressure fluctuation are analyzed.
The aerodynamic performances of the Sirocco fan can be improved at designed flow rate by the parametric optimization, which reduces the number of blade and outlet installation angle of blade. The static pressure rise and static pressure efficiency are increased by around 1.8% and 5.0%, respectively, for the optimized fan compared with the baseline fan.
The optimized model of the Sirocco fan reduces the area of recirculating flow at the central interior of the impeller and in the blade passages, thus increases the velocity of through-flow in the blade passages. The flow in the volute gets more spatially uniform and temporarily stable especially at the outlet of the fan.
The characteristics of flow in the impeller and around the volute tongue are significantly affected by the geometry modification in the parametric optimization. Compared with the baseline fan, the optimized fan increases the velocity of outflow of the impeller and decreases the velocity of recirculating flow around the volute tongue. The optimized volute increases the time-averaged static pressure but lowers the pressure fluctuation monitored within the volute.
Footnotes
Declaration of conflicting interests
The author(s) declared no potential conflicts of interest with respect to the research, authorship, and/or publication of this article.
Funding
The author(s) disclosed receipt of the following financial support for the research, authorship, and/or publication of this article: National Natural Science Foundation of China (52176047), Zhejiang Province Key Research and Development Program (2021C01049 and 2022C01227) and Higher Education Discipline Innovation Project (D21011).