
Abstract
Current trends in the automotive industry towards engine downsizing means turbocharging now plays a vital role in engine performance. The purpose of turbocharging is to increase the engine inlet air density by utilising, the otherwise wasted energy in the exhaust gas. This energy extraction is commonly accomplished through the use of a radial turbine. Although less commonly used, mixed flow turbines can offer aerodynamic advantages due to the manipulation of blade leading (LE) angles, improving performance at low velocity ratios. The current paper investigates the performance of a mixed flow turbine with four volute designs, two radial and two tilted volutes each with one variant with an aspect ratio (AR)=0.5 and one with AR = 2. To ensure constant mass flow parameter (MFP) for aerodynamic similarity, volute area to radius ratio (A/r) was manipulated between the design variants. The maximum variation of cycle averaged normalized efficiency measured between the designs was 2.87%. Purely in the rotor region, the variation in normalized cycle averaged efficiency was 3%. The smallest volute AR designs showed substantial secondary flow development. The introduction of volute tilt further complicated the secondary flow development with the introduction of asymmetry to the flows. It was established that both AR and tilt have a notable effect on secondary flows, rotor inlet conditions and over all mixed flow turbine performance.
Introduction
Due to environmental concerns, engine downsizing has become increasingly important in the automotive industry to reduce engine emissions. To enable the downsized engines to produce the required power output turbochargers are commonly implemented.
The purpose of turbocharging is to increase the engine inlet air density by utilising the otherwise wasted energy in the exhaust gas. This energy extraction is commonly accomplished through the use of a radial turbine. Although less commonly used, mixed flow turbines can offer aerodynamic advantages due to the manipulation of blade leading edge (LE) angles while maintaining radial stacking of the blade fibres, hence keeping blade stress within an acceptable limit.
1
Manipulation of blade LE angles provides an extra degree of freedom to extract the maximum work from the exhaust flow. The definition of a mixed flow turbine is given in Figure 1 and the resulting blade LE angle is defined in equation (1)

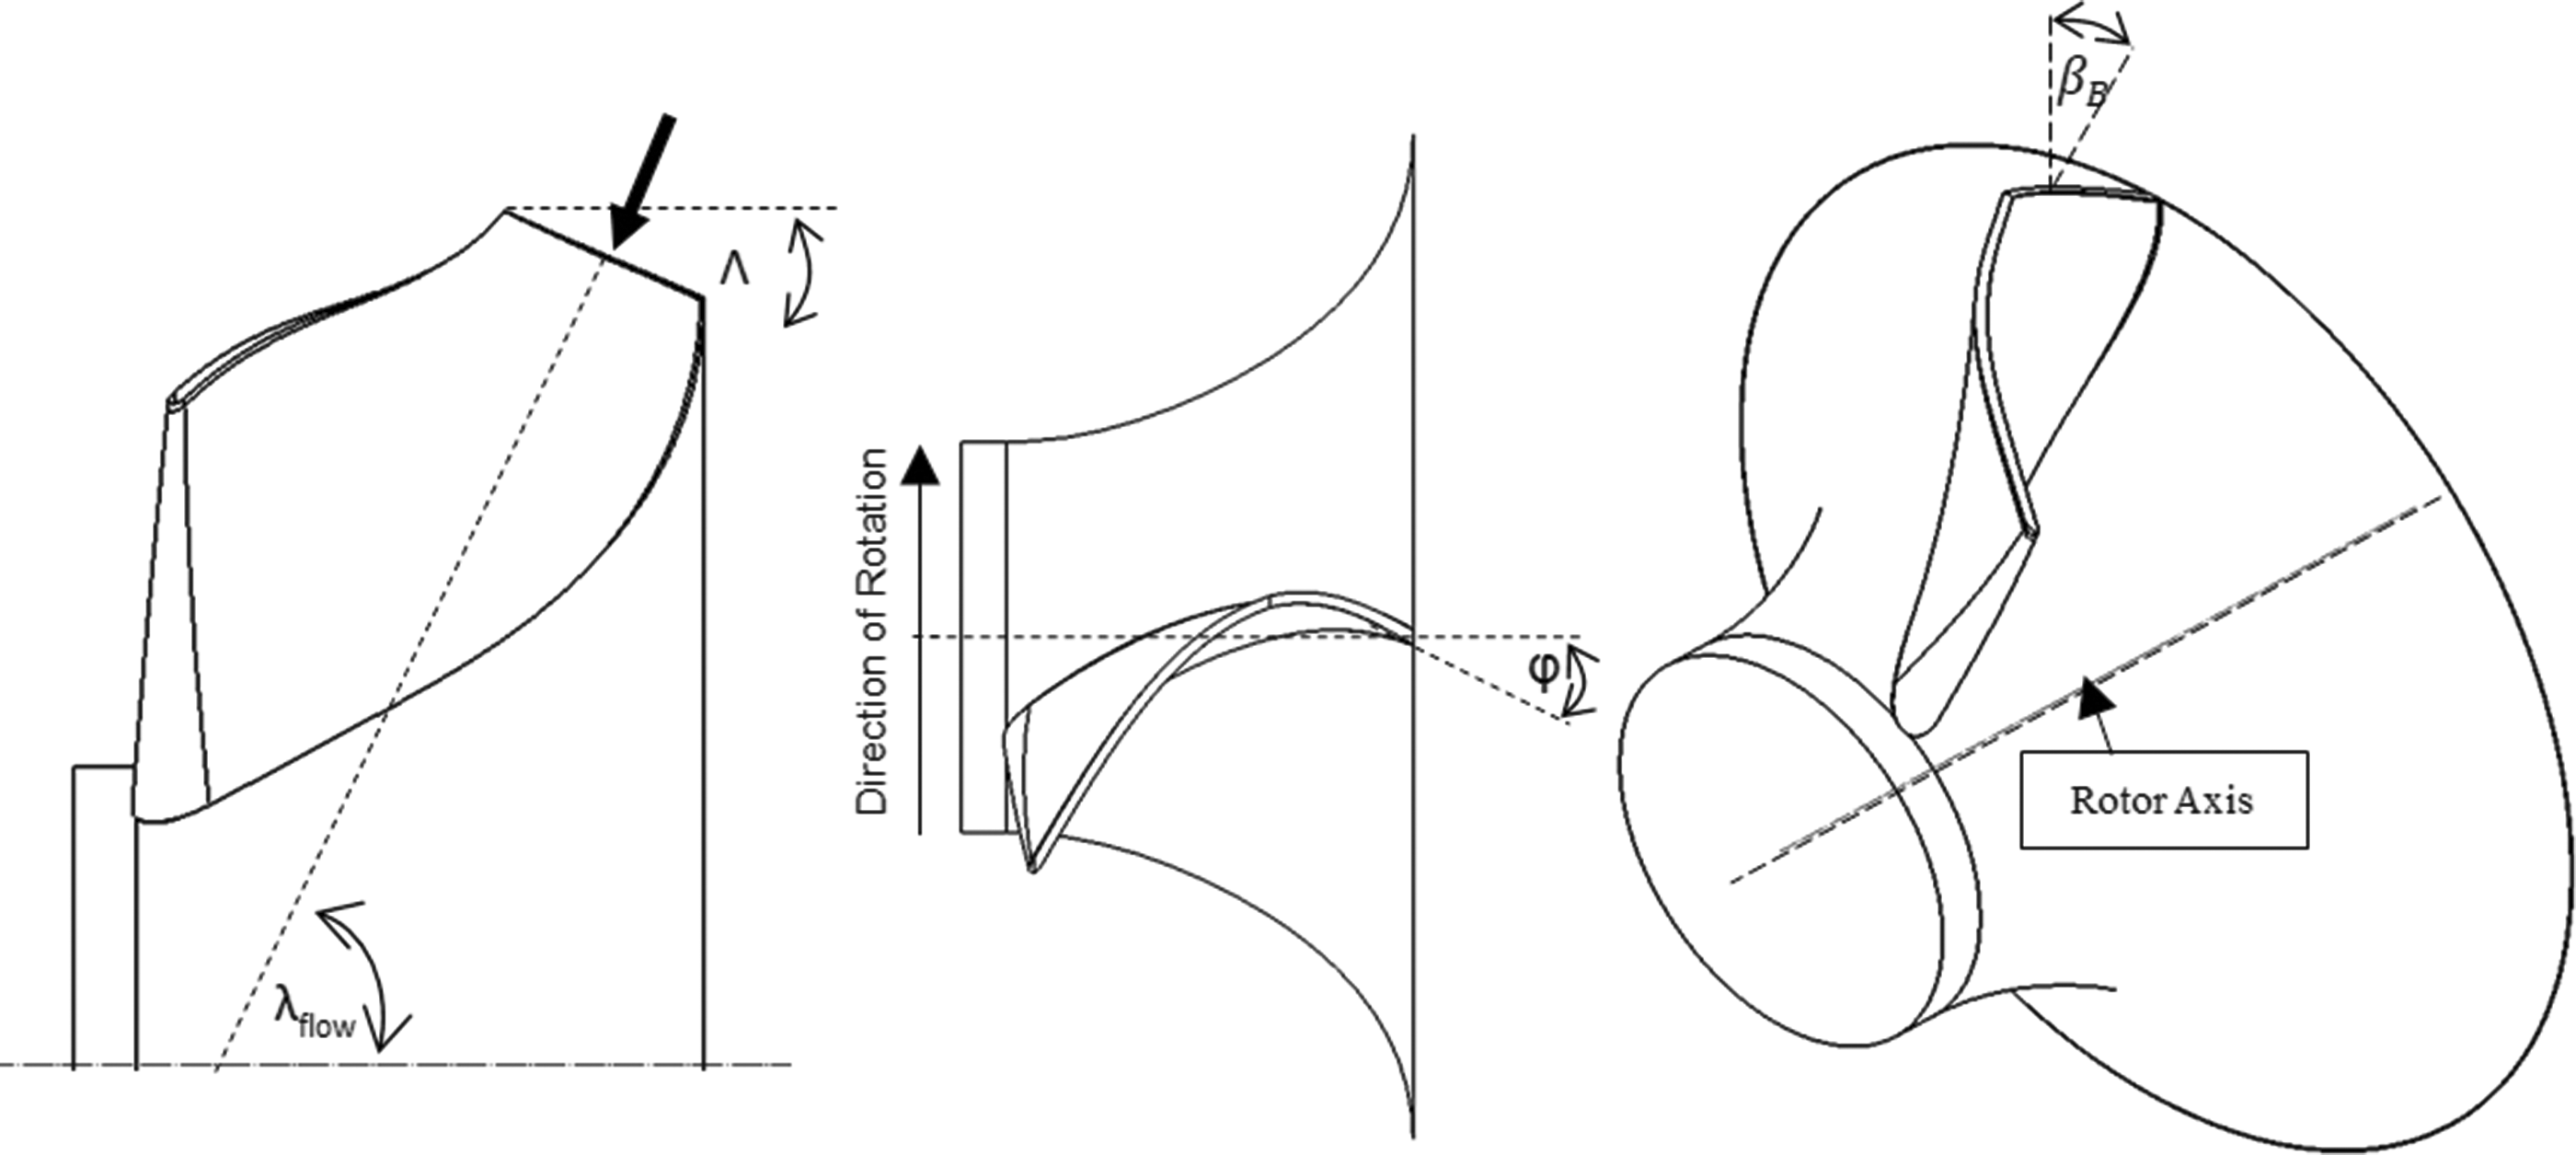
Single blade shown on rotor hub defining flow cone angle (λflow) and blade cone angle (
To ensure that blades are not over stressed, they should be stacked radially. For a radial flow wheel, this forces the blade LE angle to be zero. For a mixed flow wheel, the axial component of flow allows the flow angle to be manipulated by adding camber whilst maintaining radial stacking. This can alleviate excessive leading edge (LE) incidence angles that can arise during operation.
Figure 2 shows the impact of the highly pulsating flows on inlet flow angle (
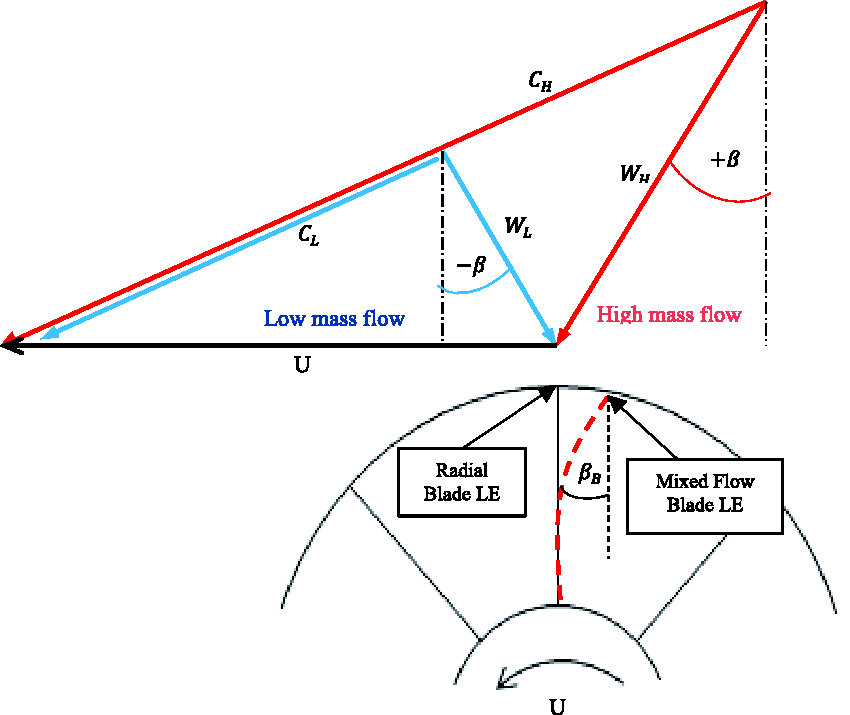
Rotor inlet velocity vector triangles under pulsating flow.
The peak energy in the exhaust pulse is available at the minimum velocity ratio (
The unsteady environment created due to the inlet pulsations introduces a significant challenge for designers to ensure the turbine can operate effectively over a wide range of conditions. The operation of mixed flow turbines under such flows has been assessed by numerous authors.2–4 The rotor is fed by the volute which is tasked with the job of directing and accelerating the flow. The volute plays a vital role in producing the rotor LE flow angles controlled by the volute cross sectional area to radius of centroid ratio, A/r. 5
LE flow variation in a mixed flow turbine was investigated by Karamanis et al. 3 using laser Doppler anemometry (LDA). This work showed complex flow distributions at the rotor LE under steady conditions, however the authors did not investigate the volute flow responsible. Furthermore, under pulsating flow the velocity measurements were limited to only the LE mid span and therefore the flow distribution over the span was not investigated. Rajoo and Martinez-Botas 1 suggested that the experimental findings by Karamanis et al., 3 and the computational work completed by Palfreyman and Martinez-Botas, 6 showed that rotor inlet guide vanes are necessary to tackle the non-uniformity of rotor inlet flow. However, implementation of inlet guide vanes incurs a greater cost, 7 and therefore well designed volutes, that can limit this nonuniformity, are a desirable proposition.
The impact of rotor inlet flow condition were studied by Lee et al. 8 over a wide range of pulsating flow conditions. The authors showed that the LE span-wise flow distribution varied over the pulse period and was dependent on the pulse characteristics. They also showed that poor flow turning ahead of the mixed flow rotor limited the mixed flow effect thereby impacting the aerodynamic advantages of the mixed flow turbine.
To overcome the limited mixed flow effect achieved with the employment of standard radial volute designs, Lee et al.
9
investigated the impact of volute tilted on the performance of a mixed flow turbine and found an efficiency benefit of up to 1.64% mainly due to a reduction in shroud surface separation. In addition, both Morison et al.
10
and Lee et al.
11
investigated the impact of rotor LE flow conditions in the absence of a volute. Both authors included the impact of flow cone angle but achieved conflicting results. Morrison et al.
10
found that a flow cone angle of 95
Another volute parameter of interest to designers is the aspect ratio of the cross section. Not only does this parameter impact on aerodynamic performance but it also impacts package size. With limited space available in the engine bay, this parameter is of high importance for package size and performance trade-off. The impact of two asymmetrical volute cross sectional shapes on the performance of a radial turbine was studied by Yang et al. 12 The flow structures present in the two volute designs were substantially different leading to notably different levels of overall performance. This was attributed to the change in rotor inlet conditions in the two designs. The authors concluded that a better understanding of the impact of volute flows on rotor performance is required to gain further performance benefits.
A similar study was conducted by Meghnine et al., 13 again investigating asymmetrical volute designs but this time for a mixed flow rotor. The authors observed clear vortex generation in all of designs studied and concluded that the volute volume is critical to vortex development.
More recently, Lee et al. 14 showed the impact of aspect ratio on volute flows and turbine performance for symmetrical volute designs. The authors showed that volute aspect ratio had a substantial impact on stage MFP and the volute A/r had to be manipulated to ensure aerodynamic similarity. It was also observed that increasing aspect ratio reduced volute secondary flows and a small reduction in rotor LE span-wise variation was achieved. Volute aspect ratio was shown to result in up to a 1.47% change in efficiency.
The current paper brings together the impact of volute tilt and aspect ratio variation on mixed flow turbine performance in an attempt to improve the understanding of volute design. While both aspects have been investigated individually no previously published work has investigated the two aspects combined. In particular this work builds on previously published work by the current authors on volute aspect ratio 14 and volute tilt. 9 The investigation focuses on the development of volute secondary flow structures and the resulting rotor inlet conditions, highlighting the importance of correct volute-rotor matching, particularly in mixed flow applications where span-wise LE manipulation is possible through camber and flow cone angle changes.
Turbine design
This study took the two most extreme volute designs, originally investigated in Lee et al.
14
and introduced their tilted counterparts for comparison. Figure 3 shows the four resulting volute cases, two radial volutes with AR = 0.5 and AR = 2; and two tilted volutes with AR = 0.5 and AR = 2. Further details of how the tilt is applied can be found in Lee et al.
9
The volute aspect ratio is defined in equation (3) as

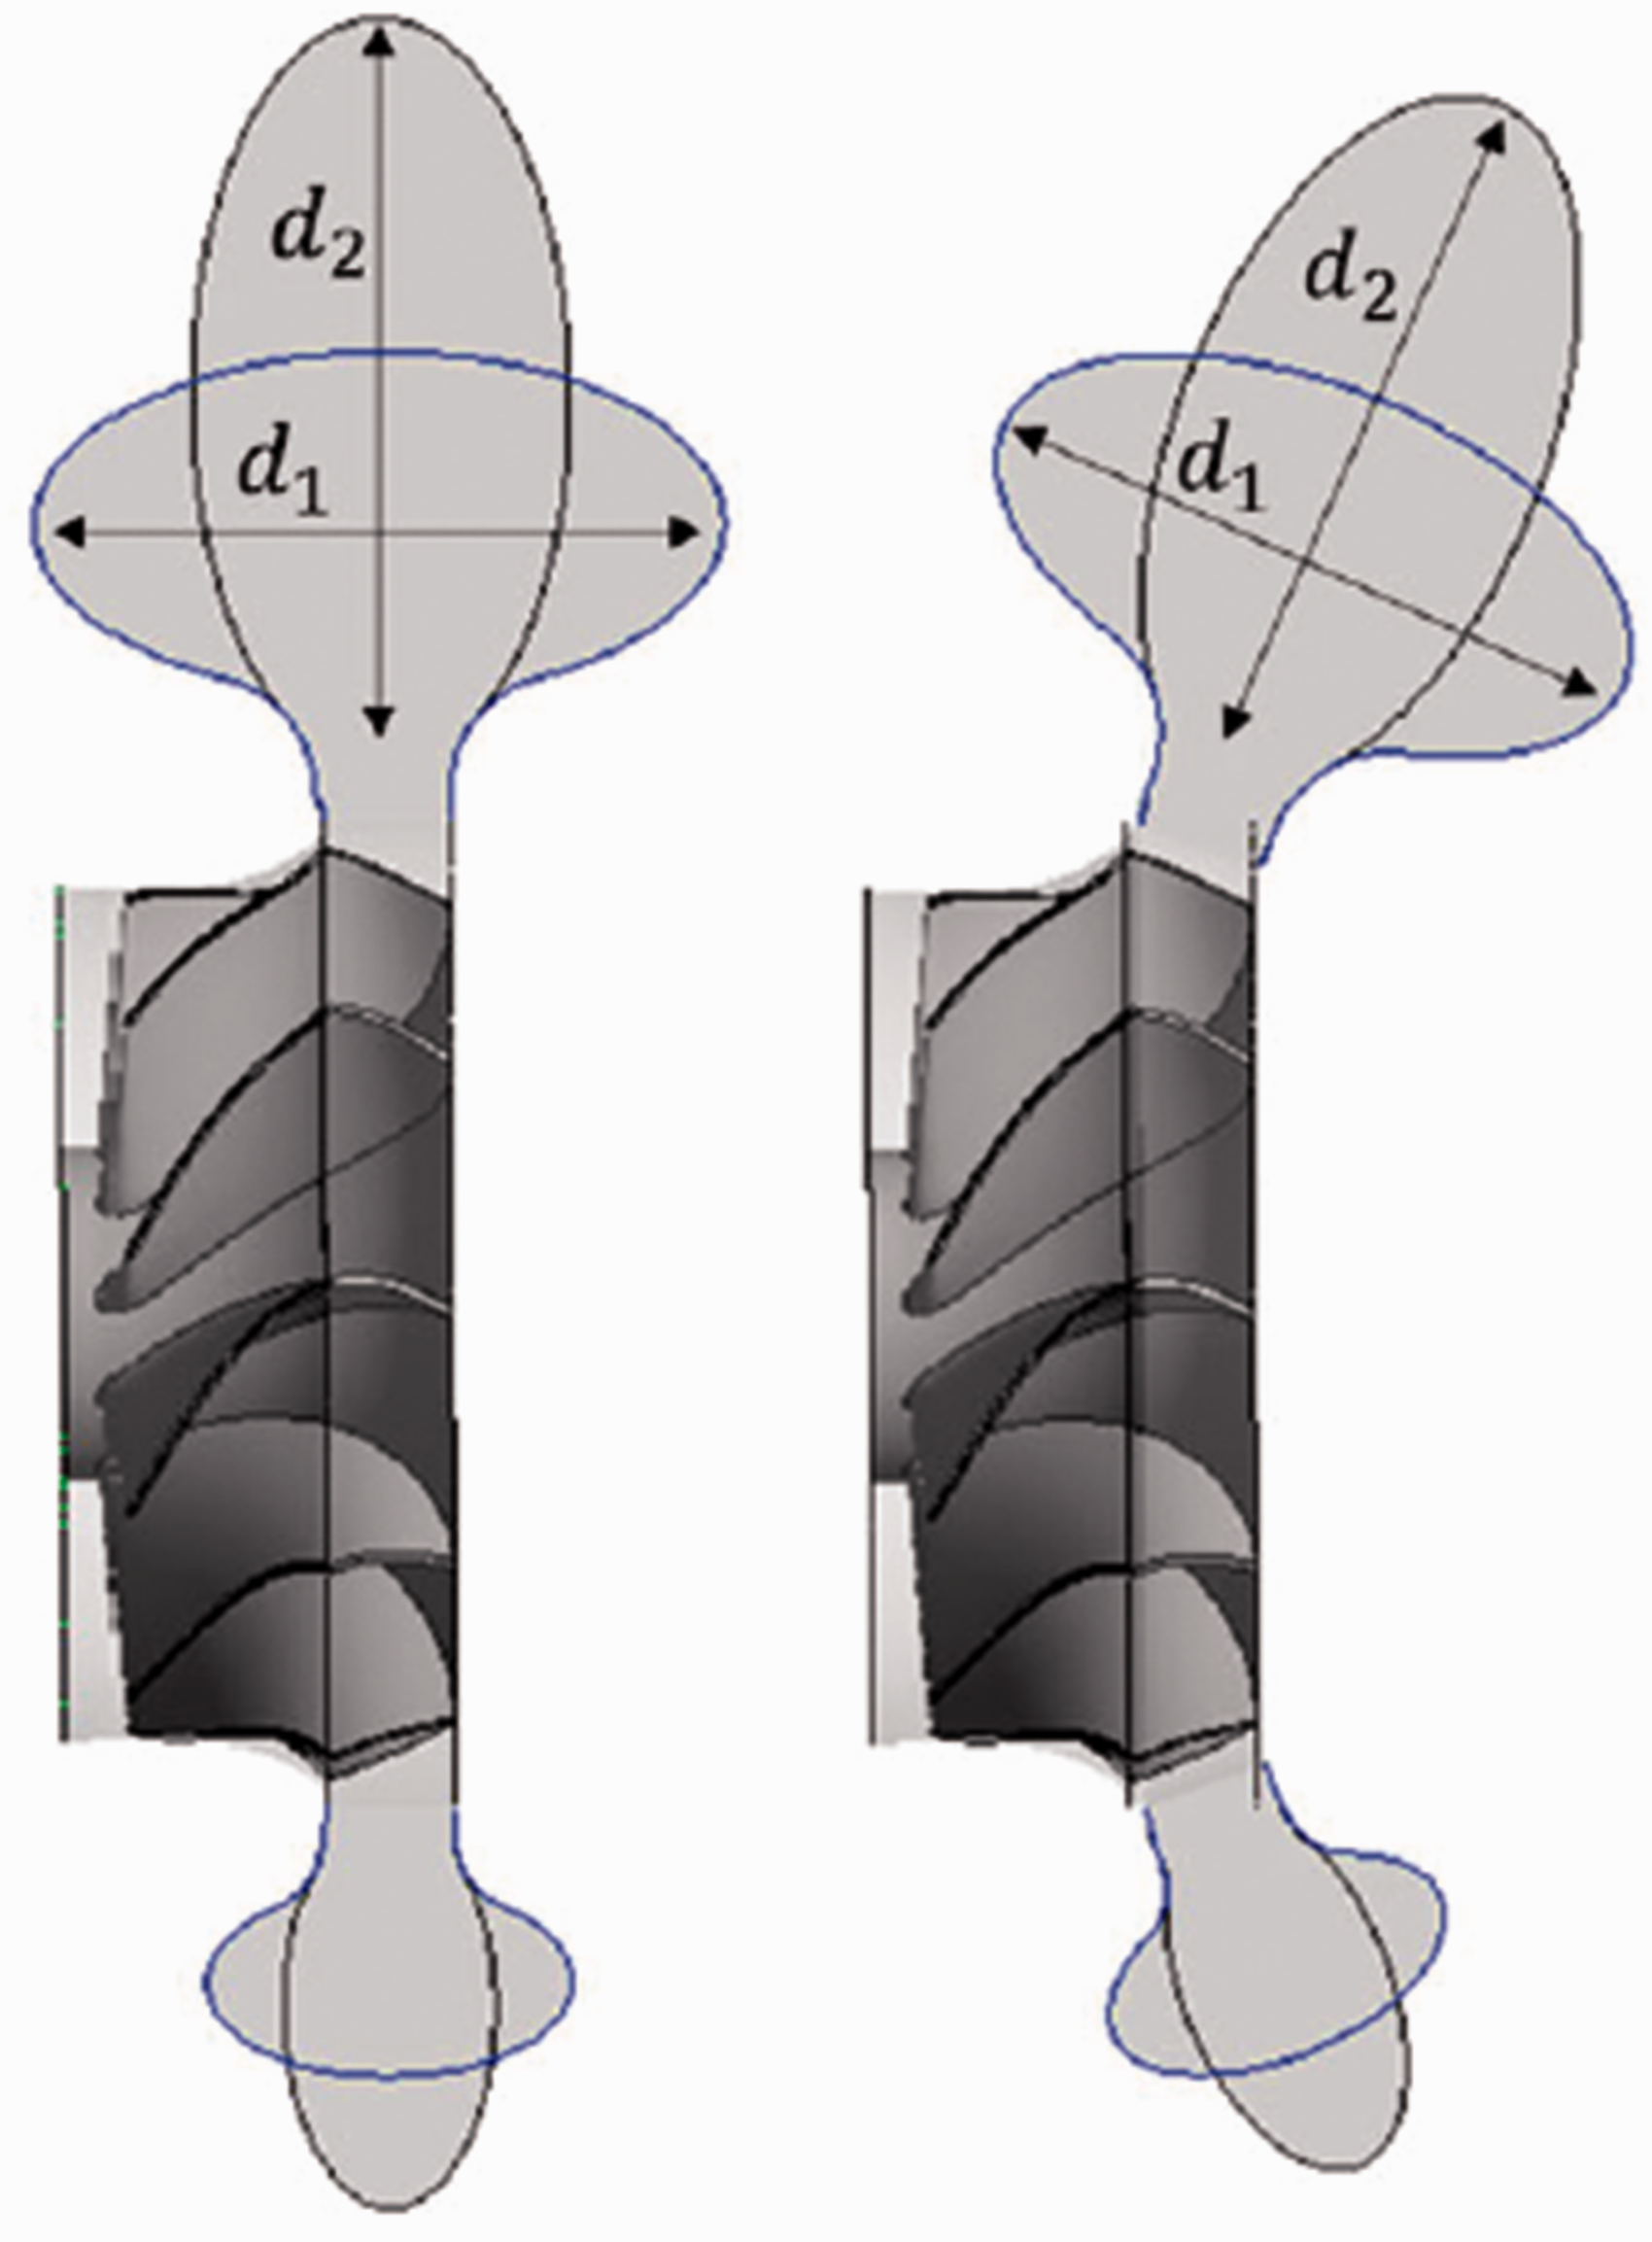
Aspect ratio designs, AR = 0.5 and AR = 2.
The turbine rotor used in this investigation, shown in Figure 4, is a production mixed flow wheel for commercial applications. This particular wheel contains a camber angle varying from approximately -27° at the hub to 13° at the shroud tip and a blade cone angle of 20°. Further details of the rotor can be found in Lee et al. 11
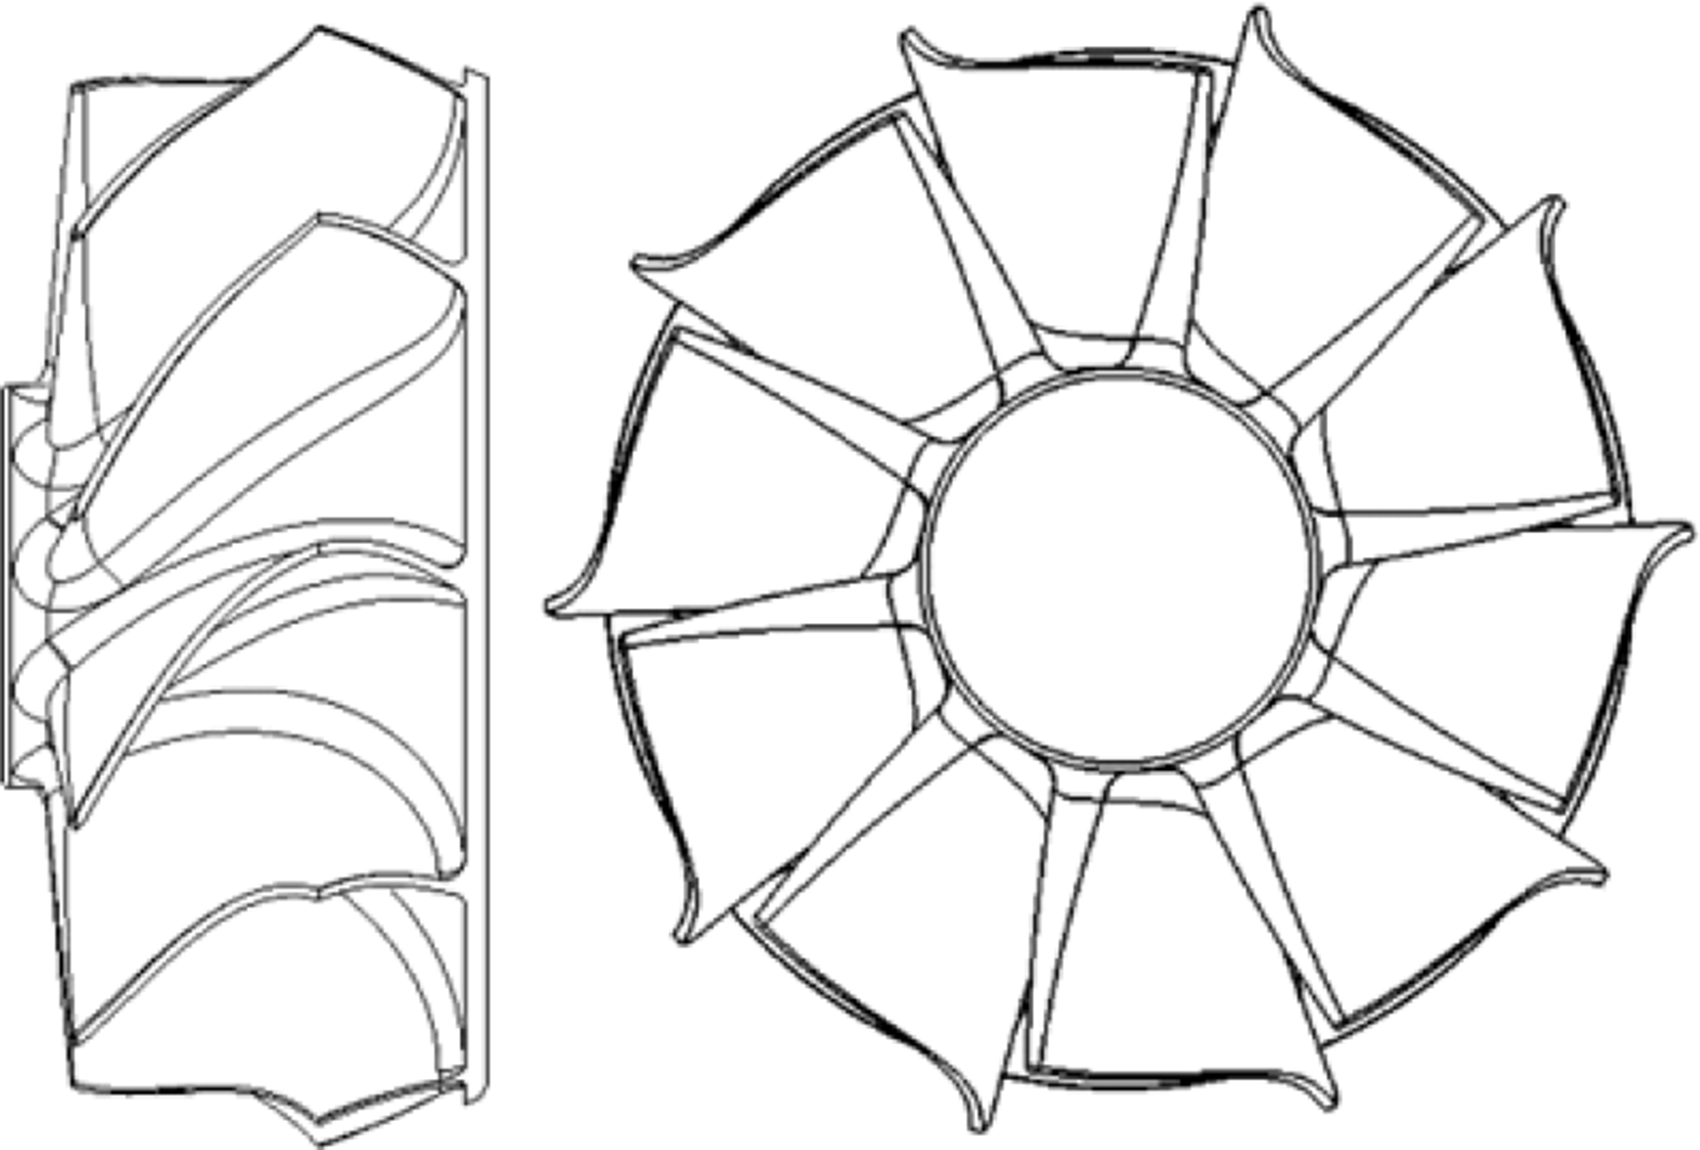
Mixed flow rotor design.
Inlet pulsating conditions
The four volute designs were analysed at three pulse frequencies of 20 hz, 40 hz and 60 hz. The turbine rotation speed was kept constant at 90krpm and the pulse load remained constant in all cases. The inlet mass flow and total temperature pulses applied as boundary conditions are presented in Figure 5. The inlet pulse shapes were extracted from a 1 D engine simulation tool and are assumed to be an accurate representation of a standard pulse shape for the purpose of this study.
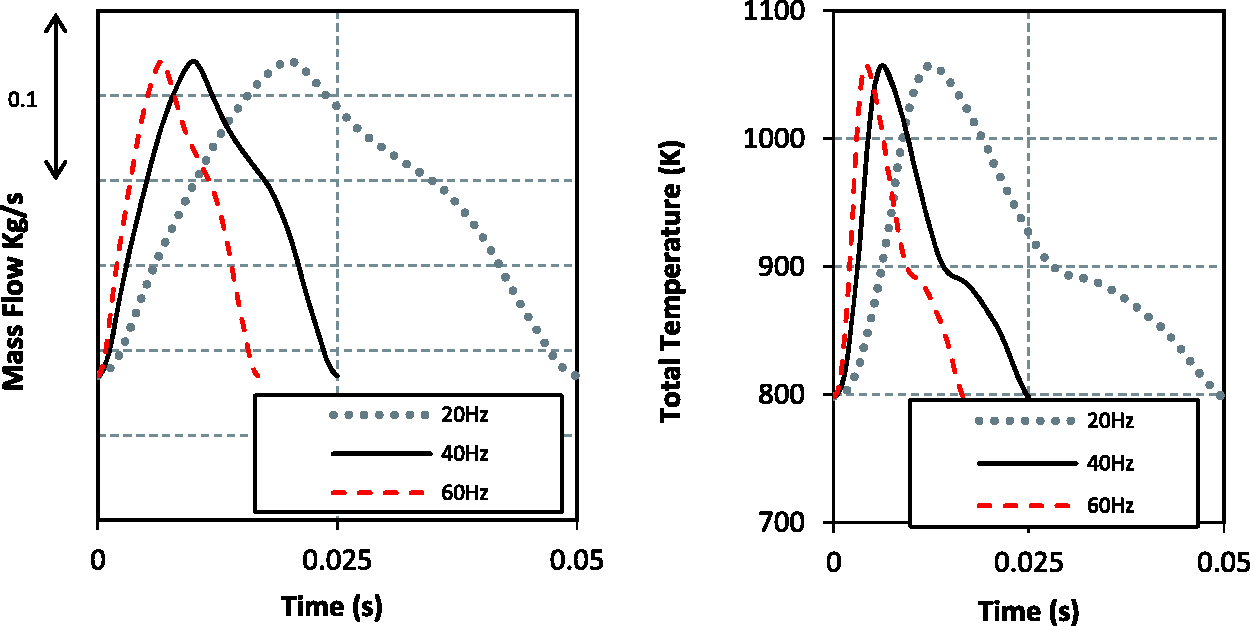
Inlet mass flow and total temperature pulses at 20 Hz, 40 Hz and 60 Hz frequencies.
Computational approach
Figure 6 shows the computational set-up which consists of three domains: the volute, the rotor and the outlet. A mesh study was completed on each domain separately as recommended by Galindo et al., 15 a boundary layer mesh study was also included, further details can be found in Lee et al. 14

Computational domain set-up.
All CFD simulations were completed in CFX 17 using the Shear Stress Transport Scale-Adaptive Simulation (SST-SAS) turbulence model. Further details of the turbulence computation can be found in Menter and Egorov. 16
A number of authors17–19 have used the frozen rotor approach to account for the turbine rotation in order to simplify the analysis. Using this approach Yang et al. 18 showed good experimental agreement, although the authors did note differences in the performance hysteresis. This discrepancy was attributed to the effect of the volute tongue.
Yang et al. 20 compared the frozen rotor and sliding mesh method in detail. It was observed that the rotor torque and the circumferential variation in velocity was well match between the two approaches. However, differences in the flow were apparent in the vicinity of the volute tongue.
To validate the frozen rotor approach for the purpose of this study the method was compared with that of the sliding mesh approach. The details of this validation are available in a previous publication by the current authors. 8
Experimental validation
All experimental tests were conducted on the cold flow test rig at Imperial College London. Hence the low turbine rotational speeds are the result of the reduced inlet temperature of approximately 320 K. Details of the test facilities are available in Yang et al. 12 and Newton. 21
The computational and experimental turbine mass flow parameter (MFP) is show in Figures 7(a) and (b). Good MFP agreement was achieved with the only notable discrepancy occurring at the peak pressure ratio at 48krpm. The CFD also provides good correlation with the experimental efficiency characteristics over most of the operating range, as shown in Figures 8(a) and 8(b). However, at the high velocity ratio the CFD under predicts the experimentally measured values. At these operating points the experimental errors also increase due to the relative errors in mass flow and pressure measurements.
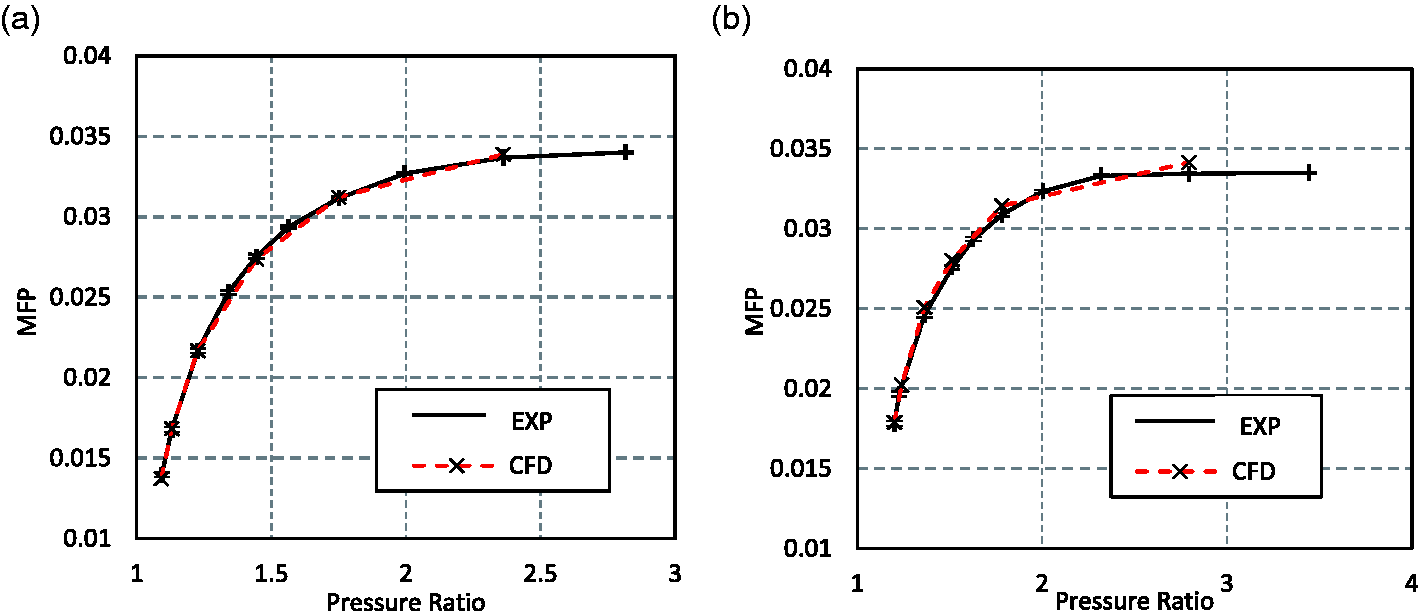
Steady MFP computational vs experimental: (a) 30 krpm and (b) 48 krpm.
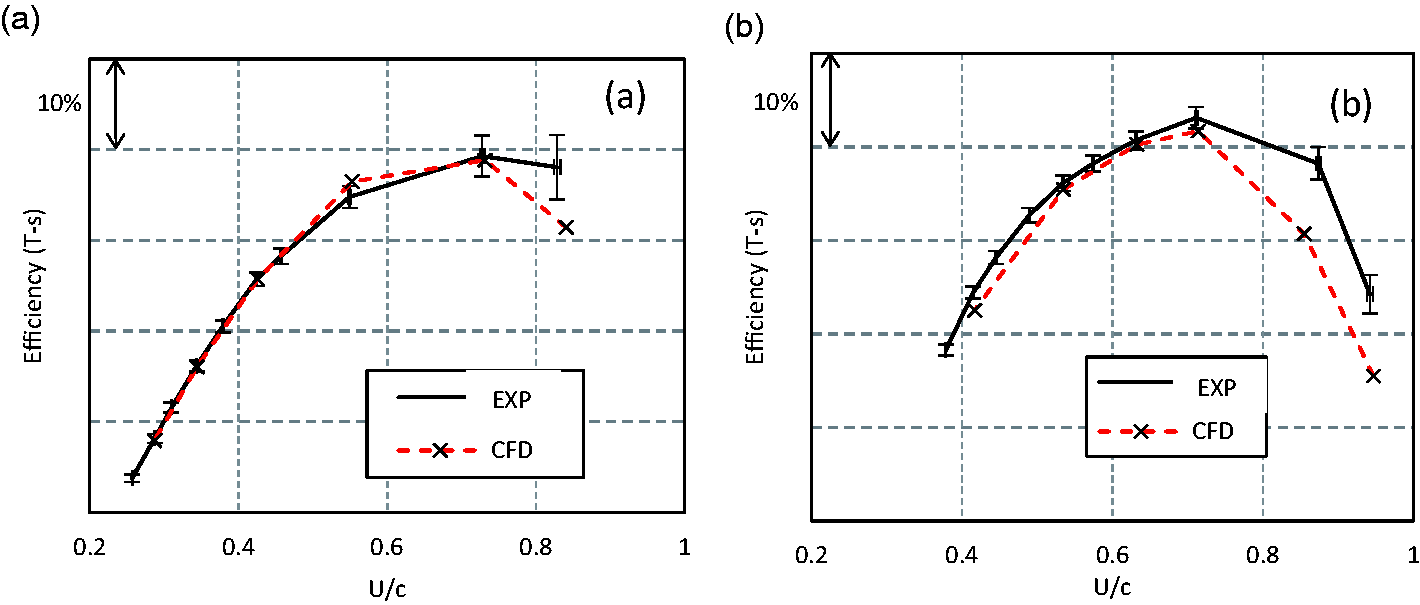
Steady efficiency computational vs experimental: (a) 30 krpm and (b) 48 krpm.
As stated by Simpson et al., 22 CFD calculations are accepted to be better at predicting trends rather than absolute values. As the performance trends shown here are well matched by the computational approach it can be concluded that the method is fit for purpose.
Unsteady experimental validation is included in Figure 9. The unsteady validation was also completed on the test rig at Imperial College London. Figure 9(a) compares the inlet isentropic work for both the experimental and computational cases at 20 Hz, 40 Hz and 60 Hz. The traces show that the inlet conditions are closely matched for both the experimental and computational cases. Figure 9(b) compares the cycle averaged rotor torque. While some discrepancies are clear, the computational values are within the experimental uncertainty and the general performance trend is predicted.
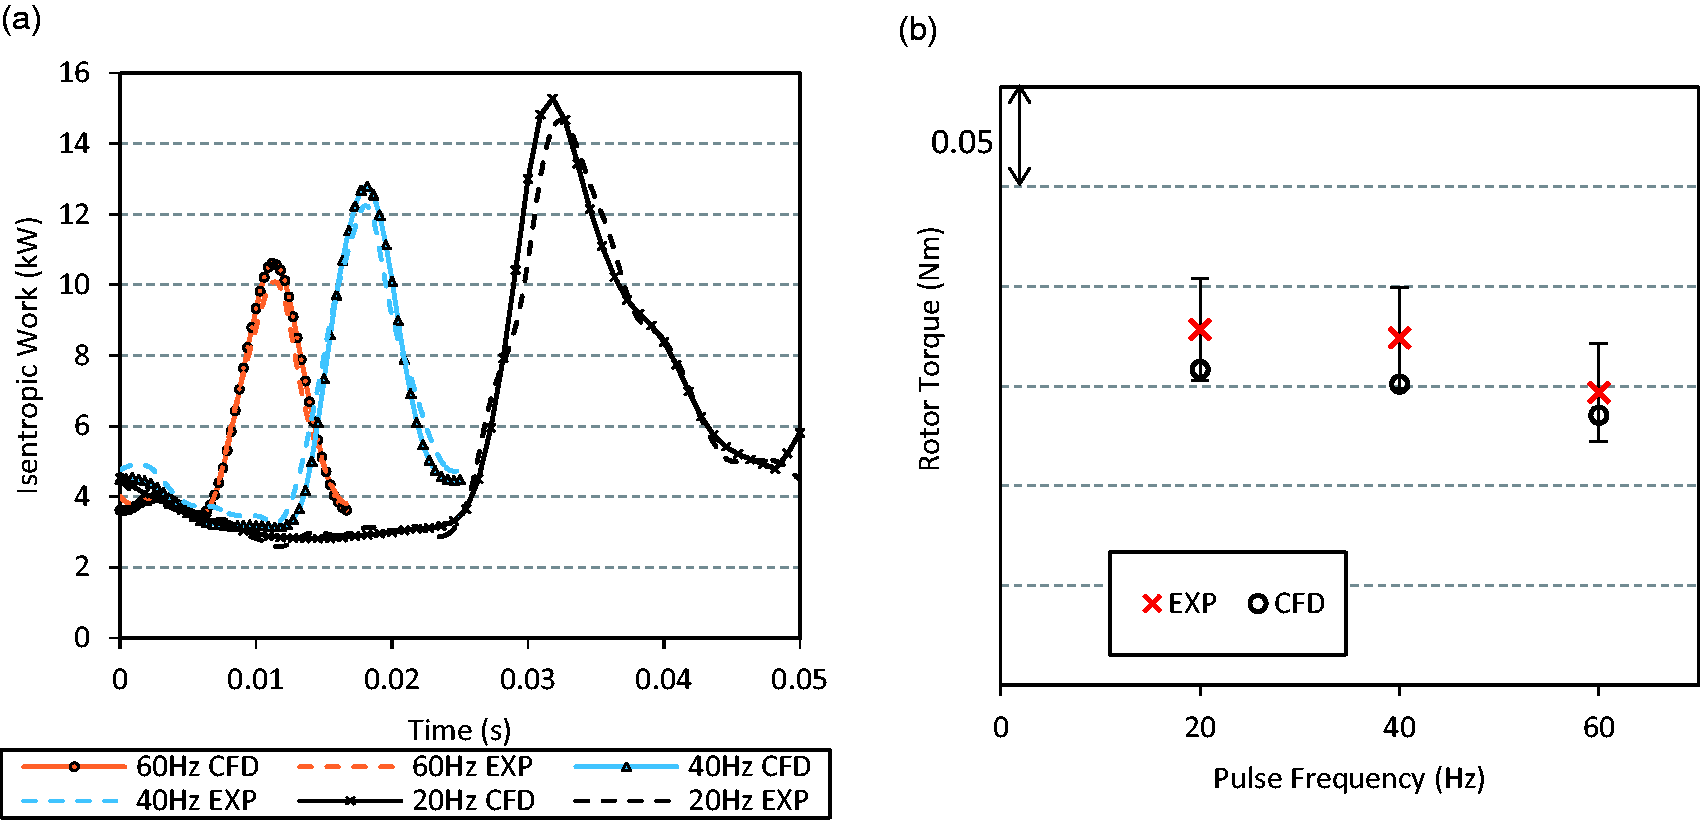
(a) Unsteady isentropic work pulse, experimental and CFD. (b) Unsteady cycle averaged torque measurements, experimental and CFD.
Results and discussion
Figure 10 compares the MFP for the four volutes tested at 40 Hz pulse frequency. To achieve equal MFP between the different AR volute designs, the AR = 0.5 volute required an A/r = 23.0 while the AR = 2 volute required an A/r = 24.2. This effect is the result of the larger AR designs achieving a lower MFP and a larger A/r being necessary to compensate for this, as discussed by Lee et al. 14 With the introduction of volute tilt, the MFP was not observed to change significantly and so A/r was kept constant between the radial and tilted designs. As shown in Figure 10, the four volute designs show very similar MFP values over the full hysteresis loop. The cycle averaged MFP difference between all volutes is within 0.5% ensuring aerodynamic similarity.
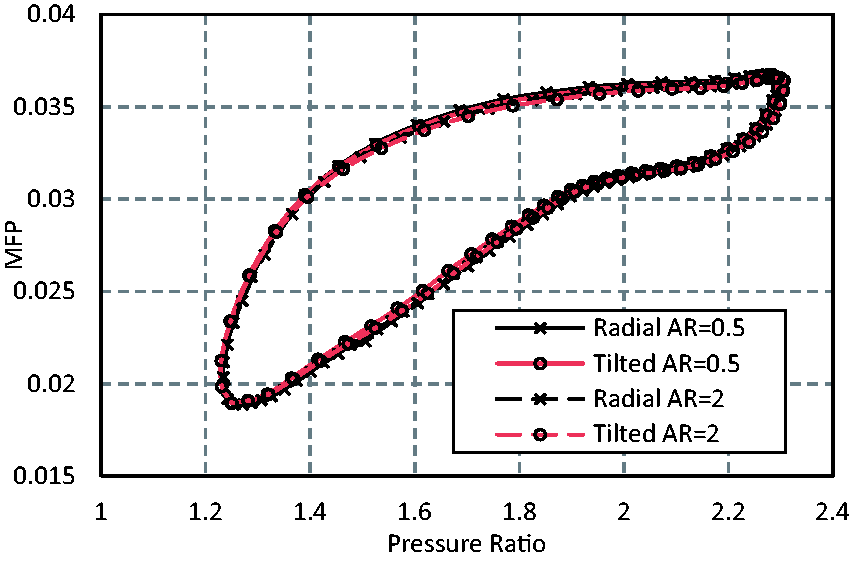
MFP hysteresis for radial and tilted housing at AR = 0.5 and AR = 2.
Figures 11 to 13 present the rotor efficiencies for each of the volute designs at 20 Hz, 40 Hz and 60 Hz respectively. The rotor efficiency is the efficiency of the rotating region only. This domain starts just ahead of the LE and ends just downstream of the TE. This reduced volume means that the hysteresis in the region is very small, removing the need for time shifting. In all cases the tilted volute results in an increase in efficiency. This improvement in efficiency increases with velocity ratio. Furthermore, with increasing volute aspect ratio, the rotor efficiency also increases. However, the impact of volute aspect ratio on rotor performance is less than that caused by volute tilt. The combination of both features leads to a significant increase in efficiency.
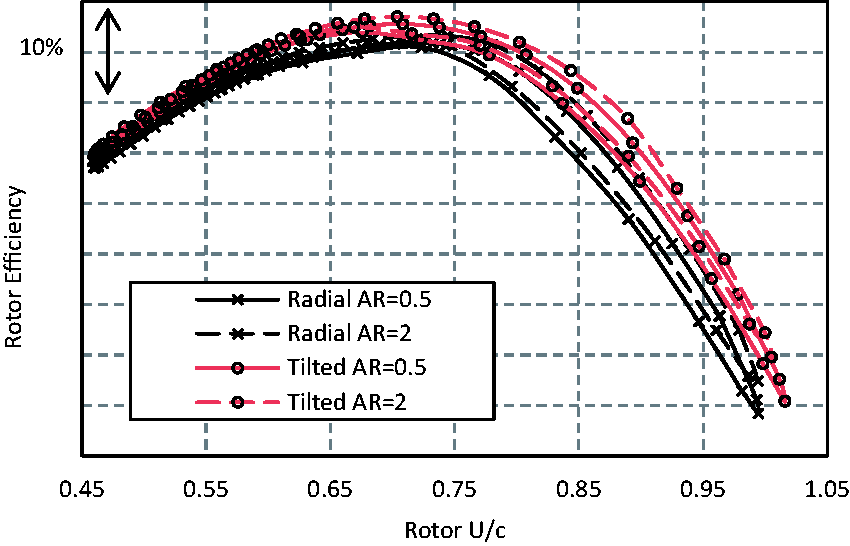
Rotor efficiency 20 Hz.
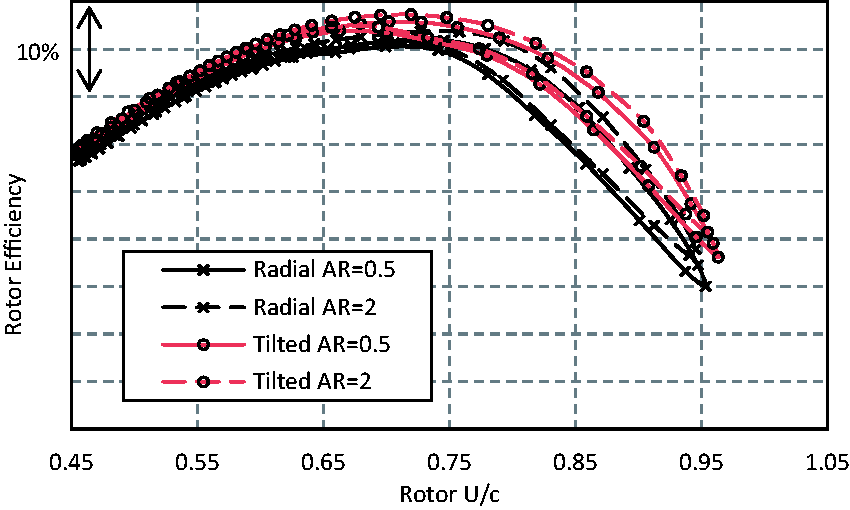
Rotor efficiency 40 Hz.
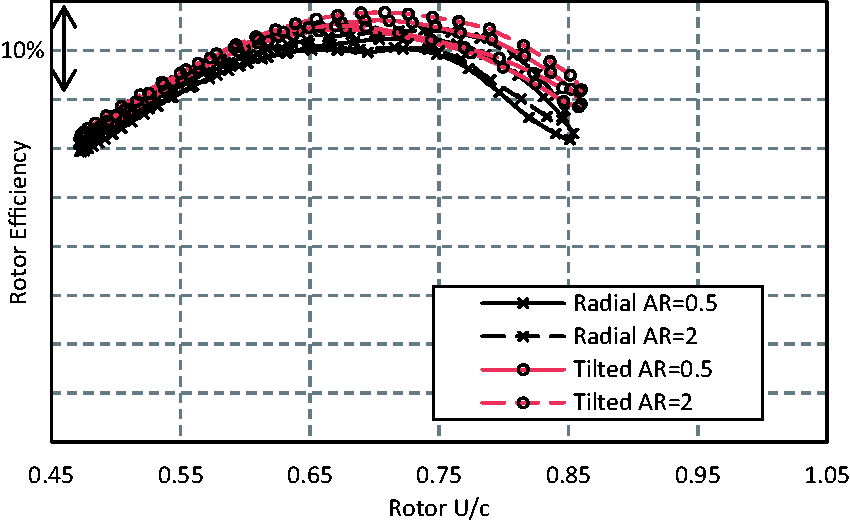
Rotor efficiency 60 Hz.
Table 1 compares the cycle averaged efficiencies for both the full stage and rotor only region for the investigated designs. The efficiency is normalised by the maximum achieved at each operating point which is with the AR = 2 tilted design in all cases. The maximum improvements in rotor and stage cycle averaged efficiency observed were 3.00% and 2.87% respectively occurring at the 20 Hz pulse frequency. The impact of frequency on this improvement was only small. The volute total pressure loss coefficient is also included in Table 1, these values are not normalised. This parameter shows that the radial volute with AR = 2 resulted in the lowest level of volute loss at all tested frequencies. Combining volute tilt and low aspect ratio resulted in the greatest volute loses observed.
Radial and tiled volutes, AR = 0.5 and AR = 2, relative performance.

The impact of volute tilt is not constant across aspect ratios, this effect is better shown in Table 2. This table compares the difference in absolute efficiency between the tilted and radial designs at both 0.5 and 2 AR. In all cases volute tilt resulted in efficiency improvements. This effect was particularly evident in the rotor region, as increased volute losses in the tilted cases negated some of the rotor improvement achieved. The efficiency improvements achieved, through the introduction of volute tilt, were larger in the AR = 0.5 volute design in both the rotor only region and over the full stage. However, the relative improvement was smaller in the full stage than that achieved in the rotor alone. This was caused by a greater increase in volute loss in the AR = 0.5 design when tilt was added, further negating some of the improvement obtained in the rotor region. The AR = 2 design experienced a smaller increase in volute loss when tilt was introduced.
Comparison of the impact of volute tilt on cycle averaged performance at aspect ratios of 0.5 and 2.
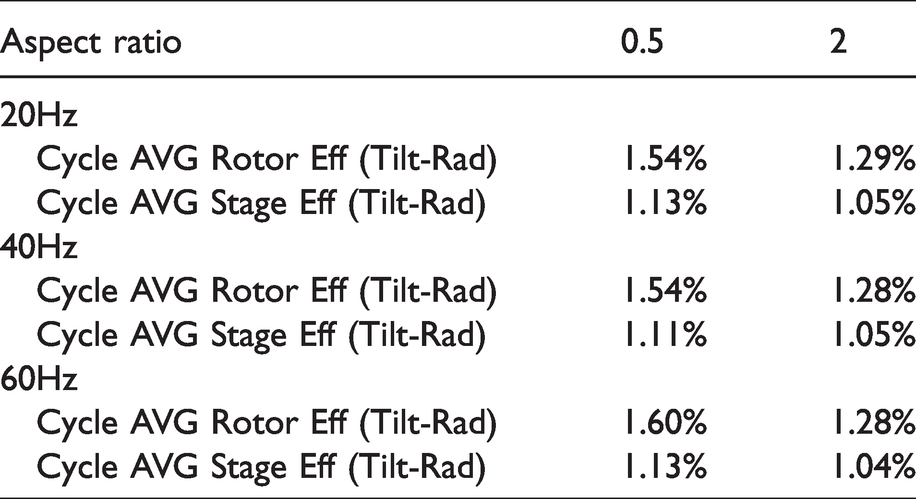
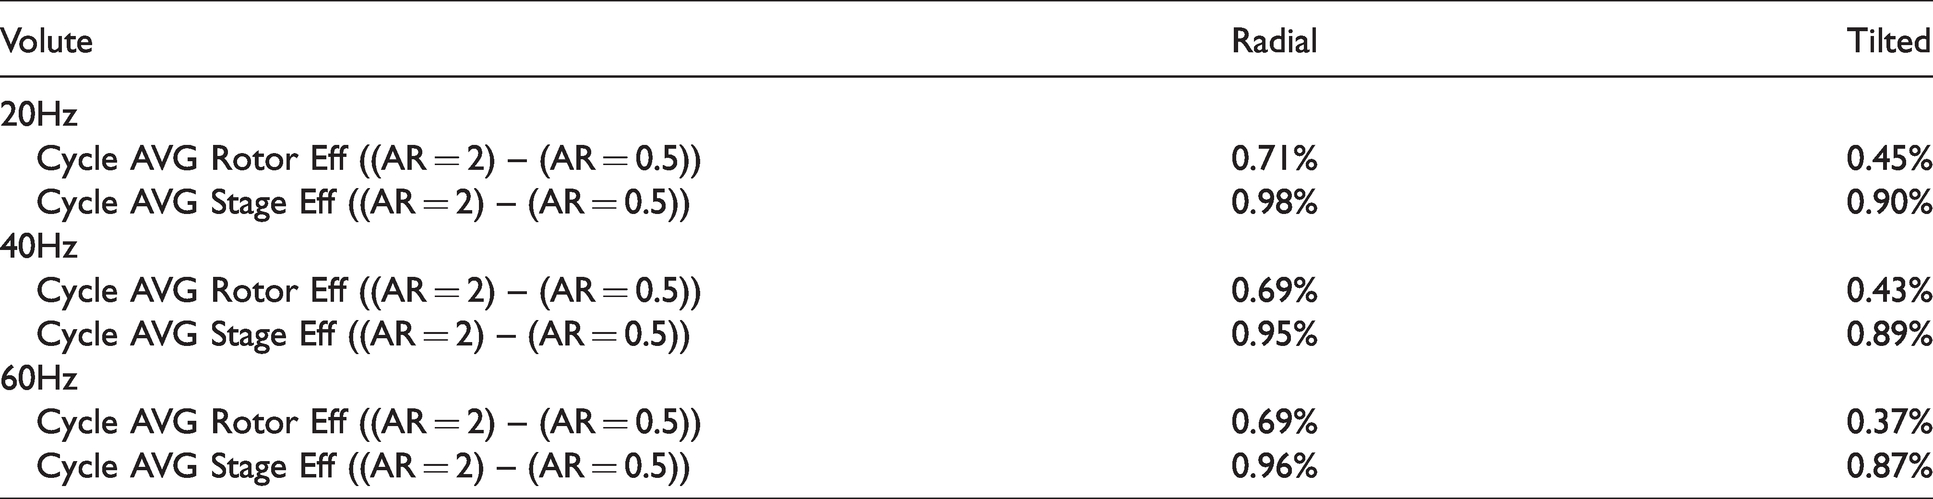
Table 3 compares the difference in absolute efficiency between the AR = 2 and AR = 0.5 designs for both radial and tilted configurations. In all cases increasing AR improves efficiency. Consistently, increasing volute AR resulted in greater efficiency improvements in the radial volute case. This effect was particularly evident in the rotor region only, where the improvement achieved in the tilted design by increasing AR remained below 0.5% at all tested frequencies. A comparison of efficiency improvements due to increasing AR shows that in the radial case the majority of the improvement came from the rotor only region. In the tilted design, a proportionally larger improvement was observed over the entire stage, indicating that when tilt is present, AR has a larger impact on volute loss.
Comparison of the impact of aspect ratio on cycle averaged performance in a radial and tilted volute.
Analysis of volute flow
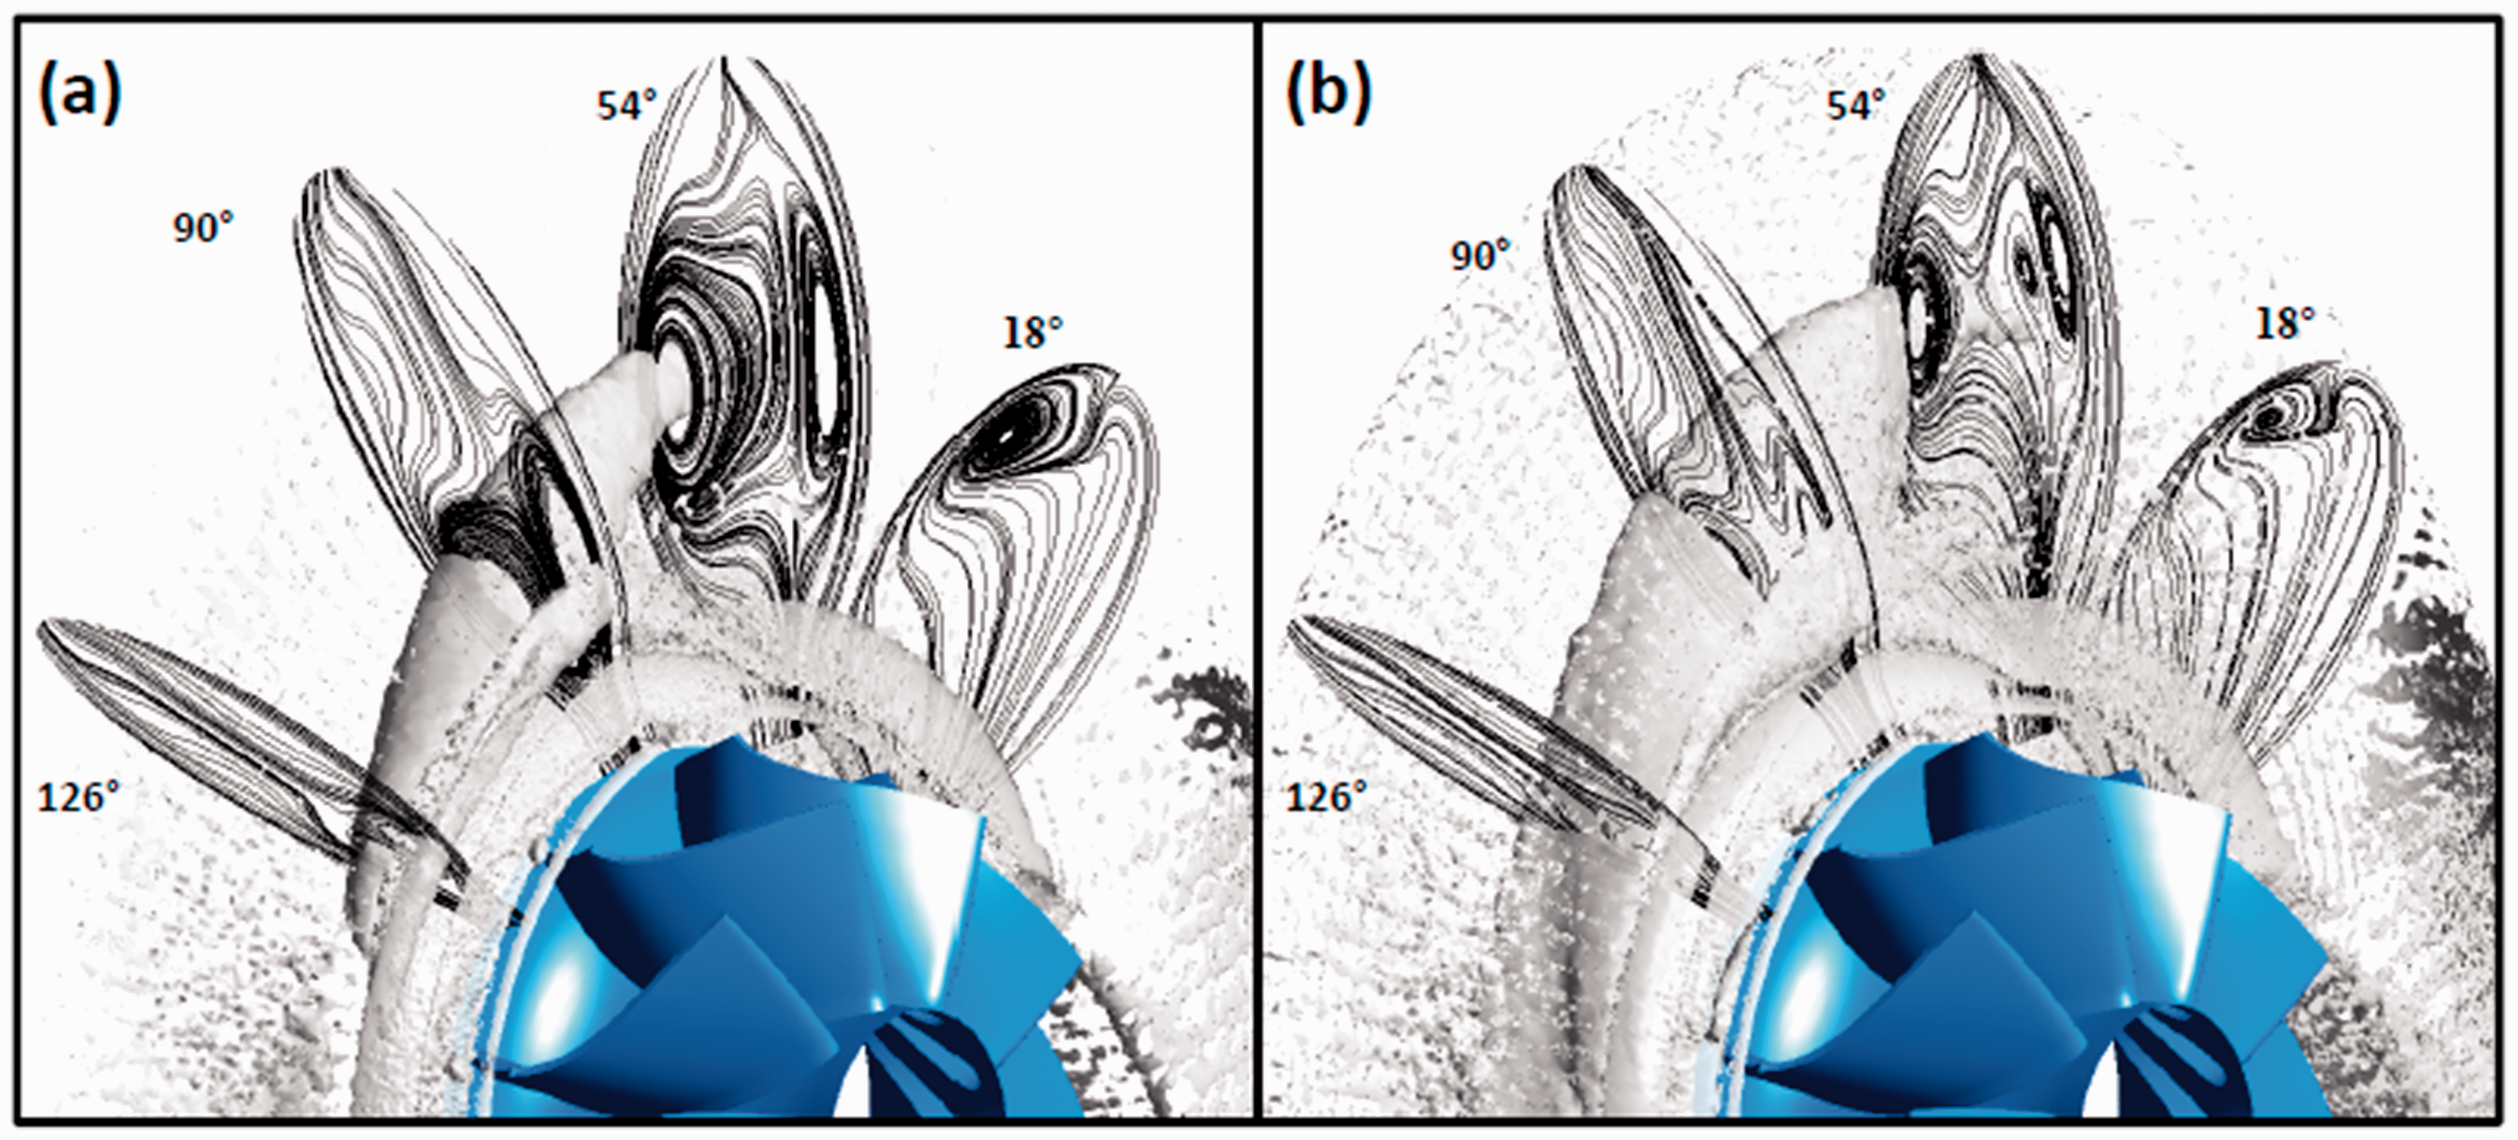
Figures 14 and 15 show the secondary flow development around the volute for all tested designs at both the minimum and maximum incidence running points respectively. The streamlines are over laid on contours of meridional velocity. Vortex development is evident in both the radial and tilted AR = 0.5 volute designs at both running points, but the vortices are significantly larger at the minimum incidence running point. The vortices do not exist beyond the 126° plane in either the radial or tilted configurations because the vortices reduce in size and move radially inwards as the cross-sectional area reduces. These flow features are the result of the Dean effect.23,24 The Dean effect explains that when flow in a pipe encounters a bend, the high inertia bulk flow will have a greater tendency to continue straight, while the lower inertial flow in the boundary layers will turn more readily. This imbalance results in the bulk passage flow travelling radially outwards and the boundary layers radially inwards, resulting in two counterrotating vortices. The Dean number, De, is given by -


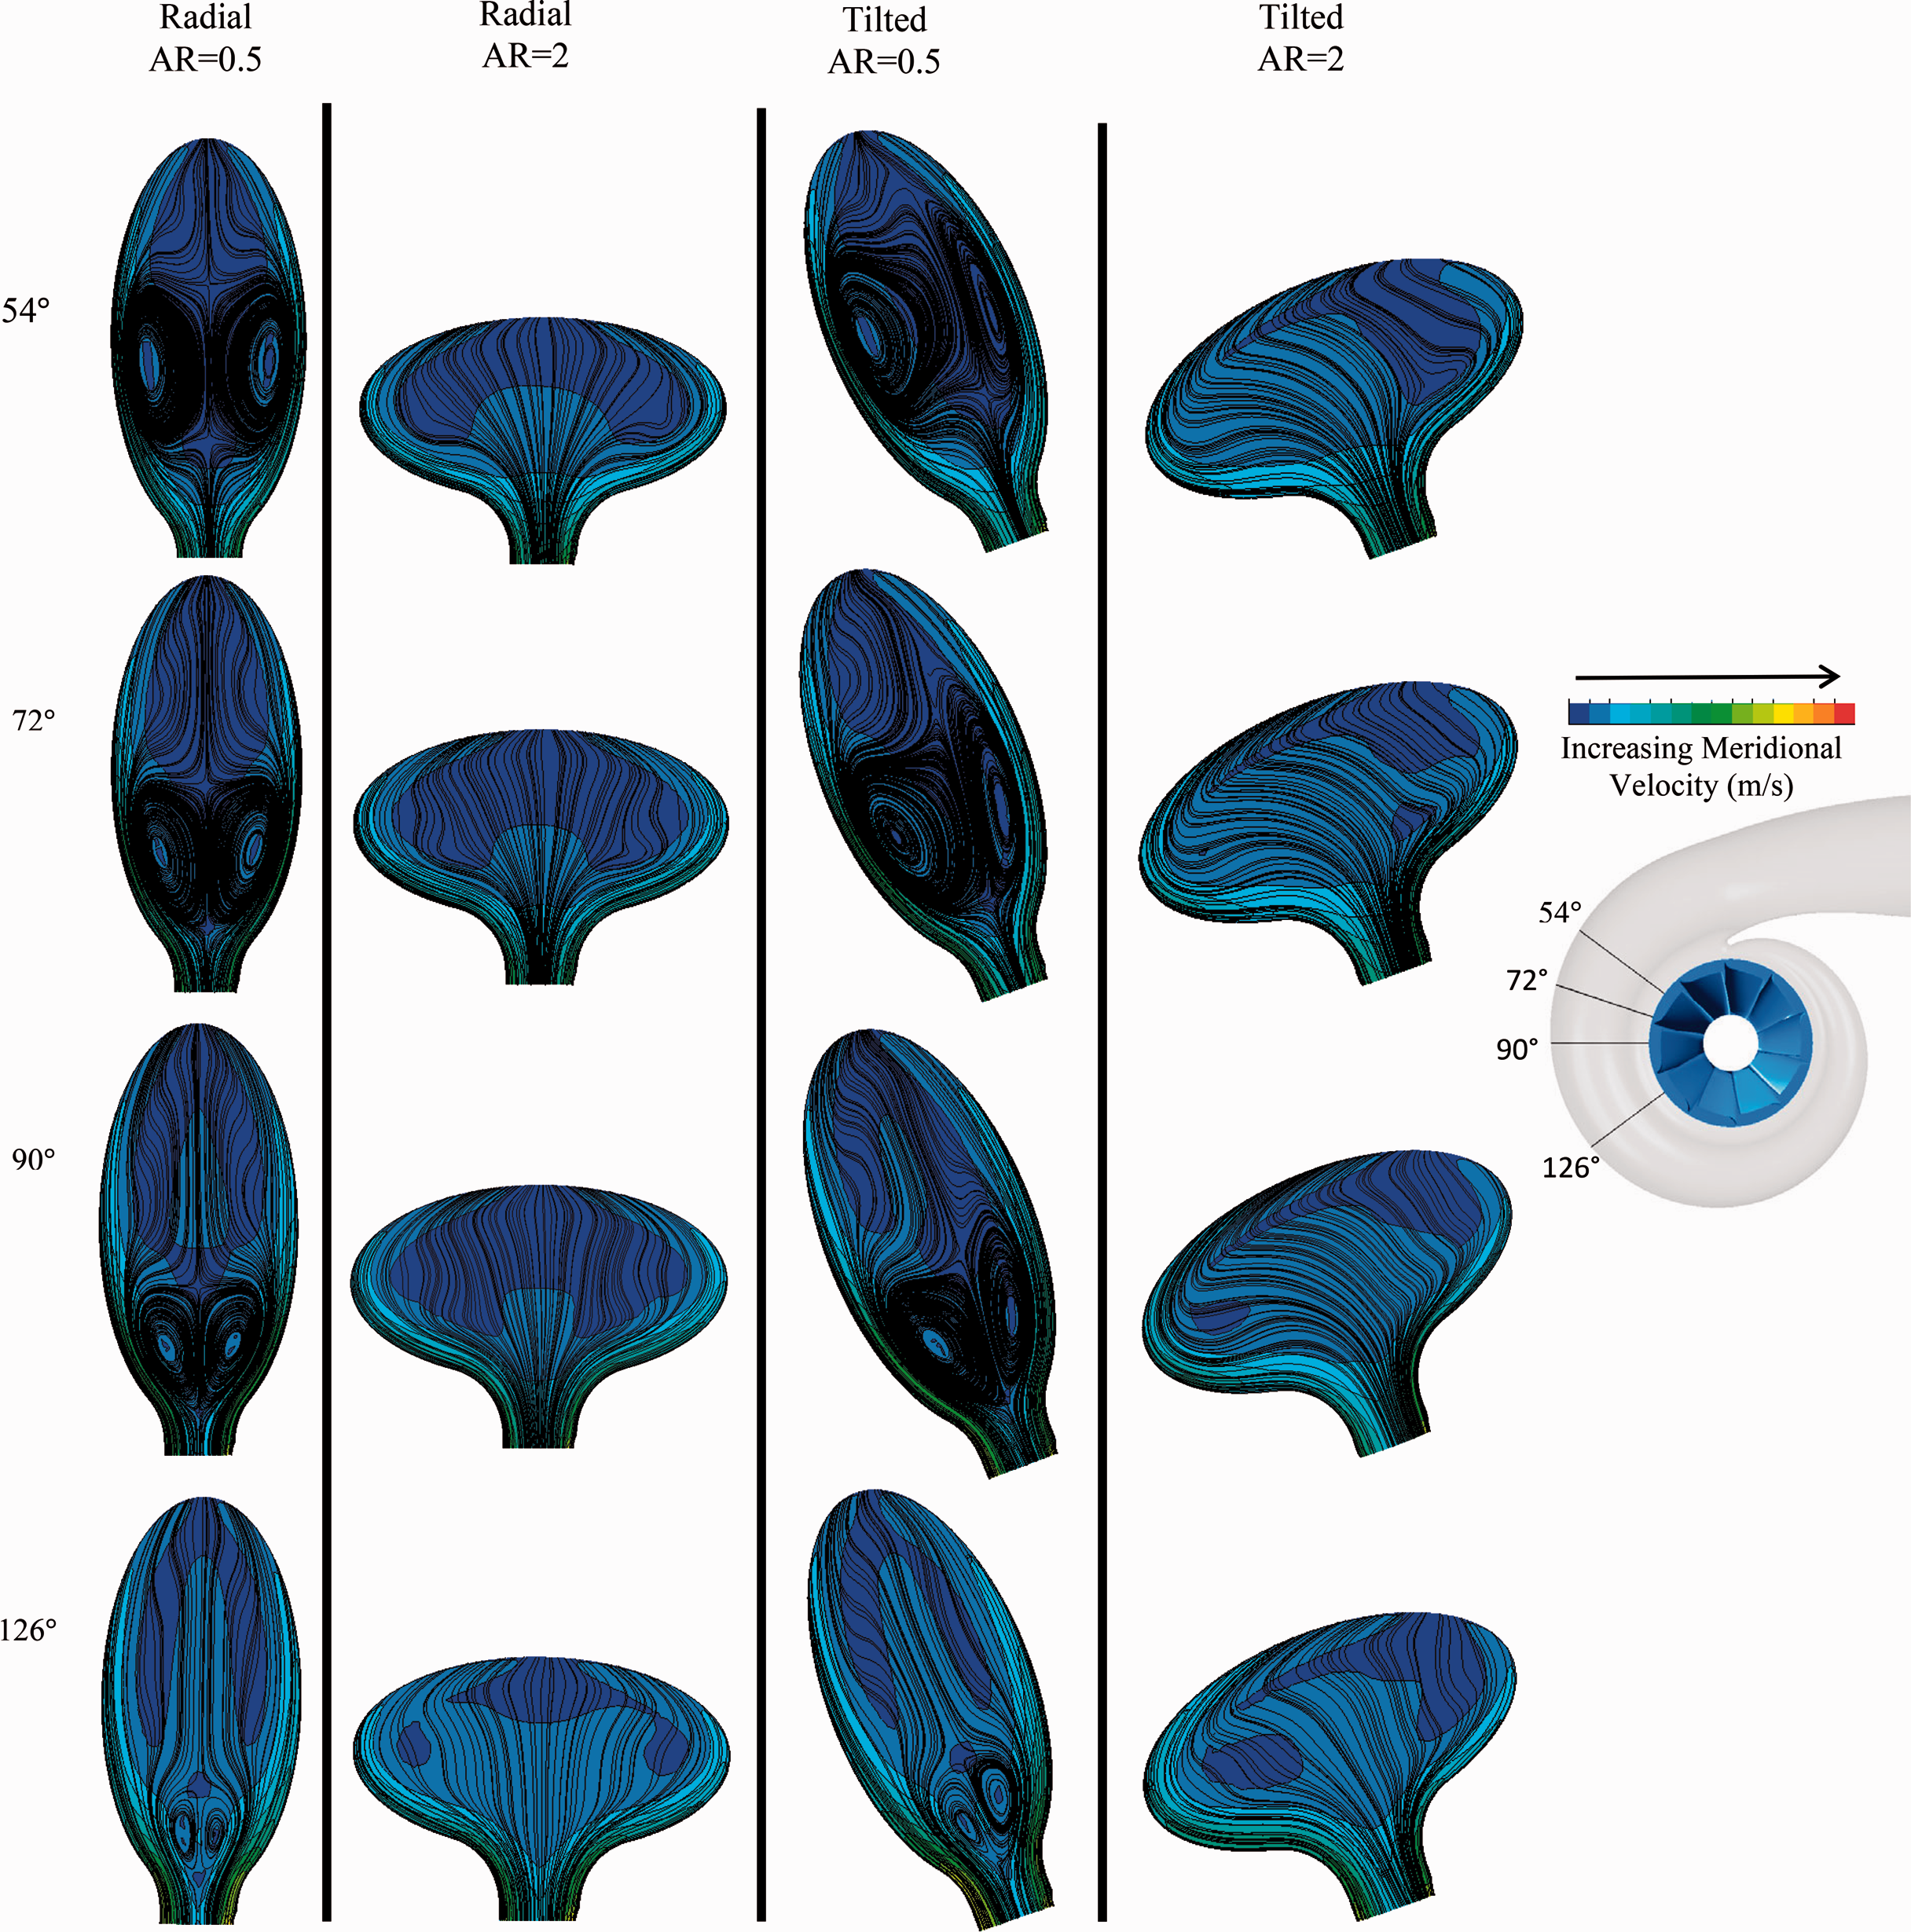
Volute secondary flows at low mass flow.
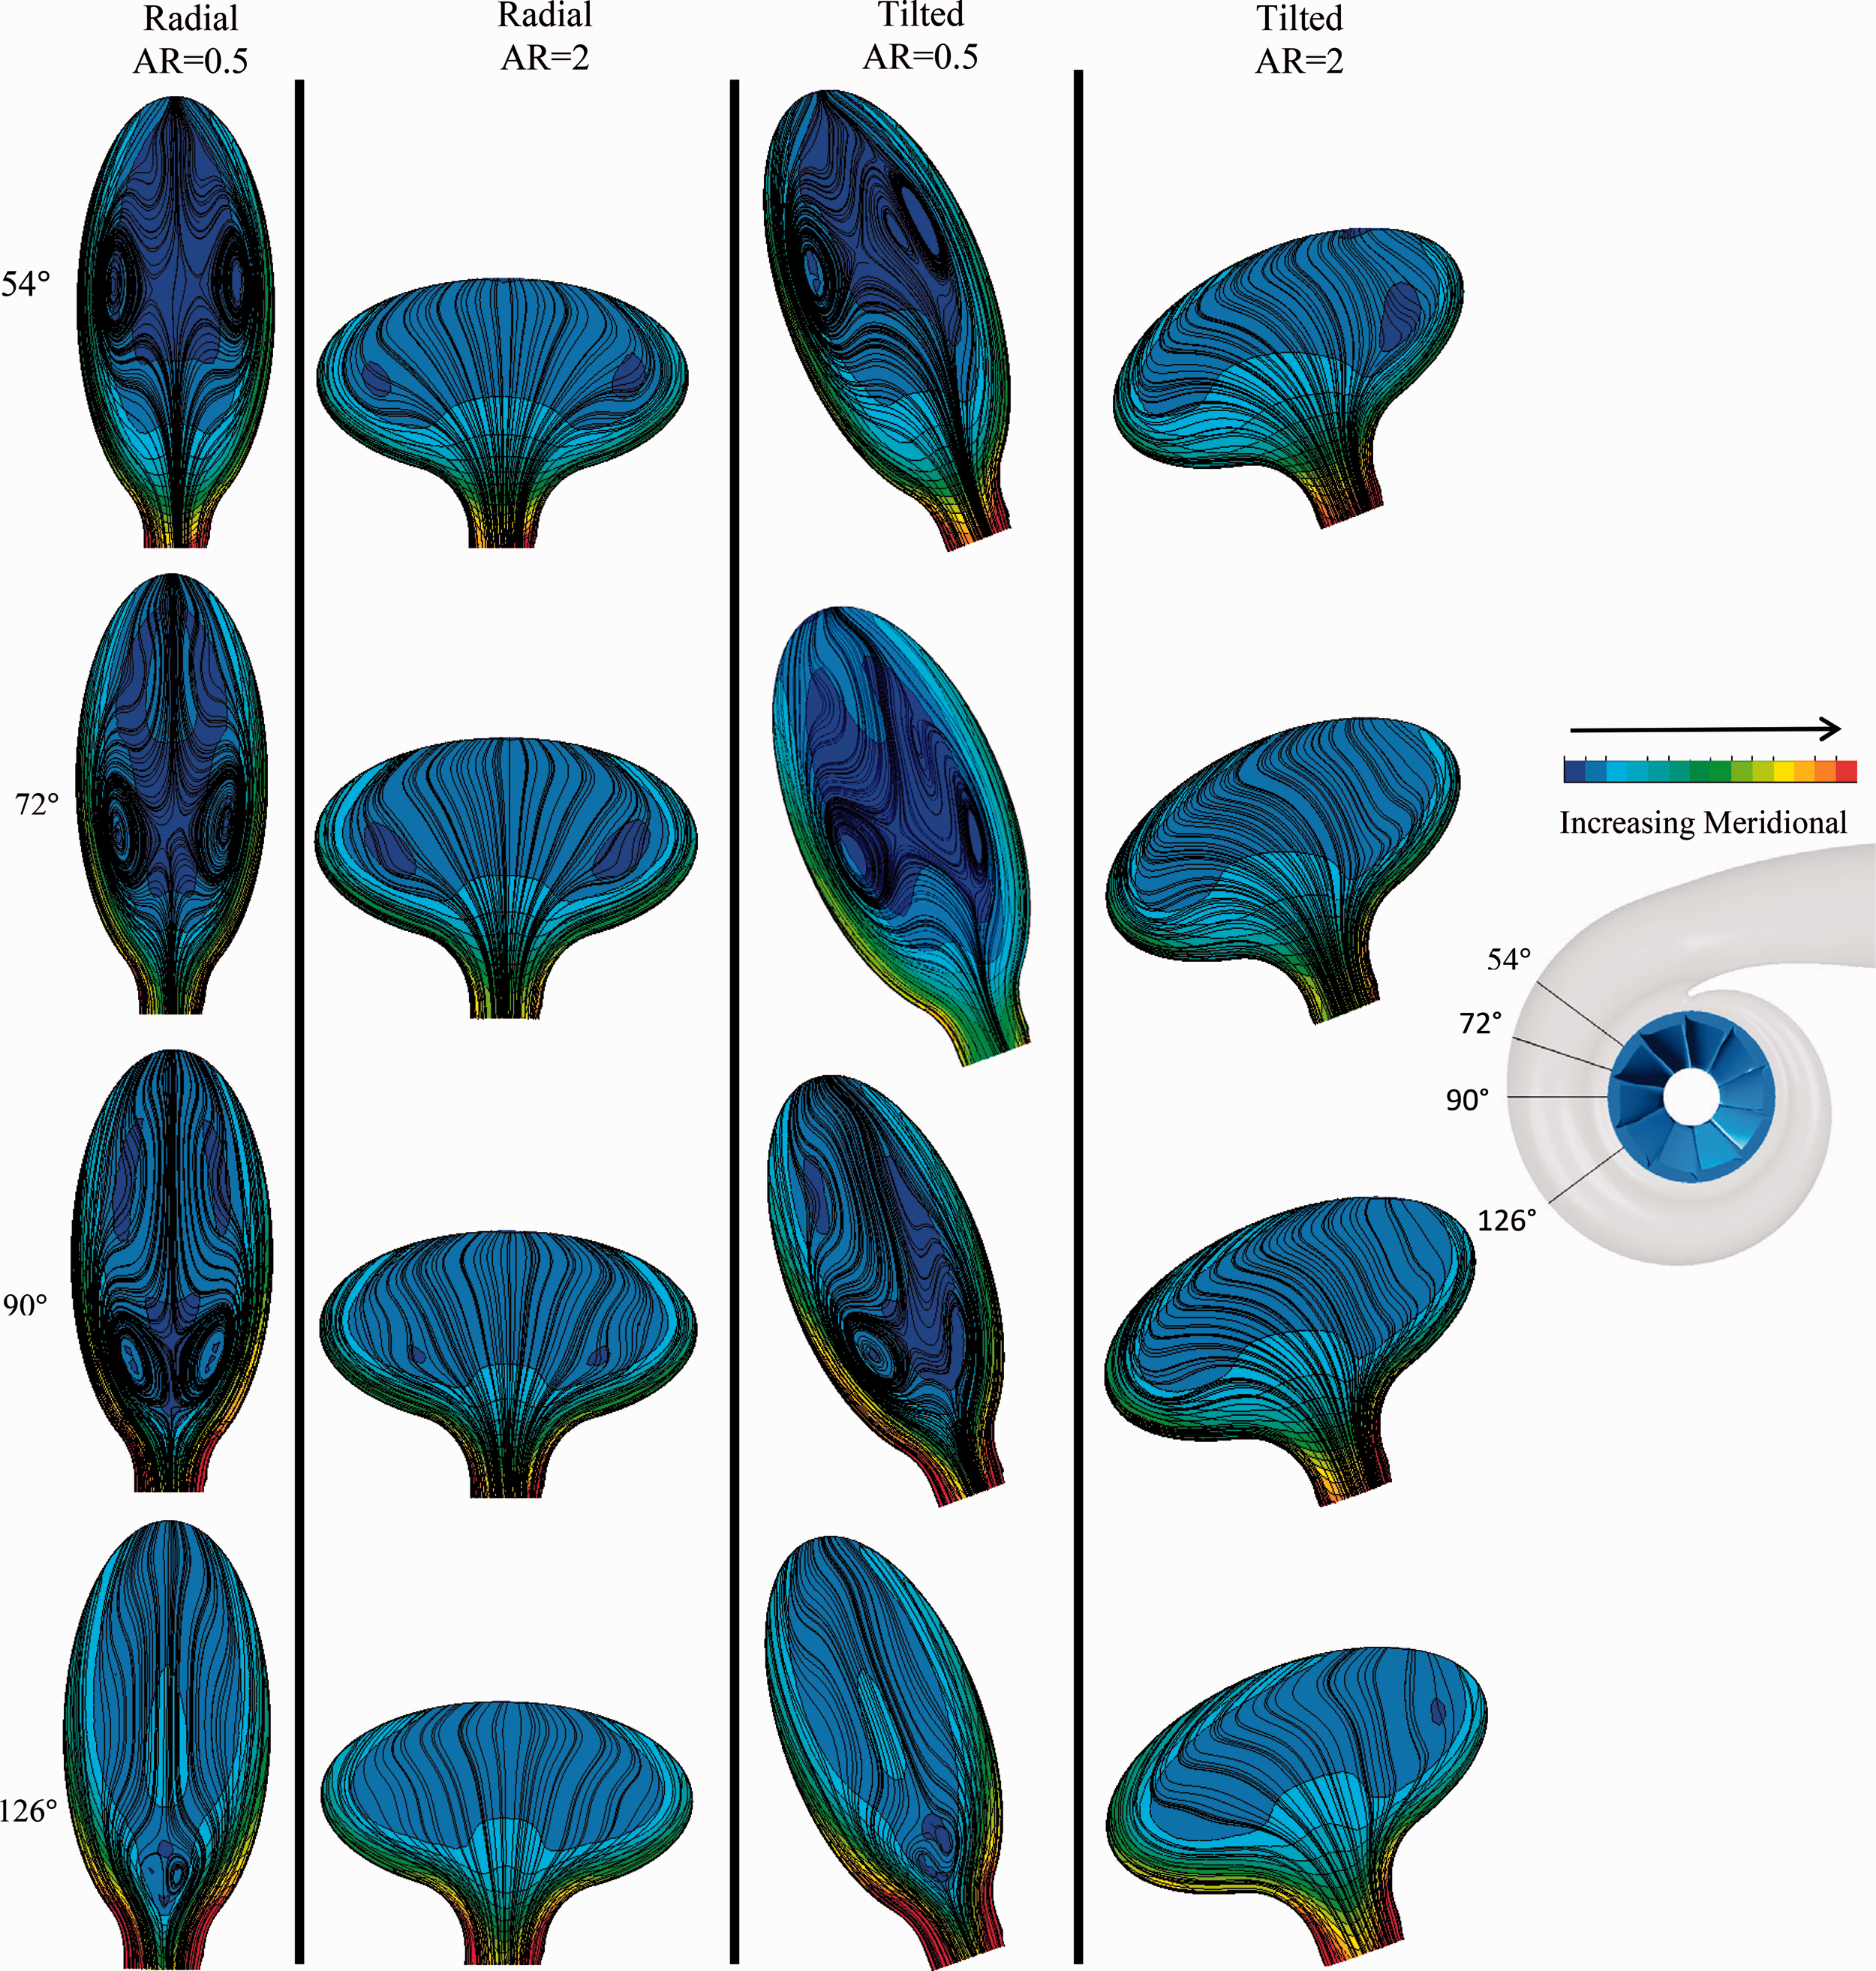
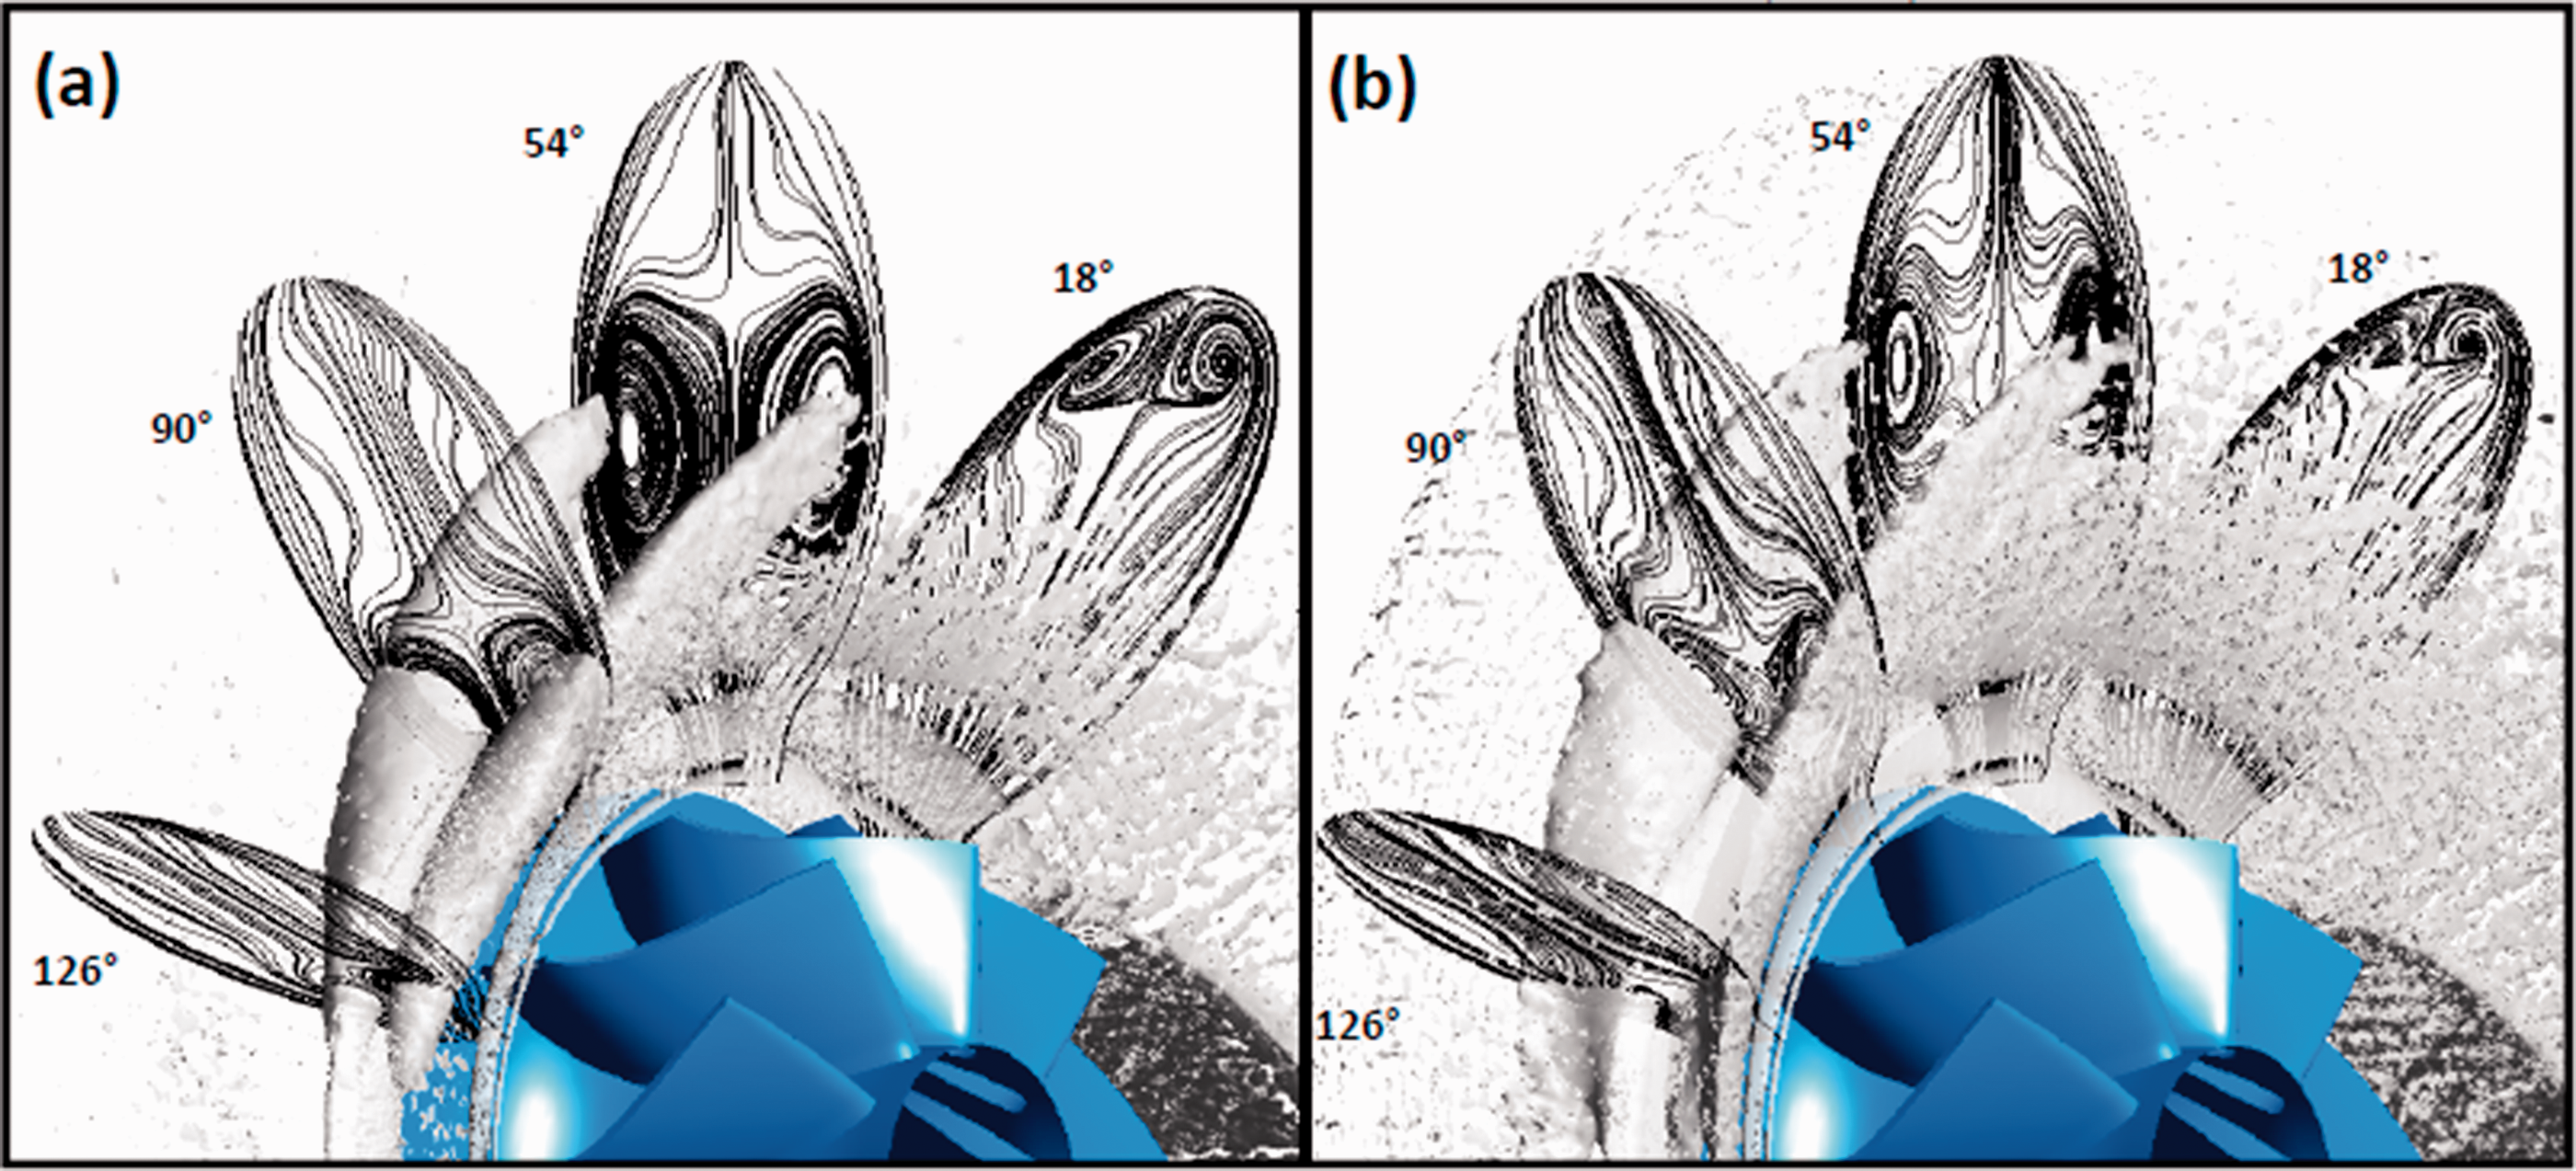
Volute secondary flows at high mass flow.
In addition to the Dean effect, the flow in the volute is further complicated by the fact that flow exits into the rotor driven by the volute geometry and the pressure gradient acting into the rotor. The pressure gradient inhibits the outward flow in the centre of the volute, reducing secondary flows particularly at high operating pressure ratios. However, following a similar logic as the Dean effect, the pressure gradient acting into the rotor does not have a uniform impact. The lower inertia boundary layer flows will turn radially inward more readily under this pressure gradient. The result is that the wall flows see a greater radial acceleration than the bulk flow at all operating conditions, significantly impacting the spanwise distribution of rotor inlet flow angle.
As the introduction of volute tilt removes the symmetry of the volute, the vortices produced also become asymmetric. In the tilted design the inner vortex (hub side) is significantly larger than the one occurring on the outer (shroud side). At the minimum incidence running point this results in the inner vortex encompassing roughly 75% of the volute passage. At the maximum incidence running point, the development of a third vortex is evident in the 54° and 72° planes. This vortex rotates in the counterclockwise direction, opposite to the vortex forming on the outer wall of the volute. Development of a third vortex was not observed in any of the radial designs.
The observed differences in the vortex development in the radial and tilted AR = 0.5 volute is the result of the misalignment of the factors that cause the vortex development. In the radial case the Dean effect drives the bulk flow radially outwards and the wall flows follow symmetrical paths inwards. When tilt is introduced, the Dean effect still results in the bulk flow moving radially outwards, but as the volute is no longer radially symmetric, the two volute segments are no longer identical and the wall flows encounter different curvatures. This affects how the vortices develop, with only the hub side vortex initially existing (see Figure 16). The end result is a greater flow acceleration on the inner wall (hub side) in the tilted design and a larger vortex.
Lambda 2 criterion in the volute for the titled volute with AR = 0.5. (a) Minimum incidence. (b) Maximum incidence (40 Hz).
Both the radial and tilted volute designs with AR = 2 show no signs of vortex development at any of the presented positions around the volute at either operating point. This reduction in secondary flow results in the lower volute total pressure losses reported in Table 1. Despite the lack of secondary flows, a significant range of meridional velocity over the plane was still observed, showing the development of the Dean type effect even though the flow does not reverse. The lack of flow reversal in this instance can be attributed to number of factors including a reduction in the volute radius of curvature, a wider volute passage reducing the velocity gradient and also a change in volute wall curvature.
Figures 16 and 17 show the development of the vortices around the volute using the lambda 2 criterion. At the minimum incidence running point, the vortex development is much more distinct in both designs. While the radial design shows the two vortices have a similar strength, in the tilted case the hub side vortex is much stronger and more defined than the shroud side. In all cases the progression of the vortex core towards the rotor inlet is evident and the vortices disappear just beyond the 126° plane. In the tilted volute case the initial development at the 18° plane shows only one vortex towards the hub side of the volute. As explained previously, this is due to the lack of radial symmetry in the tilted design while the Dean effect acts radially. This creates a region on the hub side of the volute where the vortex forms. At minimum incidence, by the 54° plane two clear vortices are evident. However, at maximum incidence, where the two primary vortices are much smaller, an additional vortex can be observed resulting in two counter rotating vortices forming on the shroud side. The change in vortex structure between points within the pulse is due to an increase in inlet pressure driving a greater mass flow into the wheel. This driving pressure ratio inhibits flow reversal reducing the vortex size.
Lambda 2 criterion in the volute for the radial volute with AR = 0.5. (a) Minimum incidence. (b) Maximum incidence (40 Hz).
Figure 18 presents the development of the secondary flow vortices in the tilted volute with AR = 0.5 through the pulse. In both designs the vortex size decreases from minimum incidence (1) during the filling process (2) as the volute pressure increases reducing flow reversal. The development of a third vortex in the tilted volute is first observed at the maximum incidence running point. This vortex still exists at the emptying point (4). Comparing the filling cases (2) and emptying cases (4) for both designs highlights the unsteady operation of the volute since the inlet mass flow is the same and yet the vortices present in case (2) encompass a much larger proportion of the passage area. At point 4 the volute vortices are at their minimum size.
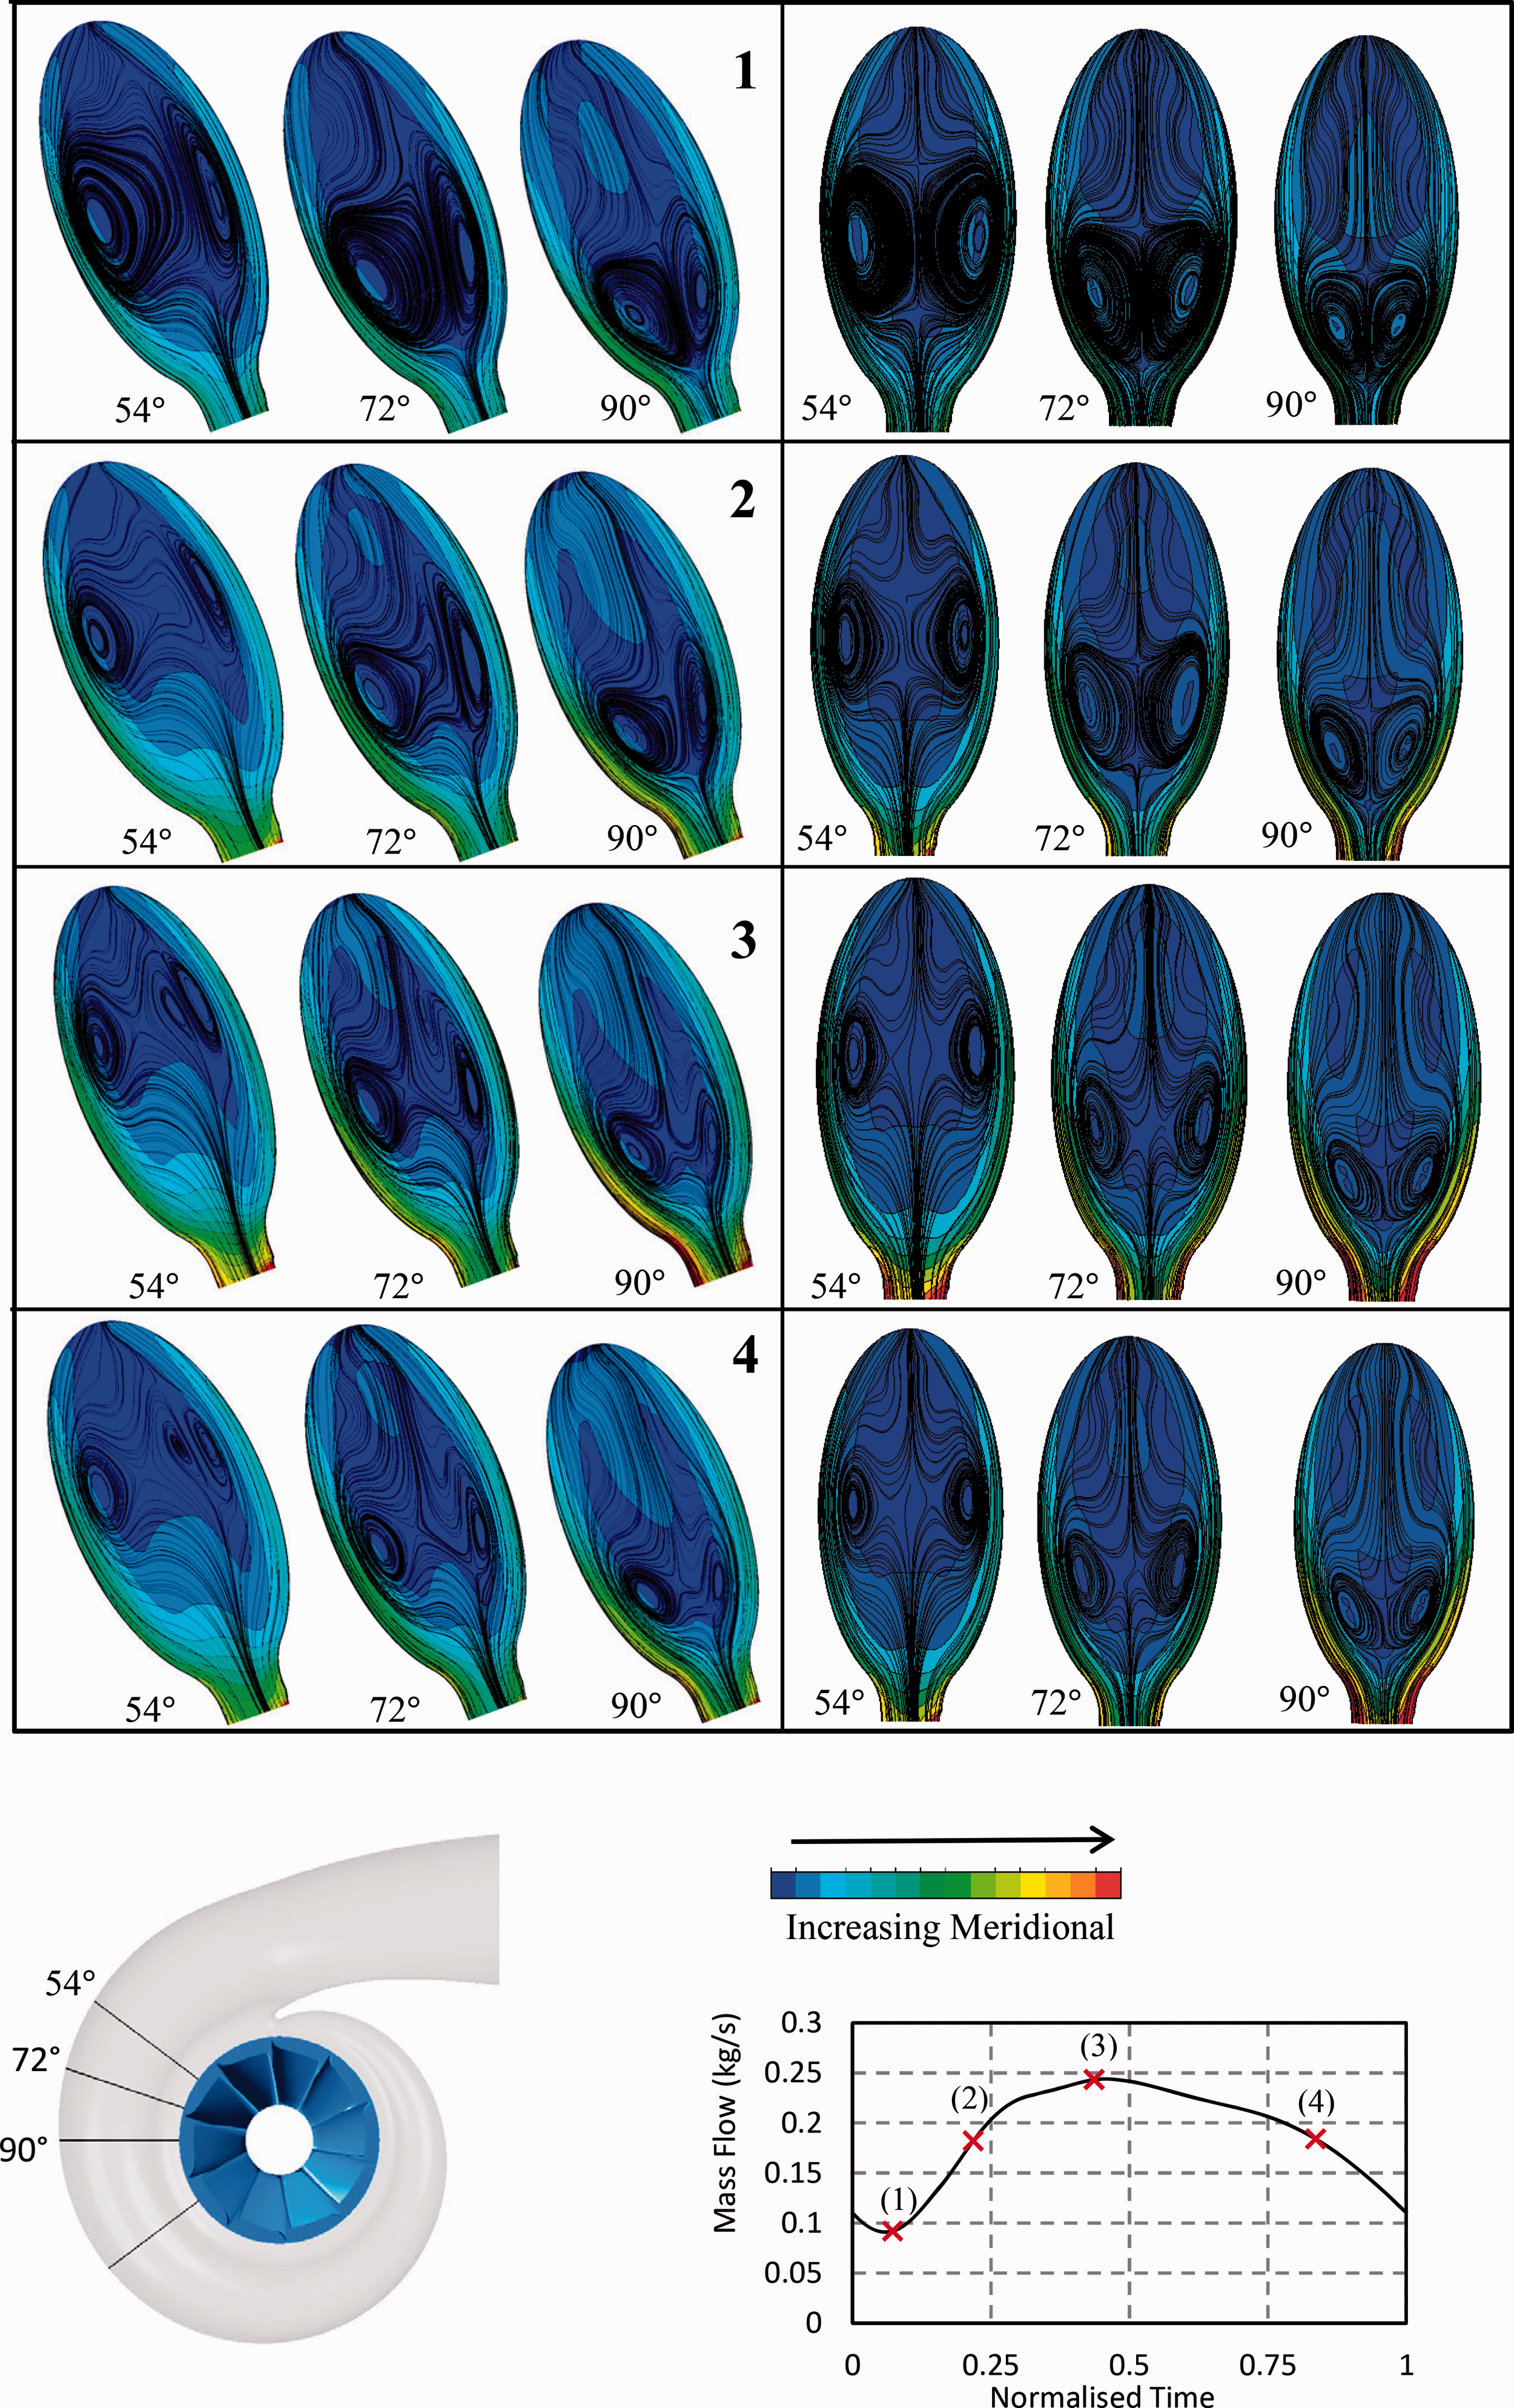
Vortex development in AR = 0.5 radial and tilted volutes through pulse period (40 Hz).
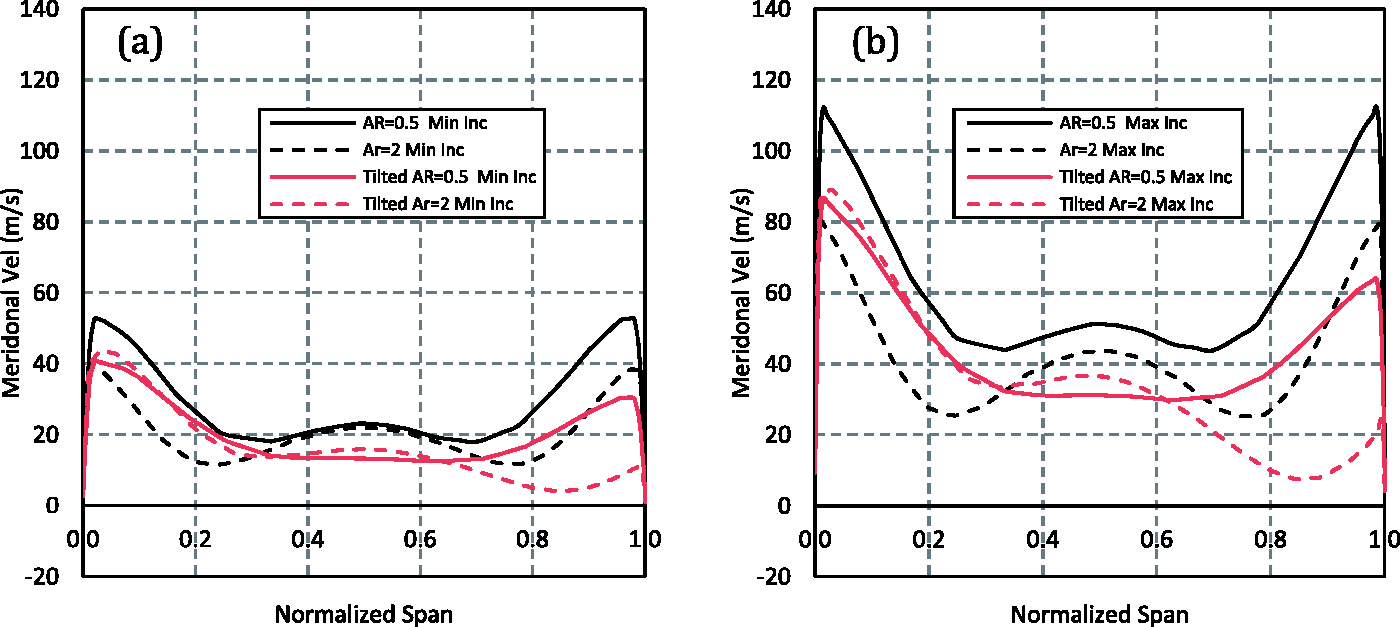
Figures 19 to 21 show the meridional velocities at the volute passage centre at specific locations around the volute for all tested volutes at minimum and maximum incidence. In the tilted volute case, the cross sectional plane is tilted to 20°; the same angle as the volute tilt to produce a plot normal to the meridional direction. The normalized span is defined as being from the hub side to the shroud side.
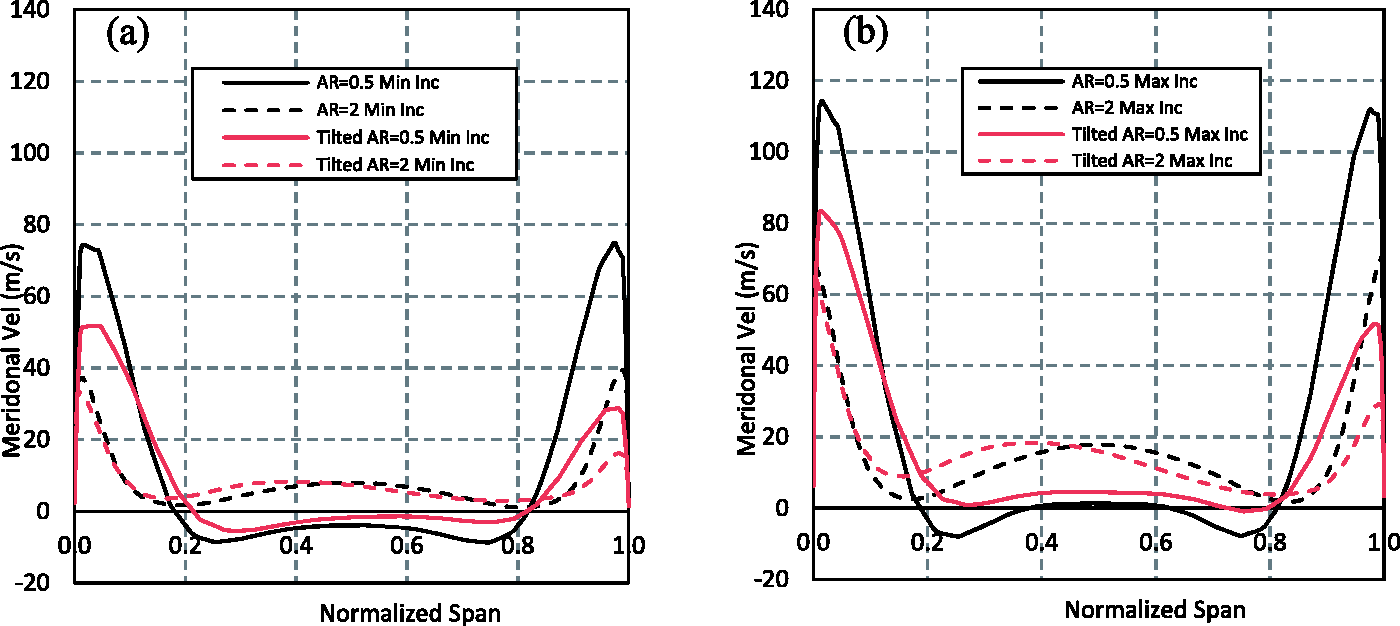
Meridional velocity across volute passage centre 54°. (a) Minimum incidence and (b) maximum incidence.
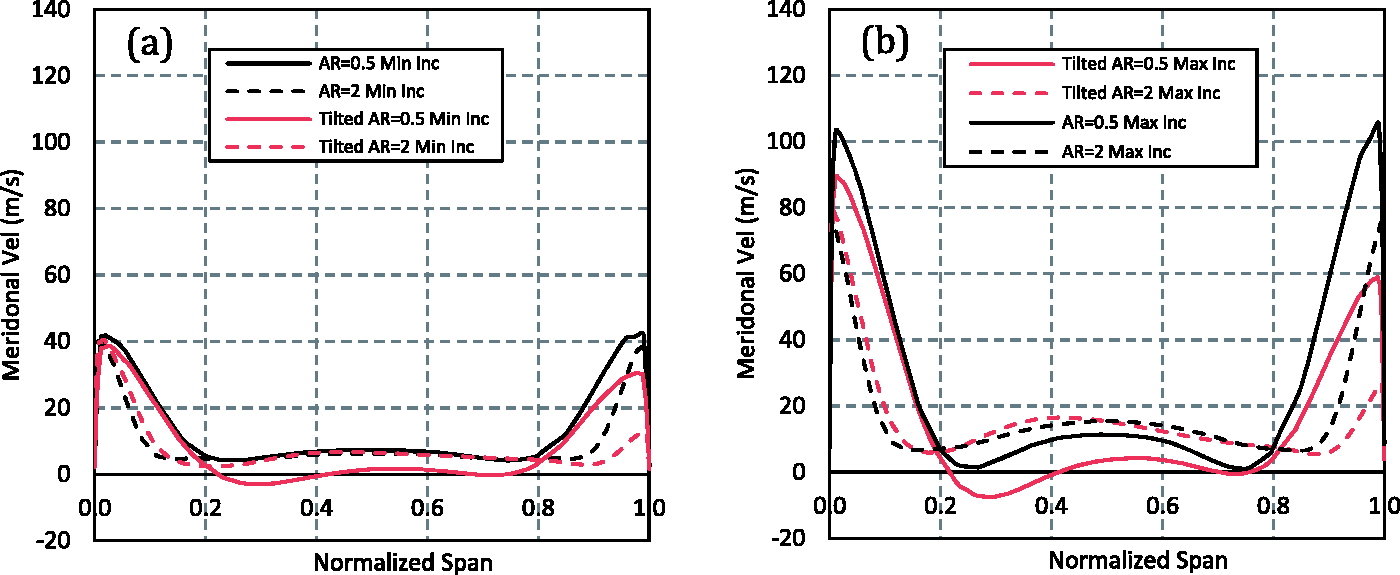
Meridional velocity across volute passage centre 90°. (a) Minimum incidence and (b) maximum incidence.

Meridional velocity across volute passage centre 270°. (a) Minimum incidence and (b) maximum incidence.
In all cases high meridional velocities can be observed towards the volute walls due to the Dean effect. The range in observed meridional velocity is greater at the maximum incidence running point in all instances. In the tilted case the results show an asymmetrical distribution of meridional velocity with higher velocities existing towards the hub side. The span-wise variation of velocity is greater in the AR = 0.5 case in both the radial and tilted designs. The higher wall velocities and the fact that the volute walls align better with the meridional direction, in the AR = 0.5 volutes, are believed to be the cause of the increased swallowing capacity of the AR = 0.5 volute. Volute tilt generates an asymmetry in the meridional velocity distribution for both aspect ratios. At the 54° and 90° planes, the hub side velocity peak remains constant for the tilted and radial volutes with AR = 2 while at the shroud side a significant reduction in the peak for the tilted design is evident. The AR = 0.5 volute shows a reduction in peak meridional velocity at both sides of the volute with a more severe drop on the shroud side. With increasing azimuth angle, the asymmetry of the meridional velocity in the tilted case tends to increase. This is particularly evident at the 270° position in the AR = 2 case where the meridional velocity towards the shroud is very low and the span-wise distribution experienced is more asymmetric than at other positions.
Negative meridional velocities (and hence reversed flow) only occur up to the 90° plane. Furthermore, it can be observed that the negative velocity in the tilted cases tends to start at a later circumferential position and ceases later around the volute. This indicates that the volute tilt delays the development of the vortices slightly and they move radial inwards at later positions. The removal of reversed flow at larger azimuth angles can be explained by the reduction in cross sectional area limiting the possibility for flow to reverse.
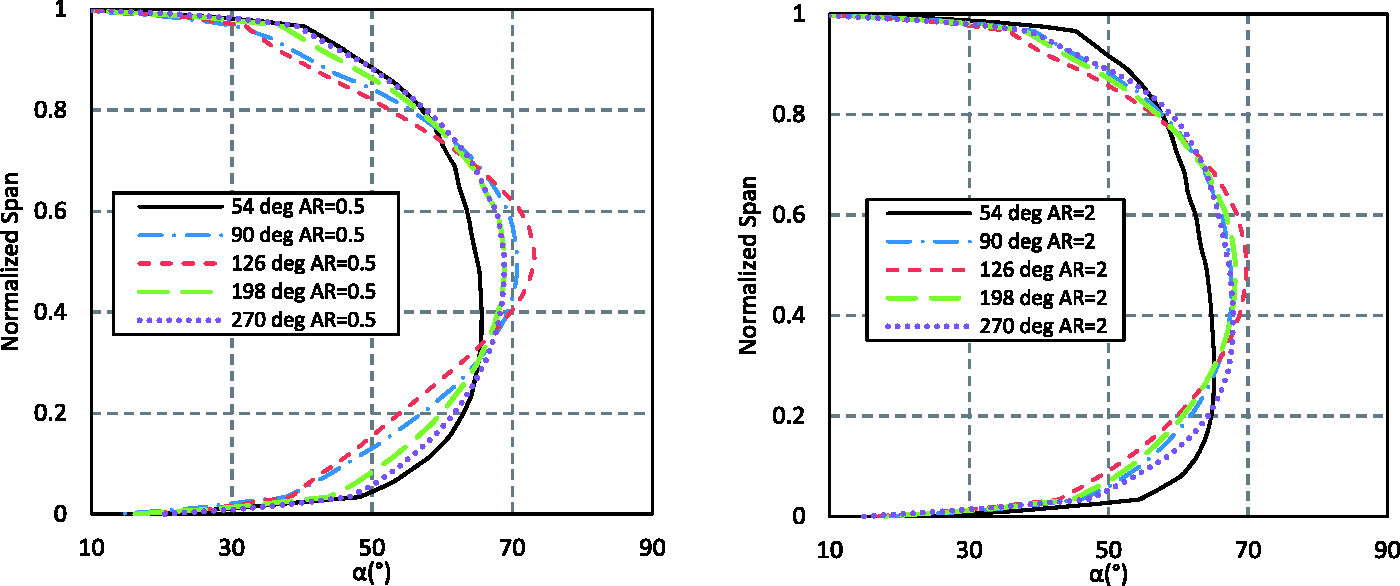
Figures 22 to 25 present the resulting volute exit absolute flow angles around the volute circumference in both the radial and tilted volutes with AR = 0.5 and 2. The circumferential positions are selected to lie equidistant from either blade LE to reduce any upstream effect.

Volute exit absolute flow angle for the radial volute at minimum incidence. Left AR = 0.5. Right AR = 2.
Volute exit absolute flow angle for the tilted volute at minimum incidence. Left AR = 0.5. Right AR = 2.
Volute exit absolute flow angle for the radial volute at maximum incidence. Left AR = 0.5. Right AR = 2.
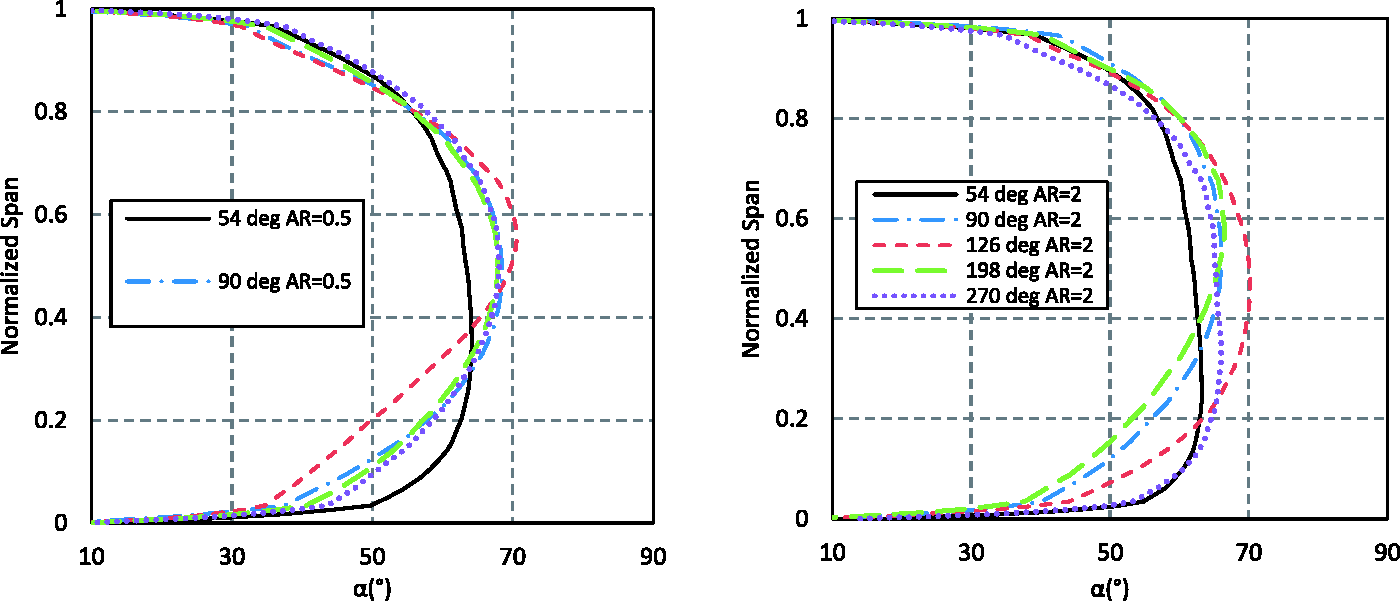
Volute exit absolute flow angle for the tilted volute at maximum incidence. Left AR = 0.5. Right AR = 2.
Comparison of the radial and tilted, AR = 0.5 volutes at the minimum incidence running point (Figures 26 and 27), shows a slight reduction in the span-wise variation in the tilted case compared with the radial case. The impact of the asymmetry is not constant around the circumference with the span-wise shift in absolute flow angle towards greater spans most distinct at the 126° position where the distribution in the tilted case is centered around 0.6 span. Beyond this point the shift reduces to produce almost symmetrical distributions. In the AR = 2 case, at minimum incidence, the circumferential shift of peak absolute angle is more distinct but occurs predominantly at the 90° and 198° positions, while the other positions show the distribution centered.
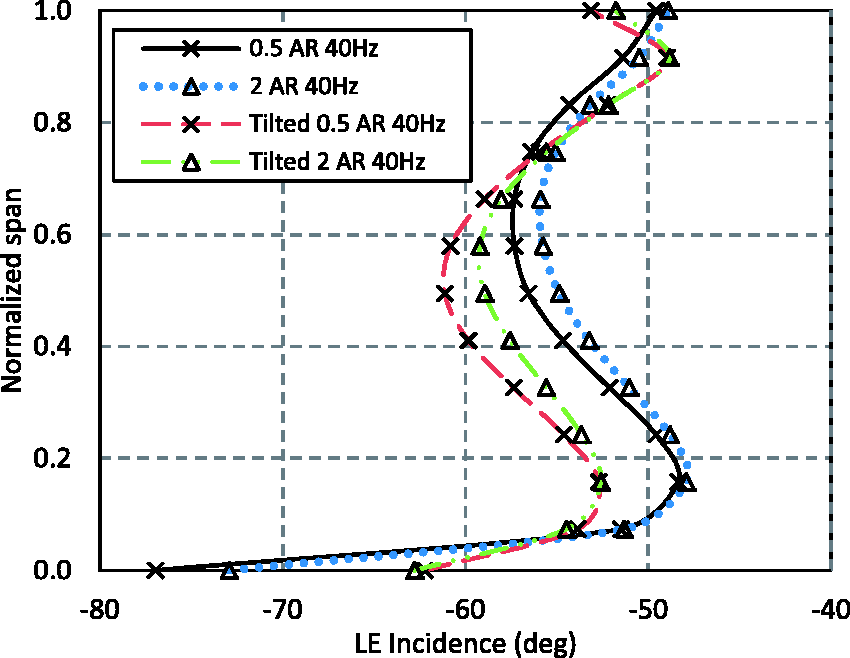
LE incidence at the minimum incidence running point in tilted and radial volute configurations with AR = 0.5 and AR = 2.
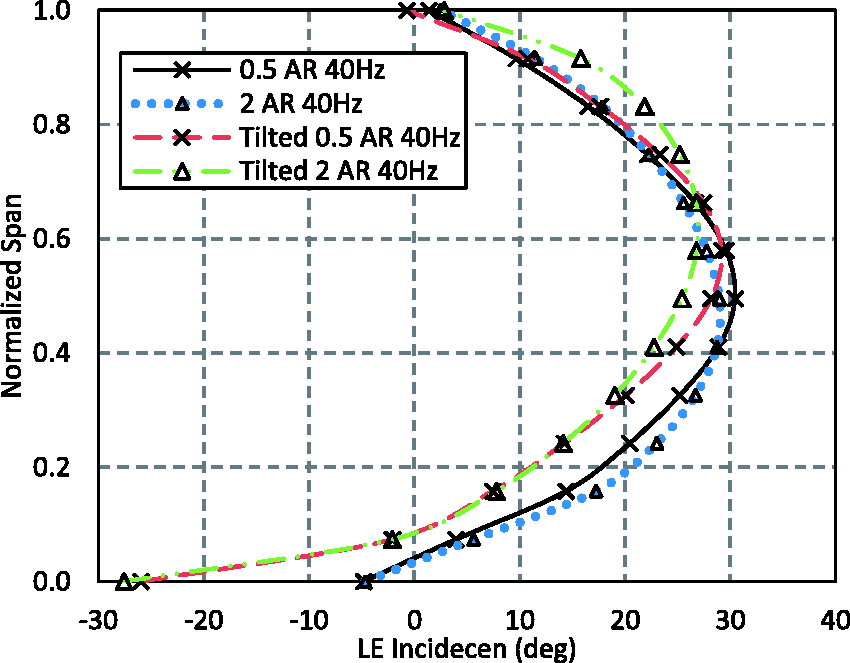
LE incidence at the maximum incidence running point in tilted and radial volute configurations with AR = 0.5 and AR = 2.
At the maximum incidence running point, the peak absolute flow angle reduces in all cases. The same circumferential shift can be observed between the radial and tilted designs that was present at the minimum incidence running point; with the peak shift occurring at 126° in the AR = 0.5 case and at 90° and 198° in the AR = 2 case. At other circumferential locations the absolute flow angle distribution shows no or little shift in the span-wise direction in the tilted case. At both running points the span-wise shift in the AR = 2 case is interesting as the shift is largest on the 90° plane, before reducing at the 126° plane, only to increase again by the 198° plane. The impact of volute aspect ratio reducing the span-wise variation is evident in both the radial and tilted cases at both running points.
Figures 26 and 27 show the resulting circumferentially averaged LE incidence angles over the blade span at the minimum and maximum incidence running points respectively. It was observed that the tilted variants resulted in the span-wise distribution shifting to lower positions at the LE than their radial counterparts at minimum incidence. The opposite is true at the maximum incidence running point. This effect is the result of the change in blade LE angle created through the increased meridional velocity at the LE in the tilted design and varying span-wise LE camber effecting the mixed flow effect.
In all cases, increasing the aspect ratio reduces the LE incidence variation with the magnitude of the peak incidence angles reducing. At the maximum incidence running point, the AR = 2 tilted volute results in the greatest span-wise shift of the distribution with the peak incidence occurring at approximately 0.65 span. The cause of this effect is the greater variation of meridional velocity in the tilted AR = 2 case discussed above.
The larger LE incidence variation in the AR = 0.5 cases, with sub optimal incidence angles over larger portions of the span relative to the AR = 2 cases, is believed to be one of the main contributions to the lower rotor efficiencies observed in the AR = 0.5 volute. Better understanding of the span-wise flow distributions delivery by the volute will allow the rotor to be optimized for energy extraction. This is particularly evident in mixed flow rotors where the blade LE angle can be manipulated through camber and cone angle modifications.
Conclusions
This paper has compared the impact of both volute tilt and volute aspect ratio by combining both parameters and comparing four volute designs.
It was observed that both parameters influence turbine performance. The maximum variation between the worst performing design, radial AR = 0.5, and the best performing design, tilted AR = 2, was 3% in the rotor region and 2.87% over the entire stage. Introducing volute tilt was shown to produce a larger improvement in the AR = 0.5 case. Increasing volute AR was more beneficial in the radial designs, with the tilted design showing a smaller performance benefit particularly in the rotor region. It was also found that combining both tilt and a smaller AR value resulted in the greatest volute loss.
It was observed that in both the radial and tilted volutes the lower AR designs resulted in greater radial acceleration around the volute walls. There were three major impacts of this on turbine performance. Firstly, the increased radial velocity at the walls led to an increase in volute secondary flows and hence volute loss. Secondly, the span-wise variation in flows at the rotor was greatest in the low AR design leading to greater variation in incidence and hence rotor loss. Finally, the increased meridional velocity in the volute resulted in an increase in MFP in the smallest AR design. It was therefore necessary to modify the volute A/r to achieve constant MFP as shown by Lee et al. 14
Volute tilt had a significant impact on the development of secondary flow structures in the AR = 0.5. The tilt resulted in asymmetric flow structures, and at certain points within the pulse, this resulted in the development of a third vortex. The impact of these secondary flows on volute exit and rotor inlet flows shows that the combination of the volute parameters can shift the LE span-wise distribution across the LE as well as influencing the range of flow angles. The AR = 2, tiled volute design resulted in the lowest peak incidence angles achieved of all the designs.
Footnotes
Acknowledgements
The authors would also like to thank Ricardo Martinez-Botas and Jose Francisco Cortell Fores of Imperial College London for supporting the unsteady analysis completed at said institute.
Declaration of Conflicting Interests
The author(s) declared no potential conflicts of interest with respect to the research, authorship, and/or publication of this article.
Funding
The author(s) disclosed receipt of the following financial support for the research, authorship, and/or publication of this article: The project is sponsored and supported by BorgWarner Turbo Systems and the Regional Growth Fund (RGF Grant Award).