
Abstract
Assessing greenhouse gas (GHG) emissions produced from electric vehicles (EVs) and hydrogen vehicles (HVs) requires understanding of the carbon intensity of electricity generation. Without the decarbonisation of electricity generation, environmental benefits of low emission vehicles (LEVs) will be diminished. The UK aims to produce net zero emissions by phasing out and banning the sale of new conventionally fuelled vehicles (CFVs) by 2035 in favour of LEVs. A comparison of the UK’s planned and future electricity production systems between 2020 and 2050 was conducted to analyse different vehicle-type mix scenarios: (1) 100% CFVs, (2 A/B) 100% EVs/HVs, (3 A/B) EVs/HVs integrated from 2035 and (4 A/B) EVs/HVs integrated from 2025 onward. This was conducted using four energy scenarios from the UK National Grid: two degrees, steady progression, consumer evolution and community renewables. This study does not consider the embedded carbon costs of the construction and decommissioning of vehicles. Results demonstrated that while the four electricity generation scenarios reduce the projected emissions they fail to achieve low emission targets. The two degree scenario produced the lowest level of emissions under each vehicle-type mix scenario. Technological improvements of CFVs are not enough to meet targets. Therefore, phasing out and banning the sale of new CFVs from 2025 (rather than 2035) would provide a stronger impetus to reduce transport emissions. Although these targets are possible, encouraging a change in transport modes from individual travel to public transport whilst simultaneously replacing buses and trains with electric or hydrogen alternatives would see a greater emission decrease.
Keywords
Introduction
In 2015, the Paris Agreement, a legally binding international agreement was introduced. 1 This agreement aimed to limit the average global temperature to well below 2 C above pre-industrial levels and to pursue efforts to limit the temperature increase to 1.5 C above pre-industrial levels. 2 Through ratification of this Agreement and recommendations from the UK’s Committee on Climate Change (CCC), the UK Parliament declared a ‘climate emergency’ in 2019. 3 The same year, the UK Government introduced an ambitious target for net zero greenhouse gas (GHG) emissions by 2050. 4 This has since been amended with an interim target of a 78% reduction in GHG emissions compared to 1990 levels, introduced in 2021 after further recommendations from the CCC. 5,6 Total UK emissions in 2019 across all sectors have been estimated to have decreased by 43.8% since the 1990s. 7,8,9 Although there remains a general trend in emission levels decreasing, transport emitted 28% of total GHG emissions in 2017, representing a decrease of only 3% from 1990. 10 To achieve these targets, reducing tailpipe emissions from road vehicles has become dominant in European Union (EU) policy to reduce transport emissions. In 2017, road transport accounted for just over three-quarters of the transport energy consumed in the UK, with cars accounting for more than half (55%). 11 Therefore focussing on reducing road transport emissions is likely to have a significant environmental benefit. 12
The objective of this paper is to analyse emissions produced by replacing conventionally fuelled vehicles (petrol or diesel cars and light vans) (CFVs) with alternatives including electric vehicles (EVs) and hydrogen vehicles (HVs) (collectively Low Emission Vehicles (LEVs)) under four National Grid energy scenarios between 2020 and 2050. Seven vehicle-type mix scenarios were analysed: (1) 100% CFVs, (2 A/B) 100% EVs/HVs, (3 A/B) EVs/HVs integrated from 2035 and (4 A/B) EVs/HVs integrated from 2025 onward. To do this, we consider the tailpipe emissions of CFVs and the emissions ascribed to generating electricity to power LEVs. This comparison of projected vehicle emissions will enable a better understanding of the influence of the electricity generation mix in the UK. We are not aware of previous studies utilising national energy generation data sets for the UK to compare both electric and hydrogen private/light commercial vehicles. Furthermore, cumulative vehicle emissions and transport emissions per person per kilometre travelled will also be investigated to better understand which of our scenarios is the least carbon intensive as the UK continues to work towards their national and international targets.
Manufacturers of CFVs are continually improving petrol and diesel engine efficiency to reduce fuel consumption and therefore emissions. However there is a growing consensus that this technological transition will not be rigorous enough to transform the transport network. 13,14,15 Under the EU Regulation (EC) 443/2009, the EU set mandated emission reduction targets for the tailpipe emissions of new cars to produce less than 130 gCO2 km−1 between 2015 and 2019, corresponding to fuel consumption of around 5.6 L/100 km of petrol or 4.9 L/100 km of diesel. 16 On average this target was met with the average emission levels of new cars registered in 2018 in the EU and Iceland at 120.4 gCO2 km−1. 16 However, average emissions increased by 2 gCO2 km−1 compared to 2017. 17 The target per vehicle has since been updated under Regulation (EU) 2019/631, with cars from 2021 to produce < 95 g CO2 km−1, which corresponds to fuel consumption of 4.1 L/100 km of petrol or 3.6 L/100 km of diesel. 17 The actual increase in emissions per kilometre is due to the increase in market share of sports utility vehicles (SUVs), powered by petrol, increased from 25 to 31% between 2017 and 2018. 17 Consumer preference regarding vehicle size is therefore a key aspect to consider when estimating future emission projection.
To meet the UK’s net zero target within the transport sector, the Department of Transport (DfT) introduced the ‘Road to Zero’ (R2Z) strategy in 2018 18 The R2Z outlines how the UK Government will support the transition to zero emission road transport and reduce emissions from CFVs during this transition.18,10 The R2Z strategy aimed to encourage a shift towards LEVs by phasing out and banning the sale of all new CFVs by 2040. 18 By international standards this target was considered weak with other countries and cities banning the sale and integrating alternatively fuelled electric or hydrogen (H2) vehicles much earlier. 19 For example, in Asia (India by 2030, Israel by 2030), across Europe (France by 2025, Ireland by 2030, Netherlands by 2030, Norway by 2025, Sweden by 2030, UK by 2035) and in South America (Costa Rica by 2021). 20 With pressure placed on the UK Government by the CCC to meet their net zero targets, this target has since been amended to ban the sale of new petrol and diesel cars (and vans) by 2030 and this now includes hybrid vehicles.21, 22 Although LEVs are considered zero emission at their point of use, their true emissions are dependent upon non-tailpipe emissions from electricity (and H2) production. Therefore, to ensure the best environmental outcome for this transition, decarbonisation of the electricity sector will be central. 23
This paper will focus on the projected carbon dioxide (CO2) emissions produced from the electricity supply mix through four electricity scenarios generated by the UK National Grid. 24 The first scenario, two degrees, reflects the UK adhering to the global ambition set out in the Paris Agreement with total emissions expected to meet the 80% emission reduction target, decreasing from 503 MtCO2e in 2017 to 165 MtCO2e in 2050. 24 The second scenario, steady progression, takes into consideration the continual levels of progress and innovation and is similar to the two degree scenario but the UK will de-carbonise at approximately half the rate. Under this scenario, emissions are expected to decrease by 58%, from 503 MtCO2e in 2017 to 345 MtCO2e in 2050. 24 The third scenario, community renewables,predicts what could happen if consumers and businesses began to install small-scale renewable generation in their homes, offices and neighbourhoods. This scenario expects emissions to meet an 80% emissions reduction, decreasing from 503 MtCO2e in 2017 to 165 MtCO2e by 2050. 24 The final scenario, consumer evolution analyses the shift towards local generation and increased consumer engagement, largely from the 2040s onward. Under this scenario, emissions are expected to decrease by 58% and not meet the 80% reduction target with emissions decreasing from 503 MtCO2e in 2017 to 344 MtCO2e by 2050. 24 Using these four energy generation scenarios, the seven different vehicle type scenarios were analysed to allow recommendations to be made to policymakers and to project future trends of energy demand and CO2 emission for CFVs, EVs and HVs in the UK.
This paper does not consider the embedded carbon costs of vehicles including the decommissioning of CFVs and the construction of EVs and HVs, including the considerable battery costs. The carbon emissions of the manufacturing processes are dependent upon energy sources used and the electricity mix where the vehicle is produced, and a full life cycle analysis (LCA) is required to give a complete understanding of transport emissions. A LCA is a methodological framework for estimating and assessing the environmental impacts attributable to the life cycle from construction, operation and scrappage, considering both direct and indirect CO2 emissions produced throughout the entire process. 23 Accelerated decommissioning of CFVs occurring before the end of their useful life will also increase emissions so a cradle to grave LCA is required and outside the scope of this paper. Focussing on operating emissions using the methods detailed later however enables a useful policy tool to give insight into the likely longer term benefits in the transition period post-CFV ban to 100% LEV. Previous work has shown that CFV, EV and HV vehicle manufacturing and disposal emissions are all expected to be significantly higher than tailpipe emission analysis.26,27 It stands to reason therefore that when discussing emissions reduction policies, focussing on operating emissions will have a greater and more rapid effect on reducing life cycle emissions from transport.28,29
UK’s electricity context
Decarbonisation of the energy sector will be one of the largest environmental issues facing widespread LEV utilisation. To ensure the UK remains on track to meet this target, the CCC has set several five-yearly carbon budgets running to 2032 to reduce GHG emissions. The UK is currently on their third carbon budget (2018–2022) which aims for a 37% reduction in GHG emissions (the equivalent of 2544 MtCO2e) by 2022 compared to 1990 levels with the UK currently on track to surpass this. 30 However, projections for the fourth (2023–2027) and fifth (2028–2032) carbon budgets suggest that the UK’s GHG emissions would currently be greater than their budgets of 1950 MtCO2e and 1765 MtCO2e respectively and shortfalls are likely to occur. 30 This is mainly due to policy developed in the Government’s Clean Growth Strategy not being fully deployed which is likely to have repercussions leading to GHG emission reduction uncertainties. 31 The sixth carbon budget was announced in December 2020 which aims to see the UK emissions capped at 965 MtCO2e between 2033 to 2037. 6
To meet these carbon budgets, the UK is legally committed to the 2009 EU Renewable Energy Directive (2009/28/EC), which requires 15% of energy to be generated from renewable sources by 2020. This was later revised under the EU Renewable Energy Directive (2018/2001/EU) with 32% of energy to be generated by renewables by 2030. 32 The UK aimed to surpass this by sourcing 40% of electricity from low carbon technologies by 2020. 32 By 2019, the UK’s energy generation consisted of 40.6% from gas, 37.1% from renewable sources, 17.3% from nuclear, 2.8% from oil and other fuels and 2.1% from coal. 33
Although the UK left the EU in early 2020, the transition period agreed upon in the EU-UK Withdrawal Agreement finished at the end of 2020. However, the UK was subject to EU legislation during the Brexit transition. 34 The UK has stated that they still want to seek cooperation with the EU to support the delivery of cost efficient, clean and secure supplies of electricity and gas, based on competitive markets and non-discriminatory access to networks as the UK recognises the shared interest in global action to mitigate climate change. 34
Recent developments of a more decentralised electricity supply network combined with the growing requirements for LEVs will lead to a more localised energy infrastructure developing. Renewable energy generation, especially solar, tidal, wind and wave can provide off grid electricity generation that can be used to charge EVs or generate hydrogen for local use before feeding excess electricity into the grid. Examples of this are the Orkney Surf ‘n’ Turf (2017–2020) and BIG HIT (2019–2022) projects which use energy from a tidal test site to provide community power and hydrogen fuel resource.35,36 Deployment of EVs and HVs will depend on the existing electricity generation and distribution infrastructure in the short to medium term before local infrastructure is developed. The benefits of more localised power resources are reduced long distance grid infrastructure upgrades which would be costly and a major barrier to increasing the use of electricity for transport power provision. Community renewables generation predictions are of interest as benefits from localisation may have additional benefits to those highlighted purely through an emissions analysis.
The UK has historically generated the majority of its energy from fossil fuels but has almost completely transitioned away from coal. This has led to a rapid increase in gas generation infrastructure due to the availability of natural gas from the North Sea and combined cycle gas turbine (CCGT) technology which is intrinsically more efficient than thermal coal. 37 As this technology can easily be switched on and off it is used for load balancing electricity generation to provide dispatchable power during peak times where there are renewable-sourced electricity shortages. This type of network arrangement will be needed until storage technology coupled with greater renewable power can be developed. Although CCGT technology produces less than half the GHG emissions of thermal coal per megawatt hour of electricity, it is not zero carbon. Additional processes such as carbon capture and storage (CCS) which captures CO2 emissions by extraction and storing these emissions in a suitable geological formation for long-term isolation from the atmosphere will be required.38,39,40 These technologies are required to reduce gas generation emissions. Decarbonisation of the energy grid in the future therefore requires technological development on two fronts, renewable-sourced energy storage and CCS. Only with these will the transition of energy grid to lower carbon be possible.
Furthermore, the UK also relies upon interconnectors with other European countries such as the Republic of Ireland, Netherlands, Norway and France. In 2017, the UK imported 19.1 TWh of electricity via interconnected power grid management systems. 41 Utilising this connection allows peak sharing between different time zones to reduce the demand on the National Grid Network. As the UK’s electricity supply is driven by demand, a transition towards EVs and HVs is likely to increase this energy demand. 9
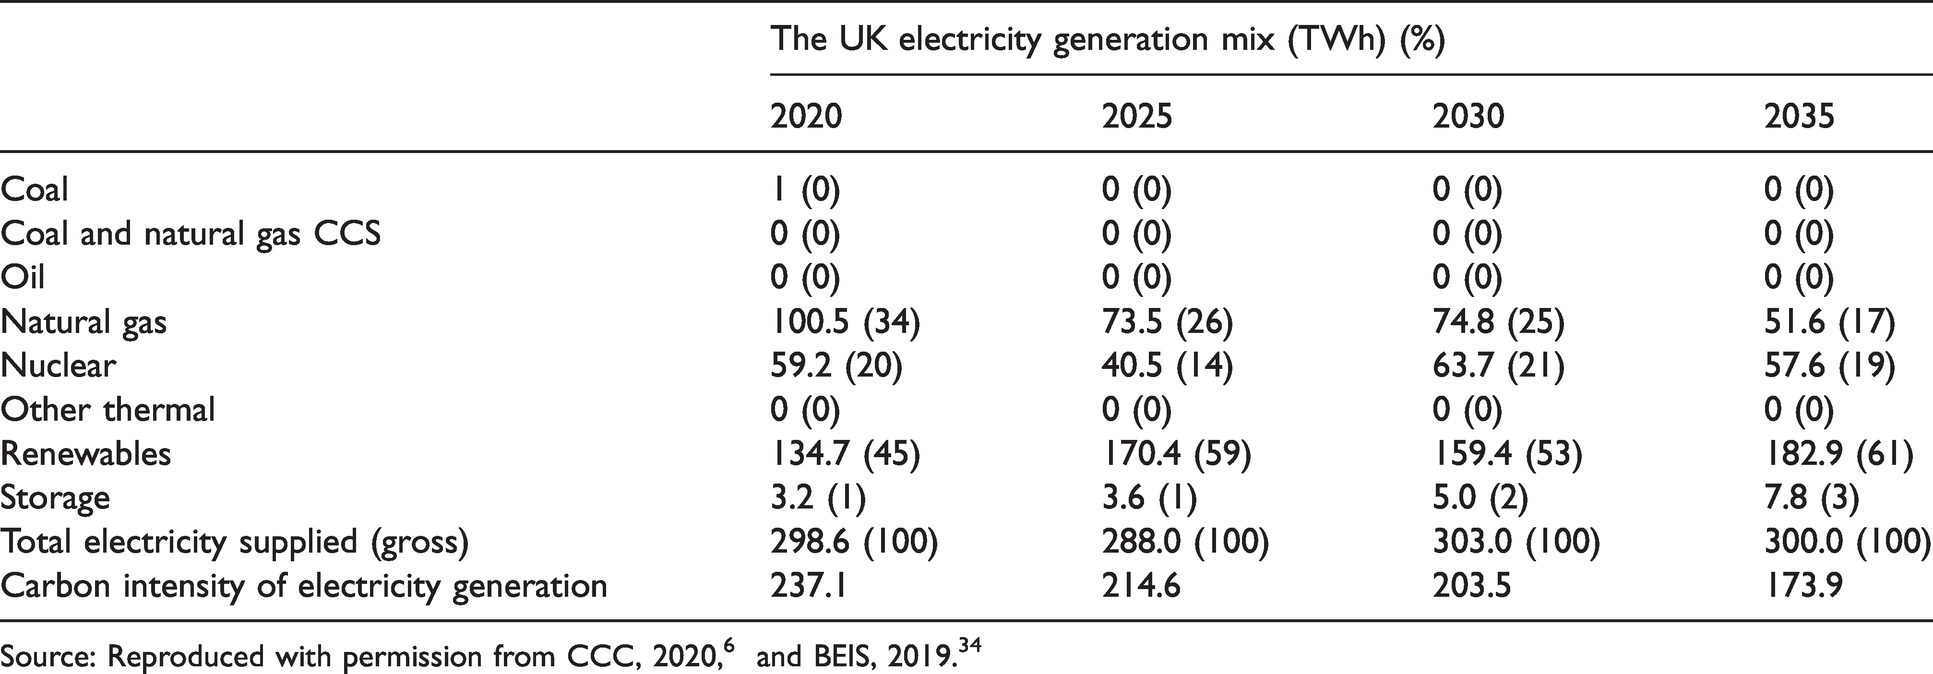
Table 1 shows the projected electricity generation mix between 2020 and 2035 using existing policies.9,42,43 Due to possible policy changes to ensure the UK meet their emission targets, published projections do not go beyond 2035. It is unknown how ambitious these projections are. Over the next 18 years, the UK Government aims to have reduced coal use from 1% (in 2019) of electricity generation to 0%, aligning within the 2025 target, while simultaneously doubling renewable energy generation. 44 This 2025 target is being intended to be brought forward to 2024. 45
Projected UK electricity generation mix based on current policy between 2020 and 2035.
H2 can be produced from an extensive range of sources and materials, including fossil fuels, biomass and industrial chemical by-products. Currently, the feedstocks used to manufacture H2 are ∼48% is from natural gas, ∼30% from petroleum, ∼18% from coal gasification, ∼3.9% from electrolysis using electricity and ∼0.1% from other processes. 46 Fuel cell vehicles use H2, which is stored within the vehicle, generating electricity by combining H2 and oxygen in a fuel cell, to power an electric motor. One method of H2 generation is through electrolysis where water is converted into H2 and oxygen by applying direct electric current between electrodes, also known as ‘green hydrogen’.47, 48 This process produces oxygen and heat as by-products and although this is the most environmentally friendly method of H2 production, if using renewable or nuclear electricity, it is often difficult to do on such a large scale. 49 Analysis within this paper focuses on H2 generated through electrolysis.
Methodology
For this paper, CO2 emissions produced for both EVs/HVs and CFVs for the UK were predicted up to 2050 using an operating emission model informed by national and regional databases from the UK Government of vehicles numbers, types and annual mileage, and the National Grid 24 predictions of electricity generation emissions under a range of scenarios. These predictions were used to analyse the level of emissions between 2020 and 2050; 2020 was selected as the base case as this was the latest available national dataset of private vehicle use and electricity generation.
For analysis seven vehicle-type scenarios were chosen: (1) 100% CFVs, (2 A/B) 100% EVs/HVs, (3 A/B) EVs/HVs integrated from 2035 and (4 A/B) EVs/HVs integrated from 2025 onward. Two different years were chosen for banning the sale of new CFVs and mandating LEVs; 2035 in line with current UK policy and 2025 as this is ten years ahead of policy. The rate of EV and HV integration under scenarios 3 and 4 can be seen in Appendix A.
To understand the level of emissions for EVs and HVs, four electricity generation scenarios were used from the National Grid database including: two degree, steady progression, community renewables and consumer evolution. 24 These four scenarios projected the UK’s electricity generation mix based on different decarbonisation scenarios. We used the CO2 intensity of electricity generation based on these four electricity generation mixes to project the best case (two degree) and worse case (consumer evolution) scenarios that the UK is likely to face between 2020 and 2050 to determine the likelihood of the UK meeting their net zero emission reduction target. An overview can be seen in Table 2, with a more detailed breakdown of the carbon intensity of electricity seen in online Appendix B Part A. Appendix B Part B highlights the percentage breakdown of the different energy generation types that contribute to the carbon dioxide intensity of electricity generation from the four different scenarios.
Overview of the carbon dioxide intensity of electricity generation under the four UK National Grid scenarios between 2020 and 2050.
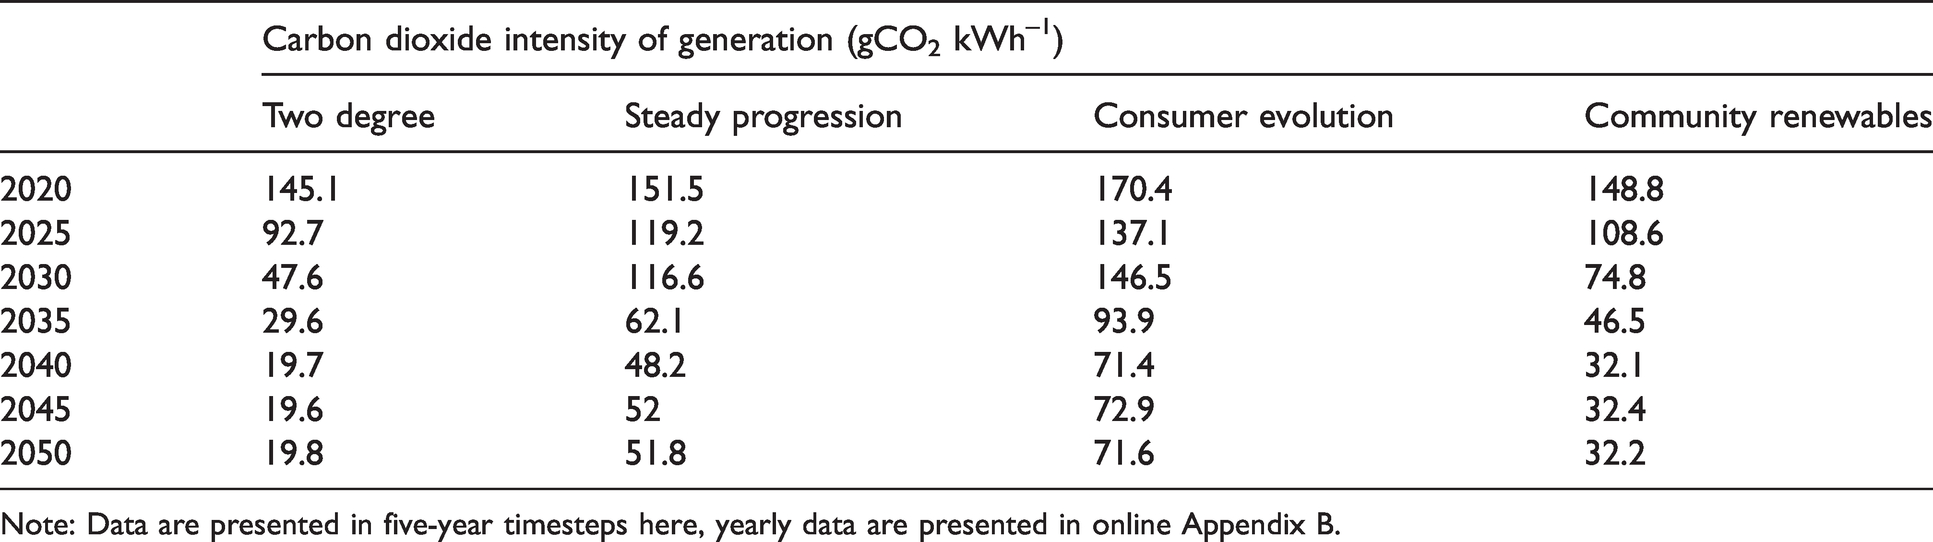
Note: Data are presented in five-year timesteps here, yearly data are presented in online Appendix B.
Projected distance travelled and number of vehicles
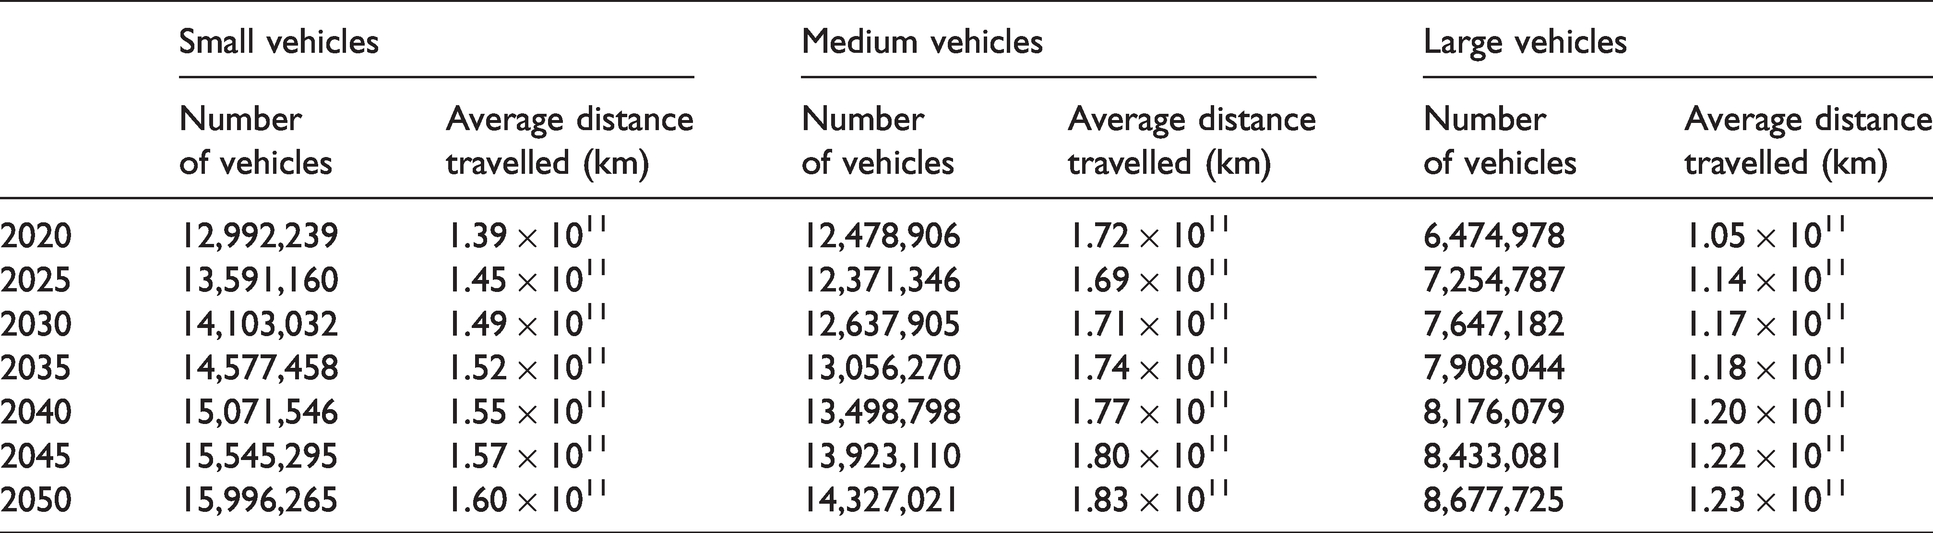
The projected distance travelled and number of vehicles was projected using the Transport Energy Air Pollution Model for the UK (TEAM-UK) with the total number split into small, medium and large passenger vehicles to be estimated individually across the differently fuelled vehicle types. 50 – 53 TEAM-UK is a transport, energy, emissions and environmental model which has been used to develop policy scenarios that explore a range of technological, fiscal, regulatory and behavioural choice policy interventions to meet UK climate change and energy security goals.50–53 For these projections, the TEAM-UK model uses current national databases and extrapolates the data towards 2050. Data was taken from the UK Government’s Department for Business, Energy and Industrial Strategy (BEIS) projections of vehicle type and numbers, distance driven and electricity generation mix.50--53 This also took into consideration national GDP, pre-tax energy prices, demographics, household disposable income and maximum car ownership levels.
An overview of the projected number of vehicles and distance travelled can be seen in Table 3 with a more detailed overview in online Appendix C. The number of vehicles is predicted to increase by 25% during this time from 31,084,109 vehicles to 38,967,587. This increase in the number of vehicles is reflected by changes in vehicle dependence in terms of transport demand growth, as well as demographics including income and GDP per capita. Furthermore, the annual distance travelled in kilometres decreased by 9% between 2020 and 2050. Although there are expected differences in wealth through annual increases in GDP growth, individuals are expected to travel a similar distance over the time frame. An overview of the projected distance travelled (km) and the projected number of vehicles in the UK for 2020 and 2050.
Overview of the total number of vehicles and distance travelled (kilometers) of small, medium and large vehicles between 2020 and 2050 in the UK.
Conventionally fuelled vehicles
To estimate the level of emissions for CFVs, equation (1) was used. The number of vehicles and distance travelled can be seen in online Appendix C. To give total CFV emissions, the emissions of the three vehicle size categories were totalled.
where s = vehicle size, D = average distance travelled per vehicle, V = estimated number of vehicles for the year and G = estimated CO2 per kilometre travelled (gCO2 km−1). Data units are then converted to MtCO2.
In the EU, the average new car purchased in 2018 produced around 120 g CO2 km−1, below their target of 130 g CO2 km−1. 16,17 To account for vehicle improvements, from 2020,120 g CO2 km−1 value was used and decreased by 1 g CO2 km−1 each year resulting in 87 g CO2 km−1 by 2050 which is below the EU limit of 95 g CO2 km−1 for all new cars by 2020. Given average scrappage age of a vehicle at ∼13.9 years, this decrease is approximately the same as the median rate of change over the time frame of rolling 14 year averages. 54
Electric and hydrogen vehicles
To estimate the level of CO2 emissions produced for 100% EVs and 100% HVs, equation (2) was used
For all vehicle sizes, the value 22.9 kWh 100 km−1 was used for energy efficiency, which is that of the Nissan leaf, the most popular mid-sized EV in the UK at the time of the analysis. 55 Using this value also enabled a fairer comparison to the HV predictions where only a mid-sized vehicle value was available. The Nissan Leaf value is also higher than the average of the three vehicle size efficiency values by around 10% meaning EV emissions savings may under estimated.
As of 2020, there were currently three publicly available HVs: the Toyota Mirai, Hyundai Nexo and the Honda Clarity. 56 As all three HV types are relatively new on the market and are mid-sized vehicles, the same values for the hydrogen consumption were selected using the most popular HV for all three vehicles types, the Toyota Mirai. To do this, the extra high technical specification value of 1.24 kg H2 100 km−1 was multiplied by the usable capacity of 1 kg of H2 (33.3 kWh kg −1) giving a value of 41.2 kWh 100 km−1. 57
To account for inefficiency in battery charge discharge, transmission and distribution losses, a correctional factor for electricity production (F) was 1.18. Power conservation is expected to improve through advances in EV technology and average annual distance travelled per vehicle is expected to decrease over time, however limited information quantifying this is currently available. This has resulted in current and future years being run with the same correctional factor, therefore energy required by EVs in 2050 may be overestimated.
Similarly, although H2 production by electrolysis requires additional conversion processes in comparison to electricity generation for transport, 48 the correctional factor for electricity productions was kept the same for both electric and hydrogen vehicles. As HV users are likely to refuel their vehicles at a central refuelling facility, more like conventional fuel, there will be less electricity transmission loss as H2 generation and refuelling will unlikely occur at home. Other sources of H2 production involve transporting H2 produced near renewable sites and therefore similarly avoid grid transmission loses. The differences between EV and HV recharging are therefore thought to offset the additional energy generation (and therefore emission) requirements for producing hydrogen onsite. Similar studies have used a different approach however the method used to approach for hydrogen generation carbon intensity should be transport type specific.28,29
Integration of electric and hydrogen vehicles
To estimate the emissions produced when integrating EVs and HVs from 2035 and 2025 (3A and 4A, 3B and 4B respectively), equation (3) was used. The integration rate used can be seen in online Appendix A which projects a LEV uptake which demonstrated that under the 2035 scenario there would be 100% LEVs by 2048 and under the 2025 scenario there would be 100% LEVs by 2038. The same level of integration for both EVs and HVs was used as although there is currently no policy in place for HV integration, in order to directly compare the projected level of emissions this assumption was required and HV integration is not expected to exceed the EV integration rate. As no HV specific data was available, a more realistic mixed scenario of CFV, EV and HV was not completed. The outputs from the integration scenarios show the respective maximum and minimum emissions involving LEVs anyway. This comparison will allow a better understanding of what changes will need to be implemented to the current road network to reduce personal vehicle emissions to net zero. To do this, equation (3) was used which combines the output values from equations (1) and (2) to predict the total emissions when integrating LEVs into the transport network
Results
The results of this study are presented in four sub-sections for the different vehicle-type mix technologies. Section ‘ Scenario 1 – Conventionally fuelled vehicles’ discusses the level of emissions from 100% CFVs assuming no EVs or HVs within the mix. Section ‘ Scenario 2 – 100% low emission vehicles’ discusses 100% EVs or HVs with sections ‘Scenario 3 – Low emission vehicles integrated from 2035’ and ‘Scenario 4 – Low emission vehicles integrated from 2025’ projected the operating emissions from the three vehicles sizes under the four different energy generation scenarios with EV/HV integration in 2025 and 2035 respectively. Section ‘Cumulative emissions’ discusses the cumulative emissions from the different fuel scenarios.
Under all scenarios, 95% of the 1990 baseline levels from passenger car transport CO2 emissions (3.5 MtCO2) are indicated to show if the transport scenarios meet emission reduction objectives. 58 This value represents net zero emission reduction targets under these scenarios.
Scenario 1 – Conventionally fuelled vehicles
Figure 1 highlights the projected CO2 emissions from small, medium and large CFVs between 2020 and 2050.
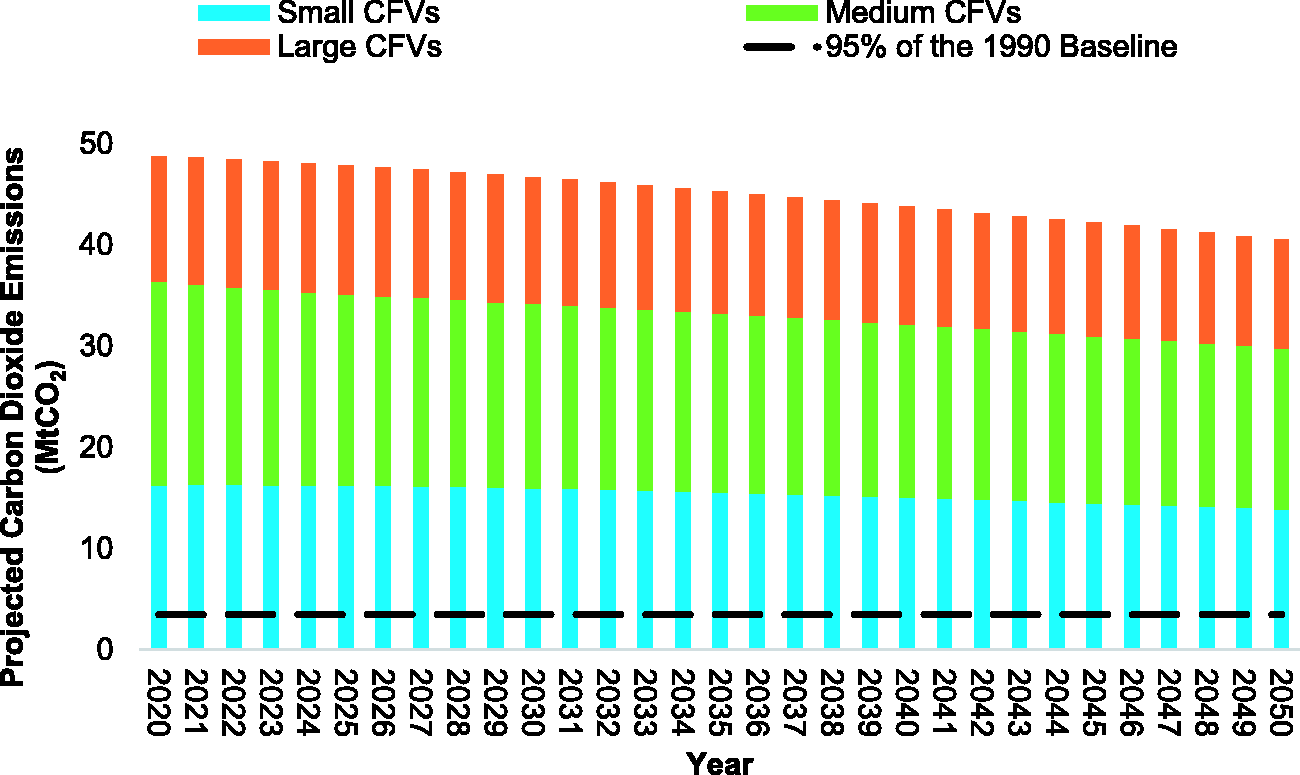
Projected carbon dioxide emissions from small, medium and large conventionally fuelled vehicles in the UK between 2020 and 2050. The 95% baseline of the 1990 carbon dioxide emissions for UK road transport is highlighted by the black dashed line.
Small CFVs show a decrease of 14% from 16.2 MtCO2 in 2020 to 13.9 MtCO2 in 2050. Emission levels for small CFVs peaked in 2023 at 16.3 MtCO2. Medium CFVs saw the largest decrease in CO2 emissions by 21% from 20.1 MtCO2 in 2020 to 15.9 MtCO2. Large CFVs saw a decrease of 13% from 12.3 MtCO2 in 2020 to 10.7 MtCO2. Results highlight that even with technological advances, and a decrease in the total level of CO2 emissions from CFVs, this reduction will not be enough to meet the net zero emission reduction targets of 95% or the 1990 baseline.
Scenario 2 – 100% low emission vehicles
This section projected the total CO2 emission from 100% EVs (Section ‘Scenario 2A – 100% electric vehicles’) and 100% HVs (Section ‘Scenario 2B – 100% hydrogen vehicles’) between 2020 and 2050 in the UK.
Scenario 2A – 100% electric vehicles
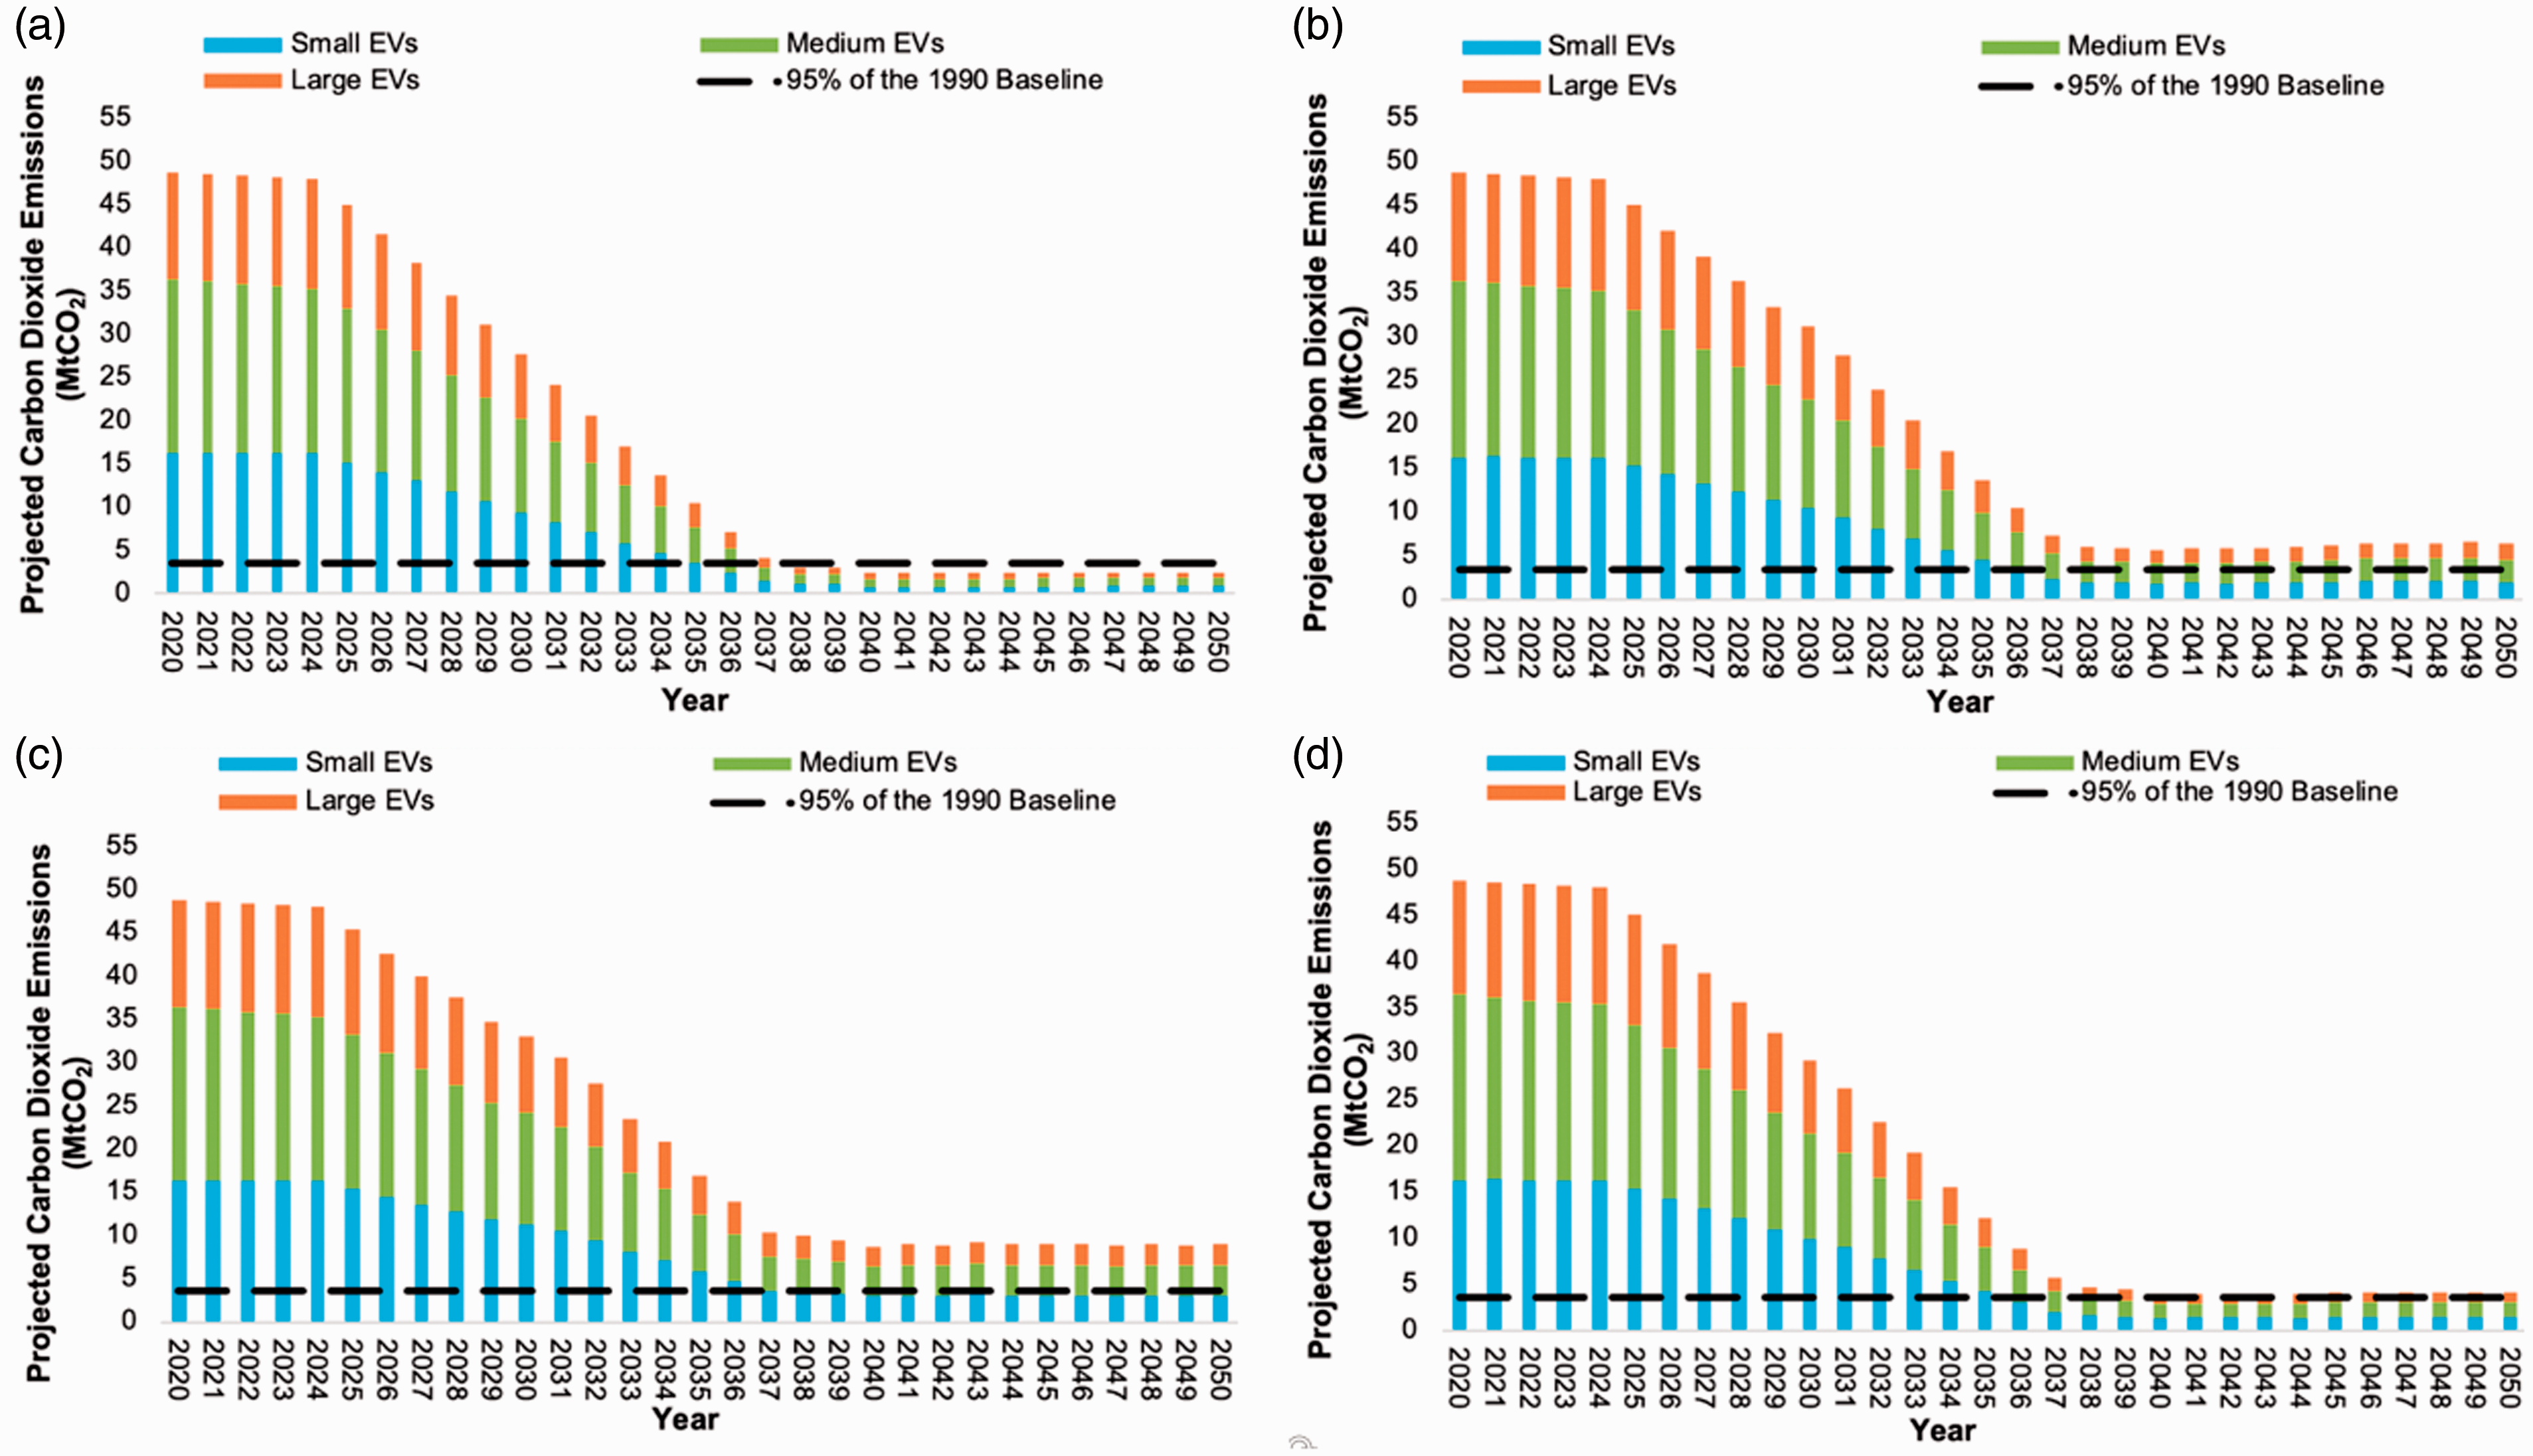
Figure 2 highlights the emissions from 100% electric small, medium and large cars under the four National Grid electricity generation scenarios if all vehicles were EV between 2020 and 2050.
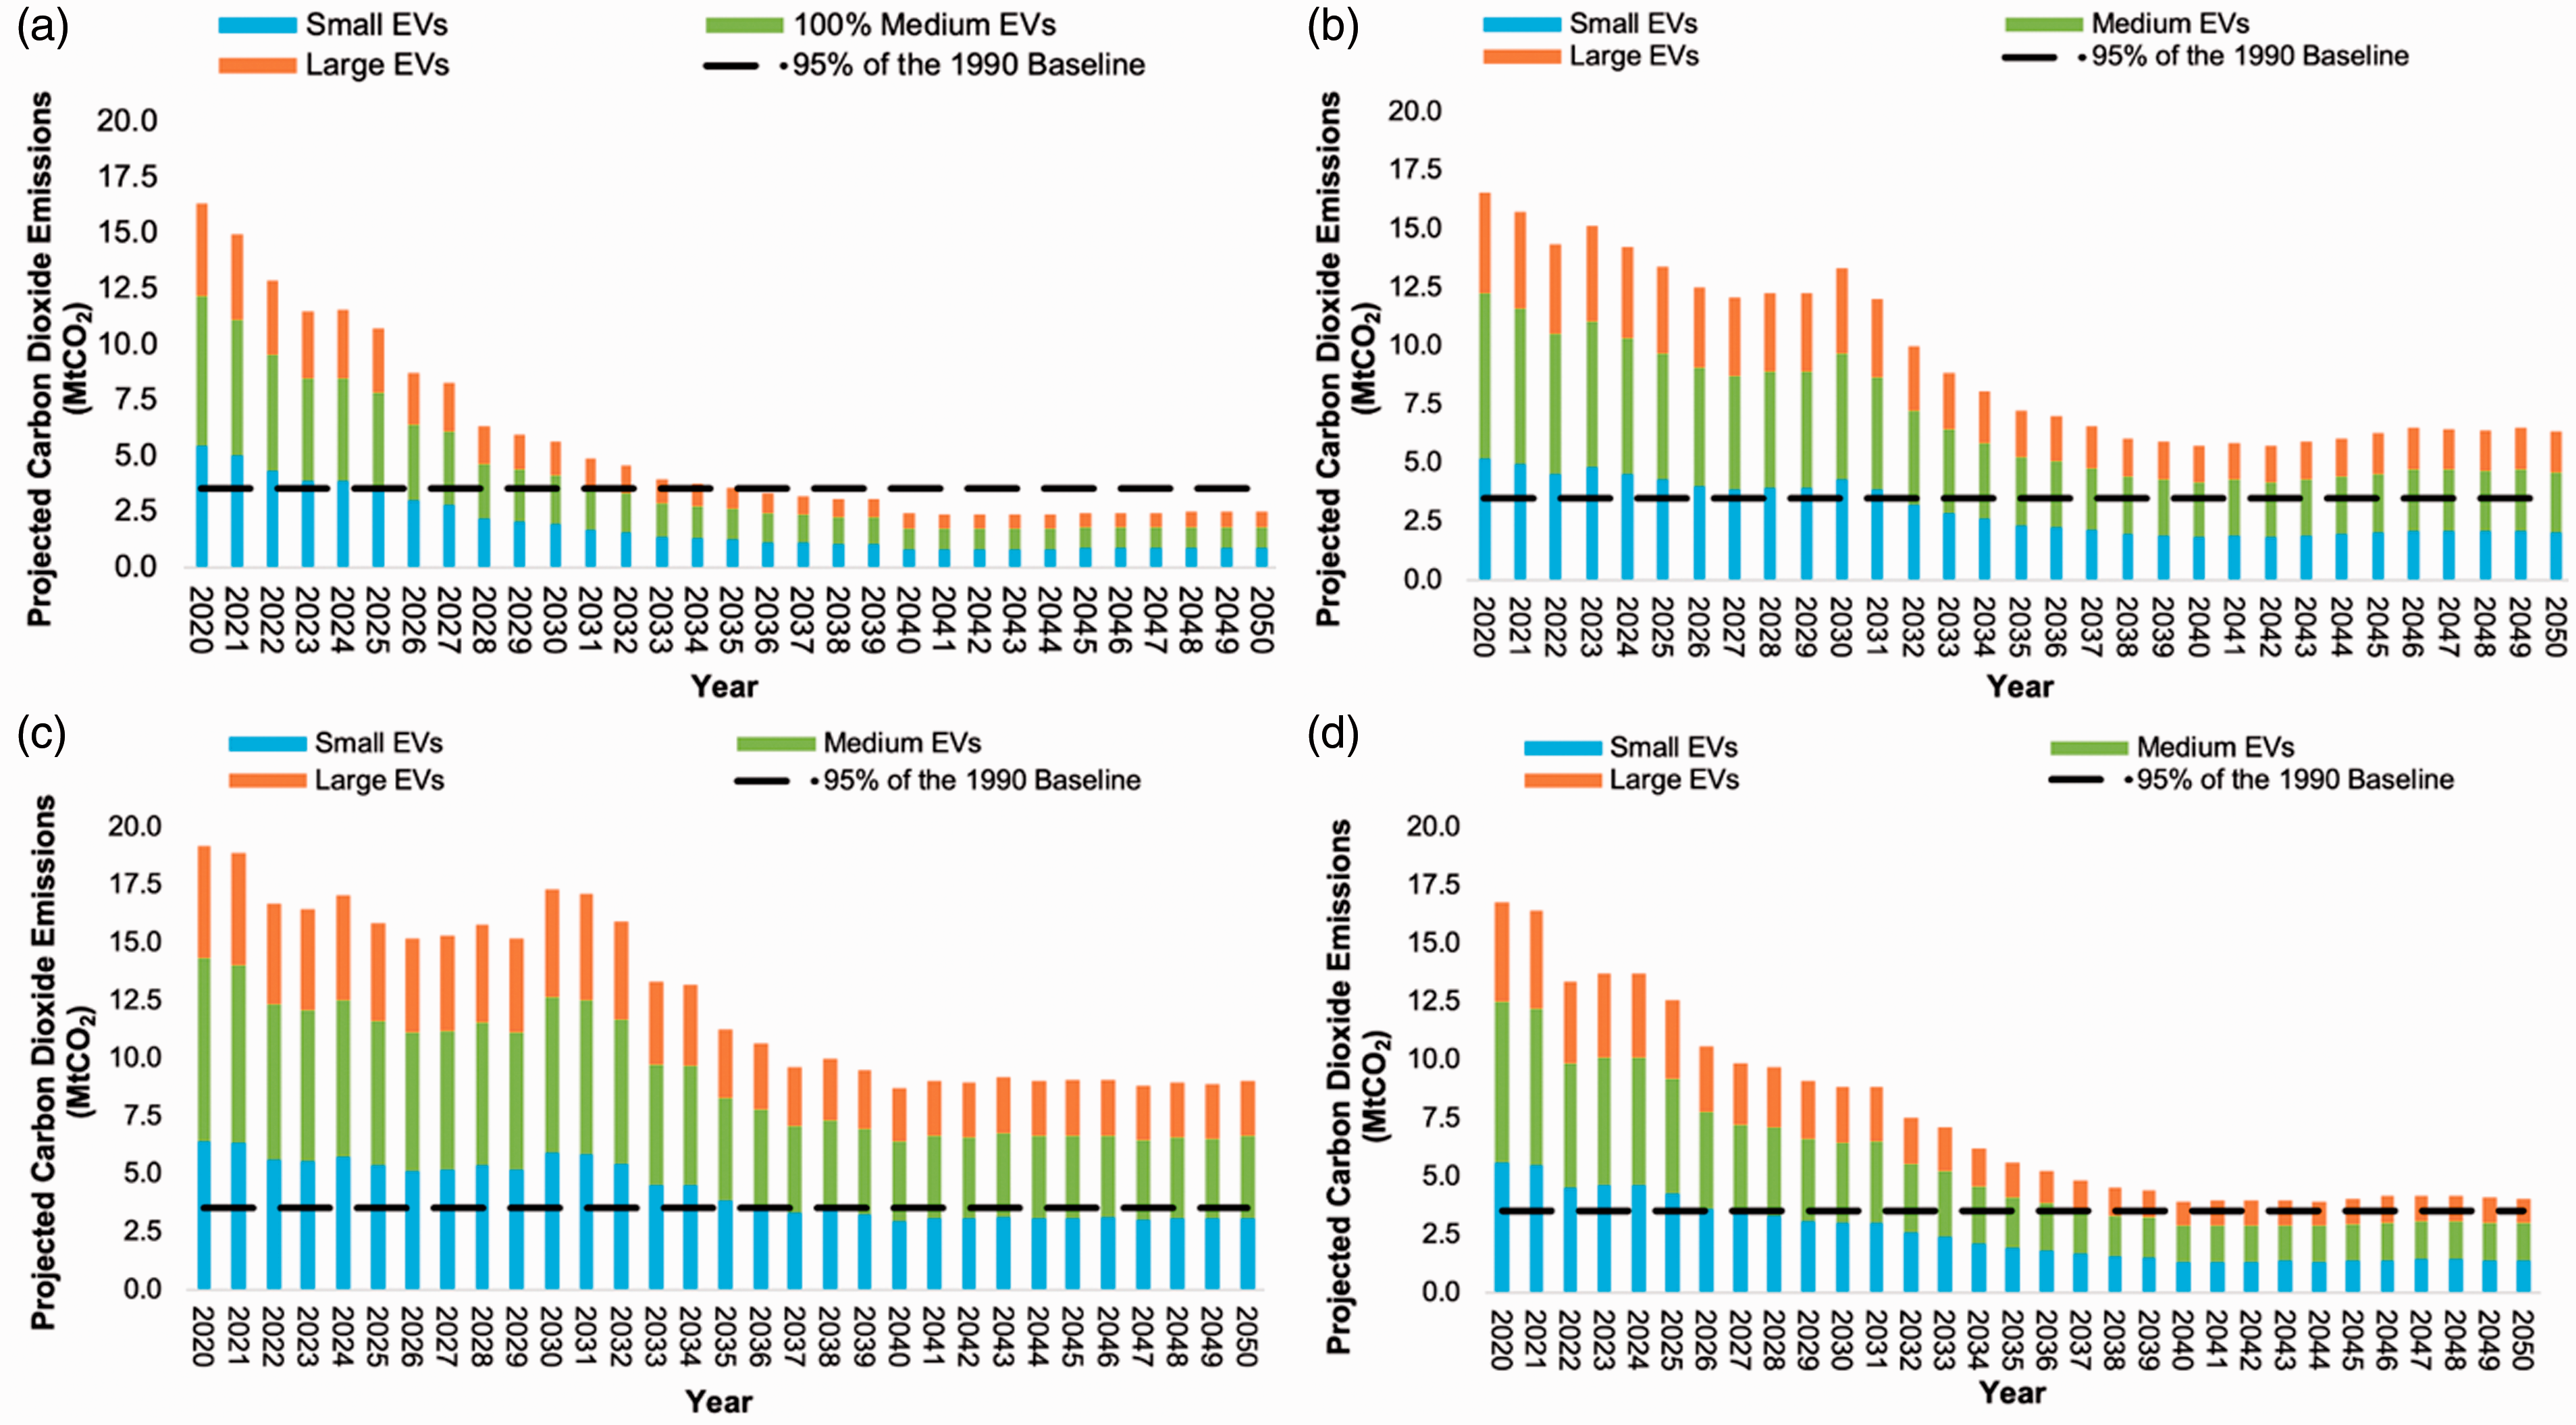
The predicted carbon dioxide emissions for 100% electric vehicles in the UK based on the four electricity scenarios (a = two degrees, b = steady progression, c = consumer evolution and d = community renewables) between 2020 and 2050. The 95% baseline of the 1990 carbon dioxide emissions for UK road transport is highlighted by the black dashed line.
Results indicate that under the two degree (A) scenario, the UK would meet their net zero emission targets of 95% or the 1990 baseline, with results showing the largest decrease in emissions by 91% from 29.4 MtCO2 to 2.5 MtCO2 within the time frame, meeting the net zero emission target. The community renewables (D) scenario saw the second largest decrease in emissions by 86% from 29.4 MtCO2 to 4.1 MtCO2, however would not meet net zero.
Under the steady progression scenario (B), the UK would struggle to meet the target of 95% or the 1990 baseline, with only a 79% reduction from 29.4 MtCO2 to 6.3 MtCO2 between 2020 and 2050. Finally, under the consumer evolution (C), results indicate the UK would not meet its net zero targets. Emissions reduced by 69% from 29.4 MtCO2 to 9.0 MtCO2 between 2020 and 2050. Therefore results indicate that, in an ideal world without low carbon electricity generation, the UK will struggle to meet its emission reduction targets. Furthermore, medium sized vehicles saw the largest decrease in emissions within the time frame.
Scenario 2B – 100% hydrogen vehicles
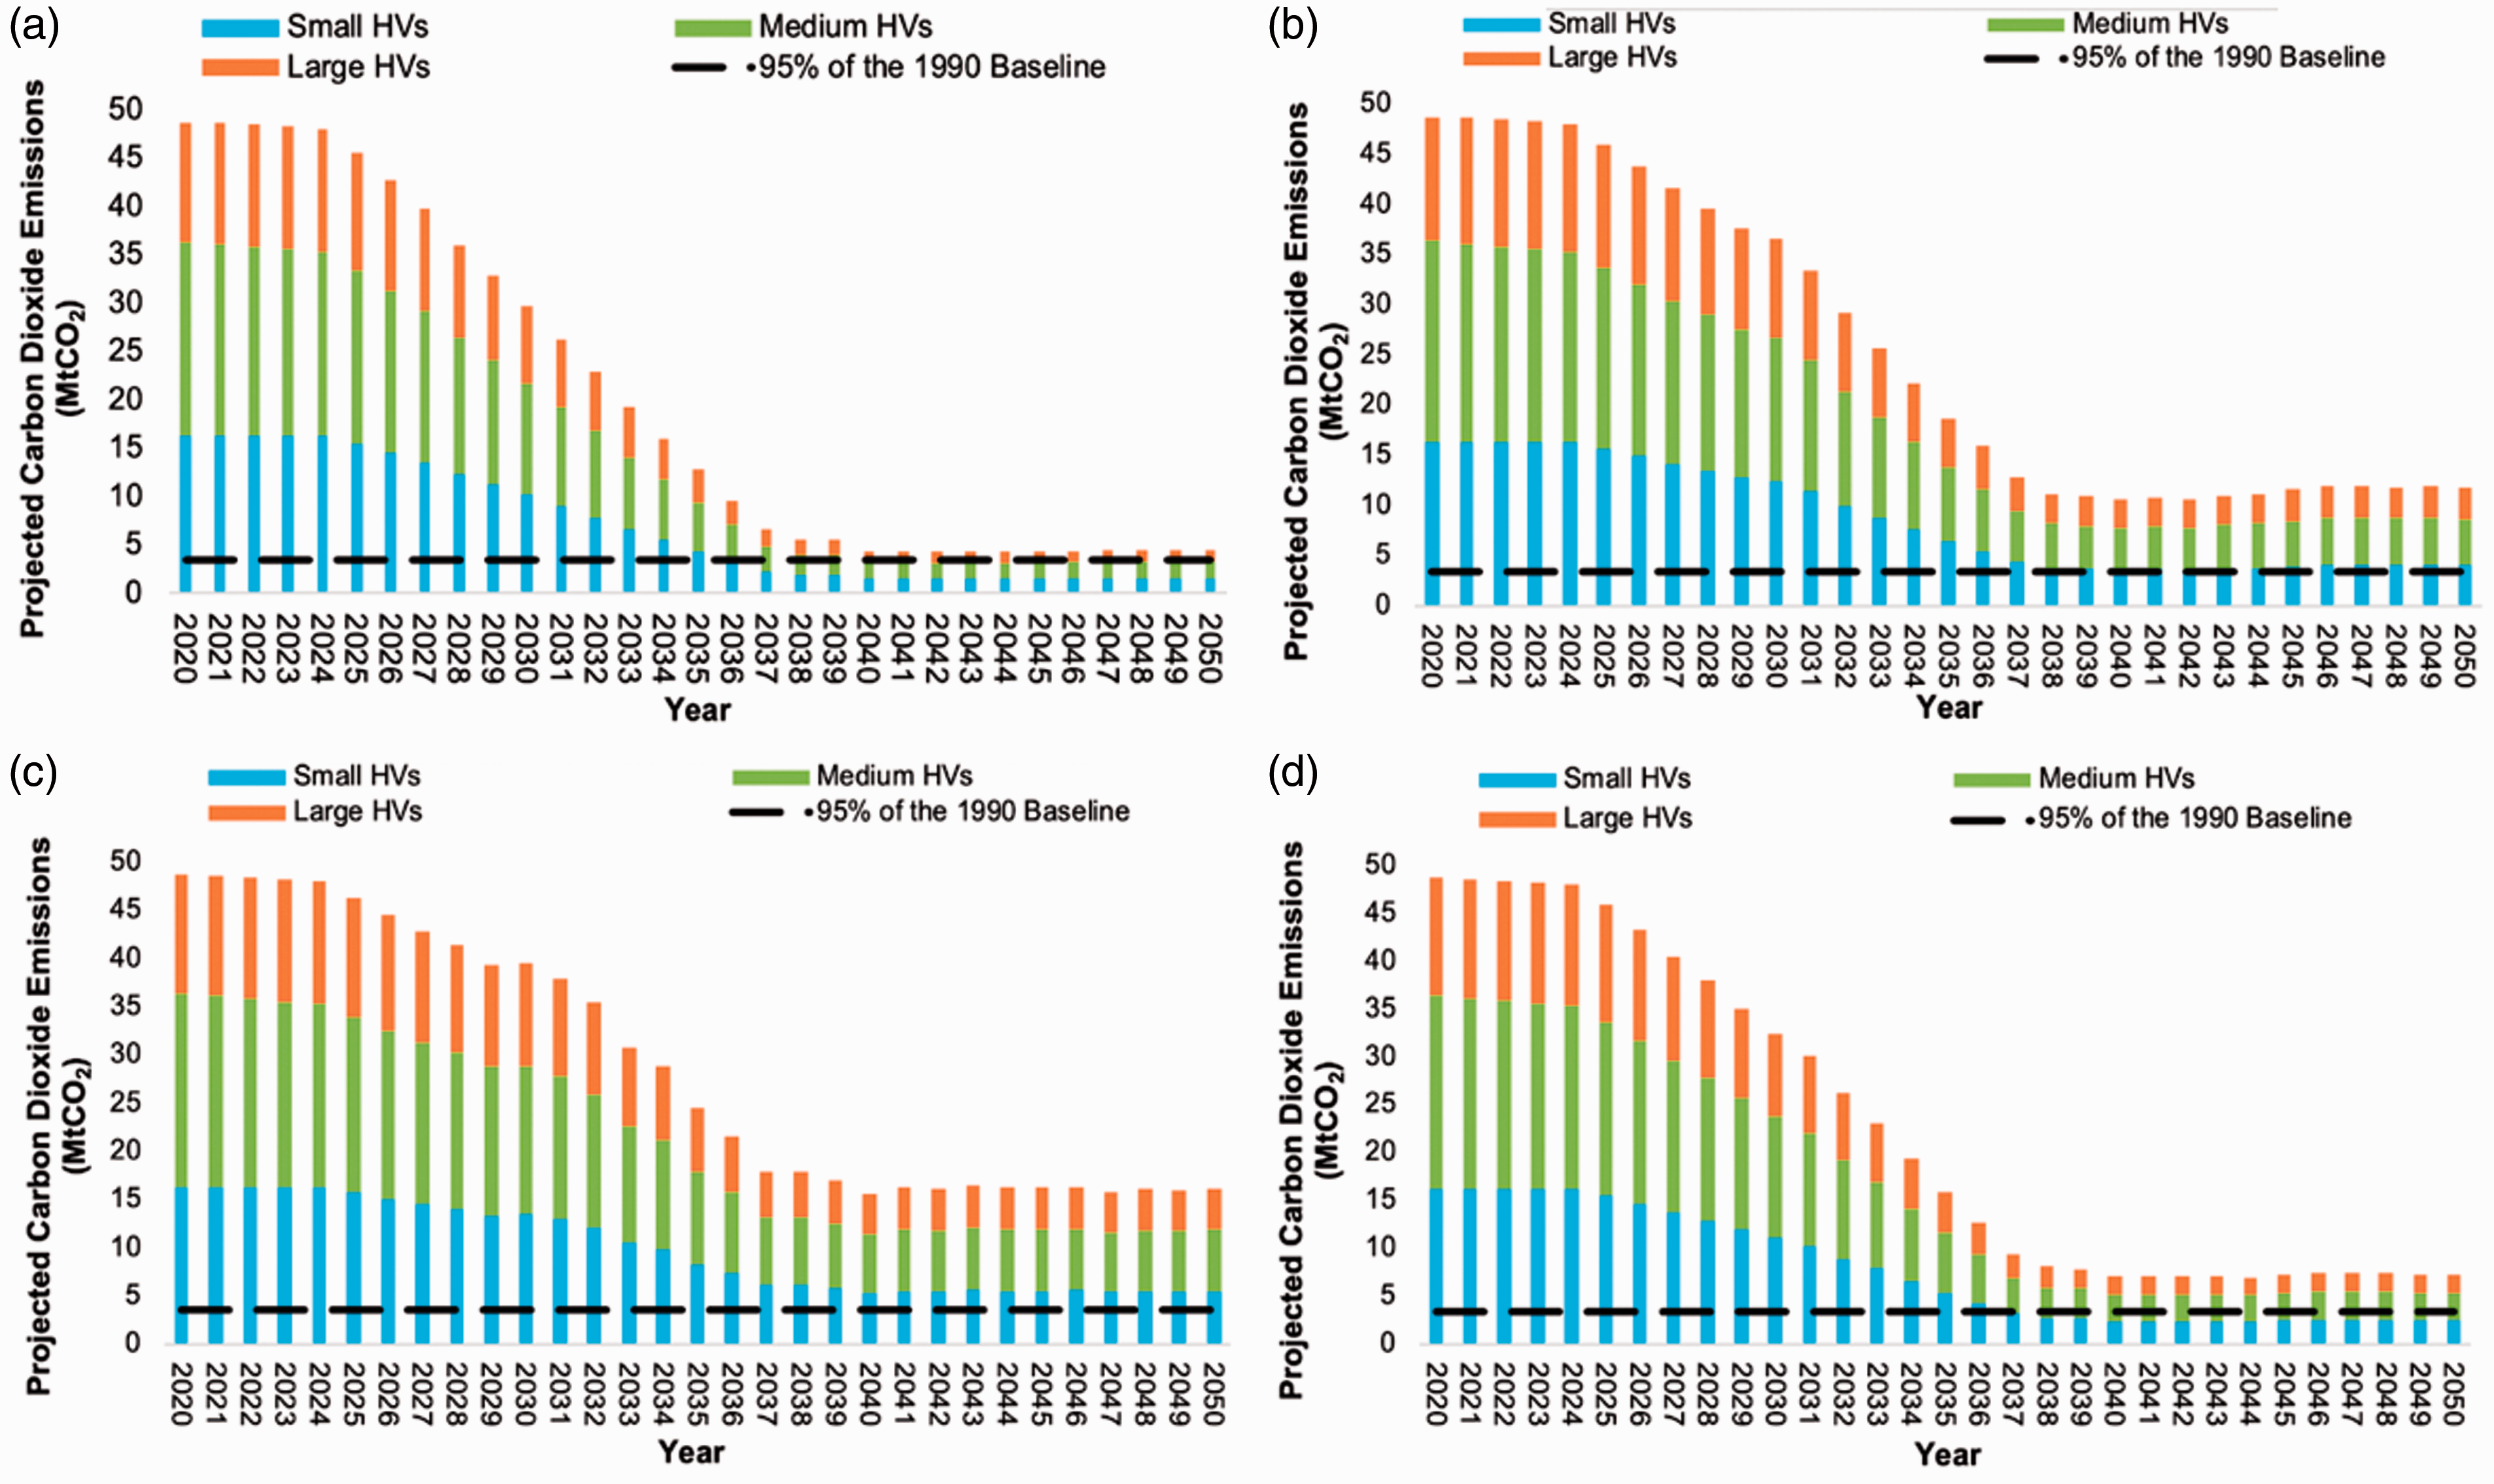
Figure 3 highlights the projected CO2 emissions from 100% hydrogen small, medium and large vehicles under the four National Grid electricity generation scenarios between 2020 and 2050 and assuming all H2 is generated by electrolysis.
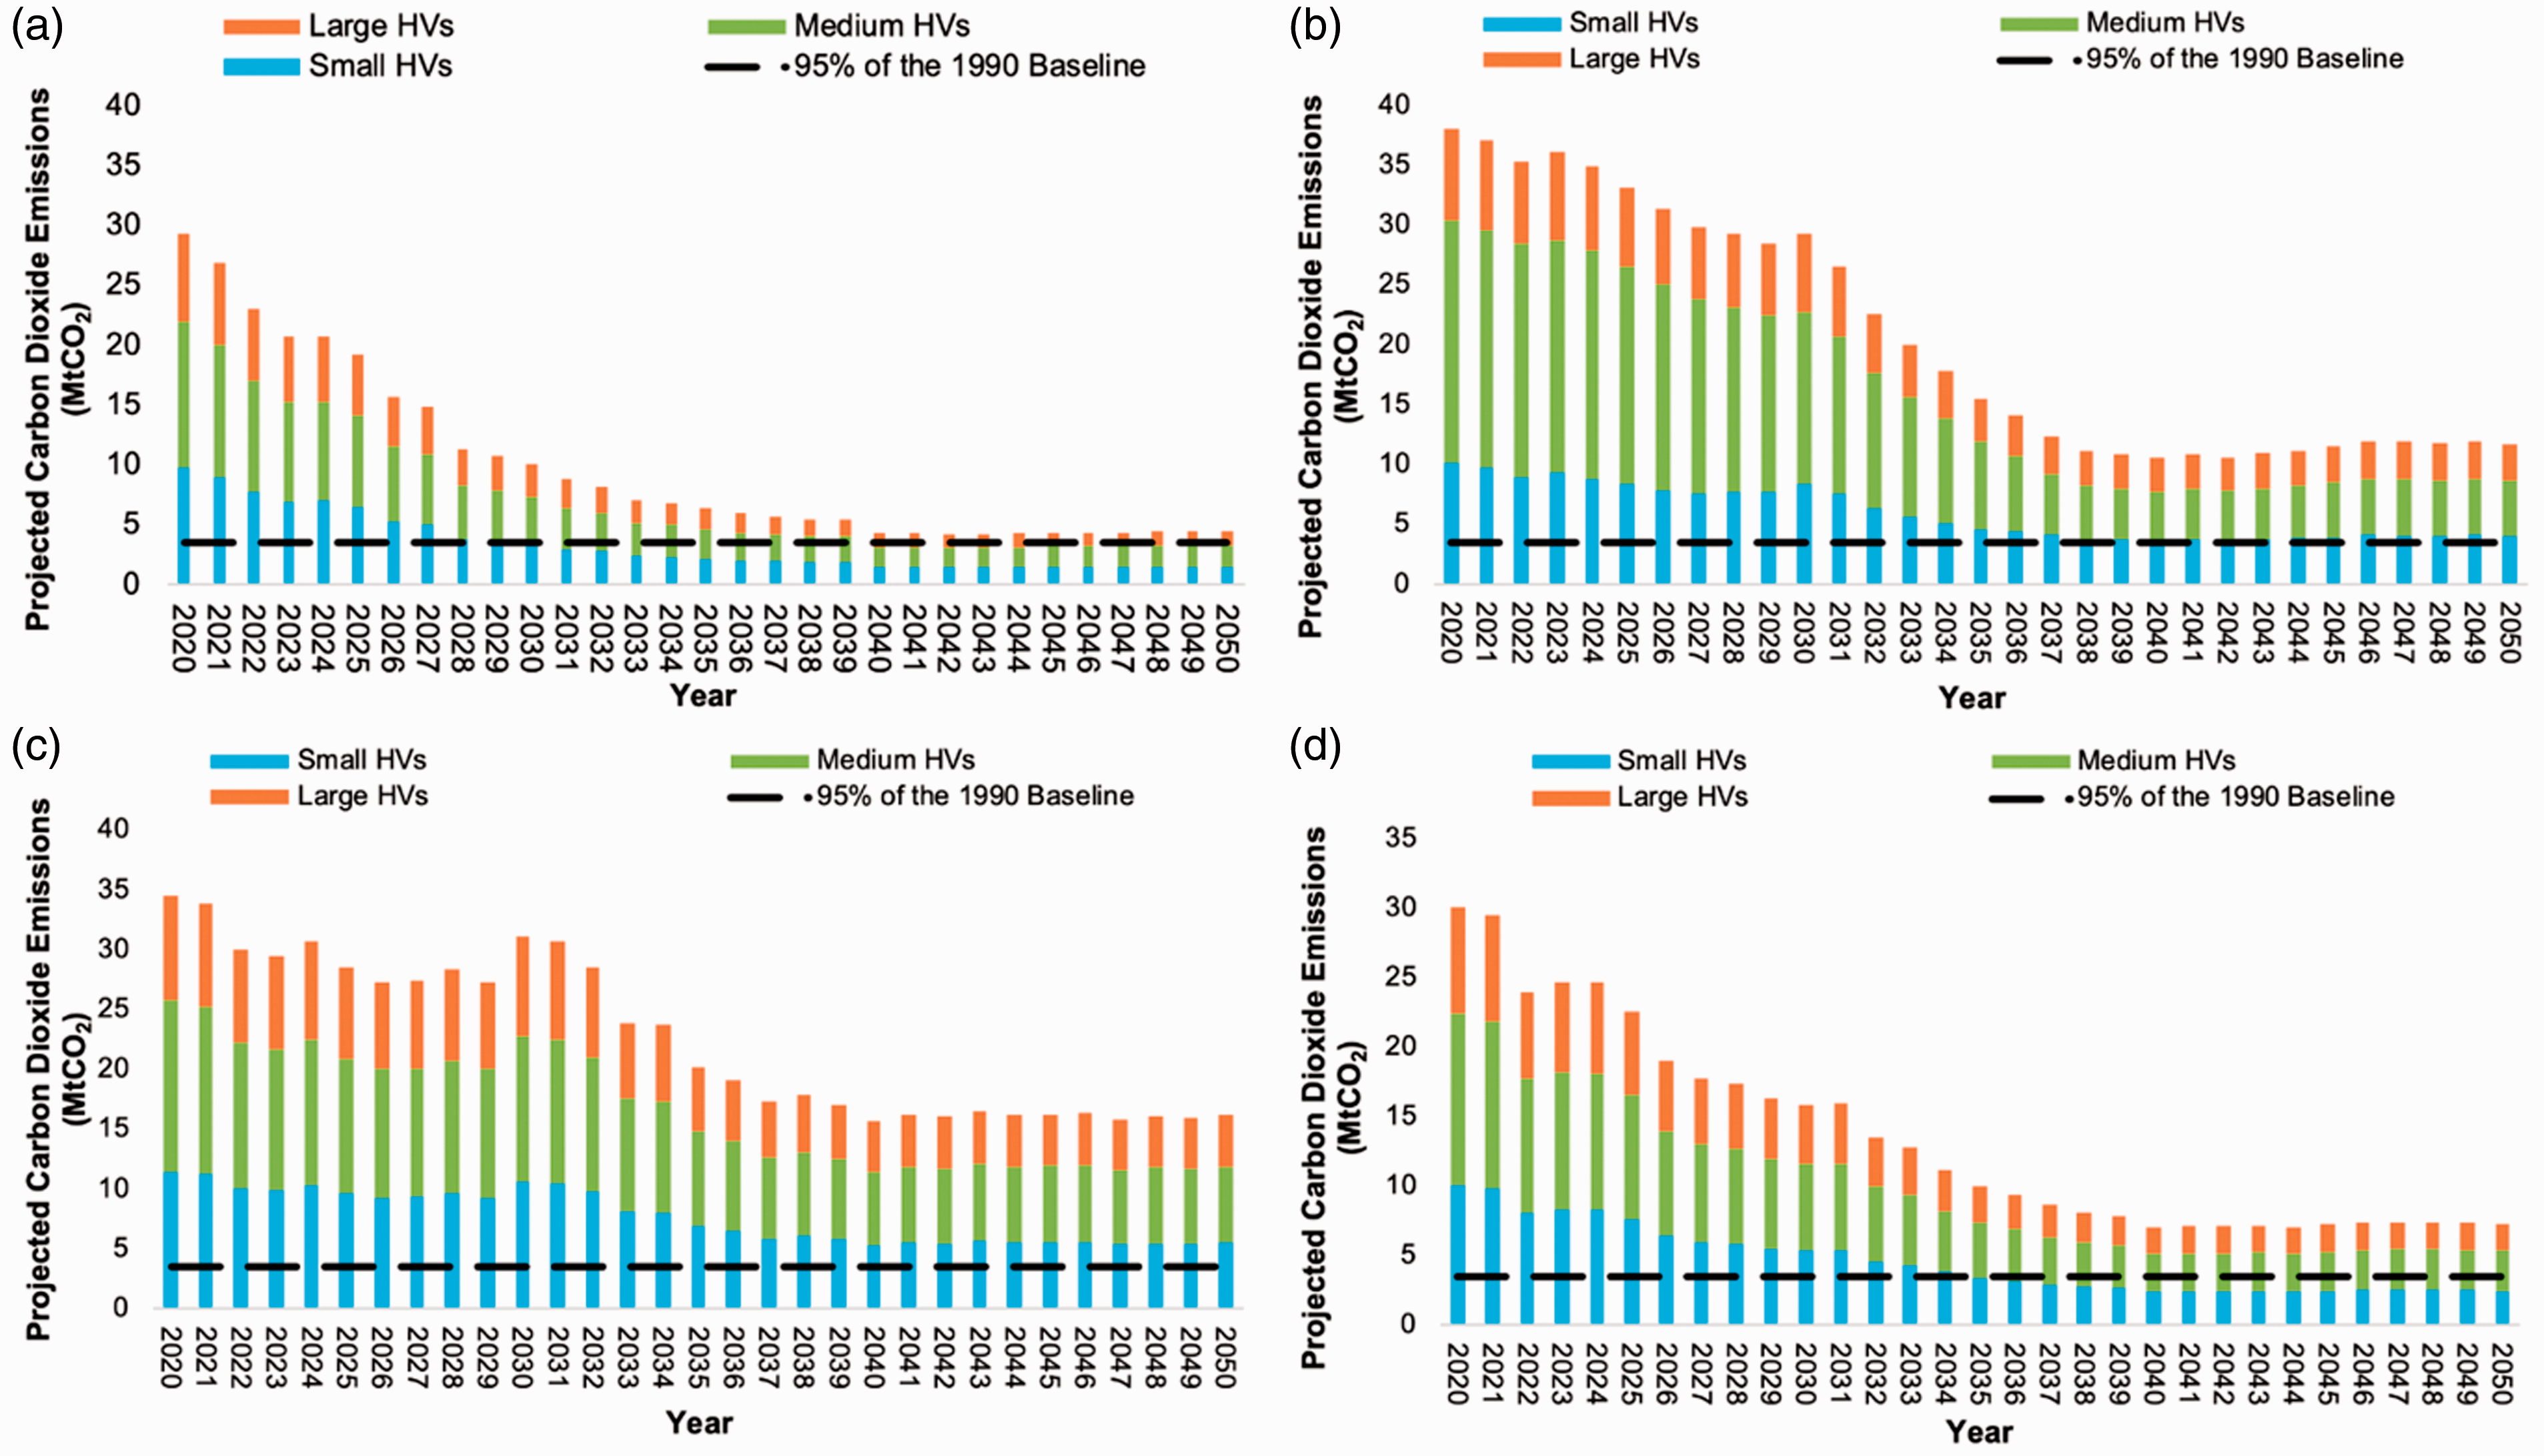
The predicted carbon dioxide emissions for 100% hydrogen vehicles in the UK based on the four electricity scenarios (a = two degrees, b = steady progression, c = consumer evolution and d = community renewables) between 2020 and 2050. The 95% baseline of the 1990 carbon dioxide emissions for UK road transport is highlighted by the black dashed line.
Results indicate that under all electricity generation scenarios the UK will struggle to meet their net zero target. Under the two degree (a) scenario, emissions would decrease by 91% from 52.9 MtCO2 to 4.5 MtCO2 within the time frame. The community renewable (d) scenario indicates the second largest decrease in emissions by 86% from 52.9 MtCO2 to 7.3 MtCO2, however would not meet net zero. Under the steady progression scenario (b), there would be a 78% reduction from 52.9 MtCO2 to 11.7 MtCO2 between 2020 and 2050. Finally, under the consumer evolution (c), emissions would reduce by 69% from 52.9 MtCO2 to 16.2 MtCO2 between 2020 and 2050. Therefore, results indicate that from 100% HVs, the UK would not meet their emission reduction targets.
Scenario 3 – Low emission vehicles integrated from 2035
This section projected the total CO2 emission from EVs integrated from 2035 (section ‘Scenario 3A – Integration of electric vehicles from 2035’) and HVs integrated from 2035 (section ‘Scenario 3B – Integration of hydrogen vehicles from 2035’) between 2020 and 2050 in the UK. This analysis falls in line with the UK’s current plan to ban the sale of all new CFVs (including vans and hybrids) by 2035.
Scenario 3A – Integration of electric vehicles from 2035
Figure 4 highlights the UK’s current policy to reduce CO2 emissions by integrating EVs from 2035. Under the two degree (A) scenario emissions are expected to decrease and meet the net zero emission reduction target. Under the consumer evolution (D), the steady progression scenario (B) and consumer evolution (C) the UK would fail to meet net zero if EVs were integrated from 2035. This therefore highlights that the electricity generation mix plays a crucial role and influences the level of operating emissions from EVs.
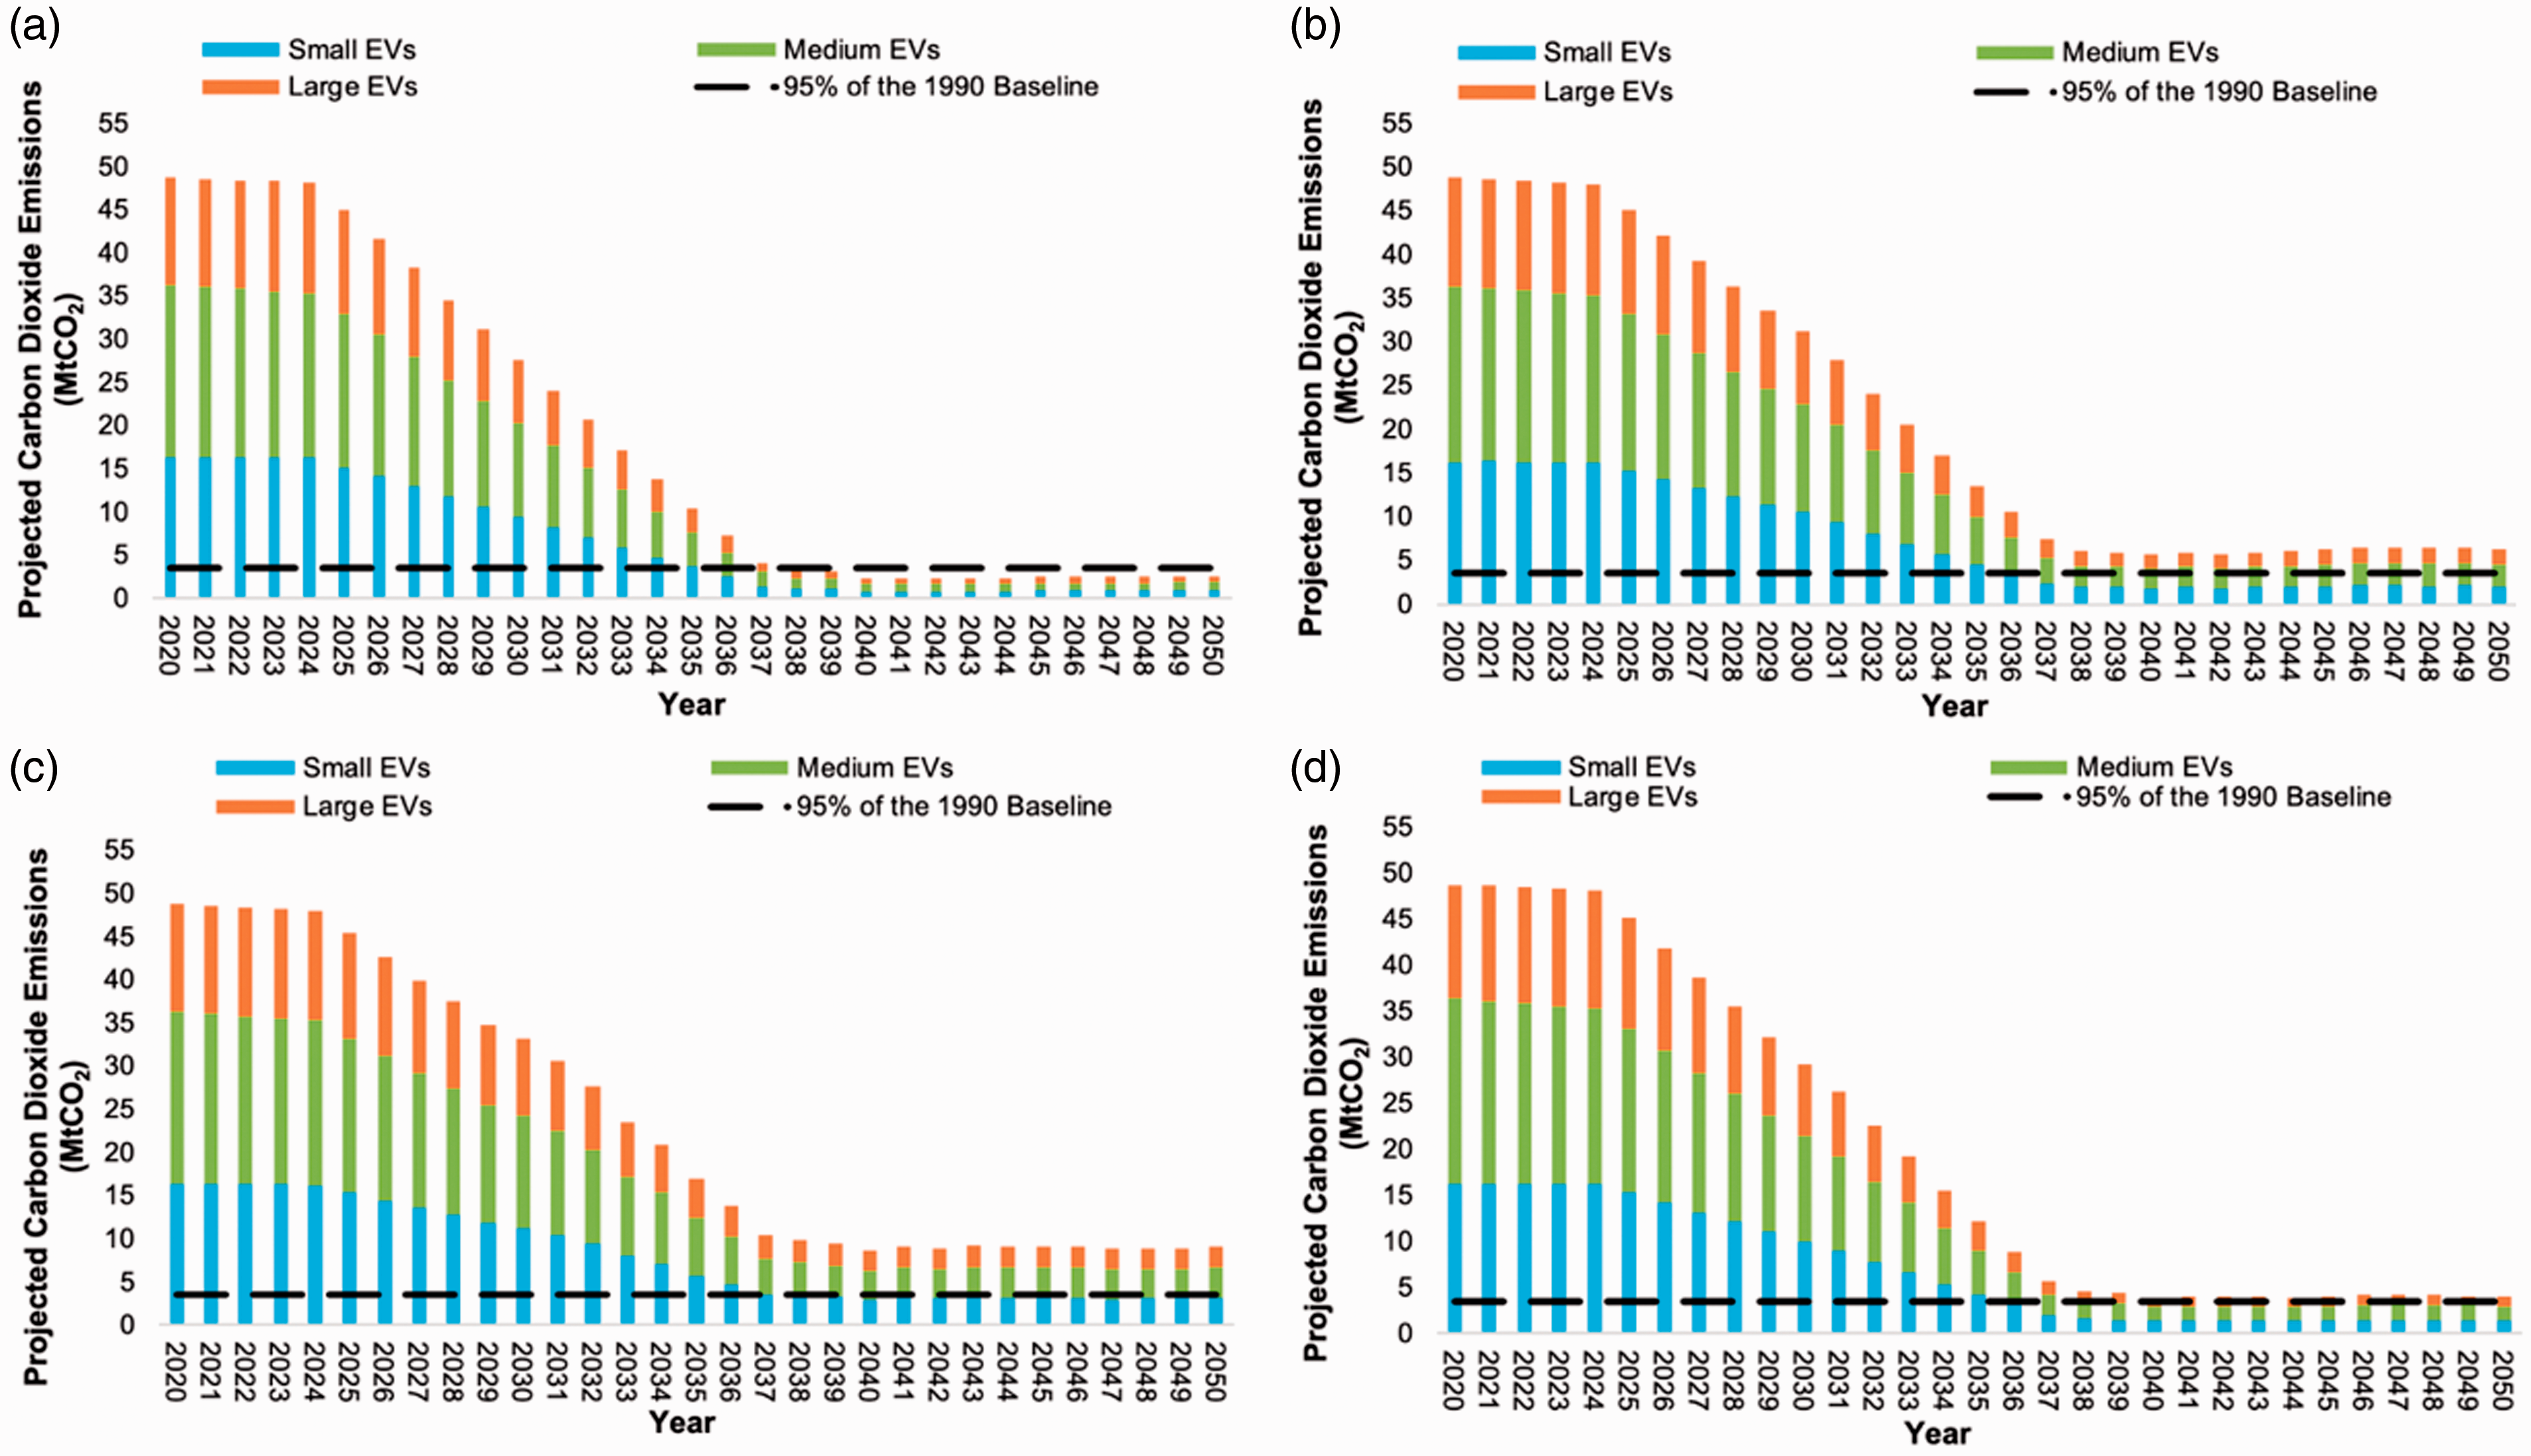
The predicted carbon dioxide emissions for electric vehicles integrated in the UK in 2035 based on the four electricity scenarios (a = two degrees, b = steady progression, c = consumer evolution and d = community renewables) between 2020 and 2050. The 95% baseline of the 1990 carbon dioxide emissions for UK road transport is highlighted by the black dashed line.
Scenario 3B – Integration of hydrogen vehicles from 2035
Figure 5 highlights the projected CO2 emissions between 2020 and 2050 under the 2035 scenario for HVs. Although there is currently no policy in place for HVs, like for EVs in the UK, HVs are considered a LEV and could be used as an alternative to CFVs as they do not produce tailpipe emissions. Therefore projected the tailpipe emissions of HVs can allow policy makers to better understand if further integration will be required in the future. Under all four electricity generation scenarios the UK would fail to meet net zero if HVs were integrated from 2035.
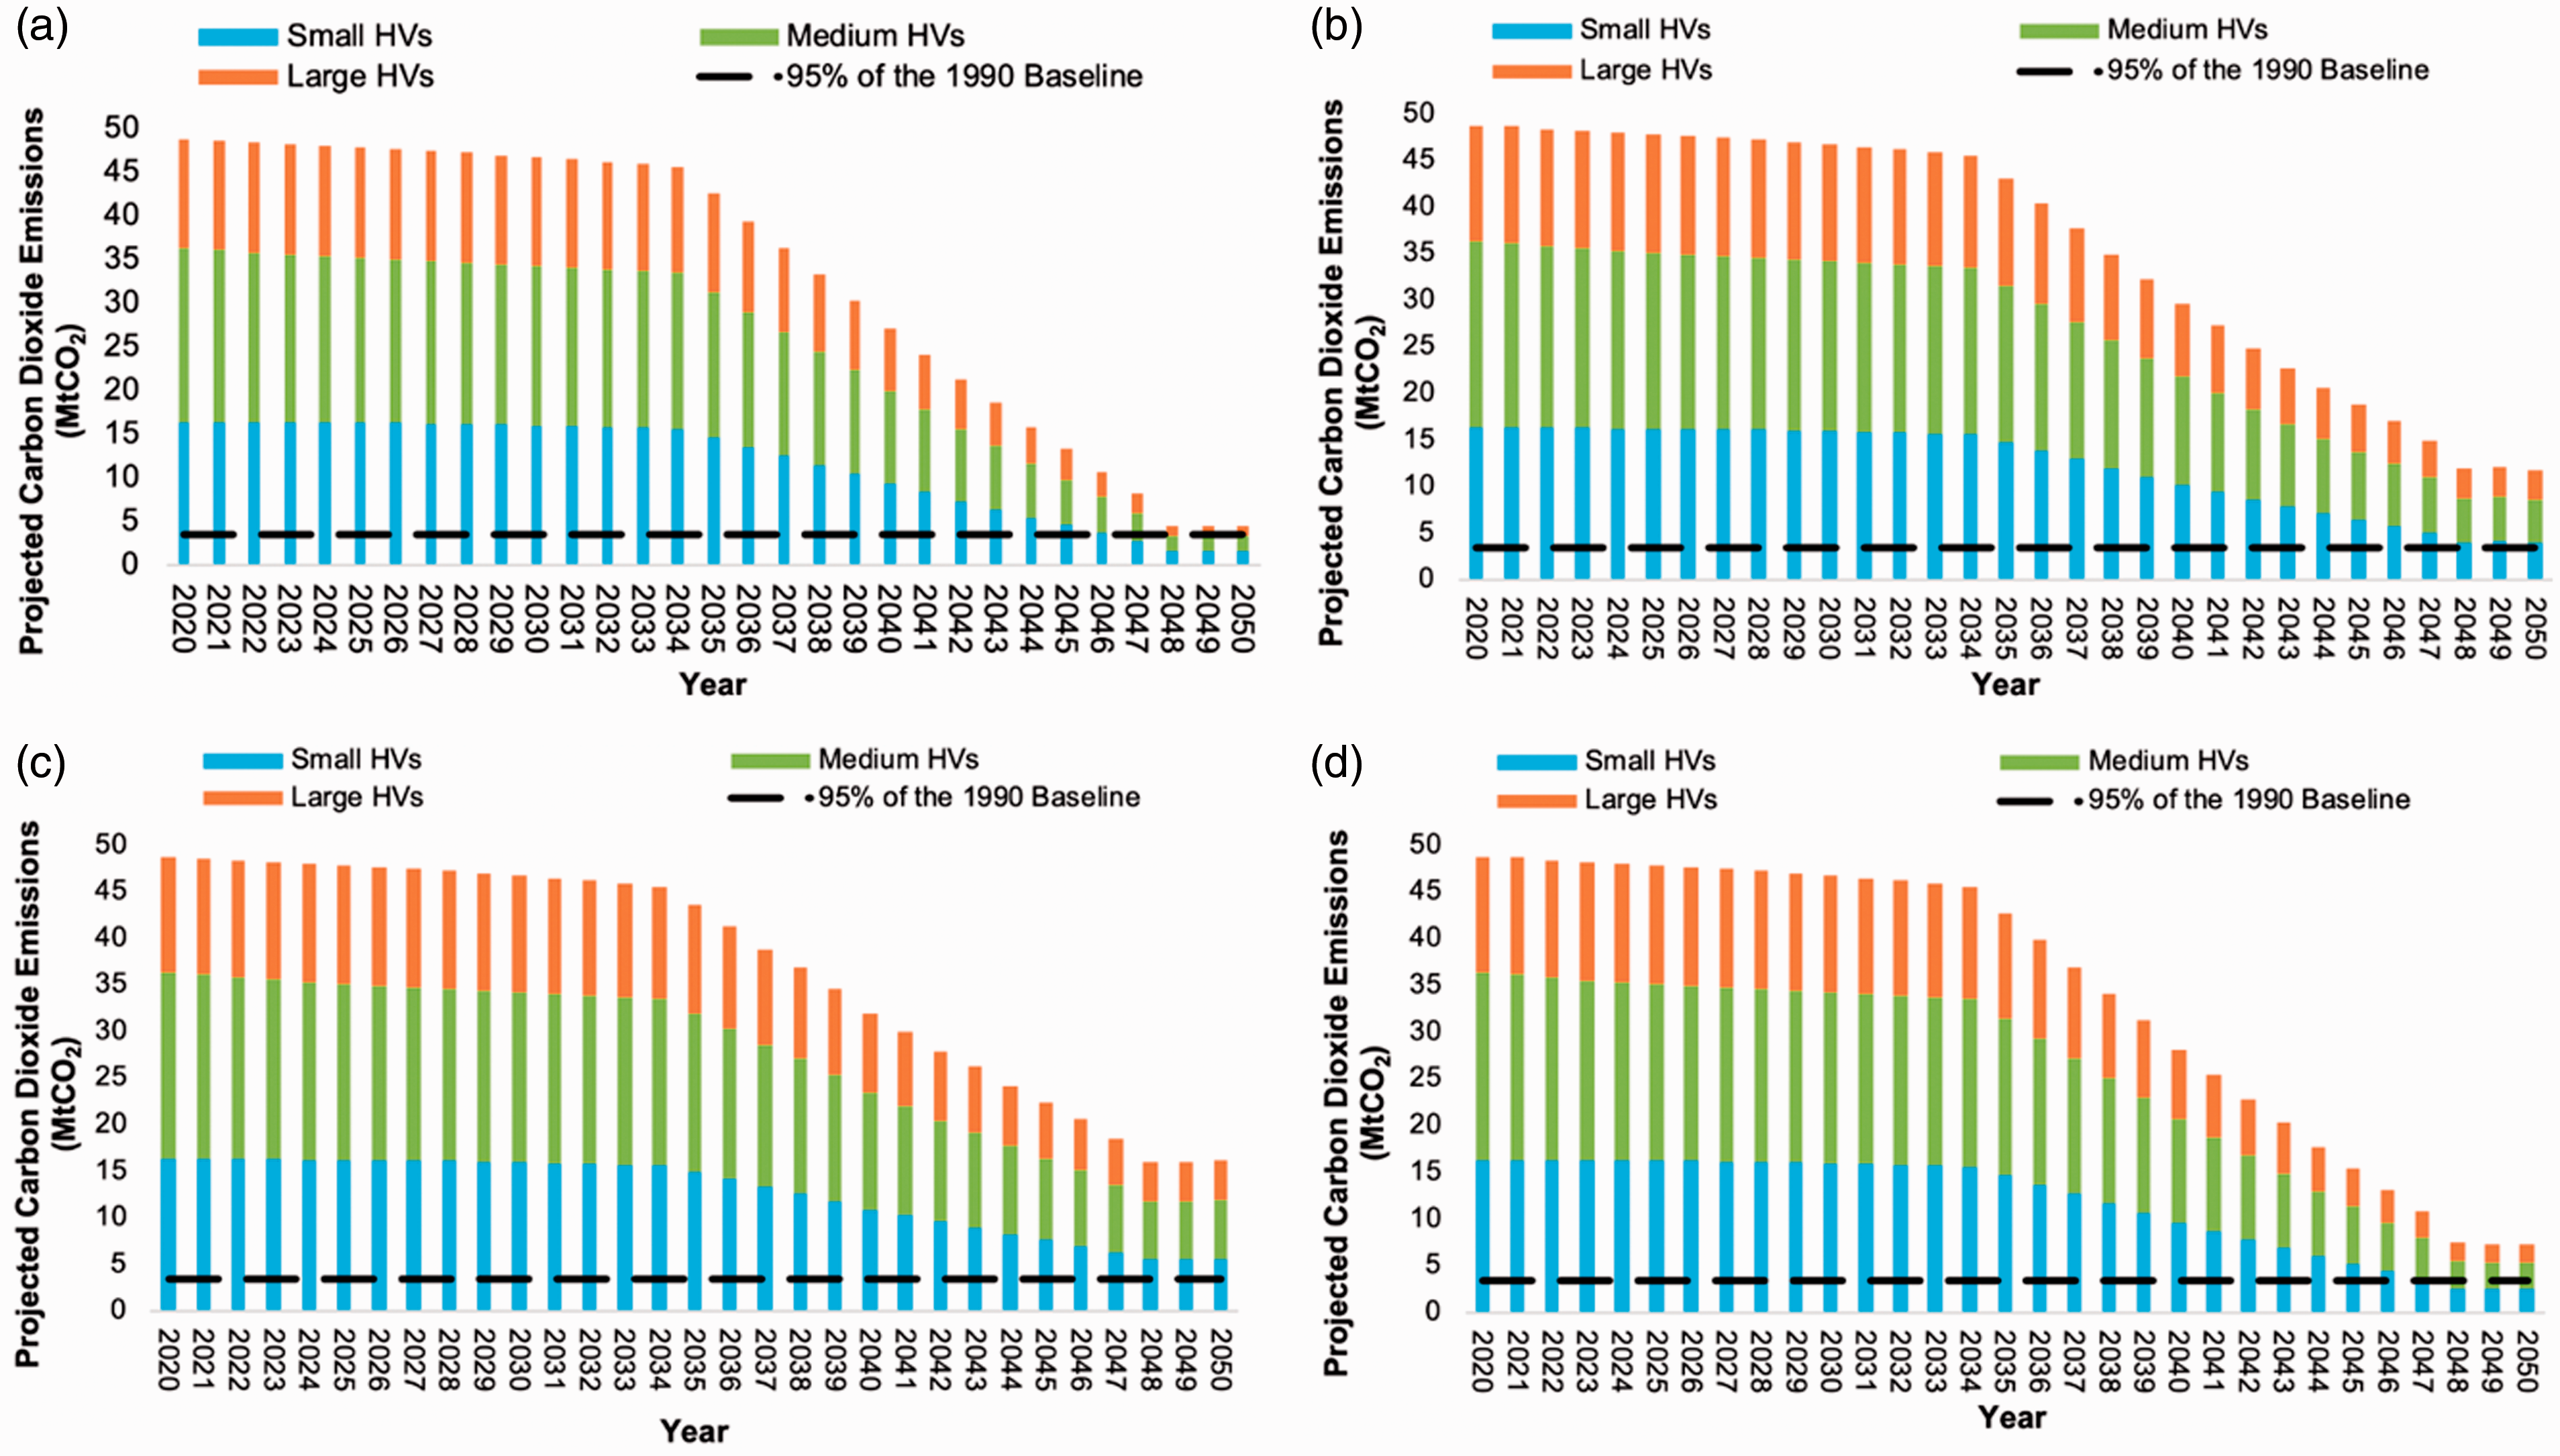
The predicted carbon dioxide emissions for hydrogen vehicles integrated in the UK in 2035 based on the four electricity scenarios (a = two degrees, b = steady progression, c = consumer evolution and d = community renewables) between 2020 and 2050. The 95% baseline of the 1990 carbon dioxide emissions for UK road transport is highlighted by the black dashed line.
Scenario 4 – Low emission vehicles integrated from 2025
This section projected the total CO2 emission from EVs integrated from 2025 (Section ‘Scenario 4A – Integration of electric vehicles in 2025’) and HVs integrated from 2025 (Section ‘Scenario 4B – Integration of hydrogen vehicles from 2025’) between 2020 and 2050 in the UK. This section analyses the emissions that could be produced if EVs/HVs are integrated 10 years ahead of the UK’s current policy.
Scenario 4A – Integration of electric vehicles in 2025
By changing the integration date of EVs from 2035 to 2025, there is a much more gradual reduction in the level of emissions produced as seen in Figure 6. It can also be seen that with an integration of EVs 10-years earlier, under the two degree scenario and the community renewables scenarios, the UK will meet their emission reduction targets. For the other two scenarios, for all vehicle sizes, the UK will struggle to meet these targets.
The predicted carbon dioxide emissions for electric vehicles integrated in the UK in 2025 based on the four electricity scenarios (a = two degrees, b = steady progression, c = consumer evolution and d = community renewables) between 2020 and 2050. The 95% baseline of the 1990 carbon dioxide emissions for UK road transport is highlighted by the black dashed line.
Furthermore, under the two degree scenario, the UK could meet their net zero emission reduction targets earlier in 2038 instead of 2048 if EVs are integrated under the 2035 scenario. Similarly, for all vehicles under the community renewable scenarios, EVs are expected to meet net zero earlier in 2035, whereas under the 2025 scenario, net zero is expected to be met in 2049.
Scenario 4B – Integration of hydrogen vehicles from 2025
Similarly, to EVs, by changing the integration date of HVs from 2035 to 2025, there is a much earlier reduction in the level of emissions produced as seen in Figure 7. It can also be seen that with an integration of HVs 10-years earlier, the UK still will not meet their emission reduction targets.
The predicted carbon dioxide emissions for hydrogen vehicles integrated in the UK in 2025 based on the four electricity scenarios (a = two degrees, b = steady progression, c = consumer evolution and d = community renewables) between 2020 and 2050. The 95% baseline of the 1990 carbon dioxide emissions for UK road transport is highlighted by the black dashed line.
Cumulative emissions
Results indicate that between 2020 and 2050, the cumulative emissions of CFVs were 1544.9 MtCO2. Table 4 displays the cumulative emissions for both EVs and HVs under each of the electricity generation scenarios and integration years.
Cumulative emissions for 100% electric vehicles, electric vehicles integrated from 2025 and electric vehicles integrated from 2035 under all four electricity generation scenarios between 2020 and 2050.
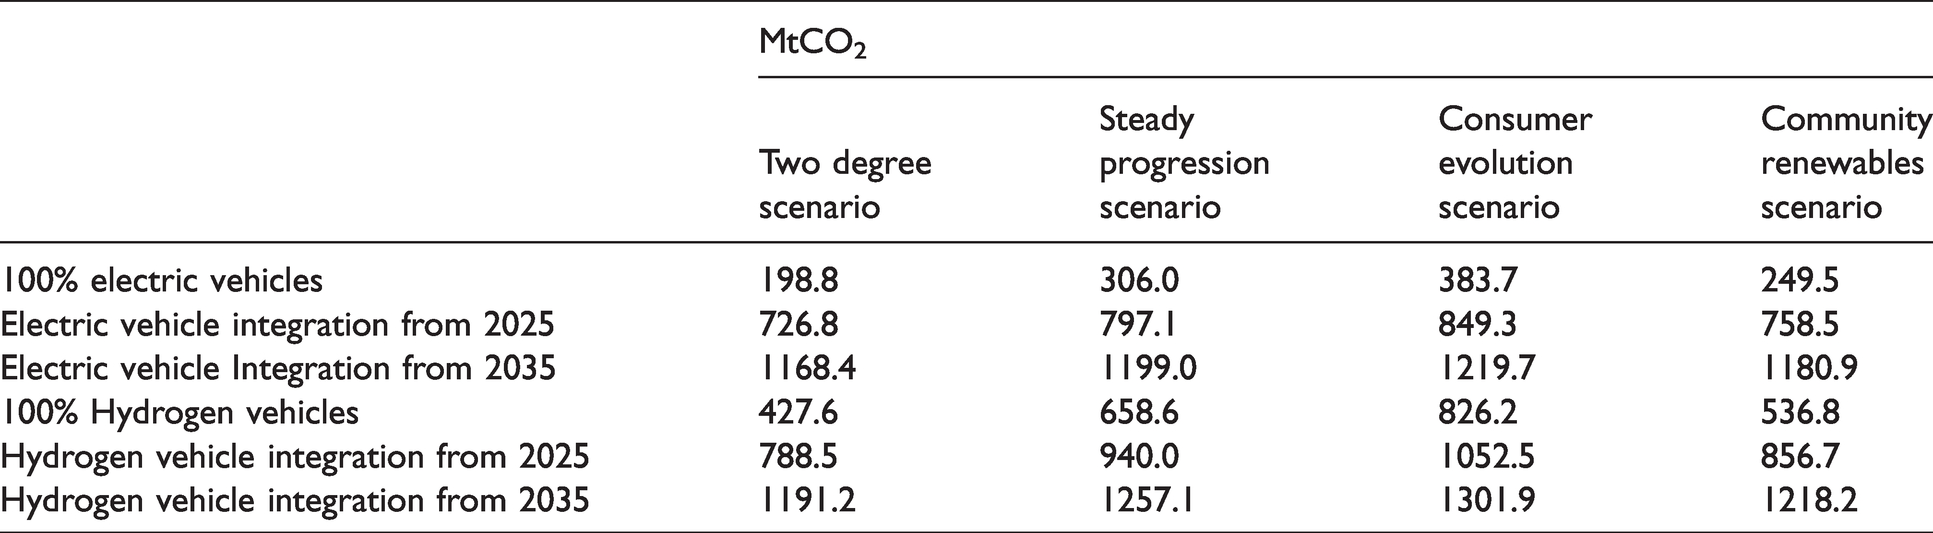
Results indicate that a fleet of 100% EVs produced the lowest level of cumulative emissions, with the two degree scenario producing the lowest level of emissions. EVs integrated from 2025 produced lower emissions than from when EVs were integrated from 2035. Similarly, for HVs the lowest level of cumulative emissions was for 100% HVs under the two degree scenario. Furthermore, integrating HVs at the earlier date of 2025 resulted in a decrease in the cumulative emissions produced.
This shows the importance of introducing EVs and HVs, along-side decarbonising electricity generation as soon as possible if the UK wants to meet its emission reduction objectives
Discussion
Results from the analysis presented indicate that even with technological advances, emissions from CFVs will not meet net zero emission targets within the required time frame. Therefore, as highlighted in Sections ‘Scenario 2 – 100% low emission vehicles’, ‘Scenario 3 – Low emission vehicles integrated from 2035’, ‘Scenario 4 – Low emission vehicles integrated from 2025’ and ‘Cumulative emissions’, integrating EVs and HVs into the vehicle fleet will be required if the UK wants to meet their targets, with Section ‘Scenario 3 – Low emission vehicles integrated from 2035’ highlighting the importance of earlier EVs and HVs integration to achieve a decrease in cumulative emissions (Section ‘Cumulative emissions’). Results also highlight that it is only under the two degree and community renewables scenarios that EVs would successfully meet their net zero emission reduction target. HVs alone would be unable to meet net zero emission reduction targets, however emissions remained significantly lower than CFVs suggesting they are still a useful alternative for some transport types and requirements (i.e. long-distance travel in rural areas).
HVs offer an alternative to EVs generally limited range (reducing ‘range anxiety’) and long charging times 59 but there are significantly higher capital costs. 60 Despite HVs becoming commercially available, HV technology remains several years behind EV technology with only limited HVs available. 61 Furthermore, from an economic stance, EVs currently dominate the market because they are more cost competitive to ICEVs than HVs. 62 Similarly, to electric transport, there remains the ‘chicken and egg’ scenario as consumer demands for hydrogen remain low and are often not considered economically feasible to build large-scale hydrogen fuelling stations. 63 Therefore, integration will require significant nationwide infrastructure requirements to ensure market progression. 60,47 In contrast, EVs are relatively mature in terms of lower capital and operating costs with infrastructure more readily available to the public. 61
Another factor to future relevant emissions, noted by Metz (2013), is that personal daily travel, particularly by CFVs has ceased to grow within developed economies. 64 It’s been suggested this can be attributed to the saturation of demand for the benefits CFV travel gives, increased access to good mass transit and choice combined with constraints on higher speeds. 64 Several of these factors are likely to fluctuate dependant on societal circumstances. Therefore, over the past decades there has been a switch away from the continuous growth of per capita travel towards stability which means that the future total travel demand will be more strongly influenced by demographics like population growth. With the population growth decreasing, total distance travelled by car in developed economies would therefore be expected to decrease. Therefore with this decrease on the distance travelled, focus should be placed on decarbonising the energy generation mix since any improvements on this will have a direct effect in reducing transport emissions. Although EVs could be considered the more ‘environmentally friendly’ option, especially within shorter travel distances, it is likely that a mix of both EVs and HVs will be required as the UK transitions to net zero.
For analysis within this study we focused on reducing operating emissions as this is the current focus of transport specific EU policy. By reducing the tailpipe emissions of EVs and HVs, the environmental impact of the vehicle will also reduce and, in turn, the LCA emissions of the vehicle. Taking a simpler approach to reducing emissions such as the method used here enables a straightforward comparison between different countries and vehicle types. Other methodologies including the Long-range Energy Alternatives Planning System (LEAP) and the TEAM-UK model were considered as these both analyse energy, policy and climate change mitigation assessments through a LCA approach.10,65 However, an LCA approach needs to take into consideration a multitude of factors including energy generation mix, land use, GDP, transport demands, and population dynamics etc. and therefore needs extensive data to be able to run effectively and give realistic outputs. More complex models will also be influenced by many other factors that are less important to emissions estimations.
Similar studies have been conducted across Europe to ensure countries stay in line within their vehicle reduction commitments, but also on a global scale.66–68 Our simplified approach provides an intermediary between fine-scale, car or city specific traffic emission and density data models66,67 and larger scale LCAs with applications for national assessments. Similar models for national assessments 68 do not in compass CFVs, EVs and HVs under the one model which limits direct comparisons. These models enable emission estimates beyond the CO2 emissions targeted within our method (e.g. nitrogen oxides, ammonia and particulates), which is additionally useful for informing a LCA approach if modellers or countries desire one to be developed. The simpler method targeting emission questions proposed in this study enables more rapid assessment to inform policy, such as assessing the benefits of bringing forward CFV sale bans.
As with all methods used to assess emissions from transport, there are limitations within our method. We have taken the precautionary approach in using upper end estimates of energy efficiencies across all vehicle sizes which, while perhaps overestimating the EV emissions output, gives a more comparable output between EV and HVs. This over estimation is at most 10% above the average (based on figures for the top selling cars in each size category (BMW i3, 19.8 kWh 100 km−1 and Hyundai Ioniq, 19.3 kWh 100 km−1).69,70 However the value used may better reflect actual vehicle performance on the road and rather than the often optimistic EU mandated test criteria. This choice is unlikely to change the overall message regarding generation scenario outcomes, with scenarios B and C remaining above the net zero target after a reduction of 10% (Figures 4 to 7). Previous studies have suggested sensitivities of vehicle emission models to scrappage and vehicle lifetime values. As our approach focuses on operating emissions, these parameters are not directly within the model however the expected numbers of cars in use across the study timeframe was obtained from TEAM-UK which incorporates these parameters. It is out with the scope of this study to test this sensitivity however discussions of the TEAM-UK model are available here. 10
We would expect our model to be the most sensitive to the energy efficiency per distance travelled as this is a key parameter that the energy requirements and therefore emissions are based upon. Due to the relatively new status of LEVs ‘real world’ efficiency values are not available and therefore the values presented here are from test conditions. While test conditions are often the benchmark to compare vehicles, their realism is sometimes questioned. For example, the (so-called) ‘dieselgate’ emissions scandal assessed the increasing divergence between ‘real world’ and ‘official’ energy use and air pollutant emissions of road vehicles. 71–74 The ‘official’ CO2 vehicle emission ratings have previously been shown to be misleading for European passenger cars and commercial vehicles, with ‘real world’ emissions shown to be almost a third higher than their official values and standards operating in the EU.71,74–77 The difference between ‘official’ and ‘real world’ emissions is due to EU type-approval process for light-duty vehicle and actual driving conditions and practices. 74 There has been increasing evidence that fuel consumption improvements originate from test-orientated optimisations and practices rather than optimizing operating fuel saving technologies.78,79 Additionally, efficiencies of fuel burn or energy consumption may change over time with the effect of aging parts on LEVs, especially HVs, largely unknown. This would lead to greater variance away from the testing values and increases in emissions above the predicted. Therefore, when estimating tailpipe emissions from vehicles, differences between ‘real’ world and ‘official’ emissions need to be considered to give a true representation of emissions produced.
Although the R2Z strategy has been updated with the integration dates of EVs brought forward to 2035, there remains a lot of ambiguity within this startegy. 80 For example, the R2Z does not address future policy issues such as whether the UK intends to remain part of the EU framework for emission standards upon leaving the EU, meaning whether the UK will keep in line with current tailpipe emission reduction targets to meet their net zero targets or takes a different approach is unknown.
In addition, the UK’s amended target of banning the sale of new CFV and hybrid cars and vans from 2035, applies to the purchase of new vehicles and does not take into consideration CFVs that are currently in use or that will be purchased before this ban. For example, in 2015 the average age of a car at scrappage was ∼13.9 years, with the average vehicle on the roads ∼7.8 years old; therefore any vehicle purchased in 2035 could remain on the roads until ∼2049 or ∼2043 respectively. 54 These vehicle ages reflect both the slower fleet renewal and the increased longevity of vehicles, and work against the environmental benefits of newer vehicles. This will result in the UK’s net zero emission target under the Paris Agreement, being difficult to achieve.
The R2Z stipulates that all new homes will have mandatory charging facilities, however it fails to mention what will happen for current homes and residencies where housing density means providing sufficient charging facilities may be difficult, such as blocks of flats. 18 It also fails to mention the maintenance of grants and potential reforms to tax vehicles. These coupled with more practical societal concerns regarding LEVs means that successful implementation of low carbon road transport will face challenges but that there are opportunities to avoid if introduction is set up correctly. Issues regarding public charging facilities (i.e. located at an individual’s place of work or in key areas such as city centres, shopping centres or libraries etc.) also need to be more explicitly thought out.
With mandatory charging facilities for all homes, there appears a lack of published details on the integration of R2Z and emission reduction requirements with National Grid and peak demand management. The results indicate that only under the two degree and community renewables scenarios will the UK be successful at meeting net zero emission targets for both EVs and HVs. Therefore, ensuring that the National Grid can meet the additional energy demand during peak times from low carbon energy will be necessary for this to be successful. One possibility to manage behaviour at the consumer level would be through financial incentives for individuals to charge their vehicles during certain times of the day to allow system wide management. Although this study does not consider the socioeconomic influences of individuals behaviour, including how cars are bought, sold, accessed and utilised, with these factors important to consider in terms of integration rate and both the vehicle and consumer life cycle. Socioeconomic consideration and policies are essential to accelerate switching towards alternatively fuelled vehicles and effective energy system usage.
This study focussed on the tailpipe emissions produced from CFVs, EVs and HVs in the UK between 2020 and 2050. By focusing on reducing the tailpipe emissions, the life cycle of a vehicle will also decrease as the majority of life time emissions come from the operating phase.81,82 This study did not consider the embedded carbon costs of manufacturing and scrappage of vehicles. The average vehicle life expectancy is ∼13.9 years, however, early scrappage will increase the yearly equivalent of embedded carbon, an effective increase in emissions per vehicle. Similarly, batteries used within EVs will have a shorter life expectancy than the vehicle itself so there will also be a need for battery replacement. This should be taken into consideration when conducting a full LCA of EVs. A full LCA like this would also need to quantify the emissions impact of new mines for lithium cobalt and copper that will be required for batteries, Similar additional materials will be required for HV fuel cells that would increase LCA carbon intensity.
If the UK is going to succeed at reducing road transport emissions to meet their net zero targets, a modal shift towards public transport may also be necessary as per person per kilometre travelled, emission levels from buses and trains remained lower than both CFVs and EVs.28,29 In this context the implementation of travel demand management (TDM) initiatives which are a set of push and pull measures to encourage sustainable travel, is relevant. 81 For example, the introduction of ultra-low emission zones to exclude use by vehicles that do not meet emission standards, whilst also favouring low emission public transport. These zones have already been implemented in London, Birmingham and Glasgow with plans for expansion in other major cities where private vehicles who do not meet the standards, need to pay to enter these zones. Similarly, allowing private vehicles to drive in bus lanes in car-share schemes with minimum limits on occupancy (most private vehicles have ∼1.6 individuals at a time) can reduce congestion. 82
To achieve the greatest reduction in tailpipe emissions from EVs and HVs, priority needs to be placed on decarbonising the electricity generation mix. Although the UK is transitioning away from fossil fuels, this will take time and as demand for energy increases with the implementation of low carbon transport, additional energy will need to be generated. At present, renewable technologies are not capable of meeting the UK per capita energy demand due to the large areas of land or water required and it will be necessary to invest in alternatives such as offshore wind and tidal energy. To reduce emissions as far as possible, and ensure energy security, the introduction of CCS technologies would allow emissions to be reduced during this transition. Through the introduction of CCS, residual non-renewable industrial sources of CO2 can also be reduced. Without CCS, emissions generated in the energy sector will be released into the atmosphere.
Conclusions
Results from this study indicate that if the UK wants to meet its emission reduction targets of net zero, integration of low carbon transport needs to happen as soon as possible. This will also allow the UK to reduce its cumulative emissions from road transport. Although results indicate that EVs produced the lowest level of tailpipe emissions, HVs are not currently at the same technological level and require more energy, thus producing more emissions; however they have the ability to reduce range anxiety from many consumers.
If the UK wants to meet its net zero emission target from EVs and HV, focus needs placed on the energy generation mix. The results indicate that only under the two degree and community renewables scenarios will the UK be successful in achieving emission reduction targets. Therefore decarbonisation of the electricity sector, whilst incorporating the use of CCS during this transition is required.
The UK Government also needs to encourage the use of sustainable public transport including electric and hydrogen buses and trains and discourage personal vehicles use. Although EVs and HVs will reduce the current level of car emissions, a substantial reduction is still required as per person per kilometre travelled emissions on public transport remain an order of magnitude lower. The change in behaviour due to COVID-19 and the discovery that the economy can function well by a large percentage of home working may also work towards reducing travel demand post COVID-19.
Supplemental Material
sj-pdf-1-pia-10.1177_09576509211015472 - Supplemental material for Low emission vehicle integration: Will National Grid electricity generation mix meet UK net zero?
Supplemental material, sj-pdf-1-pia-10.1177_09576509211015472 for Low emission vehicle integration: Will National Grid electricity generation mix meet UK net zero? by Kathryn G. Logan, John D. Nelson and Astley Hastings in Proceedings of the Institution of Mechanical Engineers, Part A: Journal of Power and Energy
Footnotes
Acknowledgements
This research was undertaken as part of the UK Energy Research Centre (UKERC) research programme under the ADdressing the Valuation of Energy and Nature Together (ADVENT) project. The authors would also like to thank Dr Christian Brand, University of Oxford, for giving them access to the Transport Energy and Air Pollution Model UK (TEAM - UK).
Declaration of Conflicting Interests
The author(s) declared no potential conflicts of interest with respect to the research, authorship, and/or publication of this article.
Funding
The author(s) disclosed receipt of the following financial support for the research, authorship, and/or publication of this article: This work was supported by the School of Biological Sciences at the University of Aberdeen, UK and the Natural Environment Research Council (grant number: NE/M019691/1).
Ethical approval/patient consent
This article does not contain any studies with human participants or animals performed by any of the authors.
Author contributions
The authors confirm contribution to the paper as follows: study design, data collection and analysis was completed by KGL. AH contributed to the design of the study and checked through the results of analysis. KGL wrote the manuscript with support from AH and JDN. All authors reviewed the results and approved the final version of the manuscript.
Supplemental material
Supplemental material for this article is available online.
References
Supplementary Material
Please find the following supplemental material available below.
For Open Access articles published under a Creative Commons License, all supplemental material carries the same license as the article it is associated with.
For non-Open Access articles published, all supplemental material carries a non-exclusive license, and permission requests for re-use of supplemental material or any part of supplemental material shall be sent directly to the copyright owner as specified in the copyright notice associated with the article.