
Abstract
Increasing the gas temperature at the inlet to the high pressure turbine of gas turbine engines is known as a proven method to increase the efficiency of these engines. However, this will expose the blades’ surface to very high heat load and thermal damages. In the case of the un-shrouded turbine blades, the blade tip will be exposed to a significant thermal load due to the developed leakage flows in the tip gap, this leads to in-service burnout which degrades the blade tip and shortens its operational life. This paper studies the in-service burnout effect of the transonic tip flows over a cavity tip which is a configuration commonly used to reduce the tip leakage flows. This investigation is carried out experimentally within a transonic wind tunnel and computationally using steady and unsteady Reynolds Averaged Navier Stokes approaches. Various flow measurements are established and different flow behaviour including separation bubbles, shockwave development and distinct flow interactions are captured and discussed. It is found that when the tip is exposed to the in-service burnout, leakage flow behaves in a significantly different way. In addition, the effective tip gap becomes much larger and allows higher leakage mass flow rate in comparison to the sharp-edge tip (i.e. a tip at the beginning of its operational life). The tip leakage losses are found much higher for the round-edge cavity tip (i.e. a tip exposed to burn-out effect). Experimental and computational flow visualisations, surface pressure measurements and discharge coefficient variation are given and analysed for several pressure ratios across the tip gap.
Keywords
Introduction
The gas temperature at the inlet of the high pressure turbine is considered as a significantly effective factor in increasing the efficiency of gas turbine engines. As the inlet temperature increases the turbine’s output power does the same. However, this increase is associated with some drawbacks since it results in high heat load transfer onto the blades surface and consequently causes considerable thermal damage to the blades and shorten their operational life. Therefore, appropriate cooling techniques must be used in order to reduce the thermal damages to the blades and to sustain reasonable operational life.1–6 The blade tip is particularly exposed to much higher heat transfer compared to the rest of the blade surface and hence it is considered as a critical design area within the high pressure turbine. One way to seal the blade tip is to interconnect the blades using a shroud.7,8 However, this method increases the blades weight and centrifugal loading. Hence there is a strong motivation to use unshrouded turbine blades with no interconnection between the blades but in the presence of the so-called leakage flows over the blades tip surface.9–11
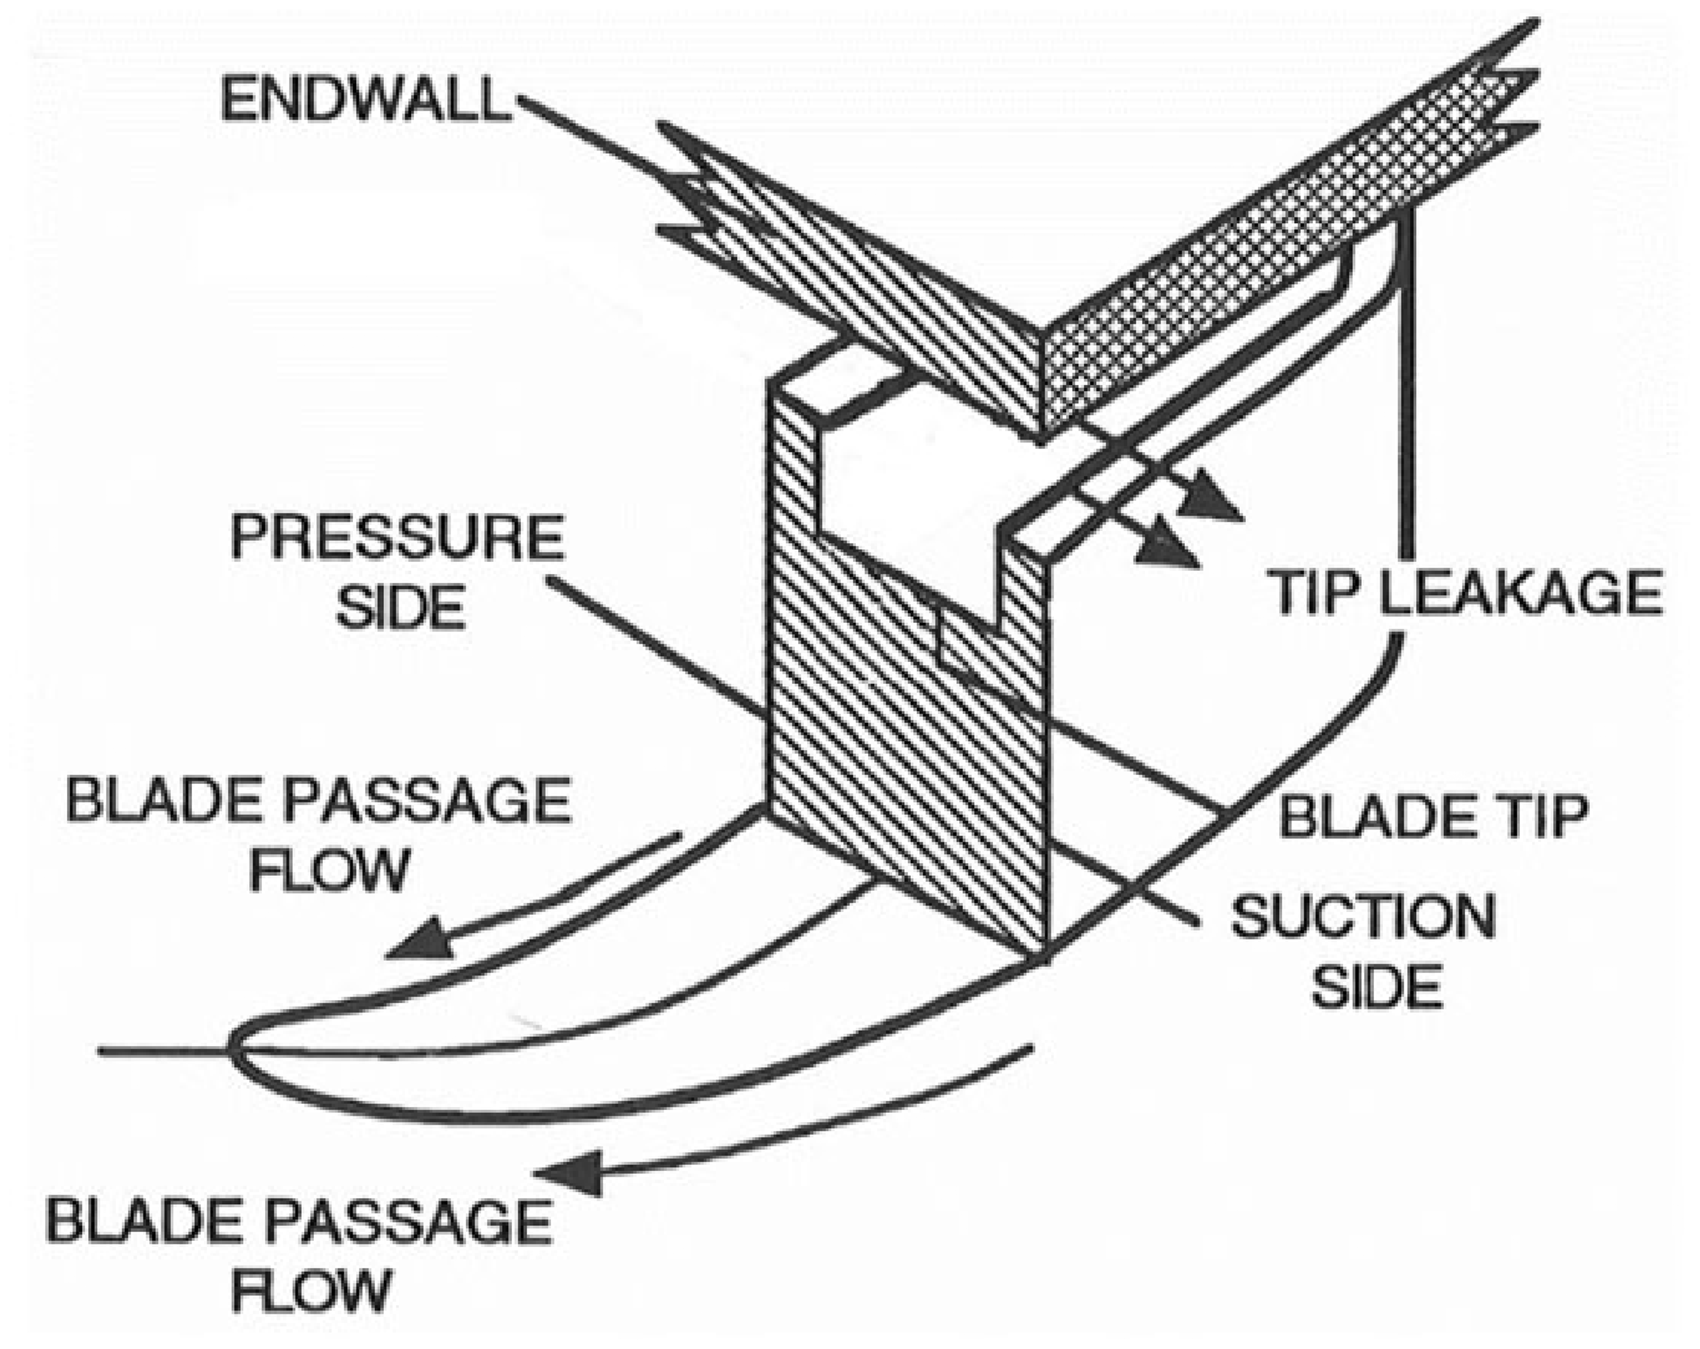
The tip leakage flow is caused by the unavoidable gap between the tip and the casing surfaces where the pressure difference across the tip gap gives rise to the development of this leakage flow. It starts at the pressure side edge, crosses the tip and exits the tip gap at the suction side edge. It exposes the blades and in particular the blades’ tip to high temperature gases and can cause thermal damage such as in-service burnout that degrades the blades and shortens their live. As the leakage flow exits the tip gap at the suction side edge, it enters the passage of the next one, interacts with it to give rise to the formation of a tip-leakage vortex. As well as the thermal damages, the tip leakage flows are associated with aerodynamic losses and contribute to about 30% of the total losses in the high pressure turbine stage which is considered as a significant contribution. Hence it is vital to establish a comprehensive understanding about the development of these flows at different conditions, the factors affecting them in order to be able to deal with them, control them and reduce them and their associated adverse effects. Due to the significant effect leakage flows have on the aerodynamics performance and on the blade operational life, any small enhancement in reducing these flows will have a great impact on improving the turbine’s efficiency and hence the engine’s performance. Therefore, the blade tip design has drawn the attention of many researchers to investigate the leakage flows behaviour and study the appropriate techniques of reducing them.12–15
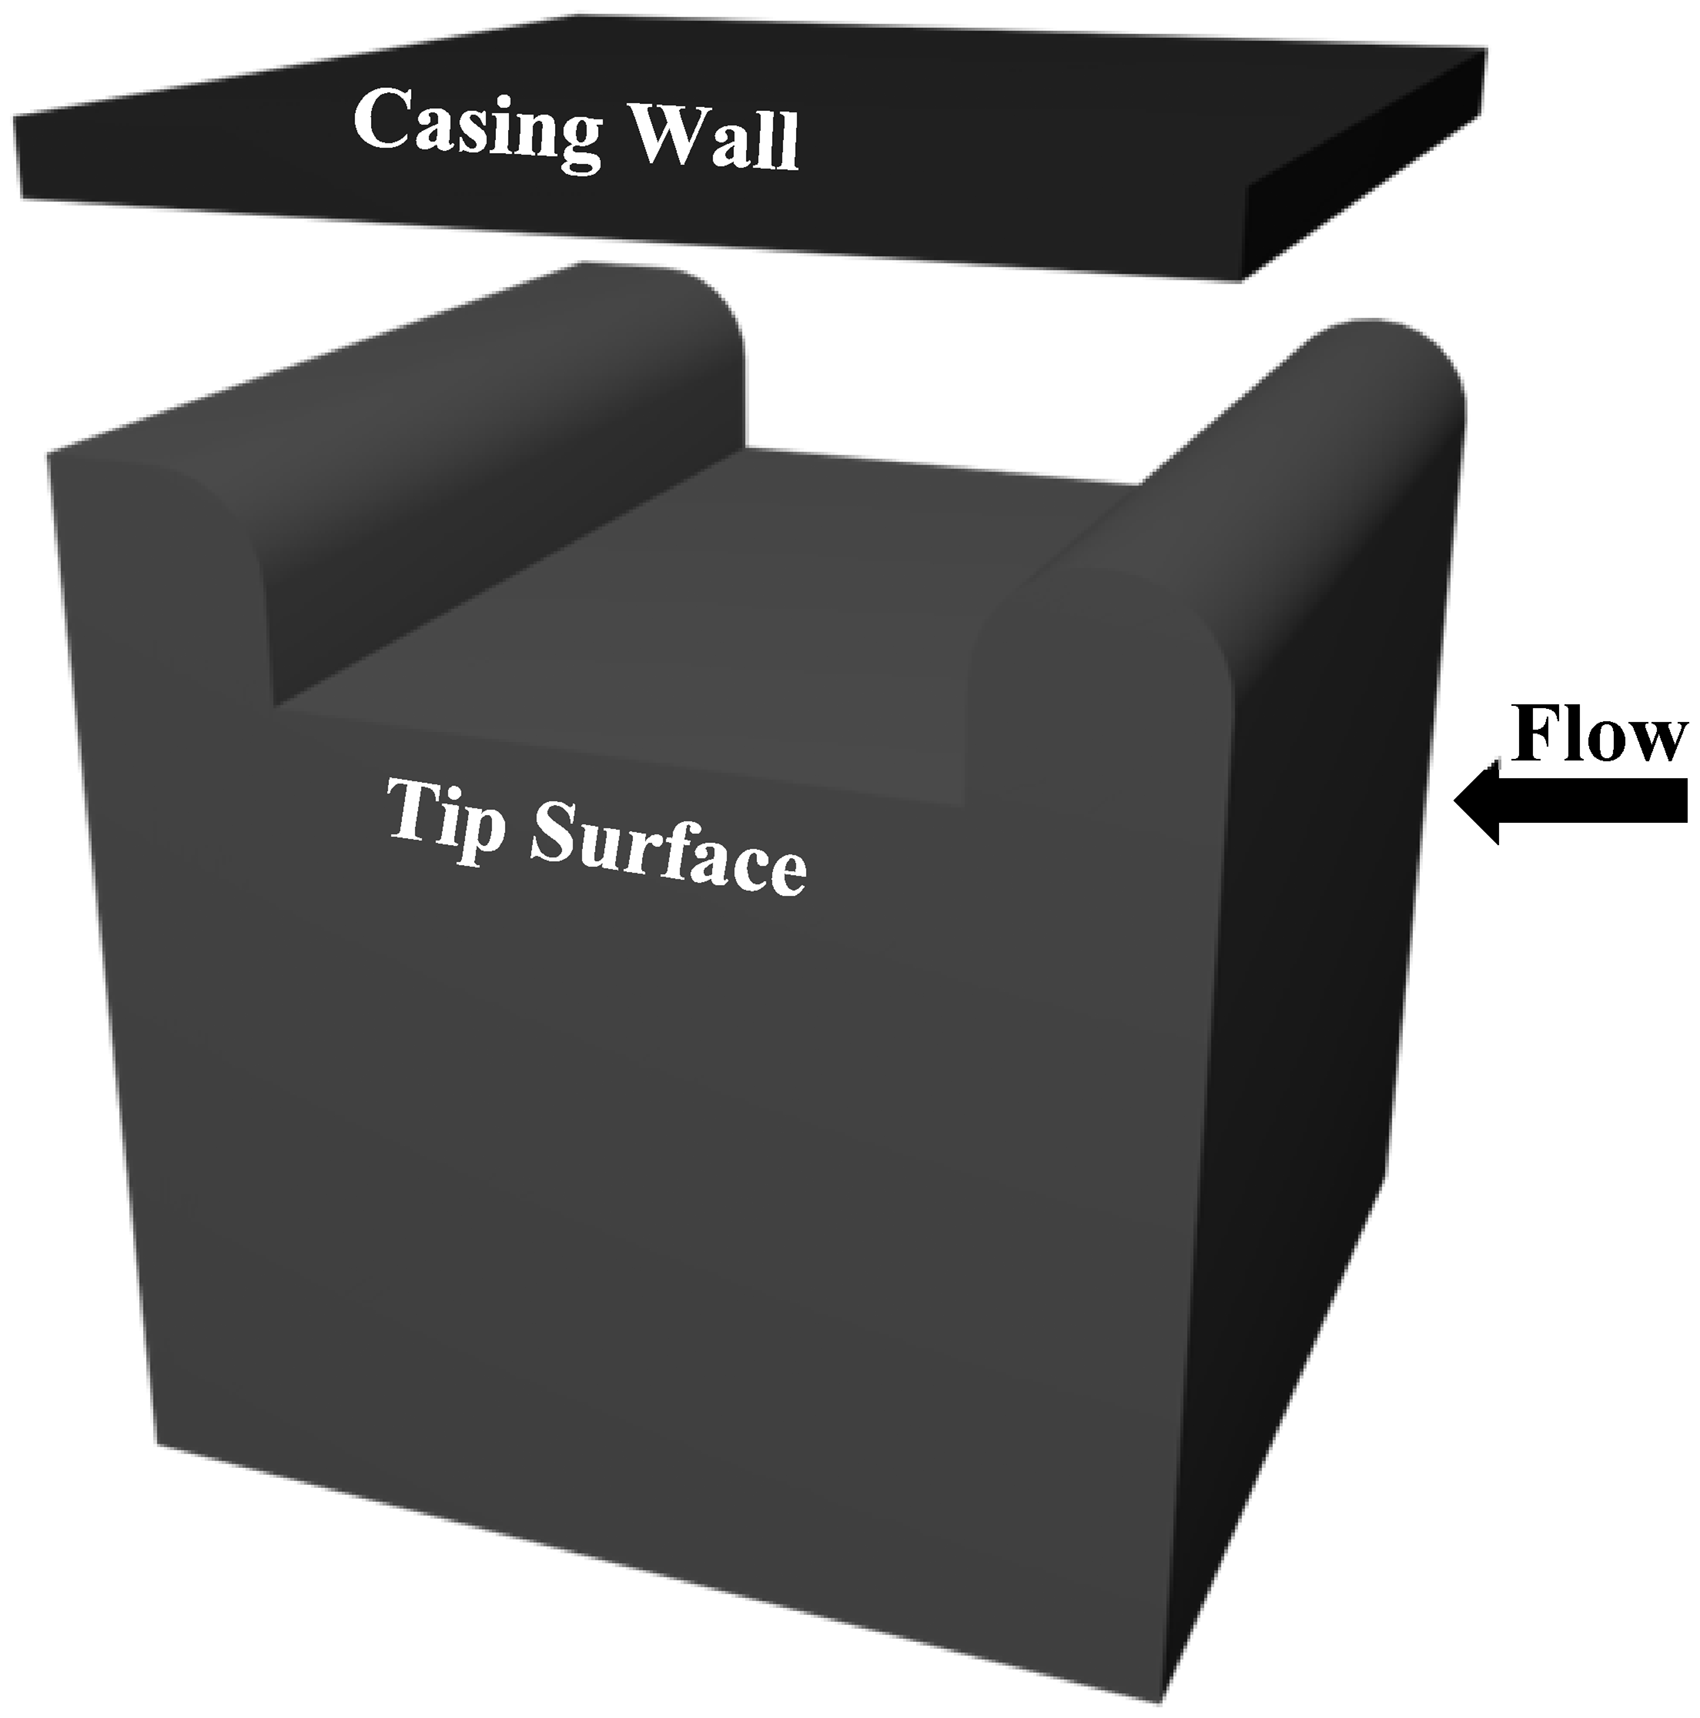
Several investigations have been carried out to study the development of the leakage flows over the blade tip. Figure 1 shows the flow development over an un-shrouded flat tip model i.e. the most basic tip geometry. At the leading edge area, the pressure difference across the tip is very small hence the leakage flow crosses the tip gap with a small momentum. Further downstream the pressure difference increases and at some point the leakage flow starts crossing the tip perpendicular to the camber line. For this part of the tip surface, the flow separates at its entrance to the tip and forms a separation bubble which acts like a vena contracta and can accelerate the flow further more. Flow reattachment may occur further downstream provided the width of the tip is sufficient.11,12,16
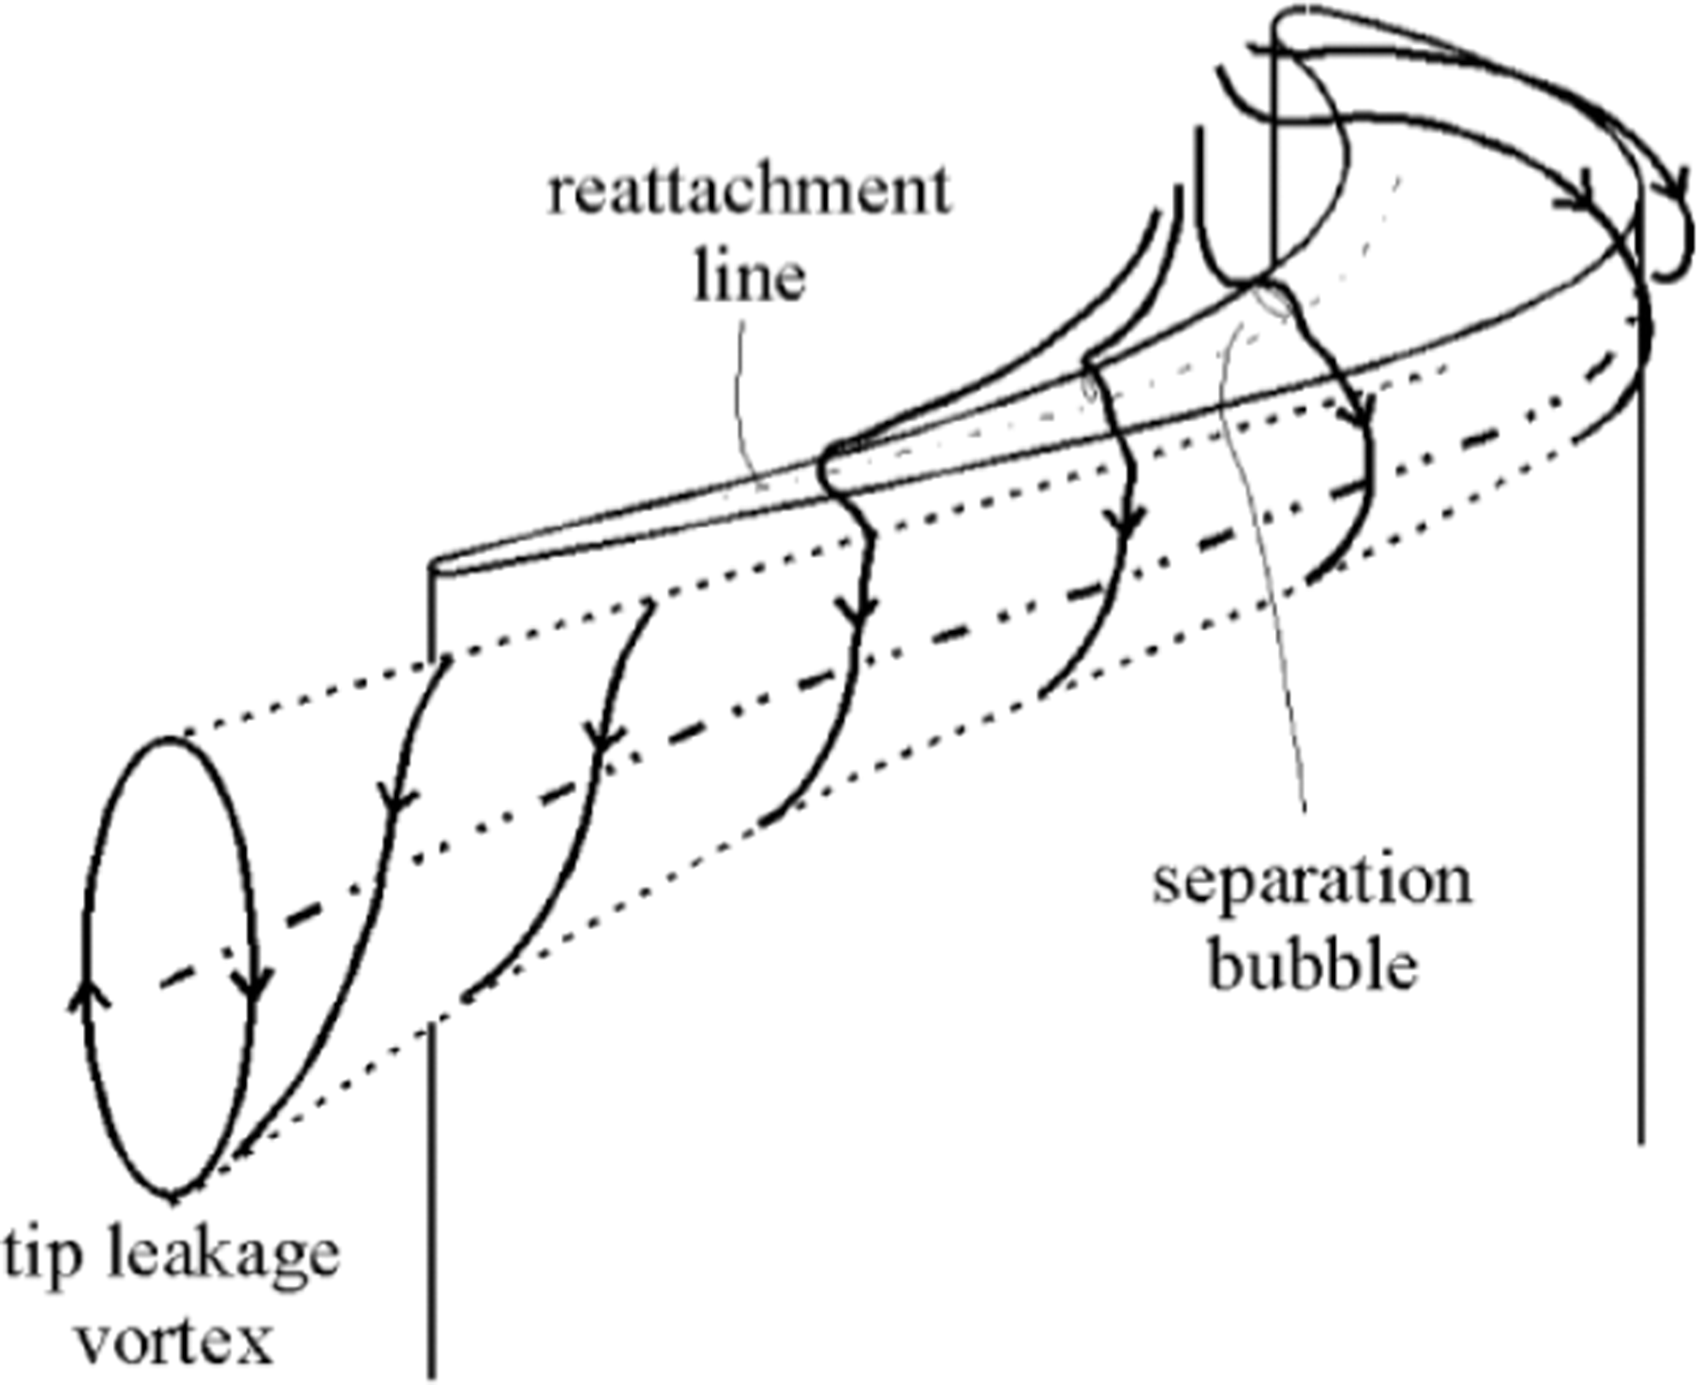
Flow development over a flat tip model. 11
There are different approaches to control and reduce the tip leakages flows and their associated losses. One approach is using active flow control techniques such as using plasma actuators. Saddoughi et al. 17 studied the tip clearance flow in a transonic compressor with and without plasma actuators and Ashrafi et al. 18 investigated the effect of the actuator plasma on the delaying the rotating stall in compressors. Blowing air from the tip or casing wall is another type of active control techniques that can be applied to reduce the tip leakage flows. Hofter and Art 19 studied the effect of air blowing from the base of a cavity tip and from the pressure side surface near the tip, they observed only very small effect on the losses due to the leakage flows. Wang et al. 20 looked at the effect of the blowing from the tip of a blade with a partial cavity, they found although the cooling was improved, there was no change to the losses due to the leakage flows.
There are different factors which can affect the development of the tip leakage flows, where the tip geometry is identified as the most important factor. The design of the tip geometry with aim of the reducing the leakages flows is consider as a passive control technique. Literature research shows that changing the tip geometry can have a significant effect in reducing the detrimental effect of the tip leakage flows. Hence there have been a lot of effort and research to study different tip geometries including flat tip, suction-side squealer tip, pressure-side squealer tip, cavity tip and winglet tip and models with different combination of squealer and winglet, with the aim of reducing leakage flows.21–25
Squealer tip geometry is one of typical tip models used for the unshrouded turbine blades. It is essentially a very thin rim along the pressure side or suction side or both sides of the tip. Azad et al. 26 performed an experimental investigation to study the effect of the squealer tip geometry on the leakage flows at high speed conditions. It was discovered that the squealer model was able to reduce the mass flow rate of leakage flow in comparison to the plain flat tip model. It was also found that on overall the heat transfer load was lower for the squealer tip compared to the flat tip geometry. Different squealer rim arrangements were tested by Azad et al., 21 including both single and double squealer. It was found that installing the rim at different positions over the tip surface resulted into different flow behaviours and heat loads. Hence the rim position was identified as an important factor as it affected the tip’s sealing effect against the flow. Kwak et al., 27 studied effect of the rim height on the tip leakage flows, it was found that increasing the rim height decreased the heat transfer over the tip surface. The performance of partial squealer tip and cavity tip was explored by Kavurmacioglu et al. 28 which concluded that the cavity tip was more effective than partial suction squealer in improving aerodynamic performance. An optimisation study was carried out by Caloni et al. 29 using several squealer designs. The effect of having an opening on the leading and trailing edges of the squealer at the blade tip was explored and the aerodynamic performance of the leakage flows was calculated using an in-house solver. The opening was found beneficial in general, the cavity vortex became stronger and the sealing effectiveness increased in the case of opening on the trailing edge. In addition, the opening on the leading edge allowed more flow to enter the cavity, and the combination of both openings enhanced the heat transfer.
Winglet-squealer tip is another well-known geometry for the turbine blade tip. Papa et al., 23 carried out an experimental investigation to study the effectiveness of this tip at low speed conditions. Naphthalene sublimation technique was used to measure the tip surface heat transfer and it was observed that as the tip gap became larger, the overall heat transfer remained almost constant for the winglet-squealer tip compared to the squealer tip model. Li et al. 30 also studied tips with different winglet and squealer arrangements including suction side winglet, pressure side winglet, cavity tip, inclined pressure side squealer and partial suction side squealer. They found that the inclined pressure side squealer tip had the best performance in improving the turbine efficiency.
Literature studies have shown the flows over high pressure gas turbine blade tips are mostly transonic. However most of the fundamental studies on these flows were done at low speed condition while only matching the flow Reynolds number. Studying the tip flows at high speed and low speed conditions and their comparison shows a significant difference between the flow structures at the two conditions. It has been found that as the tip leakage flow changes from subsonic to supersonic, the heat transfer decreases significantly pointing to a potential benefit of having the tip flow supersonic and the need for further research in that area. 15
A comprehensive study was accomplished by Moore et al., 31 and Moore and Edward 32 on the formation of the separation bubble at the inlet to the tip gap and its vena-contracta effect and on the development of the shockwave structure within the tip gap, using water table experiments. They discovered that as the flow Mach number at the exit of the tip gap exceeded 0.8 the tip flow reached the supersonic conditions and included supersonic flow features. The transonic tip leakages flows were also studied by Chen et al., 12 both experimentally and computationally where flow fluctuations were observed due to the development of shockwave structure over the tip surface. They found that as the tip flow changed from being subsonic to supersonic the length of the separation bubble at the inlet to the tip gap decreased considerably. The chocking behaviour of the tip flow and the formation of the shockwave system within the tip gap were also studied by Harvey, 33 Molter et al., 34 and Zhange and He. 35
Tip leakage flow development exposes the tip surface to very high heat load. This erodes the sharp edges of the tip a while after being in operation and results into thermal damages such as in-service burn out. Hence a more realistic model of a tip geometry in operation is one whose sharp edges has become rounded due to the exposure to high temperature gases. Despite this important fact literature survey shows that all the researches on the tip leakage flows (apart from two studies one of which belong to the authors of this paper) were carried using the tip models at the start of their life i.e. with sharp edges. In other words, all the researches in this field were carried out on an ideal representation model of the tip geometries and not on a realistic model. It is significantly important to take into account a realistic model of the tip geometries while studying the leakage flows. This is because as soon as the blade tip starts its life in the engine it becomes exposed to high thermal load and its edges become eroded as a result of in-service burnout. The longer the tip stays in the operation, it will be exposed to more in-service burnout and to adverse effects of the in-service burnout on its geometry. As the edges become eroded the tip geometry changes which therefore changes the development and the behaviour of the tip leakage flows. One way to assess the effect of the in-service burnout is to compare the aerodynamic performance of a tip model with sharp edges (i.e. a tip at the beginning of its operational life) to a tip geometry with round edges (i.e. a tip exposed to in-service burnout).
As far as we are aware there is only one work done by Ameri and Bunker36,37 and one work by Saleh et al. 25 (i.e. the authors of this paper) looking at the burnout effect. The work by Ameri and Bunker mainly focused on the detailed heat transfer coefficient distributions over the tip and the shroud surfaces of a first stage power generation turbine blade. The study was performed experimentally and computationally and the only aerodynamic measurement included the overall pressure distribution along the suction side, pressure side and the mean line. It was concluded that the round-edge (i.e. the tip edge exposed to burn-out effect) redistributed the flow at the entrance to the tip gap and increased the losses associated with the leakage flows. Despite this result the study did not provide any details on the flow behaviour and pattern across the tip i.e. starting from the pressure side and ending at the suction side edge. In addition, no flow visualisation was established by that investigation. The study by Saleh et al. 25 established the effect of the in-service burnout over the flat tip model both experimentally and computationally. It presented a good understanding of how the flow was developed over a flat tip model that was exposed to an in-service burnout in comparison to the flow over a flat tip model at the start of its operation life i.e. with sharp edges and included different flow measurement and flow visualisation. However, the paper did not study the burnout effect for a cavity tip model.
Clearly there is a large gap of knowledge on the in-service burnout effect area in the literature of this field. Hence it is the aim of this investigation to bridge this gap by studying burnout effect on the cavity tip model which is known as one of the typical tip models used in the high pressure turbine. In this study a sharp-edge cavity tip model will represent a new blade tip coming to the service and a round-edge cavity tip model will model a tip after service effects.
This investigation is fundamental study which focuses on the main leakage flow characteristic that is essentially due to the two-dimensional geometry effect.12,16,25 This is a philosophy of investigation embedded in the traditional aerodynamic modelling such as blade element for the blade and the lifting line theory for the wing, where two-dimensional geometry effects are first studied to be followed by considering three-dimensional geometry effects, by joining the two-dimensional flows while assuming a high aspect ratio. We will investigate the three-dimensional effects in a future paper. In this paper the flow conditions including the Mach and Reynolds numbers are within the operational range of the high pressure turbine blade tip. Both experimental and computational investigations are used to yield flow visualisations, pressure distributions and the important discharge coefficient, CD (as a measure of loss produced by the leakage flows).
Experimental procedure
The experimental work of this investigation was carried out in the transonic wind tunnel facility of White head laboratory, School of Engineering and Materials Science, Queen Mary University of London. This is a closed-circuit transonic wind tunnel which has a working section with a cross sectional area of 127 mm × 135 mm. Figure 2 shows the diagram of the wind tunnel and working section. The airflow passing through the empty working section i.e. without any model, can accelerate up to a maximum Mach number of 1.4. The flow condition within the working section can be varied changing the pressure of the injector. This is facilitated by a feedback loop and a regulator to provide a constant condition in the test section for about 60 seconds. In order to ensure a turbulent boundary layer at the tip gap entrance, a trip wire was used on the top wall of the wind tunnel working section (which presented the casing wall for the tip model) upstream of the tip model.
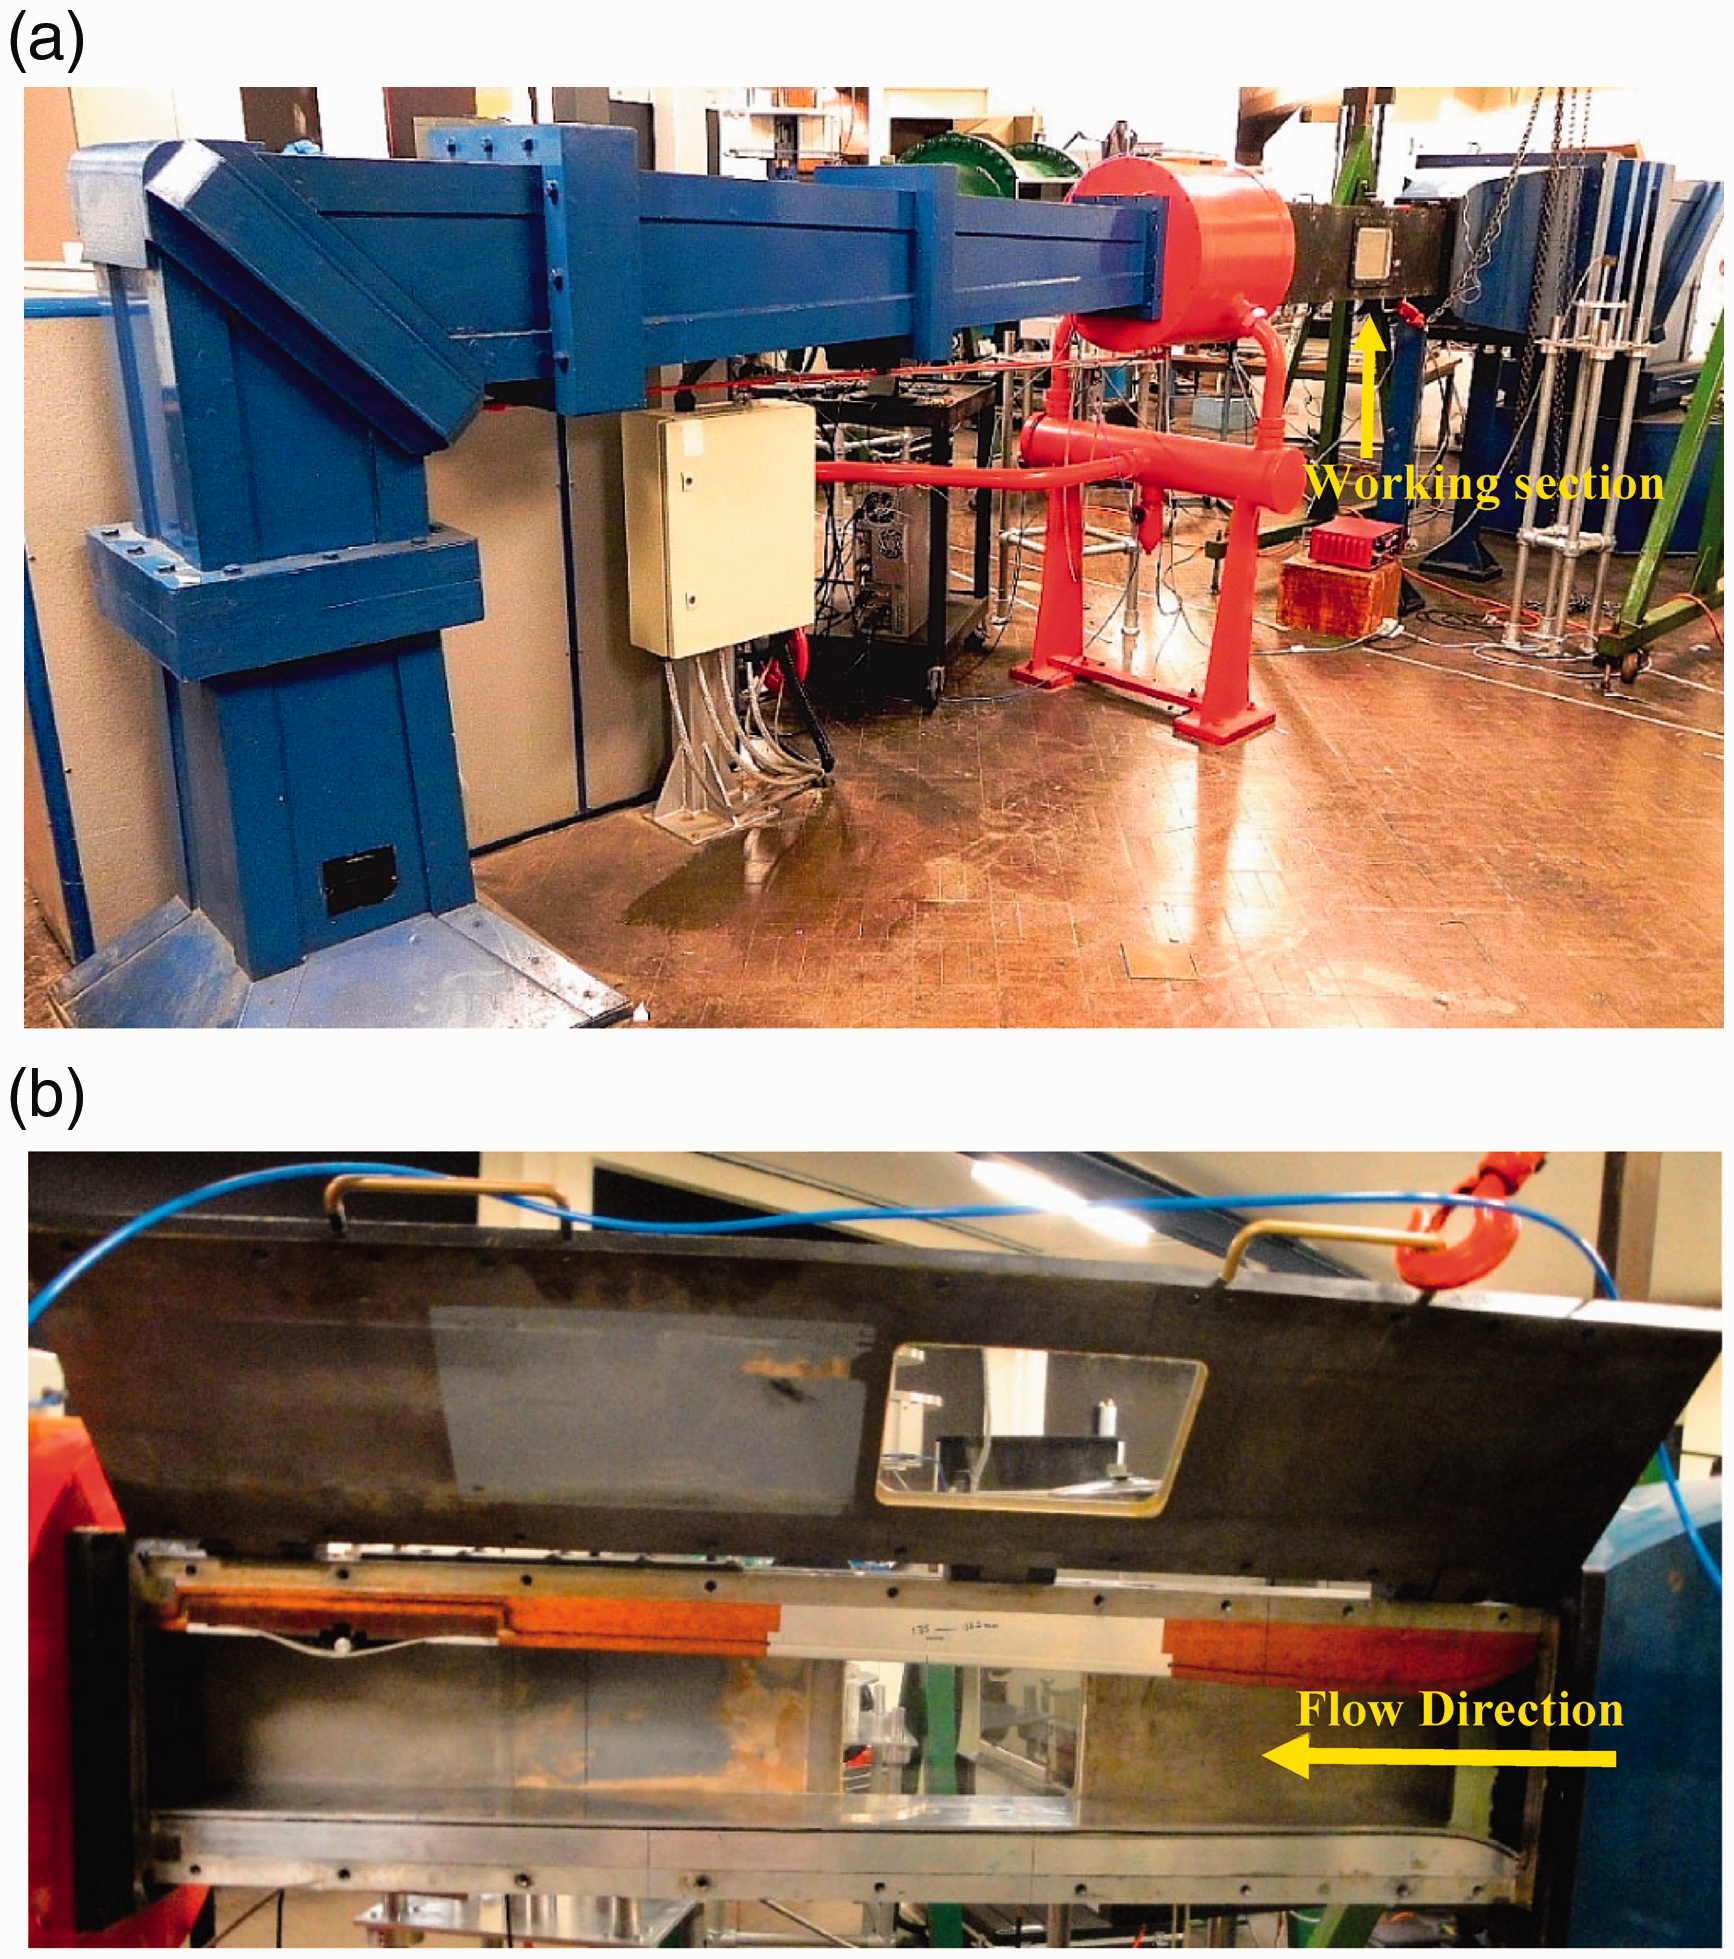
(a) The diagram of the transonic wind tunnel, (b) The diagram of the wind tunnel working section.
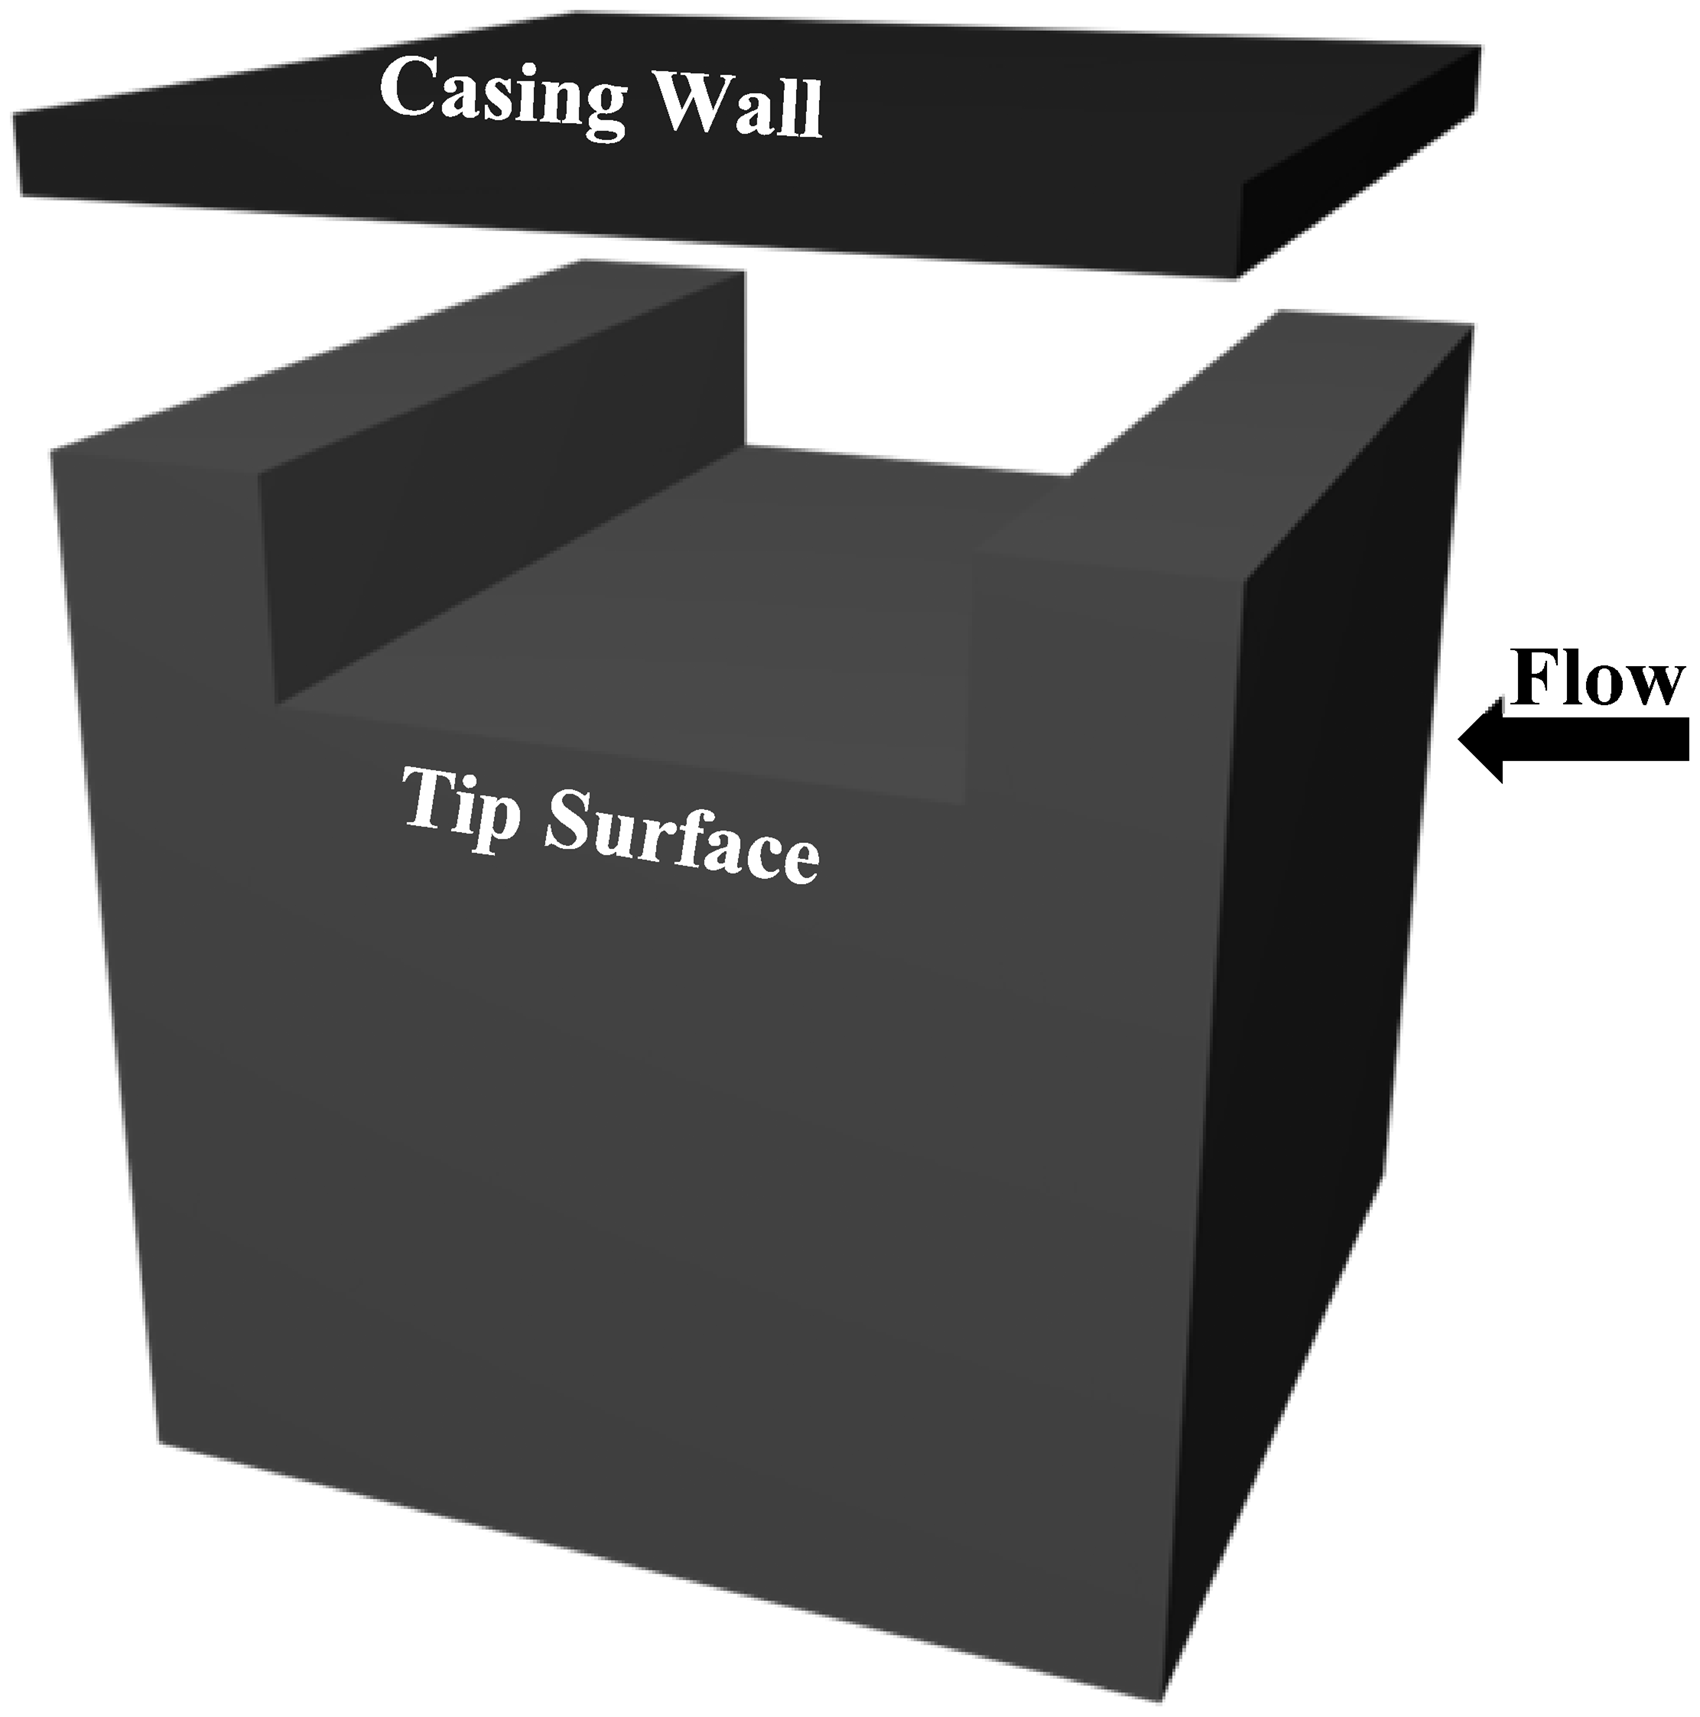
The tip leakage flows were modelled using the approach by Chen et al. 12 in this investigation. This approach was based on the model proposed by the Rains. 38 Rains’s model was based on a few assumptions, it assumed that the momentum components parallel to the blade chord and perpendicular to it were largely decoupled. It also assumed that the pressure variation in the chordwise direction was much smaller as compared to the variation normal to the chord. Using these assumptions, Rains 38 treated the blade tip as a series of planes cut perpendicular to its chord where the main component of the tip leakage flow was in the direction parallel to these planes. This leakage flow component was considered as half of two-dimensional jet discharged from an infinitely long orifice with sharp edges where casing surface being the centerline of the jet. Flow in this model separated due to the sharp edges of the orifice. Figure 3 shows the tip leakage flow modelling proposed by Rains 38 for a cavity tip model (which is based on a schematic diagram by Chen et al. 12 ).
Many studies on tip leakage flows have varified the assumptions which formed the basis of the Rains’s model. The chordwise velocity vector distributions at different spanwise distance within the tip gap were studied by Yaras and Sjolander. 39 They found that apart from the areas very close to the leading edge and trailing edge, the tip leakage flow crossed the tip perpendicular to the chord. Hence it was concluded that the flow momentum mainly changed in the direction normal to the chord. This was the same as the model proposed by Rains 38 which confirmed the reliability of studying the tip leakage flows using two-dimensional and quasi three-dimensional modelling. Therefore the outcomes of this paper are reliable and applicable to the tip leakage flows over the whole blade tip apart from the areas very close to the leading and the trailing edges. 25
The experimental models of this investigation are shown in Figures 4 and 5 which are quasi three-dimensional. The top wall of the working section represented the casing wall in each case and the top surfaces of the models were the tip surfaces. The axial length of each tip was 100 mm and the tip gap height for all the tested cases was 20 mm which was 10 times larger than the tip gap size in the actual engine. This scale was chosen since it was almost impossible to operate the wind tunnel at the real tip gap height. In addition, this was a unified scale i.e. it was applied to all the parts of the experimental model which resulted into a tip gap height to streamwise length ratio of 5. This corresponds to the region over the tip surface where the thickness of the tip is maximum i.e. the middle section. This region is far from both leading and trailing edges and the flow crosses the tip almost perpendicular to the chord direction. Hence the quasi three-dimensional approach in the experimental work and the two-dimensional principle used in the computational work of this investigation which were based on the model suggested by Rains, are applicable and give reliable results.16,25,38
The sharp-edge cavity tip model.
The round-edge cavity tip model.
Additionally, the round edge in the case of the round-edge cavity tip model had a radius of 10 mm and radius to tip gap height of 0.5 which presented a simple model of a tip exposed to high thermal load and in-service burnout. The study by Ameri and Bunker36,37 (which is the only study on round edge models other than the papers by the authors of this study) studied round-edge flat tip model and mainly focused on the heat transfer aspect rather than aerodynamics. Previous study by Saleh et al. 25 (i.e. the authors of this study) looked at the aerodynamics aspect of the round-edge flat tip model and provided comprehensive insight on this. Both of these studies used similar radius for the edges of the tip models which represented simple models of tips exposed to burnout effects. Studying the effects of other factors such as the geometry variation caused by the in-service burnout will be represented in a future paper.
Both Models were build using rapid prototyping. The tip surface of each model was equipped by 2 mm pressure tappings along its centreline to measure the surface static pressure distributions at different flow conditions. This was done using a DSA3017 pressure scanner with an accuracy of ±0.05 full scale output. Each model was designed to have an inner cavity and the tubes connecting the pressure tappings to the pressure scanner were passed through model’s inner cavity. The working section lower wall was equipped with some holes which passed these tubes to outside of the tunnel to be connected to the pressure scanner. Each model was designed to be fixed inside the wind tunnel working section from its base. Two bolts were used to bolt each model onto the lower wall of the working section. Figure 6 shows the diagram of the model’s base. Each model was covered by a few layers Aluminium foil to overcome issues such as air passing through the model due to the materials porosity in high speed flow and its impact on the testing accuracy.
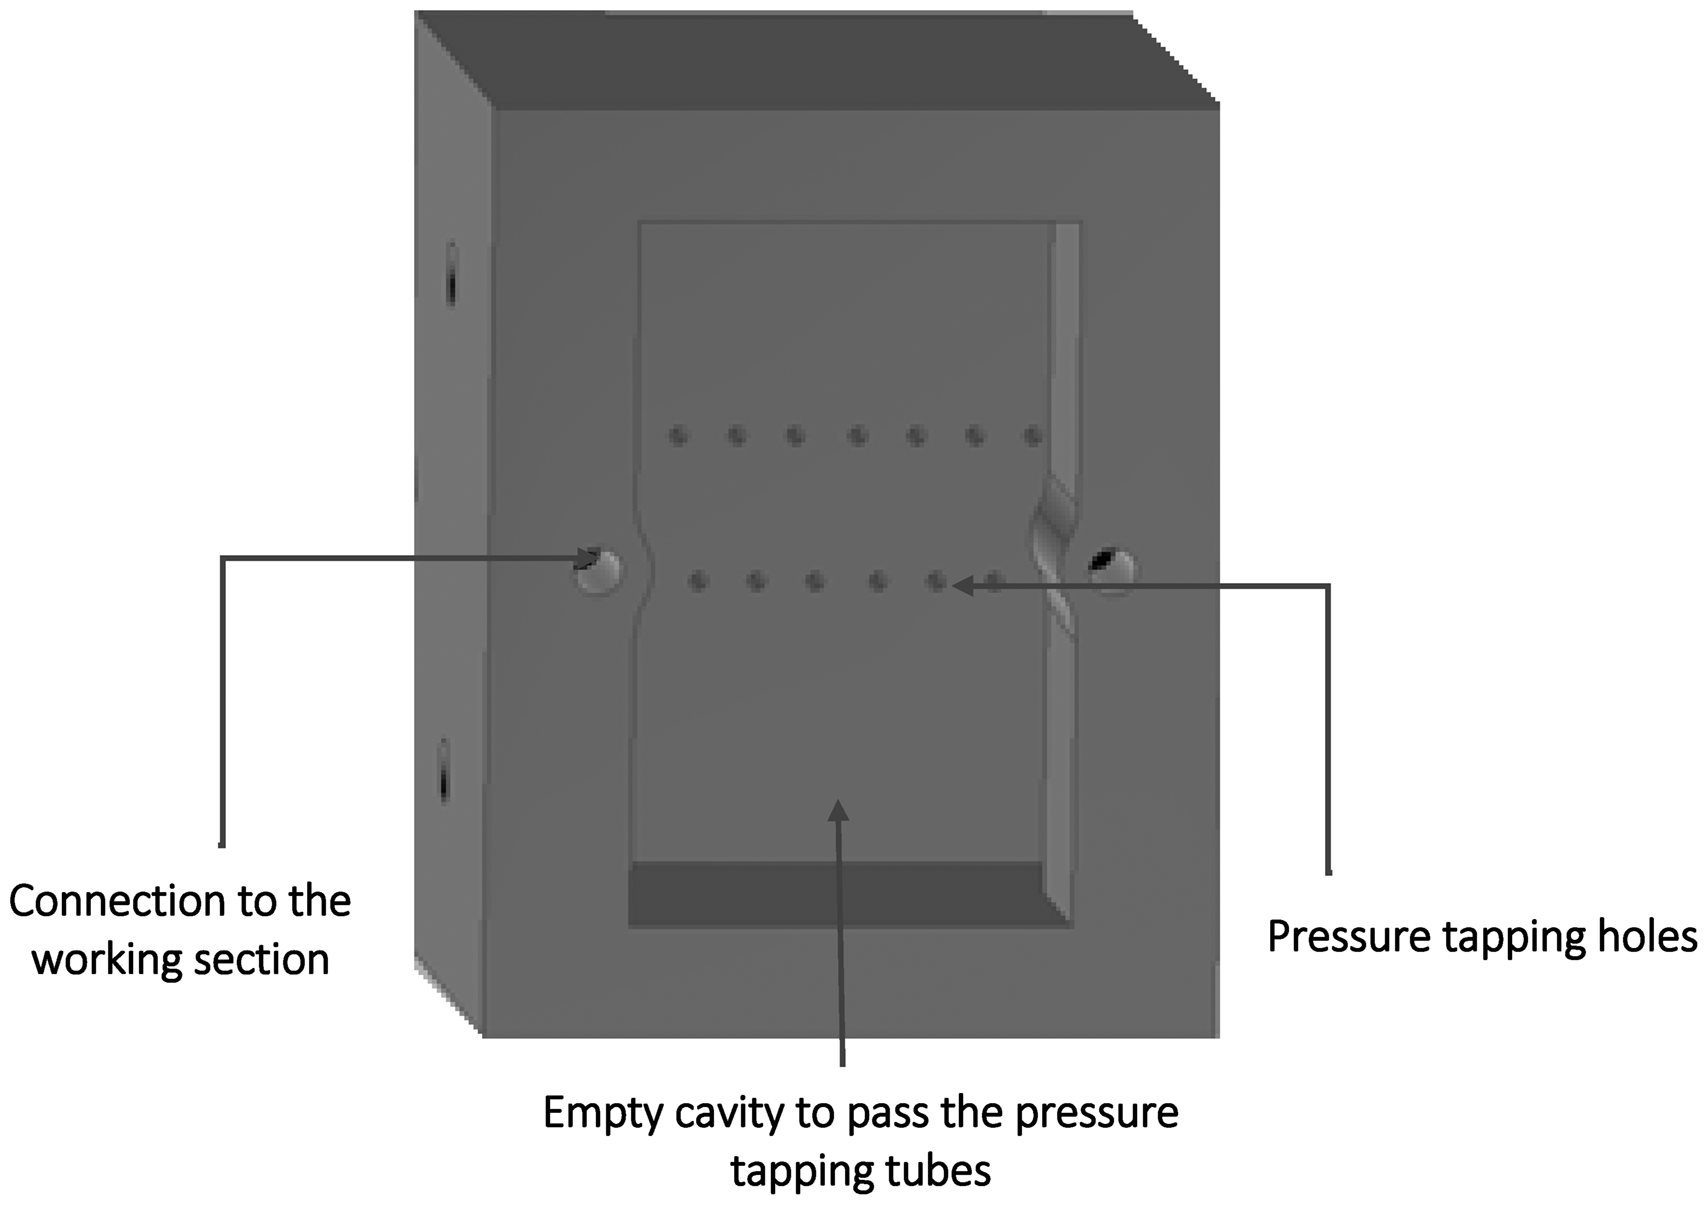
The diagram of experimental model’s base design.
In the case of each model, the tip model was aerodynamically blunt with a very high pressure difference across it. These combinations produced a very large wake at the back of the model and hence a large blockage which consequently stopped the wing tunnel’s operation. Therefore, an afterbody was connected to the tip model in order to diffuse the air at a moderate rate and overcome the blockage issue. Figure 7 shows the experimental model equipped with the after body inside the wind tunnel working section.
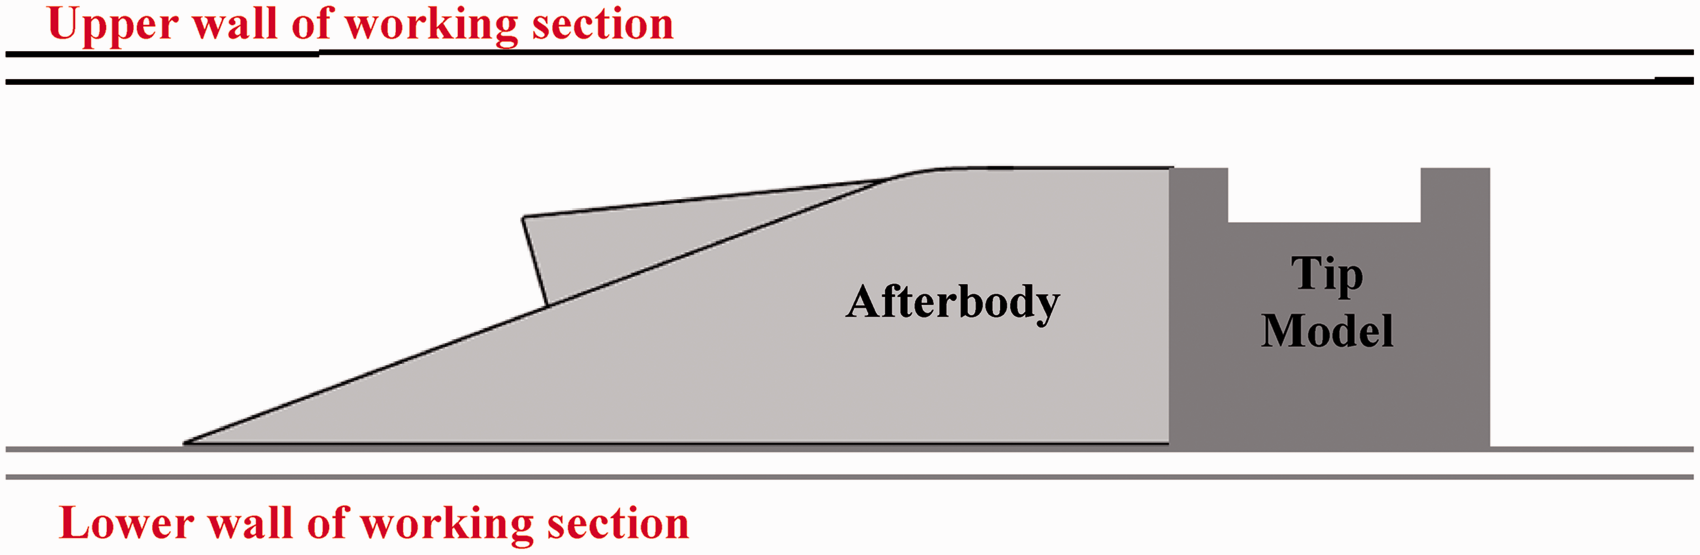
The Schematic diagram of the experimental model in the wind tunnel working section.
The transonic windtunnel was also equiped by the z-type Schlieren flow visualisation set up in order to get a comprehensive insight into the flow behaviour and pattern within the tip gap area. This is an optical setup which visualises the reflactive index gradient. Since the flows in this investigation were of high speed compressible type, the change in the refractive index was due to the change in the flow density. Figure 8 includes the schematic diagram of z-type Schlieren set up used in this study, which comprises of an extended light source, two parabolic mirrors tilted oppositely, a razor blade and a camera. The light source should be placed at the focal point of the first mirror. The light from this source travels to the first mirror and reflects. This miror then is rotated to pass the reflected light rays into the working section after which they reach the second mirror and reflect. The reflected light rays at the second mirror will have all the information about the flow in the working section which can be viewed on a screen or captured by a camera. A razor blade is used at the focal point of the second mirror where most focused image of the flow in the test section is developed. It is used to adjust the sensitivity of the Schlieren system through blocking some of the light rays. The more rays blocked by the razor blade the more sensitive is the Schlieren setup and hence more disturbance and flow pattens are captured. 41
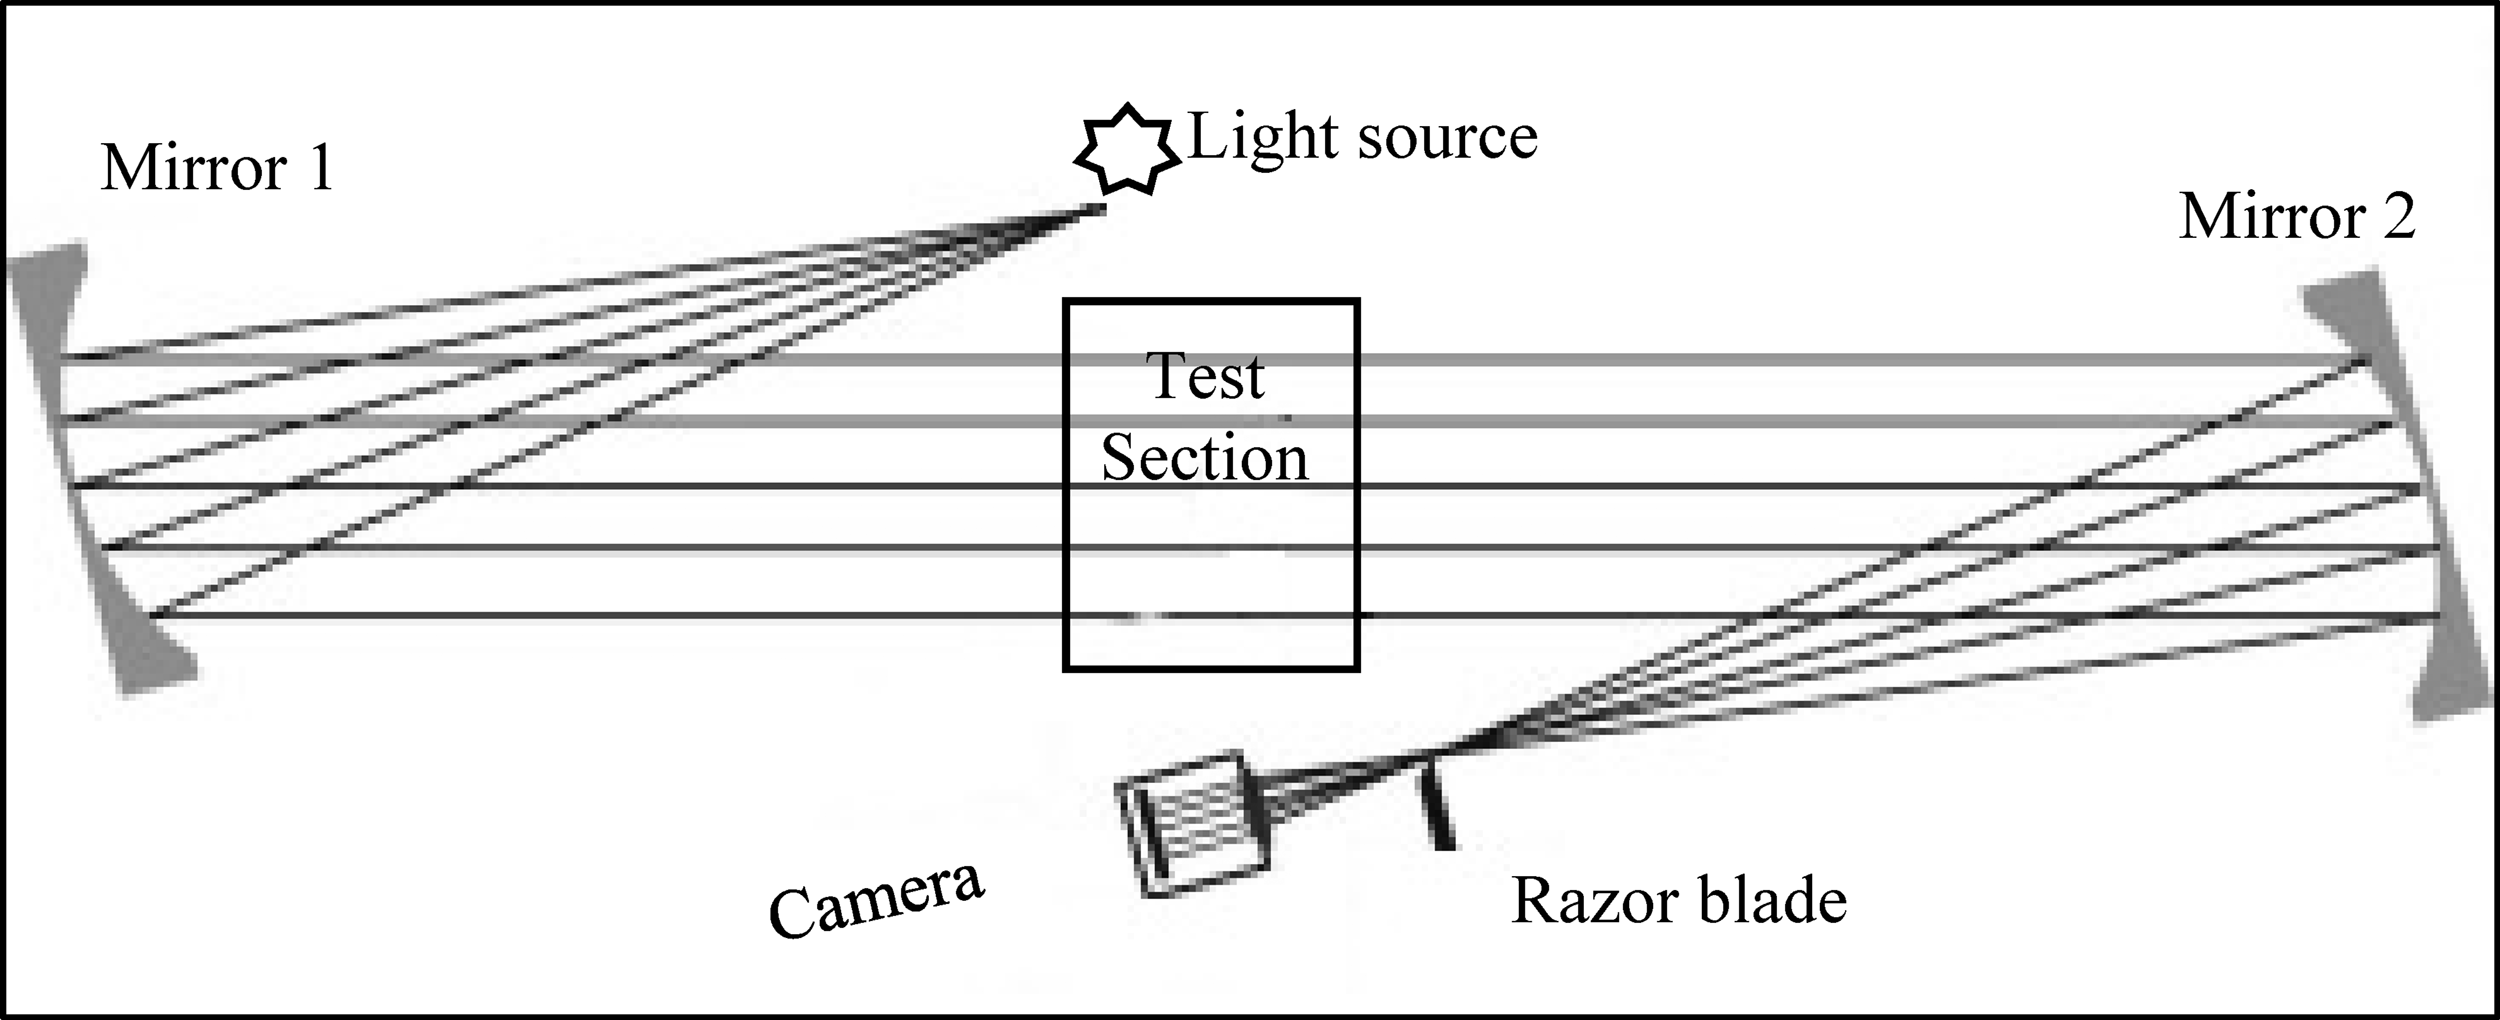
The schematic diagram of the z-type Schlieren flow visualisation set up. 42
Both sharp-edge and round-edge models were tested for different conditions with pressure ratio PR ranging from 0.85 to 0.58. All the experimental results are presented in the results section of this paper.
Computational procedure
ANSYS commercial package was used to mesh and solve the flow fields of both tip geometries. Structured mesh (i.e. quadrilateral Mesh cells) was used for sharp-edge cavity tip and hybrid mesh (i.e. a combination of triangular and quadrilateral mesh cells) was employed for the computational domain of round-edge cavity tip. Figures 9 and 10 show the computational domains for both models, for clarity only one-fourth of the gridlines are plotted.
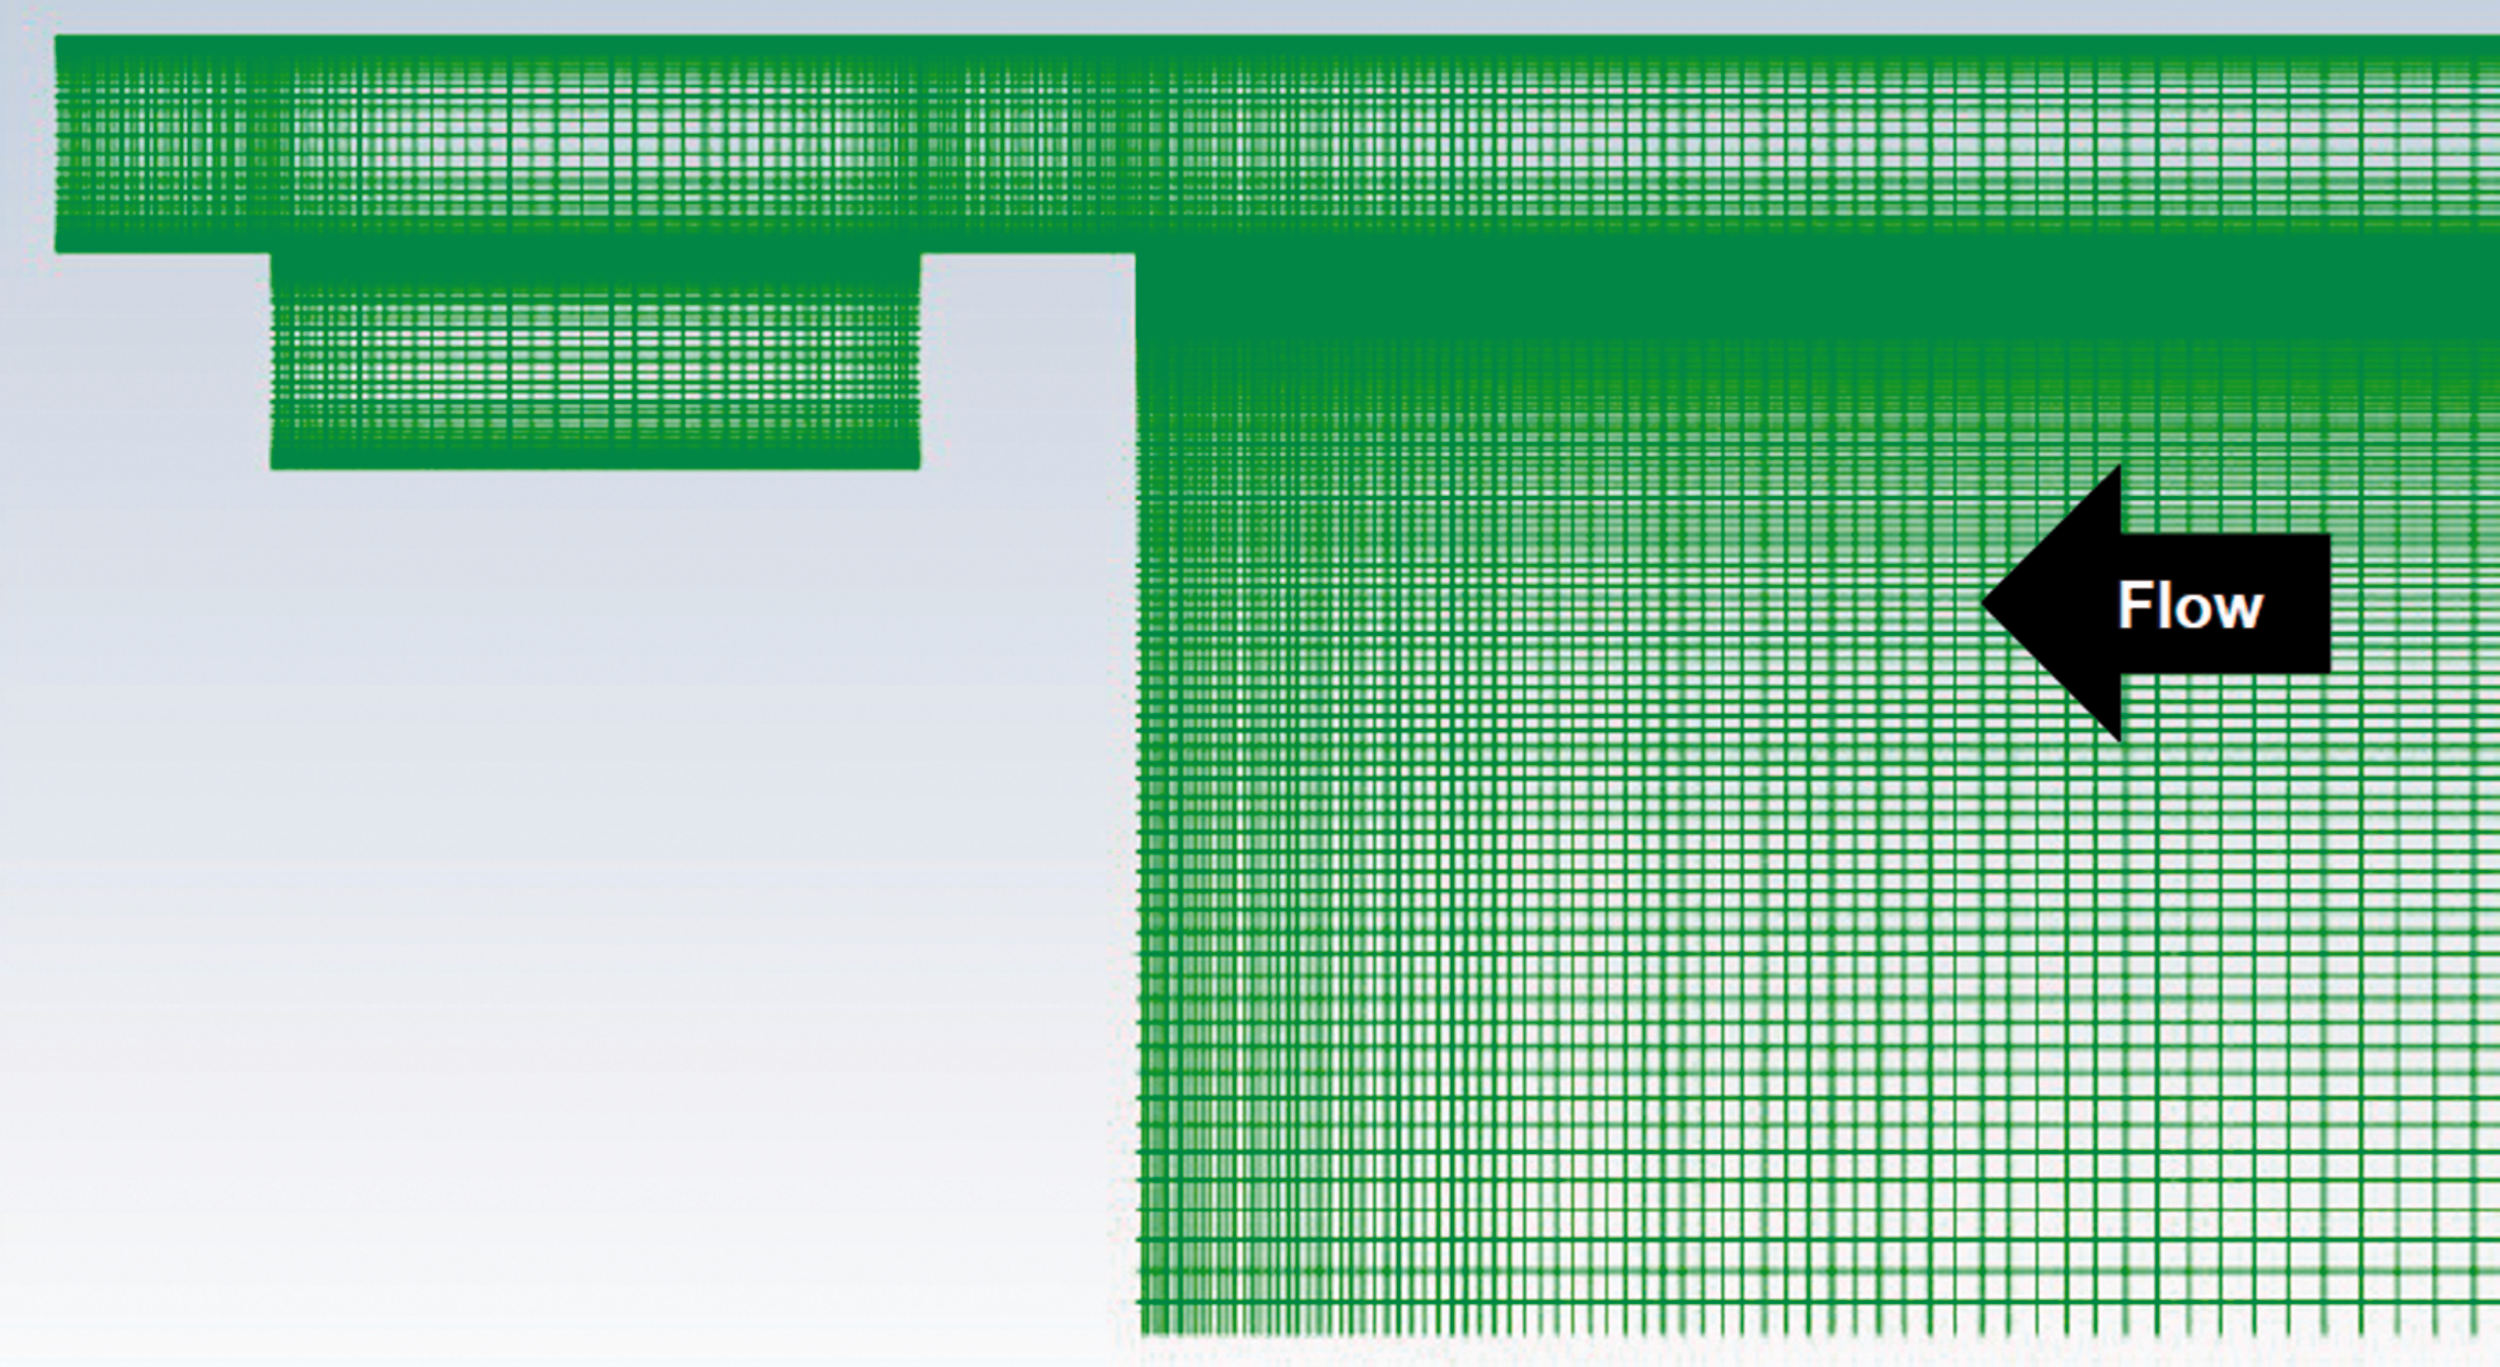
The computational domain for the sharp-edge cavity tip model.
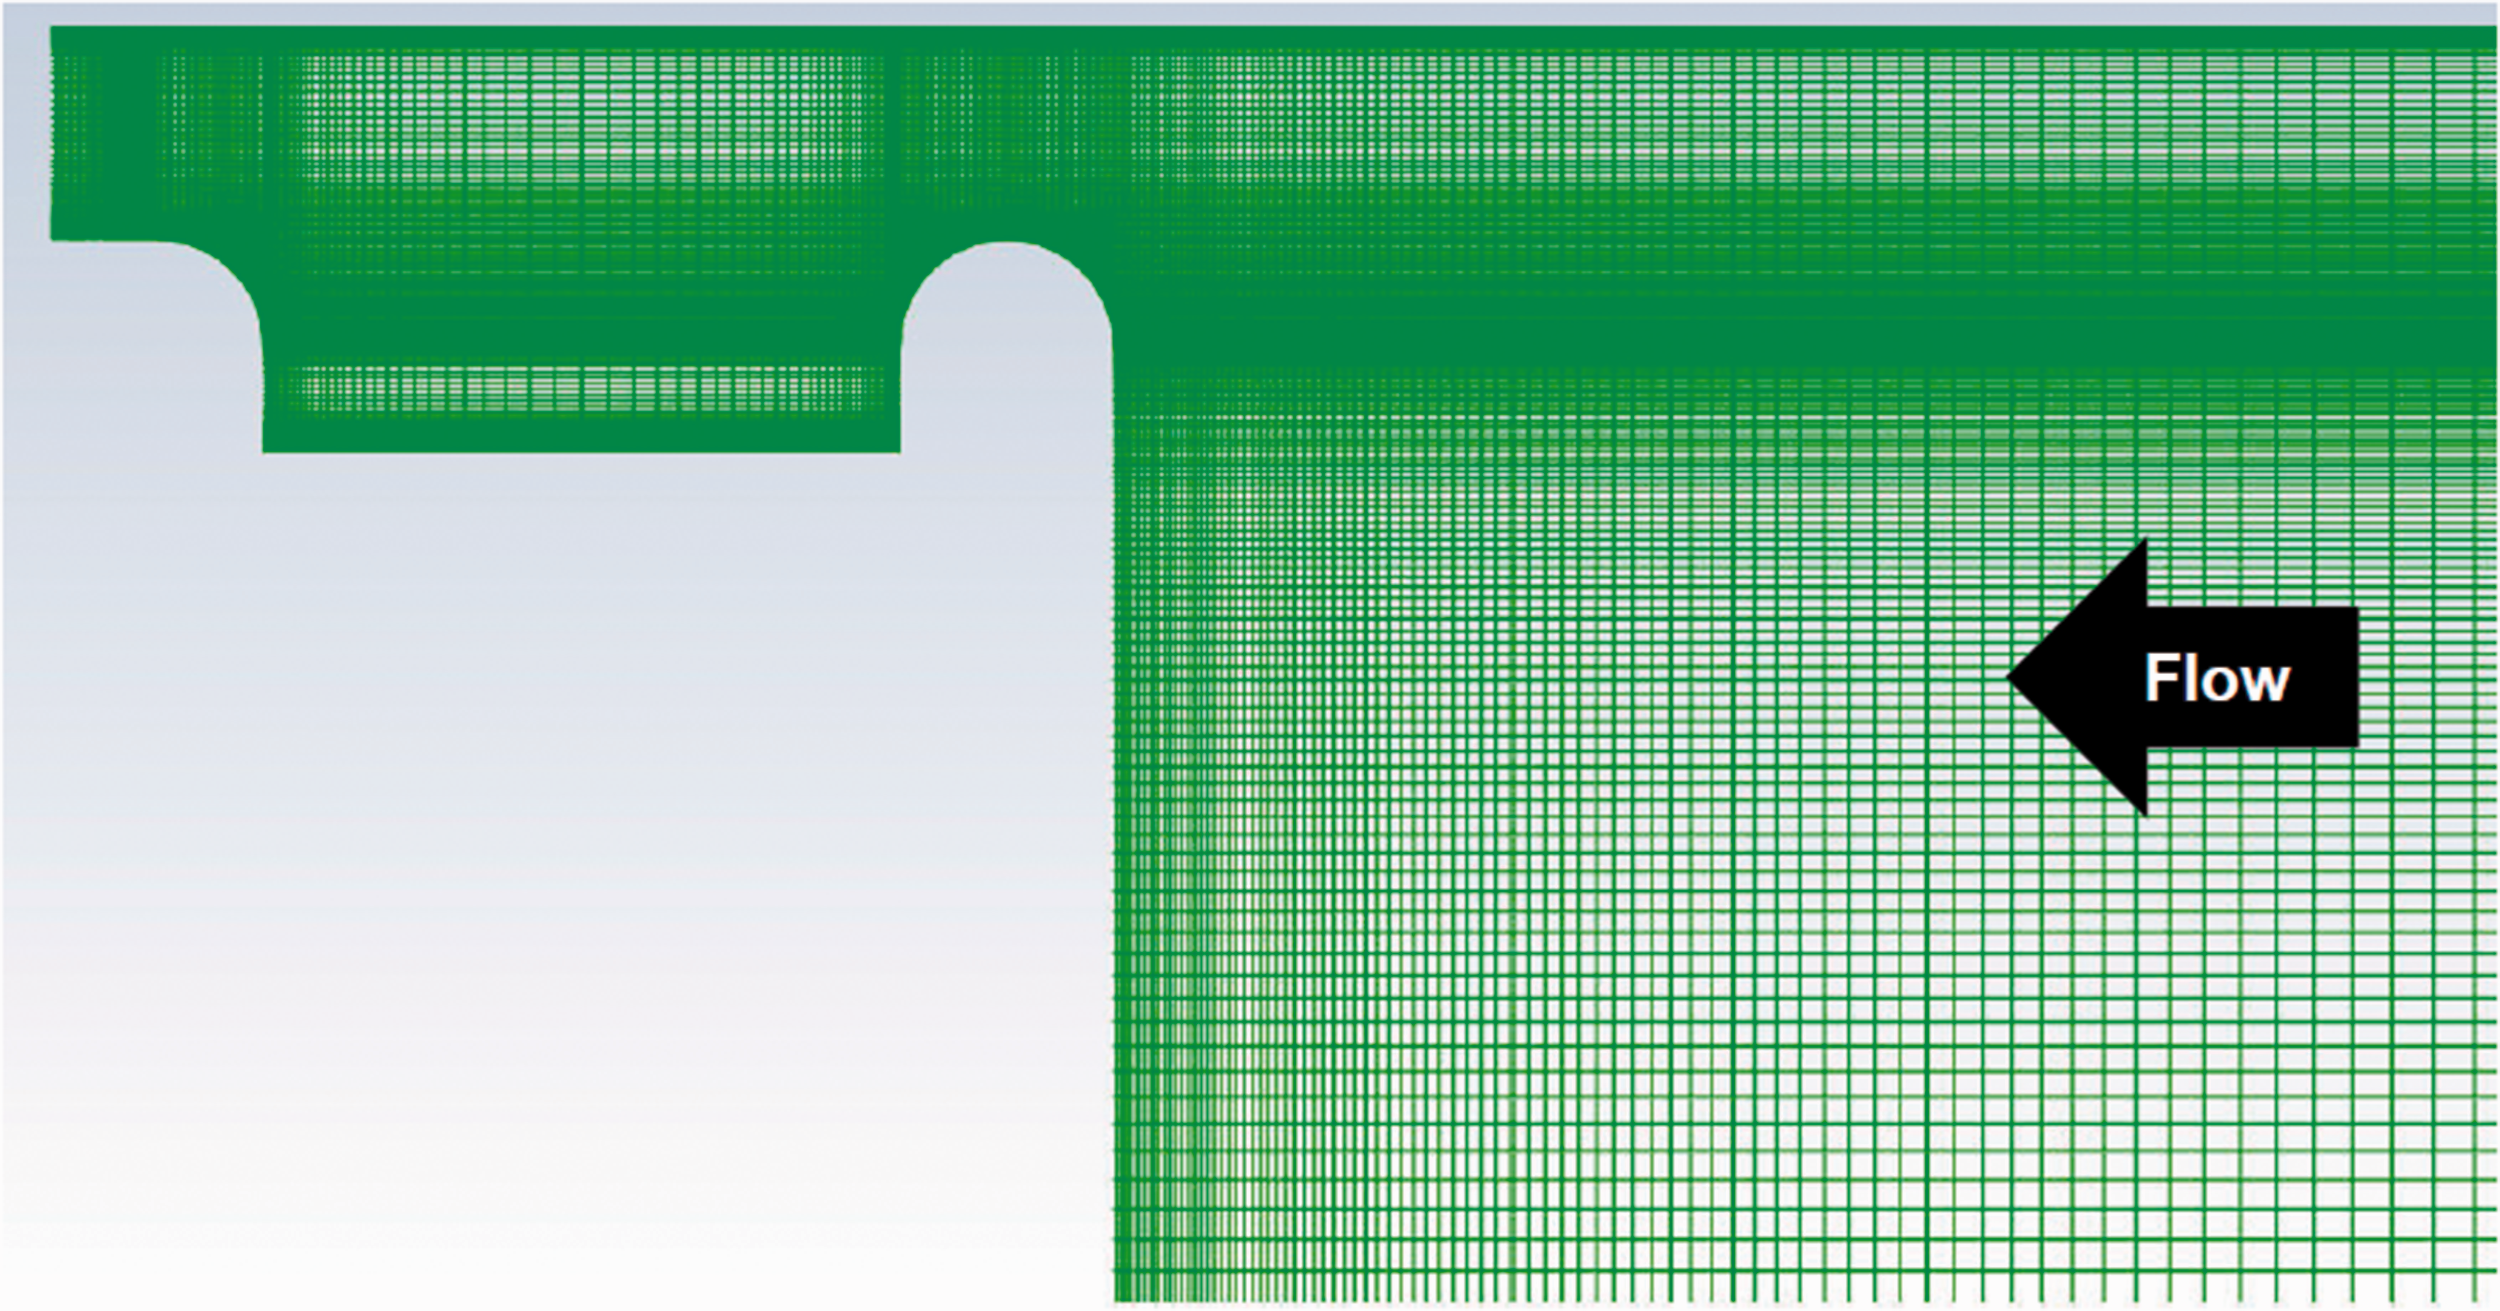
The computational domain for the round-edge cavity tip model.
The tip leakage flows in the case of sharp-edge cavity tip was solved using both Reynolds Averaged Navier-stokes (RANS) equations and Unsteady Reynolds average Navier-stokes (URANS) equations approaches. The comparison of these approaches showed no difference between the outcomes of both methods for this model. Hence RANS was selected to solve the flow fields for this geometry at all the required flow conditions. In addition, compressible Spalart Allmaras model was chosen as the turbulent model. The flow domain of round-edge cavity tip was computed using Unsteady Reynolds average Navier-stokes (URANS) equations approach since the experimental testing demonstrated unsteady flow behaviour at tip of this model. Furthermore, the realizable k–ε turbulence model was used to solve the URANS for the flow field of round-edge cavity tip. The URANS simulation was run long enough to allow transient structures resulting from the initial condition to disappear.
Both RANS and URANS were solved using FLUENT within the ANSYS commercial package, where finite volume method and collocated grid approach were employed. The pressure inlet and pressure outlet boundary conditions were chosen at the tip gap entrance and exit and for all the solid boundaries within the flow field, adiabatic wall with no slip condition was selected. A second order central difference scheme was used for the diffusion terms and a second order upwind scheme was employed for the convection terms. The density-based solver was employed to solve the leakage flows since they were of compressible type at all the tested conditions. An implicit time marching approach was employed to enhance the stability and the convergence rate as the mean flow solution was sought for the RANS. The unsteady leakage flows over round-edge cavity tip were solved using transient simulation of URANS and the first order implicit time stepping was applied in order to improve the temporal accuracy. The solution convergence was achieved through monitoring the residual plots and allowing it to level off at a very low residual error values.
Mesh independency study was established through increasing the grid density at the areas with high pressure gradient and comparing the flow parameters at different mesh resolutions. The mesh density beyond which increasing its cells further did not change the flow results, was chosen as the sufficient mesh to provide mesh independent results. In this case the grid with 2.28 × 10⁵ cells was found to provide grid independent results. The first grid point above the wall was found to be at y+ of about 30 and thus at the log region of the turbulent boundary layer, therefore an enhanced wall model was used while solving the domain of each tip geometry at different flow conditions. Enhanced wall function has proven to give a very reliable estimate for y+>30 when compared to the DNS. Its accuracy is much higher than the standard wall function for this range of y+. 43 The strong agreement between the experimental and computational results (which are presented in the next section) supports the reliability of the simulations.
Results
All the experimental and computational results of both geometries are included in this section. The flow Reynolds number (based on the flow conditions at the tip exit and the height of the tip gap) was about 2.5 × 10⁵. This is about 5 to 10 times larger than the value found in a typical engine operational condition. However, the simulations established at different flow Reynolds numbers showed that this much difference in the flow Reynolds number had insignificant effects on the flow patterns and shockwave structure within the tip gap area and that the pattern remained almost the same. This is caused by the transonic nature of the flow which is mostly affected by the pressure ratio, i.e. the Mach number. Similar results and finding were reported by Wheeler et al. 6 and Saleh et al. 25 for other types of blades tips. Also the study by Matsunuma 44 showed a similar variation in the Reynolds number did not affect the losses due to the tip leakage flows.
Furthermore, pressure ratio (i.e. the ratio of static pressure at exit of the tip gap to the stagnation pressure at the inlet) was used as the similarity criteria (which effectively set the Mach number in the tip gap) and the tip flows for both tip geometries were tested at pressure ratio PR in a range of 0.85 to 0.58 which included both subsonic and transonic flow conditions. The leakage flows over the tip of a typical high pressure turbine blade is mostly transonic and hence the transonic conditions tested in this study are applicable to the operational conditions of a typical high pressure turbine.
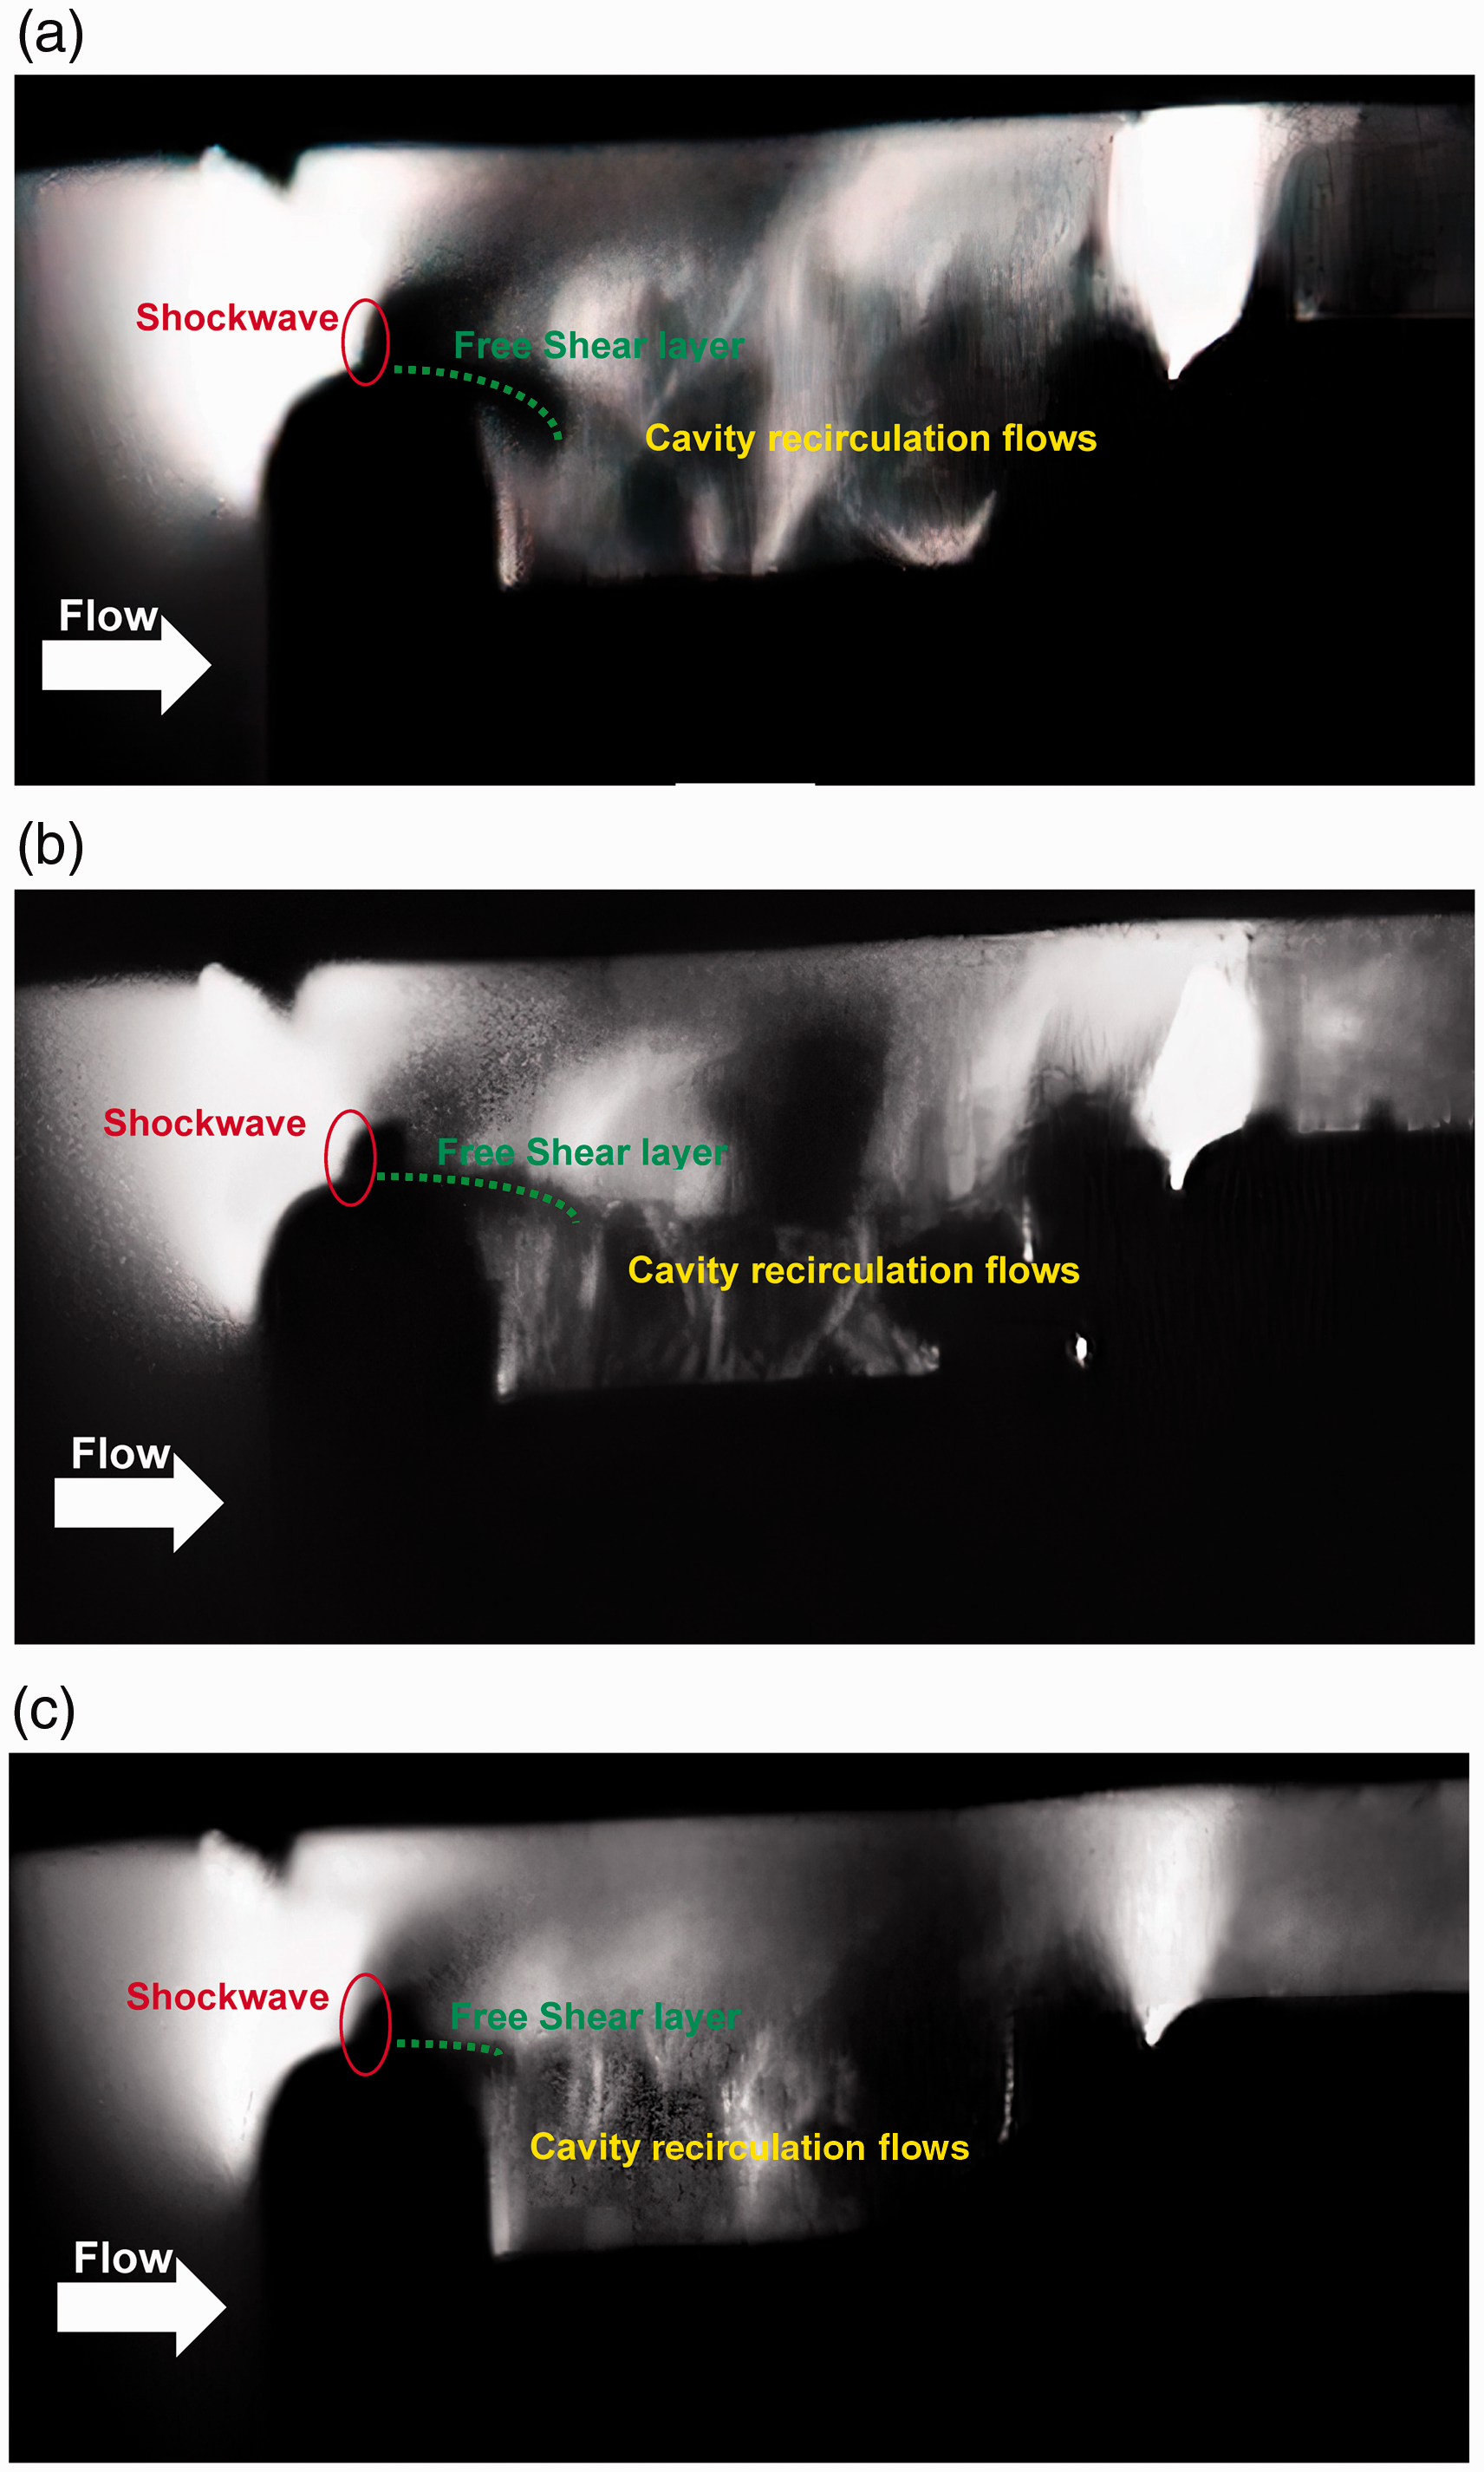
Figure 11 include the Schlieren flow visualisation results of sharp-edge cavity tip at different flow conditions with pressure ratios PRs of 0.58, 0.60, and 0.66. These visualise the flow features over this tip and thereby provide comprehensive understanding of the flow development. Schlieren technique in Figure 11, has visualised the refractive index gradient due to the density gradient since the flows in these cases are of compressible type. Hence density gradient can be defined as the flow parameter based on which the Schlieren results are developed here. As it can be observed from Figure 11, the compressible flow features including the expansion fan, oblique shockwave and flow structure such as the separation bubble are visualised as dark patterns on a bright background. This is due to the fact that the density gradient is very high at those regions in comparison to the rest of the flow field.
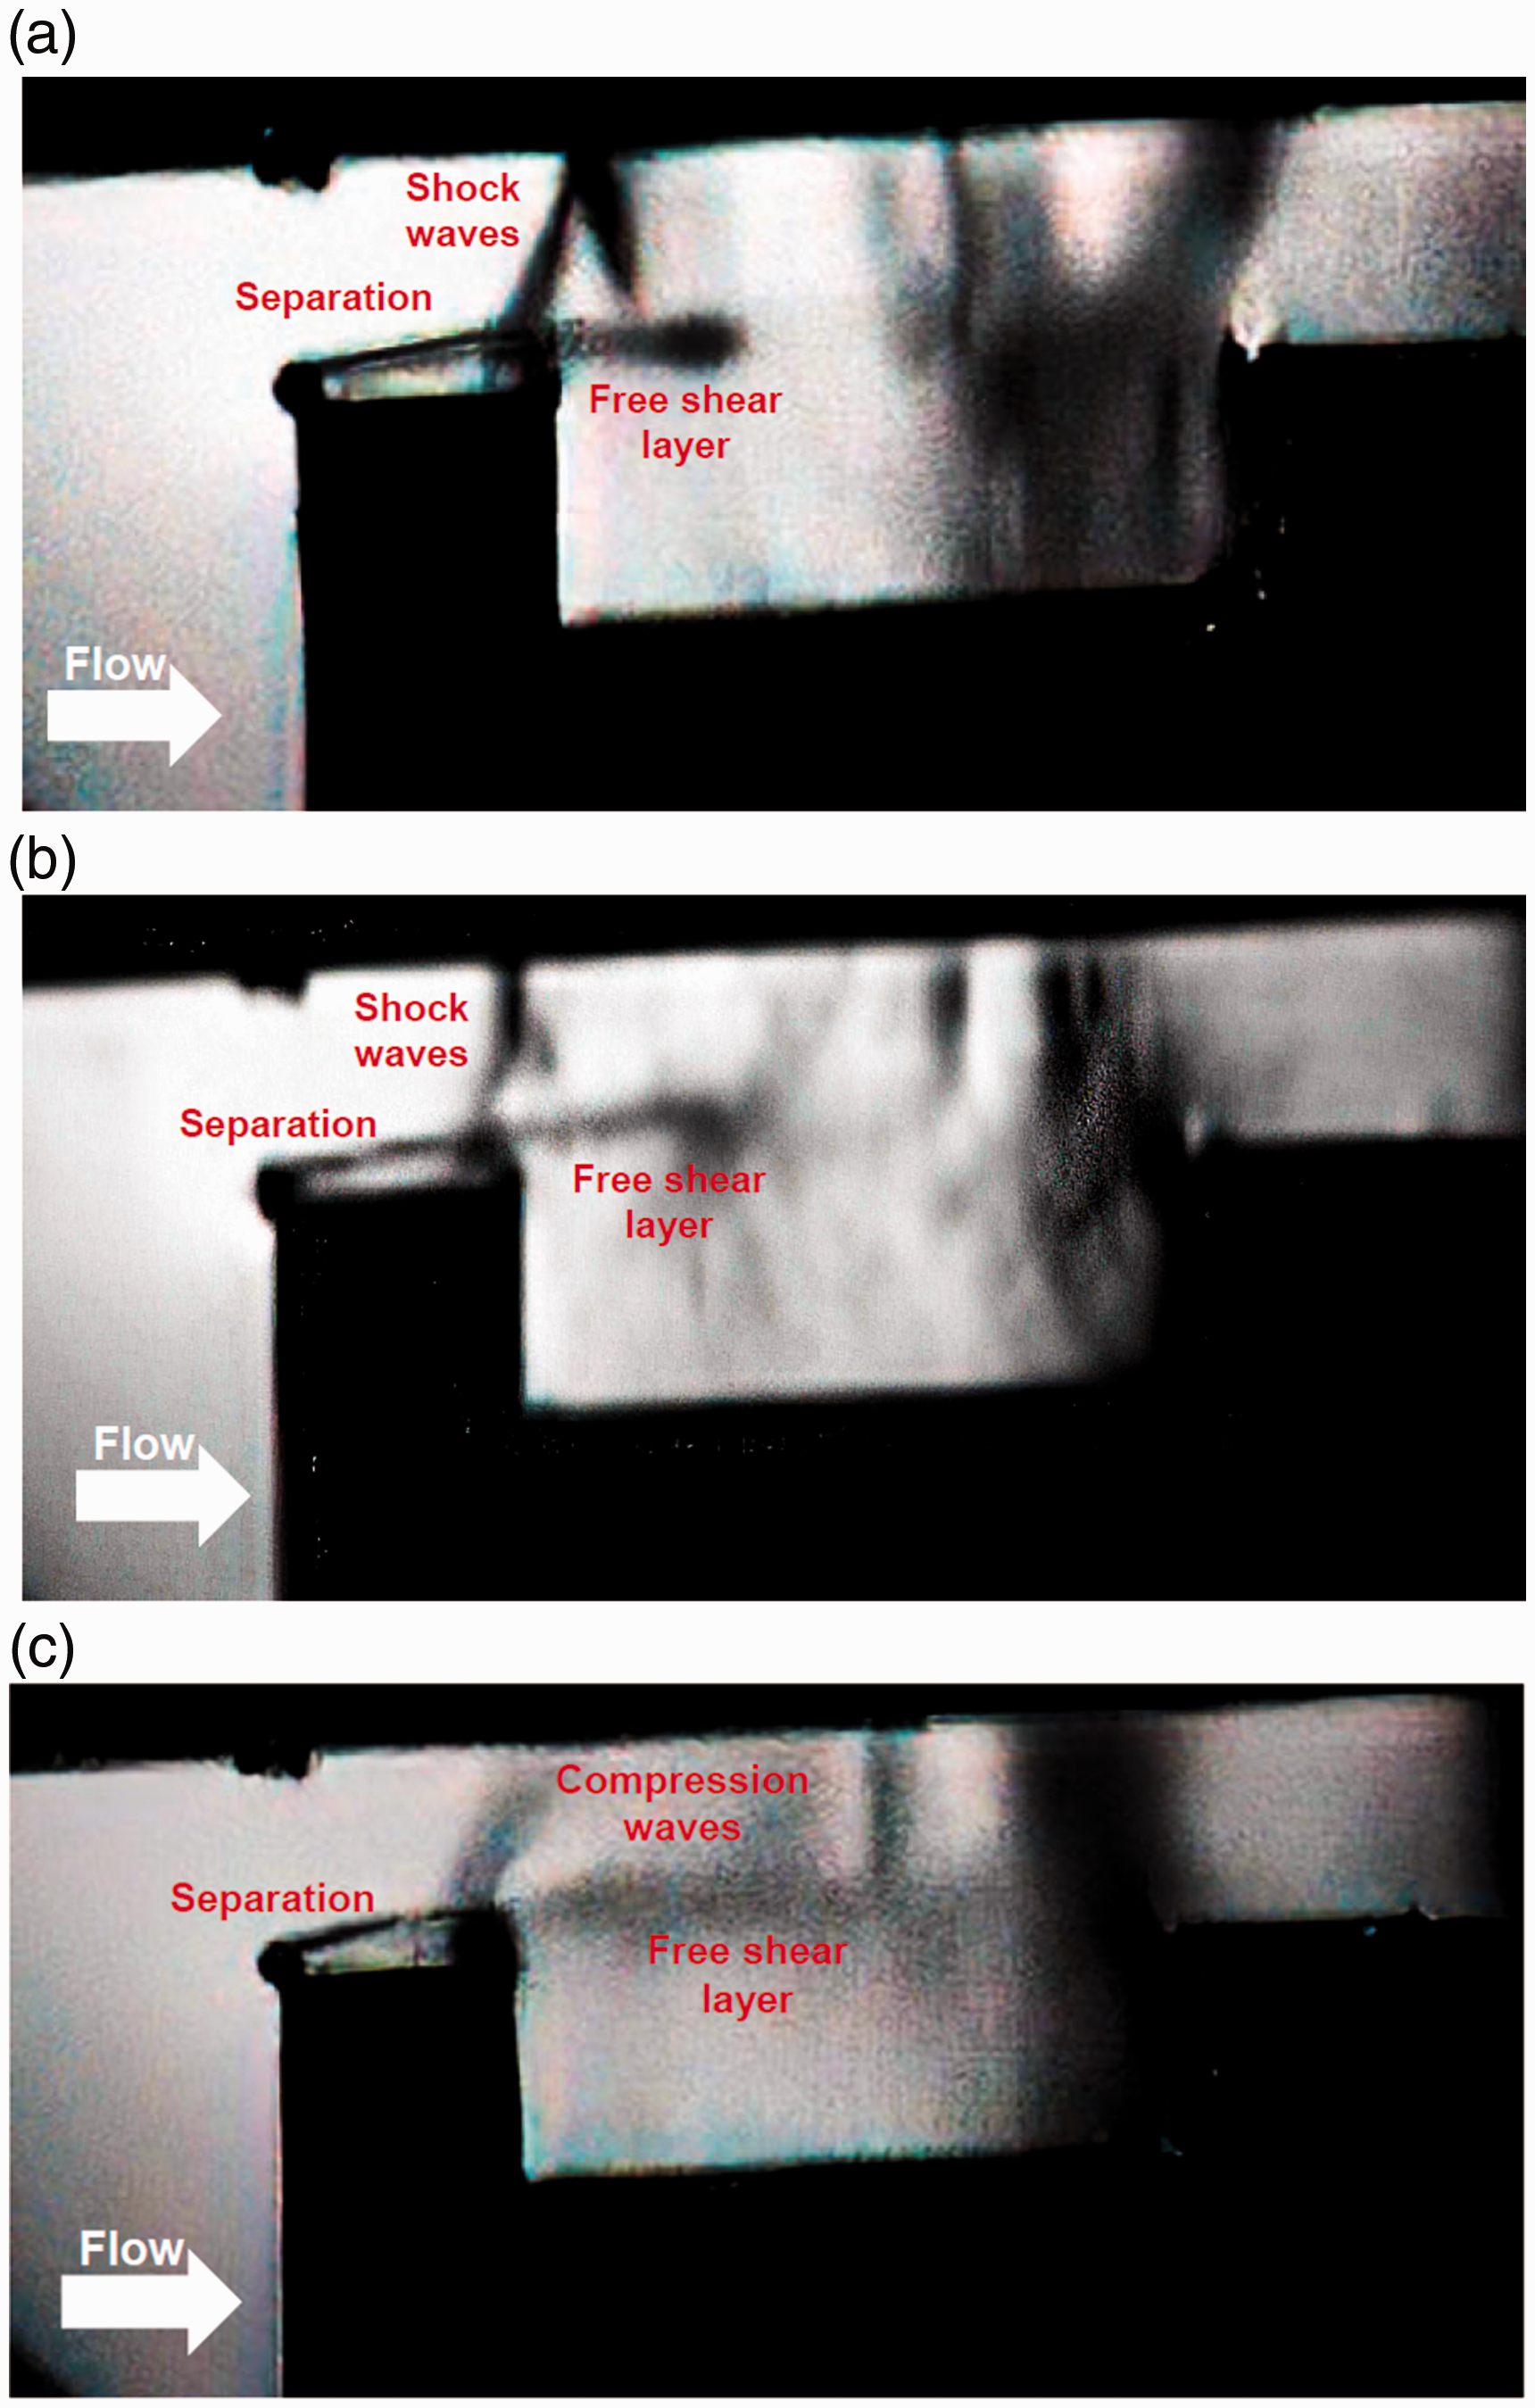
The Schlieren flow visualisation results of the sharp-edge cavity tip model at a) PR = 0.58, b) PR = 0.60 and c) PR = 0.66.
Using Schlieren techniques, the key flow features and pattern are visualised which provide very important understanding of the flow development over different tip geometries. Despite the significance of using this technique there is very limited number of studies which have used it in studying the tip leakage flows most of which represent the result for flat tip blade. This is because producing the transonic flows and capturing the Schlieren for cavity tip is much more challenging and expensive (as compared to flat tip model) as it requires better facility to produce the flow in the working section and better camera to capture the tip leakage flows. The only study which present Schlieren for the cavity tip model (apart from those by the authors of this paper) is Chen et al., 12 the results of which does not visualise as much details as presented here.
As observed in the Figure 11, as the flow approaches the leading edge of the pressure side rim, this rim acts like a flat tip model with a small width. The flow accelerates, turns (through a small expansion fan) and adjusts itself around this edge as it does over the leading edge of an aerofoil however since the edge of this rim is sharp, the tip flow separates on its arrival. The separated flow builds up a vena contracta effect and can accelerate the flow to supersonic speed provided the pressure difference across the tip is sufficient. In all the cases presented in Figure 11, the pressure ratio is such that the tip flow reaches Mach number above 1. Since the width of the rim is not sufficiently long, the separated flow is unable to reattach and leaves this rim as a free shear layer. It travels across the tip until it reaches the second rim i.e. the suction side rim, where no evidence of flow separation is detected.
At the aft portion of the separation over pressure side rim, flow direction has to change and becomes aligned with the tip surface. Since the flow in all the cases presented in Figure 11 is of compressible type, the change of the flow direction occurs through the formation of compression waves. As it can be seen from these figures, for the case with PR = 0.58 the compression waves merge and produce an oblique shockwave which reaches the casing wall and reflects as another shockwave. The reflected shockwave hits the free shear layer developed over the cavity. No further information about the interaction of this shockwave with the free shear layer is captured by the experimental Schlieren flow visualisation. As the pressure ratio PR increases from 0.58 to 0.66 the pressure difference across the gap and hence the acceleration of the tip flow decreases and the captured shockwave becomes less pronounced, meaning it becomes weaker. This is such that in the case of PR = 0.66 the pressure difference is sufficient to accelerate the flow to sonic condition but not to supersonic condition, hence the change of flow direction at aft portion of the separation gives rise to the formation of compression waves but does not result into a shockwave.
The experimental surface static pressure distributions of these cases are shown in Figure 12, which dictates the flow pattern in the Schlieren results. In this figure the streamwise distance 0 < x < 20 mm indicates the pressure side rim, 20 mm < x < 80 mm is the cavity and 80 mm < x < 100 mm belongs to the suction side rim. As it is evident from the plot the pressure variation is very small and almost flattened over the pressure side rim. This is due to the flow separation over this rim which was observed previously in the Schlieren results. In addition, over the cavity floor, the distribution varies very slightly and is almost levelled over about 70% of the cavity surface implying that flow is largely separated over most of the cavity floor. The pressure starts to increase over a small region at the end of the cavity to a level found at the leading edge of the suction side rim after which it increases very moderately.
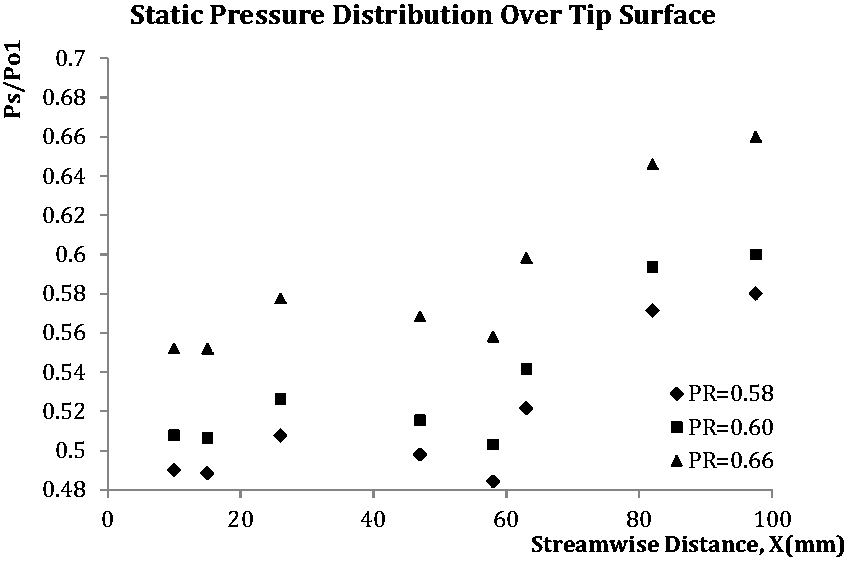
Experimental Surface static pressure distributions over the sharp-edge cavity tip model.
The pressure distributions of all three cases are very similar and none of them include supersonic flow features such as shockwave. This is due to the fact that for supersonic cases with PR of 0.58 and 0.60 shockwave is originally formed over the separation on the pressure side rim and the reflected shockwave hits the free shear layer crossing the cavity and smears through this layer, as illustrated by the Schlieren images. Hence none of the formed shockwaves reach the tip surface and cannot modify the distribution with sudden interruption (which is usually observed in the distribution that include a shockwave).
Schlieren flow visualisations of the round-edge cavity tip are included in Figure 13, which illustrate the flow pattern for a cavity tip exposed to in-service burnout at different flow conditions. Similar to the sharp-edge cavity model, the tip flow in all the presented cases is of compressible type and density gradient is the parameter based on which these figures are formed. Flow features such as shockwave and shear layers are captured as dark pattern on bright background since they are the regions in the flow with high density gradient.
The Schlieren flow visualisation results of the round-edge cavity tip model at a) PR = 0.58, b) PR = 0.60 and c)PR = 0.66.
As the flow approaches the leading edge of the round-edge model similar to the sharp-edge tip it adjusts itself around the model’s leading edge and turns and accelerates. However, since the leading edge is round in this case, leakage flows bend around the tip smoothly with no separation. In all the cases presented by Figure 13, flow acceleration at the tip’s leading edge is sufficient to increase the flow Mach number above 1 and results into development of high speed flow features.
As evident in the Schlieren results a shockwave is formed downstream of the pressure side rim apex. In addition, the flow separates at the same point and leaves the rim as a free shear layer. The question which arises here is whether the separation has caused the formation of the shockwave or the development of the shockwave and its interaction with the boundary layer have resulted into this separation. To answer this URANS computation is performed for this tip geometry with PR = 0.85, where the maximum flow Mach number is 0.657. It is found that although the leakage flow in this case is subsonic and no shockwave is present in the tip gap, separation occurs at similar streamwise position as in the case with PR = 0.58. Hence it can be concluded that flow separation over the pressure rim of round-edge cavity tip model is due to the geometrical gradient. This can act like a disturbance to the supersonic tip flow and cause the formation of a shockwave.
A very interesting flow feature captured by the Schlieren technique is the developed shockwave over the round-edge cavity tip. As it can be observed the shockwave over this tip is short and unlike the one for the sharp-edge model, does not reach the casing surface. This may imply that the acceleration is not uniform across the tip in the traverse direction. It is also evident that there are a lot of recirculation flows inside the cavity and the flow is largely separated in this region. The tip flow in the case of the round-edge cavity tip is more complicated and has much greater unsteadiness than that for the sharp-edge model, hence the Schlieren captured for the round-edge tip is not as clear as the results for the sharp-edge cavity and shows less amount of details.
The surface static pressure distributions over the round-edge cavity tip surface at three different conditions are shown in Figure 14. As it can be observed, the static pressure changes sharply at the inlet to the tip gap over the pressure side rim (i.e. 0 mm < x < 20 mm) for all the pressure ratios, PRs. This is caused by the shockwave formation in this region as evident in the Schlieren images shown previously. The pressure then levels off due to the separation of the flow in that region. Over the cavity surface (i.e. 20 mm < x < 80 mm) the pressure distribution is flattened over most of the surface indicating strong flow recirculation in the cavity as one may expect. Further downstream the pressure starts to increase close to the suction side rim to the value found at the leading edge of this rim. On the suction side rim (i.e. 80 mm<x < 100mm), the static pressure rapidly decreases, implying high flow acceleration around this rim.
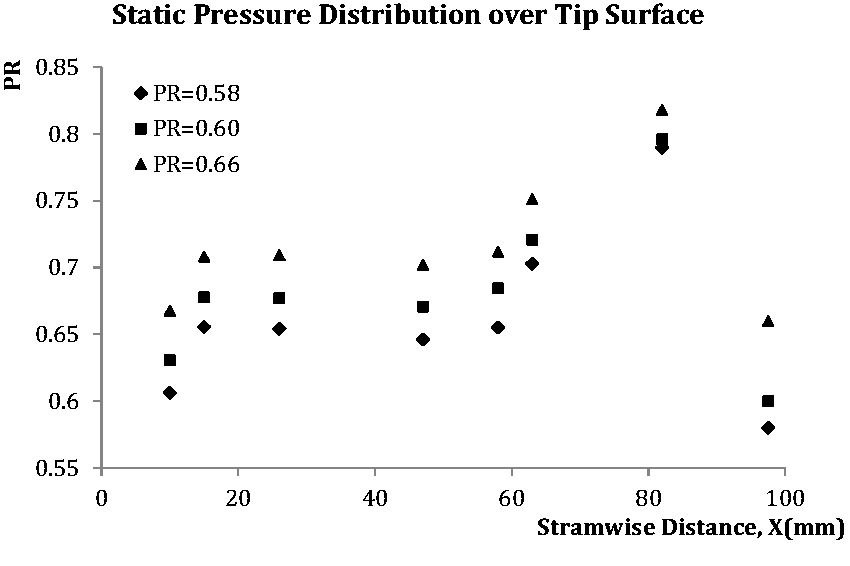
Surface static pressure distributions over the round-edge cavity tip model.
Figure 15 illustrate the computational Mach number contours of both sharp-edge and round edge models for PR = 0.58. As it can be seen there is a very good qualitative agreement between these contours and the Schlieren images for both models. More importantly it can be observed that the rounded edges in the case of round-edge cavity model (i.e. the tip exposed to in-service burnout) changes the flow development over the tip significantly compared to the sharp-edge case (i.e. the tip model at the beginning of its operational life), as was also evident in the Schlieren results. Flow acceleration over the leading edge of pressure side rim is much greater for the round-edge tip than for the sharp-edge cavity. This is such that the tip flow reaches a maximum Mach number of 1.35 for the round-edge cavity, while it accelerates up to 1.18 for the sharp-edge model.
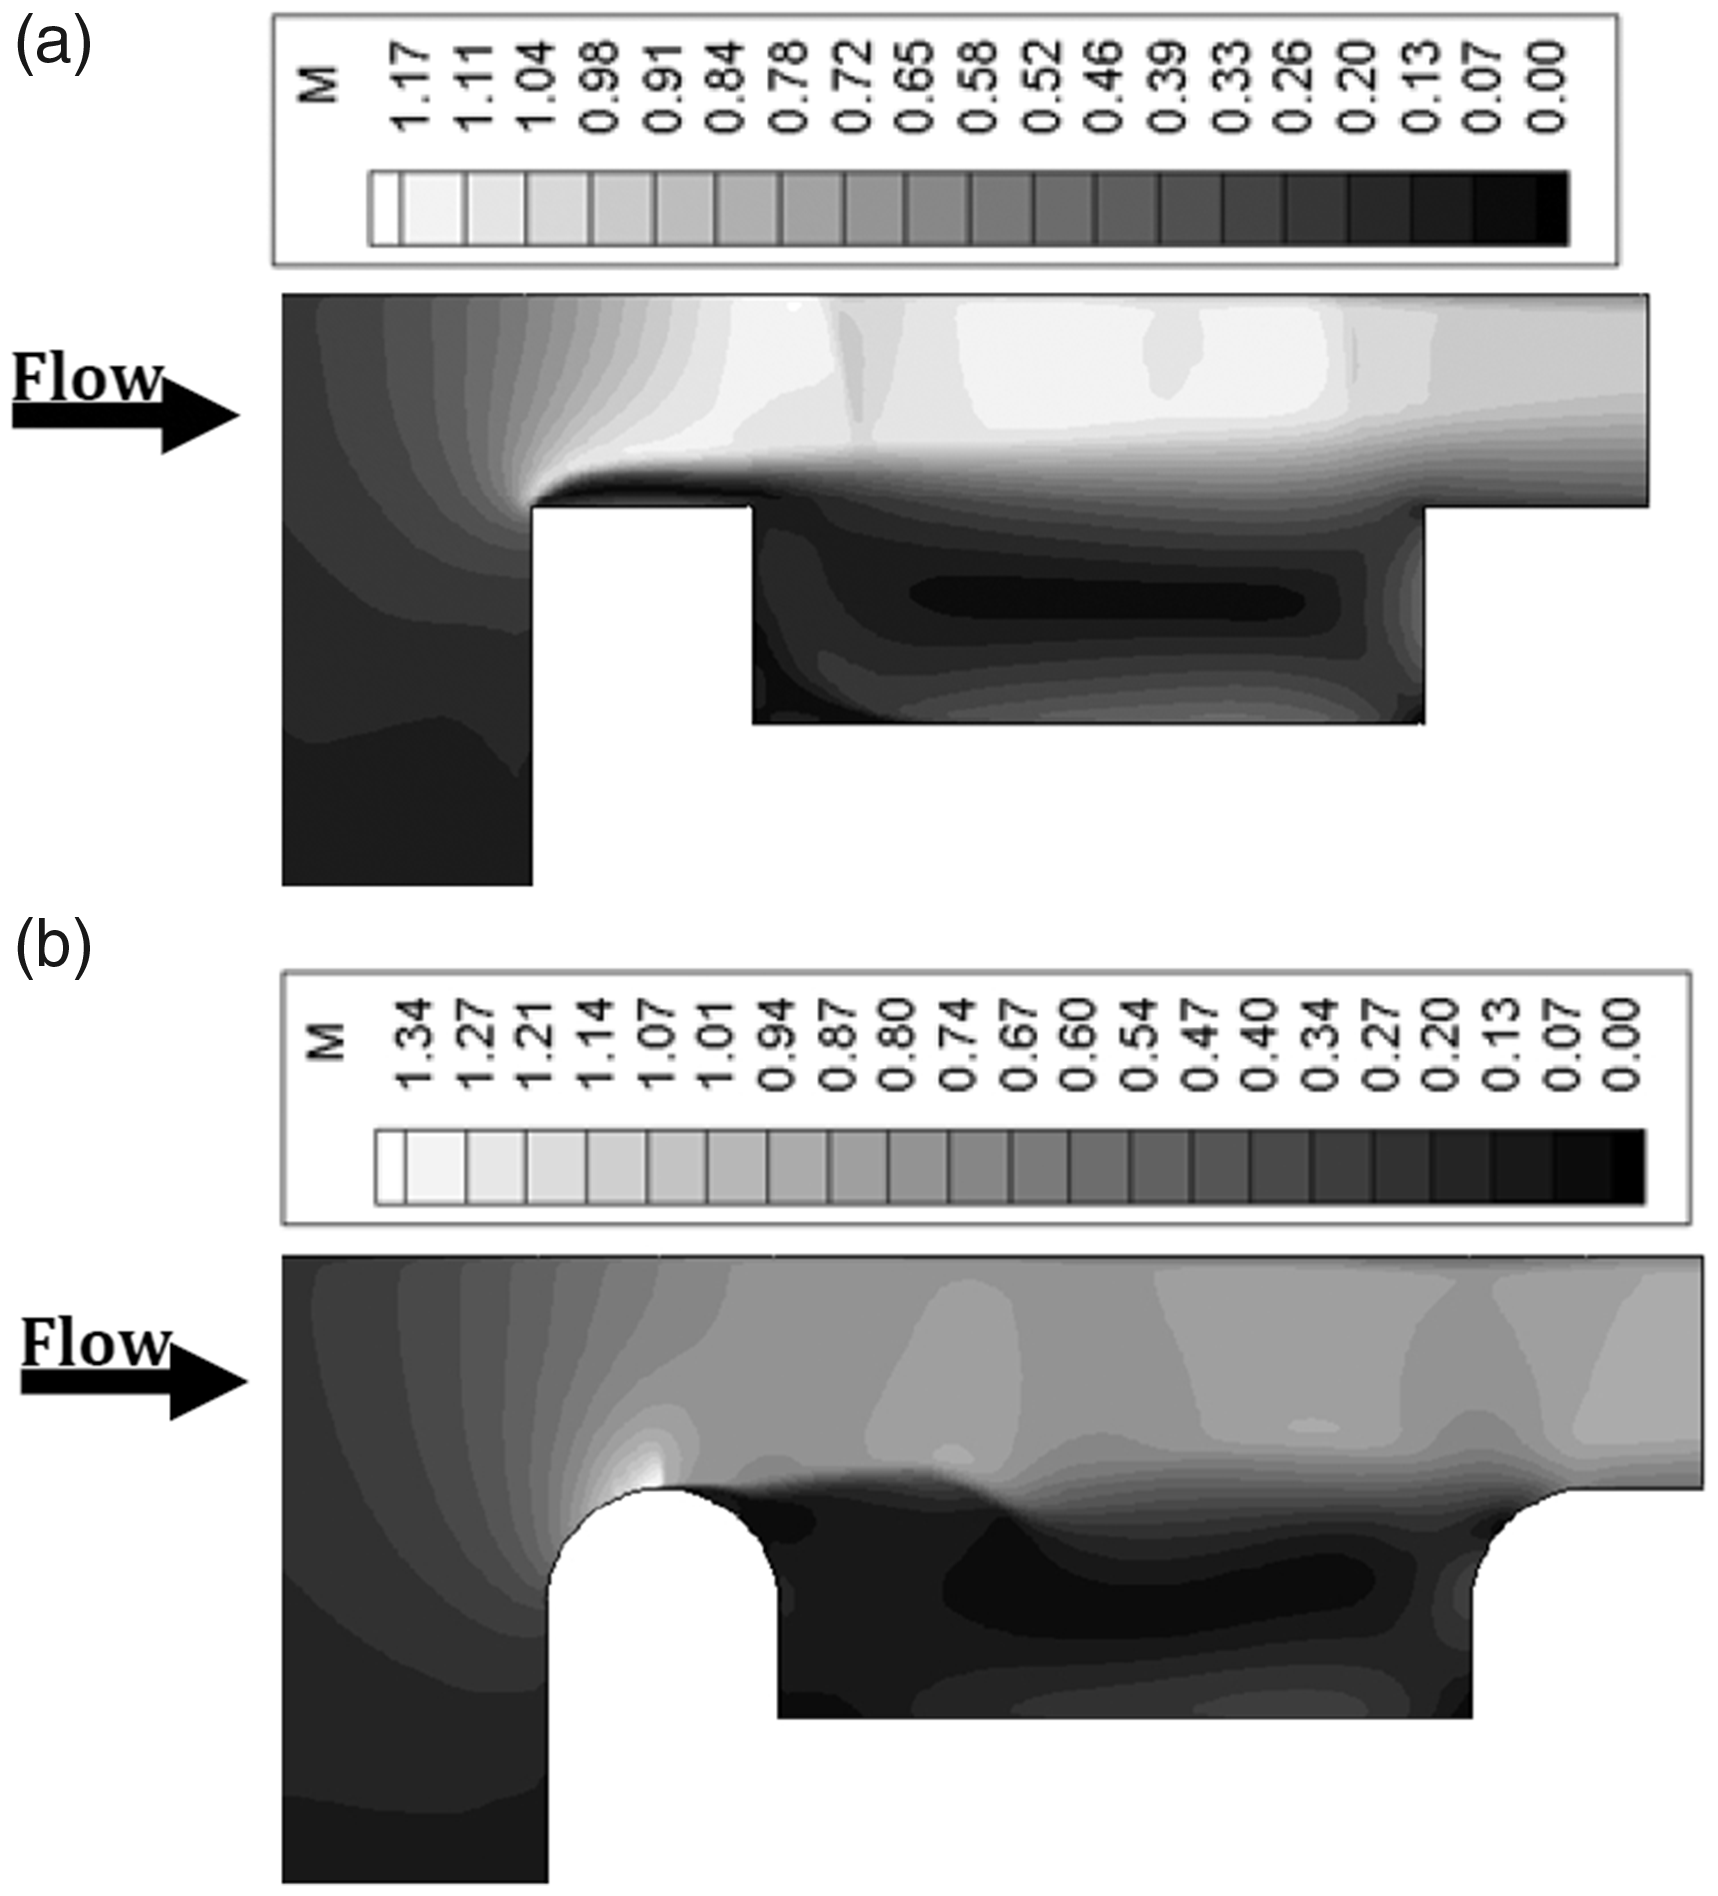
(a) The computational Mach number contours of the sharp-edge cavity tip model with PR = 0.58. (b) The computational Mach number contours of the round-edge cavity tip model with PR = 0.58.
One very important difference between the flow developments over the two geometries is in the formation of shockwave over the pressure side rim. As it was captured by Schlieren, the shockwave does not reach the casing wall in the case of round-edge cavity model. The Mach number contours show that flow Mach number significantly changes in the traverse direction for this tip (i.e. from the tip surface to the casing surface in the vertical direction). This variation is such that leakage flow close to the tip surface reaches supersonic Mach numbers while the flow near the casing wall at the same streamwise location is subsonic. This means that the acceleration of the tip flow varies considerably across the tip gap height (i.e. in the vertical direction) and as a result of this variation, part of the flow which has reached supersonic condition includes a shockwave. This shockwave development is very similar to the one over the transonic aerofoil.
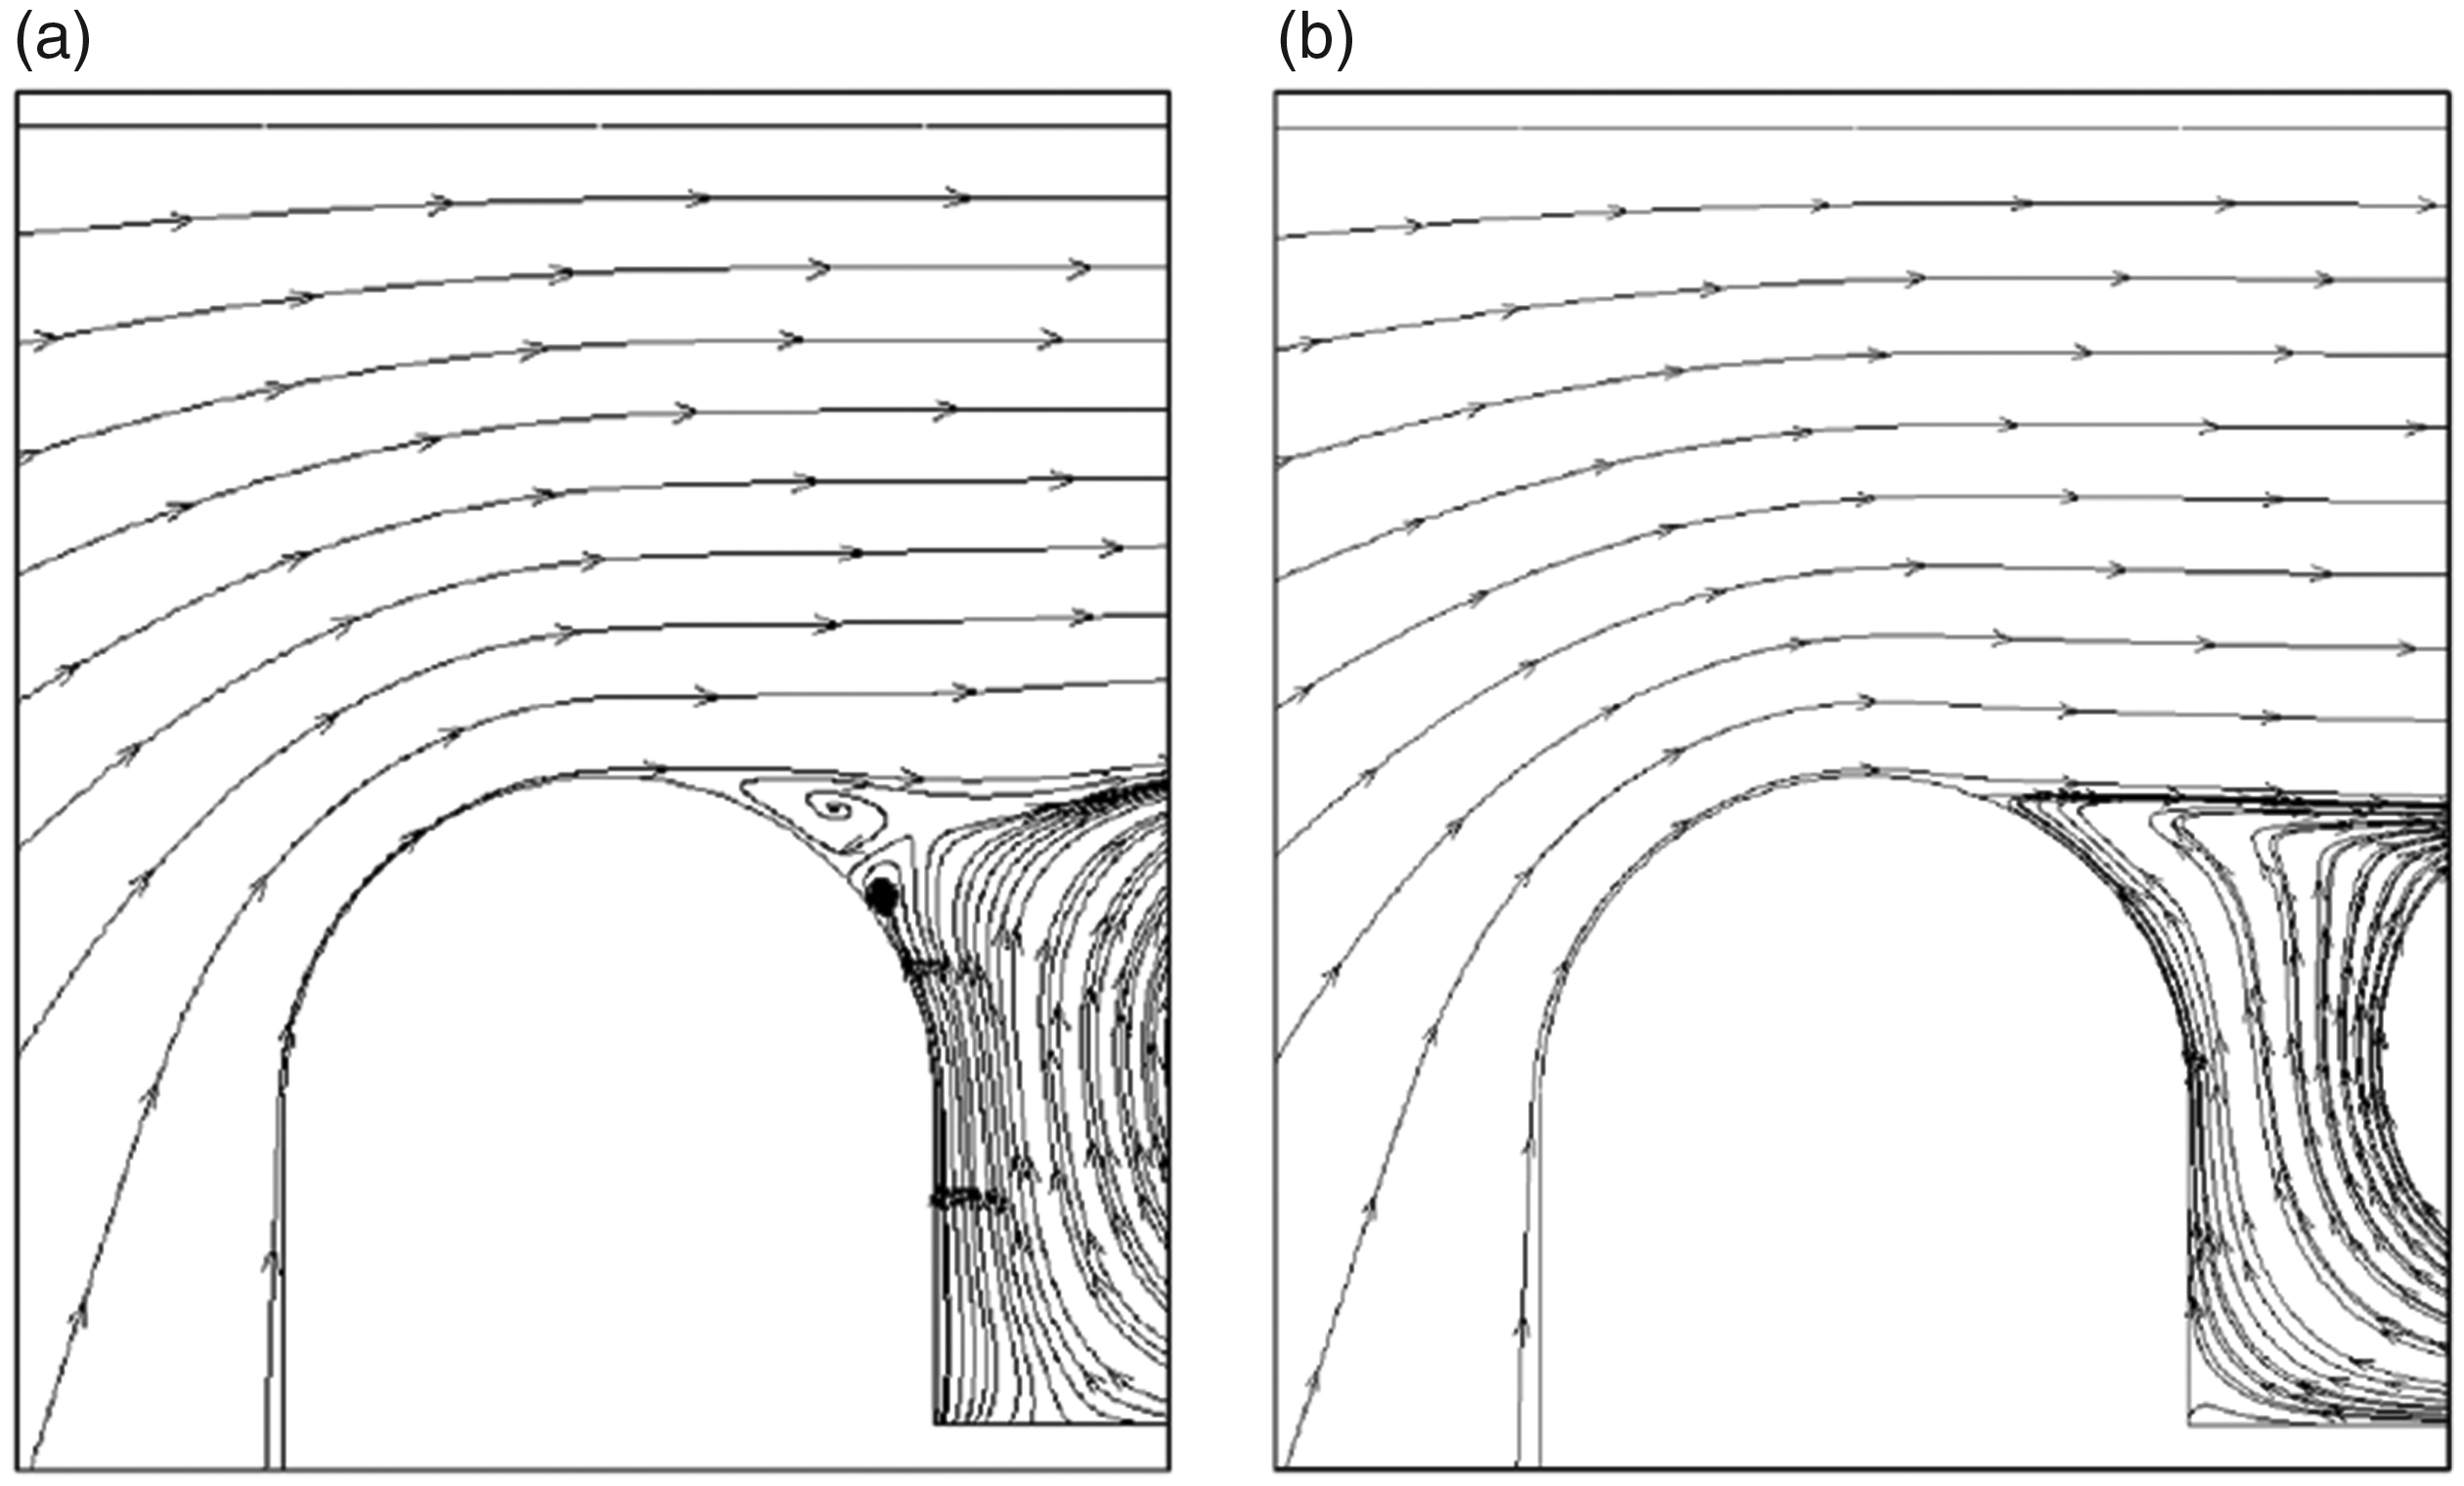
The computational flow velocity streamlines shown in Figure 16 clearly capture features such as flow separation and flow smoothness for both tip geometries at PR = 0.58. In the case of the sharp-edge geometry, there is a large flow separation on the pressure side rim. This occurs on the flow arrival due to the pressure side edge being sharp and results into a large separation bubble at the inlet to the tip gap. The effective tip gap for this model is defined as the minimum distance between the separation bubble at the inlet and the casing surface. The effective tip gap in this case is about 16.5 mm in comparison to the geometrical tip gap which is 20 mm, this means the separation bubble at the inlet to the tip has reduced the effective tip gap for this model by about 17%.
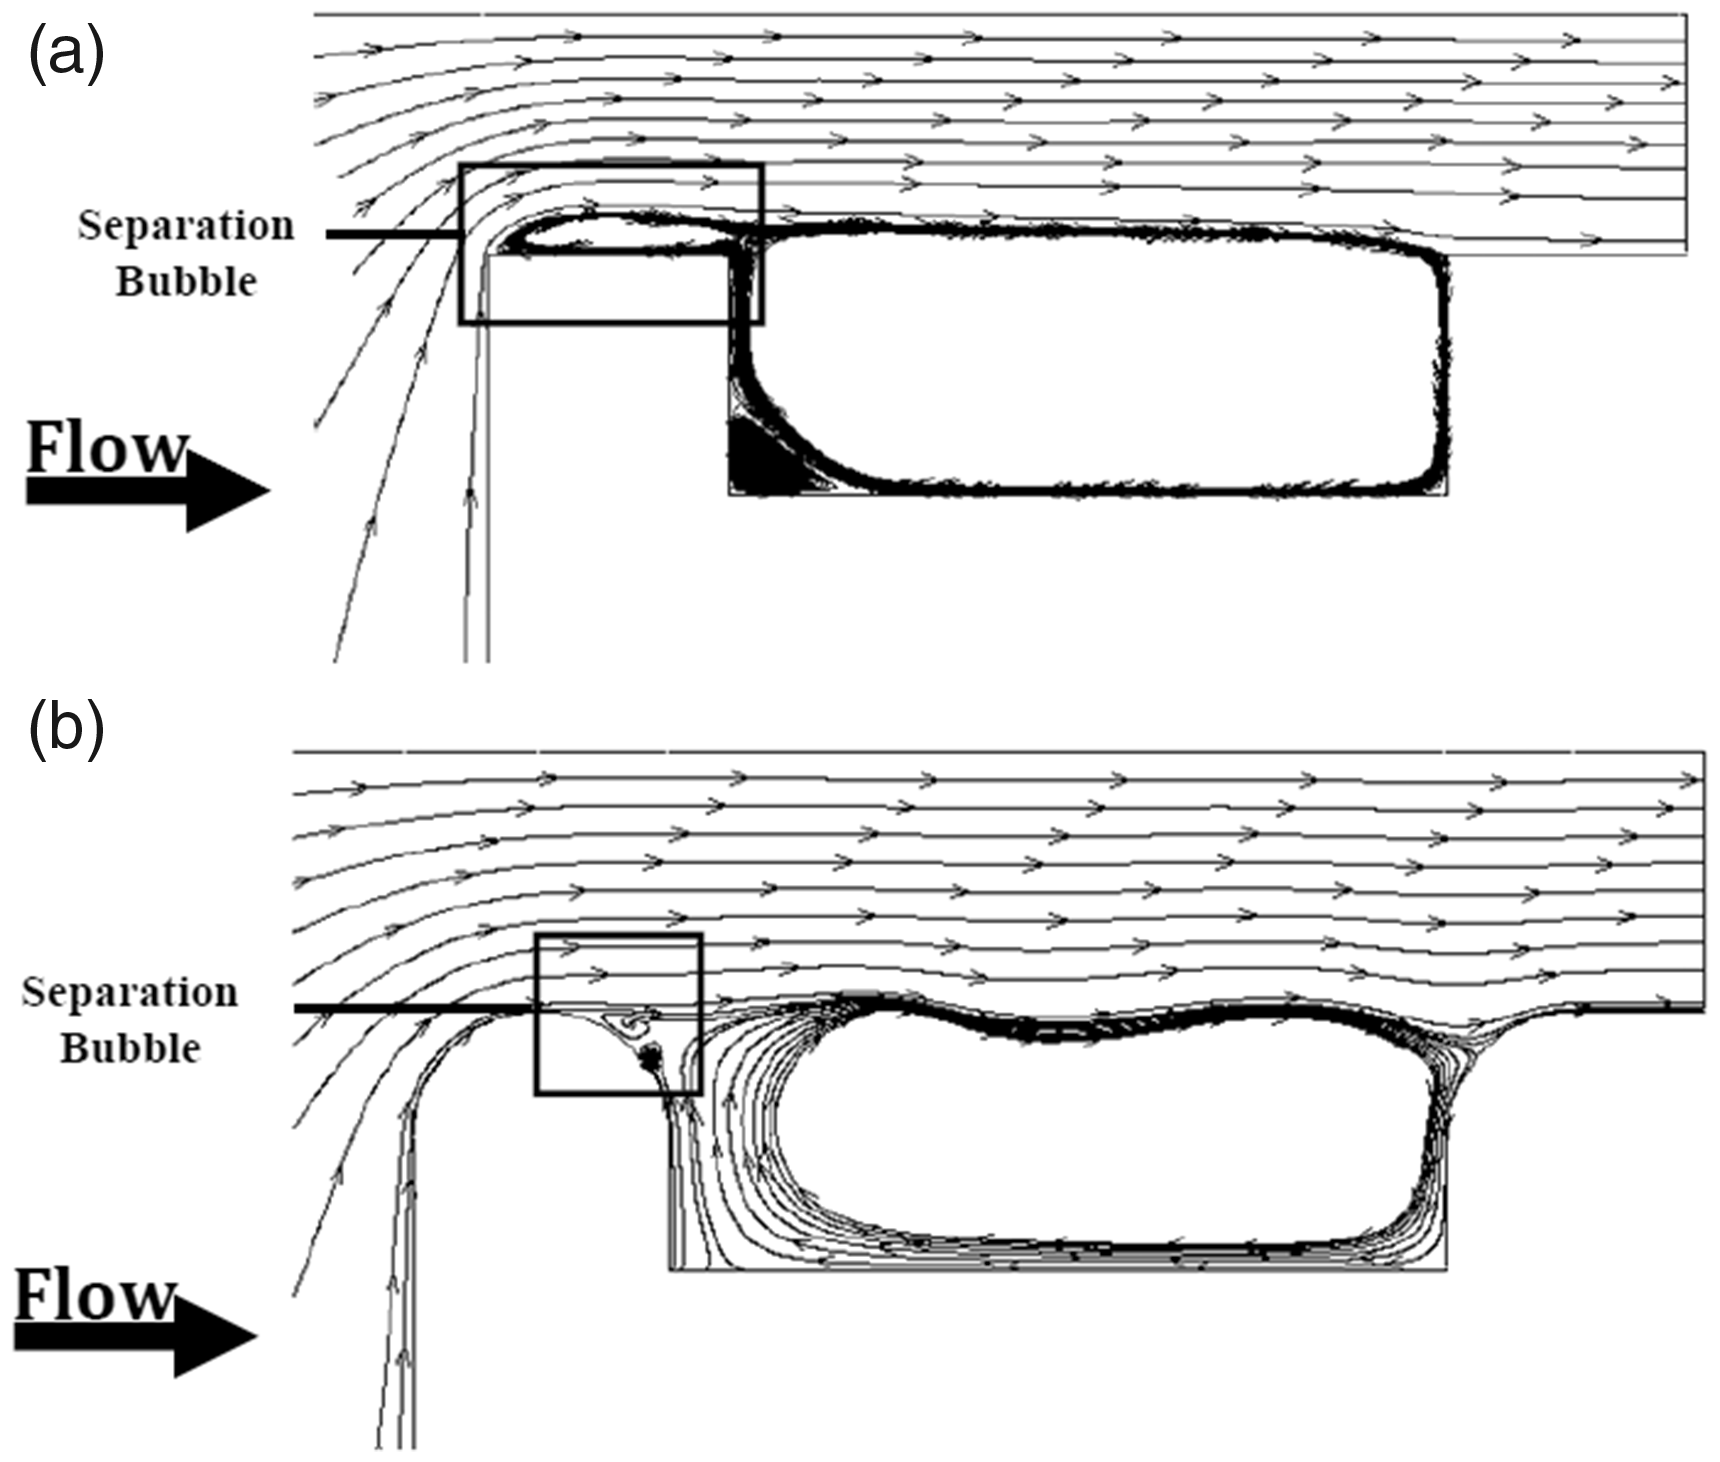
(a) The computational streamline diagram of sharp-edge cavity tip with PR = 0.58. (b) The computational streamline diagram of round-edge cavity tip with PR = 0.58.
For the round-edge tip model however leakage flow adjusts itself smoothly around the pressure side rim on its arrival with no separation at the inlet. Flow remains attached over more than 50% of the rim before it gets separated at a point downstream of the rim’s apex due to the geometrical gradient. As evident in the streamline diagram this separation does not reduce the effective tip gap for this tip model since the height of the separation bubble does not add to the height of pressure side rim. Hence the effective tip gap in this case is equivalent to the geometrical tip gap i.e. the minimum distance between the tip and casing surfaces which is 20 mm. Comparing the two geometries, it can clearly be observed that the effective tip gap is much larger for the round-edge cavity than the sharp-edge model. Hence the tip leakage flow and its associated losses are expected to be greater for the round-edge tip in comparison to the sharp-edge one.
Both Mach number contours and streamline diagrams show that the cavity region is occupied by significant recirculating flows for both tip geometries. The intensity of the recirculating flows tends to increase towards the suction side corner in both cases. Over the suction side rim, there is no evidence of flow separation for the sharp-edge cavity tip model and leakage flow is attached over this rim. However in the case of the round-edge cavity model, tip flow is separated at the leading edge of this rim and further downstream flow reattachment occurs within 25% of the rim length (measured from the rim leading edge). Moreover flow acceleration around the leading edge of suction side rim is much greater for the round-edge tip model than for the sharp-edge cavity.
The experimental and computational static pressure distributions over the tip surfaces of the sharp-edge and round-edge cavity tip models for PR = 0.58, are illustrated in Figure 17. The region 0 mm < x < 20 mm indicates the streamline position of the pressure side rim, 20 mm < x < 80 mm is the cavity surface and 80 mm < x < 100 mm belongs to the suction side rim.

Static pressure distributions over tip surface, at PR = 0.58.
Over the pressure side rim, pressure variation is almost flat for the sharp-edge cavity tip due to the flow separation over this rim, whereas for the round-edge cavity model there is a large interruption over this rim due to the shockwave formation at that region. Within the cavity, the distributions show almost zero pressure variation over most of the cavity floor for both models since the flow is completely separated over this floor and significantly recirculating flows are occupied in this region for both geometries. Despite the similar distributions over the cavity surface for both tip geometries, the magnitude of the
Comparison between the distributions shows a strong agreement between the experimental and computational data for both tip geometries. In some regions over the tip surface the agreement is so strong that the computational and experimental data show the same pressure values and in the rest of the regions the values are very similar with a very small error. There are only two points on the sharp-edge cavity distribution and one point on the round-edge cavity tip distribution where the experimental and computational values are more distinguishable and separated from each other but with very small error.
For the sharp-edge model these correspond to the flow over the pressure side rim and flow over the cavity surface (and at the streamwise distance of about 60 mm from the tip leading edge) and for the round-edge model the point corresponds to the flow over the cavity surface (and on the streamwise of 60 mm from the tip leading edge). In the case of these three points, the flow is completely separated and the small difference between values at these points can be due to small mismatch between the simulated intensity of these separated flows in comparison to the flow intensity in the experiments.
Loss estimation, discharge coefficient
As it was mentioned previously in the introduction section, tip leakage flows have significant impact on both the blade operational life and the aerodynamic performance of the gas turbine engines. They are known to contribute to about one third of the total losses within a turbine stage. In addition, the losses associated with leakage flows are proportional to their mass flow rate and increase for larger mass flow rates. Therefore, any small advancement in decreasing these flows can lead to a significant improvement in the stage efficiency and hence engine performance and efficiency. Therefore, optimal tip geometry is the one which allows the least leakage flows into tip gap.
In this study, the discharge coefficient


The variation of discharge coefficient,
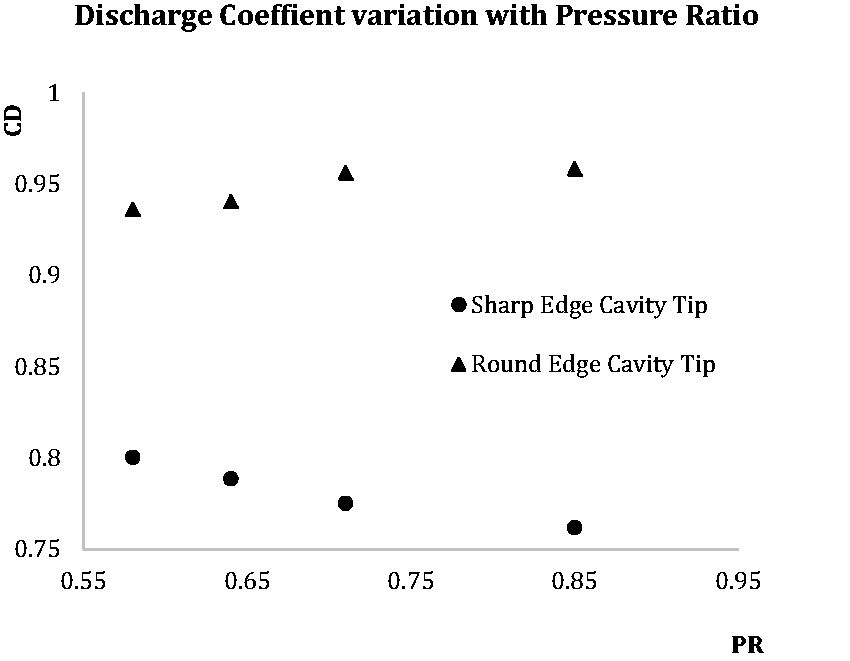
Computational discharge coefficient,
As the pressure ratio decreases from 0.85 to 0.58, the pressure difference across the tip increases, the tip flow acceleration increases and changes from being subsonic to supersonic. For the sharp-edge tip, the discharge coefficient increases as the pressure ratio decreases. This variation is due to a change in the size of the separation bubble at the inlet to the tip gap, as the PR decreases the tip flow acceleration increases and this suppresses the separation at the inlet. Suppression of the separation bubble increases the effective tip gap and allows more leakage flow to enter the tip gap, hence the discharge coefficient increases. Therefore, the separation over pressure side rim of this tip geometry plays a vital role in determining the discharge coefficient compared to the other flow features such as the oblique shockwave over this rim in the supersonic cases. This is an important result and provides a very significant understanding about this tip geometry which can be used in its design process to optimise and modify it accordingly to give its best performance in reducing the losses due to the tip leakage flows.
The
Flow streamlines around the pressure side rim of round-edge cavity tip at (a) PR = 0.58 and (b) PR = 0.64.
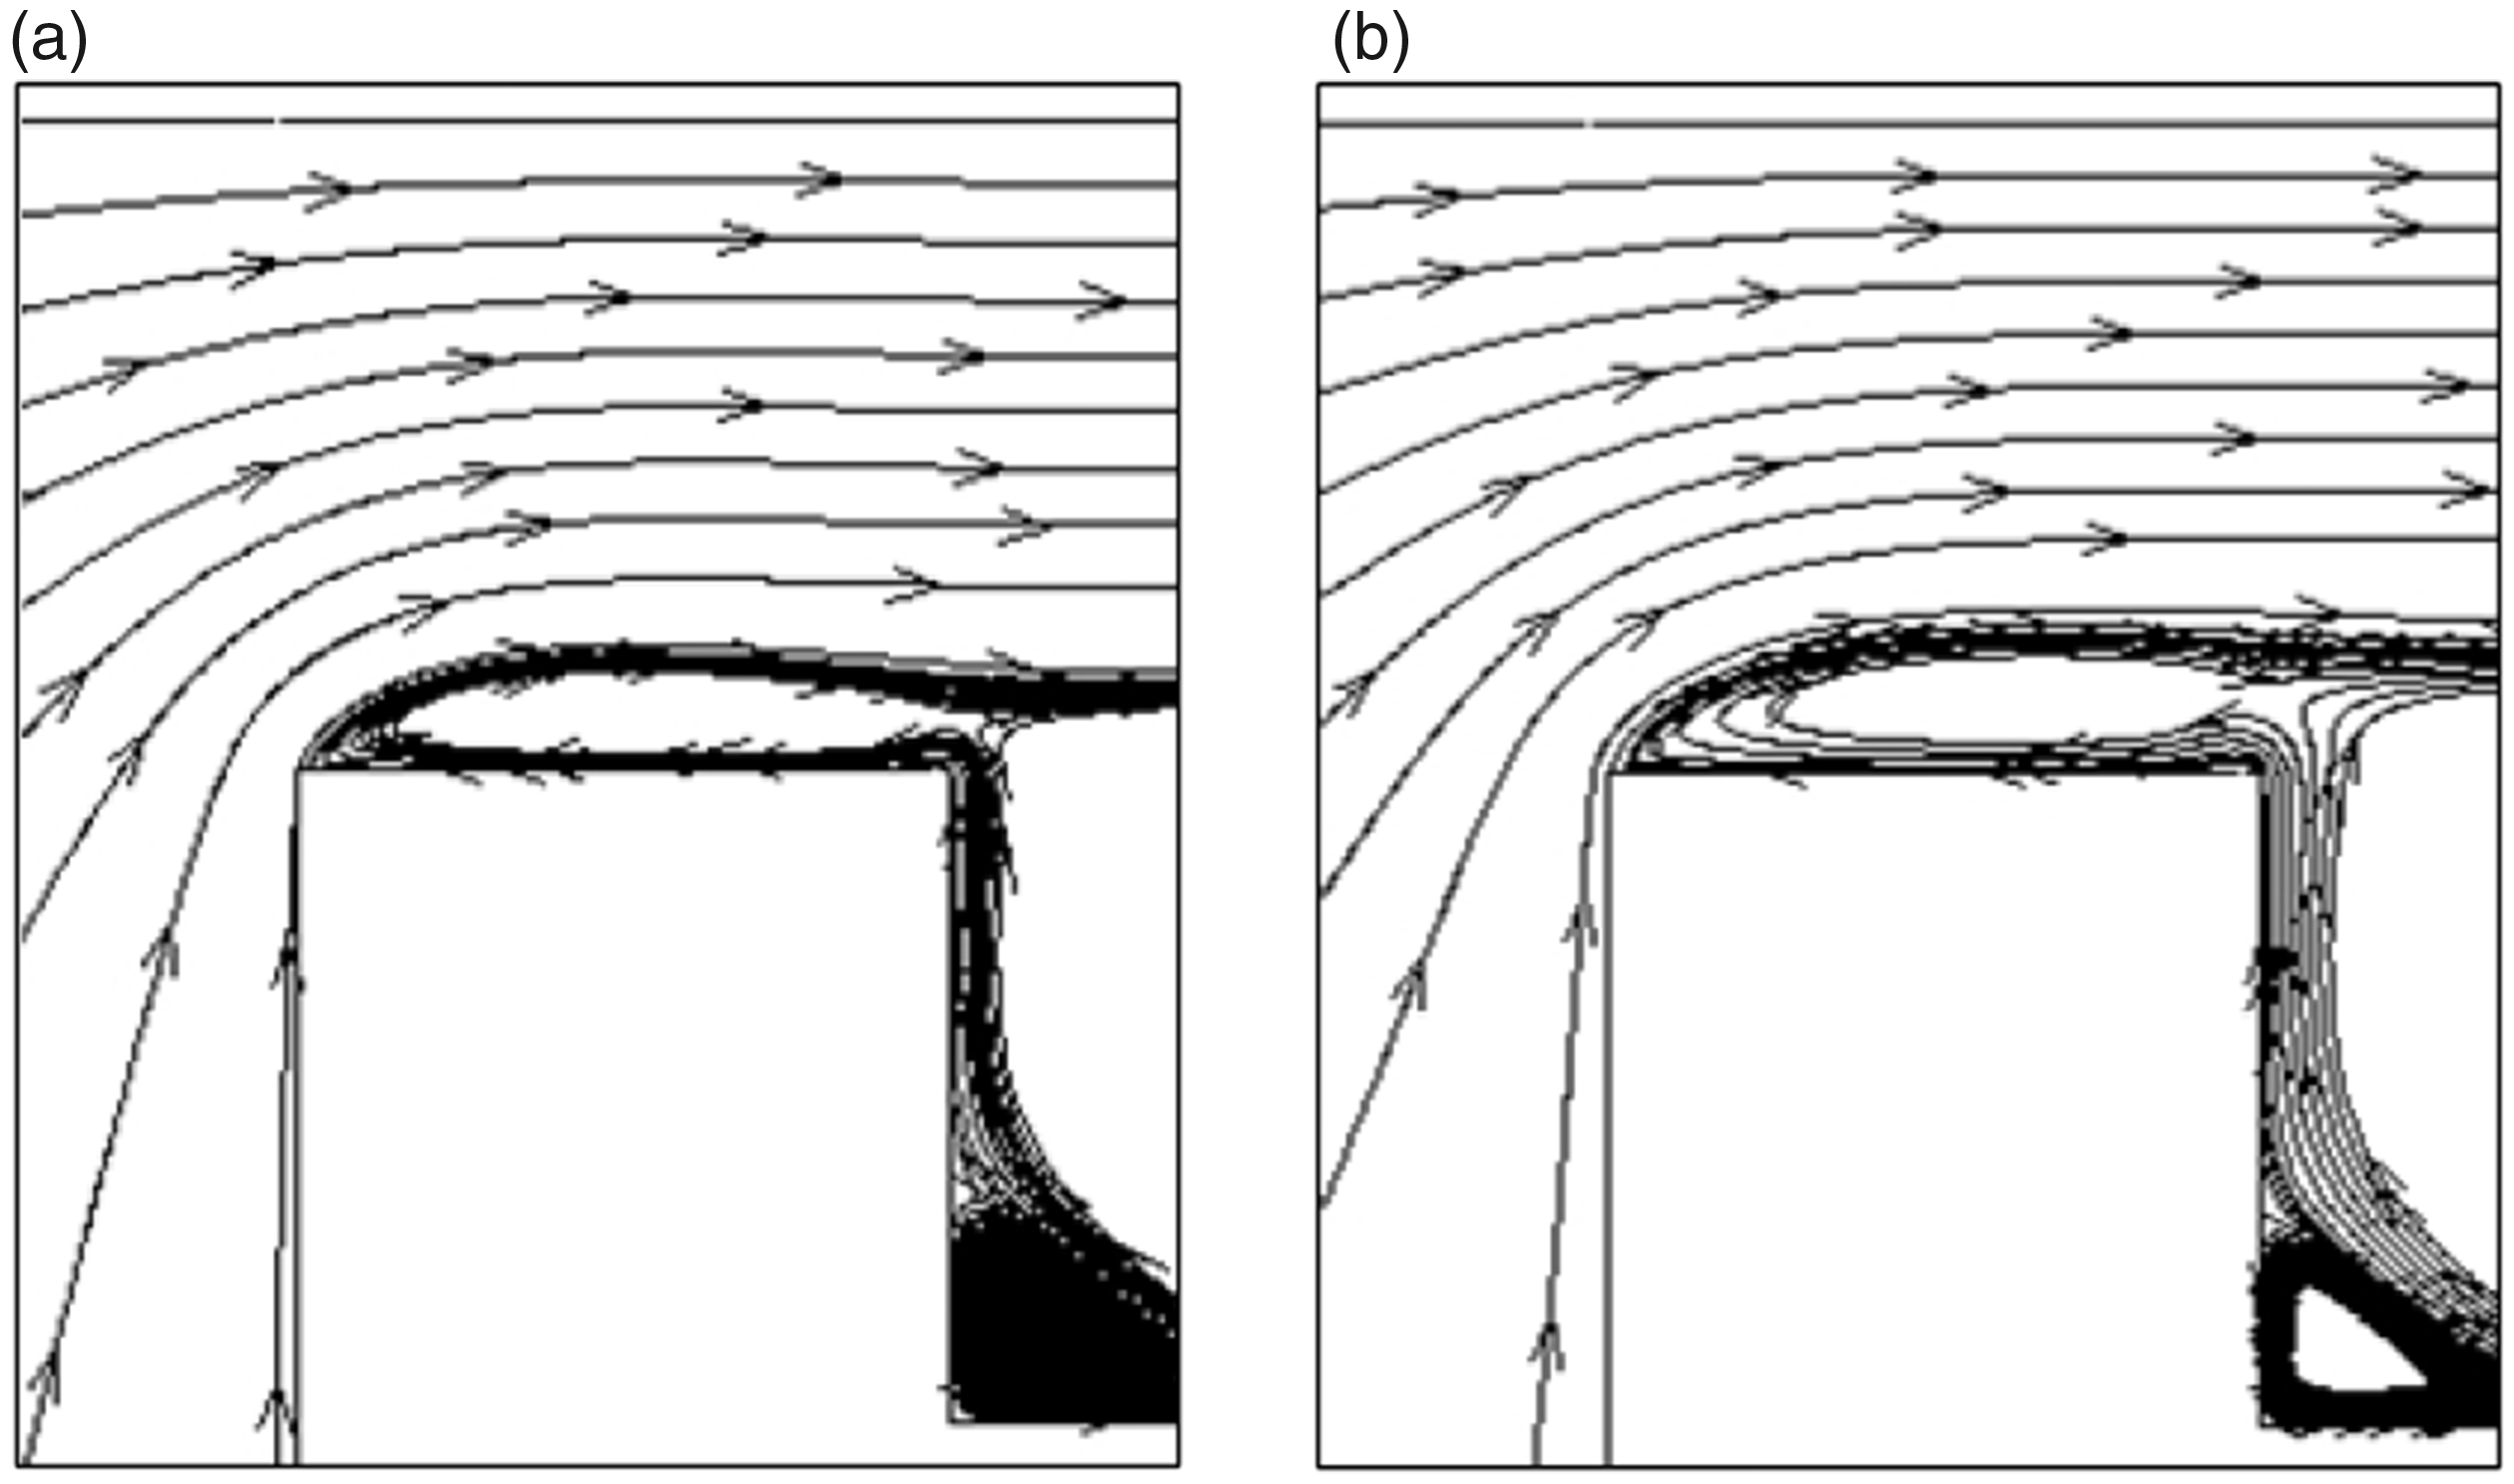
Flow streamlines around the pressure side rim of sharp-edge cavity tip at (a) PR = 0.58 and (b) PR = 0.64.
As it is evident from Figure 19(a) and (b), the flow separation over this rim occurs earlier for PR = 0.58 and forms a larger separation bubble when compared to the flow with PR = 0.64. A larger bubble in the case of PR = 0.58 deflects the tip flow more upwards (i.e. towards the casing wall) which produces more blockage effect to the flow entering the tip. This consequently decreases the tip leakage flow and its associated losses and reduces the discharge coefficient. Despite the fact that the tip flows in both cases presented in Figure 19 are of supersonic type, flow separation is larger for the case with PR of 0.58. This is since the pressure difference across the tip and hence tip flow acceleration are larger for this flow condition which results into development of a stronger shockwave in this case in comparison to PR = 0.64. Stronger shockwave gives rise to stronger interaction with the flow over this rim and develops a larger separation.
Comparison of Figure 19(a) and (b) with the streamline diagrams of the sharp-edge model in Figure 20 shows that the separation bubble over the pressure side rim of the sharp-edge cavity occurs at the flow’s arrival due to the tip leading edge being sharp and becomes smaller as PR decreases from 0.64 to 0.58. This is since as the PR decreases the pressure difference across the tip and hence leakage flow acceleration increases which gives rise to the suppression of the bubble and decreasing its size. As the separation bubble becomes smaller, its blockage effect decreases and hence allowing more leakage flow to enter the tip gap, consequently the discharge coefficient becomes larger. Since the shockwave is formed at the aft portion of the separation bubble via a merge of compression waves in the case of the sharp-edge model, it does not affect the size of the separation bubble. Hence the separation bubble size in this case is controlled by the acceleration of the tip leakage flow over it.
Comparing the effect of the in-service burnout on the leakage flows over a cavity tip model studied in this investigation to that in the case of a flat tip model studied by Saleh et al., 25 it can be concluded that the round-edge in the case of both the round-edge cavity tip and round-edge flat tip redistributed the leakage flow significantly in comparison to the tips with sharp edges. In addition, both round-edge cavity and flat tips gave rise to similar shockwave structure and removed the separation bubble at the inlet to the tip gap (which was present in the case of the sharp-edge cavity tip and sharp-edge flat tip models). Despite this similarity, the flow over round-edge cavity was unsteady and produced a separation over the pressure side rim after the rim apex whereas the flow over the round edge flat tip remained steady and attached all the way through the tip gap.
Conclusion
This paper presents a comprehensive study of high pressure turbine blade tip leakage flows at high speed conditions. The in-service burnout effect is studied for a cavity tip via testing and comparing two tip geometries; sharp-edge cavity tip model and round-edge cavity tip model. This is the first investigation, to the knowledge of the authors, which studies this effect for the cavity tip. It gives an extensive details and provides a comprehensive insight into the behaviour of the leakage flow as it crosses the tip in the case of these geometries. The study is carried out both experimentally and computationally and detailed qualitative and quantitative flow measurements are presented.
It is found as the flow approaches the leading edge of the sharp-edge cavity tip model, it accelerates and adjusts itself around the tip geometry as it does around an aerofoil. However, since the tip edge is sharp, the flow separates on its arrival at the tip and produces a separation bubble. In addition, since the pressure side rim width is not sufficient for reattachment, the flow leaves the rim as a free shear layer, in other words the pressure side rim acts as a flat tip model with a small width. In this case the effective tip gap is defined as the minimum distance between the separation and the casing wall. In the case of the round-edge cavity model, the leakage flow adjusts itself smoothly with no separation at the tip leading edge, however the flow separates downstream of the apex point of the pressure side rim due to a geometrical gradient. Nevertheless, this separation is such that it does not reduce the effective tip gap for this tip model, hence the effective tip gap in this case is equal to the geometrical tip gap and is larger than the one for the sharp-edge model.
Moreover, it is found that the discharge coefficient,
Therefore, it is concluded that the in-service burnout effect on the cavity tip model redistributes the tip flow, eliminates the separation at the leading edge of pressure side rim, produces a separation downstream of the pressure side rim apex, and results in a larger effective tip gap, greater tip leakages flows and hence larger discharge coefficient,
Footnotes
Acknowledgements
The advice given by Dr. Wheeler of University of Cambridge for the experimental set up is appreciated.
Declaration of Conflicting Interests
The author(s) declared no potential conflicts of interest with respect to the research, authorship, and/or publication of this article.
Funding
The author(s) disclosed receipt of the following financial support for the research, authorship, and/or publication of this article: The support of the UK EPSRC doctoral training program is greatly acknowledged. The support from Rolls-Royce for building the experimental model is greatly appreciated.