
Abstract
With the transition to more use of renewable forms of energy in Europe, grid instability that is linked to the intermittency in power generation is a concern, and thus, the fast response of on-demand power systems like gas turbines has become more important. This study focuses on the injection of compressed air to facilitate the improvement in the ramp-up rate of a heavy-duty gas turbine. The steady-state analysis of compressed airflow injection at part-load and full load indicates power augmentation of up to 25%, without infringing on the surge margin. The surge margin is also seen to be more limiting at part-load with maximum closing of the variable inlet guide vane than at high load with a maximum opening. Nevertheless, the percentage increase in the thermal efficiency of the former is slightly greater for the same amount of airflow injection. Part-load operations above 75% of power show higher thermal efficiencies with airflow injection when compared with other load variation approaches. The quasi-dynamic simulations performed using constant mass flow method show that the heavy-duty gas turbine ramp-up rate can be improved by 10% on average, for every 2% of compressor outlet airflow injected during ramp-up irrespective of the starting load. It also shows that the limitation of the ramp-up rate improvement is dominated by the rear stages and at lower variable inlet guide vane openings. The turbine entry temperature is found to be another restrictive factor at a high injection rate of up to 10%. However, the 2% injection rate is shown to be the safest, also offering considerable performance enhancements. It was also found that the ramp-up rate with air injection from the minimum environmental load to full load amounted to lower total fuel consumption than the design case.
Introduction
The increased renewable energy subscription and legislation on emissions is changing the role of conventional forms of power generation, such as gas and coal-fired plants. However, to maintain a stable grid in the developing energy mix, these fossil-fuelled combustion engines need to ramp-up to high power, to make up for the shortfall of renewable forms of energy (that are typically intermittent), in a short time. The rate of response of a gas turbine (GT) also called its ramp-up rate is an important performance indicator of operational flexibility, as well as a selling point for original equipment manufacturers (OEMs). GT ramp rates are primarily limited by the rate of change of turbine entry temperature (TET), due to the thermo-mechanical stresses that determine engine life.
Ramp-up rates for F-class GTs by different OEMs.
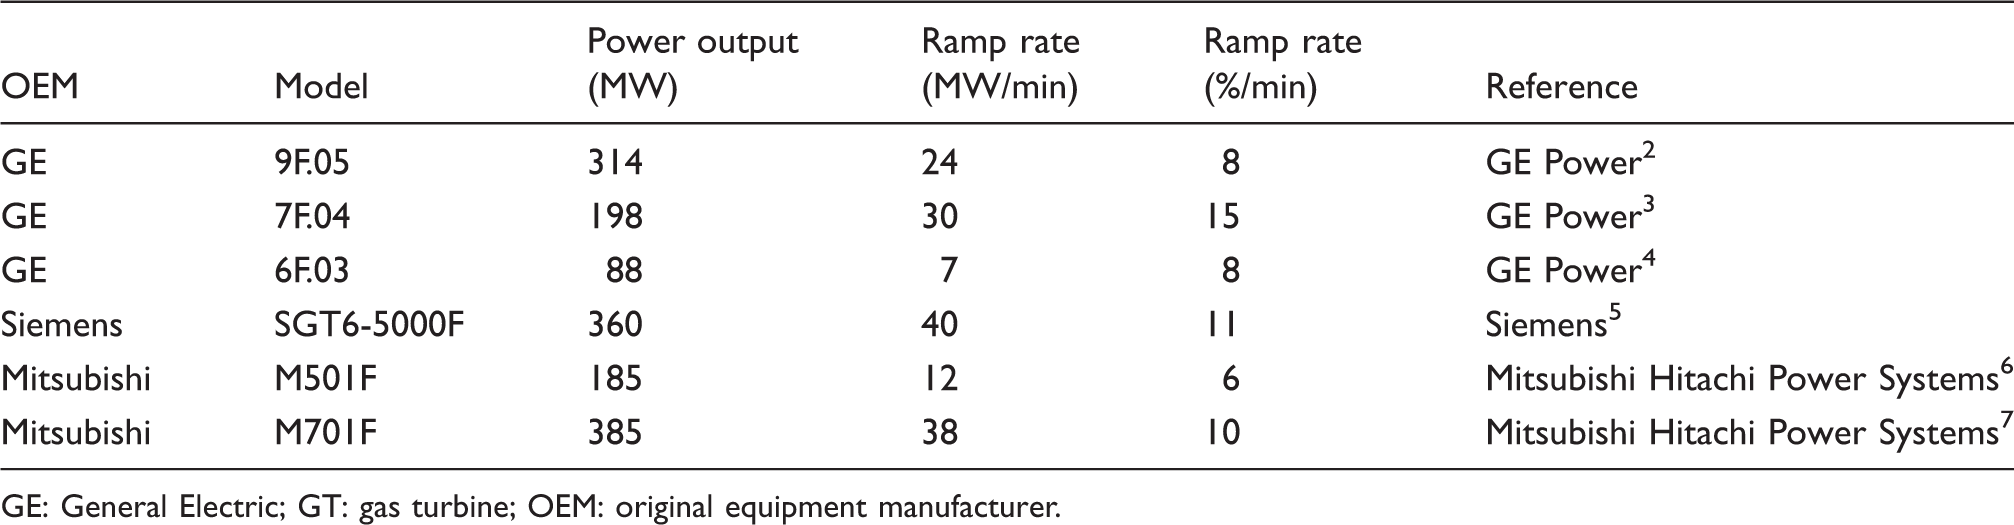
GE: General Electric; GT: gas turbine; OEM: original equipment manufacturer.
Balling 9 study is based on Siemens technology; the article explains the Fast Cycling concept that enables faster combined cycle gas turbines (CCGTs) start-up, by combining GT and ST ramping using their Start on the Fly technology. The study suggests that they can satisfy the frequency requirements of the UK grid code by fast variation of the variable inlet guide vanes (VIGVs) and an optimized fuel control system that ensures power ramp-up without adverse impacts on combustion. A combination of software and hardware has been considered by General Electric (GE) as shown in GE Power. 10 The upgrade includes an advanced gas path installation, which involves better turbine blade design and materials to improve aerodynamic efficiency, durability, and firing temperatures; a DLN2.6 + combustor system; and OPFlex Suite consisting of fast start, fast ramp, and turndown control modules.10,11 The critical improvements which enable the faster ramp-up are the improved turbine firing temperature and controls. 12
Other methods of improving the flexibility of a GT with respect to power ramp-up have involved additional system integration. The GE LM6000 Hybrid EGT™ (electric GT) combines the benefits of a battery storage system and the fast ramping up capability of this engine that is related to its aero-derivative multi-spool design. The technology features a 10 MW battery storage system which enables immediate power response and high-fidelity frequency response. 13 Perri 14 indicates that an improvement of 5 MW/min at International Organization for Standardization (ISO) conditions can be achieved for heavy-duty GT with compressed airflow injection from add-on multi-stage intercooled centrifugal compressor modules powered by natural gas.
With regards to compressed air injection technology, a few studies have explored this for GT power augmentation and ramp rate improvements. Salvini 15 investigated a recuperated GT, considering two configurations: compressed air energy storage (CAES) air injection and CAES air injection with expanders. The latter approach proved better as a result of preheating of the injected air, as well as an additional expander. This study identified that the short discharge duration causes high storage efficiencies of up to 70%, also concluding that additional expanders are beneficial for power augmentation but not so for the storage efficiency. Wojcik and Wang, 16 on the other hand, studied the feasibility of integrating adiabatic CAES systems with a CCGT. Their configuration uses the GT compressor for first stage CAES compression, a thermal energy store and air expanders, all of which leads to a power augmentation of 47.5% over the recorded CCGT plant capacity. Salvini 17 presents a performance analysis for a CAES integrated CCGT. Like the previous work of the author, the compression train was powered by a motor, with an air heater used to increase injection air energy. Using a modified storage efficiency equation, over 58% storage efficiency for the CCGT combined with CAES was achieved. The study also shows a trade-off between storage efficiency and plant cost, with a variation of initial pressure of the storage tank.
Igie et al.
18
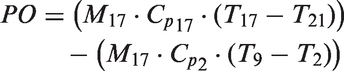
focus on the stand-alone GT with respect to an assumed CAES. This study shows the performance benefits of different injection air temperatures, as well as the influence of the design stage pressure ratio distribution on stall margin. Though PO increased with more air injection, its value reduced for a given rate when the injection temperature increased. However, this brought about an increase in thermal efficiency due to the increased specific heat. This work did not consider transient operations as presented in Kim and Kim
19
that evaluate the potential ramp rate benefit from injecting compressed air at the discharge of a 15 MW GT compressor, taking into account the variability in the rotational speed. The study optimizes the injection schedule and concludes that a linear increase and decrease of injection airflow is required for optimum ramp-up. Consequently, the authors theoretically confirm the potential of using compressed air from CAES to improve GT ramp rates. This study, unlike previous works, explores the potentials of compressed airflow injection for heavy-duty GT operating at a constant rotational speed that is set by grid requirement. It presents:
the benefits and limitations of air injection that is restricted by the surge margin and the TET improvements in part-load efficiency are shown and compared with other load variation strategies a quasi-dynamic analysis to quantify the improvements in the load ramp rates from 50% of the load at maximum VIGV opening the improvements in ramp rates attainable from the minimum environmental load (MEL) to full load (FL), when VIGV schedules are included
This study shows the ramp rate capability of compressed air injection with an emphasis on operability. The combination of VIGV operations with the lumped compressor stages employed to replicate multi-stage operations has demonstrated more indicative compressor limitation that was previously not evident in studies that model the compressor as one ‘brick’. The impact of this is highlighted in the latter part of this paper.
Set-up under investigation
The single shaft 185 MW engine under investigation is inspired by a generic Mitsubishi F-class GT. The design and off-design behaviour have been modelled and simulated using Cranfield University's in-house software – Turbomatch. The zero-dimensional code was written in FORTRAN language, with the capability to run both steady-state and transient GT performance simulations.
The tool accounts for turbomachinery effects in the compressor and turbine using embedded standard component maps. There is also a generalized combustor map used to evaluate the combustion efficiency variations. For design point (DP) computations, the software performs an energy balance for the simulated system using defined inputs. However, first, it rescales the selected component maps to new maps used, based on user-defined inputs such as pressure ratio, component efficiency, and corrected mass flow (CMF). Their scale factors (SF) are defined as shown in equations (1) to (3)


In the design and off-design analysis, the computations must satisfy the work balance and compatibility of flow and rotational speed as indicated in equations (5) to (7). In addition to this, the Newton–Raphson method is used to determine convergence for off-design calculations


Operational requirements can be attained by adjusting the VIGV, which is achieved through further scaling of maps. The models generated can be controlled using shaft speed, combustor outlet temperature (COT), or fixed PO, depending on the application. The combustor mean temperature (CMT) and exhaust gas temperature (EGT) can also be set as model controls.
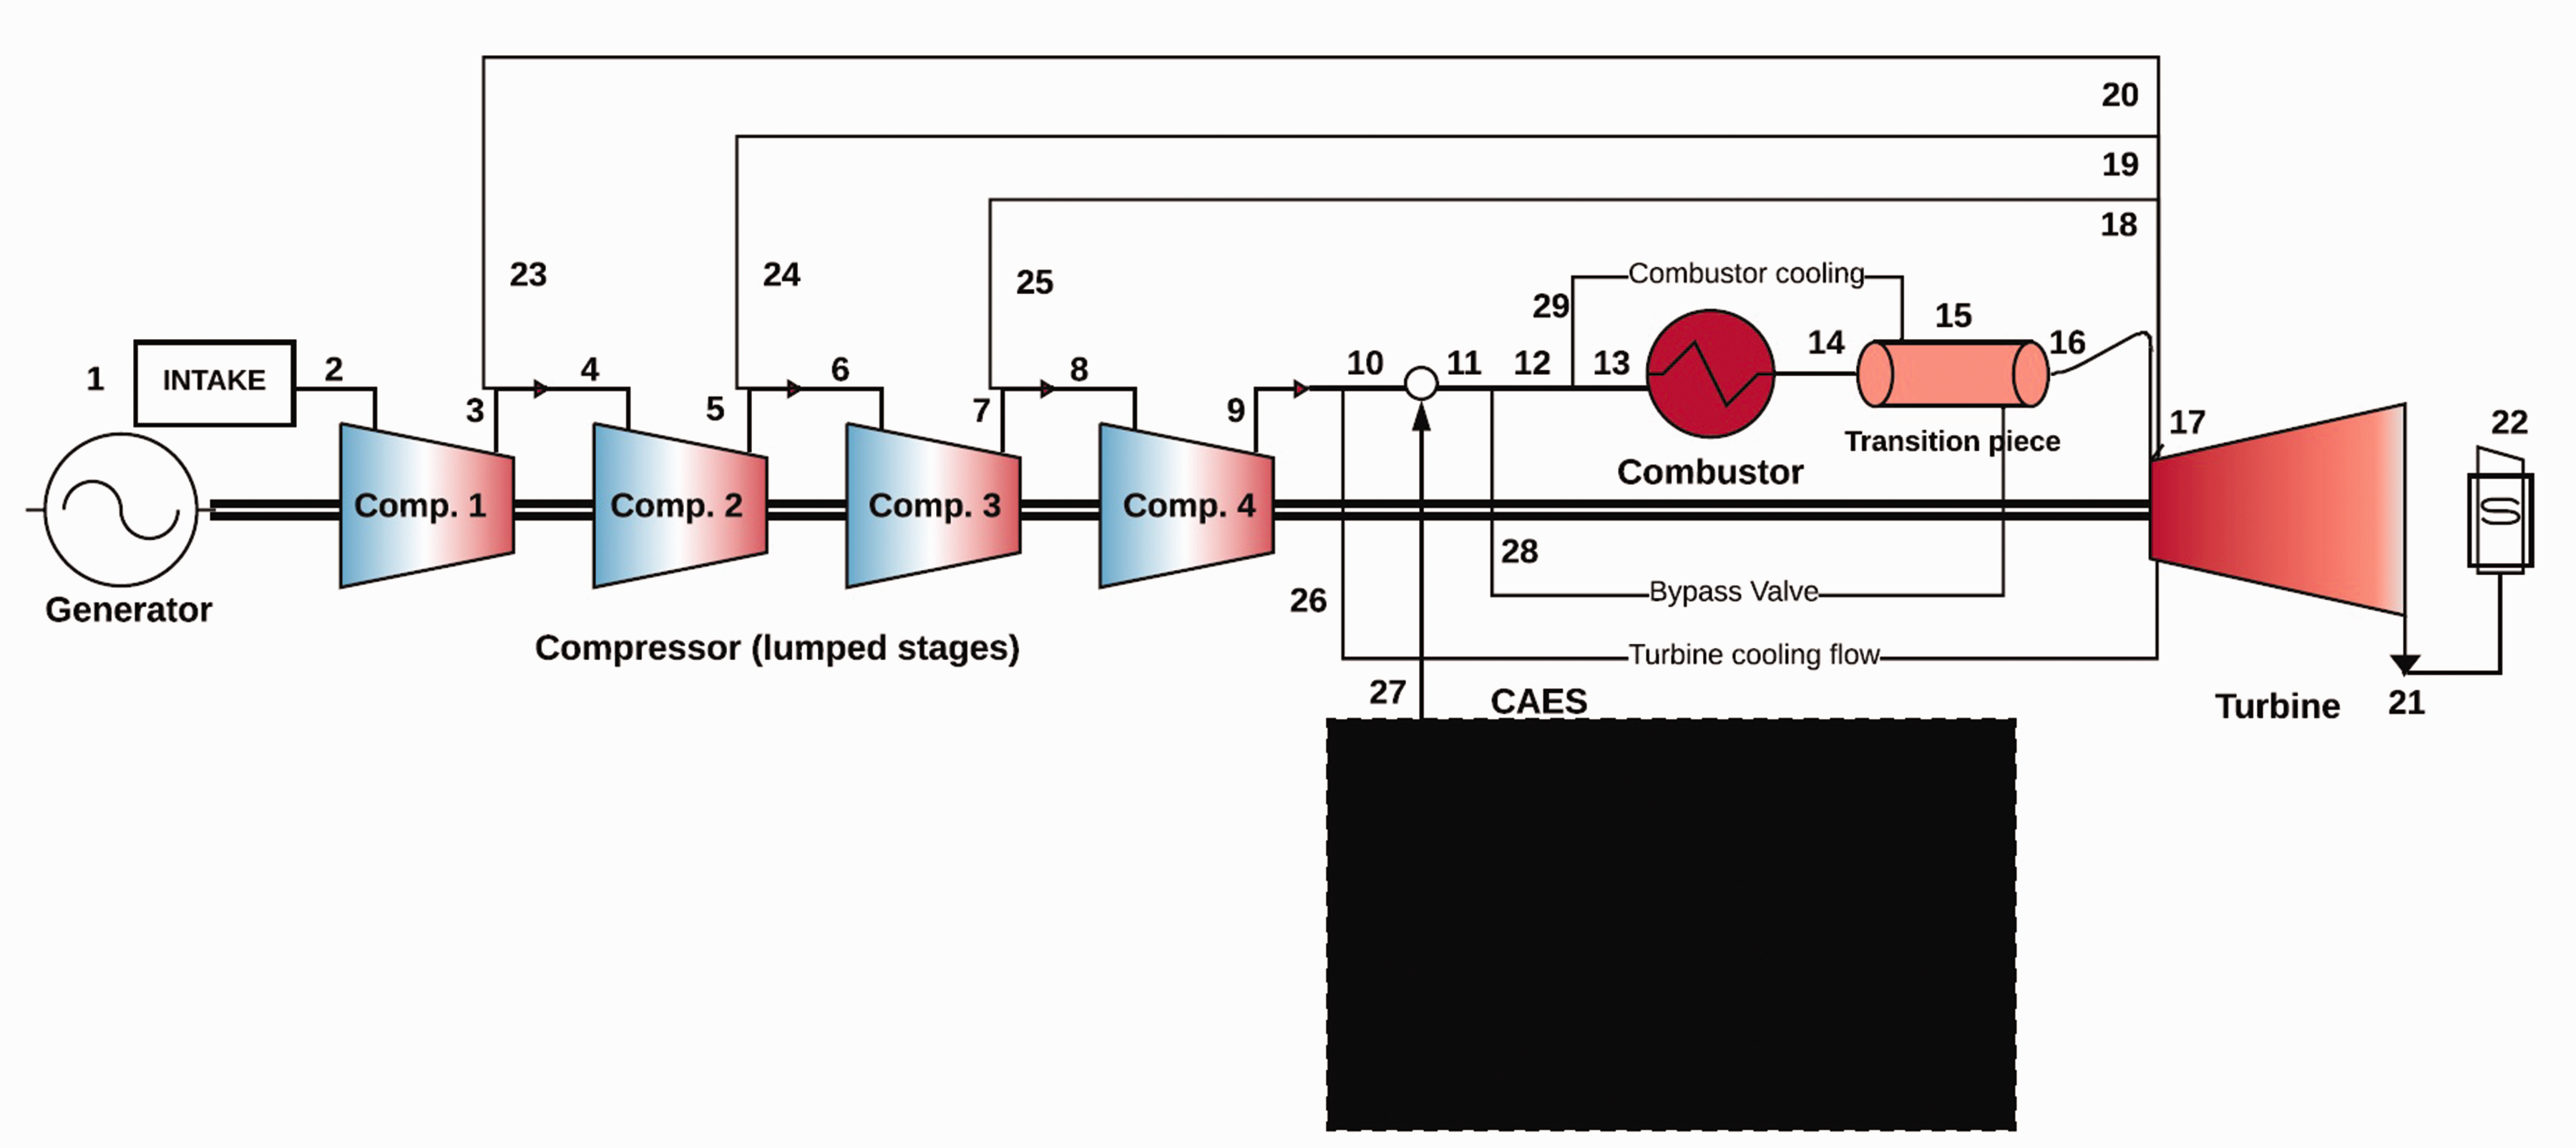
Figure 1 illustrates the simulation set-up of the engine model that consists of four compressor bricks, each of which are lumped stages. The individual lumped stages have between them air extractions for cooling the turbine. It can also be observed that some of the discharge air from the compressor exit is used for the turbine and combustor cooling. A unique feature of this engine is the cooling of the combustor exit flow through a bypass into the transition piece. The amount of air through this bypass varies at different loads, unlike the other cooling flows that are active and constant for all the operations. The flow leaves the dummy CAES into the GT; this type of operation is referred to as discharging of the storage system. The injection is assumed to occur behind the diffuser, between stations 10 and 11, that is immediately after the turbine cooling flow extraction. In practice, the storage pressure is greater than the maximum operating pressure of the GT, by using auxiliary components as described in Wojcik and Wang
16
and Salvini.
17
Thus, the air pressure is sufficient to allow for injection into the GT. The pressures and temperatures of the added flows are assumed to be the same as the corresponding compressor exit values. This simplification ensures the integration of the injected and compressor discharge airflow with minimum supplementary compressor work and minimal distortions. In addition, similar temperatures enable a constant fuel–air ratio to attain the desired combustion temperature. The average TET at station 17 is a result of the cooling flows. The turbine is modelled as one brick for simplicity, as it is least prone to aerodynamic problems for the study under investigation. The turbine drives all four compressor bricks on the same shaft, and the total driven work of the compressor is the sum of the individual bricks. The surge margin utilization (SMU) defines the proximity of the operating point and the surge line of the individual lumped stages. This is mathematically represented in equation (8); an assumed SMU of 85% (i.e. 15% surge margin) is specified for all the lumped stages at the DP.
Flow injection set-up with a dummy storage system. CAES: compressed air energy storage.
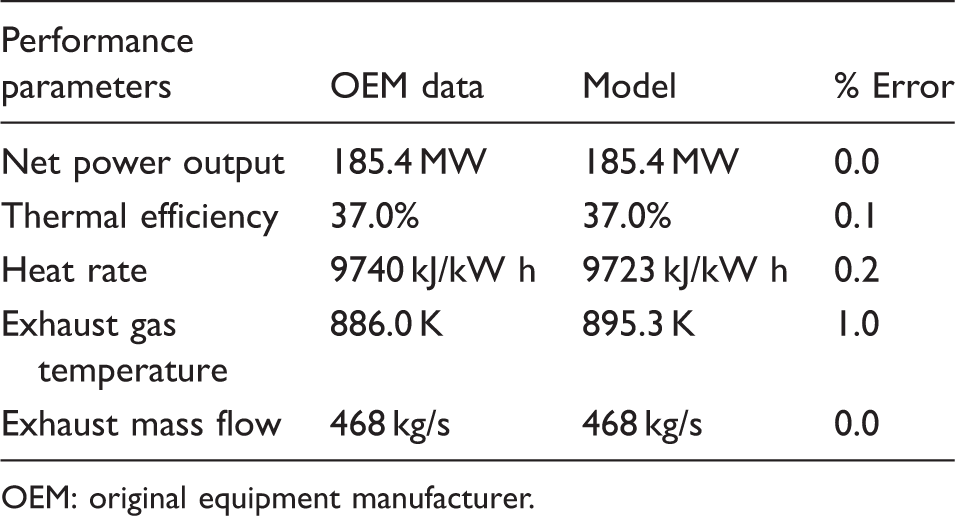
Engine performance specification at DP.
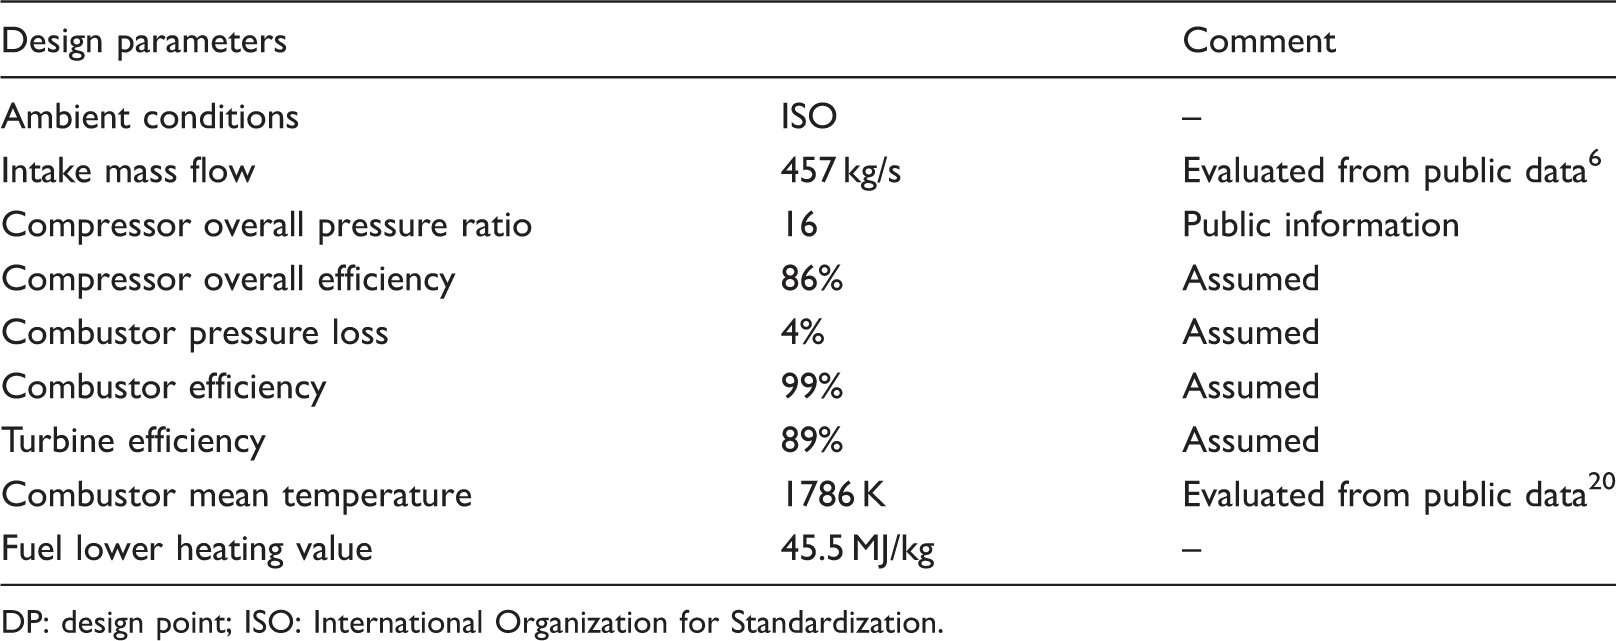
DP: design point; ISO: International Organization for Standardization.
Table 3 shows the DP calculated parameters, also in comparison to the OEM published data in Mitsubishi Hitachi Power Systems.
6
This indicates a low percentage error, and in addition, the off-design validation was conducted. Figure 2 illustrates the validation of the off-design calculations based on the variation of ambient temperatures at fixed COT. It shows good agreement with the publicly available OEM data,
6
having the highest percentage error of 2% for one temperature; the mean error across the nine cases is 0.2%. Further details of the design and off-design calculations are provided in Igie et al.,
18
MacMillan,
21
and Pellegrini et al.
22
Off-design validation of engine model – varying ambient temperatures. OEM: original equipment manufacturer. DP performance of calculated parameters and % error. OEM: original equipment manufacturer.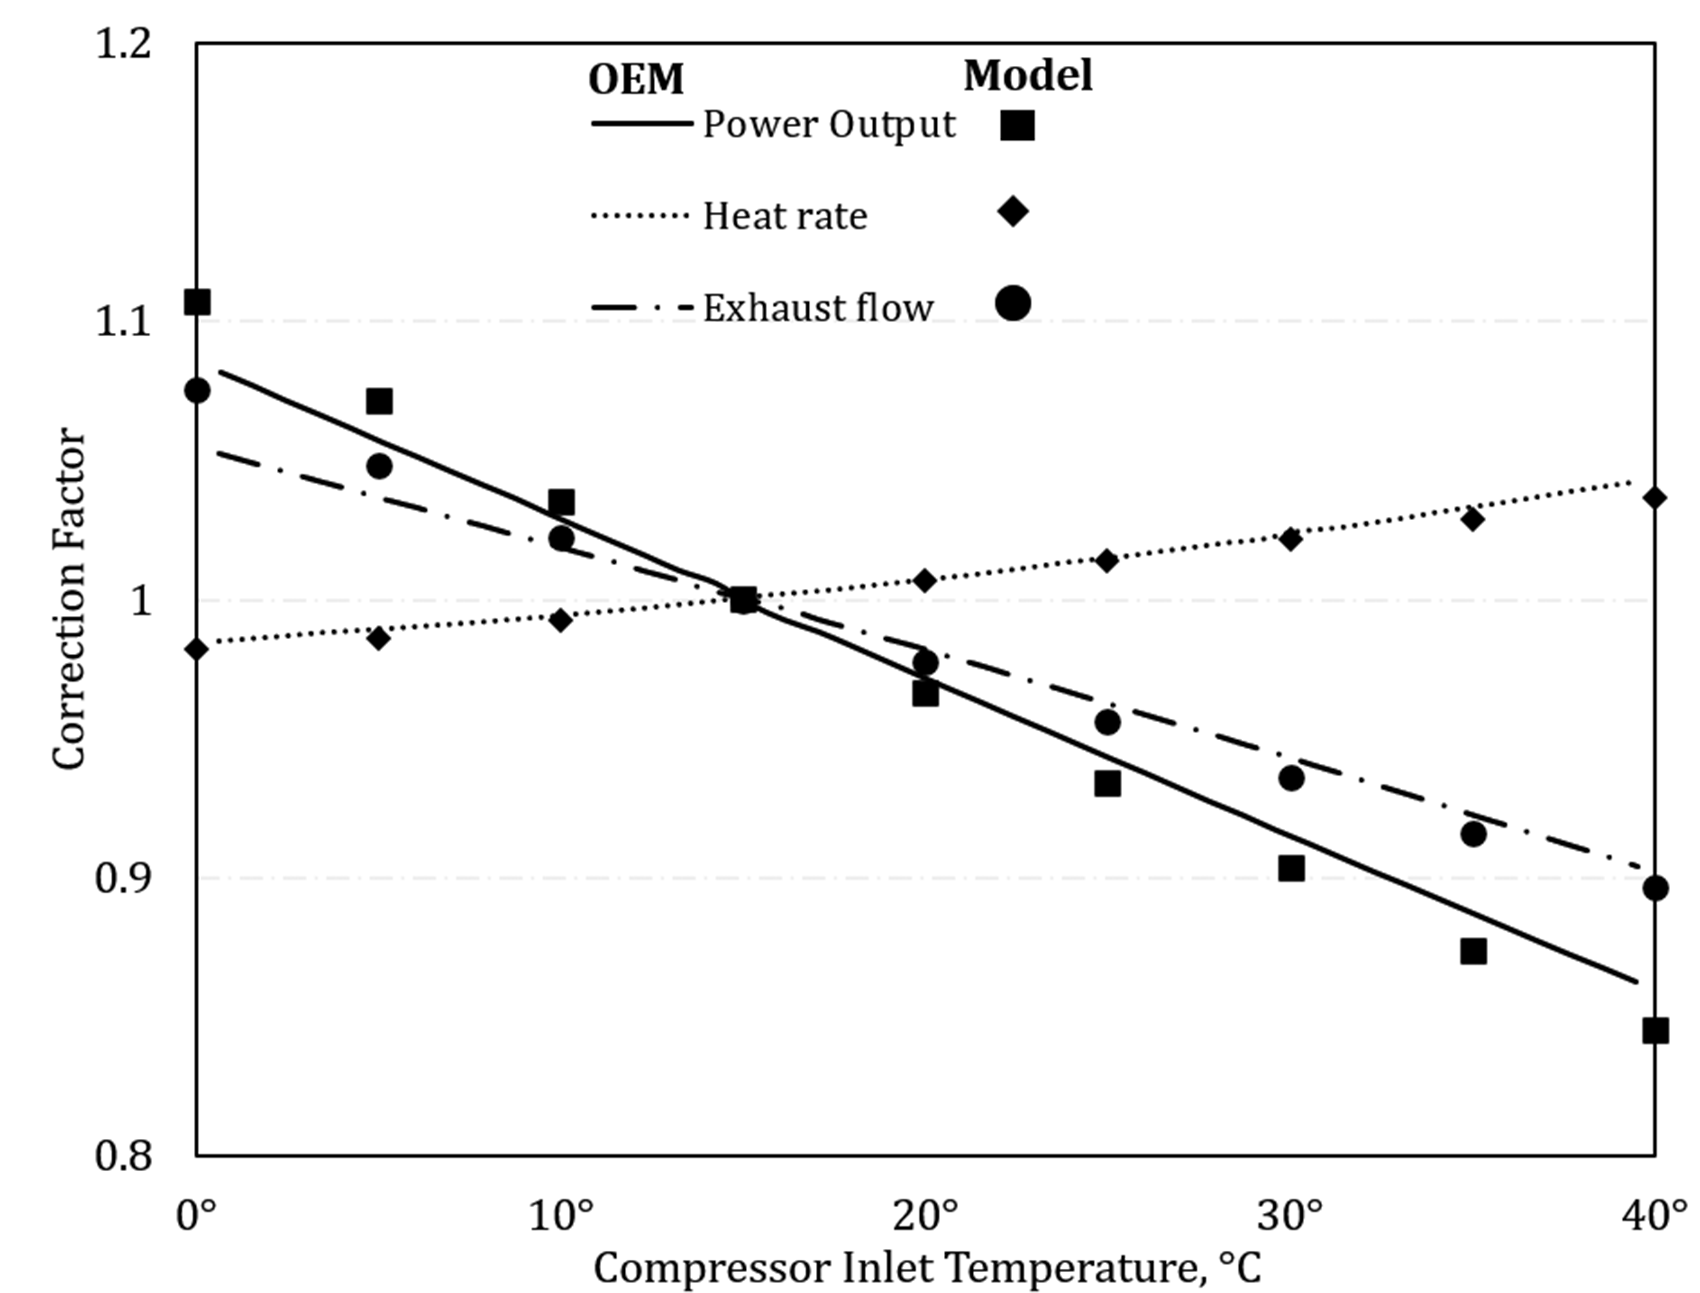
Steady-state flow injection at DP – max. fixed VIGV opening
The first case of air injection investigated is that of a steady-state, with a fixed maximum opening of the VIGV, keeping the CMT (1786 K) constant. Airflow injections up to 15% of the compressor discharge flow (CDF) have been considered. Air injection allows for more fuel flow as shown in Figure 3(a), to maintain the same value of CMT. With an increase in air and fuel flow in the engine, the PO rises such that the gains (in flow and useful work) are greater than the heat input; thus, an improvement in the thermal efficiency as indicated in the figure. Figure 3(a) also shows up to 25% increase in PO with a 12% rise in the thermal efficiency when 15% of air is injected. Lower values are obtained at lower air injection rates, such as 5% flow injection that amounts to a 9% increase in the PO. Figure 3(b) shows the rise in OPR that is a result of increased work output in the turbine that leads to a higher compressor work. The increased work output in the turbine is caused by the rise in the air and fuel flow, with a higher TET that is a function of the cooling scheme applied.
Effect of flow injection on engine performance. (a) Performance parameters and (b) OPR and temperatures. CDT: compressor discharge temperature; OPR: overall pressure ratio; TET: turbine entry temperature.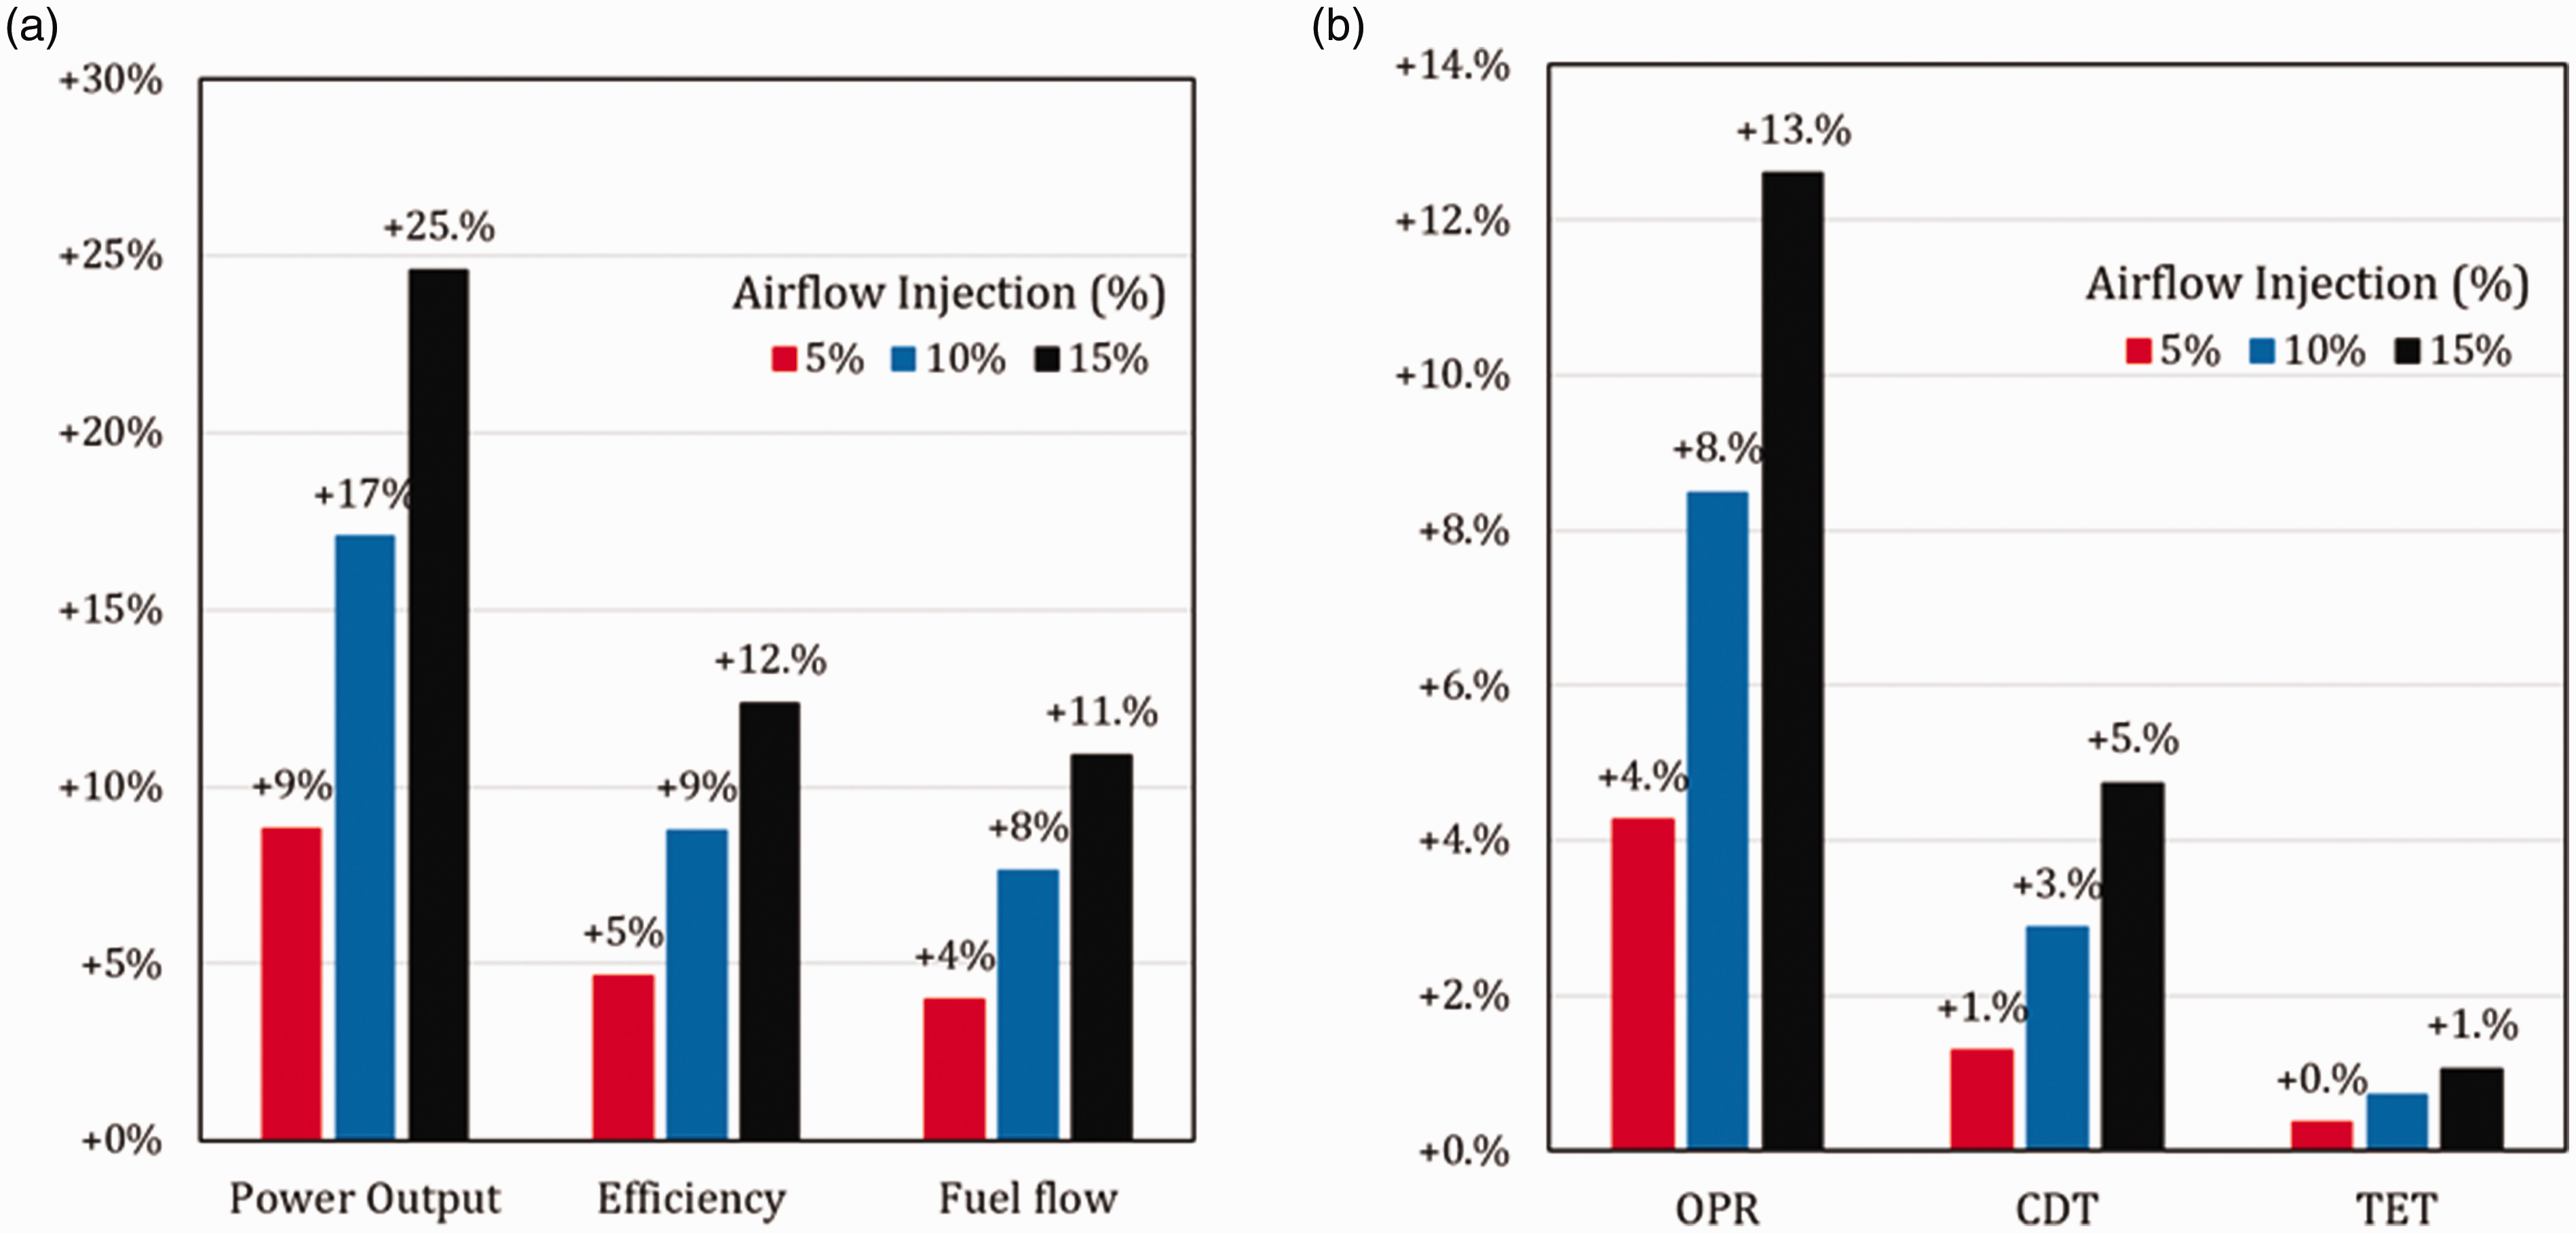
In these conditions (before and after air injections), the turbine is choked, this means that the inlet non-dimensional mass flow is unchanged or fixed. Hence, the inlet pressure of the turbine (at station 17 of Figure 1) must be higher to satisfy the compatibility of flow between the turbomachinery components as indicated in equation (6). The effect is an increase in the compressor back pressure leading to higher OPR and a rise in the compressor discharge temperature (CDT) that is due to the increase in the compressor work. The implication of equation (6) is that the inlet airflow into the compressor is reduced, as a result of greater back pressure of the turbine leading to a similar effect at the back of the compressor. This inlet flow reduction is indicated in Figure 4 that shows the operating point of the lumped stages (comp. 4) moving towards surge, as injection airflow increases.
Operating points of last lumped stages during flow injection – max VIGV opening. DP: design point.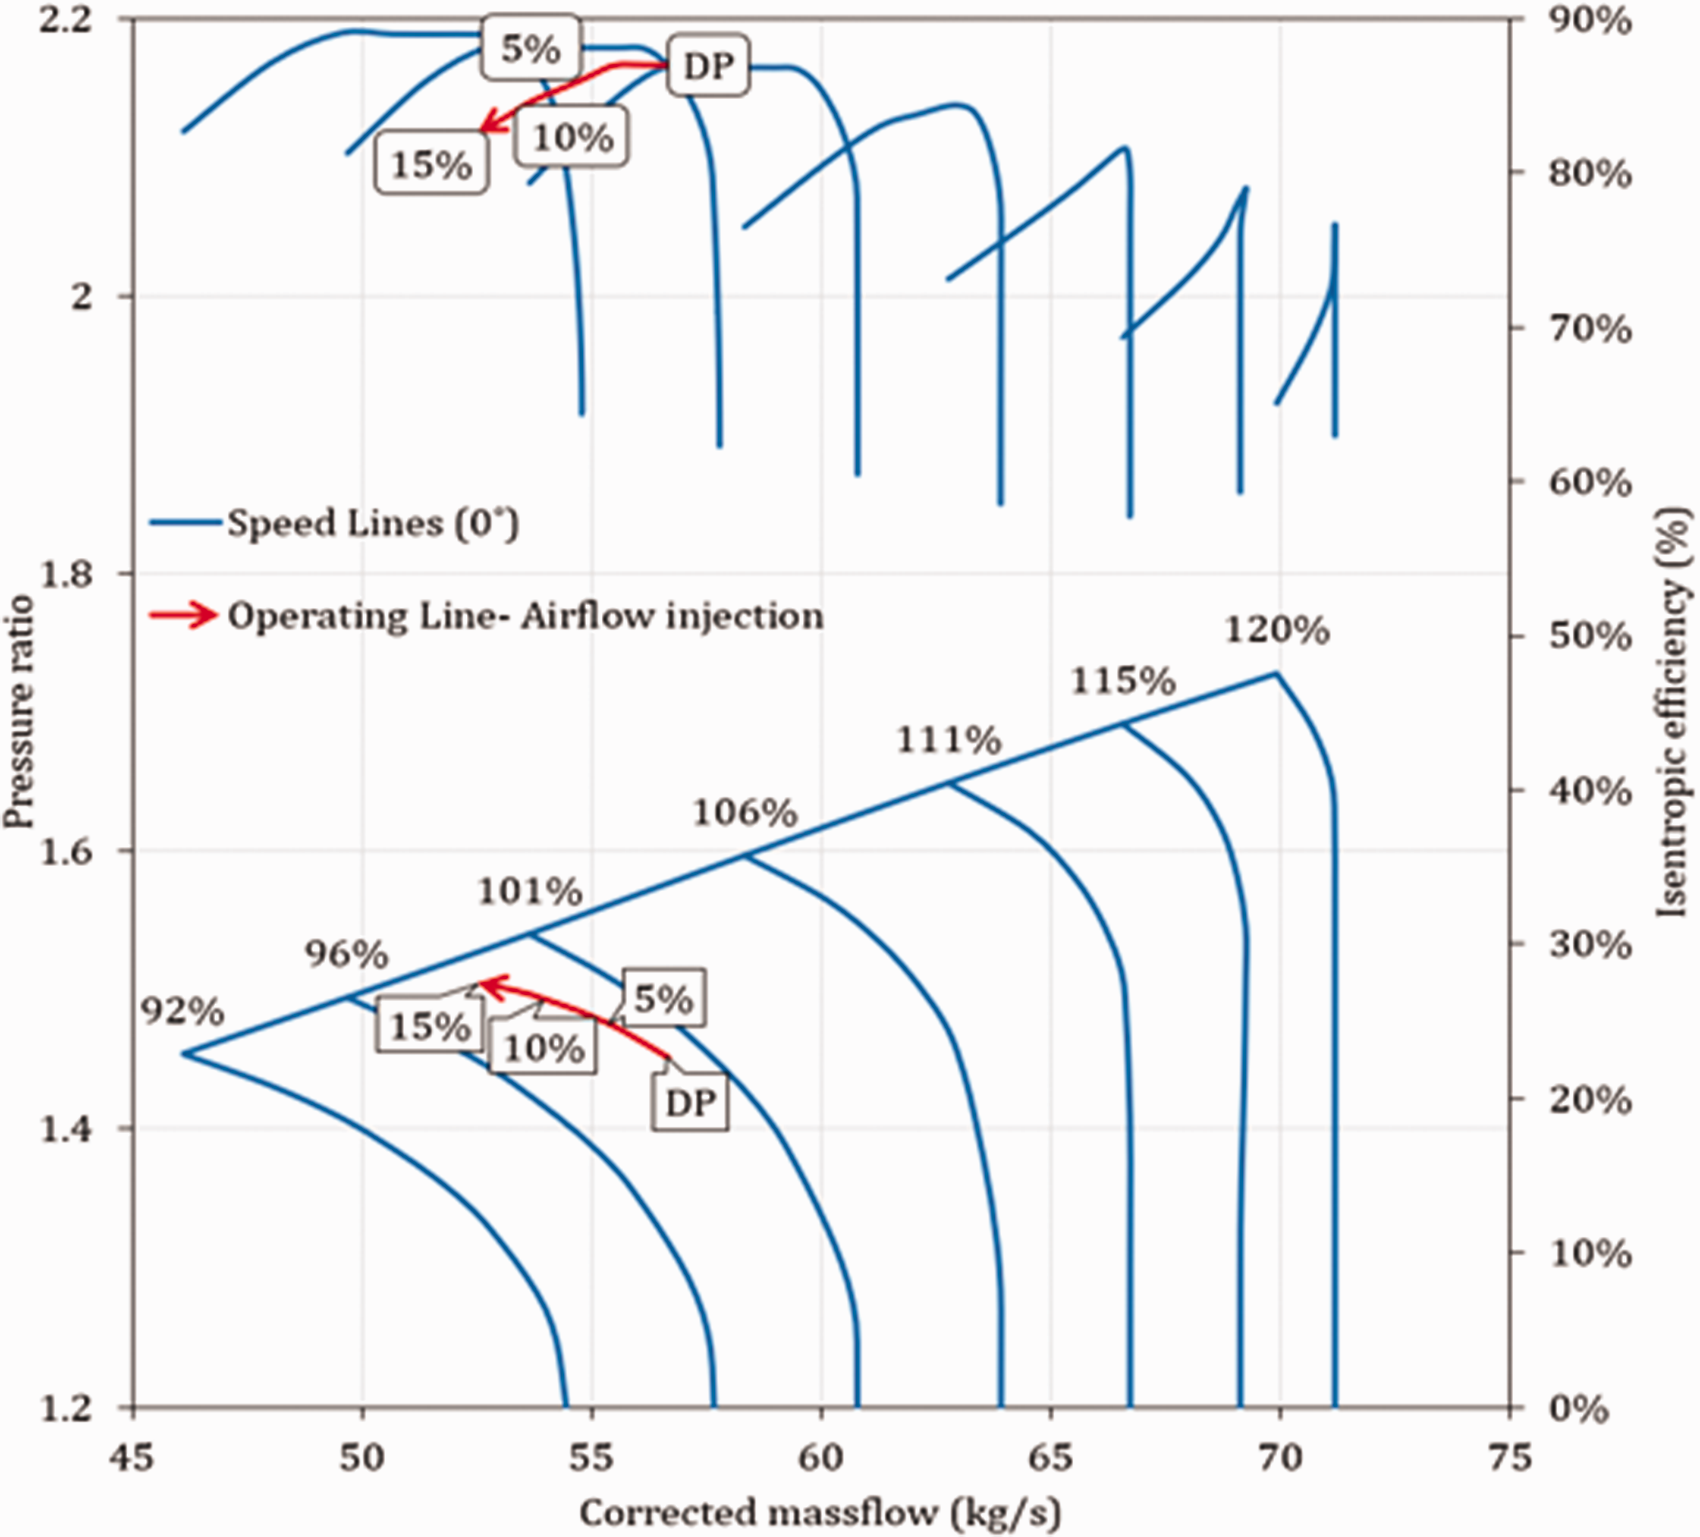
Figure 4 also shows the isentropic efficiency of the lumped stages that decreases with airflow injection, due to a higher rise in temperature ratios than its pressure ratios. Nevertheless, the entire compressor isentropic efficiency is almost constant in these cases, due to a similar order of magnitude in the increase in the overall ratios. The SMU for the highest air injection (that is 15%) is 97% based on equation (8). That of the 5 and 10% injections are 90 and 94%, respectively.
Steady-state flow injection at part-load – max. fixed VIGV closing
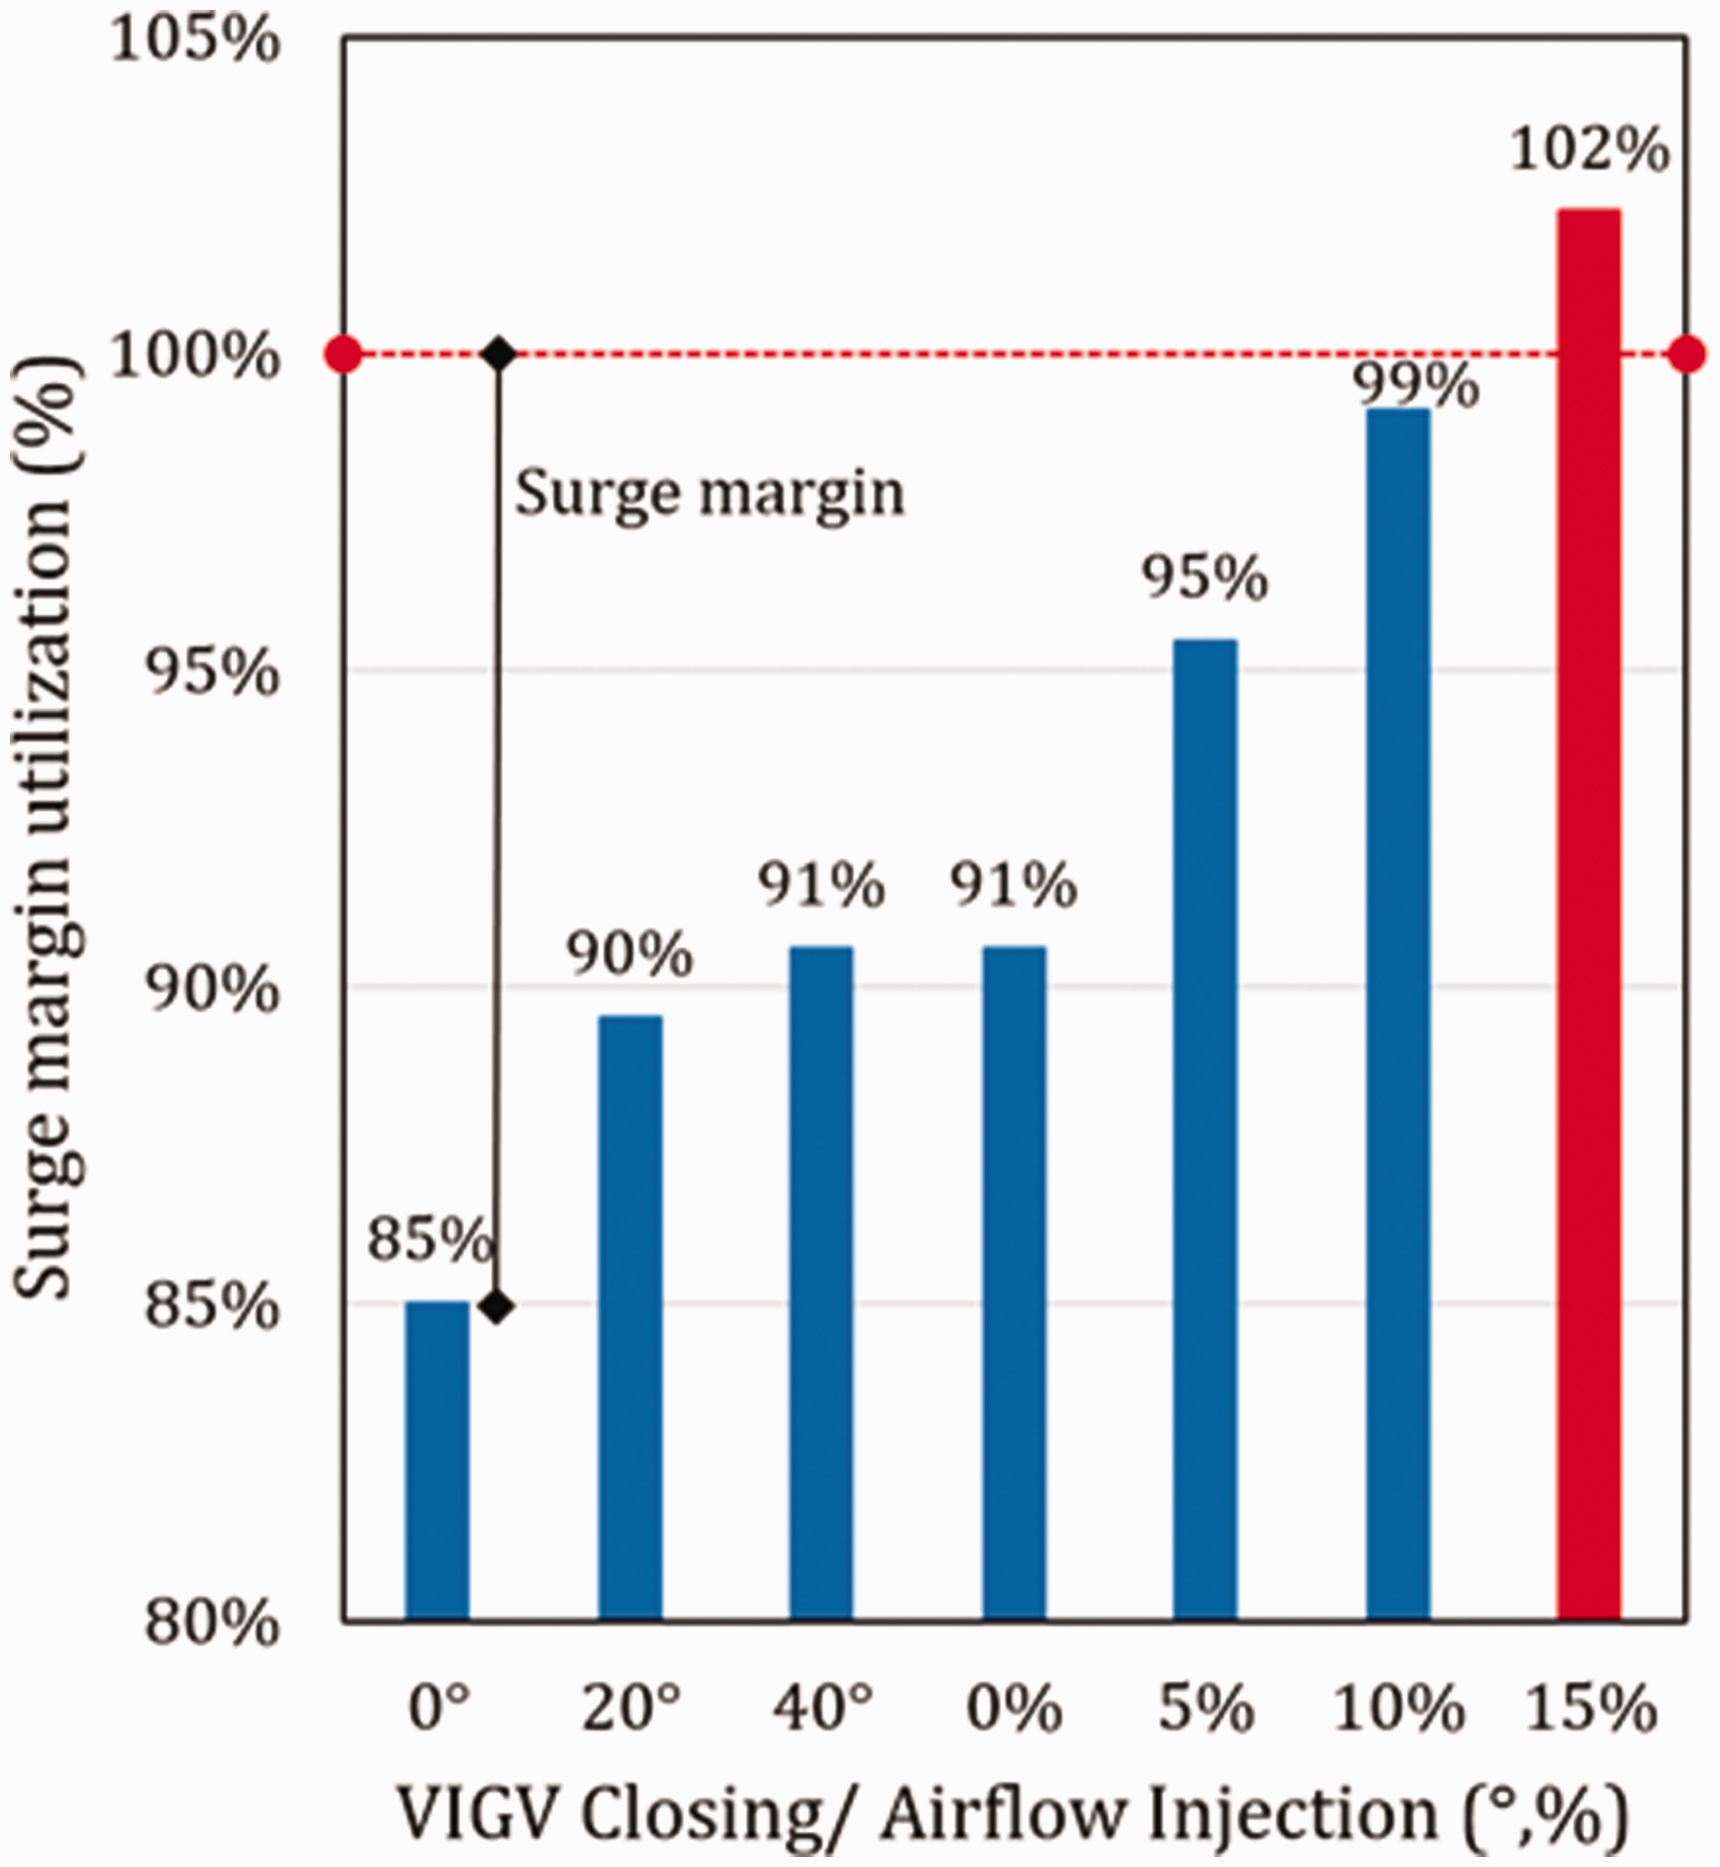
In this case, the VIGV is closed, to reduce the PO of the engine to low part-load before air injection. The rationale for this is that high PO obtained by flow injection at FL may not be required in actual operation, as this PO exceeds the rated capacity of the engine. Thus, it is of interest to investigate VIGV closure with air injection. Similarly, a fixed CMT of 1786 K is also applied, and with reference to the previous case, the operating point shifts to the top right of the compressor map as shown in Figure 5. Though the actual mass flow reduces, the CMF increase due to a higher drop in inlet pressure than the corresponding drop in flow and temperature, respectively. As such, at the same rotational speed and higher corrected flow, more work is done in these last stages that brings about a rise in the pressure ratio. The consequence of this is a reduction in the surge margin after the closure of the VIGV. The SMU is also shown on the left of Figure 6, where 0° is the maximum VIGV opening, while 40° is the maximum closing. The injection of 5, 10, and 15% of the CDF increases the surge utilization (or reduces surge margin). At 15% air injection, the back compressor would go into surge as shown in Figures 5 and 6.
Operating points of last lumped stages during flow injection – max VIGV closing. SMU at different operations. VIGV: variable inlet guide vane.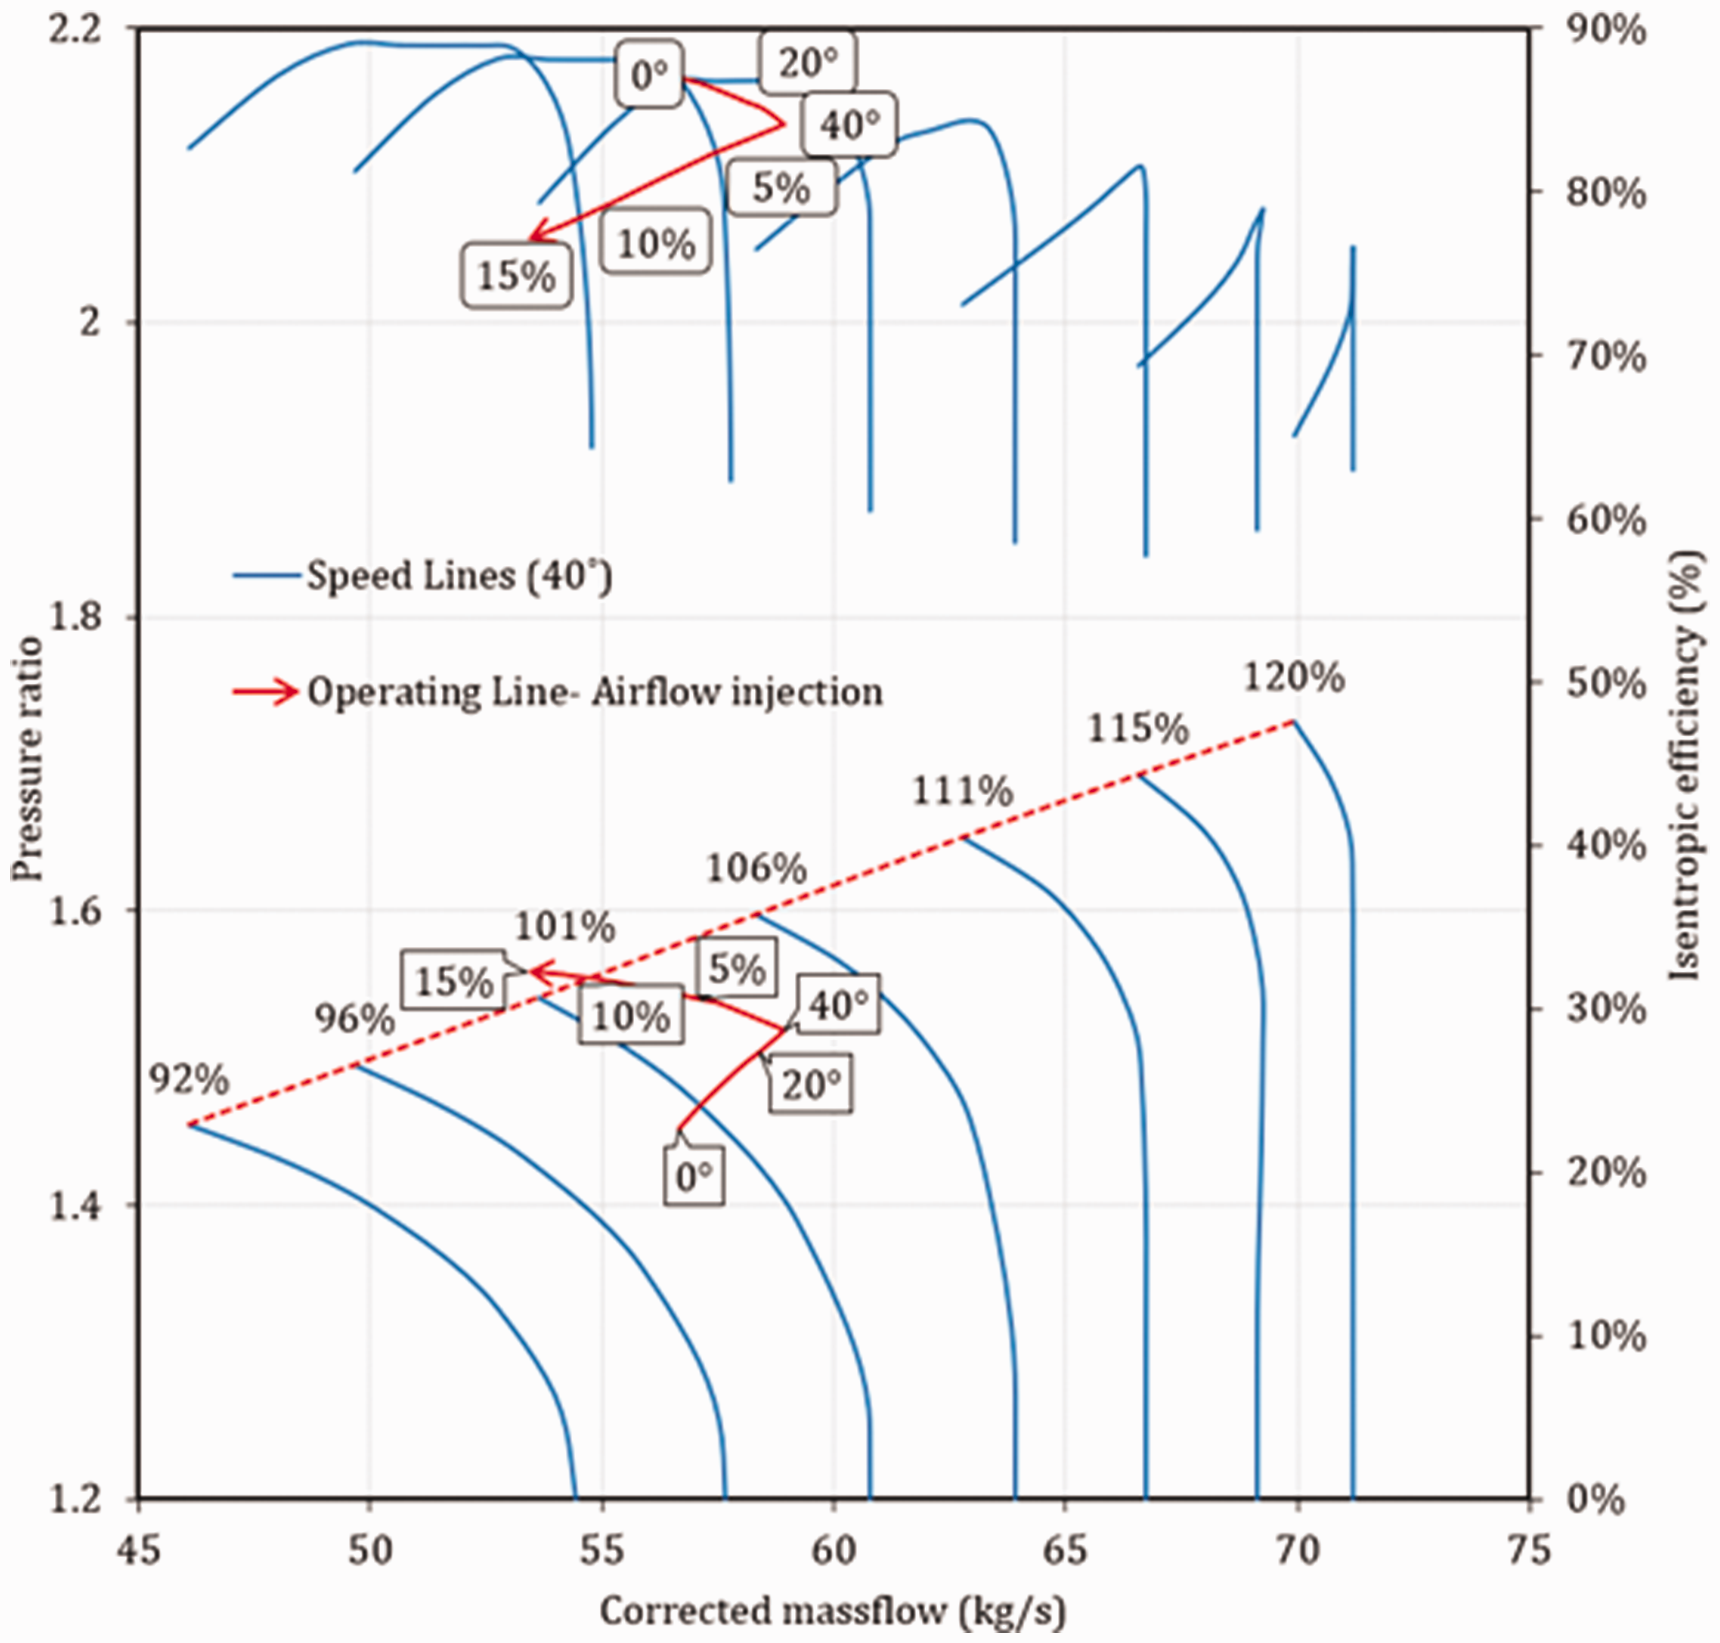
In comparison to the flow injection at FL with max VIGV opening, the finding suggests that more air can be injected safely, for wider VIGV openings, related to higher values of PO. This also infers that with more closing of the VIGV, the maximum airflow that can be injected will reduce with concern about the surge. This is demonstrated by the fact that in the case of max closing of the VIGV with an injection of 15%, the surge margin is −2%, while at the maximum opening it is 3%.
Figure 7 shows the performance of the respective injection cases (5, 10, and 15%). The figure indicates that the PO at maximum closing is in fact 68% of the rated FL without injection. That of the thermal efficiency and fuel flow are 92 and 74%, respectively. It is noticeable when compared to Figure 3(a) that the increases in the performance parameters due to injections are a little smaller, due to slightly higher percentage rise in fuel flow at low-load injections to maintain the same constant CMT.
Effect of flow injection on performance parameters – max VIGV closing.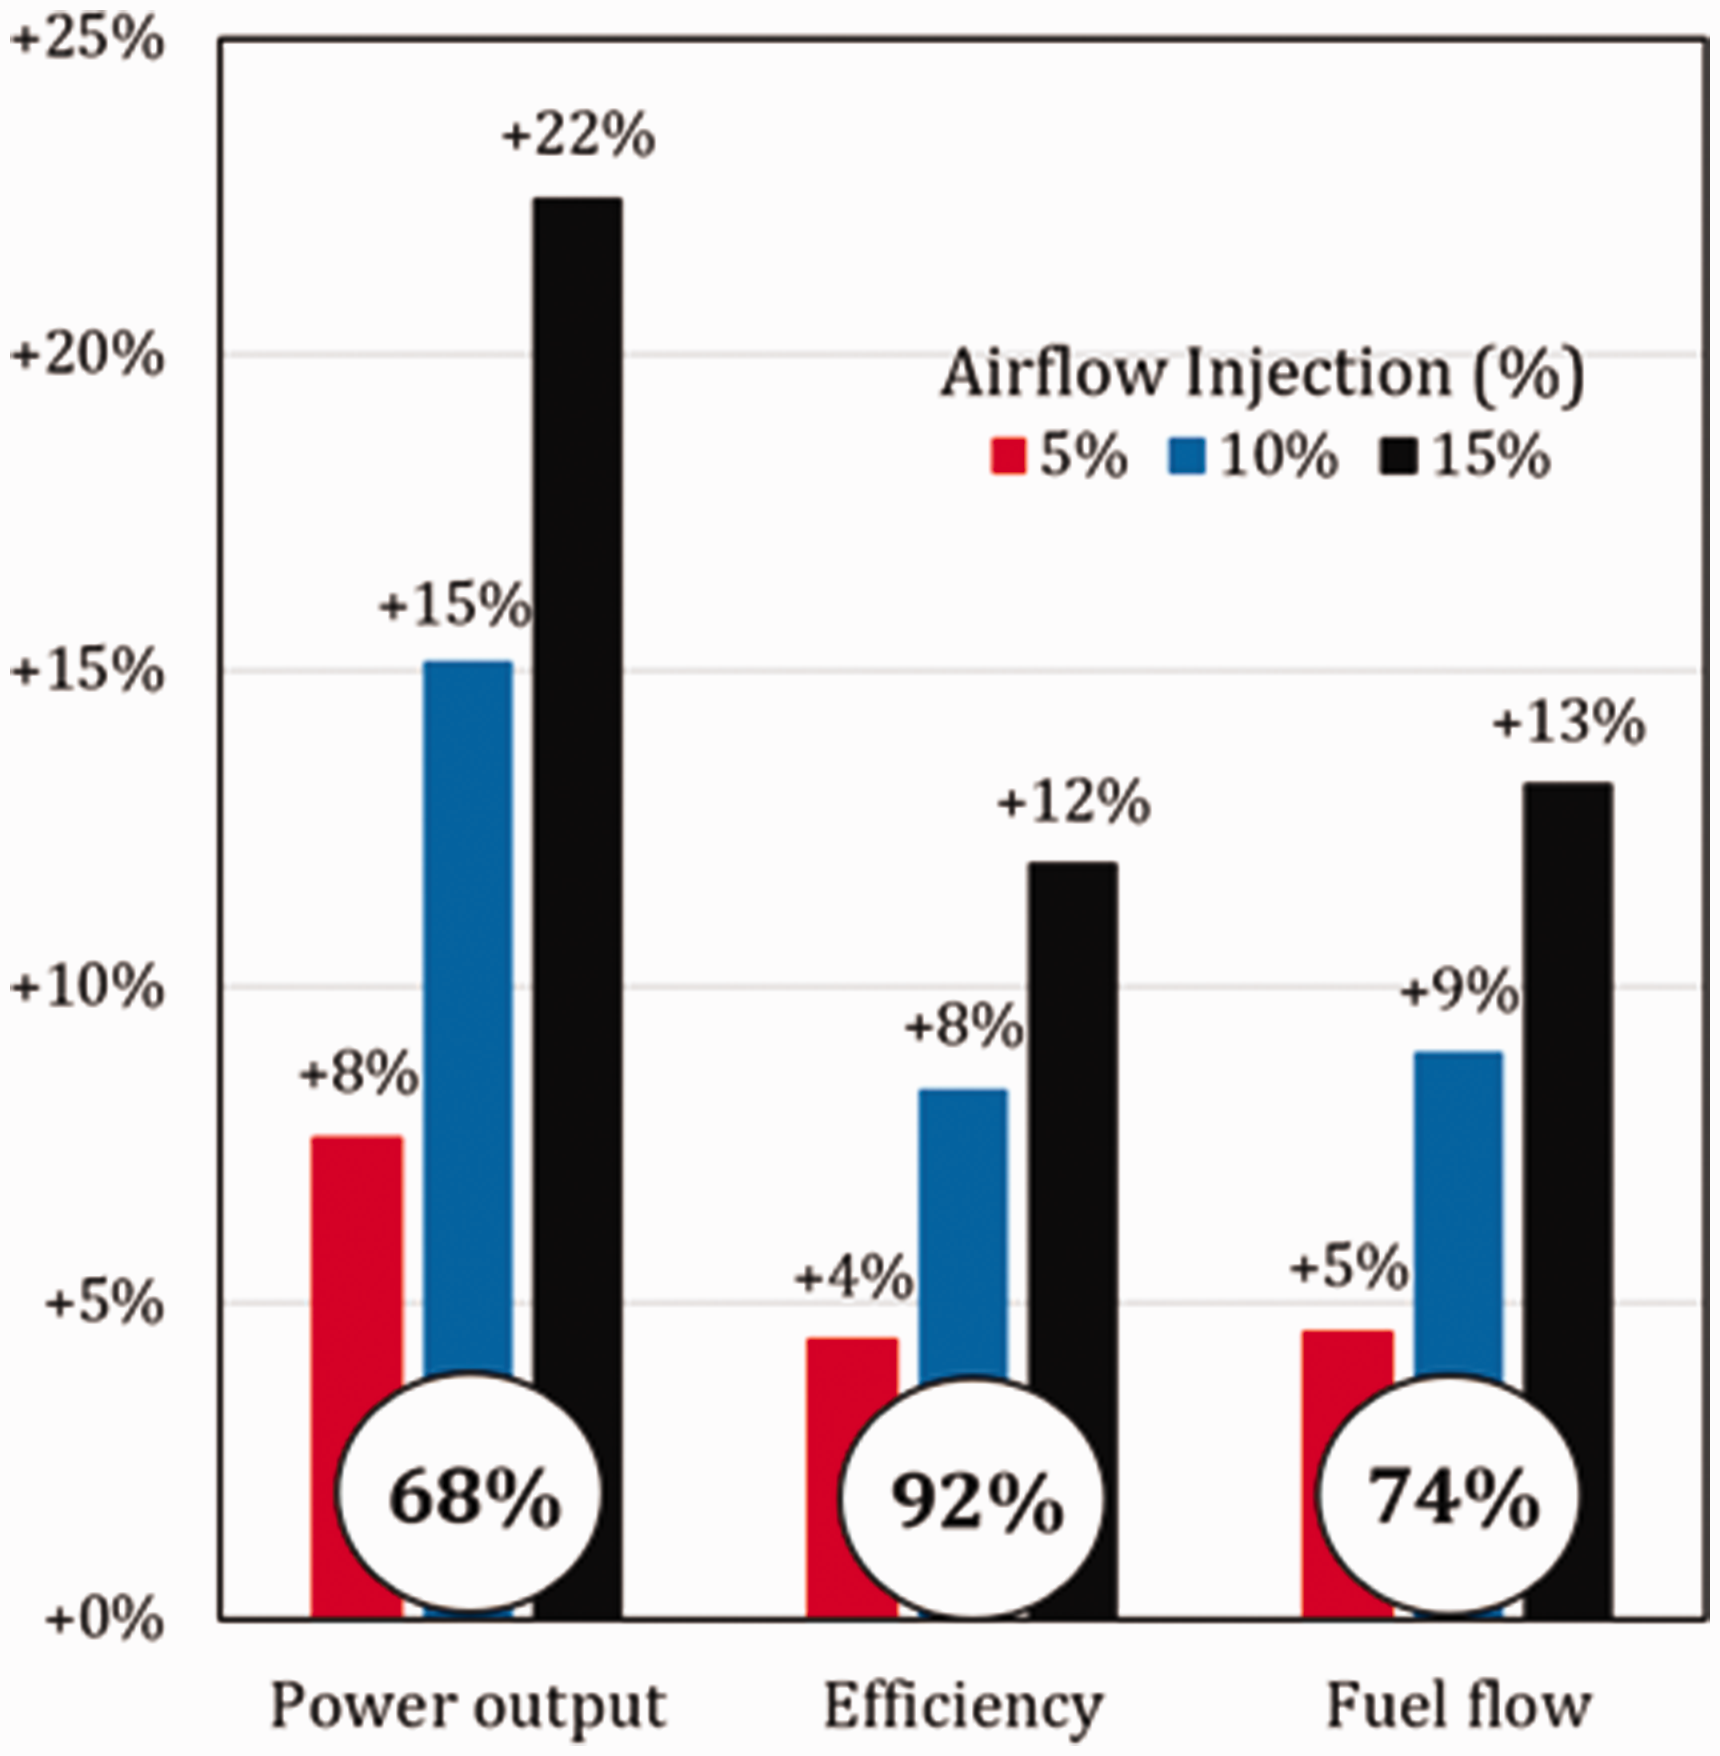
The thermal efficiency with air injection has been compared to that obtained in normal operations, to quantify part-load efficiency improvements. This is a comparison of the thermal efficiencies for the same PO, with and without injection as shown in Figure 8. The normal operations indicated here are of two types: first, the modulation of the VIGV to change the PO and presented using the dashed line. Second, the variation of fuel flow to change the PO, for a fixed maximum opening of the VIGV. In this latter case, the operating point on the line moves more vertically on the compressor map, as opposed to more horizontally in the former case. The latter is referred to as TET variation, indicated by a dotted line. Operating the engine in this mode is generally more efficient as shown, due to the better fuel-to-air ratio, with more air mass flow through the engine and a higher OPR.
Thermal efficiency versus PO – with air injection and without (fixed and varied VIGV). CMT: combustor mean temperature; VIGV: variable inlet guide vane.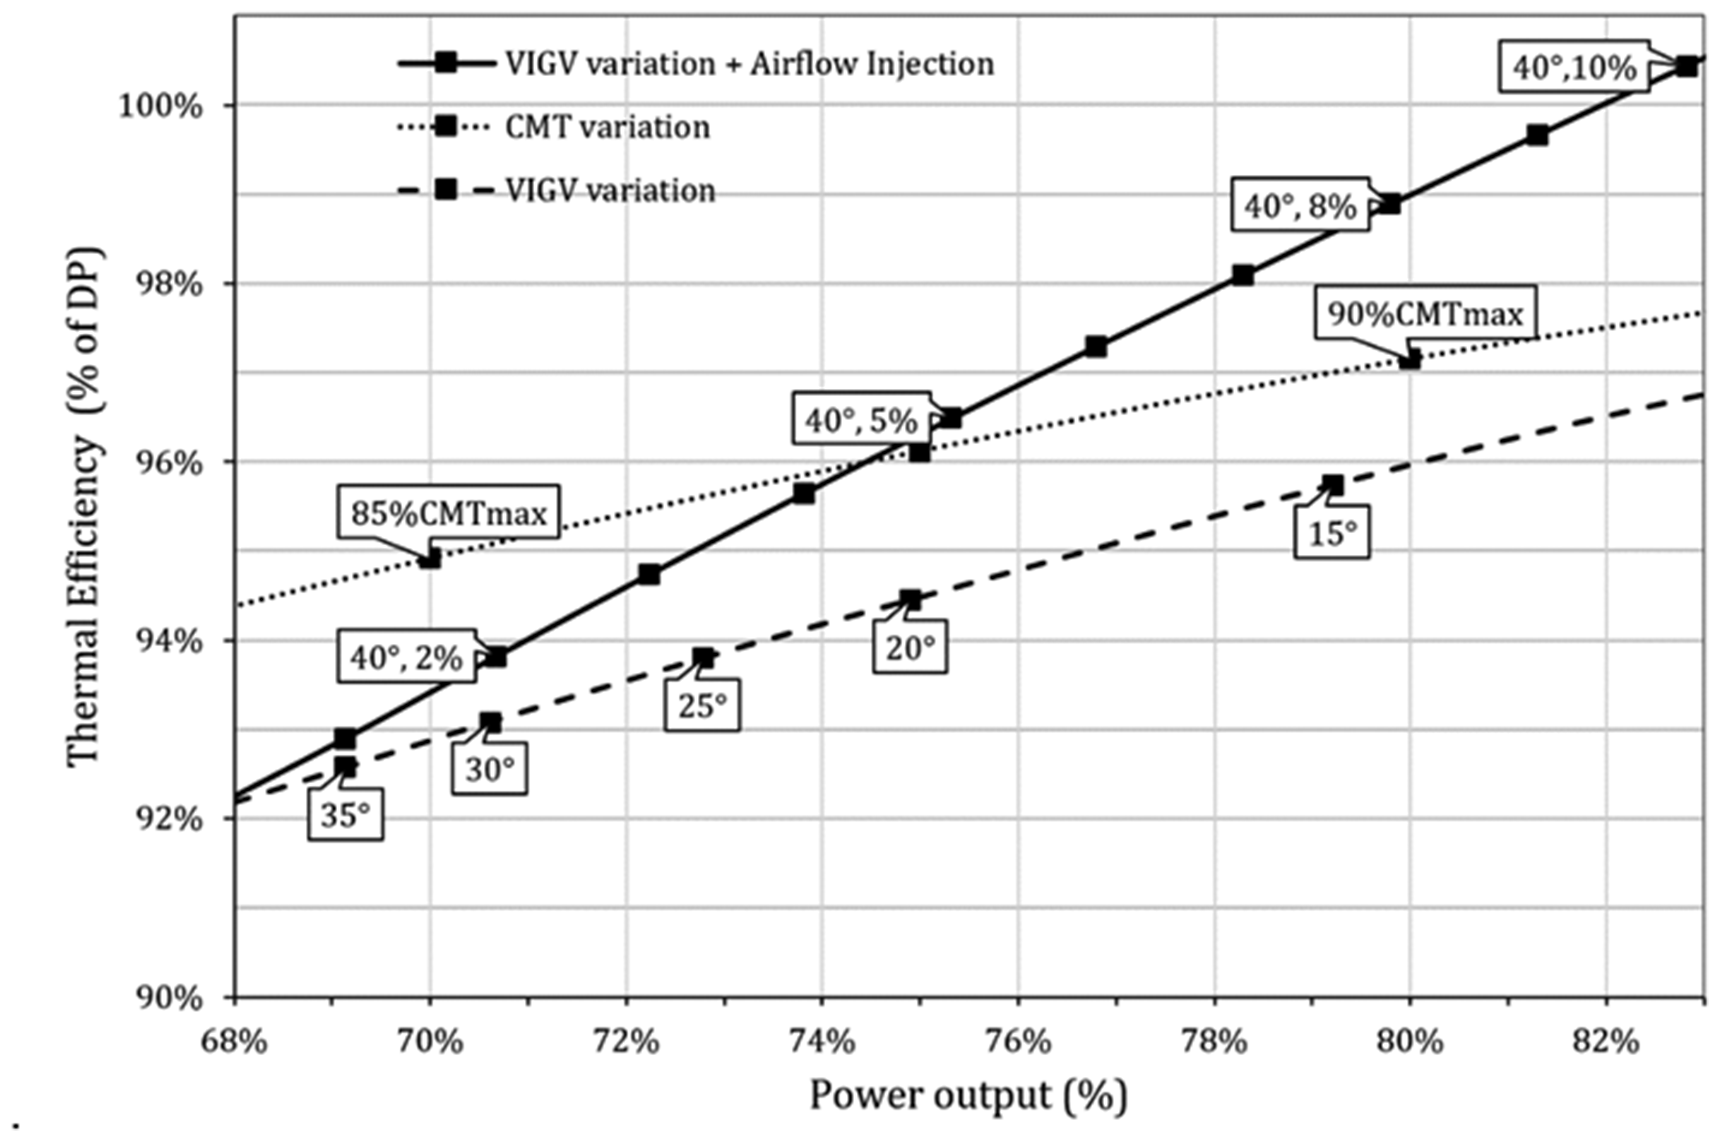
The case of airflow injections at a fixed VIGV position of 40° (maximum closing) is up to 10%. The increasing air injections from the left to right signify an increasing thermal efficiency that is greater than the other two cases from about 75% of the rated PO onwards. Better thermal efficiency below this PO is shown for the case of CMT variation. This is a result of the higher OPR at low load, compared to the former that operates from a closed VIGV position. However, this changes with increased injection as explained. The VIGV variation (at fixed CMT) case for which the thermal efficiency is the least, has advantages not shown here, with regards to higher EGT for CCGT operation.
With regards to the rationale of modelling the engine into split lumped compressor stages rather than one bulk compressor as shown in published work, Figure 9 highlights the merit of the discretized approached used in this study. The figure indicates the variation in SMU with 2% (top of each bar) and no injection for both models, at different VIGV position. Where comp. 1/4 to 4/4 relates to the existing model, that of one bulk compressor is shown to be more optimistic with the SMU. Hence does not adequately capture the severity to surge when air is injected.
SMU for existing discretized compressor model and bulk case at different VIGV opening – with and without injection. VIGV: variable inlet guide vane.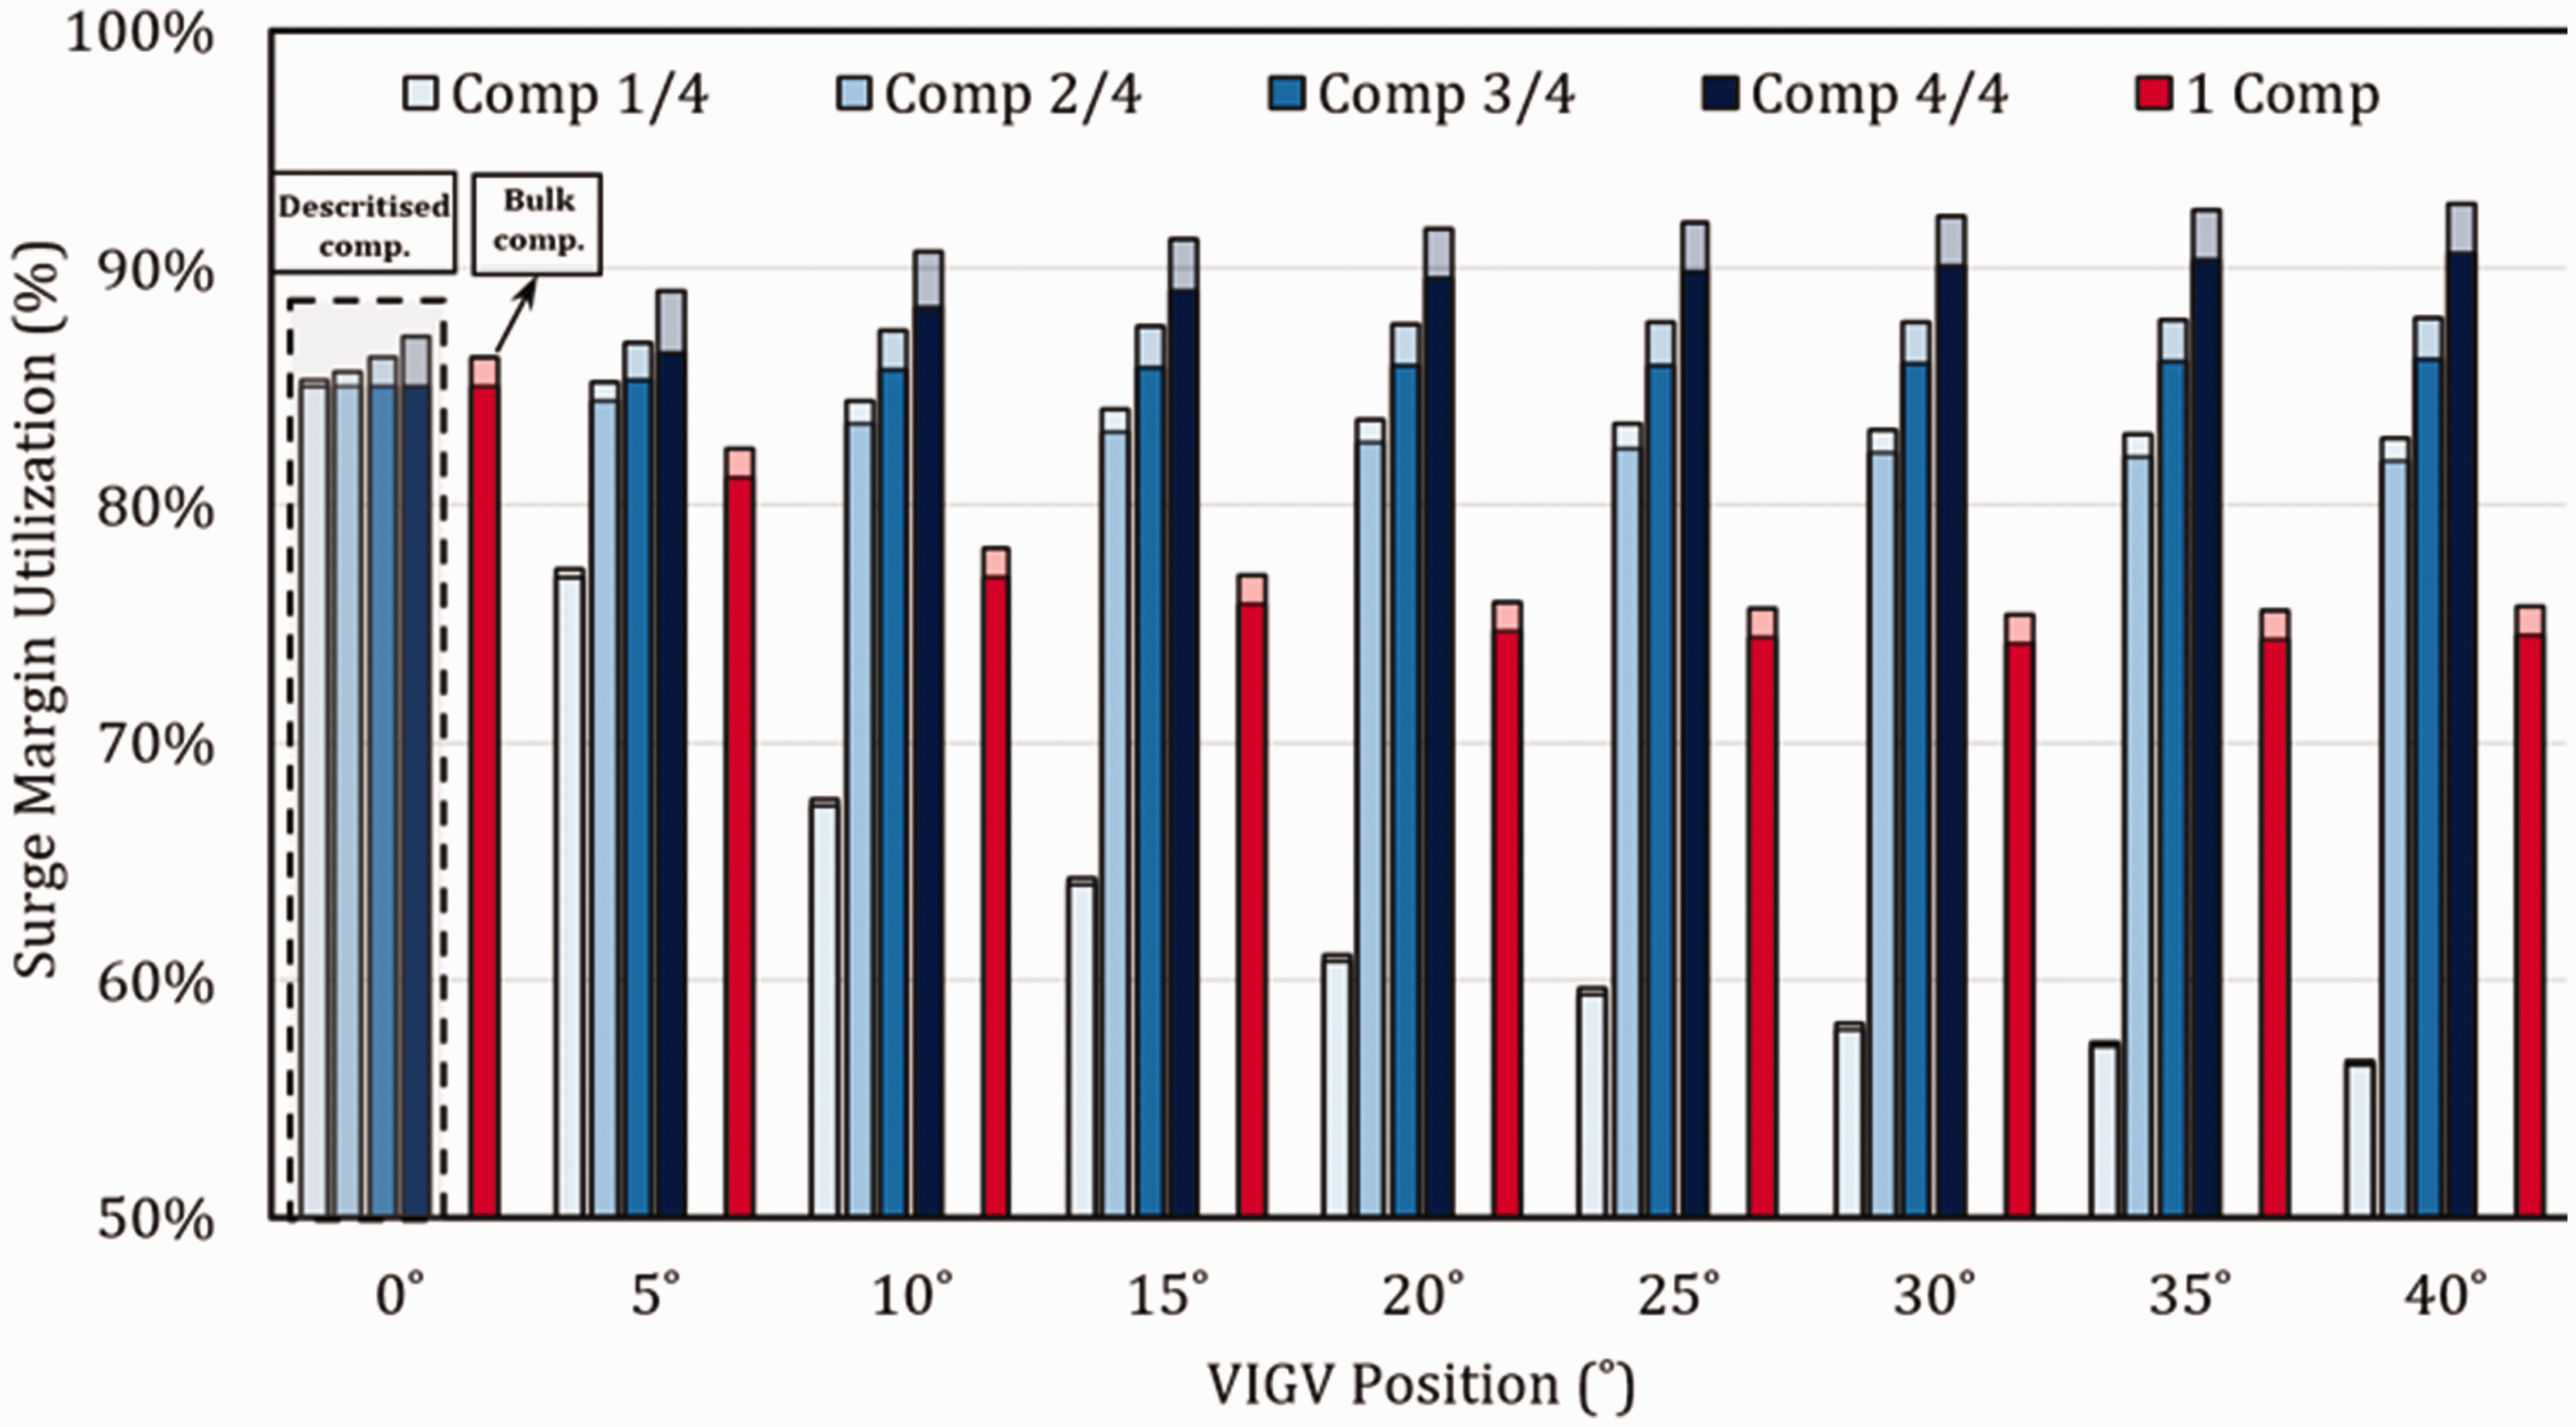
Transient flow injection at part-load – max. fixed VIGV opening
This part of the study onward focuses on the ramp rates, and in this section, the emphasis is load ramp from 50% of the PO when the VIGV is fully open. The response rate investigated here is that of a quasi-transient simulation of ramp-ups through airflow injection. This analysis is based on the following assumptions:
heat soakage and volume storage effects are negligible for heavy-duty GTs
23
ramp-up rate is limited by combustion temperature (CMT) schedule a perfect control system in present: rotational speed is maintained at 100% vibration effects are considered acceptable constant rate of opening and closing for airflow injection valve
Input data for design transient simulation.
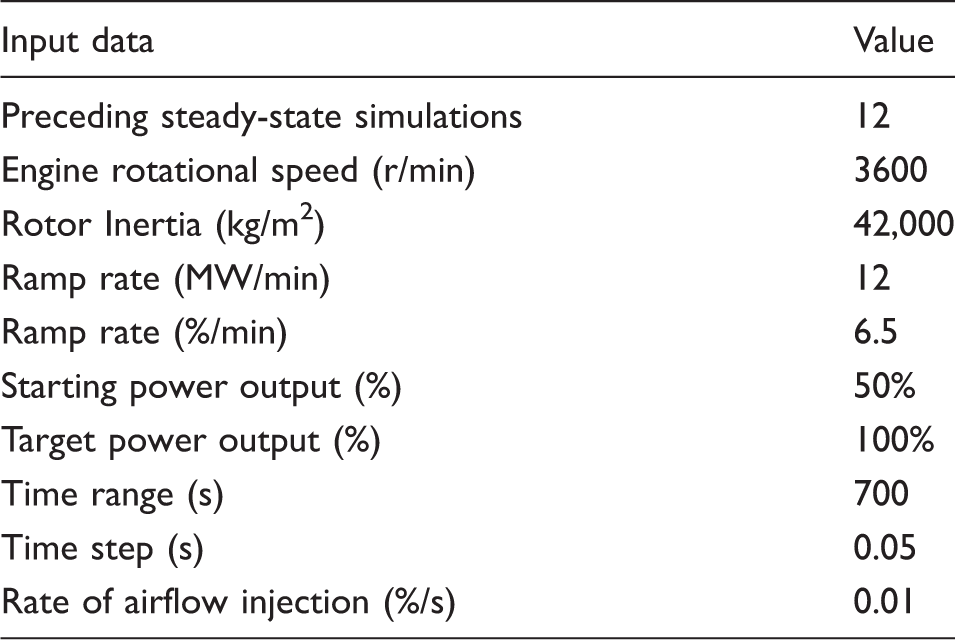
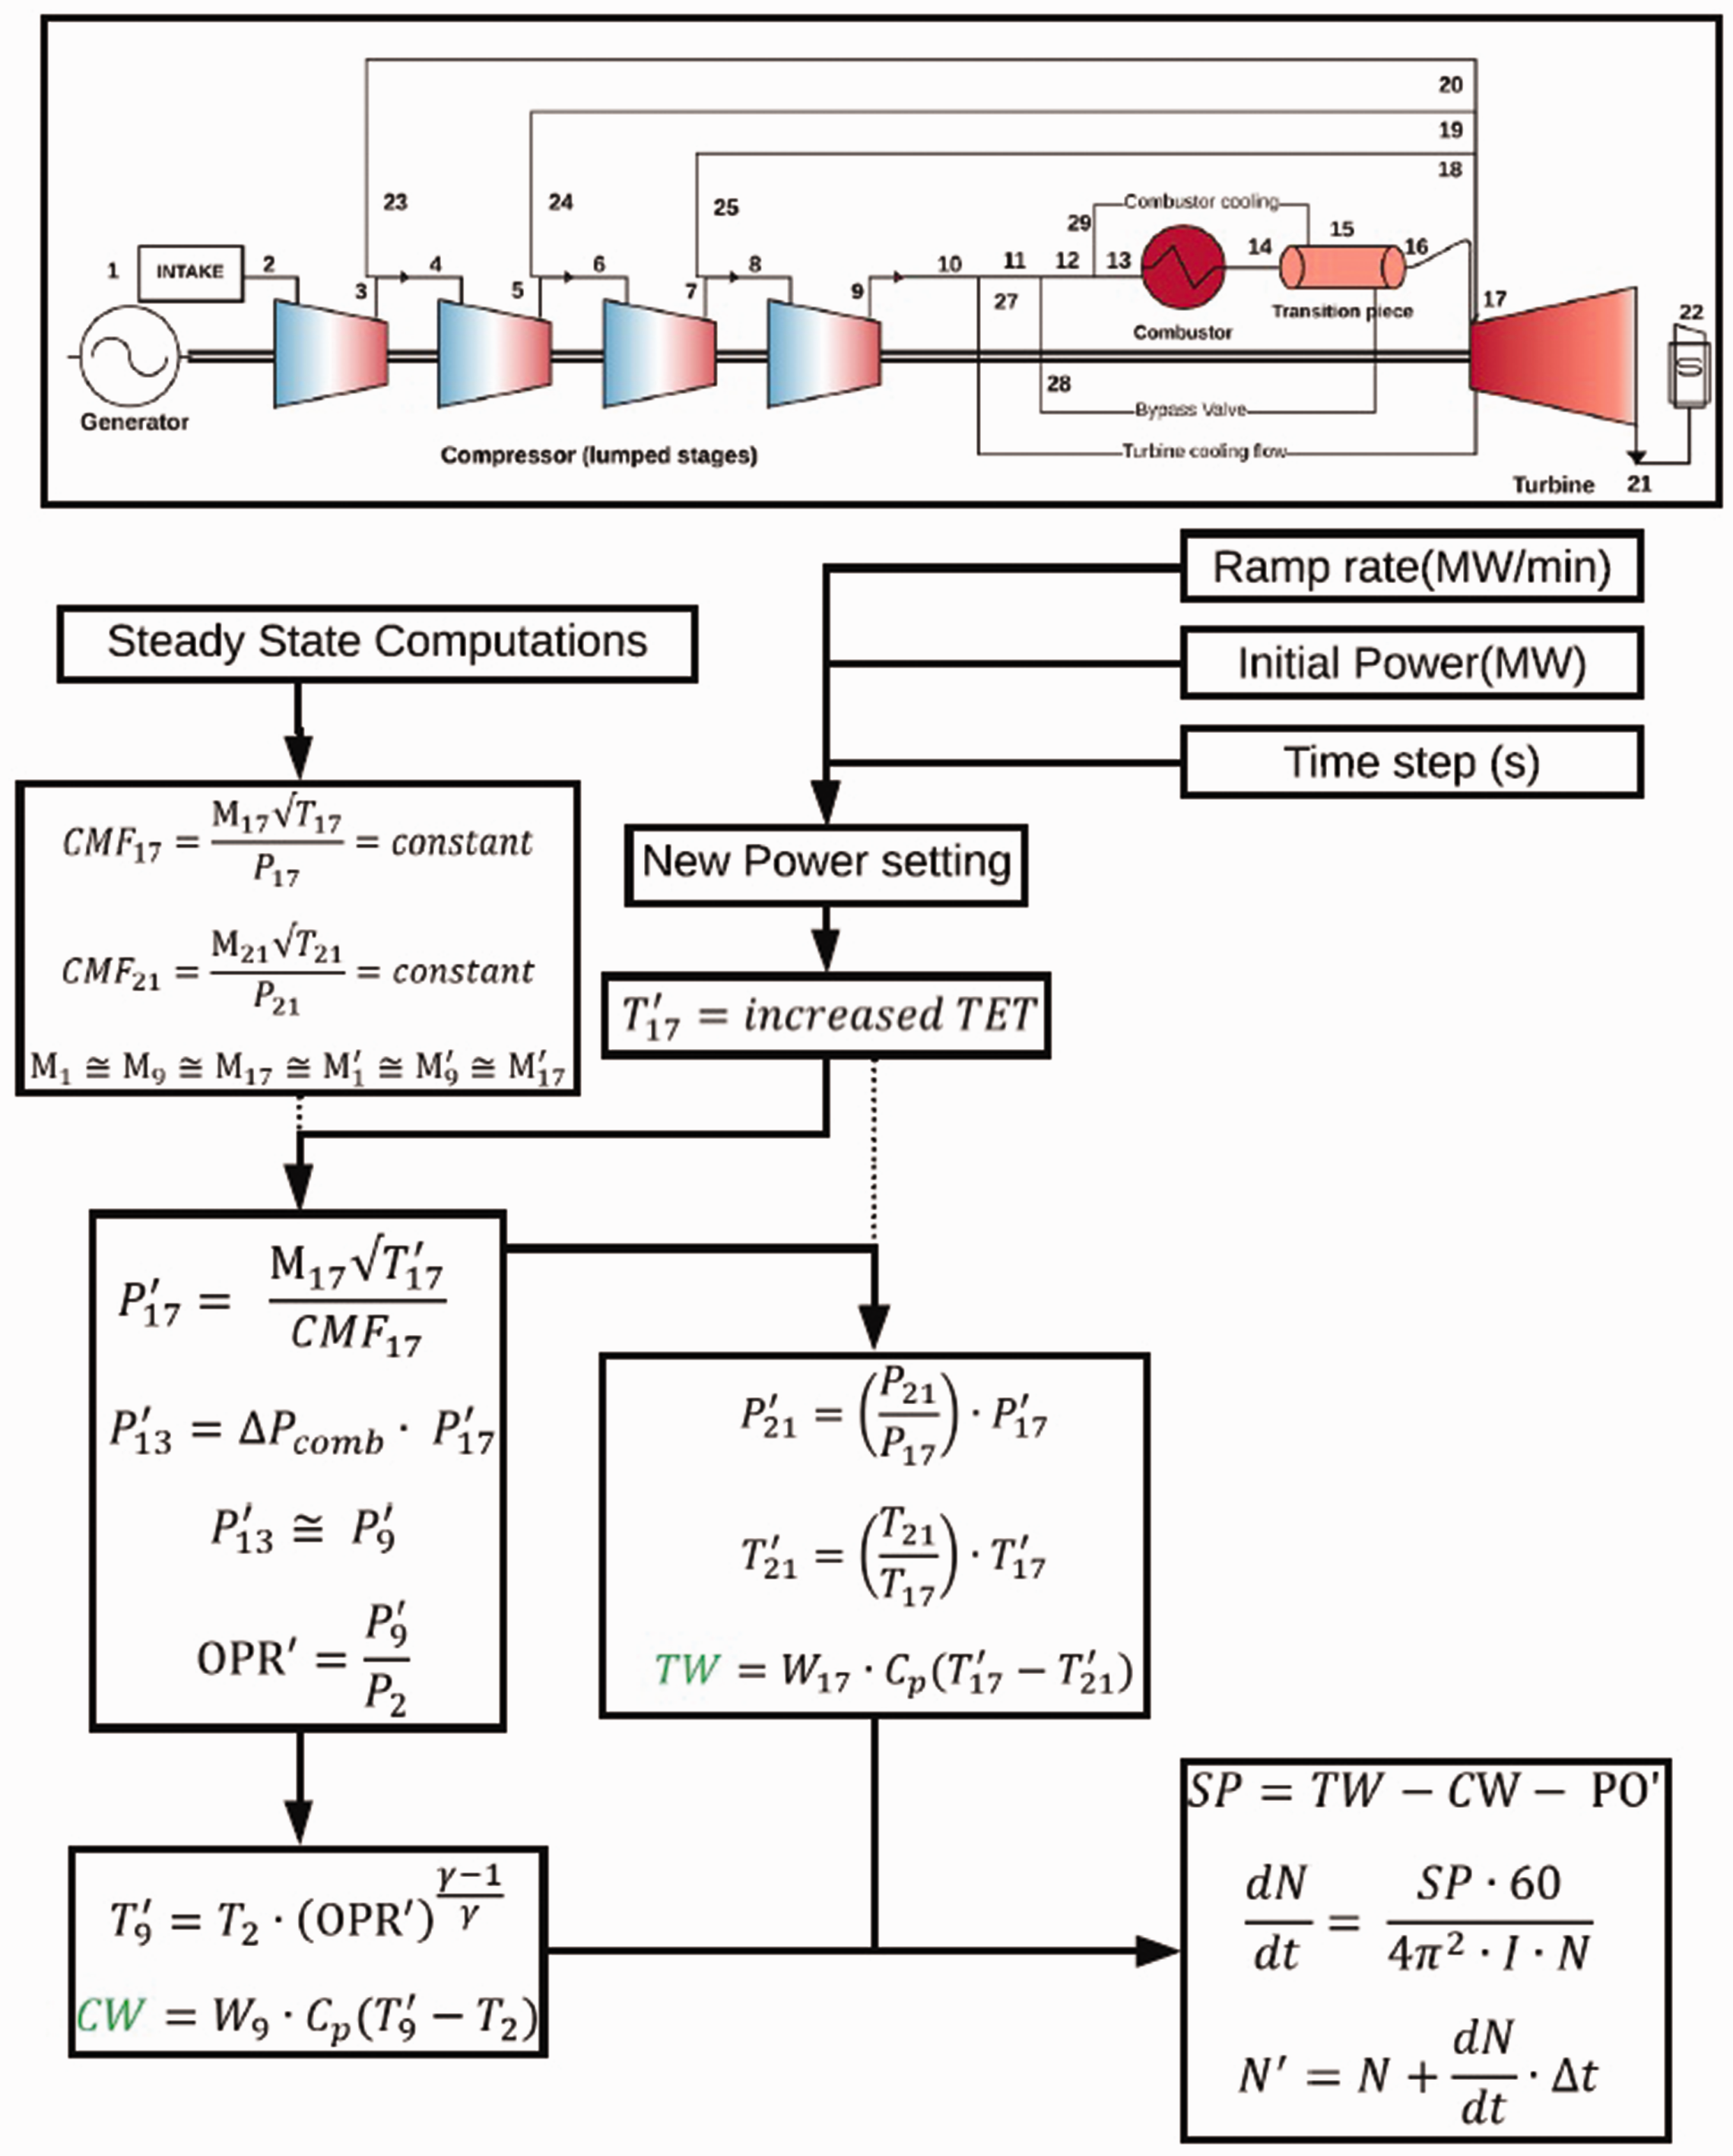
The ramp rate simulation strategy is shown in Figure 10; a quasi-transient simulation was performed using the defined PO schedule to obtain the CMT as a function of time. This is conducted, starting from 50% of the PO, up to 100%. For the injection case on the right of the flow chart, a different PO schedule is arrived at, that is a consequence of the injection rate. This operation is constrained such that the CMT trend is identical to the case of no air injection on the left-hand side. The iterative process stops when both CMT trends are identical with a root mean square error (RMSE) less than a Kelvin. The respective PO trends are compared to evaluate the improvement in ramp rate.
Flow chart indicating the strategy for the ramp rate increase – max VIGV opening. OEM: original equipment manufacturer.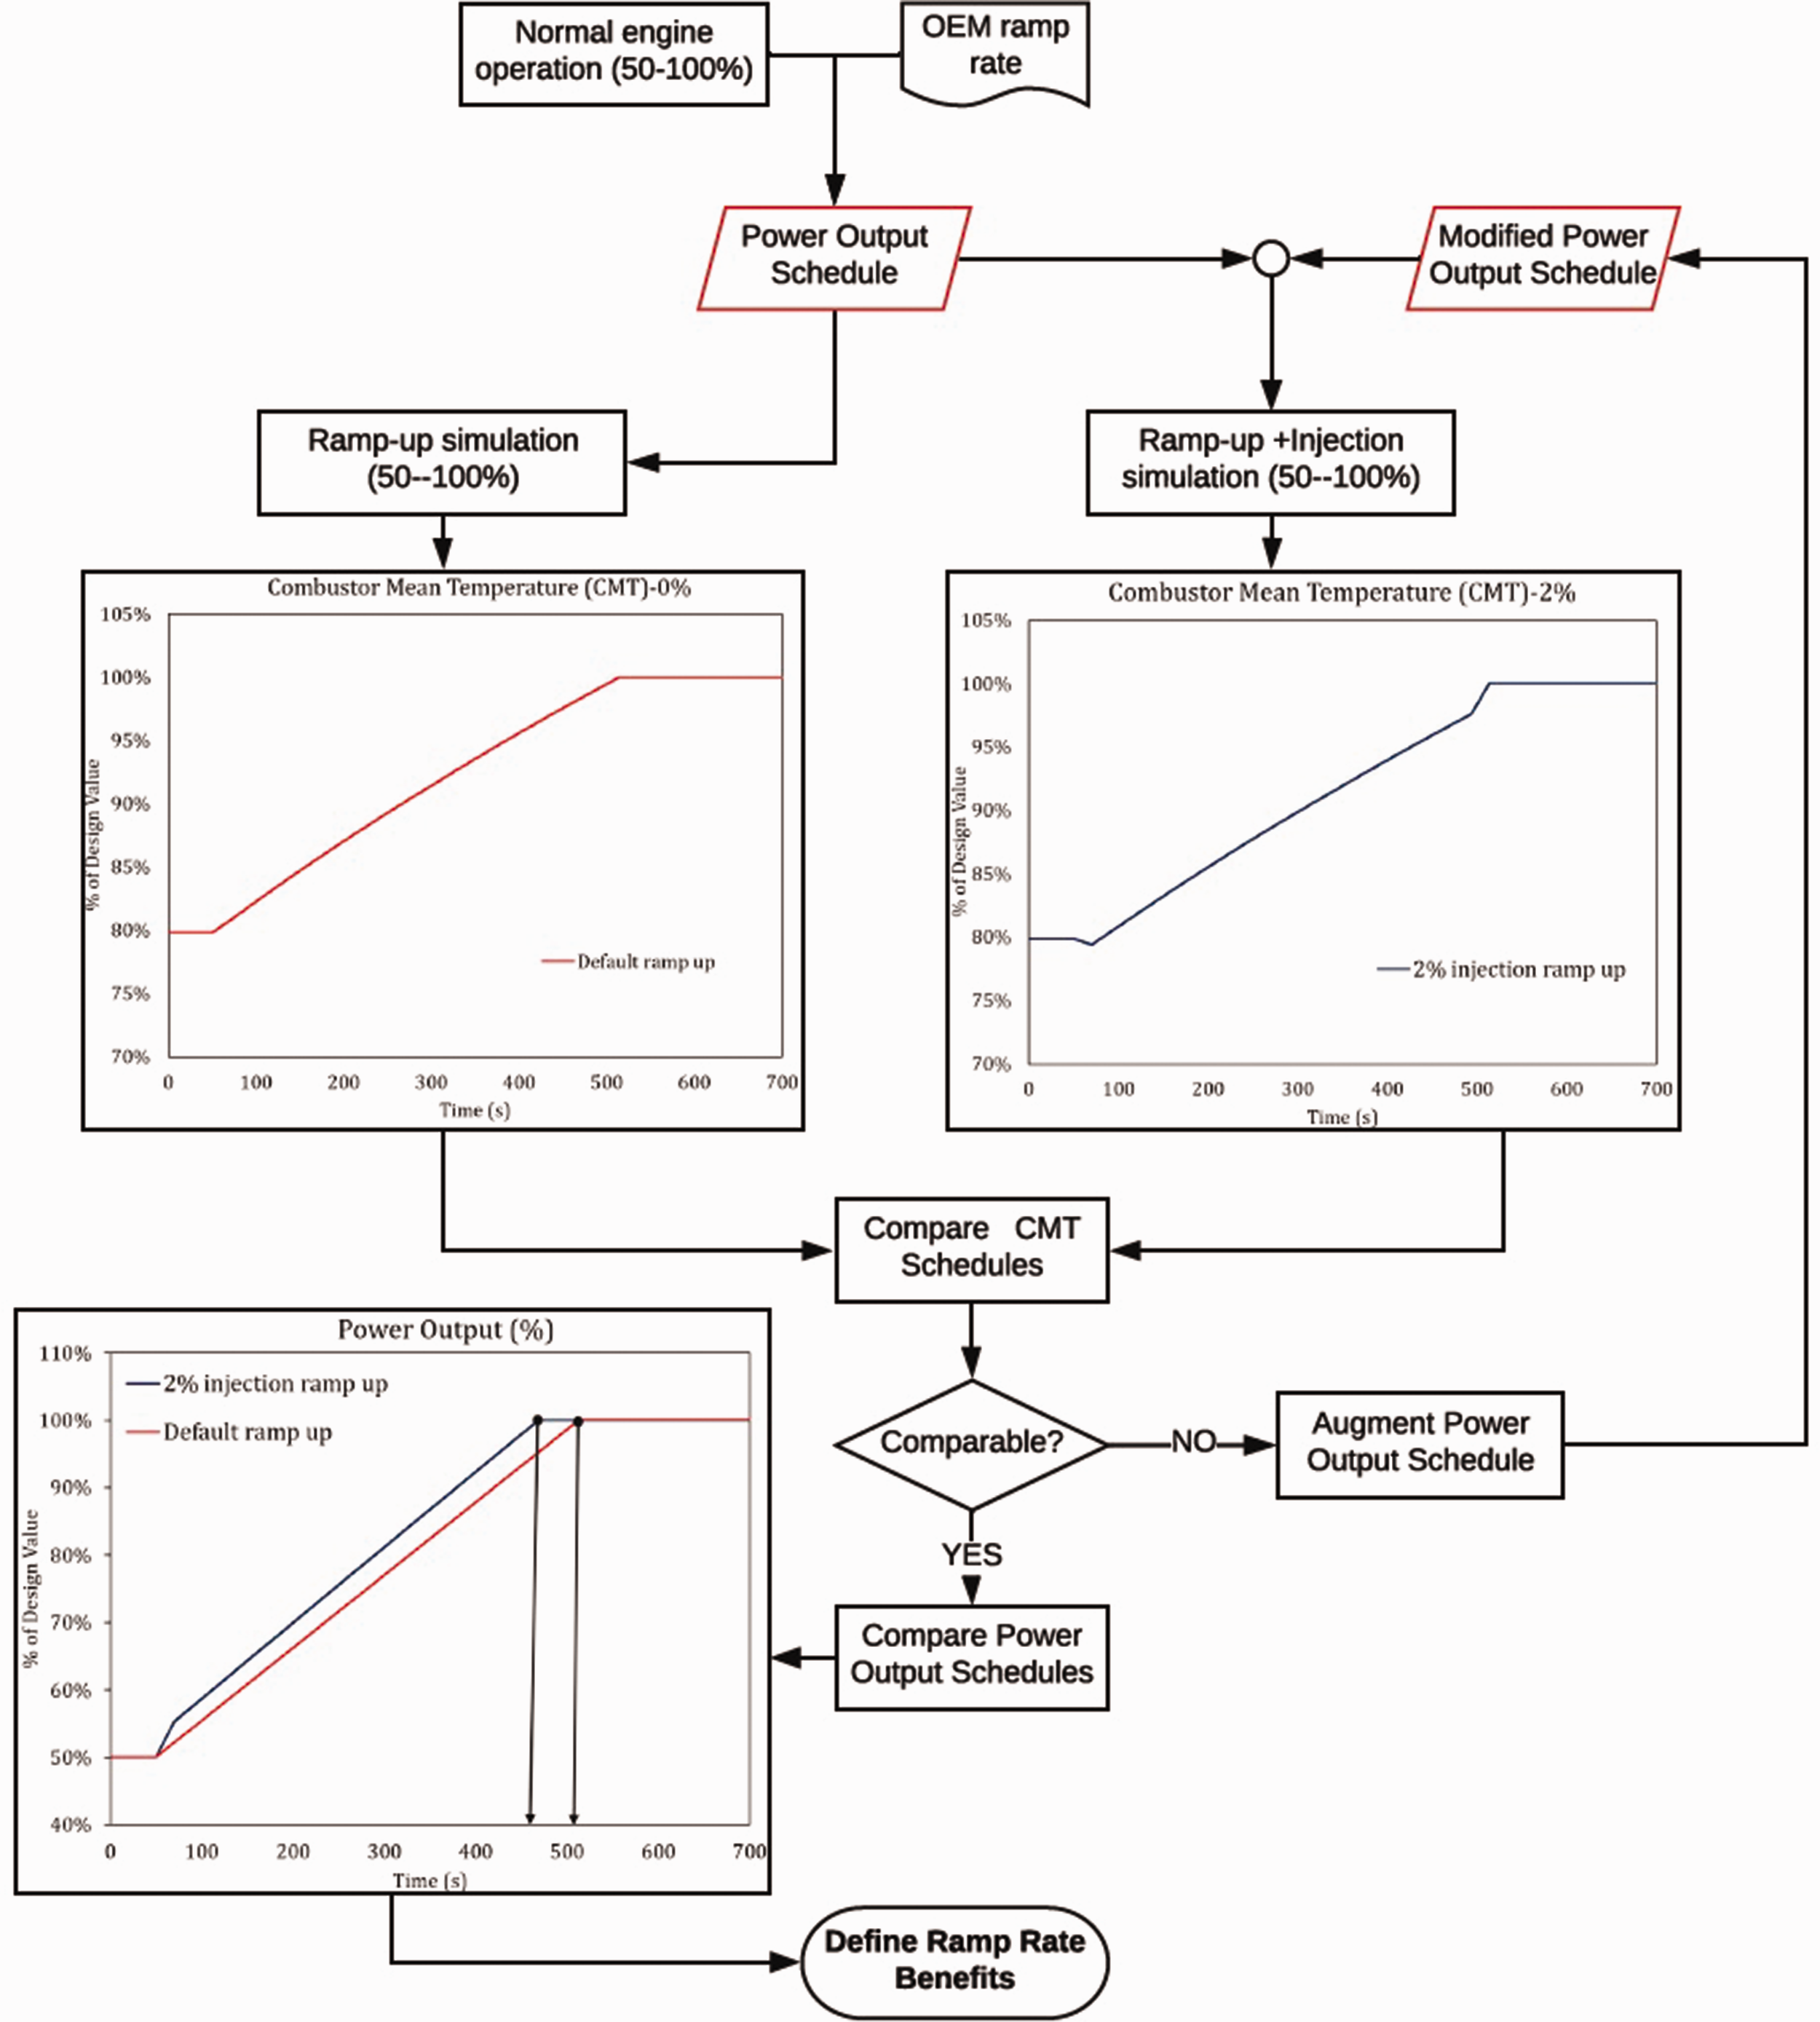
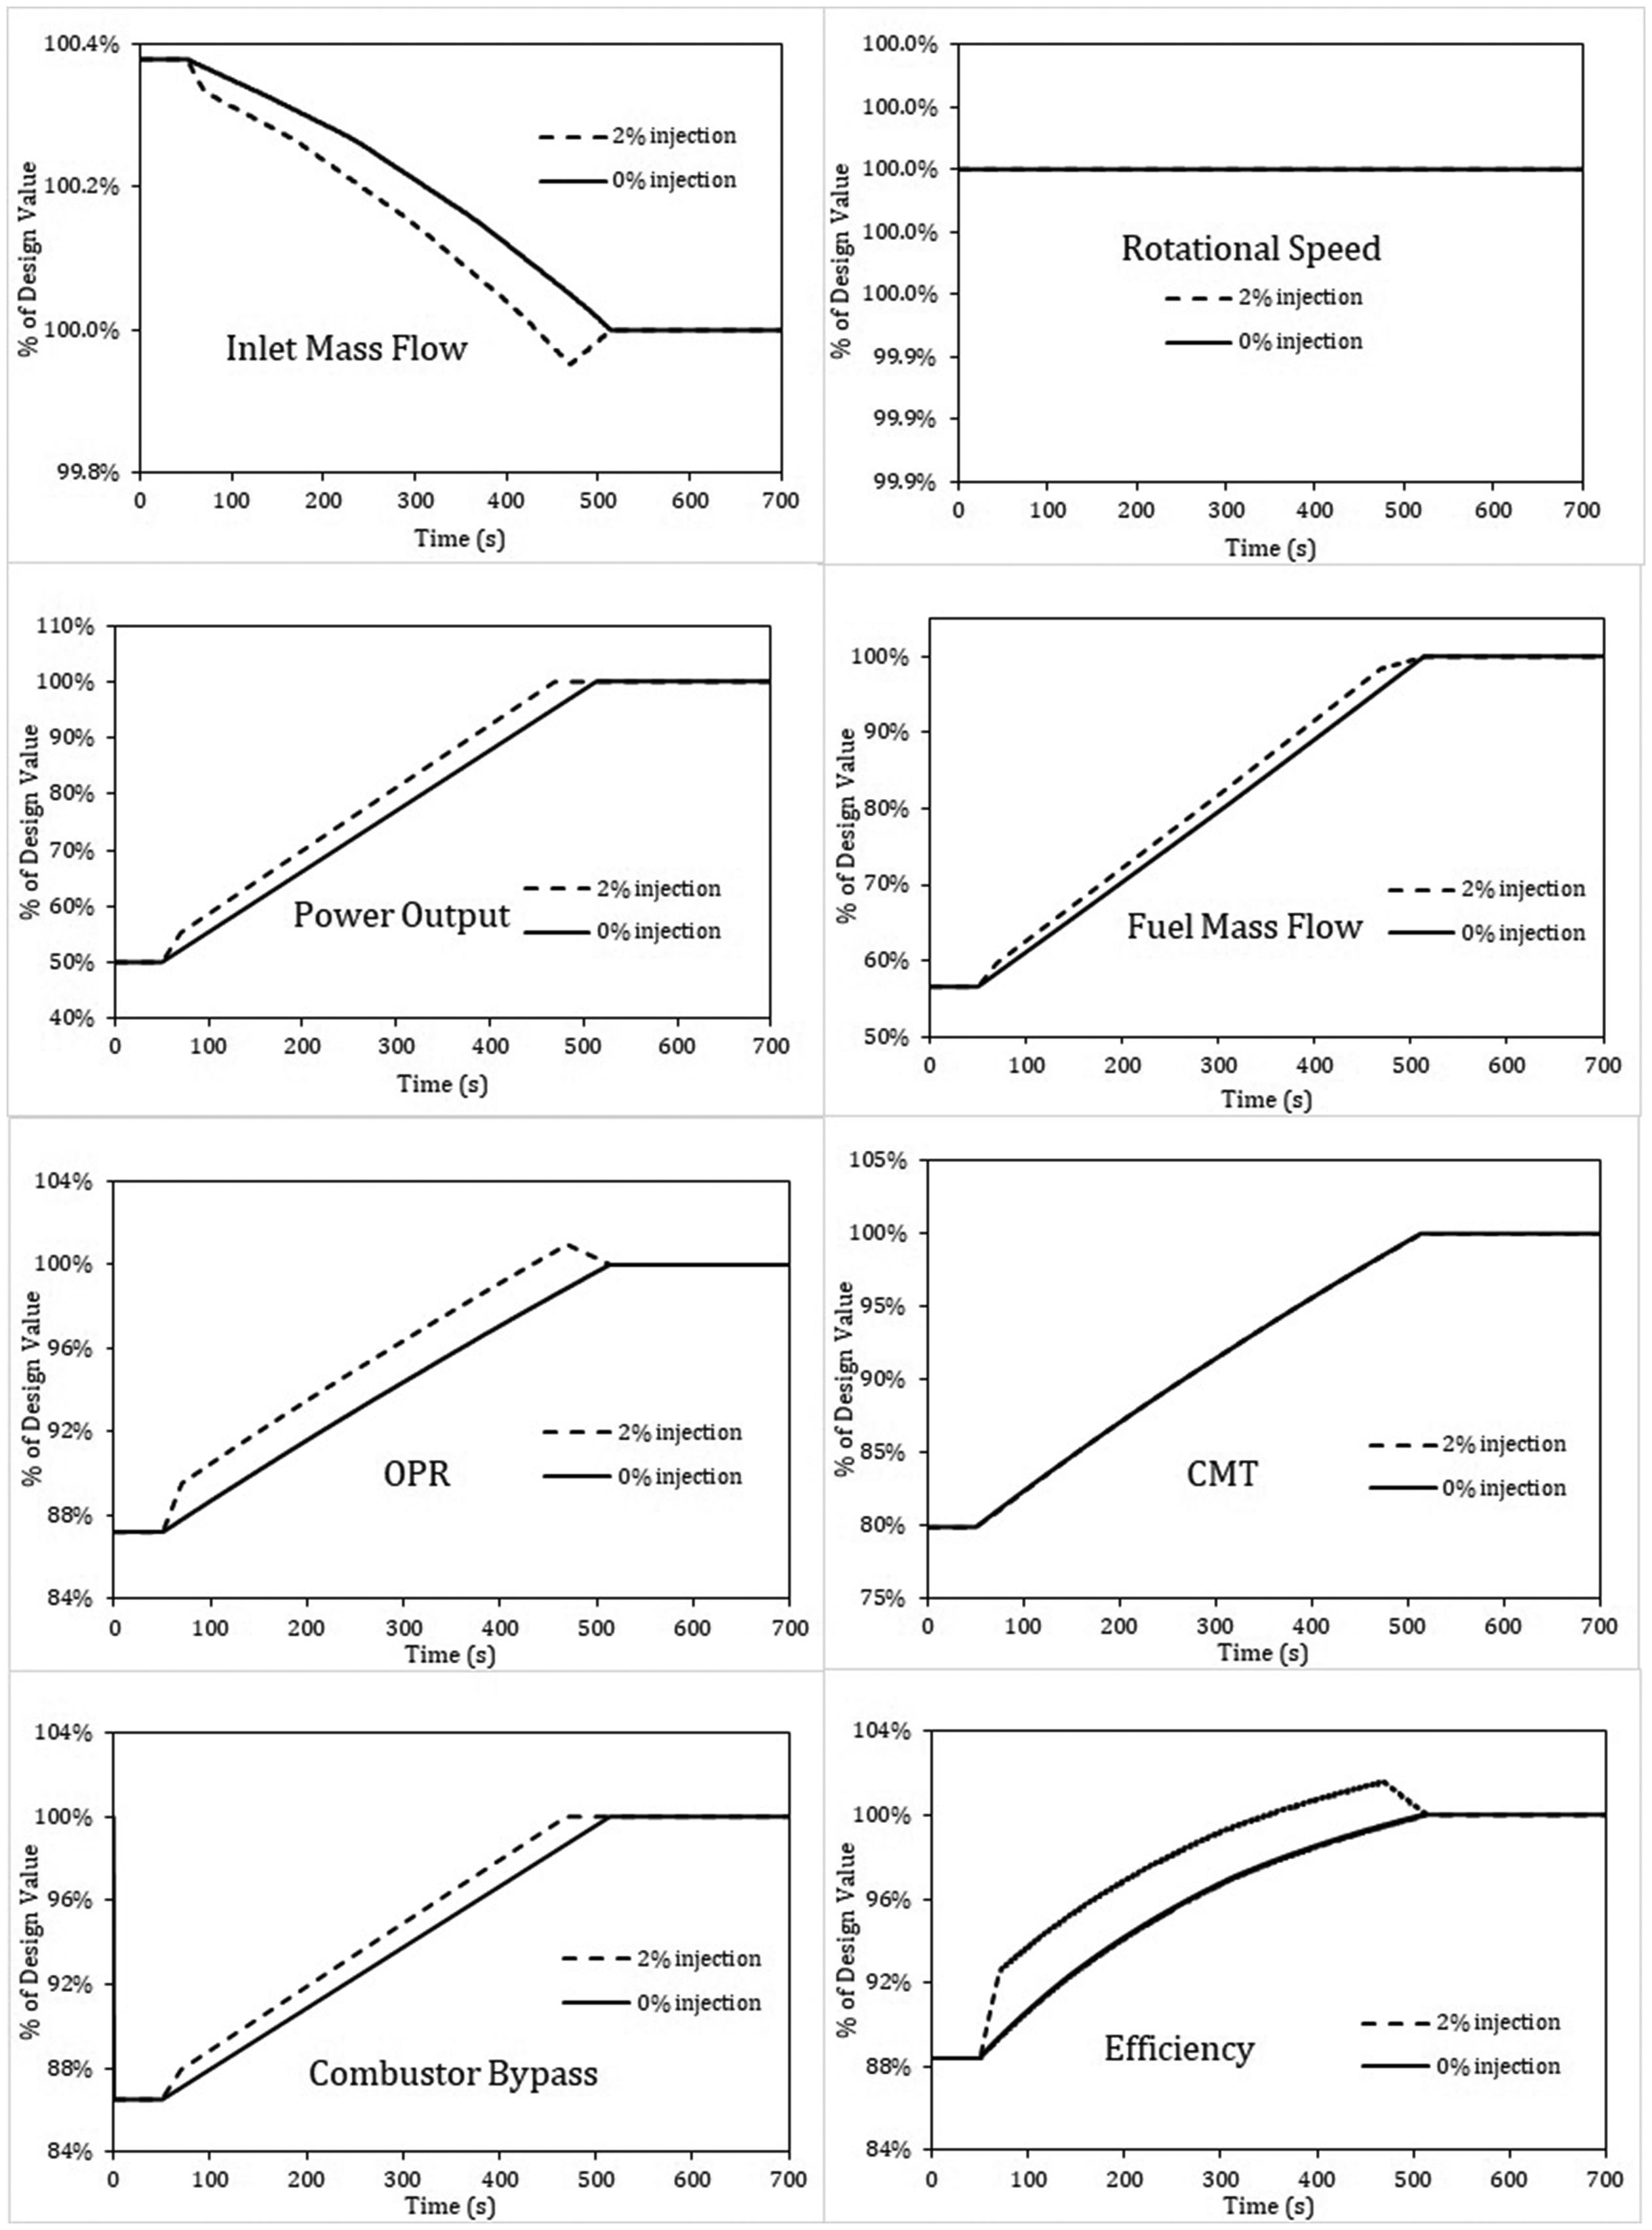
Figure 11 indicates the differences in PO with and without injections with the time duration. It shows no flow injection during the first 50 s of the ramp-up; afterwards, the air injection valve gradually opens to deliver 2% of CDF which corresponds to approximately 7.5 kg/s to the plenum. The injection rate is kept constant, leading to an increase in fuel flow and OPR until the design PO is achieved. At this point, the air injection valve closes, and the combustion temperature increases to maintain full PO. The 100% PO is achieved at 44 s earlier as shown, in the case of 2% airflow injection. Figure 23 in Appendix 1 shows the engine operating parameters during a ramp-up for both cases. The figure shows the rapid increase of most parameters as the air injection valve opens, although a slight reduction in inlet mass flow. The rotational speed is also shown to be constant, while the thermal efficiency increases the most, due to the OPR increase.
PO and airflow injection with time – with and without injection. PO: power output.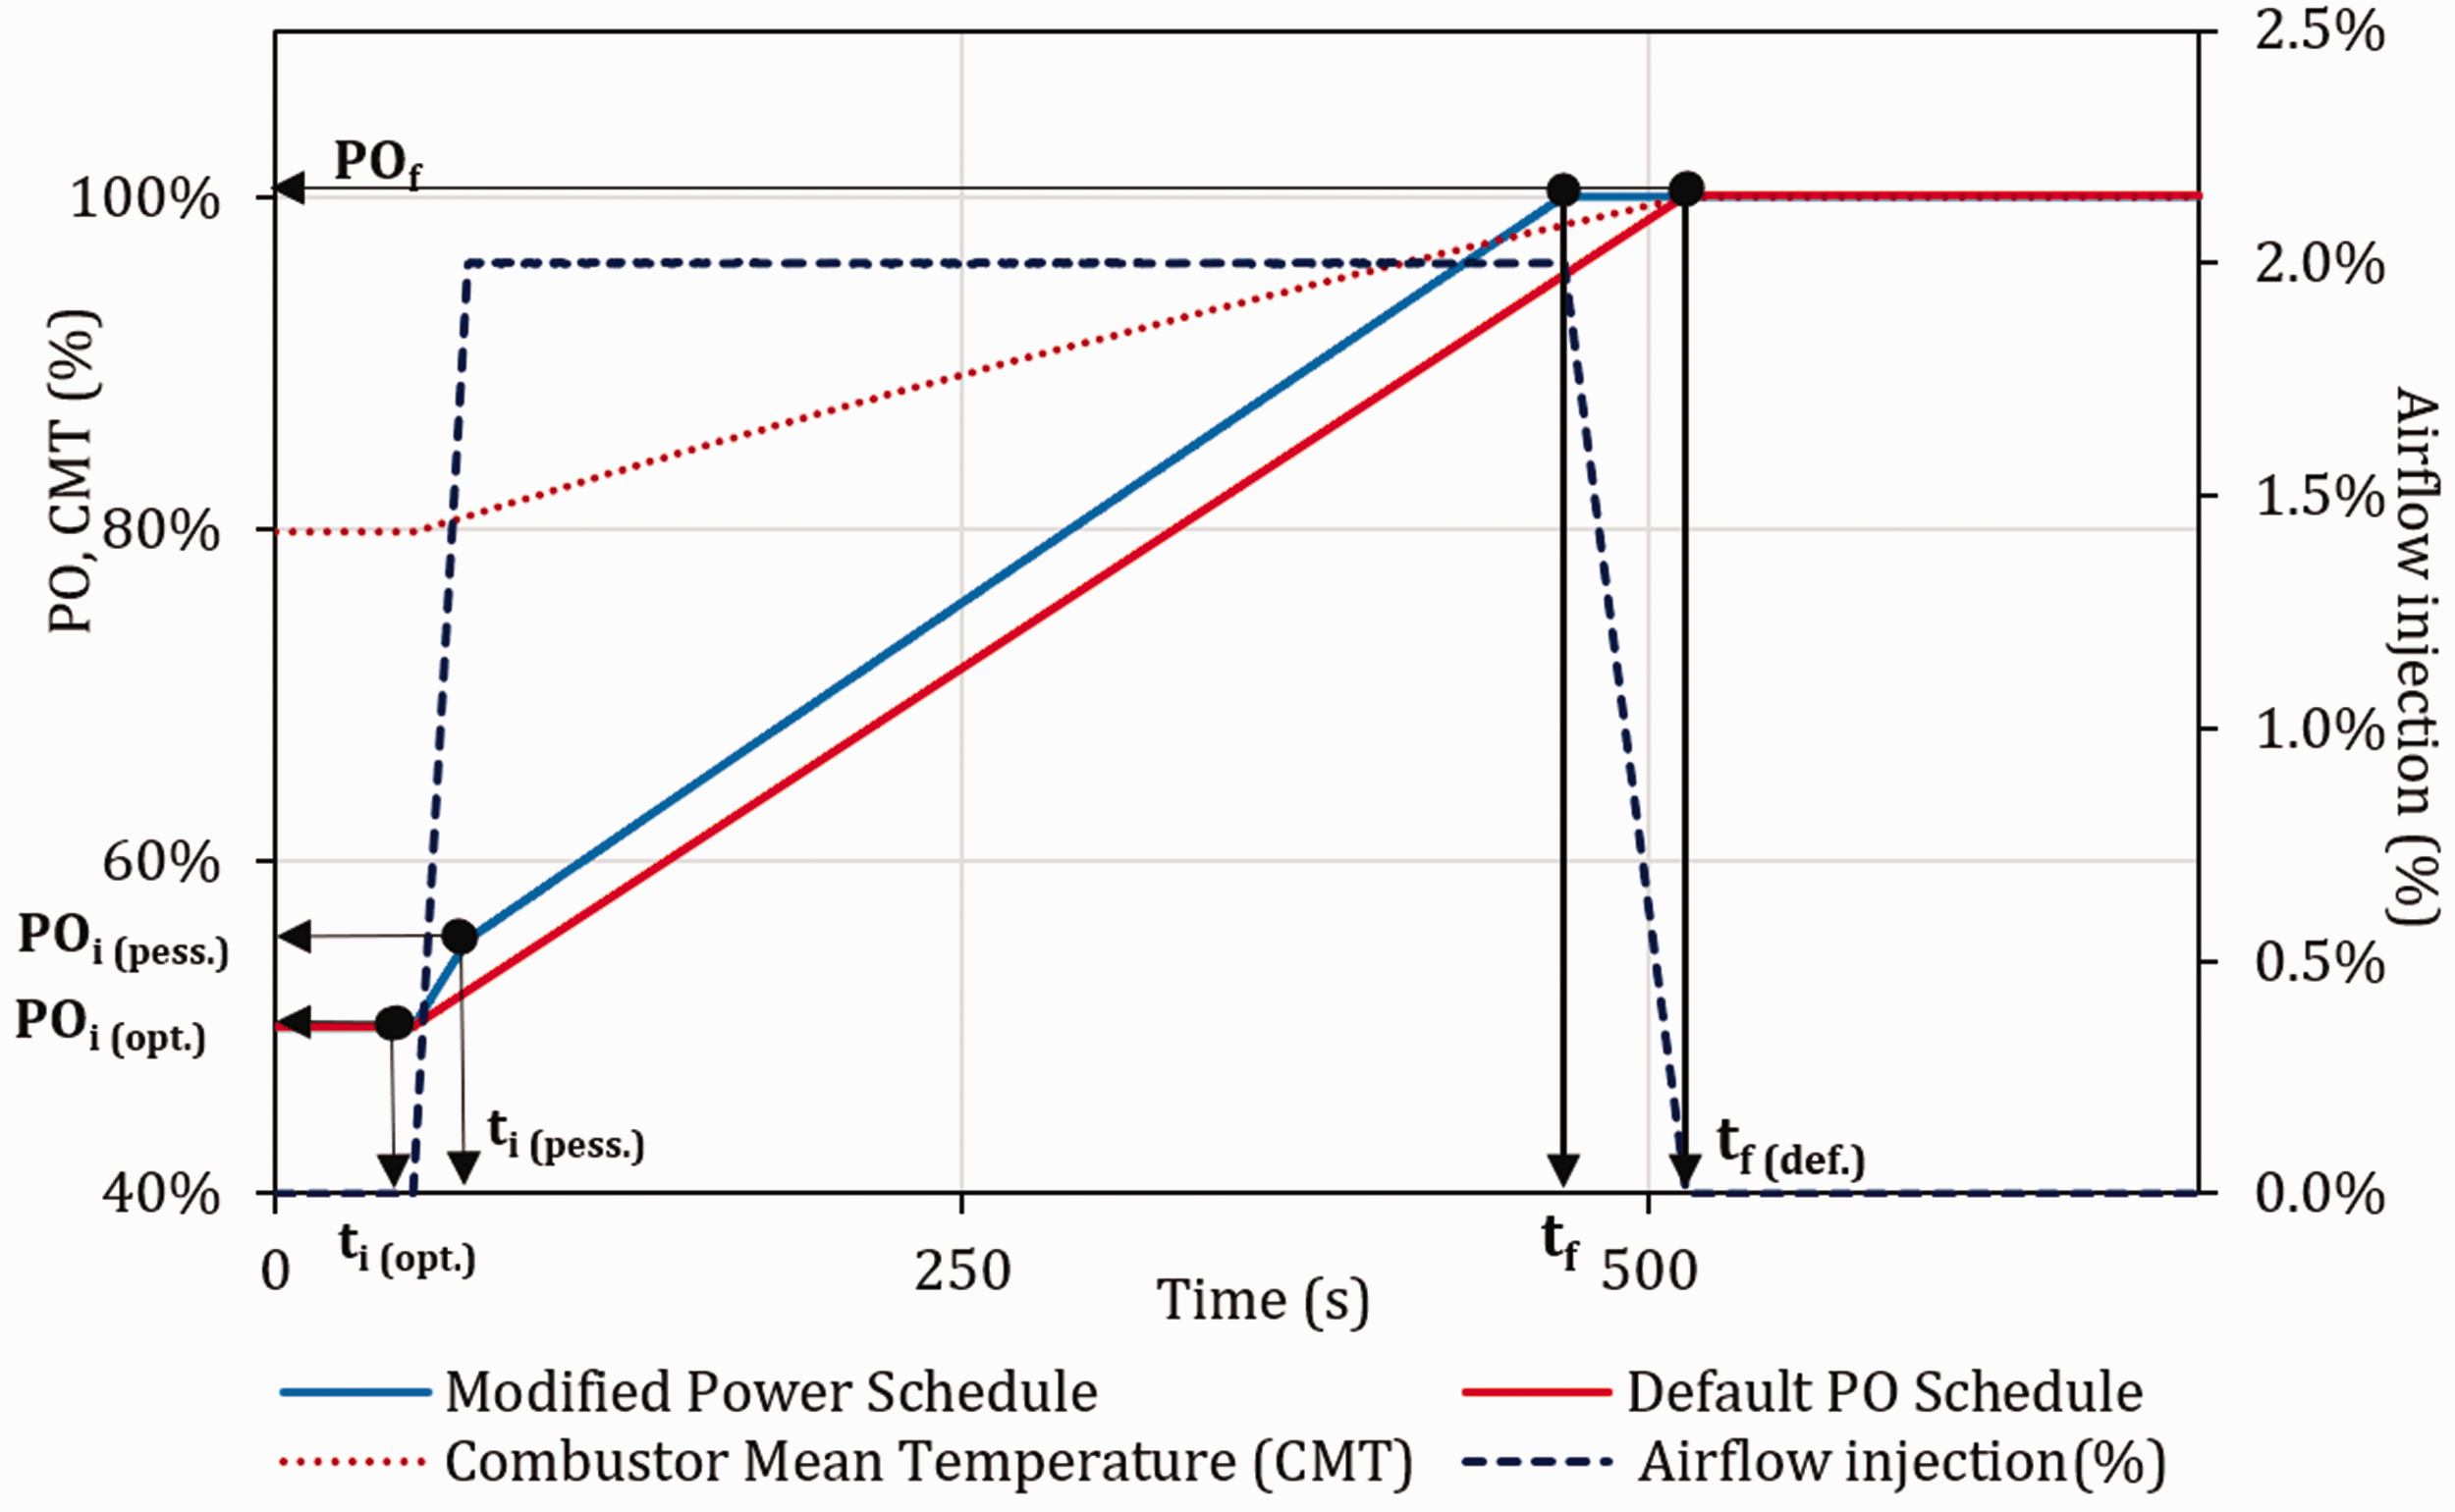
The ramp rate obtained is analysed in different likelihoods: the default case, optimistic, pessimistic, and average ramp rates as indicated in equations (9) to (12). As implied, the optimistic ramp rate calculates the best ramp rate achievable. This is defined by the change in PO with time duration; for this case, it is the difference between the maximum POf achieved and the lowest POi(opt.) – 50% of PO, against their respective time difference tf and ti(opt.). In a similar formulation, that of the pessimistic case still considers the maximum PO and earliest time to achieve this tf, with reference to a higher starting PO (that does not account for the initial gradual increase in airflow) and corresponding time ti(pess.). An average is also considered between the two scenarios as shown. Optimistic ramp rates include the benefits of the injection valve opening period as a faster ramp is observed when the injection flow rate increases from none to the desired injection amount. Following this, a more modest ramp rate is obtained. This effect is primarily due to the increased OPR accompanying the injection and a corresponding fuel flow increase


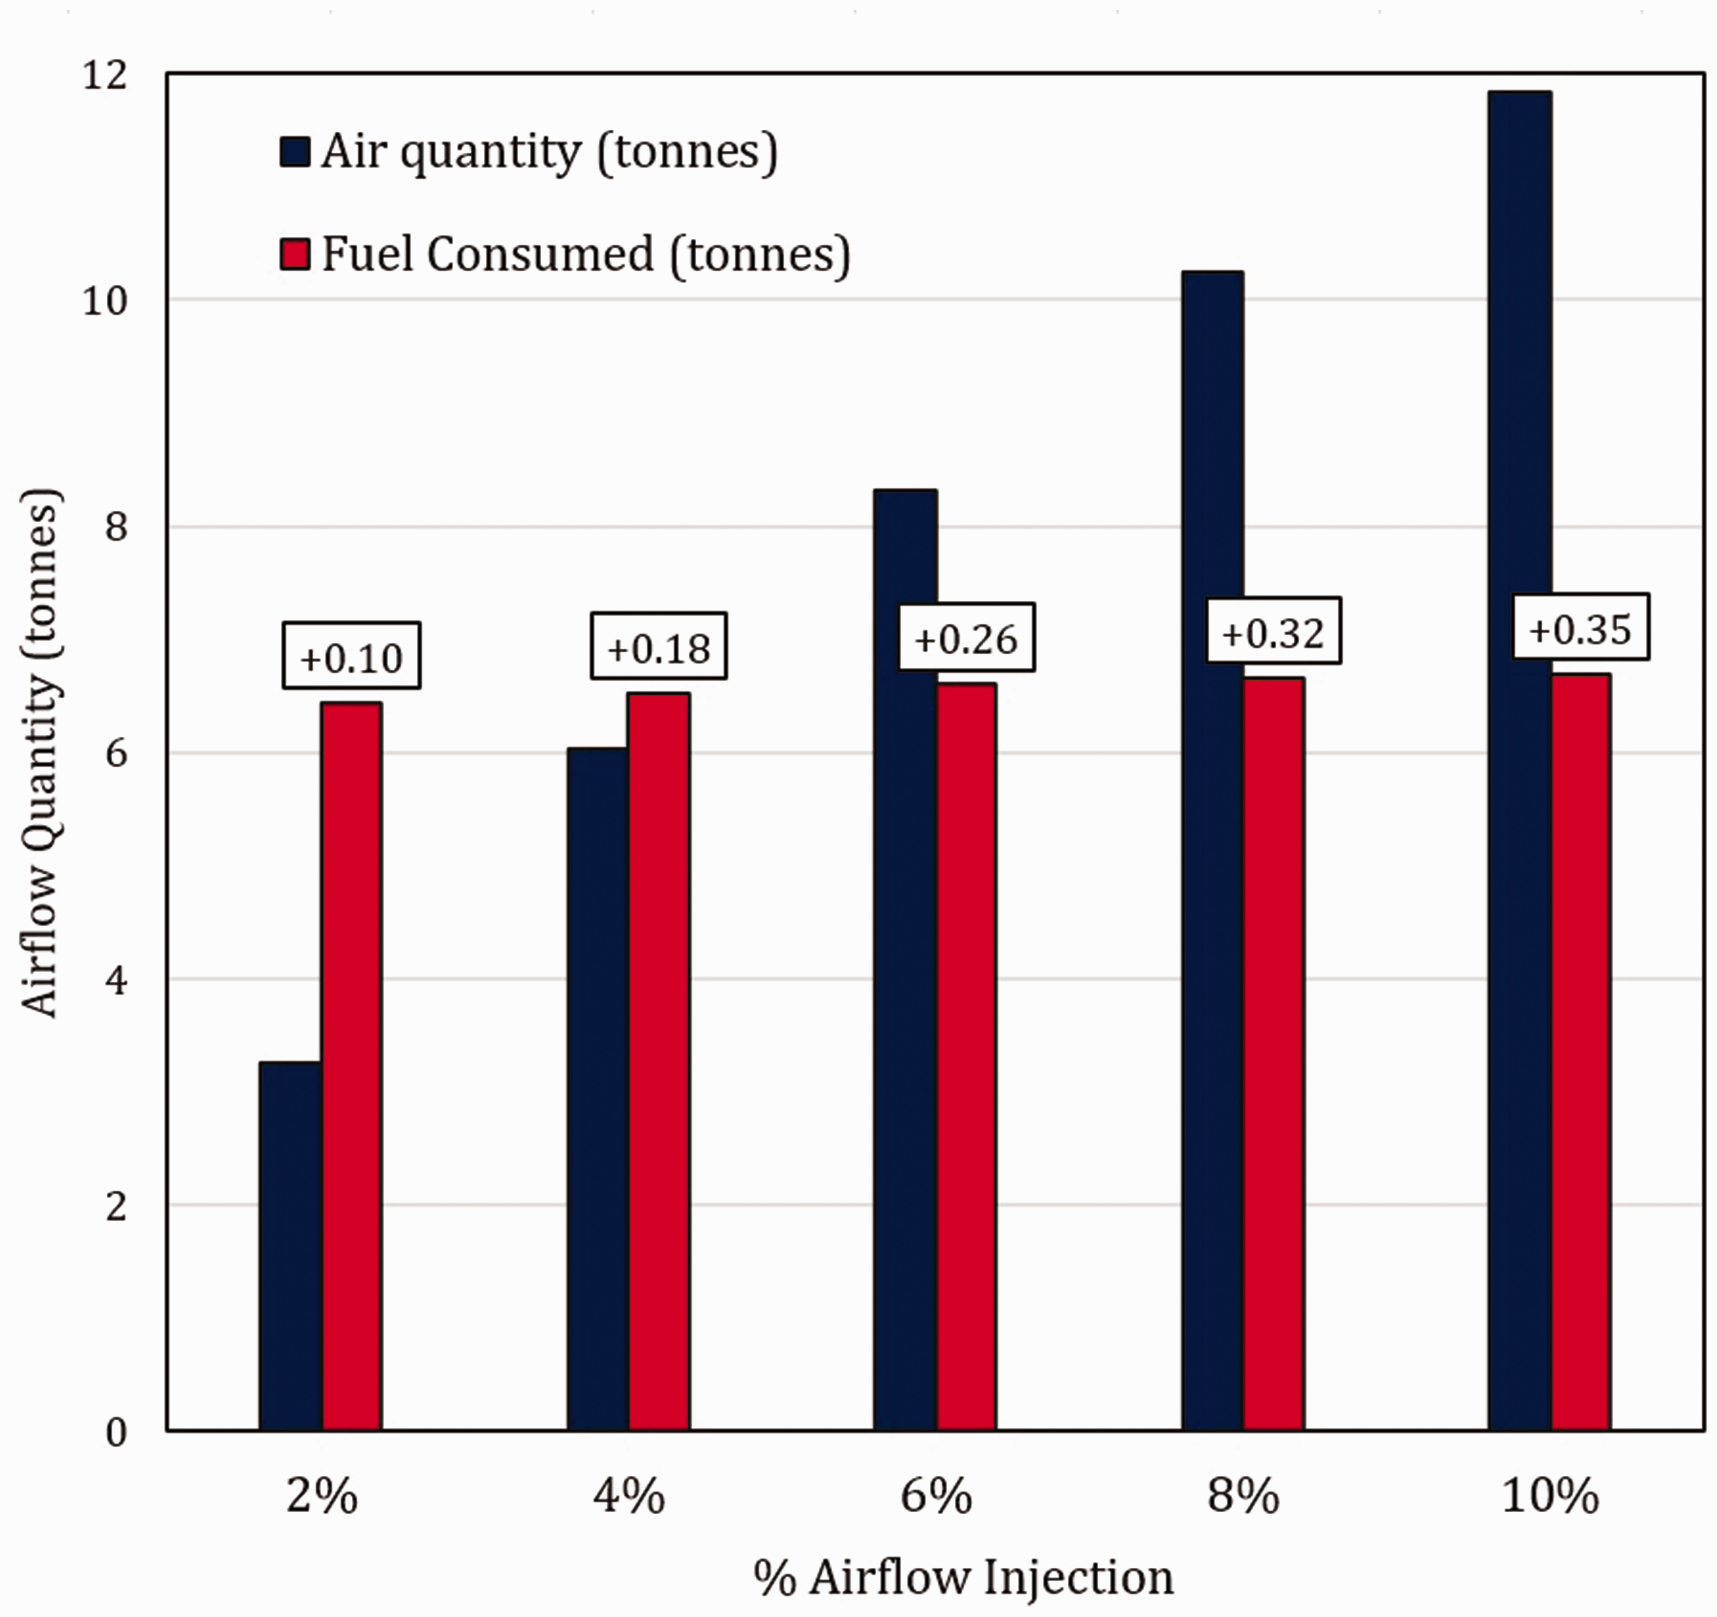
The procedure is repeated for airflow injections up to 10% at 2% intervals, and their ramp rates are shown in Figure 12. These are constant rates of injection immediately after the gradual valve opening as shown in Appendix 1 (Figure 24). From the figure, it shows that the ramp rates increase with the flow injections. These increments are presented in the three scenarios in Figure 12, showing that for the average case, at every 2% increase in the flow, the ramp rate improves by about 10%. At 2% air injection, the average response rate is 12.9 MW/min representing a 7.5% augmentation. For this case, the corresponding maximum SMU was 86%. The injection ramp rates increased up to 46% for the highest injection (10%), although the SMU approached 91%. Since the CMT schedule is maintained, airflow injection brings about an increase in fuel consumption for every ramp rate increase case as shown in Figure 13. This figure highlights the increase in fuel, in tonnes, with their corresponding mass of total air injected.
Increase in ramp rate as a function of flow injection for different scenarios. RR: ramp-up rate; SMU: surge margin utilisation. Air and fuel quantity as a function of flow injection.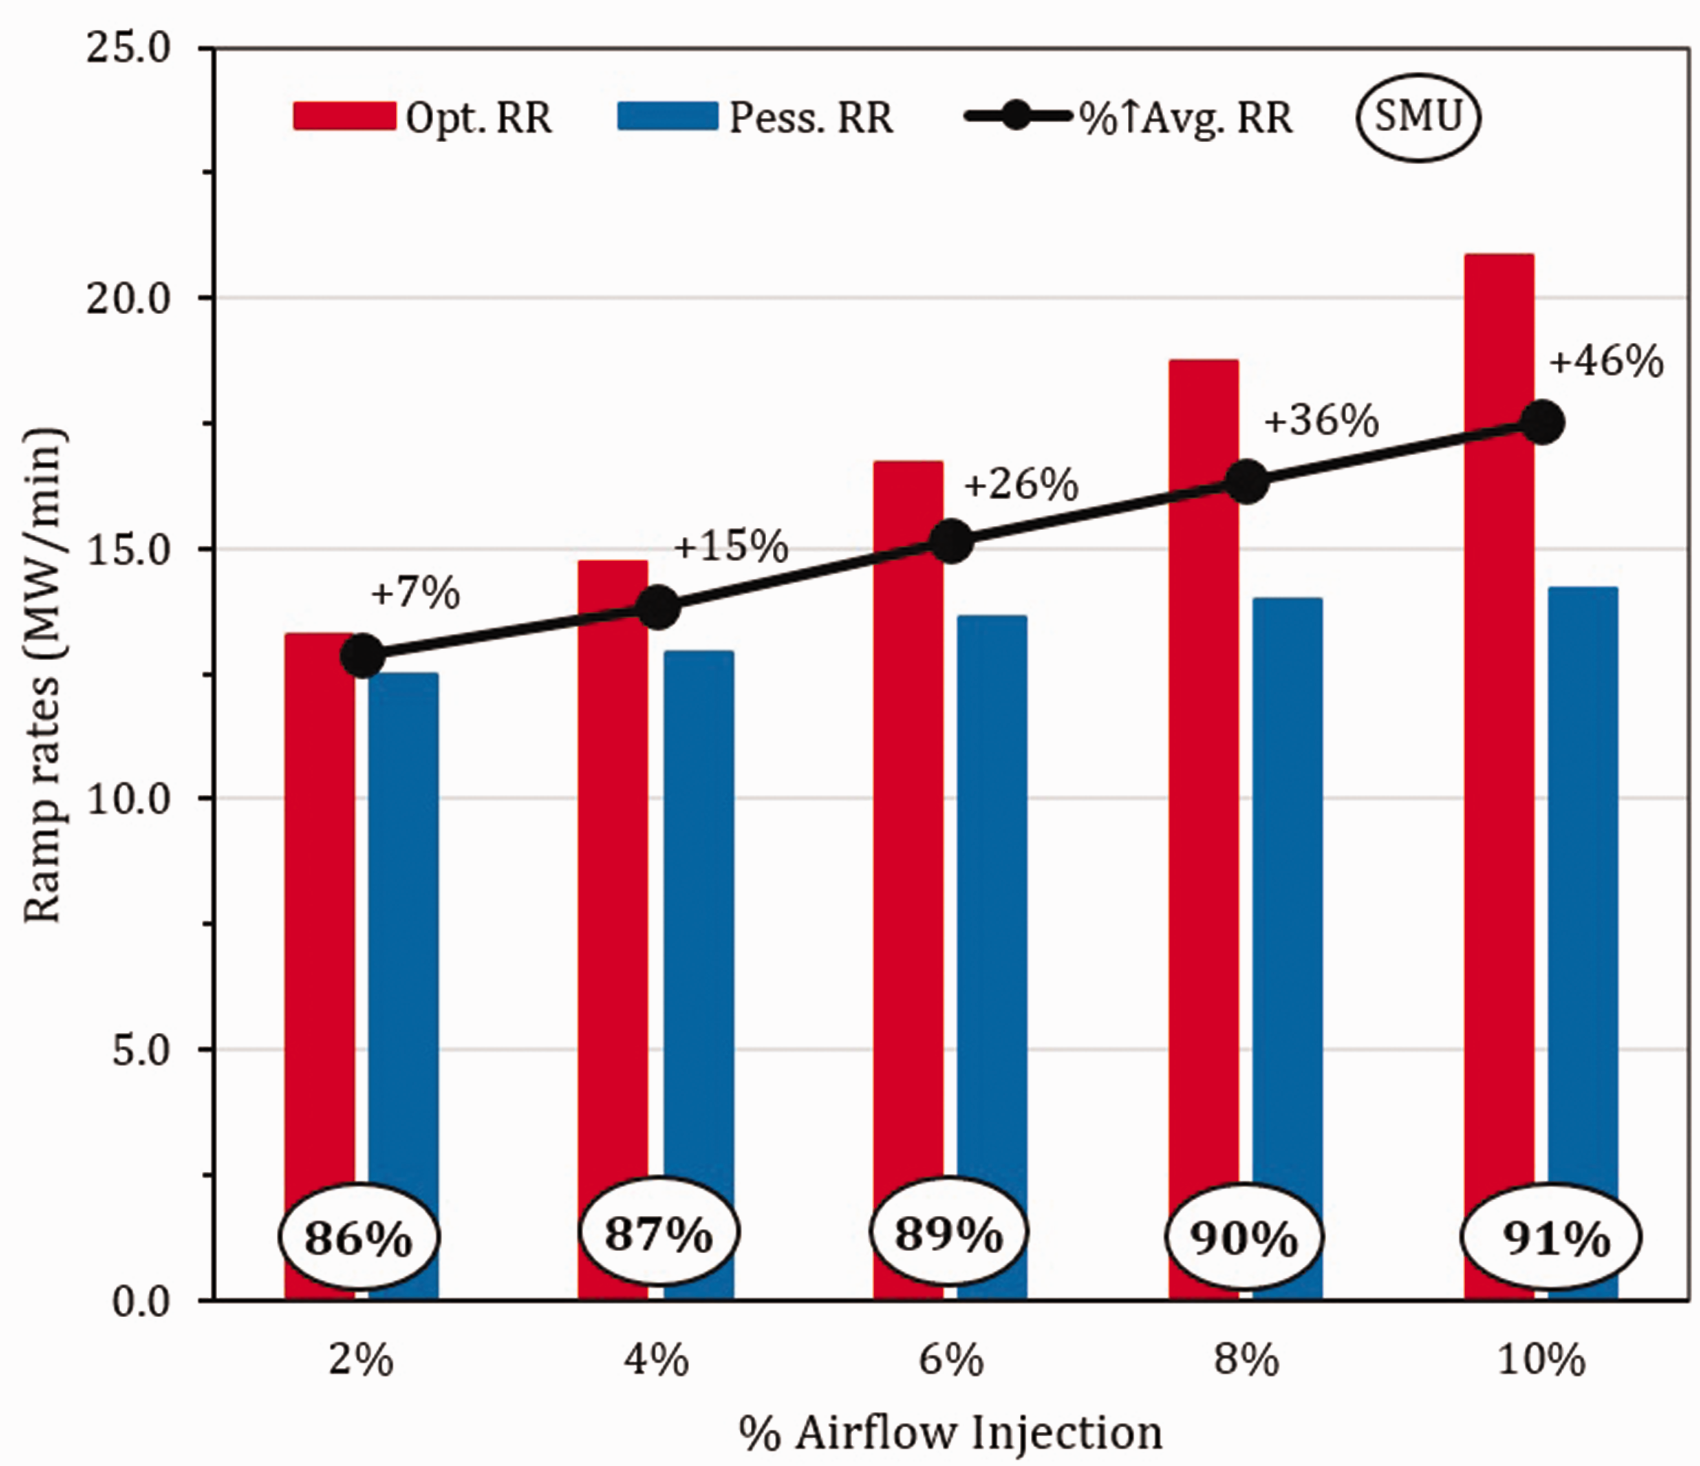
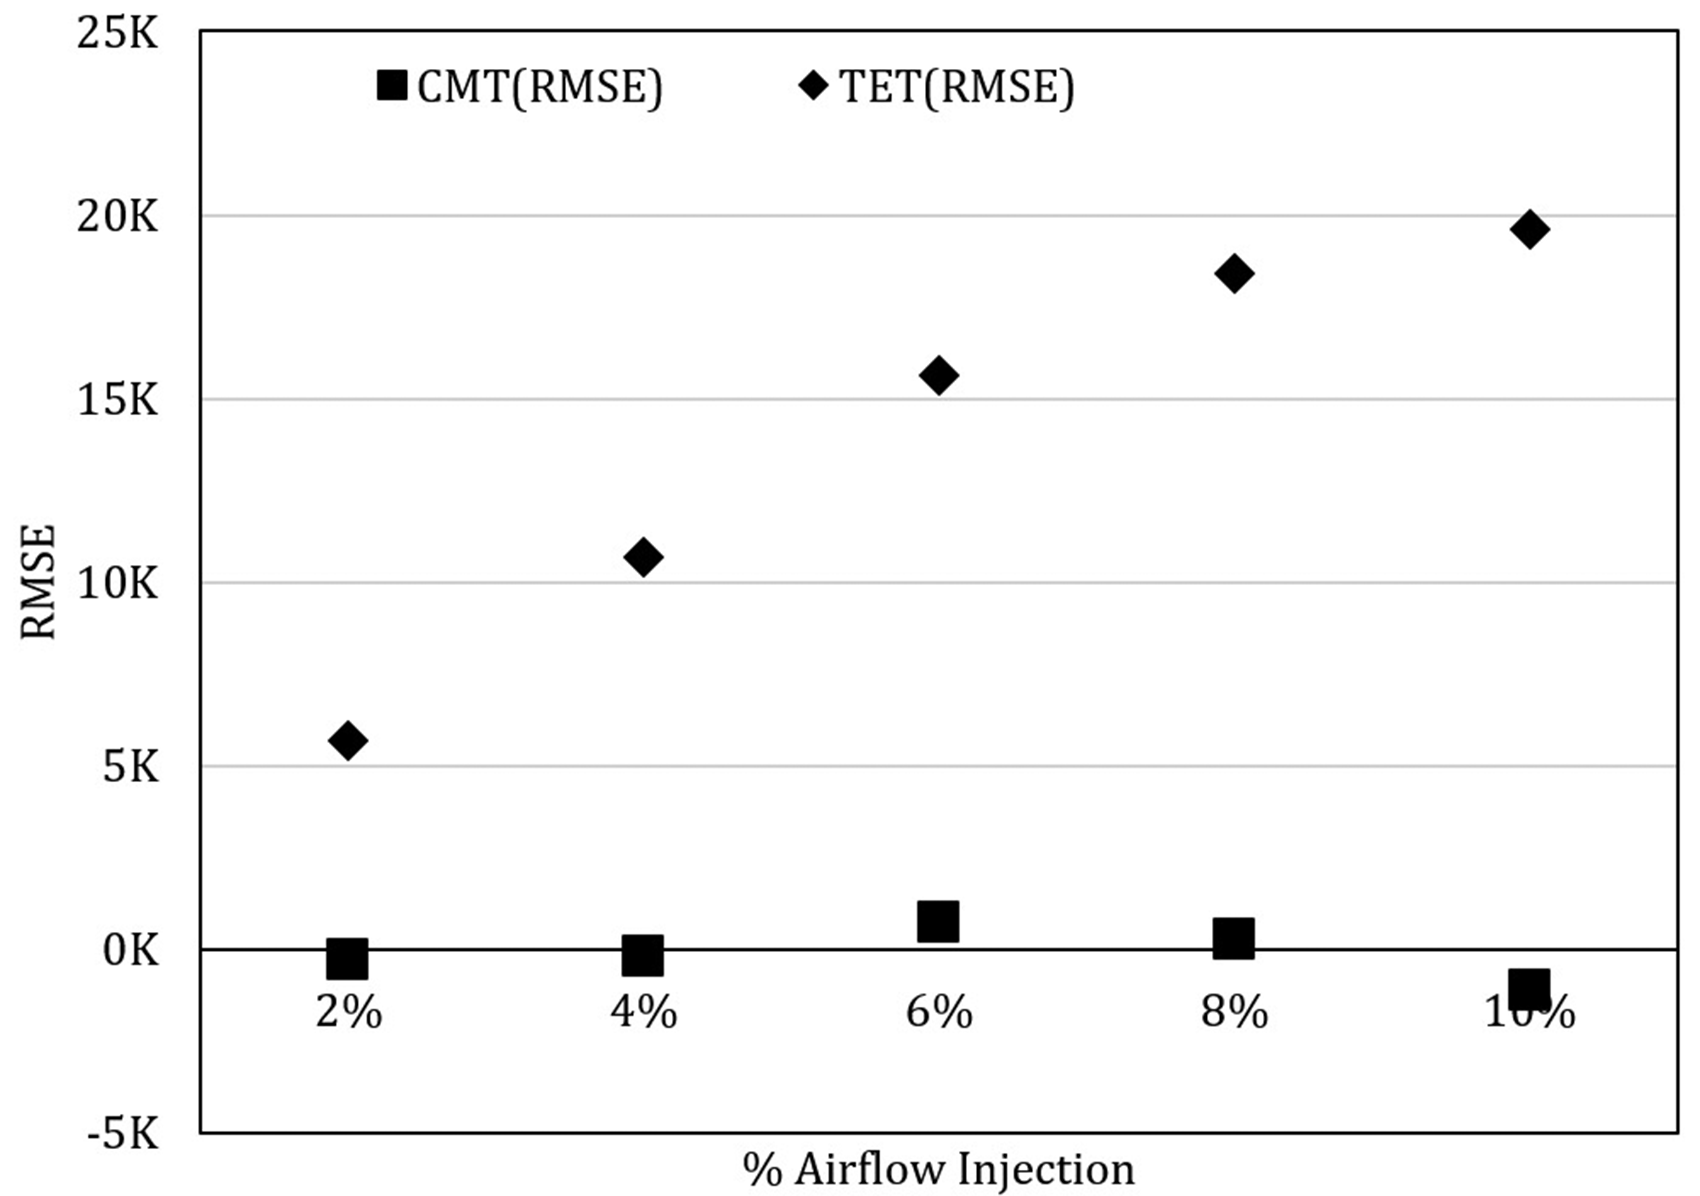
The RMSE between the CMT of the default case and the injection ramp-up cases is 1 K, and the left-hand side of Figure 14 shows their absolute values. That of the TET is indicated on the right of the figure. This shows that the gradients increase with injection rate, which is attributed to higher cooling flow temperatures that occur with a rise in compressor work. Figure 25 of Appendix 1 shows the RMSE for both CMT and TET for the cases of air injection.
CMT and TET schedules for ramp-up – with and without injection.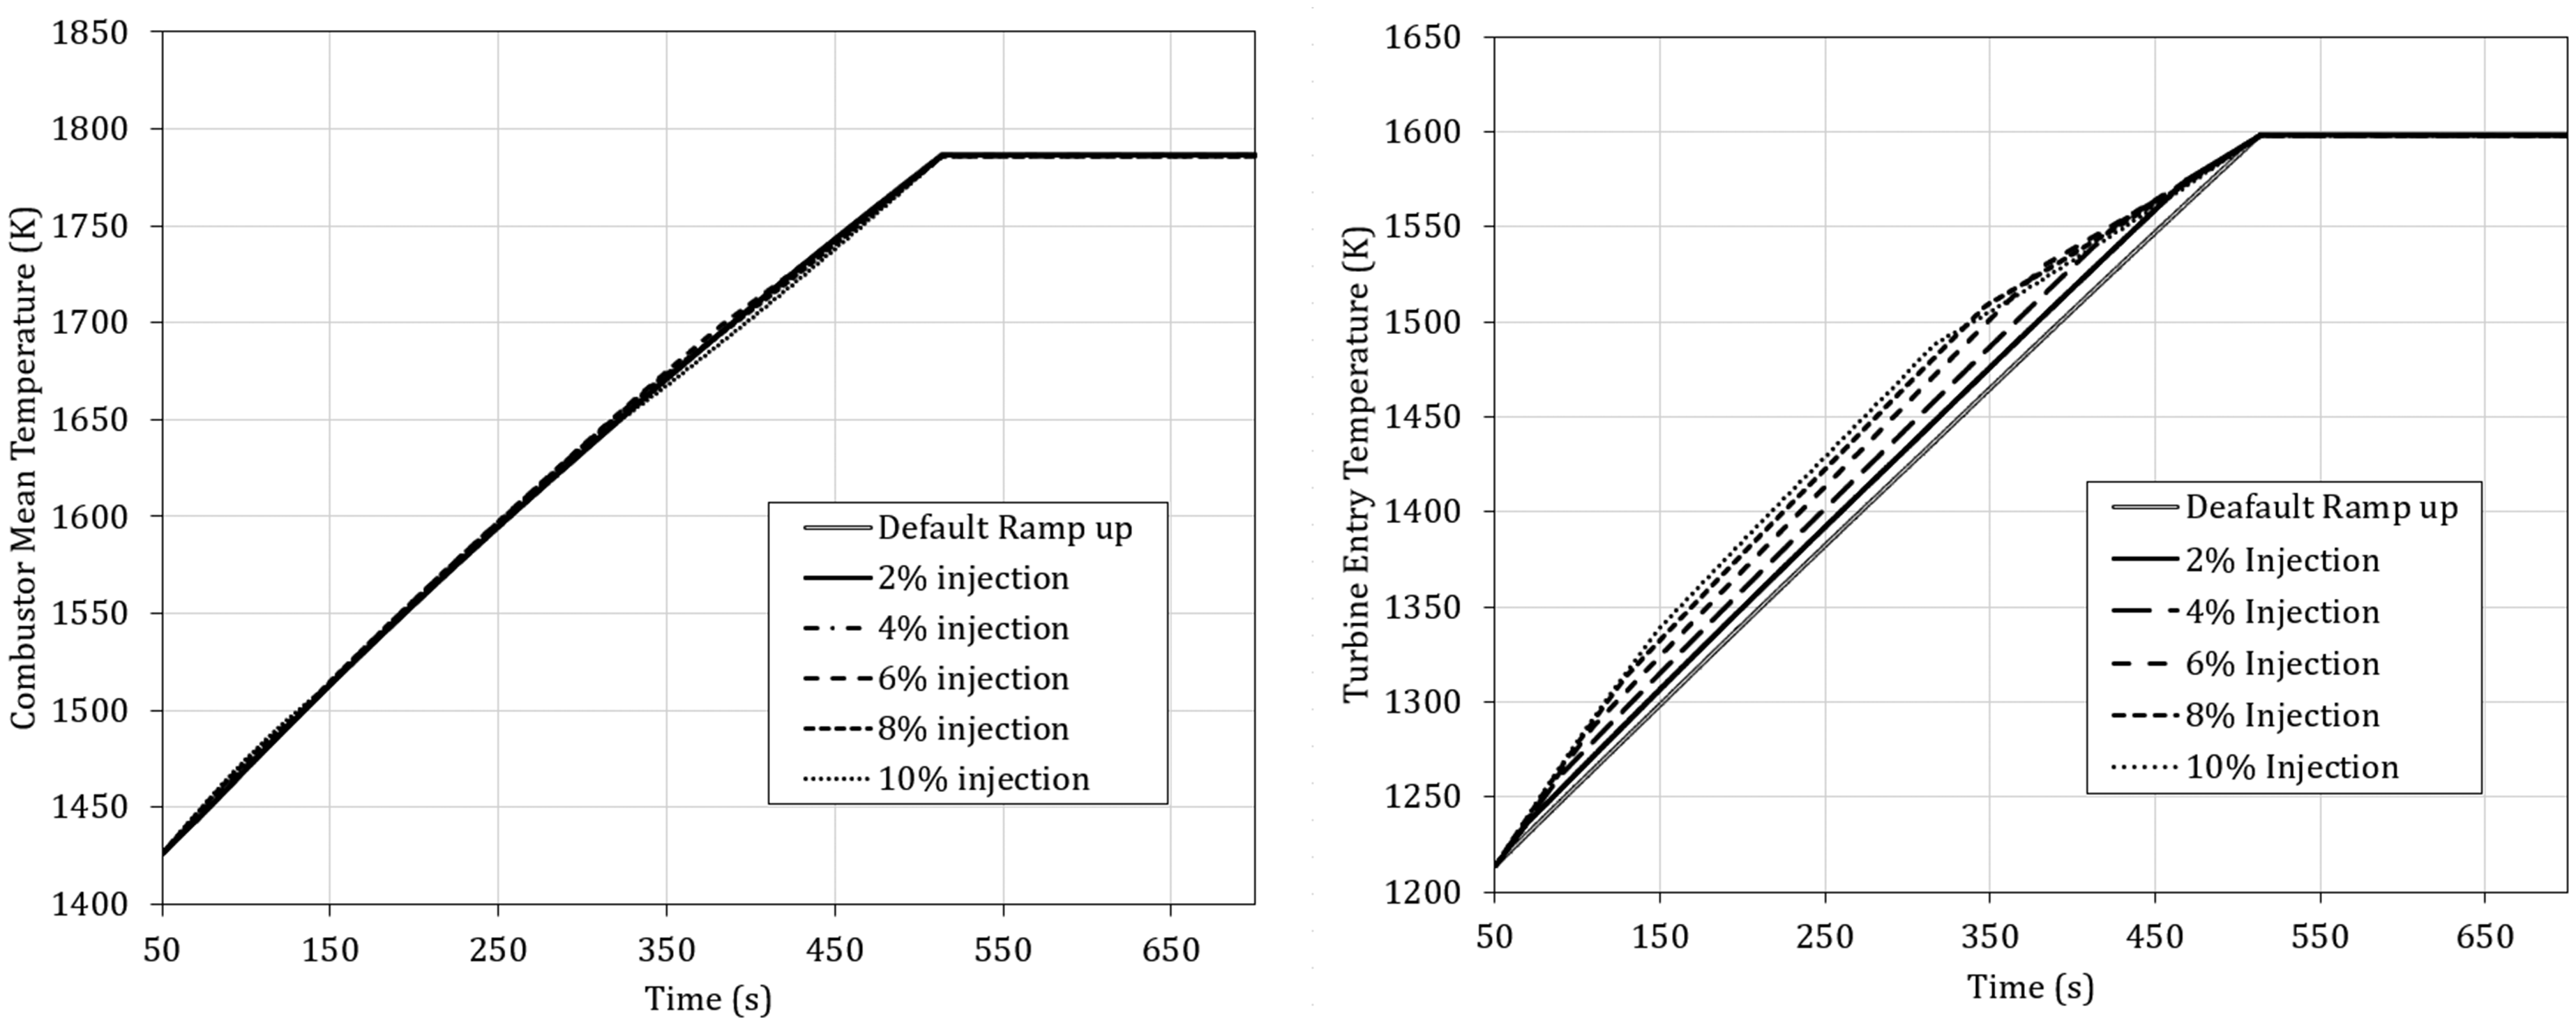
Transient flow injection from MEL to FL with variable VIGV
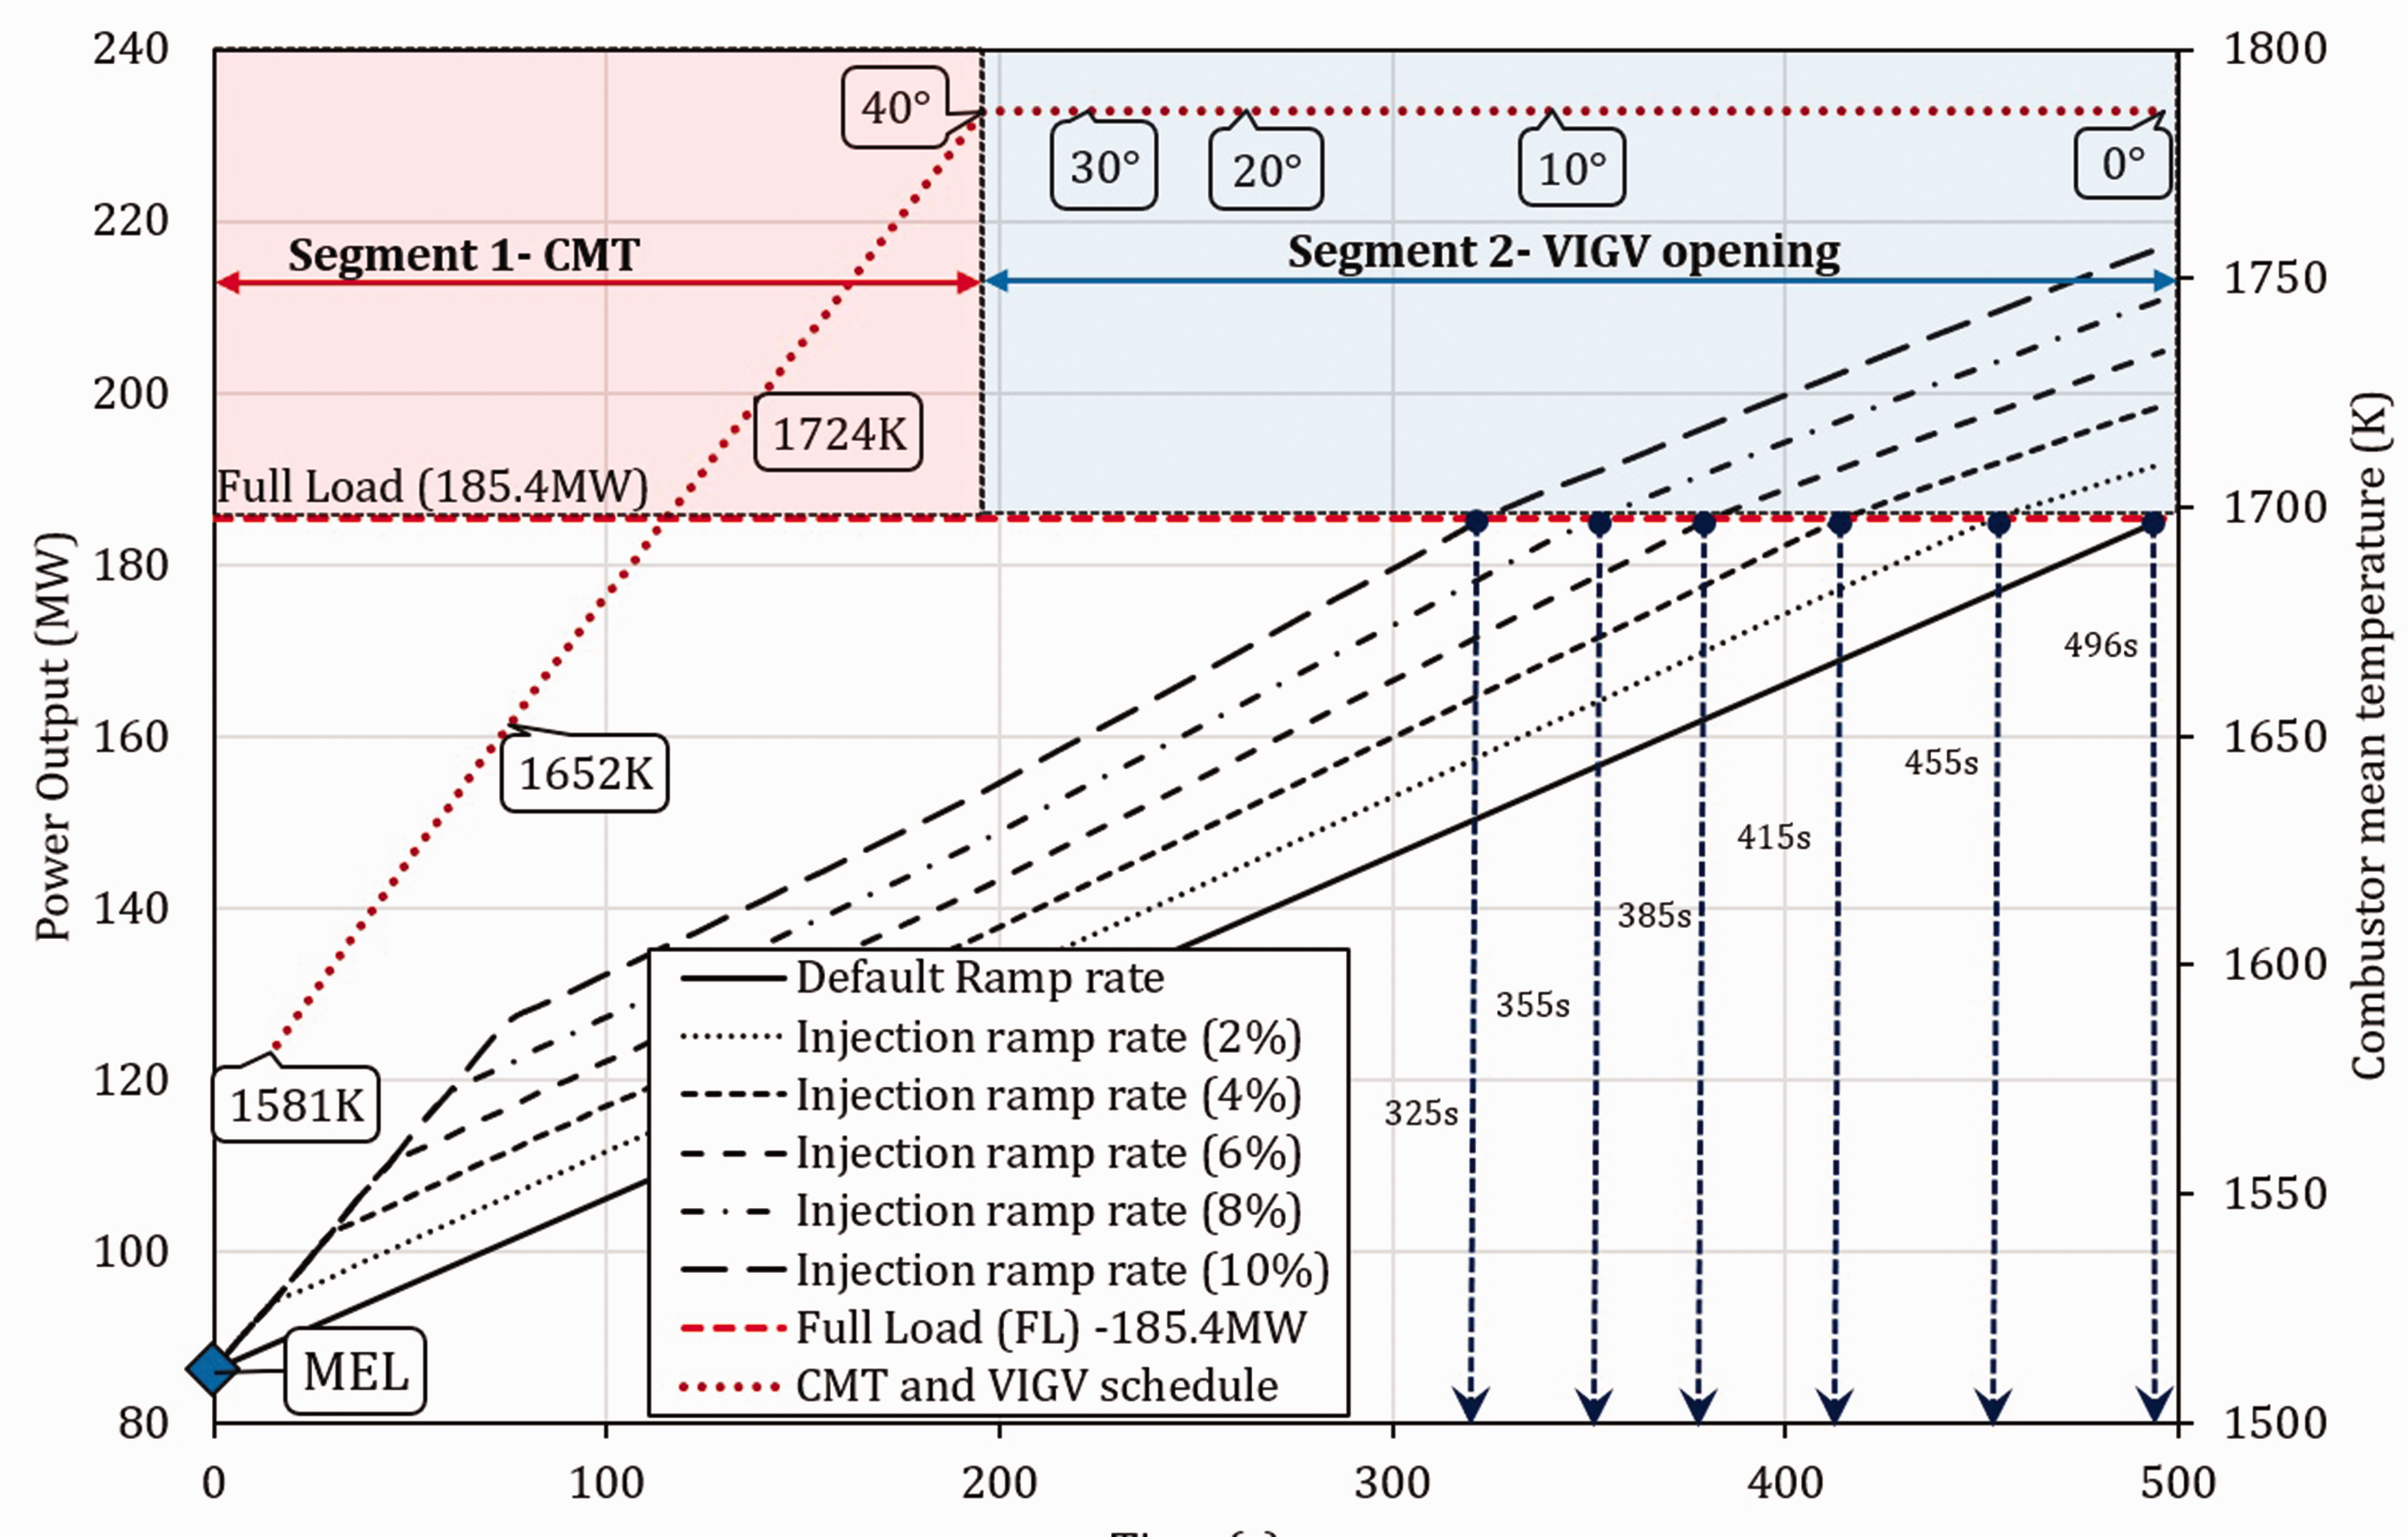
The focus of this section is the ramp-up rate of the engine from the MEL that relates to the lowest environmentally compliant load that is limited by CO emissions. The aim is to reduce the time taken from MEL to FL, facilitated by compressed air injection. Unlike the previous investigation, it captures the operation from low load (with closed VIGV at 40°) and the opening of the vanes. It also consists of the scheduling of the CMT from 88.5% of its design value, at intervals of 0.05%, until the maximum value of 1786 K. The operation consists of segment 1 that involves the increase of CMT and segment 2 that consist of the opening of the VIGV at fixed CMT as shown in Figure 15. The overall procedure for the air injection is as follows:
From MEL, CMT is increased from 88.5% of design value until 100% of its value (at closed VIGV – 40 °). This is achieved simultaneously with compressed air injection that increases gradually until its respective fixed values (2, 4,…10%). At 100% of CMT, i.e 1786 K, the VIGV is then opened at 1° per 7 s while the CMT remains fixed; this occurs with the constant injection rate until FL is achieved and exceeded. It is worth noting that due to the simultaneous injection of compressed air and VIGV opening, the FL is reached before the maximum opening of the VIGV. PO, CMT, and VIGV schedules for default and injection ramp-ups. CMT: combustor mean temperature; MEL: minimum environmental load; VIGV: variable inlet guide vane.

The computed improved ramp rates are displayed in a bar chart in Figure 16 which shows a steady increase in the ramp rate, with an increase in injection. Unlike the previous analysis which explores ramp rates improvements in three perspectives, the analysis here focuses on the optimistic case to show the most benefit of airflow injection during ramp-up. The ramp rate improvement rises to over 50% for the highest injection percentage; at 2% of air injection, the ramp rates of the engine increases from 12 to 13.2 MW/min that is a 10% increase as shown. A consistent increase in ramp rates of approximately 10% is noticed for every 2% increase in injected airflow.
Ramp rates increase as a function of airflow injection from MEL.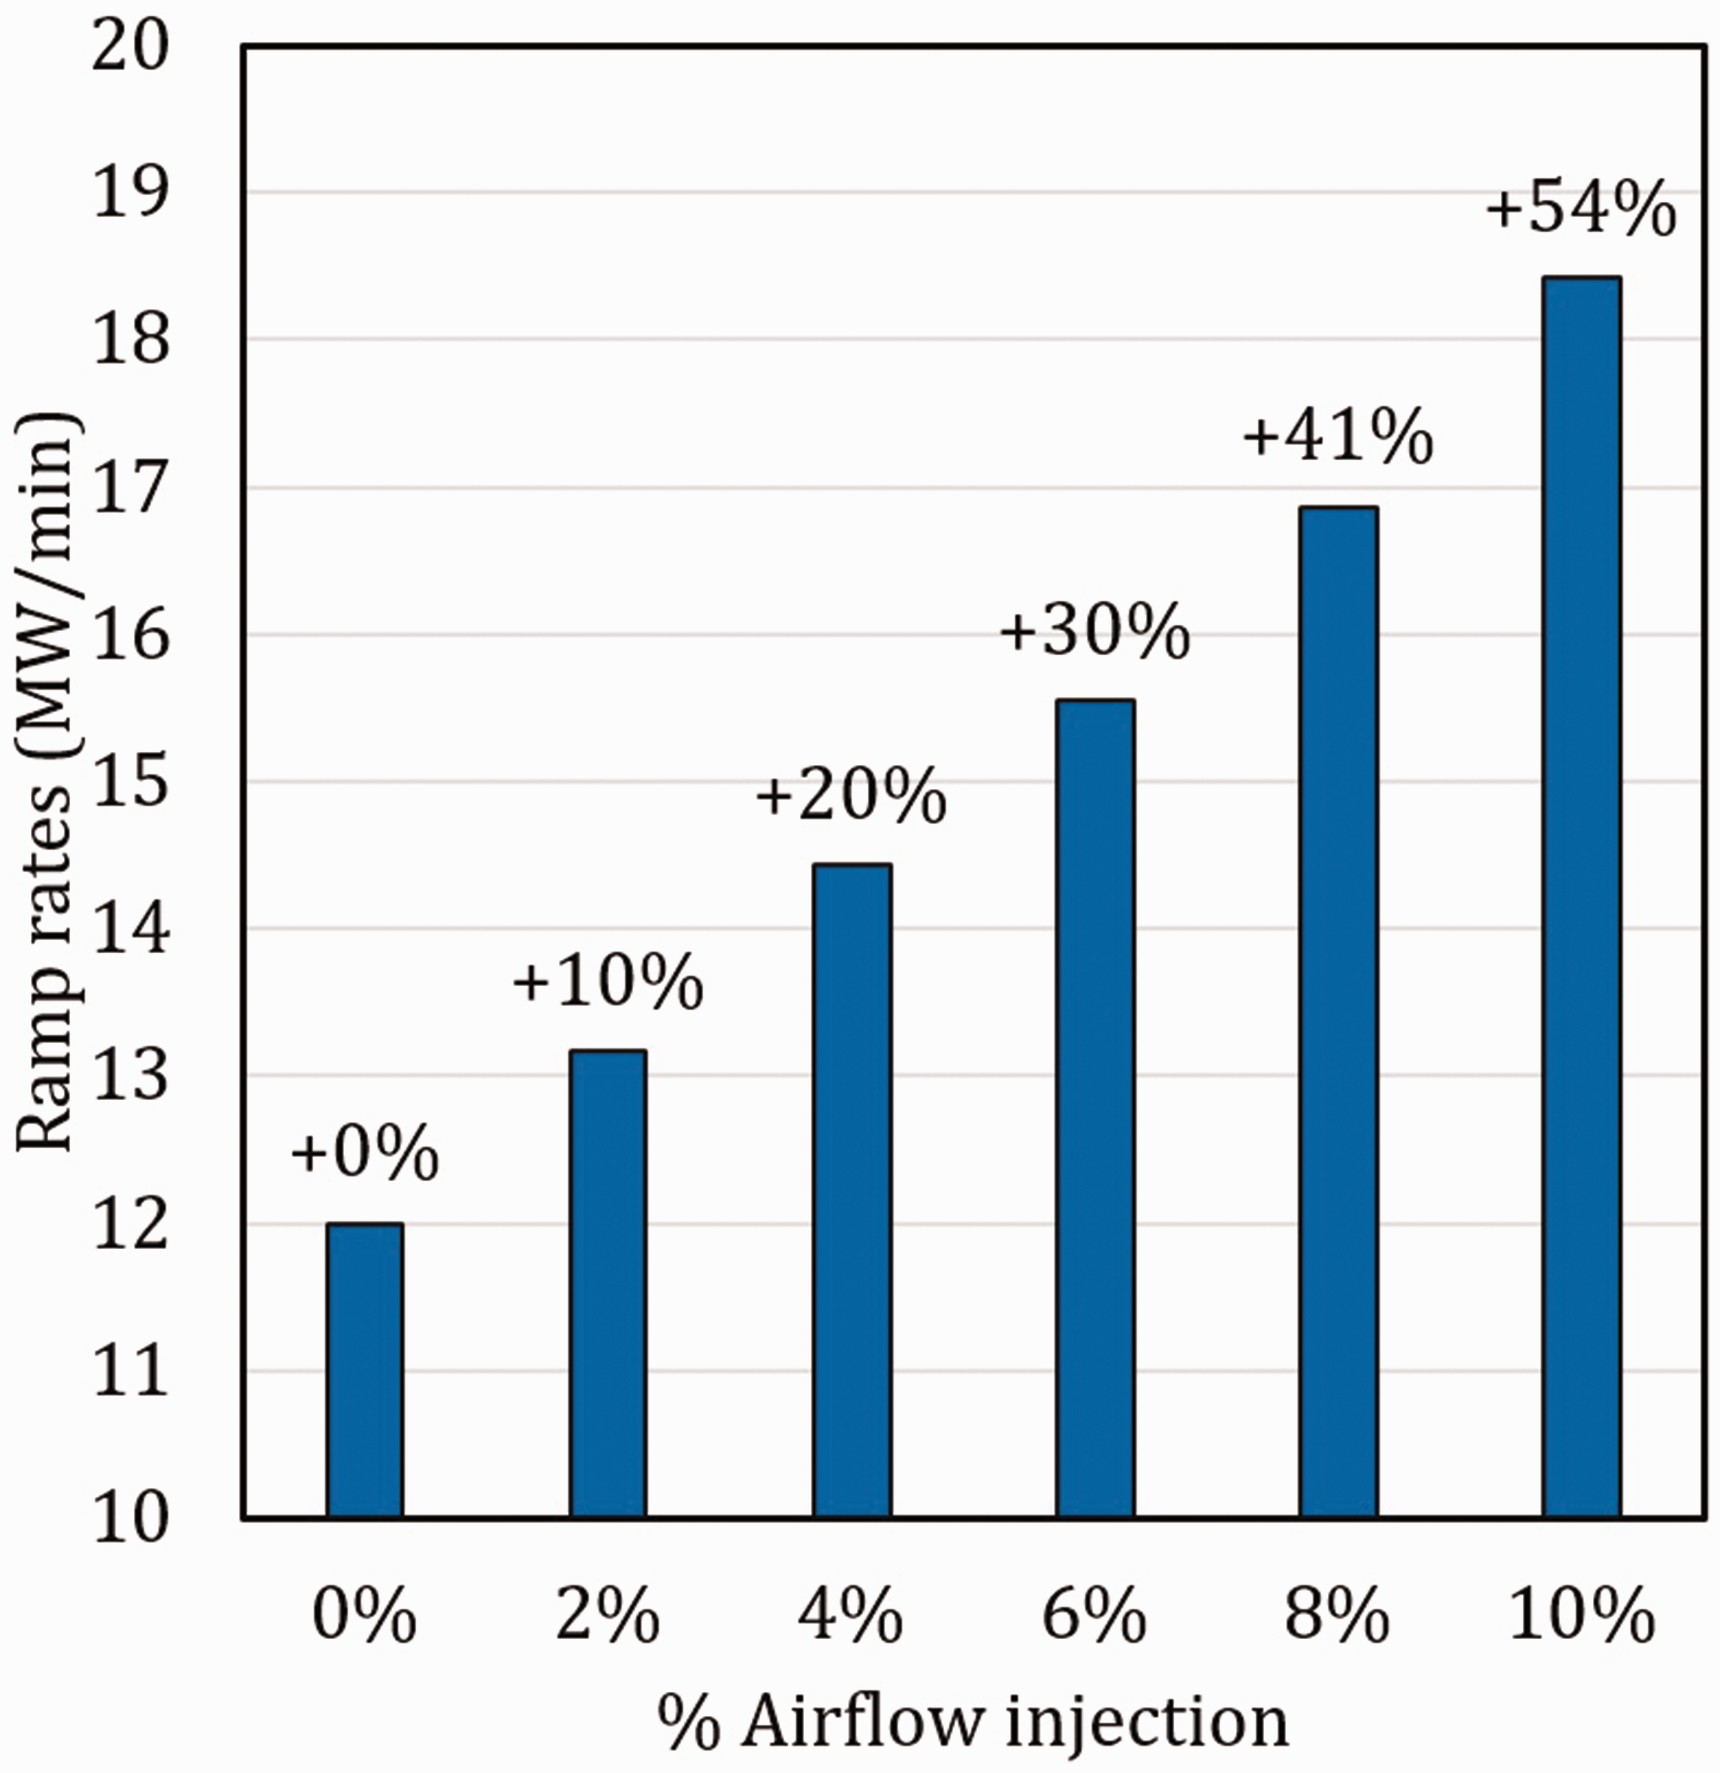
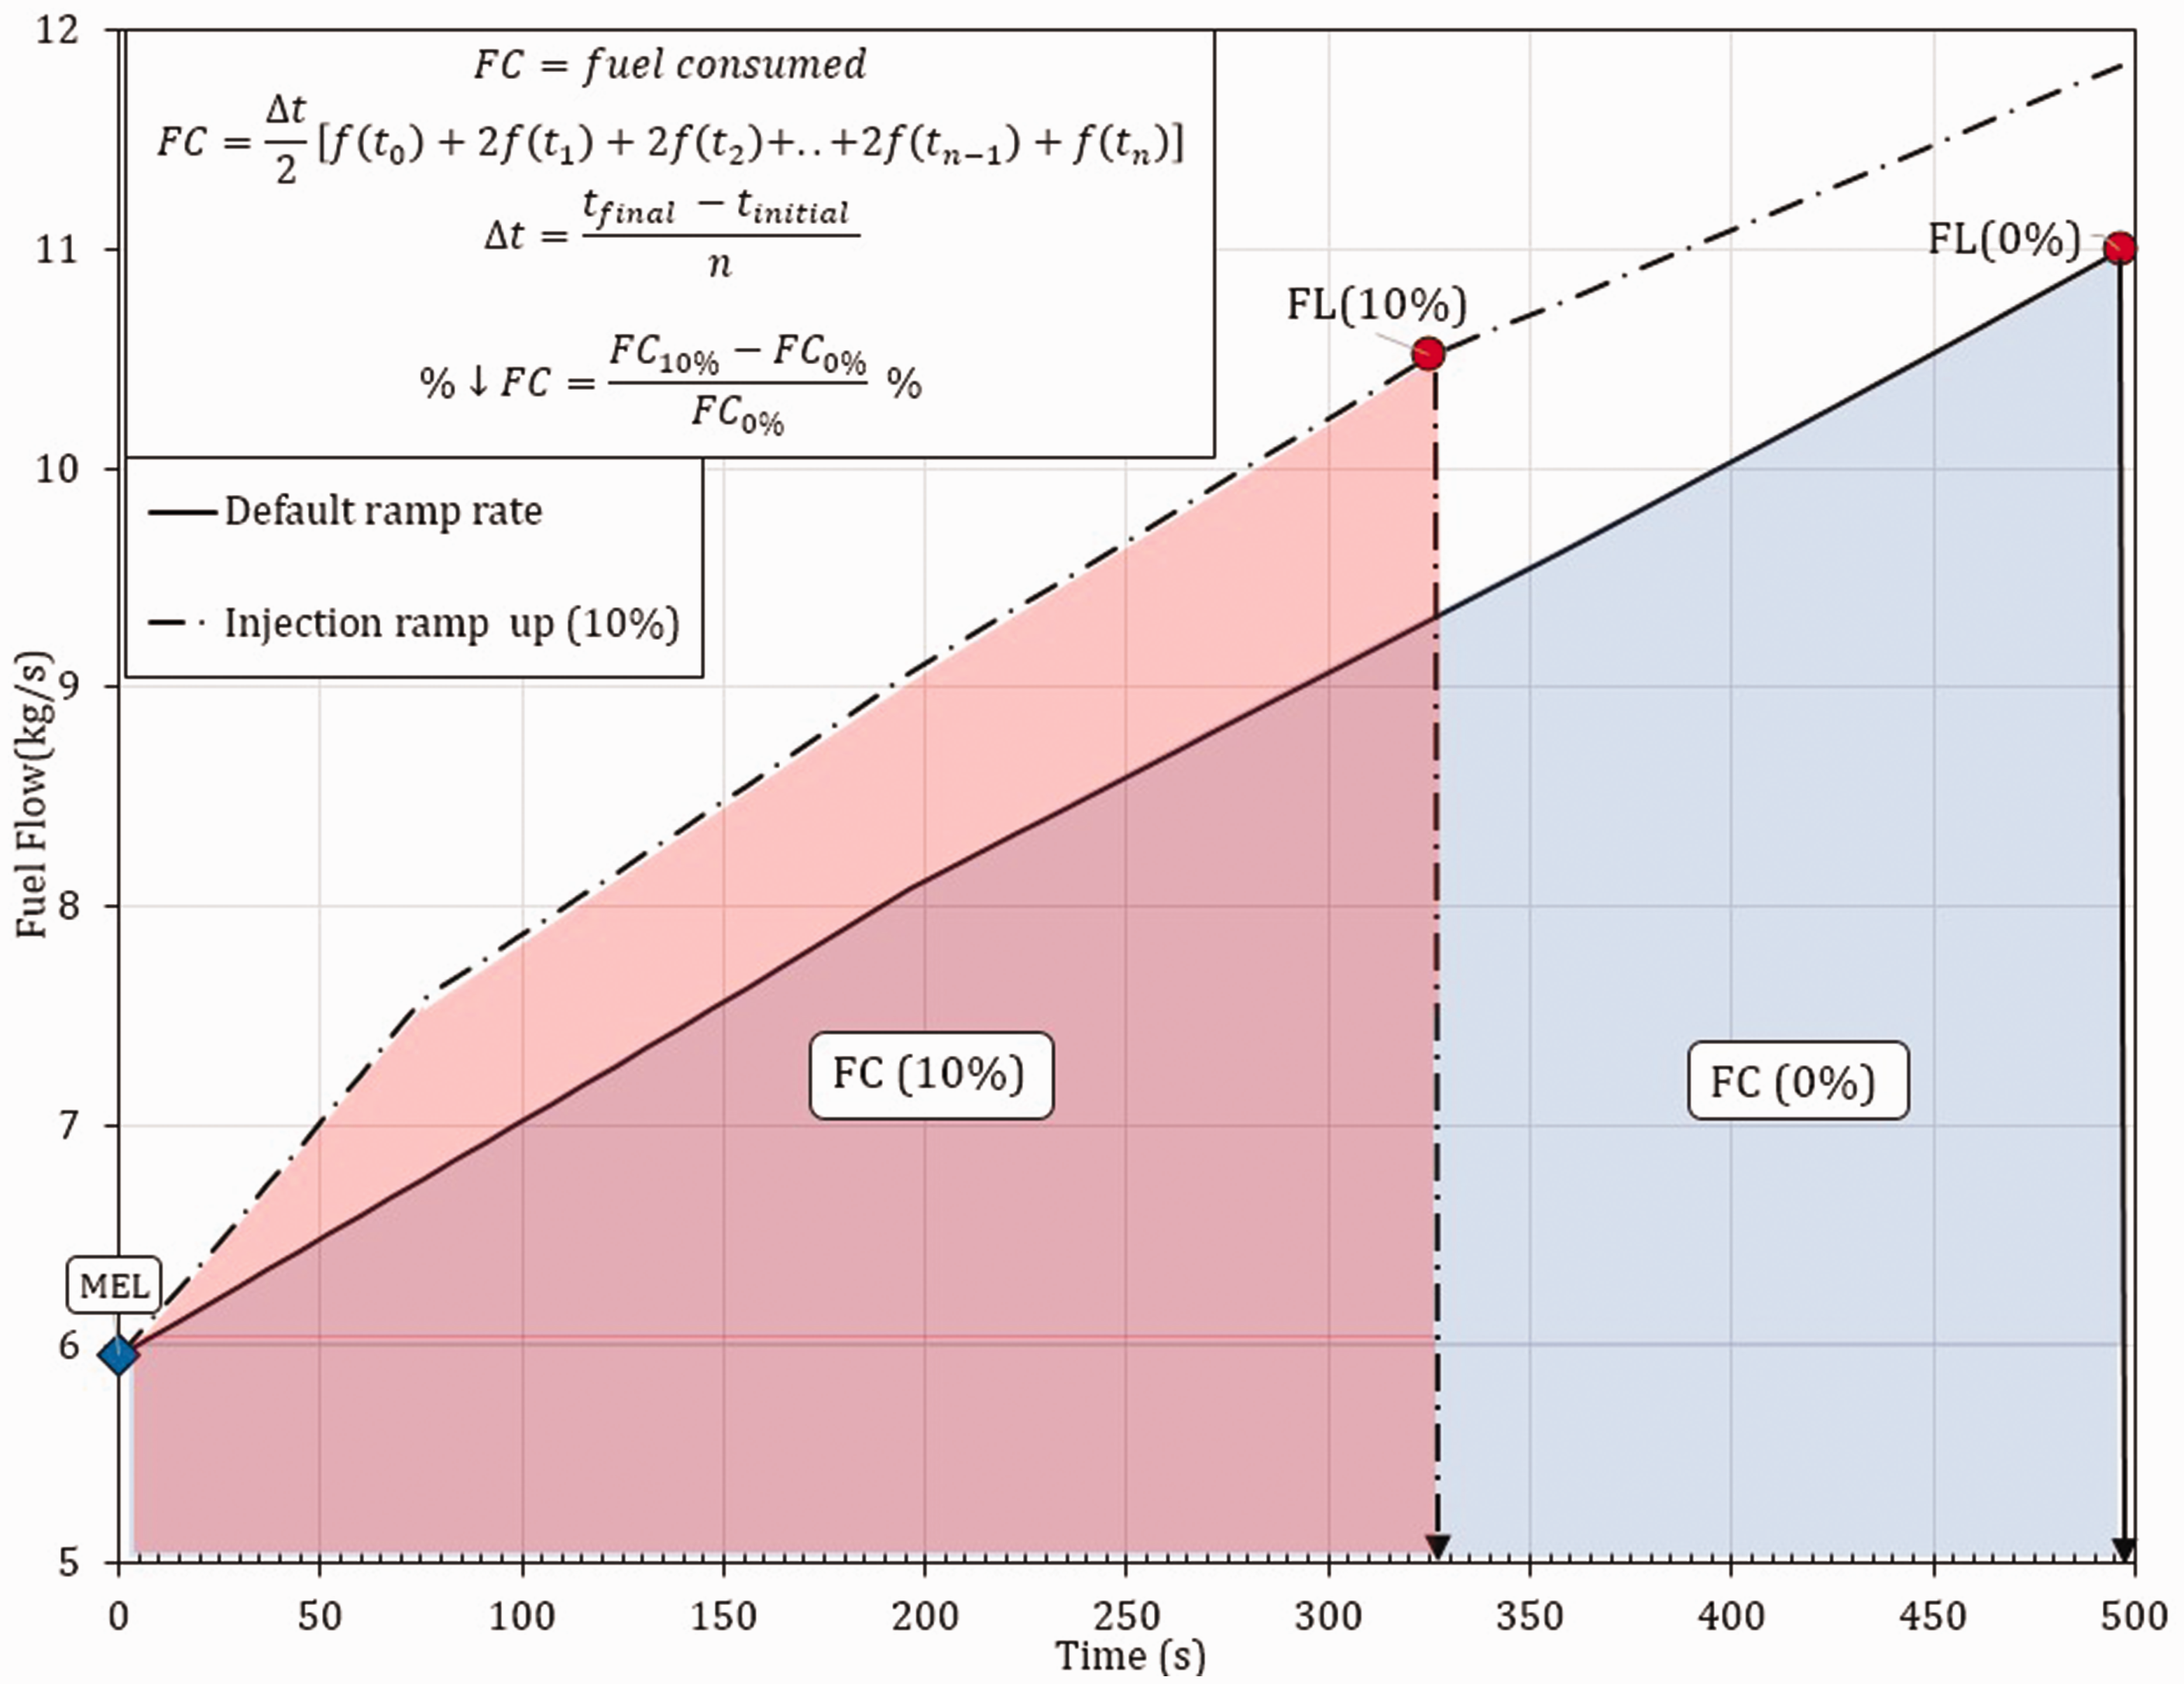
Figure 17 shows that the rise in air injection is accompanied by a corresponding reduction in the fuel consumed. The consumption represents accumulated fuel flow over the duration of the ramp-up between MEL and FL. The injection ramp-up benefits from a shorter duration (with regards fuel consumption) as less fuel flow is required to achieve the design Tmax at FL, which occurs at partially closed VIGV. Figure 26 of Appendix 1 provides the method of computing the fuel consumed and suggests a reduced area for the 10% injection, in comparison to the default injection ramp-up, which indicates improved fuel consumption.
Reduced fuel consumption as a function of airflow injection from MEL.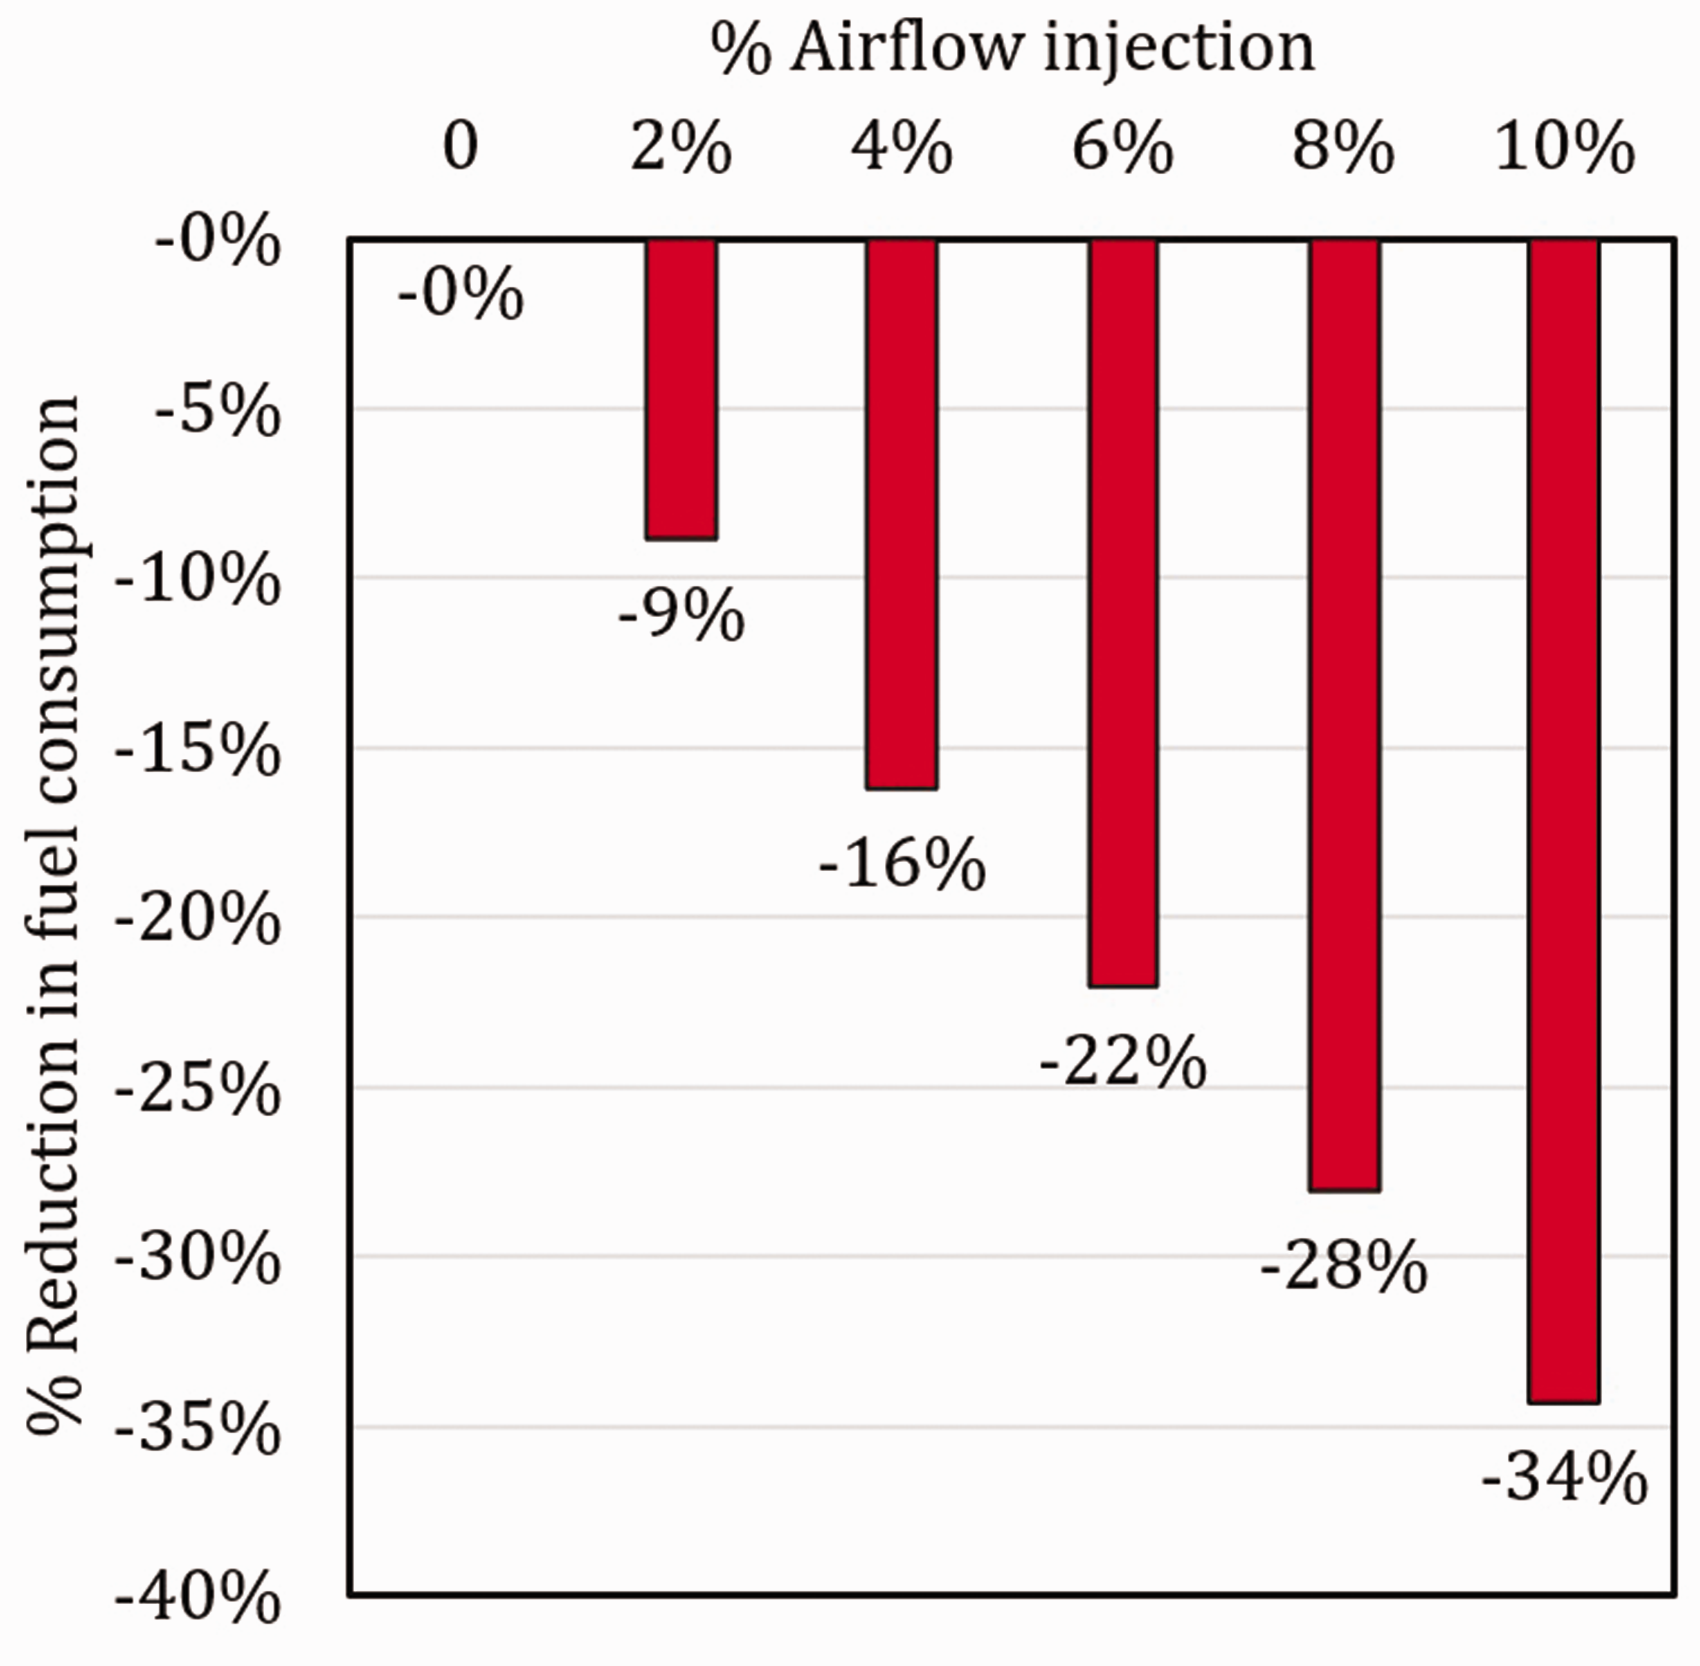
As the current analysis involves the opening of the VIGV and rises in CMT to achieve higher power settings, there is more attention on compressor surge. The earlier sections of this paper discuss the variation in the compressor operating line for the front and rear stages during airflow injection at closed VIGV. For the ramp-up procedure from MEL here, the front stage map in Figure 18 shows the changes in the operating point at MEL with closed VIGV, the CMTmax operation, and the FL (when VIGV is fully opened) with and without injection. The map shows that there is a small rise in the pressure ratio when raising the CMT from MEL, and the final pressure ratio of the lumped stage at maximum CMT with air injection is greater. The zoomed inset shows that higher injection ramp-ups increase the SMU more than lower injection ramps, as the increased combustor flow requires a higher pressure ratio. The ramp-up proceeds with opening the VIGV which further increases the SMU as the ingested airflow into the engine increases. It should be noted that the surge line for this compressor section moves downwards during the VIGV opening. Nonetheless, the ramp-up operation terminates at the FL DP with acceptable SMU values of 85 and 86.4% for the default and 10% injection ramp-up, respectively.
Operating points of first lumped stages during ramp-up. CMT: combustor mean temperature; FL: full load; MEL: minimum environmental load.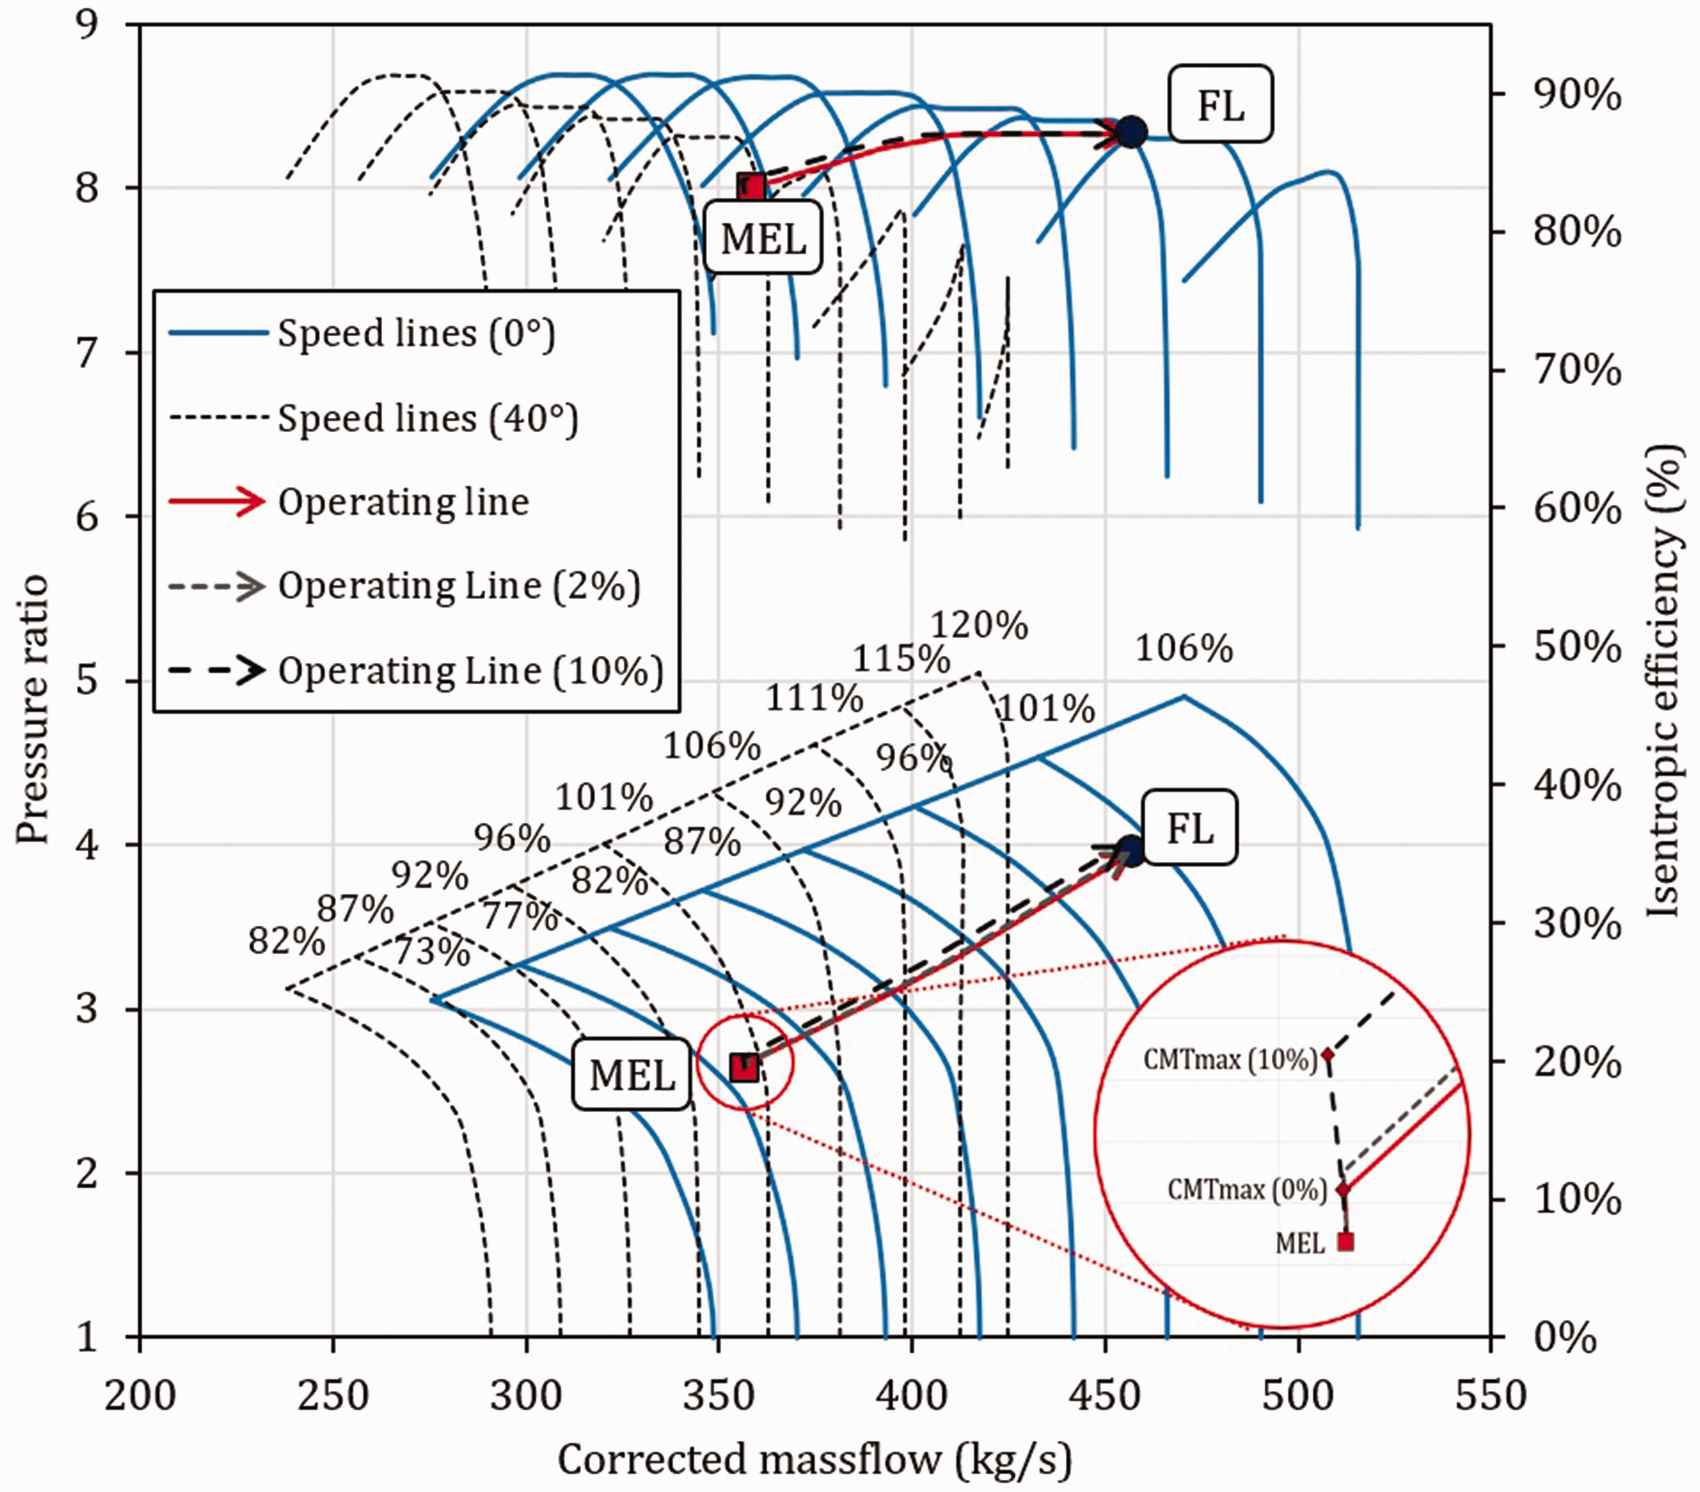
The compressor map of the rear stages (comp. 4) is provided in Figure 19 with the default case, minimum and maximum injection ramp-up operating lines. Wider variations in SMU are observed for this compressor section in comparison to the front stages due to its proximity to the combustor and the location of injection. The pressure ratio increase (from CMT increment) raises the SMU in the first segment of the ramp-up as shown, with higher injection rates raising the SMU higher. Conversely, the VIGV opening reduces the SMU as the CMF is seen to decrease. The FL points indicated in the figure suggest a very high SMU of 97.9% for the 10% injection ramp-up in comparison to 88.4 and 85% for the 2% injection and default ramp-up, respectively. From the map, it is observed that the CMTmax operating point incurs the highest SMU, for the ramp-up scenarios considered, and predisposes compressor rear stages to surge. It is noteworthy that the FL point for injection ramp-ups are achieved at partially closed VIGV and results in a higher SMU. It should be noted that at MEL and CMTmax, the indicated non-dimensional speed is higher than at FL, which is a result of reduced inlet airflow temperature into the rear lumped stages.
Operating points of last lumped stages during ramp-up. CMT: combustor mean temperature; FL: full load; MEL: minimum environmental load.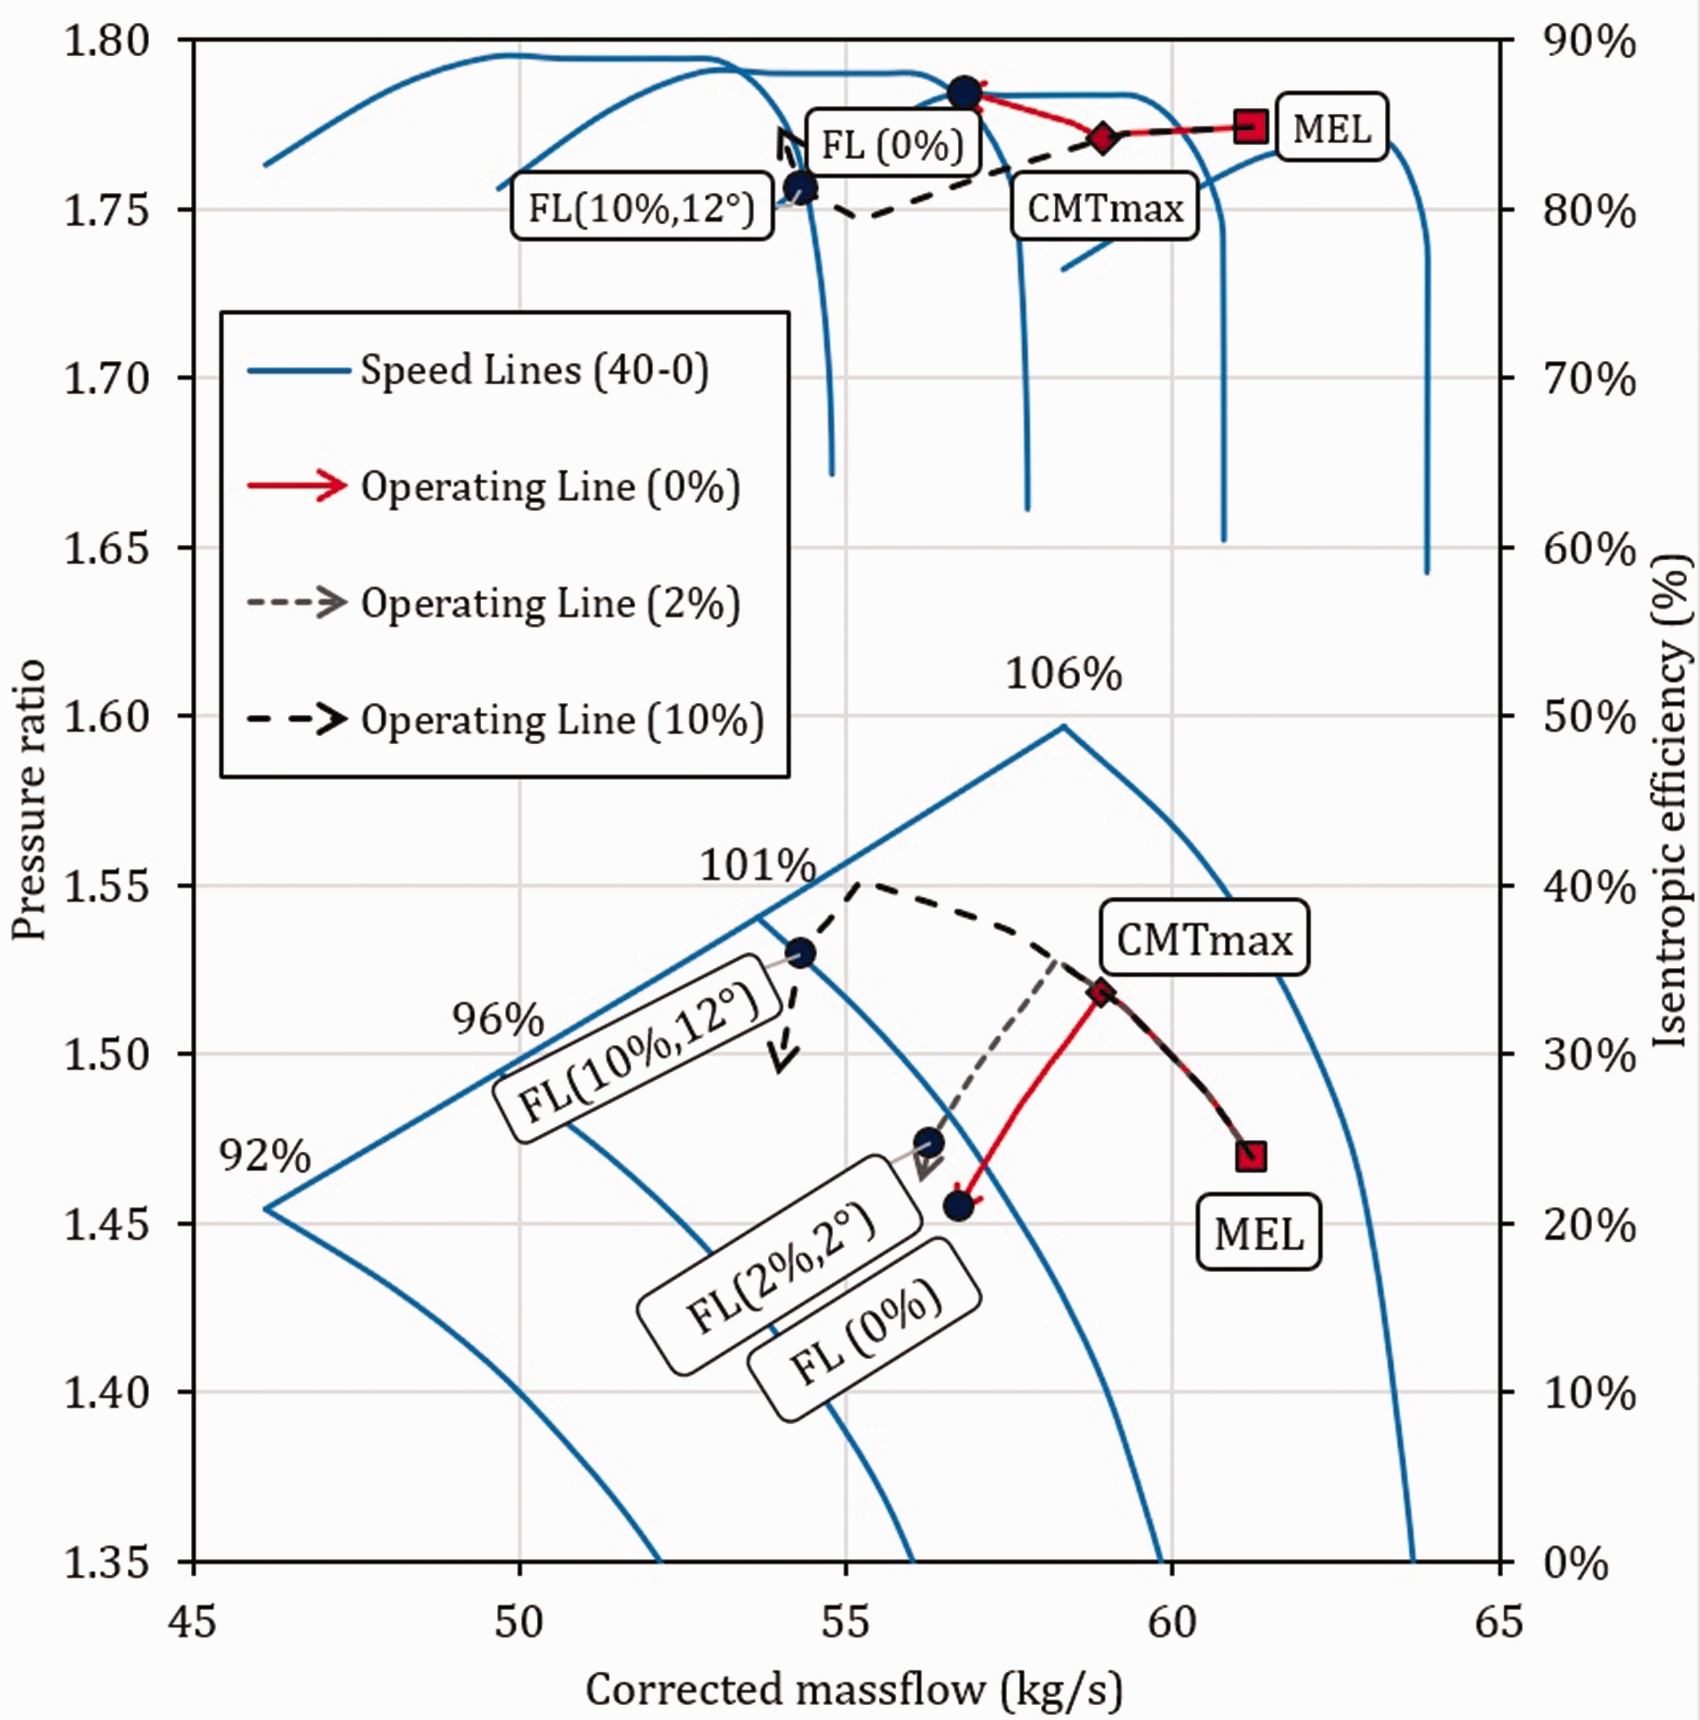
Figure 20 shows the SMU of each lumped stage, inclusive of the middle ones (2 and 3) for the different flow injection. It indicates that 2% injection is generally the safest operation and that the back lumped stages (comp. 4) are also the most prone to surge, with reduced risk towards the front of the compressor. The first segment operation on the left-hand side of the figure shows a similar increase in SMU for all the lumped stages with a rise in the airflow injection. This is not the case in the second segment when VIGV opens. In fact, the SMU of the front stages begins to improve, by the signified reduction in the value, while the back stages increase.
SMU as a function of airflow injection at end of segment 1 (left) and end of segment 2 at respective FL (right). CMT: combustor mean temperature; FL: full load.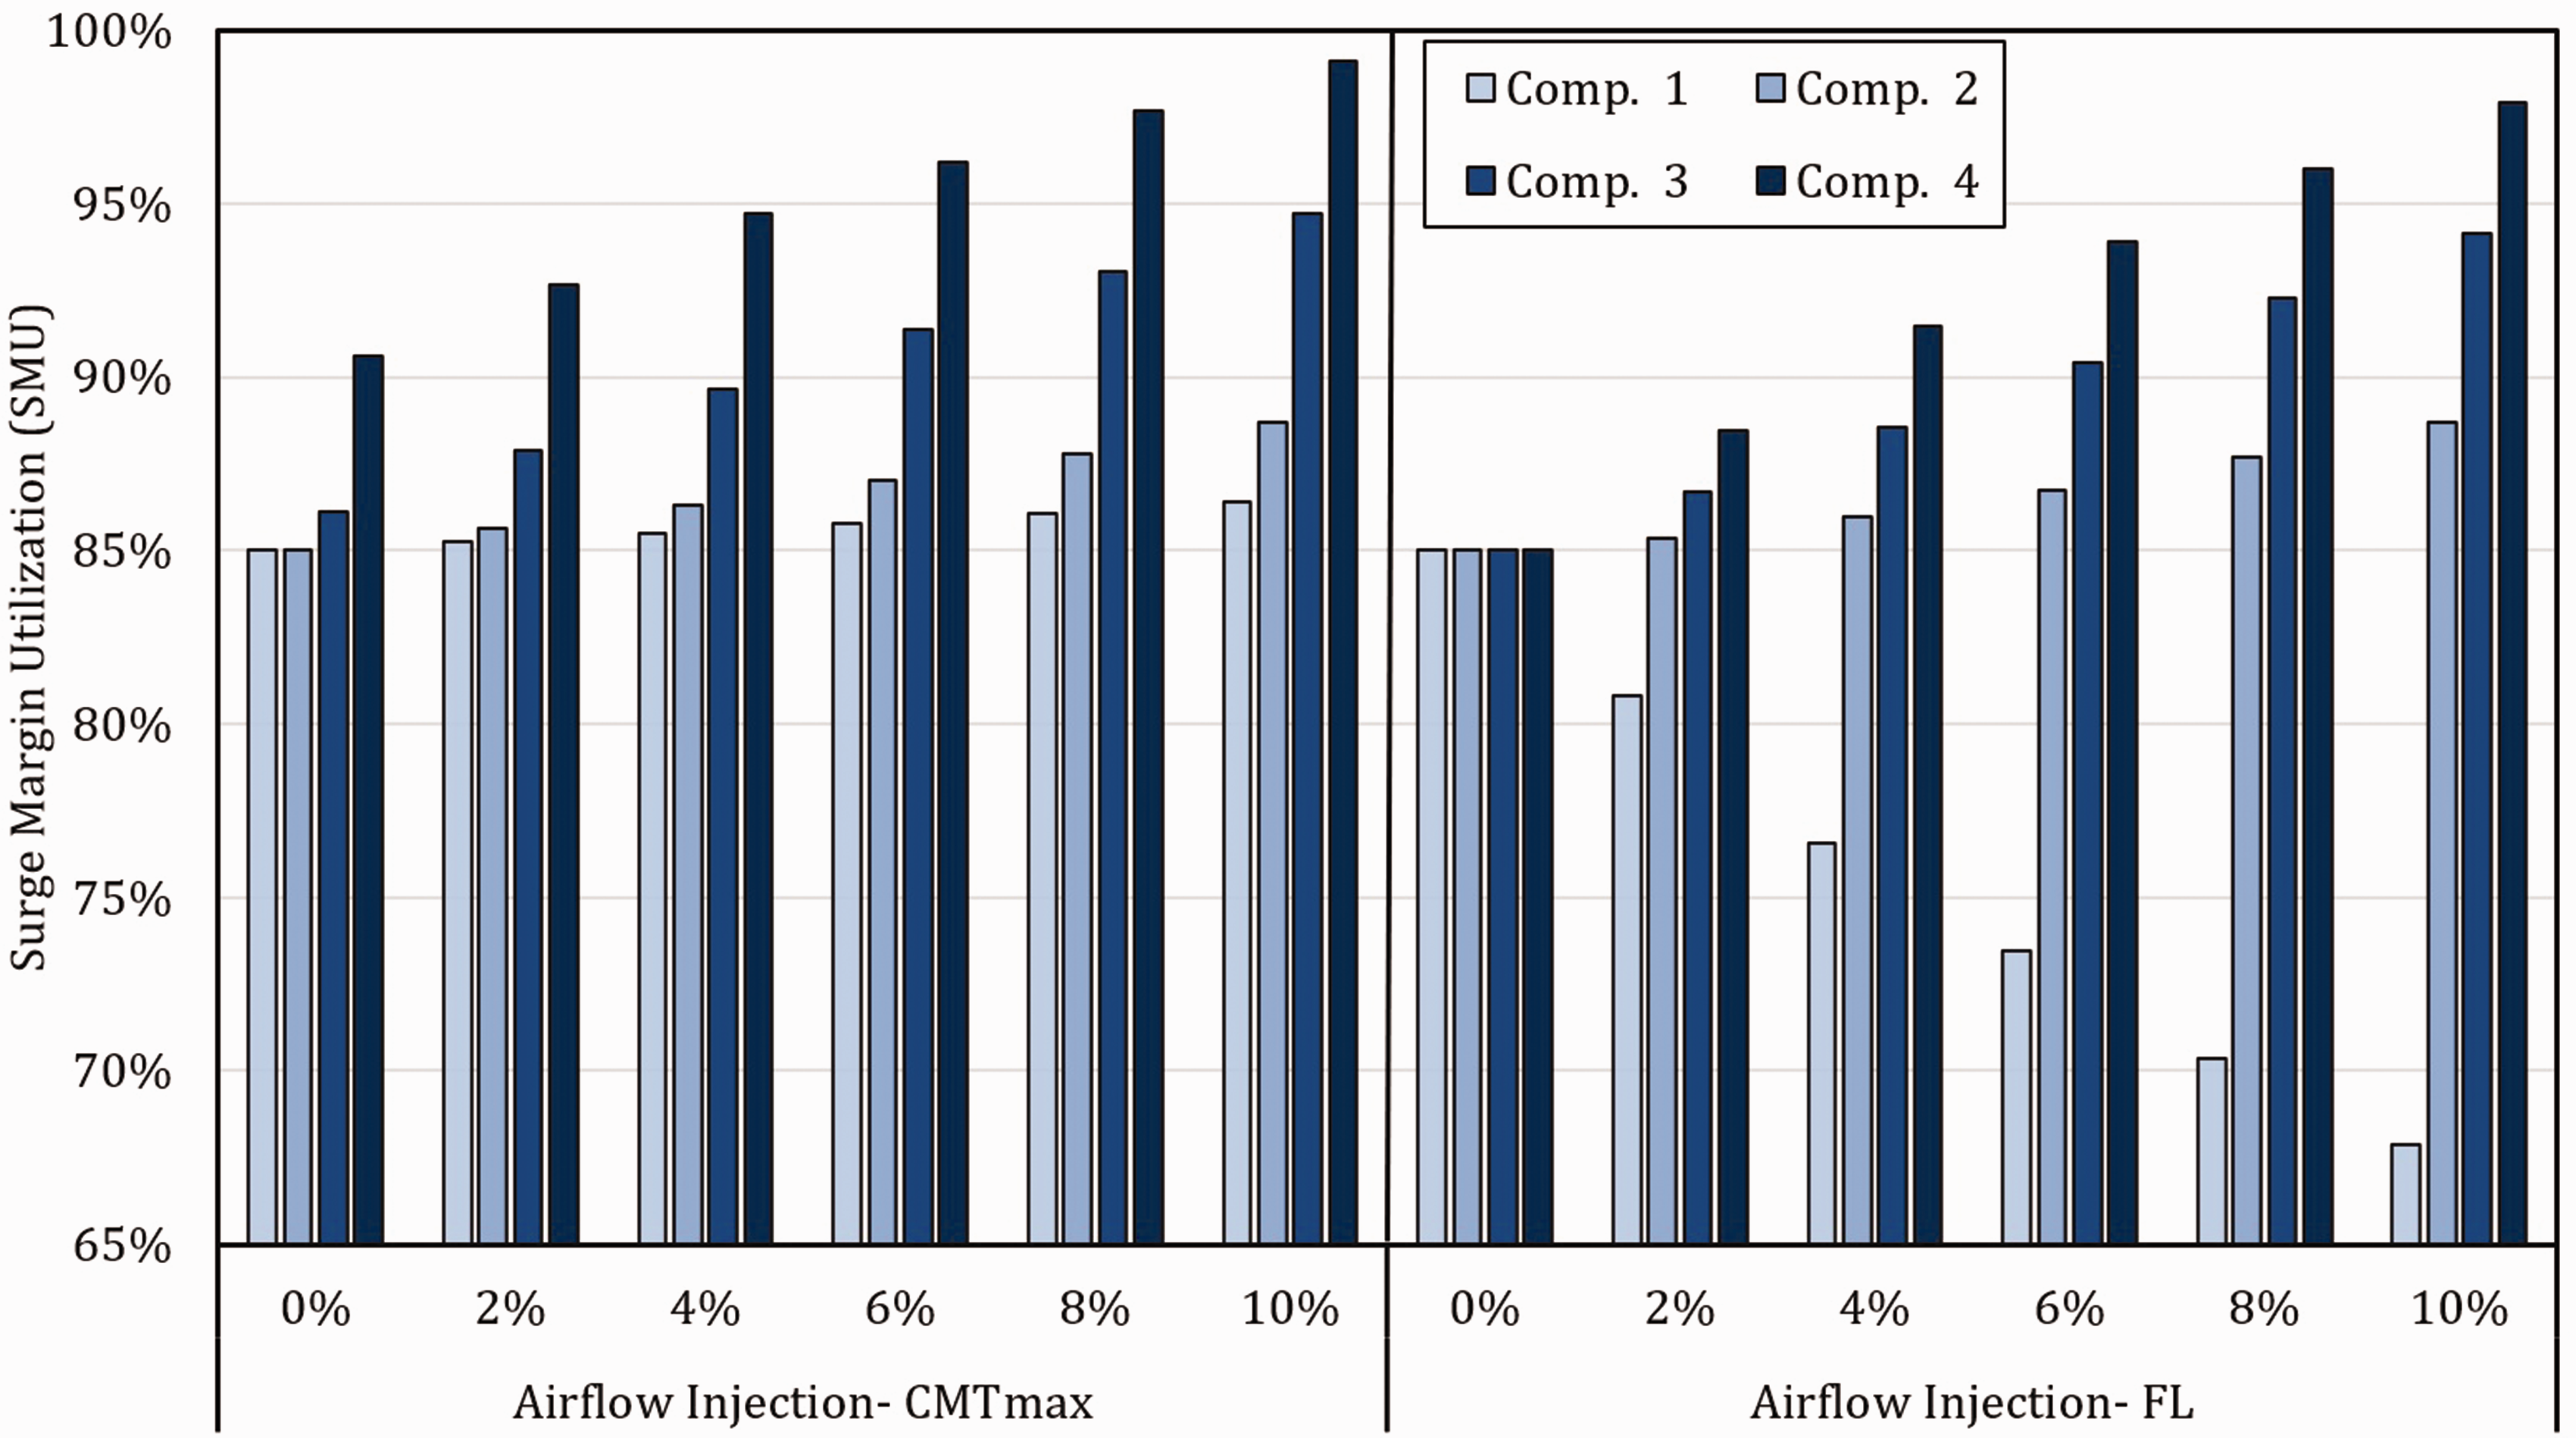
Although the CMT is kept identical for all injection cases, their TET varies. This is due to the increase in temperature of cooling flows during injection ramps that could be a limiting factor on the amount of airflow injected. More importantly (than the increase in TET value) is the rate of increase in TET that impacts thermal transients on the turbine blades and can be life-limiting. The TET schedules for the default and 2% injection ramp-up are shown in Figure 21. The figure shows segment 1 and 2 operations, indicating that the TET rises at different rates. Segment 1, for the default case, has a TET rate of 1.06 K/s, while that of the injection is an average of 1.07 K/s. For segment 2, it is 0.25 and 0.26 K/s, respectively. The figure also shows how these change for other injection rates in each segment. A maximum deviation of 0.06 and 0.05 K/s is observed for the 10% injection ramp-up in segment 1 and 2, respectively. The deviation implies a 6 and 20% increase in comparison to the default ramp-up with respect to segments 1 and 2. To contextualize, during every minute of the ramp-up, the turbine blades experience a 0.6 and 3.5 K hotter flue gas temperature in comparison to the default case. This suggests that the 2% injection ramp-up scenario is safest and reflects a potential concern for the maximum injection ramp-up. It should be noted that the hotter gas temperatures are not sustained as the airflow injection is terminated after the engine achieves FL.
TET as a function of injection rate with time. CMT: combustor mean temperature; INJ: injection; TET: turbine entry temperature; VIGV: variable inlet guide vane. Computational procedure for transient simulation. CMF: corrected mass flow; CW: compressor; OPR: overall pressure ratio; PO: power output; SP: surplus power; TET: turbine entry temperature; TW: turbine. Variation in operating parameters during ramp-up – with and without injection-fixed VIGV. CMT: combustor mean temperature; OPR: overall pressure ratio. Airflow injection schedules for ramp-ups. TET gradient and RMSE for CMT and TET during injection ramp-up. CMT: combustor mean temperature; RMSE: root mean square error; TET: turbine entry temperature. Fuel schedules for default and 10% injection ramp-up – varying VIGV. FL: full load; MEL: minimum environmental load.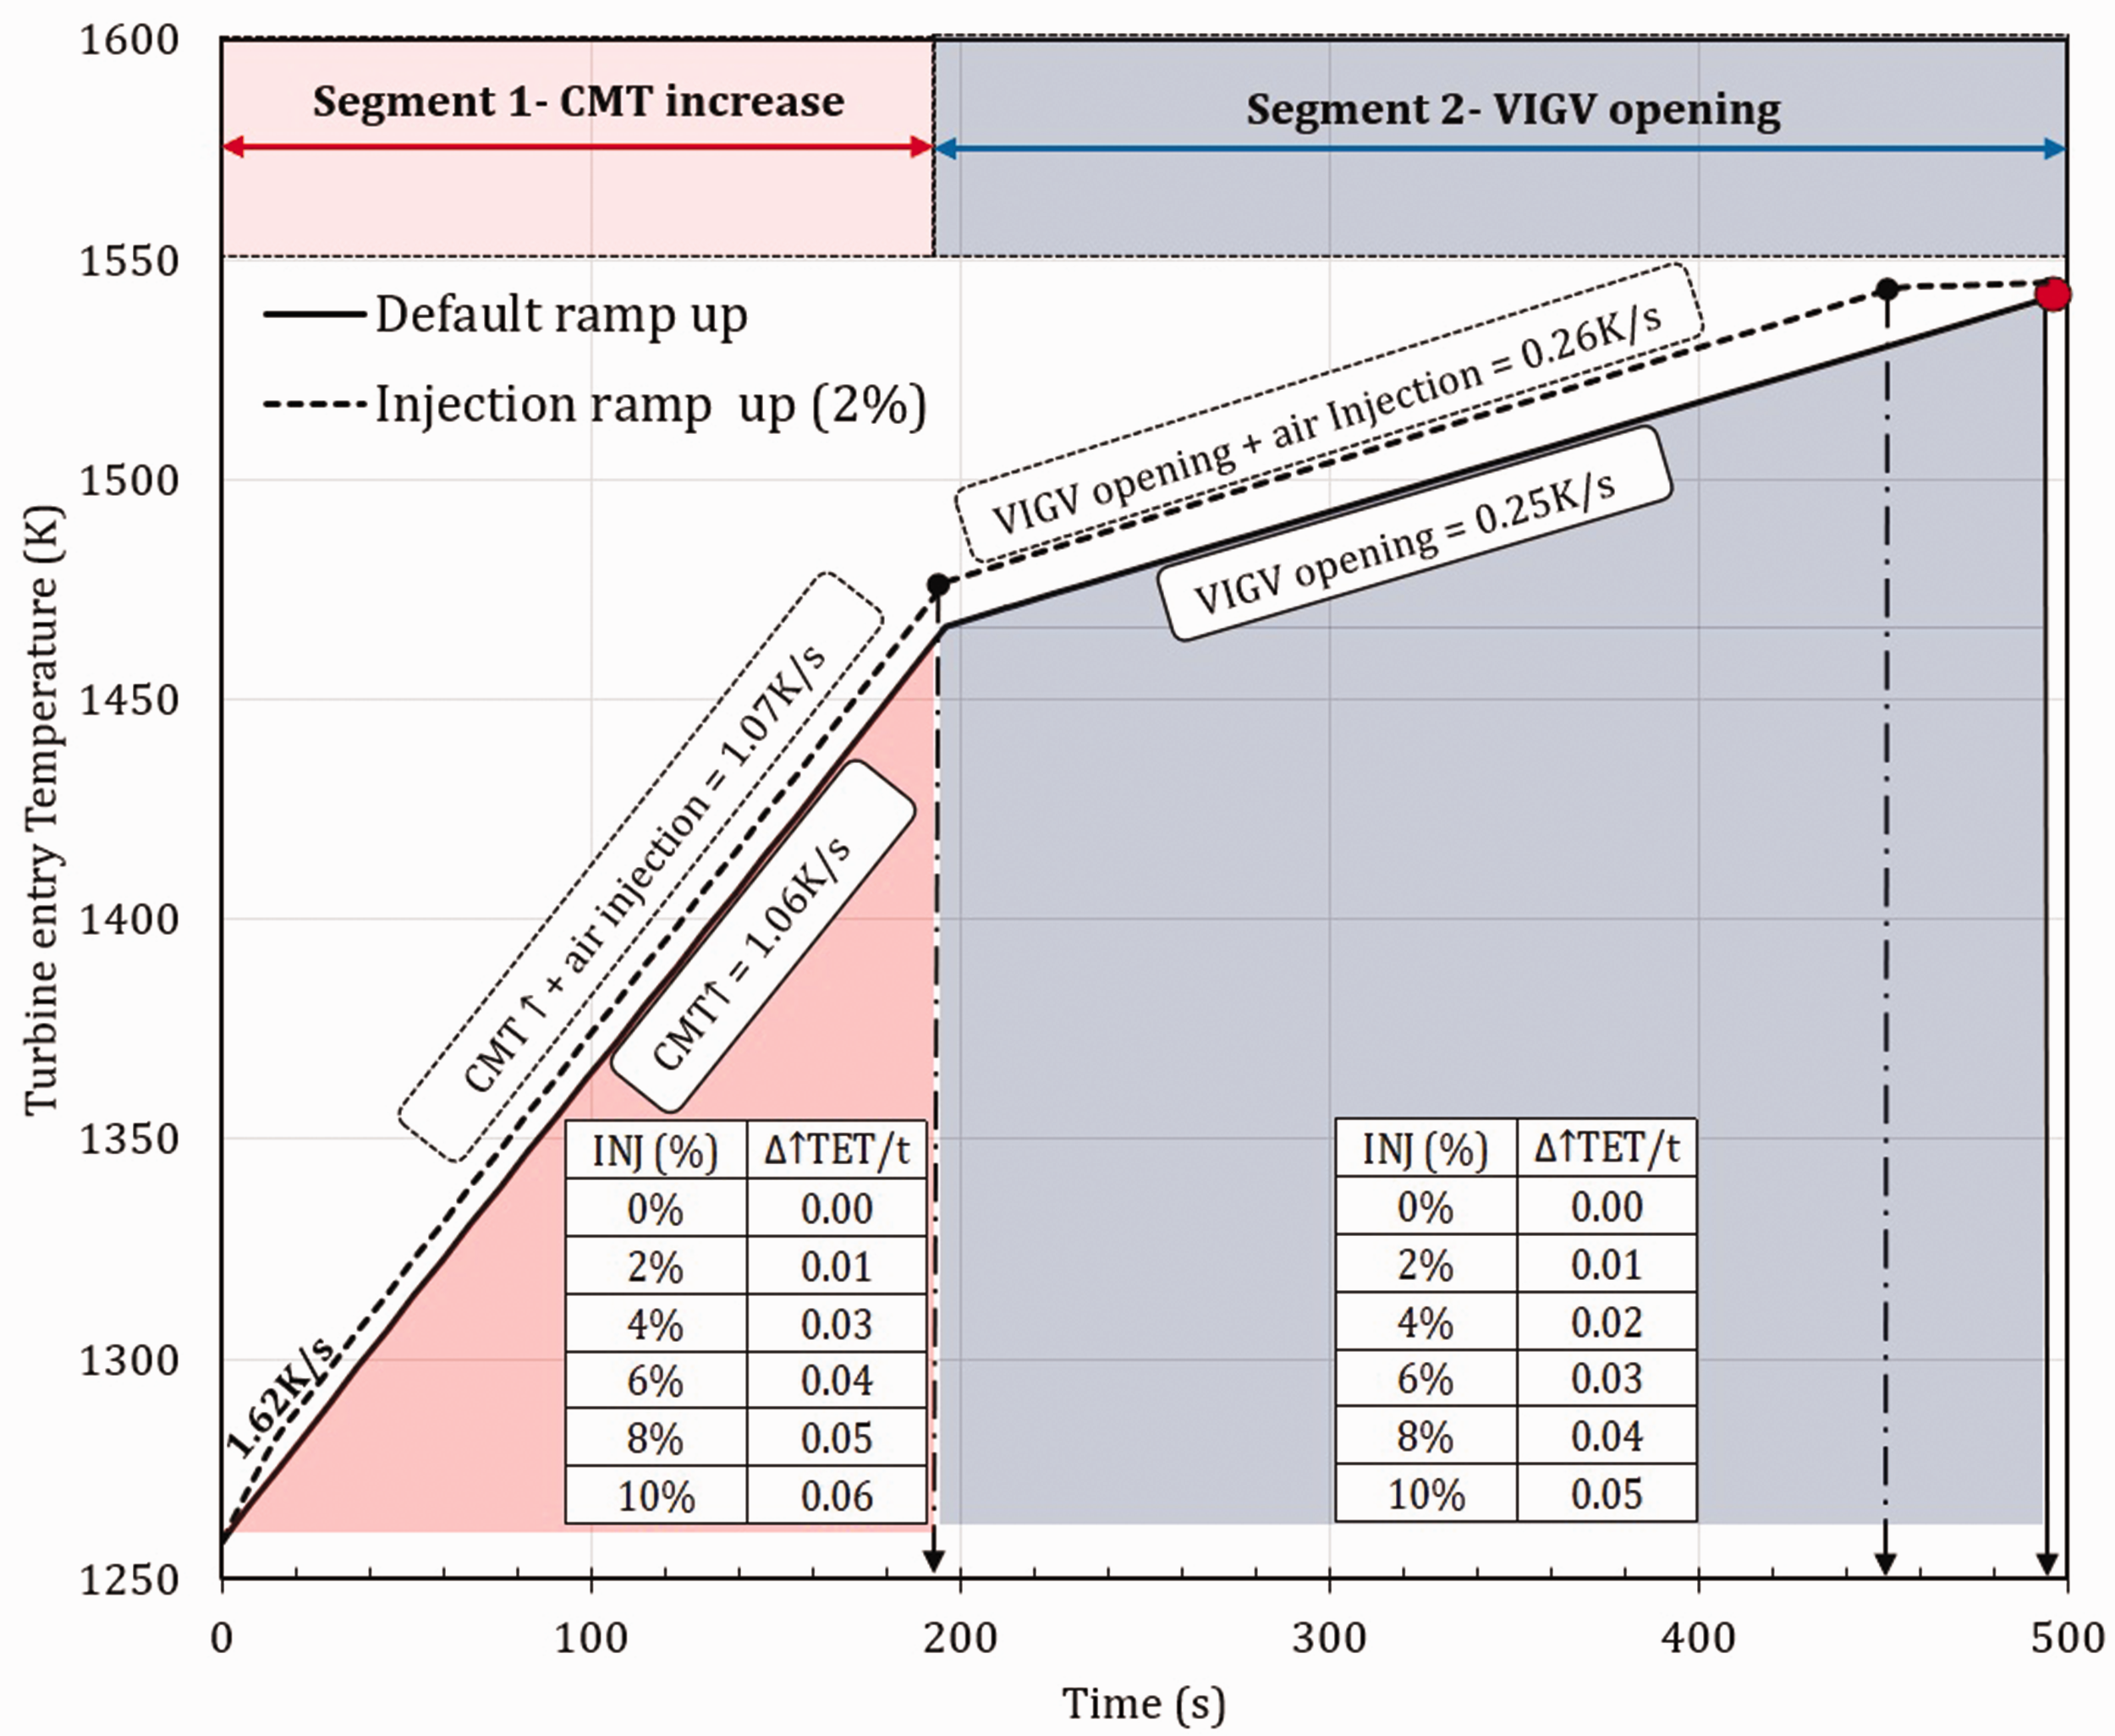

Conclusions
This study has investigated the benefits of compressed air injection for GTs with respect to power augmentation, part-load efficiency improvement, and enhancements in ramp-up rates.
The simulations show the tendency of the compressor back stages to operate towards stall during flow injection, especially at closed VIGV position. The airflow injection is shown to:
increase the OPR, CDT, TET, and slightly reduce the EGT. increase the PO, thermal efficiency, and fuel flow in similar magnitude for fully closed and fully open VIGV positions. result in an earlier surge, when injection occurs with closed VIGV. significantly reduce the isentropic efficiency of the bulk compressor stages closer to the injection location. improve the part-load efficiency when operating above 75% of PO, compared to other load variation approaches. improve engine power/load ramp-up rates.
The steady-state simulations show a potential power augmentation of up to 25% with 15% flow injection. The quasi-transient analysis shows that the load ramp rate improves from 12 to 12.9 MW/min on average when 2% (of compressor discharge) is injected at a fixed opened VIGV position. That of the optimistic scenarios is 13.3 MW/min. An increment in airflow injection by 2% is shown to improve the ramp-up rates by approximately 10%.
The ramp rate improvement from MEL shows that with 2% air injection, the ramp rate also increases by about 10%. In this case, the VIGV modulation resulted in less optimistic SMU in parts of the operation towards full closure, especially for high air injections. The cases of air injections from MEL show reduced fuel consumption that is attributed to the reduced time of operation and less opening of the VIGV (with injection rate).
Finally, the study shows the potentials of compressed air injection capabilities. Aspects like delays in the GT control system, heat soakage, and mass storage effects are not accounted for. The mechanical integrity (vibration limits) under these conditions are also worthy of investigation. It is also important to note that in CCGT operations, the ramp rates will be limited by ST ramp rate that is also a function of the boiler and ST mechanical integrity.
Footnotes
Declaration of Conflicting Interests
The author(s) declared no potential conflicts of interest with respect to the research, authorship, and/or publication of this article.
Funding
The author(s) disclosed receipt of the following financial support for the research, authorship, and/or publication of this article: This study is part of TURBO-REFLEX project that has received funding from the European Union’s Horizon 2020 research and innovation programme, under grant agreement No. 764545.