
Abstract
The study involves a bottom-up approach, from bottom cells to large supercapacitor pouch cells, encompassing the design, modelling and fabrication stages of the cells leading to a 12 V transient start–stop (TSS) power system for automotive applications. More specifically, the design of a large composite supercapacitor is presented, consisting of a high power density component and a high energy density component, hybridised at material level. The composition of the composite supercapacitor is optimised to be application-specific so that it satisfies a specified energy-to-maximum power ratio for the 12 V TSS system. The testing of the large composite supercapacitor pouch cells and the 12 V TSS system proves the validity of the bottom-up approach, validates the design and the proposed electric circuit model and its parameters, fitted according to experimental data of small laboratory cells and applied successfully to the large cells, and proves the high quality of the scaled-up fabrication processes. The 12 V TSS power system of seven large composite supercapacitor cells satisfies the set criteria of energy and maximum power for the specified duration, 15 Wh and 4.2 kW respectively, at a total mass of 3.94 kg, below the original set limit of 5 kg.
Introduction
A transient start–stop (TSS) power system aims at conserving the energy of a vehicle, provided by an internal combustion (IC) engine or a battery, ultimately reducing harmful emissions to the environment, especially in the case of an IC engine. The specifications of a 12 V TSS power system were taken as published by the FreedomCAR project of the United States Advanced Battery Consortium (USABC). 1 The specifications included a maximum stored energy of 15 Wh and a power peak of 4.2 kW, determining an energy-to-maximum power ratio of 12.86 s. Li-ion batteries 2 have a range of energy and power density, namely 110–170 Wh kg–1 and 200–400 W kg–1, respectively, which means that whereas only 0.09–0.14 kg of Li-ion battery might be needed for the maximum energy storage requirement of the 12 V TSS power system, 11–21 kg of Li-ion battery is needed for the maximum power requirement which is a limiting factor for the design of this power system using a Li-ion battery. Li-ion batteries also have limited cycle life, generally of a few hundreds of cycles, 3 depending on the specification of the remaining capacity. On the other hand, supercapacitors have much higher power density, 1–6 kW kg–1, but also much lower energy density, 1–6 Wh kg–1. 4 They also have ultralong cycle life. Hybrid battery–supercapacitor energy storage systems need a DC/DC converter which adds to the total weight and the complexity of the energy management system.5–7
After various design exercises, it was found that an application-specific composite supercapacitor 8 would offer the best opportunity to reduce the mass of the supercapacitor and maximise both energy and power density. The composite supercapacitor consists of composite electrodes, containing both high energy density and high power density materials connected in parallel and sharing the same current collector and the same electrolyte. An organic electrolyte of 1.5 M TEABF4 in acetonitrile (AN) was selected as it has been tested to voltages up to 3 V, 8 compared to aqueous electrolytes that usually have a maximum voltage around 1.1 V 9 and in some cases up to 2 V. 10
A survey of high energy density porous materials for supercapacitors (with moderate power density) yielded materials with a narrow pore size distribution, in the micropore range, such as phenolic-derived activated carbon fabrics (ACFs) Kynol 507-2011,12 and Kynol 507-158: although the latter has lower specific surface area BET (Brunauer–Emmett–Teller) = 1500 m2 g–1 (against BET = 2000 m2 g–1 for Kynol 507-20), its higher areal density, 12.05 mg cm–2 (against 8.44 mg cm–2 for Kynol 507-20) gives a slightly higher energy density of 39.1 Wh kg–1. A survey of high power density porous materials for supercapacitors yielded different types of coatings, which contained activated carbon (AC) powder, highly conductive additives such as carbon black (CB) and multiwall carbon nanotubes13–17 and graphene.18–21 In particular, phenolic-derived AC powder TE32022 has a bimodal pore size distribution, combining micropores of about 2 nm with mesopores of 30–40 nm which has produced coatings that have been used to fabricate electrochemical double layer capacitors (EDLCs) of high power density of 38 kW kg–1, while they also reach moderate energy density of 24 Wh kg–1. The final selection for this study included ACF Kynol 507-15 electrodes as the high energy density material, and a coating electrode of phenolic-derived TE320 AC with 5 wt% CB additive and 3 wt% SBR binder as the high power density material. The exact composition of the composite supercapacitor was designed to satisfy the specified energy-to-maximum power ratio for the 12 V TSS power system and minimise its mass.
With regards to modelling of EDLCs and supercapacitor systems, various approaches have been followed in various studies in the literature targeting different scales. 23 At the lowest level, density functional theory (DFT) simulations consider electron systems and are based on models that employ functionals of the spatially dependent electron density. DFT simulations of EDLCs have focused on the double layer capacitance at the electrode–electrolyte interface and provided insights about the effect of pore size on the capacitance in relation to the ion size of the electrolyte. 24 Due to the huge computational time, DFT simulations can only be used for simple flat or curved electrode–electrolyte interface geometry. Molecular dynamics (MD) simulations are at atomic or molecular level and may be used to track the motion of ions of electrolyte solutions in more complex pore geometries and determine macroscopic properties regarding the ion transport such as ion diffusion coefficient, coordination number and desolvation energy as well as evolving coordination number with desolvation.25,26 However, these are also costly and lengthy simulations running on high performance computer clusters and can only simulate a small part of an electrode structure. Properties derived from DFT and MD simulations can be used in pore network simulations using continuum electrochemical models based on the Poisson–Nernst–Planck equations. 27 However, it is very difficult to obtain the pore network structure experimentally as even 4D nano-CT characterisation techniques have a resolution of about 1 µm, 28 which is inadequate for characterising the meso and microporous electrode materials of EDLCs with pore size peaks usually in the range of 0.6–3 nm (8 among others). A recent model by our group29 includes a continuum model of volume-averaged equations through the electrodes of an EDLC taking into account the pore size distribution of electrodes which can be easily determined via nitrogen adsorption/desorption experiments 29 ; such a model proved valuable in the design and selection of the porous electrode materials in relation to a certain electrolyte system. 29 Equivalent circuit models are frequently used to fit electrochemical test data for supercapacitor and battery cells11,14 and are used in the design and simulations of supercapacitor and battery packs. 30 They can be easily implemented in algorithms that are fast to run for the management of energy storage systems. 30 Therefore, equivalent circuit modelling will be used in this study as best suited for the scaling up of cells, and design and simulations of a power system for a start–stop application for vehicles.
The present study describes the development of the 12 V TSS power system following a bottom-up approach across modelling, design and experimental scaling up stages, from small 2–4 cm2 laboratory scale cells of each type of electrode material, small high energy EDLC and small high power EDLC, to large composite EDLC pouch cells of over 0.5 kg each. The design of the large composite EDLC was optimised on the basis of data from the small laboratory cells to achieve the specified energy-to-maximum power ratio for the 12 V TSS power system. Testing of the cells and system is presented at each stage of the development process, as well as comparison of the experimental data with model predictions of voltage profiles during galvanostatic charge–discharge (GCD).
Modelling and design
The 12 V TSS power system has a specified voltage range of 9–17 V. The design included seven EDLCs in series, each operating in the range of Vmin,cell = 1.286 to Vmax,cell = 2.43 V. A power delivery operating current of IP = 323 A was specified whereas the energy storage requirement was specified at a current IE = 77 A. Each of the seven EDLCs was then set to the specified cell energy, Ecell, and cell power, Pcell, described by the equations

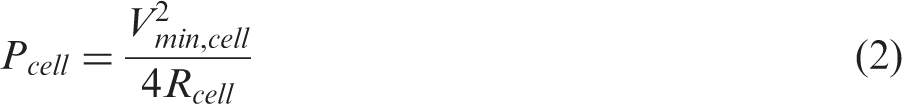
Given the specified energy and maximum power of the 12 V TSS power system, 15 Wh and 4.2 kW respectively, it follows that the requirements at cell level are: Ecell = 15 Wh/7 = 2.14 Wh and Pcell = 4200 W/7 = 600 W. Using equations (1) and (2), the required capacitance and maximum resistance of each EDLC cell are then calculated as: Ccell = 3660 F and Rcell = 0.59 mΩ.
Given that each EDLC consists of composite electrodes in an integrated composite cell as presented in Figure 1(a), where the high energy density component(s) are connected in parallel with the high power density component(s)
8
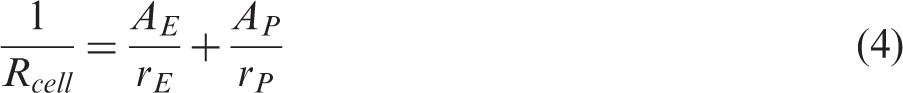
(top level composite EDLC in Figure 2(a)), the cell capacitance and resistance are described by the following equations for in parallel connection
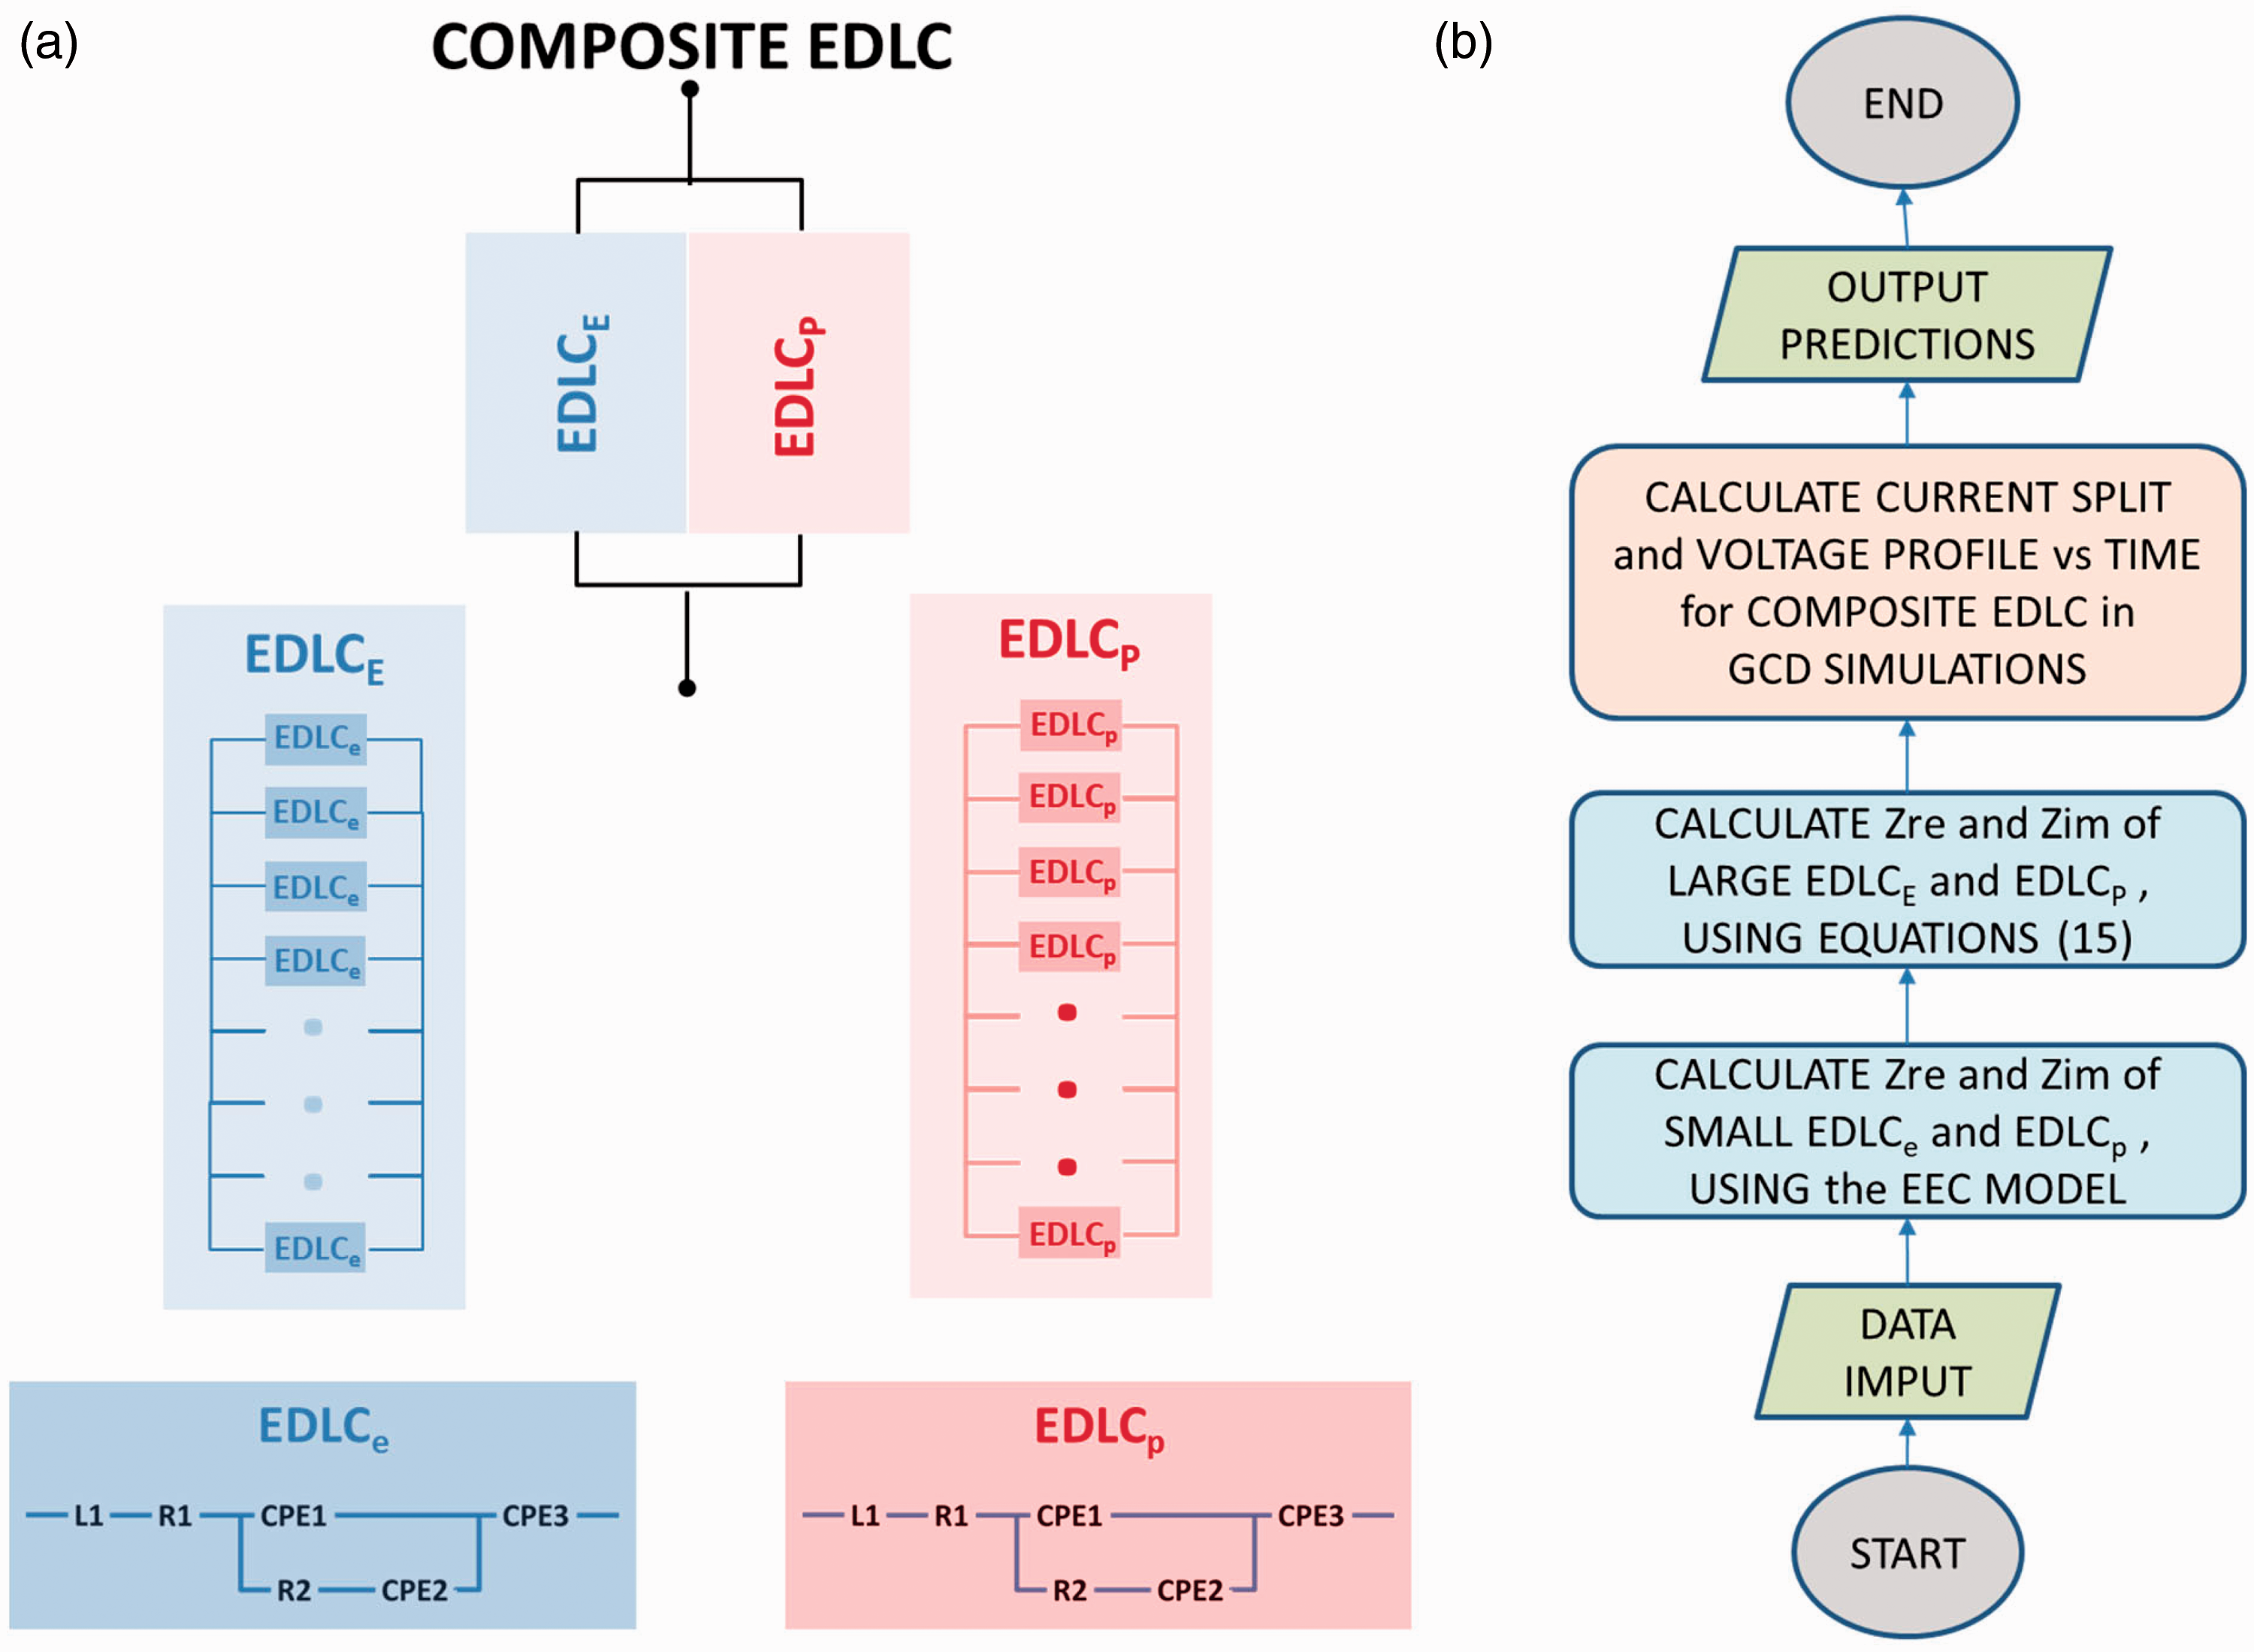
(a) Diagram of integrated composite supercapacitor cell with double-side coated current collectors and two types of electrode materials of high energy density (black in diagram) and high power density (textured grey in diagram), respectively. (b) Ragone plots of a small, high power EDLC cell based on phenolic-derived AC + 5 wt% CB + 3 wt% SBR coating and a small, high energy EDLC cell based on phenolic-derived AC fabric. Bottom-up approach: (a) Hierarchical equivalent electric circuit modelling: Top layer: Composite supercapacitor consisting of high energy density EDLCE and high power density EDLCP, connected in parallel. Middle layer: EDLCE equivalent electric circuit consists of nE number of small laboratory scale high energy density EDLCes connected in parallel; EDLCP equivalent electric circuit consists of nP number of small laboratory scale high power density EDLCps connected in parallel. Bottom layer: each small laboratory scale EDLCe or EDLCp is represented by its own EEC consisting of an inductor, resistor, R1, Voigt circuit and constant phase element, CPE3, in series; Voigt circuit consists of CPE1 in parallel with R2 and CPE2, where R2 and CPE2 are connected in series. (b) Algorithm flowchart for the prediction of voltage profile against time in the simulation of the GCD of a large composite EDLC.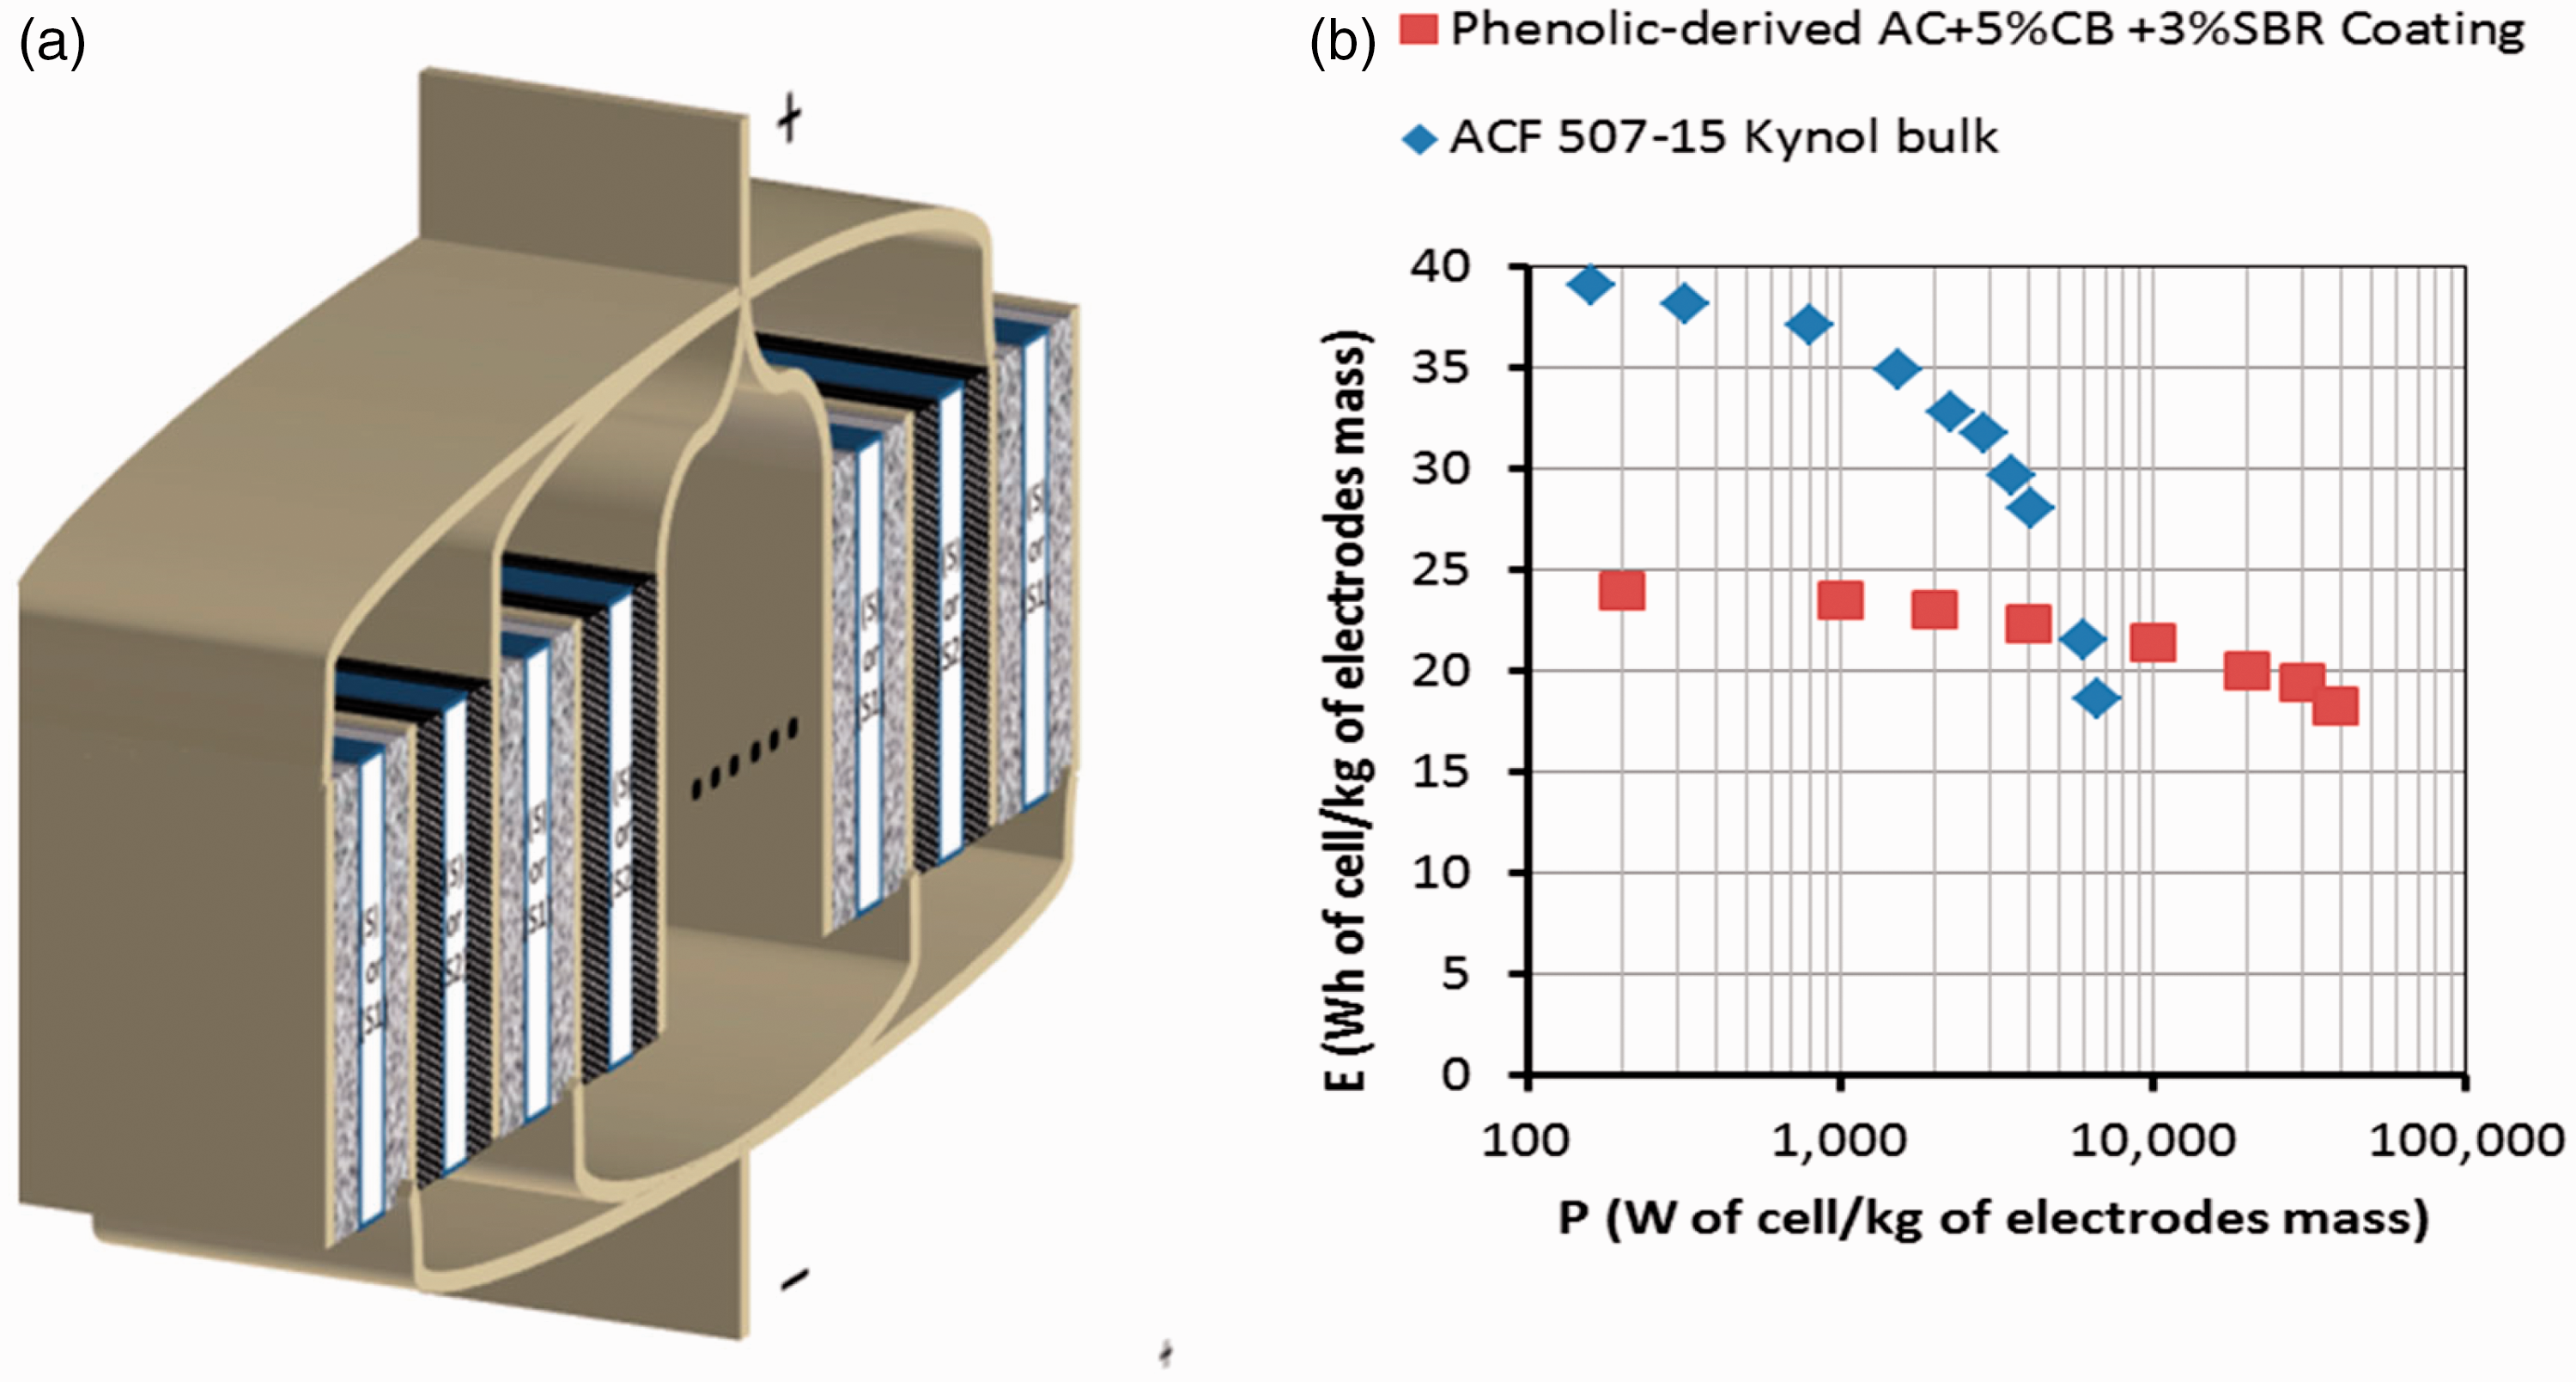

As the above design of each composite EDLC in the 12 V TSS power system, the modelling also starts from the small laboratory cells of the ACF-based high energy density EDLC (4 cm2 cells), EDLCe, and the coating-based high power density EDLC (2 cm2 cells), EDPCp, the experimental data of which is presented in Fields et al.
8
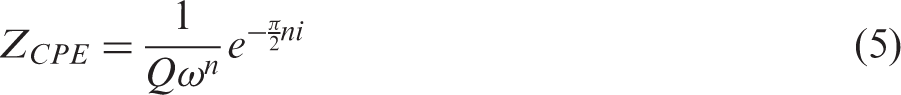
Figure 2(a) presents the equivalent electrical circuit (EEC) model used in this study for each small laboratory cell, EDLCe or EDLCp, consisting of an inductor, L1, connected in series with a resistor, R1, a Voigt circuit, and a constant phase element, CPE3. The Voigt circuit consists of a constant phase element CPE1 connected in parallel with a branch of a resistor R2 in series with a constant phase element CPE2. Each constant phase element, CPE, has an impedance, ZCPE, given by the relation

For any resistor with resistance, R

For an inductor, as for inductor L1 in Figure 2(a)

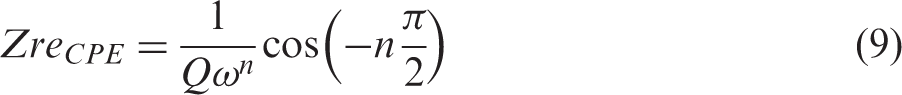
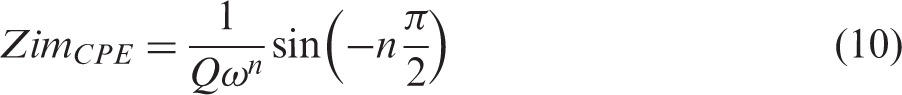
Similarly, for a constant phase element, the complex ZCPE consists of the sum of real, ZreCPE, and imaginary impedance, ZimCPE, as in equation (6), with each component given by the following equations (9) and (10), respectively
Considering the EEC model of the bottom layer in Figure 2(a), for all parts connected in series, the total Zre and Zim are determined as the sum of the Zre and Zim of each part, according to the equations


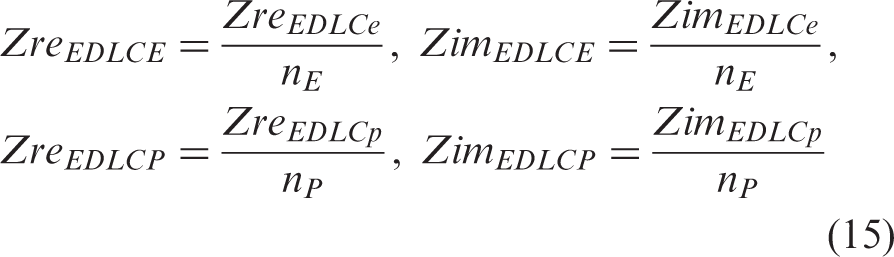
The scaled-up composite supercapacitor (top layer in Figure 2(a)) consists of a high energy density EDLCE in parallel with a high power density EDLCP, in a Voigt circuit the real and imaginary impedances are also given by equations (13) and (14), if EDLCE and EDLCP are considered the top and bottom parts of the Voigt circuit. Each part is then an equivalent parallel circuit of small laboratory scale EDLCs as illustrated in the middle layer in Figure 2(a): EDLCE is an equivalent parallel circuit of nE small laboratory scale high energy density EDLCes and EDLCP is an equivalent parallel circuit of nP small laboratory scale high energy density EDLCps. On the basis of the equivalent parallel connection of the small laboratory scale EDLCs, the real and imaginary impedance of parts EDLCE and EDLCP are given by the following equations

An algorithm has been then written for the prediction of Zre and Zim of the large composite EDLC, and subsequently the predictions of its voltage profile against time in the simulation of a GCD test. Figure 2(b) presents the flowchart of this algorithm which reflects the bottom-up approach of the model in Figure 2(a).
Materials and experimental methods
According to the design of the composite EDLC supercapacitors for the 12 V TSS power system, employing equations (1) to (4) in the ‘Modelling and design’ section, the 12 V TSS power system has been designed as a system of seven composite EDLCs in series. Each composite EDLC comprised double-sided current collector which was Toyal-Carbo® foil (Toyal Toyo Aluminium K.K., Japan) covered with active electrode materials on each side, NKK TF4060 cellulose paper separator (NKK-Nippon Kodoshi Corp.) and electrolyte 1.5 M TEABF4 (>99% purity, Sigma–Aldrich) in AN (anhydrous, >99.8% purity, Alfa Aesar). The design calculations in the ‘Modelling and design’ section, scaling up from small laboratory scale cells of high energy density or high power density material, yielded an application-specific composite supercapacitor with AE = 3888 cm2 of high energy EDLC-equivalent, with a mass mE = 93.3 of high energy density material ACF Kynol 507-15 (from Kynol Europe Gmbh), which is a plain woven AC fabric of an areal density of 12.05 mg cm–2, nominal thickness of 0.5 mm and measured specific surface area BET = 1461 m2 g–1. High power density coatings were fabricated consisting of phenolic-derived AC TE320 (from MAST Carbon, UK), 5 wt% acetylene CB (from Alfa Aesar; average particle size 42 nm, BET = 75 m2 g–1, bulk density 170–230 kg m–3) and 3 wt% SBR binder (15% SBR aqueous emulsion, hydrophilic binder PSBR100 from Targray). A slurry of these materials in water was created and coated onto the current collector foil by the doctor-blade technique using the pilot scale coater depicted in Figure SI-1. A question of coating thickness had to be resolved in terms of both gravimetric efficiency and electrochemical performance of the scaled-up EDLC. Summing all masses from the different materials (electrode coating, current collector foil, separator, electrolyte, pouch, tabs) would yield the total cell mass, generating the gravimetric efficiency of the scaled-up EDLCP, which represents the ratio of the mass of the electrode coating versus the mass of the whole EDLCP cell. Parametric studies of the gravimetric efficiency as a function of the electrode coating thickness were carried out for EDLPP and the results are presented in Figure 3(a). It can be seen that a plateau is reached at a gravimetric efficiency of about 27%, corresponding to a coating thickness of 150 µm and an areal density of 8 mg cm–2. Increasing the coating thickness above this value increased the cell resistance; hence, the coating thickness value of 150 µm was selected. Based on these data, the application-specific design of the composite supercapacitor in the ‘Modelling and design’ section yielded a required area of high power EDLC-equivalent of AP = 2880 cm2 with coating-type electrode material of mass mP = 46.1 g at coating areal density of 8 mg cm–2.
(a) Gravimetric efficiency plot for coating-based EDLC cells. (b) Mass composition of a large composite EDLC pouch cell fabricated in this study.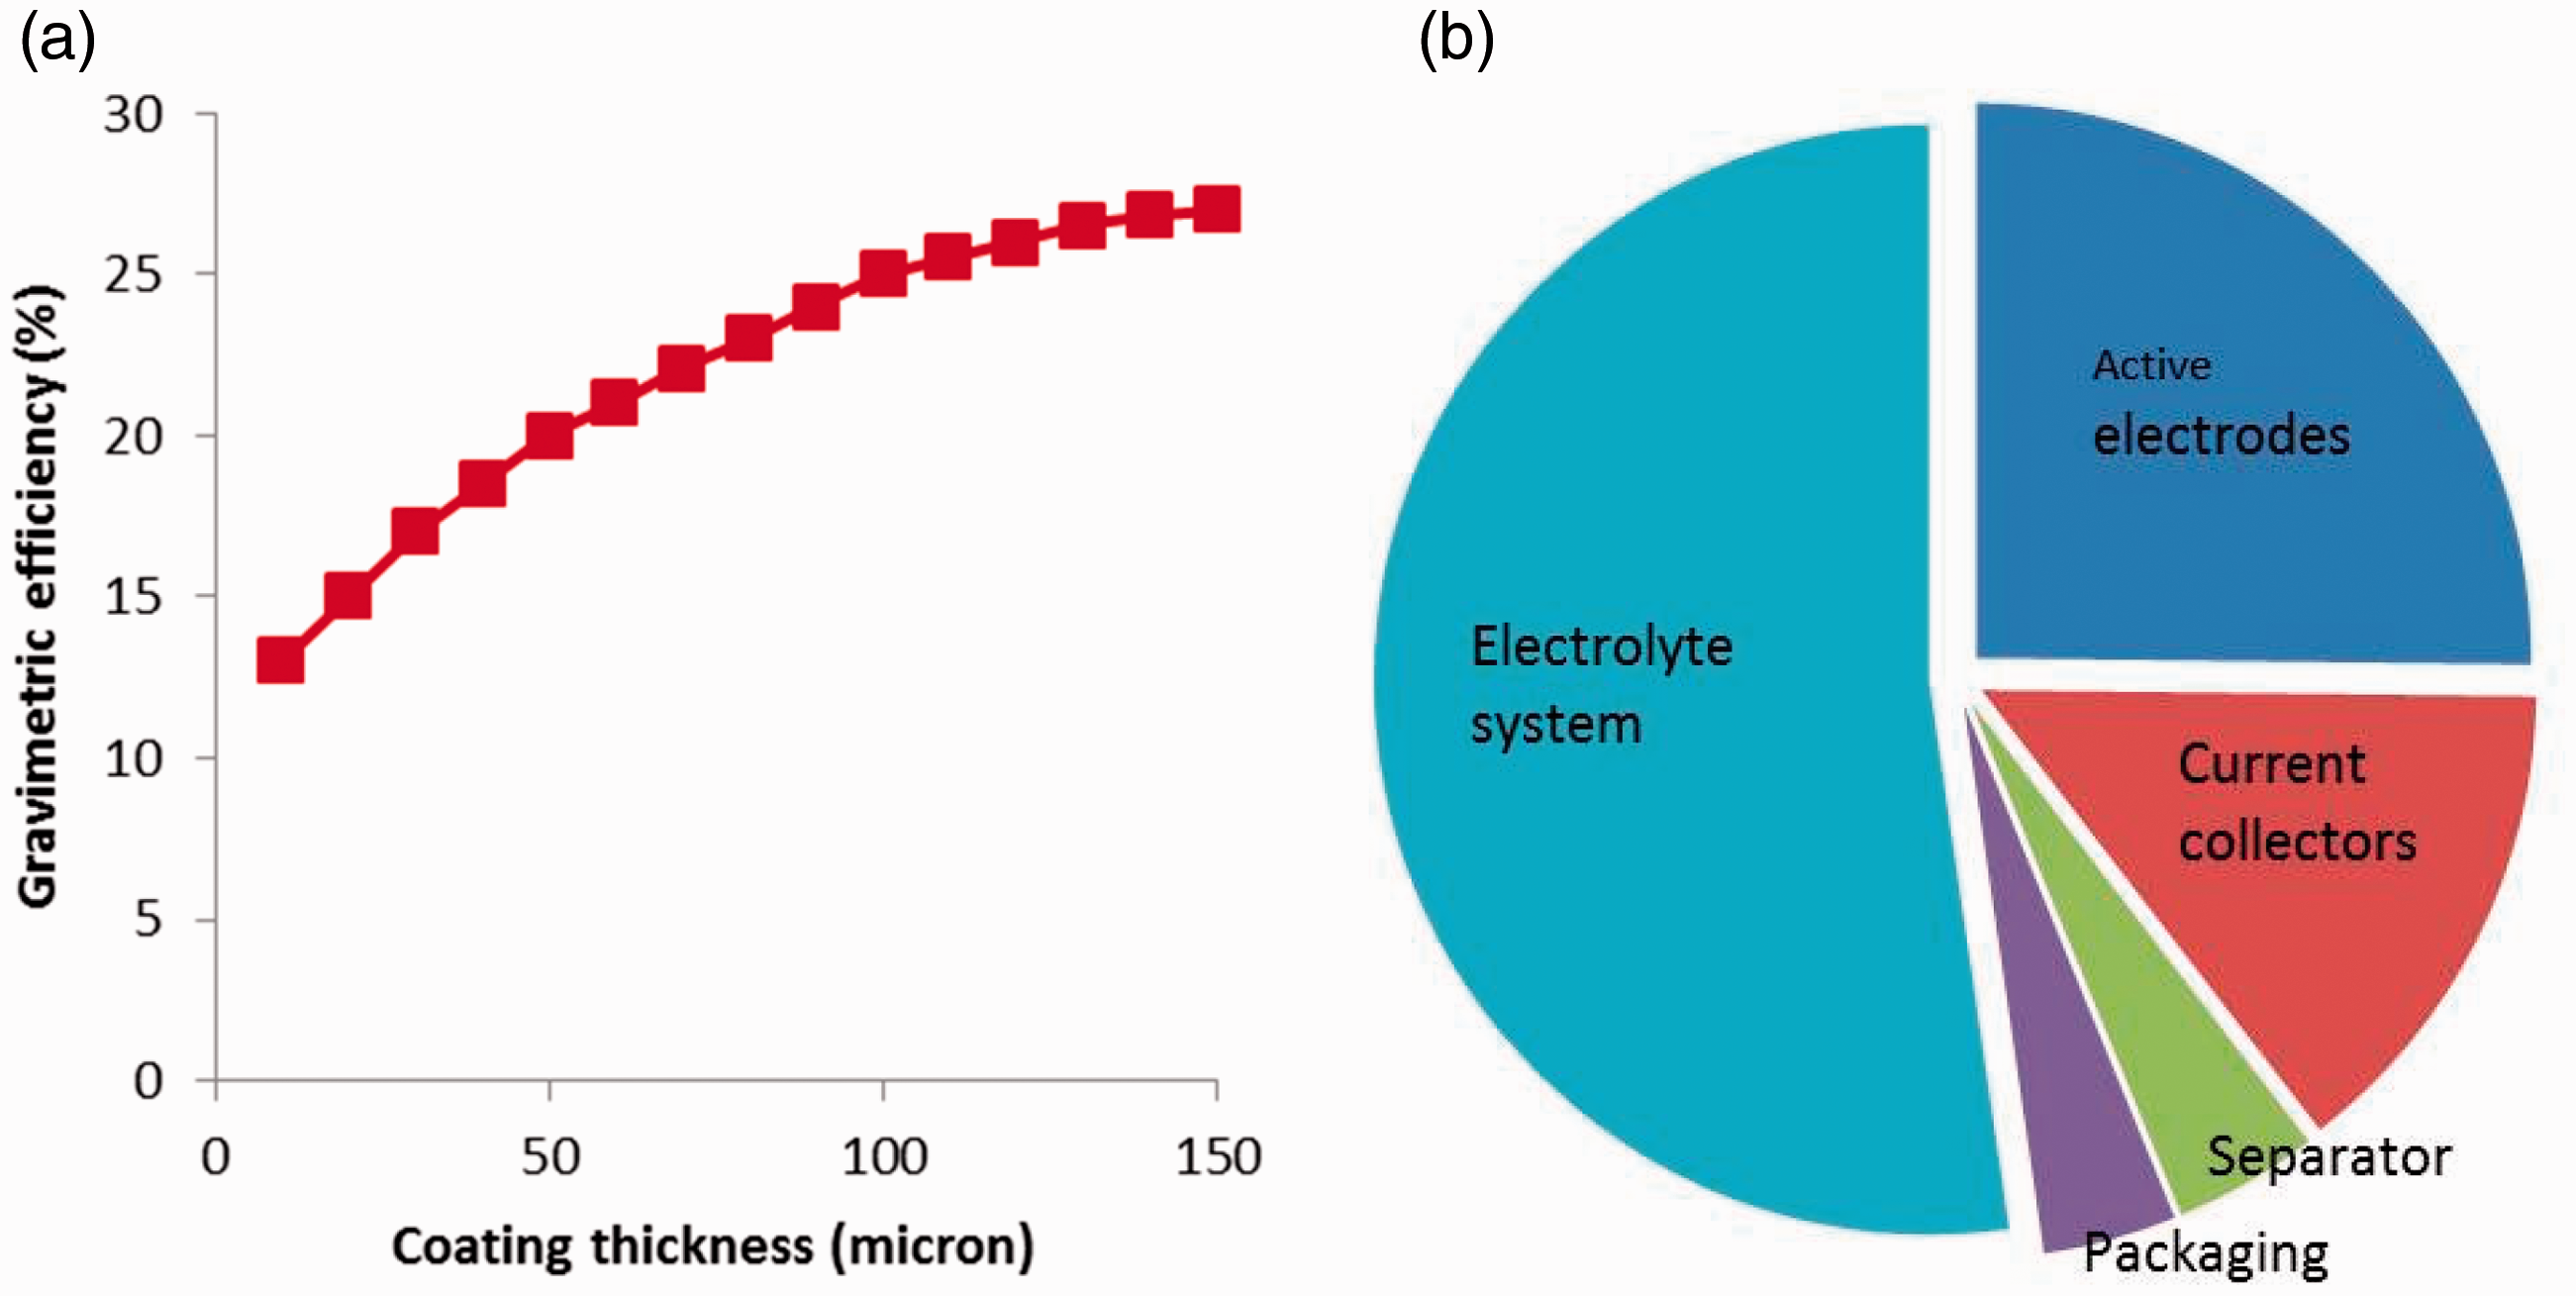
Multiple pouch cells (Figure SI-2) were fabricated containing the composite EDLC assembly as presented in Figure 1(a). The pouch foil was aluminium–polypropylene film laminated foil (from MTI, of 115 µm thickness). A 100 µm aluminium sheet was used for terminal tabs which were welded ultrasonically to the current collector foils. The mass composition of a large composite EDLC pouch cell is presented in Figure 3(b). Each pouch cell was first tested for any manufacturing defects, using an infra-red (IR) thermal camera FLIR E4 in galvanostatic charge at low current, 10 A, which would detect any hot spots in the cell area (outside the tabs), as seen in Figure SI-3, which would have the potential to lead to short circuiting.
After passing successfully the IR camera test, each pouch cell composite EDLC was tested in GCD using a Hocherl & Hackl NL1V8C320 source-sink instrument at different currents in the range of 50–300 A. A self-discharge test involved charging the cell to 2.7 V and maintaining that voltage for 4 h, then letting the cell to self-discharge and measure its voltage as a function of time, from which the degree of self-discharge with respect to the maximum voltage (2.7 V) was determined after 72 h.
Voltage cell balancing was tested for four large composite EDLC cells in series at a time, in the range of 0–8 V, using the Hocherl & Hackl NL1V8C320 source-sink instrument, as displayed in Figure SI-4. Finally, a supercapacitor bank of five large, composite EDLC pouch cells was assembled in series and was tested to start a two-cylinder diesel engine via a 12 V, 0.9 kW starter motor. The five-EDLC power system was charged at a constant current of 10 A to 12 V, and the voltage was maintained at 12 V for 300 s. After that, five consecutive engine start–stop–starts were performed without any supercapacitor recharge in between. The voltage of the EDLC system was measured at the end of the five consecutive engine start tests.
Results and discussion
The bottom-up approach was adopted in modelling in the hierarchical electric circuit model of Figure 2(a). The Nyquist plots of electrochemical impedance spectroscopy (EIS) data 8 for the small laboratory cells EDLCe and EDLCp were used to fit the EEC model parameters of the bottom layer models in Figure 2(a), as follows: EDLCe: L1 = 5×10⁻⁸ H, R1 = 0.36 Ω, Q1 = 1 F s–0.63, n1 = 0.37, R2 = 0.2 Ω, Q2 = 7 F s–0.8, n2 = 0.2, Q3 = 2.7 F s–0.02, n3 = 0.98; EDLCp: L1 = 5×10⁻⁸ H, R1 = 0.52 Ω, Q1 = 1 F s–0.75, n1 = 0.25, R2 = 0.35 Ω, Q2 = 8 F s–0.8, n2 = 0.2, Q3 = 0.28 F s–0.033, n3 = 0.967.
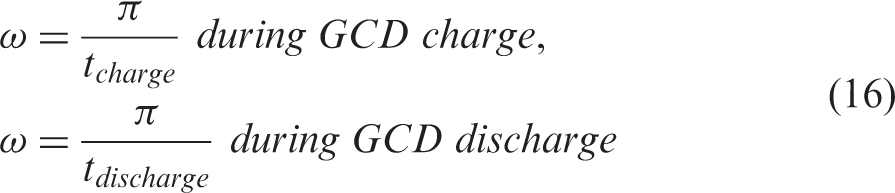
These parameter values (Figure 4(a)) were then used in simulations of the GCD tests of the small laboratory size EDLCe and EDLCp, where at constant current of charge or discharge at each time step, the total real and imaginary impedances of the EDLC was calculated according to equations (11) and (12), the real and imaginary impedances of each component according to equation (7) for the resistors, (8) for the inductor, (9) and (10) for each CPE and (13) and (14) for the Voigt circuit. In many of these equations the value of ω is required during the GCD test, which was calculated as a function of the charge or discharge time at each time step according to the following equation
(a) Electrical circuit model used for each small, laboratory scale EDLC, fitted parameters: EDLCe: L1 = 5×10⁻⁸ H, R1 = 0.36 Ω, Q1 = 1 F s–0.63, n1 = 0.37, R2 = 0.2 Ω, Q2 = 7 F s–0.8, n2 = 0.2, Q3 = 2.7 F s–0.02, n3 = 0.98; EDLCp: L1 = 5×10⁻⁸ H, R1 = 0.52 Ω, Q1 = 1 F s–0.75, n1 = 0.25, R2 = 0.35 Ω, Q2 = 8 F s–0.8, n2 = 0.2, Q3 = 0.28 F s–0.033, n3 = 0.967. (b) and (c) Predictions from this study against experimental data from Fields et al.
8
of the galvanostatic charge–discharge at two different current densities (50 and 2.5 mA cm–2) of (b) EDLCe: ACF-based EDLC (4 cm2 cell) and (c) EDLCp: AC coating-based EDLC (2 cm2 cell), and also the predicted evolution of voltage components across each component of the electrical circuit model in (a). VR1, VR2, VCPE1, VCPE2, VCPE3: voltage difference across R1, R2, CPE1, CPE2, CPE3, respectively.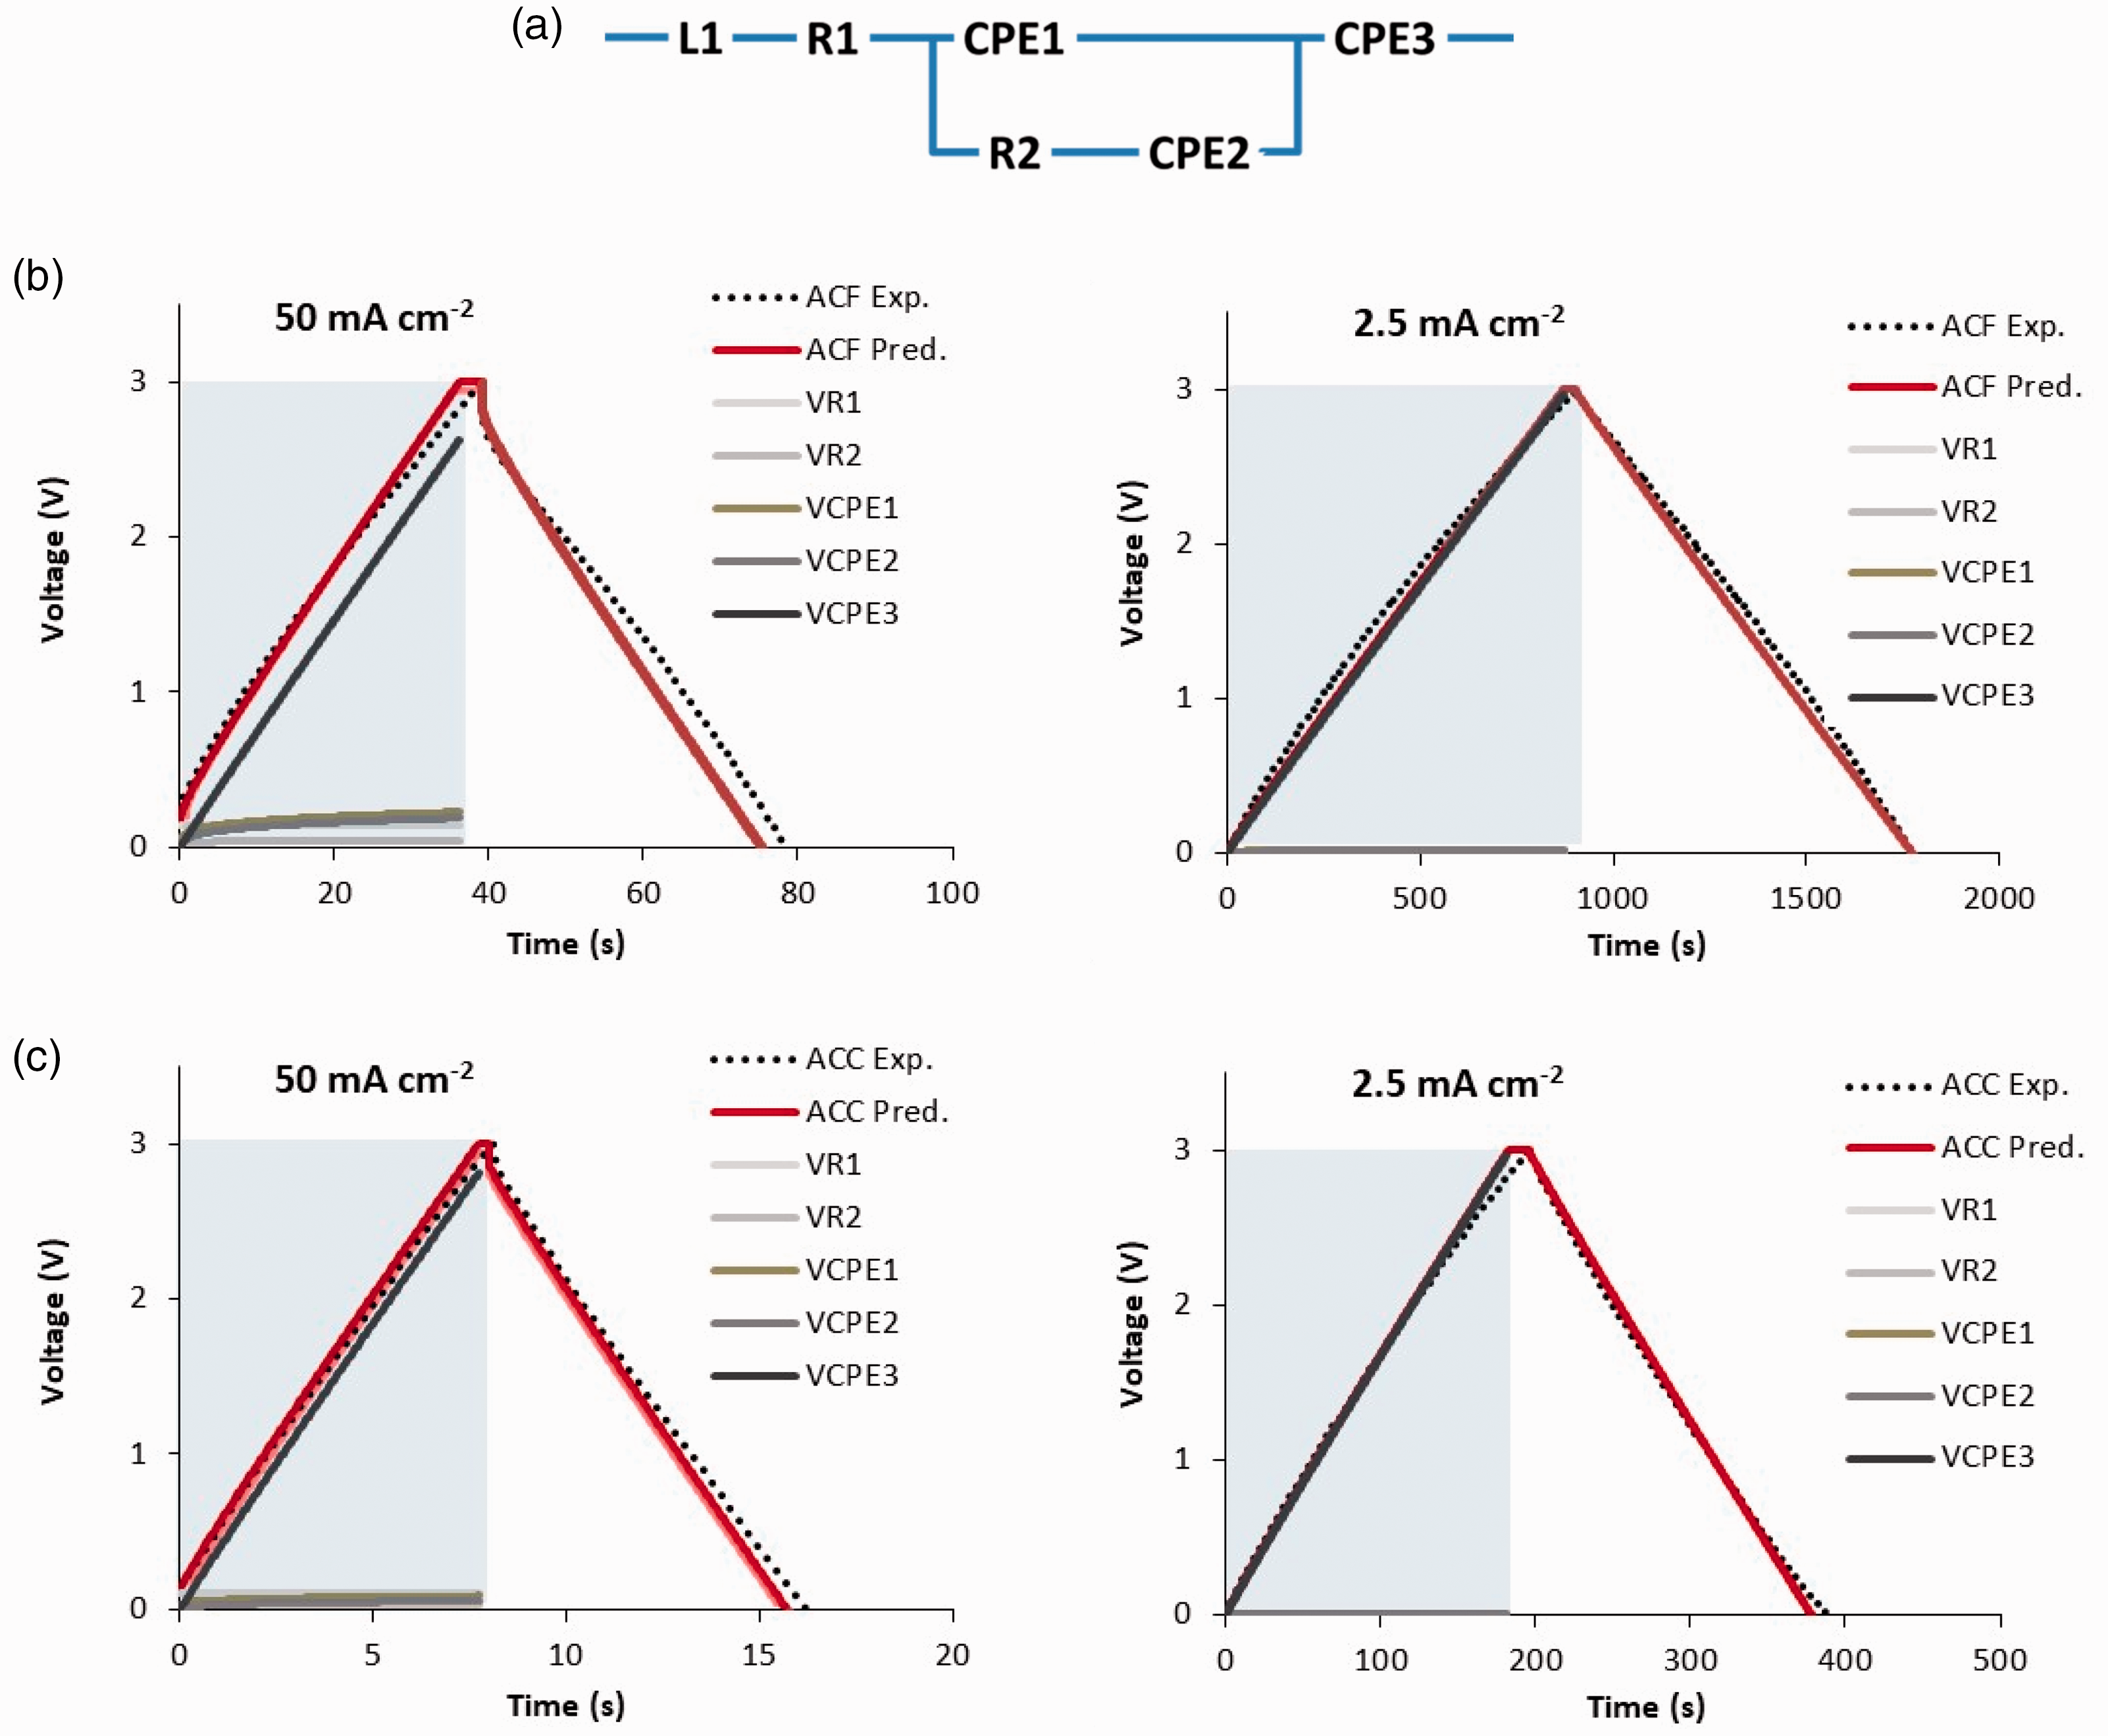

The total small EDLC voltage at each time step during GCD was calculated from the equation
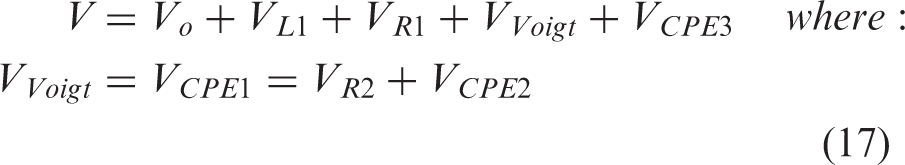
The predictions from these simulations are shown in Figure 4(b) for EDLCe and Figure 4(c) for EDLCp at two different current densities: fast GCD at 50 mA cm–2 and slow GCD at 2.5 mA cm–2. The predictions agree very well with the corresponding experimental data taken from Fields et al. 8 validating the parameter fitting process and the applications of the EEC model presented in Figure 4(a) to the modelling of the GCD process employing equations (16) and (17).
Furthermore, the graphs of predictions contain the time evolution of the voltage of each component of the EEC model, R1, R2, CPE1, CPE2, CPE3, and its relative effect on the overall GCD voltage curve at different timescales. According to relation (16), as time progresses the frequency decreases representing a sequence of timescales from short (at initial high frequency) to long timescales, where the length of such timescales also depends on the charge-discharge rate or current density. In fast GCD at the high current density of 50 mA cm–2, small timescales are involved, 0–36 s for the EDLCe and 0–8 s for the EDLCp; in such short timescales, ion transport involves crossing from the current collector to the electrode, VR2, and the capacitance at their interface, as well as the ion transport through the hierarchical pore sizes, VCPE1, VCPE2, where especially VCPE1 is higher for EDLCe than for EDLCp due to the higher n1 value for EDLCe, which makes it more capacitive during this ion transport. In both types of EDLCs, the main source for the gradient of the GCD curve is VCPE3 which represents the main capacitance of the small pores for both types of EDLCs, for which n3 ≈ 1, meaning that CPE3 is mainly a capacitor. Q3 is clearly of higher value in EDLCe, supporting the fact that EDLCe is the high energy EDLC compared to EDLCp. In the low rate GCD at 2.5 mA cm–3, the GCD curve is dominated by the VCPE3 (micropore capacitor) component.
The scaled-up composite supercapacitor consists of AE = 3888 cm2 of high energy density area, equivalent to nE = 3888/4 = 972 small laboratory scale high energy density EDLCes (each of 4 cm2), and of AP = 2880 cm2 of high power density area, equivalent to nP = 2880/2 = 1440 small laboratory scale high power density EDLCps (each of 2 cm2). Figure 5 displays the experimental data of three GCD cycles at different currents, namely 30, 75 , 200 and 300 A, as well as the predictions of the composite EDLC model (according to Figure 2) for the third GCD cycle at each current. There is good agreement between predictions and experimental data, taking into account the scaling up of both the experimental cell and the model of the large composite EDLC, where the latter is scaled up across three model layers (as presented in Figure 2(a)) in a bottom-up approach, starting from the EEC of small cells EDLCe and EDLCp with the model validated against the corresponding experimental data with good agreement (as shown in Figure 4), moving to the middle layer of modelling the large EDLCE and EDLCP and connecting them in parallel in the large composite EDLC occupying the top layer of the model in Figure 2(a).
Experimental data for three GCD cycles and predictions for one GCD cycle (presented for the third cycle) of a large composite EDLC pouch cell at different currents: (a) 30 A, (b) 75 A, (c) 200 A and (d) 300 A.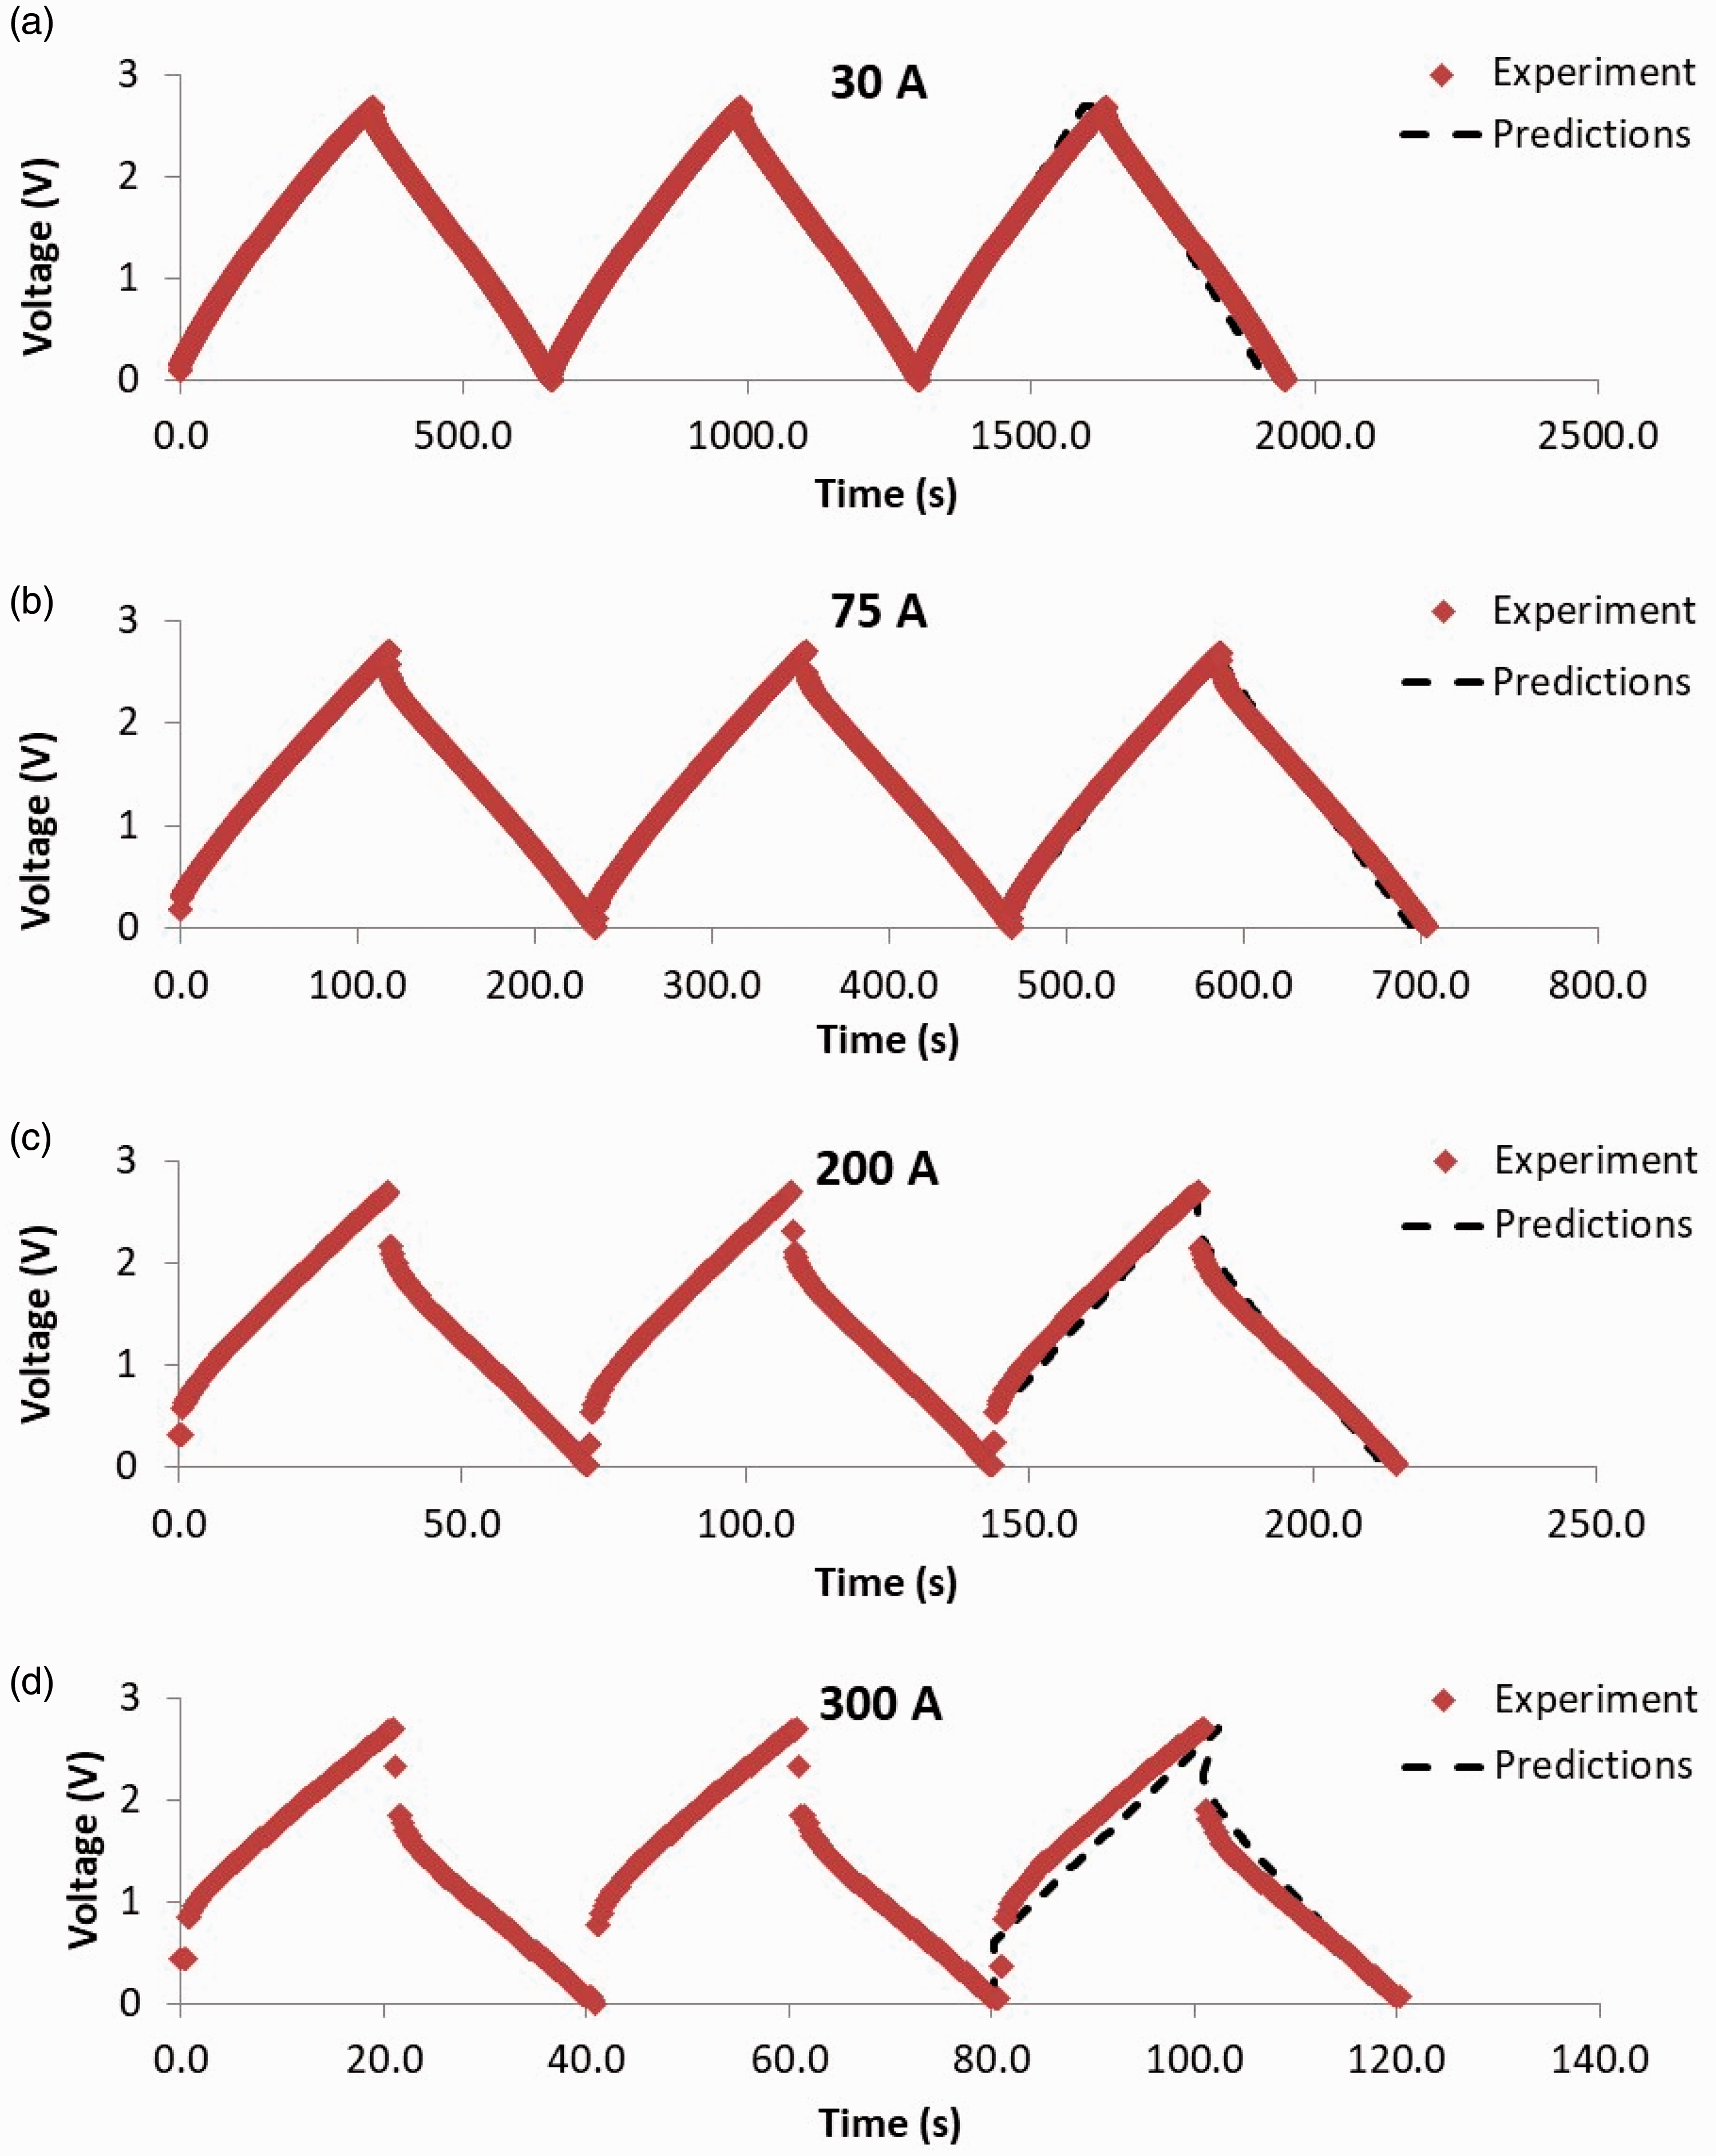
Seven of such large composite EDLC pouch cells have been designed to be combined in series for a 12 V TSS power system and therefore seven of such large EDLC pouch cells have been fabricated and tested in GCD tests as for the example presented in Figure 5. Key features and performance parameters determined from the GCD test data are presented in Table SI-1. The seven large, composite EDLC pouch cells had an average mass of 562 ± 2 g with a composition as presented in Figure 3(b) and an average gravimetric efficiency of (active electrode mass to total cell mass) 24.6% ± 0.1%, which is lower than the 27% efficiency of the targeted efficiency for the high power component EDLCP in the electrode coating manufacture (Figure 3(a)) due to the high microporosity of the ACF electrode of the high energy component EDLCE which would absorb more electrolyte. In fact, Figure 3(b) exhibits that the electrolyte mass dominates the composite EDLC cell mass at more than 50%.
Sums of performance of the seven large composite EDLC cells connected in series: total mass of system, system power (fast discharged at 300 A after been fast charged also at 300 A) and the system energy (discharged at 75 A after been charged also at 75 A, equivalent to 1 kW for the system of seven cells) in the voltage range 2.43–1.286 V for each cell, equivalent to the voltage range 17–9 V for the system of seven of such cells in series.
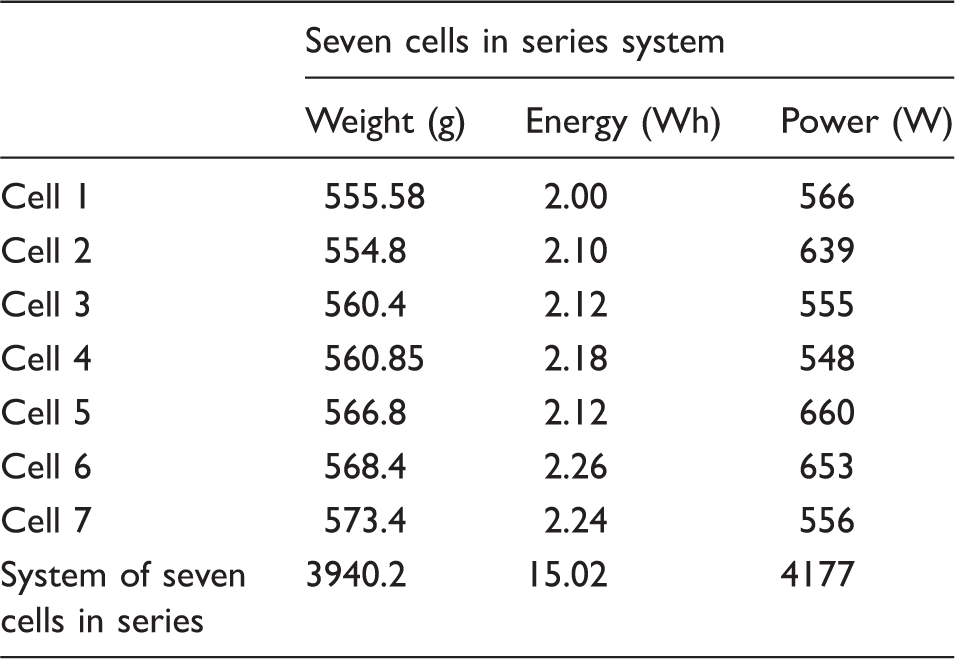
Figure 6 presents an experimental self-discharge study for the 555 g large composite EDLC cell from a maximum voltage Vmax = 2.7 V on the basis of which the degree of self-discharge was determined after 72 h at 24% which is much higher than the requirement of 4% specified by the FreedomCAR project of the USABC.
1
The high self-discharge of the composite EDLC may be attributed to the large charge diffusive element of the high energy EDLC component as can be seen in Figure 4(b) for the EDLCe charged discharged at 50 mA cm–2 and the significant contribution of its CPE2 compared to the experimental data for EDLCp in Figure 4(c). The reason for this is the large volume of micropores in EDLCe (compared to EDLCp), which although raises the specific capacitance and energy, decreases the charge diffusivity leading to self-discharge. In general, supercapacitors suffer from self-discharge that limits their application as a long-term energy storage system. There have been several research papers on the development of methods to suppress self-discharge by reducing ion flow after the EDLC has been charged; such methods are based on selective ion exchange membranes,
31
surfactants in the electrolyte that can be adsorbed on the electrodes and hinder ion flow,
32
or additive electrorheological molecules in the electrolyte
33
which reduced self-discharge by 80%.
33
Hence, applying the method of 2% electrorheological additive in the electrolyte
33
in the composite EDLC in this study could result in an estimated self-discharge of 4.8% after 72 h, which is close to the USABC requirement of 4%.
1
Experimental data for the self-discharge of the 555 g large composite EDLC cell from a maximum voltage of 2.7 V.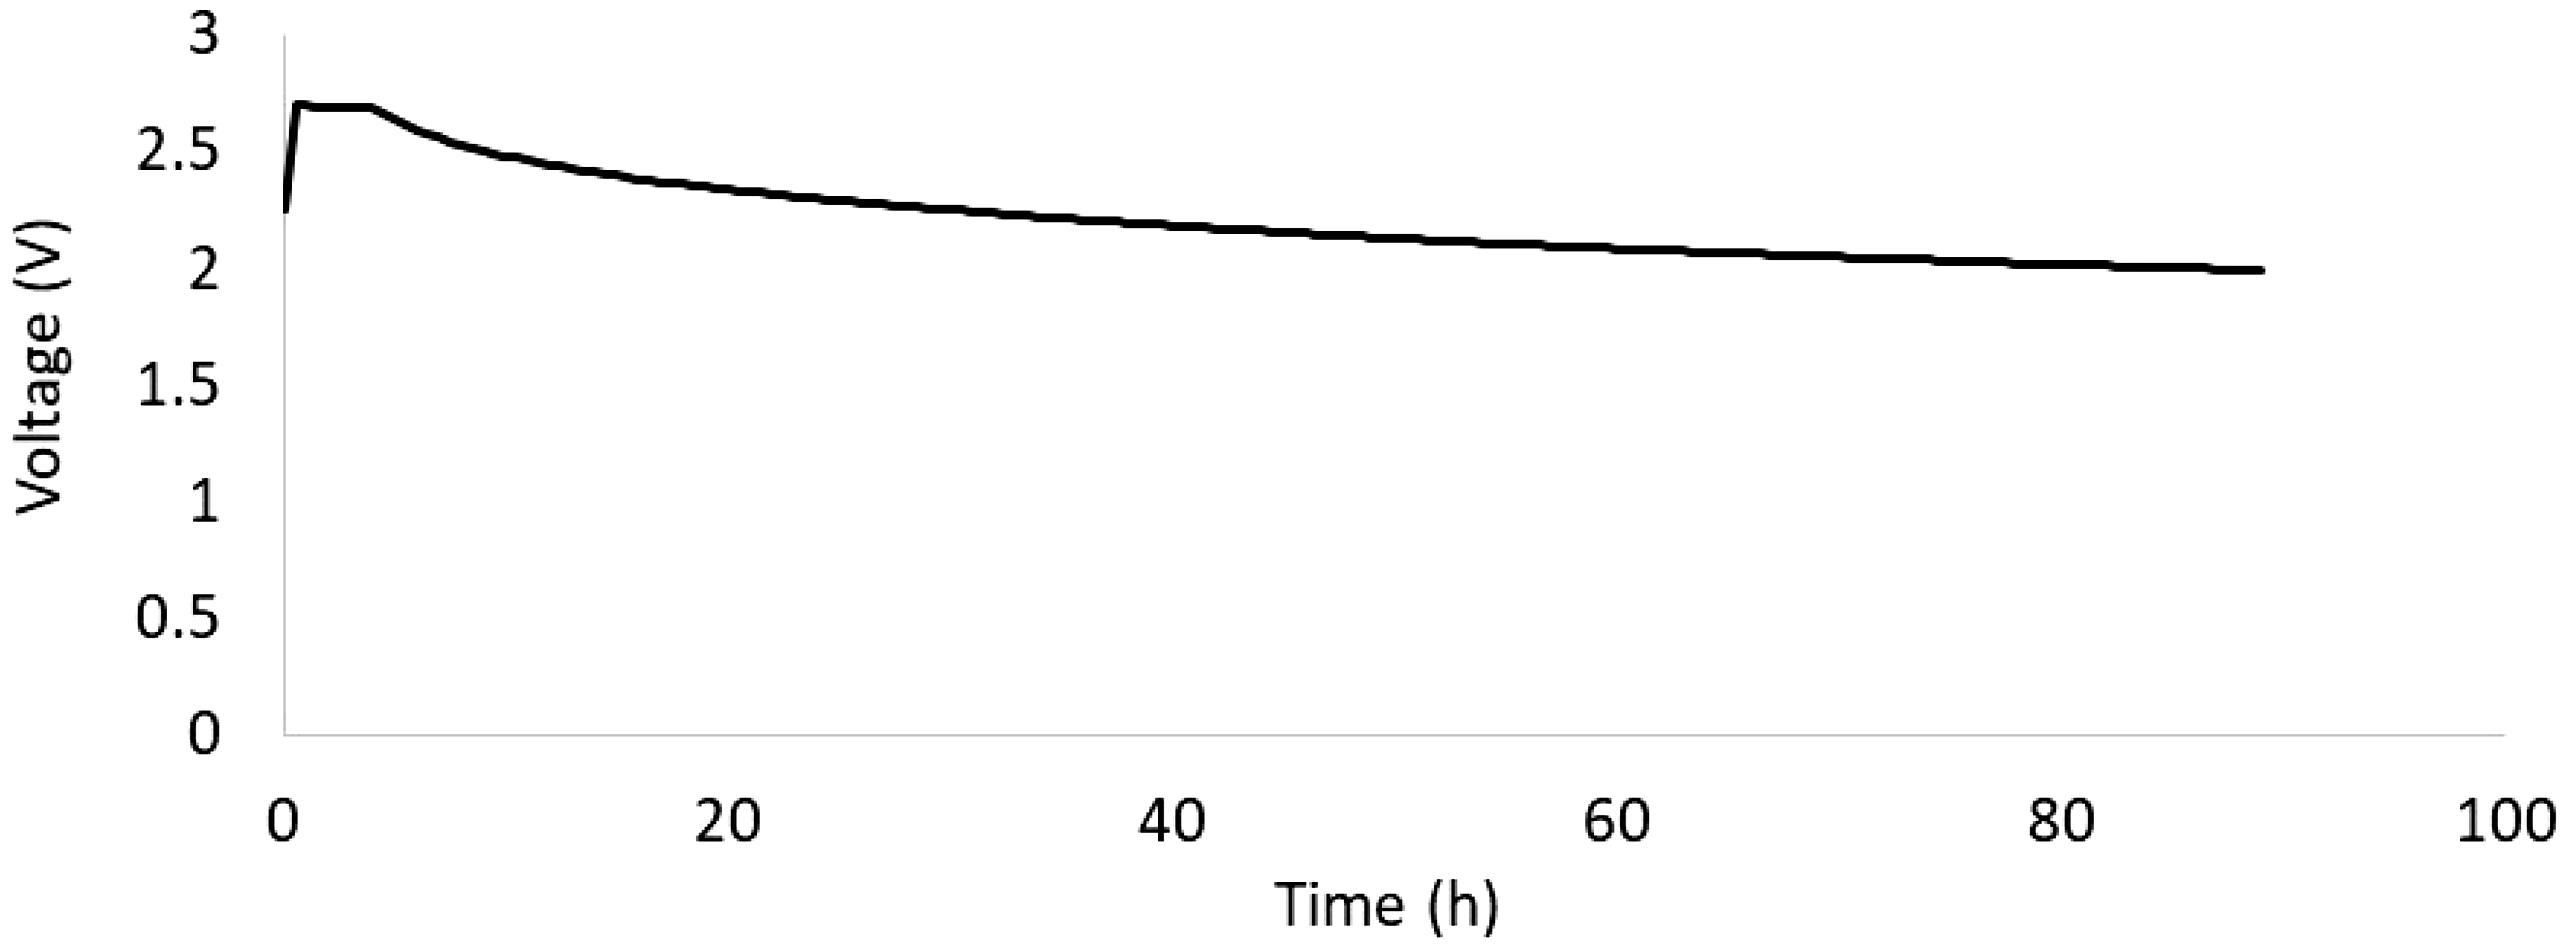
Systems of four large, composite EDLC cells in series were tested for cell voltage balancing (Figure SI-4), and an example of results is presented in Table SI-2. The experimental data showed the following average cell voltage and standard error at different charge voltage values for the whole system of the four cells: System voltage: 0.29, 2, 4, 6, 8 V and corresponding average cell voltage and standard error: 0.07 ± 0.01, 0.50 ± 0.01, 1.000 ± 0.007, 1.501 ± 0.006, 2.001 ± 0.005 V, where it can be clearly seen that the % standard error reduces quickly as the system voltage increases, from 14% at 0.29 V, to 2% at 2 V, to 0.25% at 8 V. This was thought to be a good performance of cell self-balancing and also a proof of the small variability in material and cell manufacture in the cell fabrication scaling up process and, hence, no additional circuit balancing was used for the system in the system testing.
Figure 7(a) presents the experimental data of charging the system of five large, composite EDLC pouch cells in series, first at a constant current of 10 A from 1.85 V to 12 V, which was achieved at 841 s, maintaining the voltage at 12 V for 300 s and then letting the EDLC system to self-discharge for 55 s, in which case the voltage reached 11.88 V. Figure 7(a) also presents the predictions of charge at a constant current of 10 A, using the hierarchical composite EDLC model presented in Figure 2, which shows excellent agreement with the experimental data in terms of total charge time, although the predictions line is more linear than the experimental voltage–time line.
Testing of a system of five large, composite EDLC pouch cells in series to power a 12 V, 0.9 kW motor to start a two-cylinder diesel engine. (a) Charge phase of the EDLC system: experimental data and predictions. (b) Predictions of the voltage profile against time for five consecutive start–stop tests and experimental voltage measurements at the beginning and end of the five consecutive start–stop tests.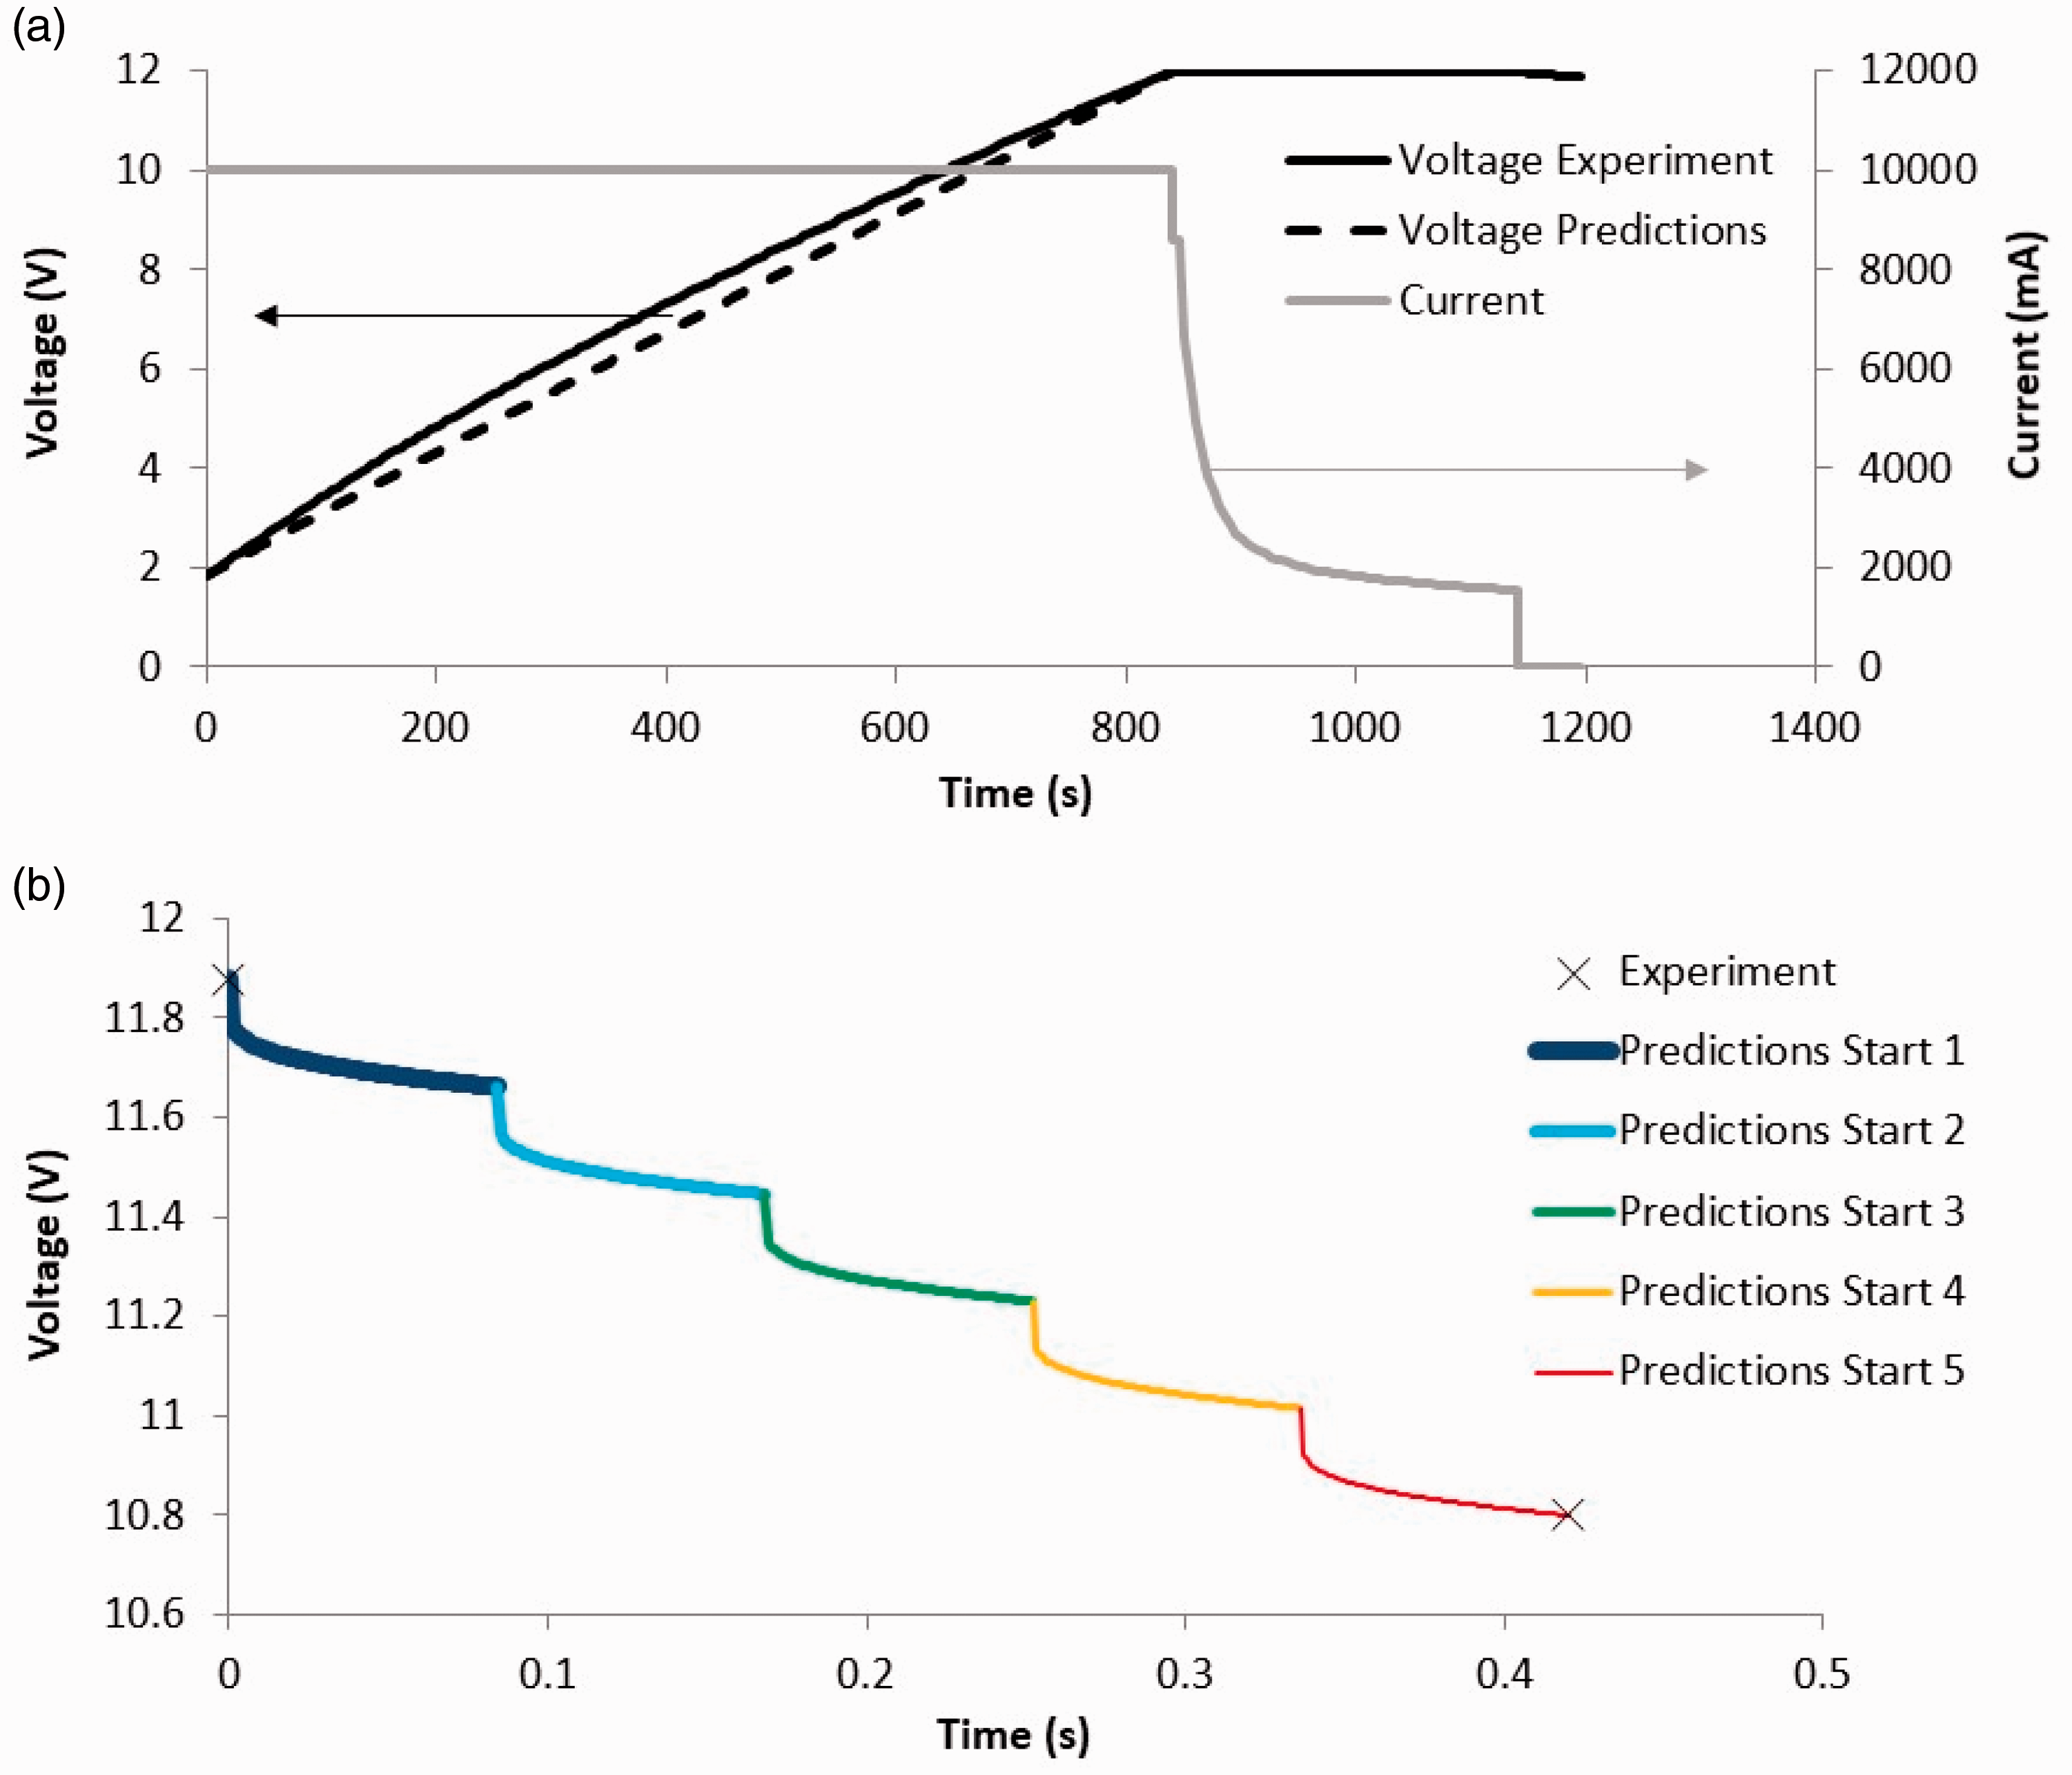
Then testing of the five EDLC system discharge was carried out in five consecutive start–stop tests of a two-cylinder diesel engine via a 12 V, 0.9 kW starter motor. The voltage of the five EDLC power system was measured at the start as 11.88 V and at the end of the five consecutive start–stop tests as 10.8 V. Assuming that the motor ran at its maximum power of 0.9 kW and at an average voltage of 11.34 V, an average current of 79.36 A is assumed. Running the computer code of the hierarchical composite EDLC model (Figure 2) yields the predictions of the voltage profile against time for the five consecutive start–stop tests, the results of which are presented in Figure 7(b). The model captures the ESR-related voltage drop at 79.36 A at the beginning of each start, which seems to be the dominant factor for the voltage drop at each start test. The predicted time duration of each start test is 0.084 s and the predicted total duration of five consecutive start pulses is 0.42 s which is below the maximum pulse duration of 2 s specified by the FreedomCAR project of the USABC. 1 The sound recording in the recorded videos of the five consecutive start–stop tests indicates an engine start time of less than 0.2 s for each start (with the video running at 0.25× the full speed), but the poor time resolution between audio/video frame scenes has made it impossible to resolve time below 0.2 s in order to be able to validate the model predictions.
An ecological assessment has been carried out by our group regarding the production of the supercapacitor of this study with calculations regarding the cumulative energy demand 34 and the global-warming potential (GWP) in terms of CO2 equivalent. 35 Further to this study, another study on the recycling of the composite supercapacitors established the protocol 36 of disassembling the cell, 37 washing the components, dissolving the polymer binder from the electrode coatings38,39 and separating the solid carbonaceous materials of the electrode coatings via dielectrophoresis. 40 A life cycle analysis of activated carbon based supercapacitors, considering that they are recycled at the end of their life, yielded a GWP of 17 kg CO2 eq. 35 for a supercapacitor equivalent to an EDLC of 555 g in this study.
Conclusions
A transient 12 V TSS power system, consisting of novel application-specific composite EDLCs was designed, modelled and scaled up in fabrication from small laboratory cells to large pouch cells of more than 0.5 kg each. The design included optimisation of the composition of each composite EDLC, so that an application-specific device was proposed that satisfied the required energy-to-maximum power ratio in the specifications of the FreedomCAR USABC project 1 at minimum mass. An EEC model was suggested for each type of EDLC part in the composite EDLC, namely the high energy density EDLC part and the high power density EDLC part. The model parameters were fitted from the EIS data of small EDLCs and further validated in the comparison between predictions and experimental data of GCD cells for these small EDLCs. While there is some concern about applying data and models obtained for small cells, in the present study, the same fitted parameters of the same EEC model were applied for the large composite EDLC using a bottom-up model approach and associated algorithm to simulate the GCD of the large composite EDLC and there was very good agreement between the predictions and corresponding experimental data. A simulation run of a whole GCD cycle to yield the predictions in Figure 4 or Figure 5 takes about 1 min on a personal computer (PC) with an I3 processor, which makes the developed algorithm a valuable tool for the design of a supercapacitor pack for a power system.
Furthermore, the optimised design of the 12 V TSS and large composite EDLCs was based on the areal capacitance and areal resistance of the small laboratory cells, as derived from the GCD tests of the small cells. The performance of the fabricated large pouch cell composite EDLCs was confirmed to be as expected in terms of providing the designed power and energy density at the specified currents, from GCD tests. Hence, this proved the validity of the bottom-up design approach as well as the high quality in the fabrication procedures and the validity of the scaling up in fabrication. The system of the seven large composite EDLCs had the designed power and energy for the 12 V TSS system, and the total mass of the seven large EDLC was 3.94 kg, below the 5 kg limit set by the FreedomCAR USABC project. 1 Furthermore, the gravimetric efficiency of each large pouch cell composite EDLC (mass of active electrodes to total pouch cell mass, including all materials) was found to be about 25%. In the composition of the large pouch cell EDLC, the electrolyte was a little more than 50%.
The only indicator of underperformance of the large composite EDLC was in the self-discharge test, in which 24% self-discharge was determined after 72 h, against the specification of 4% in the FreedomCAR USABC project. 1 That is attributed to the narrow micropore size distribution of the high energy density electrode, which raises ion diffusion issues, usually associated with self-discharge. 41 However, it may be possible to reduce self-discharge; for example, by using 2% electrorheological additive in the electrolyte, as in Xia et al., 33 the self-discharge could be reduced by 80%.
Further proof of the high quality of fabrication and small variability between cells was the good performance of cell self-balancing, for four large composite EDLCs tested in series in the range of 0.29–8 V.
A 12 V start–stop test procedure was carried out, consisting of five consecutive start–stop tests of a two-cylinder diesel engine via a 12 V, 0.9 kW starter motor, and the voltage of the system of the five EDLCs was measured to fall from 11.88 V originally to 10.8 V at the end of the five consecutive start–stop tests. A computer simulation yielded the same voltage values with a predicted duration of 0.084 s for each start–stop test.
After the validation of the designed 12 V TSS power system in this study, based on a composite supercapacitor, work is expected to continue along three avenues: (a) the proposed system may be validated in real vehicle environment by industrial members; (b) hybrid battery–supercapacitor systems may be designed for electric vehicle applications or the grid, embedding a specially designed and optimised composite supercapacitor; (c) research is being carried out by the University of Surrey (led by C. Lekakou) on the development of a hybrid battery–supercapacitor, hybridised at material level, as in the composite supercapacitor.
Supplemental Material
sj-pdf-1-pia-10.1177_0957650920930166 - Supplemental material for Development and evaluation of a composite supercapacitor-based 12 V transient start–stop power system for vehicles: Modelling, design and fabrication scaling up
Supplemental material, sj-pdf-1-pia-10.1177_0957650920930166 for Development and evaluation of a composite supercapacitor-based 12 V transient start–stop power system for vehicles: Modelling, design and fabrication scaling up by Chunhong Lei, Richard Fields, Peter Wilson, Constantina Lekakou, Negar Amini, Stephen Tennison, John Perry, Michele Gosso and Brunetto Martorana in Proceedings of the Institution of Mechanical Engineers, Part A: Journal of Power and Energy
Footnotes
Declaration of Conflicting Interests
The author(s) declared no potential conflicts of interest with respect to the research, authorship, and/or publication of this article.
Funding
The author(s) disclosed receipt of the following financial support for the research, authorship, and/or publication of this article: This study has been partially funded by the European FP7 project AUTOSUPERCAP, GA No 266097.
Supplemental Material
Supplemental material for this article is available online.
Appendix
References
Supplementary Material
Please find the following supplemental material available below.
For Open Access articles published under a Creative Commons License, all supplemental material carries the same license as the article it is associated with.
For non-Open Access articles published, all supplemental material carries a non-exclusive license, and permission requests for re-use of supplemental material or any part of supplemental material shall be sent directly to the copyright owner as specified in the copyright notice associated with the article.