
Abstract
Industrial gas turbines are now required to operate more flexibly as a result of incentives and priorities given to renewable forms of energy. This study considers the extraction of compressed air from the gas turbine; it is implemented to store heat energy at periods of a surplus power supply and the reinjection at peak demand. Using an in-house engine performance simulation code, extractions and injections are investigated for a range of flows and for varied rear stage bleeding locations. Inter-stage bleeding is seen to unload the stage of extraction towards choke, while loading the subsequent stages, pushing them towards stall. Extracting after the last stage is shown to be appropriate for a wider range of flows: up to 15% of the compressor inlet flow. Injecting in this location at high flows pushes the closest stage towards stall. The same effect is observed in all the stages but to a lesser magnitude. Up to 17.5% injection seems allowable before compressor stalls; however, a more conservative estimate is expected with higher fidelity models. The study also shows an increase in performance with a rise in flow injection. Varying the design stage pressure ratio distribution brought about an improvement in the stall margin utilized, only for high extraction.
Introduction
The increasing adoption of renewable forms of energy in many parts of the world is changing the role of industrial gas turbines (GT) in the energy market. With renewables given priority in European electricity grids, many GTs no longer operate at continuous baseload and, in some cases, operate only a few hours a day, during peak demand. Nevertheless, the intermittency of renewables creates an opportunity for GT as a back-up and to ensure better grid stability that could be achieved with improved ramp-up capabilities.
The idea of storing extracted compressed air with high heat energy from the GT during periods of an oversupply of power (relatively low power demand) can be beneficial for use in peak operations when it is more profitable. This can be used to offset downtime financial losses related to fewer hours of engine operation that is particularly attractive for the ancillary service market. Integrating GT to compressed air energy storage (CAES) involves two main operations for the engine; these are the extraction of compressed air which involves charging the energy store and the injection of the stored air into the GT, which effectively discharges the energy store. The former can be applied in the extension of the minimum turndown of the engine (an additional degree of freedom to the variable inlet guide vanes), while the latter can offer improved ramp rate and for power augmentation. Of these three capabilities, only the steady-state air extraction at full load (not the minimum environmental load capability) and steady-state air injection – augmentation (not ramp rate capability) have been explored and are the focus of this paper.
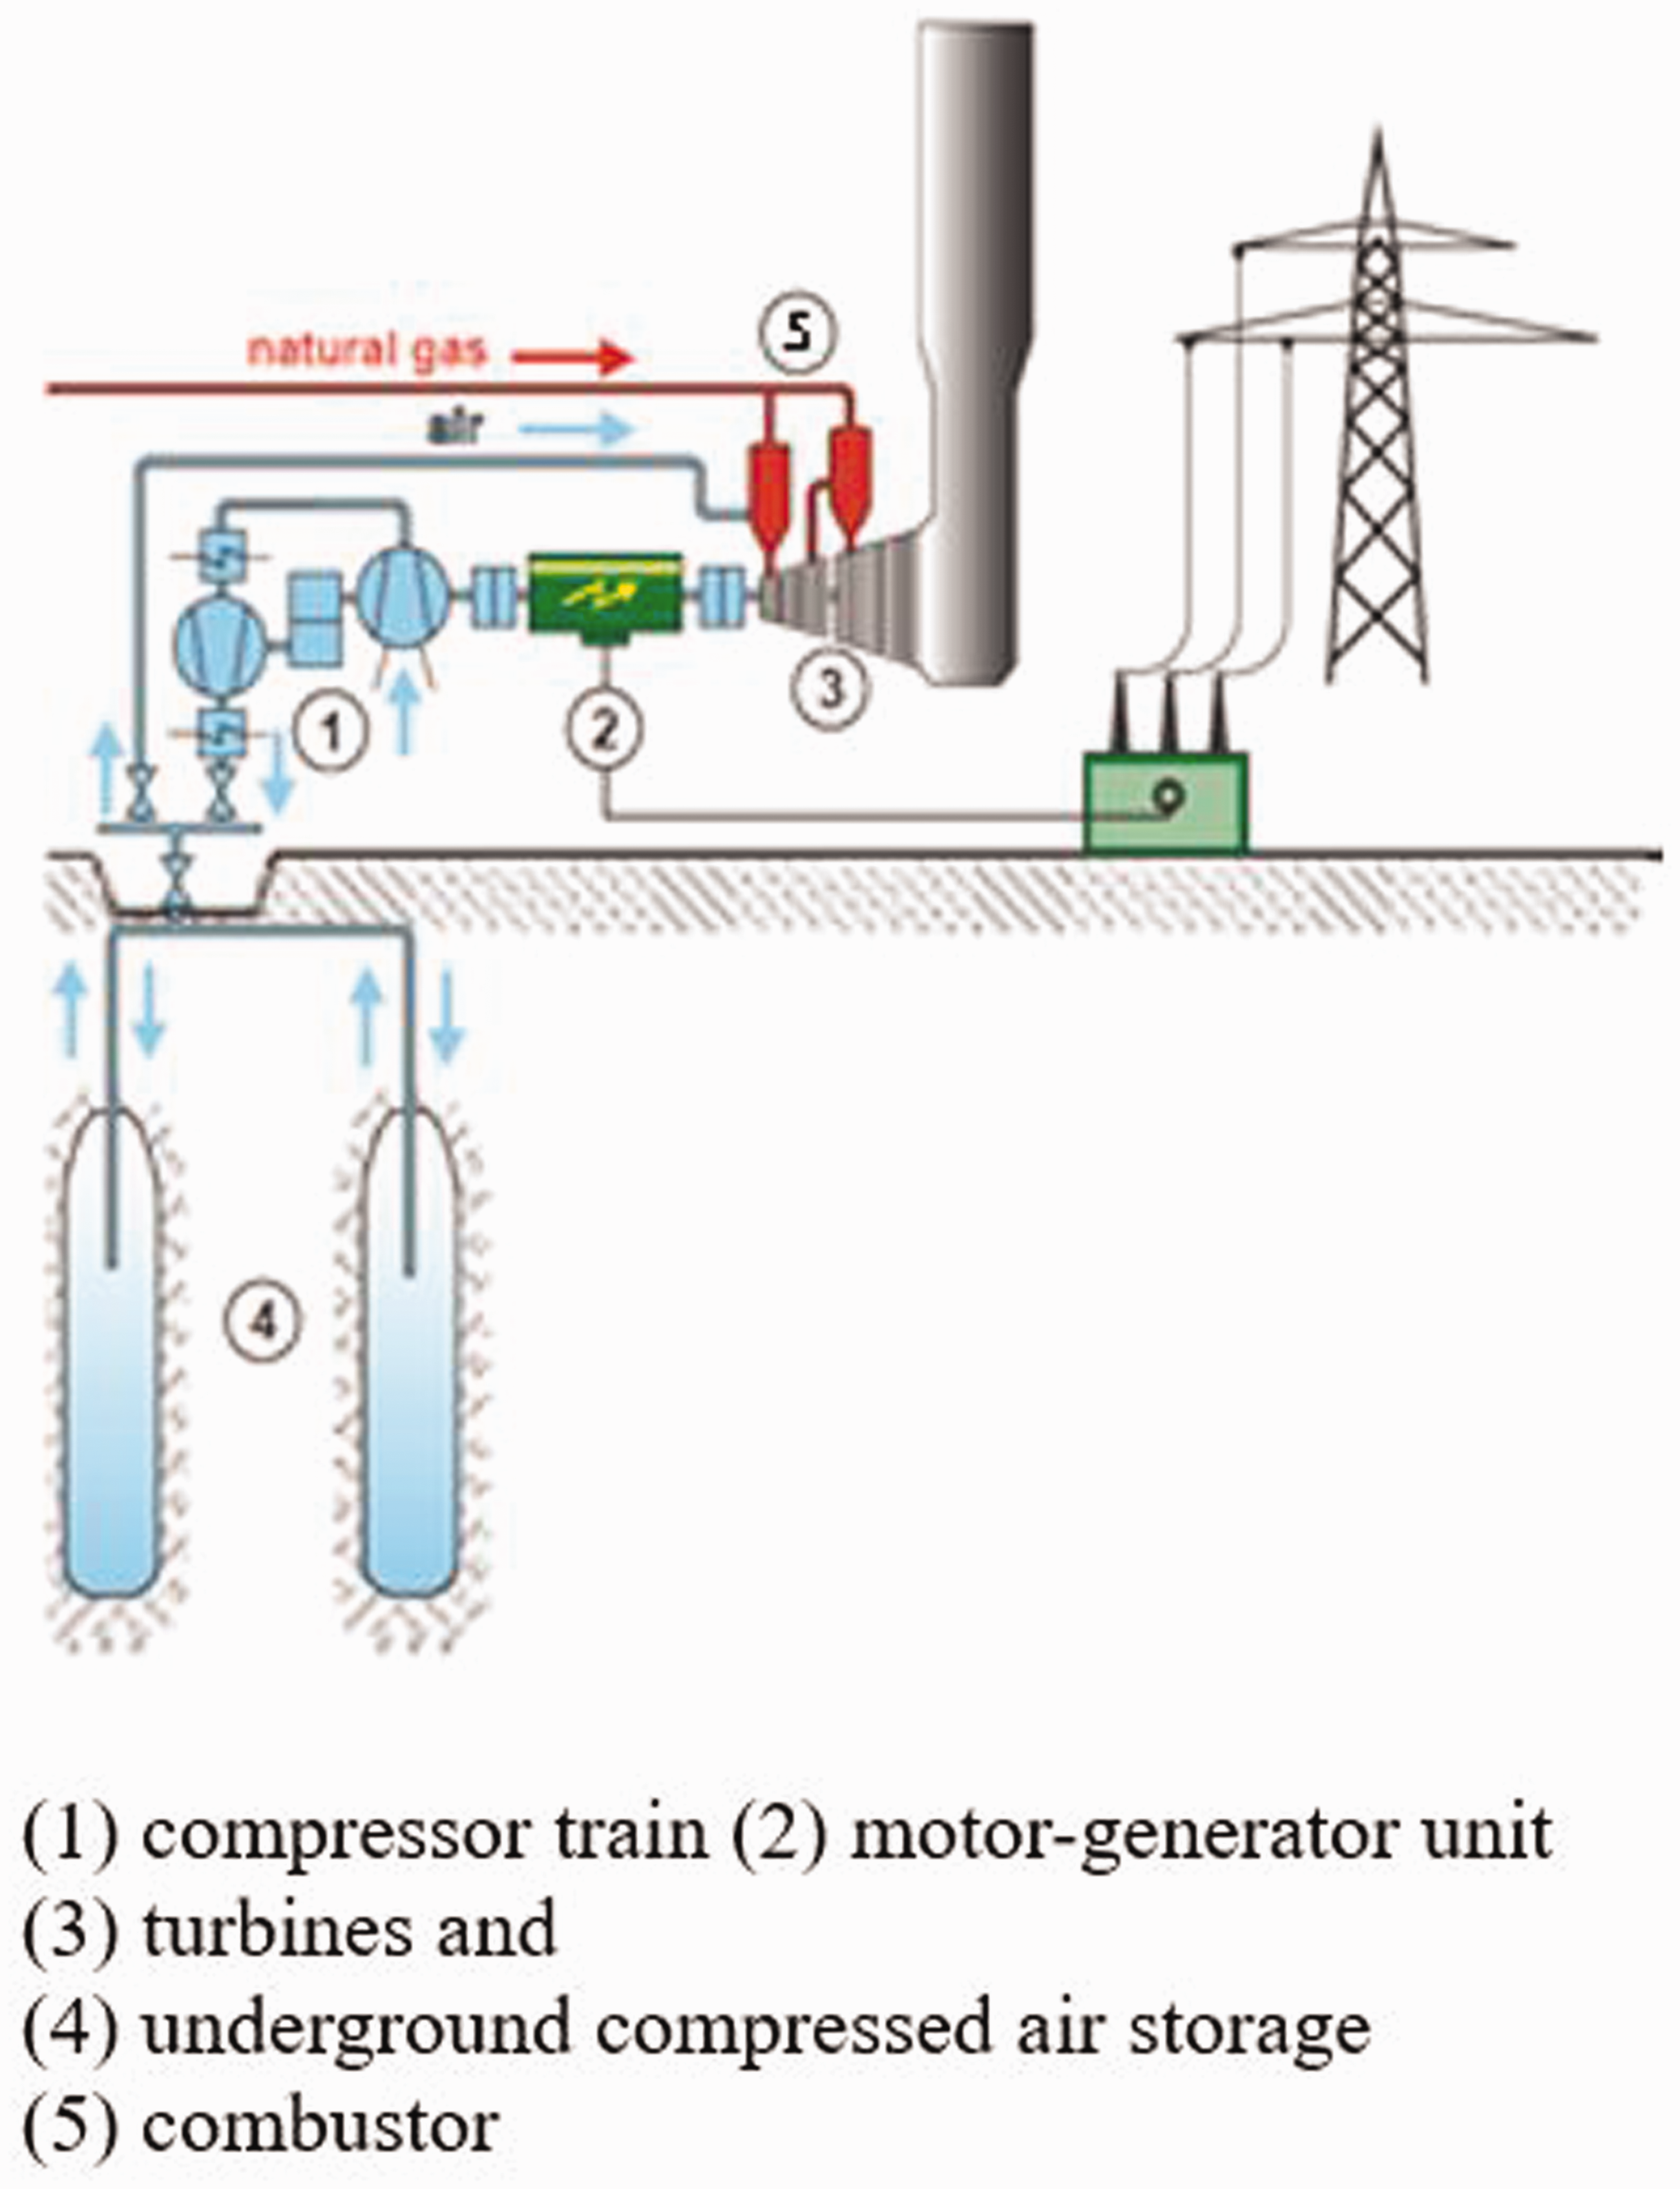
To date, two power plants have operated on diabatic CAES technology. The first is the Huntorf power plant commissioned in 1978 in Germany. This air-storage compressor and turbine power plant consist of two caverns with a total volume of approximately 300,000 m3 air reservoir with a maximum storage pressure of 70 bar. These caverns were formed by leaching out salt deposits below the earth surface between 650 and 800 m. It is a 290 MW power plant that consists of a compressor and turbine that are configured in such a way that during periods of air storage, the generator acts as a motor, therefore driving the compressor as depicted in Figure 1. At peak periods, the stored air gets reversed into the combustion chamber after which it gets expanded in the two-stage turbine that spins the generator to produce electricity for a maximum of 3 h. Crotogino et al.
1
highlighted the application in a coal power plant for minute reserve and peak shaving at evenings when there is no longer pumped hydro capacity. The second application of CAES is the 110 MW McIntosh power station that was commissioned in 1991 in the United States.
2
Similarly, the air is stored in an airtight salt cavern and, during power generation from the turbines, can operate for 26 h continuously as a result of the larger storage volume before drawdown.
Components and arrangement of CAES.
1
A research study by Budt et al. 3 presents a comprehensive review of CAES approaches, providing classification and comparison of the processes, based on their idealised change of state (diabatic, adiabatic and isothermal). The study also reviews different configurations of the decoupled compression and expansion cycle of a combustion turbine, highlighting the possible increase in compressor and expansion efficiencies when operating at elevated rotational speeds. Cárdenas et al. 4 show that increasing the number of compression stages is beneficial with intermediate isobaric cooling to low temperature; though it reduces the temperatures, the overall pressure ratio (PR) increases. This study shows that more fraction of exergy stored as heat increases in this configuration and allows for a reduced storage volume. It also shows improvements in exergy with preheating of air with and a variation in the configuration. Nevertheless, this type of study does not mention extraction as all of the compressed air is used for storage.
Despite the two actual applications of flow extraction and injection for the decoupled compressor and turbine machinery, this capability has not been tested on a conventional GT engine setup (with compressor and turbine on the same shaft) that will require other auxiliary devices. This is now being considered as a GT flexible solution that is of interest to existing users and manufacturers of GT. Brinckerhoff’s
5
report reflects the opportunities for GT, for a system referred to as gas turbine integrated storage (GTI-storage). This report shows the extraction and injection of the air in the GT engine occurring at the end of the compressor, before the combustor section. As in this case, having a compressor and turbine on the same shaft limits the range of operations of the respective components, as a result of the necessary turbomachinery matching. This is also separate from the fact that in most operations for power generation, the rotational speed (3000 or 3600 r/min) is approximately constant to ensure synchronisation with the electrical grid. The basic rule that governs the matching of the turbomachinery components is: the requirement for compatibility of mass flow, compatibility of rotational speed and that of the work between the compressor, turbine and load. These are indicated in the non-dimensional form for mass flow and speed, respectively, as


While the work balance equation is

The implication of equations (1) to (3) is that the operation of the individual component is dependent on the other as well as the corresponding overall performance. This is not the case for the configuration applied in Huntorf power plant and McIntosh power station where the compressor and turbine operate independently. This matching described here is key to the off-design performance prediction of GT and becomes more crucial when evaluating highly off-design scenarios, like possible high flow extractions or injections. Very few studies have investigated the conventional GT system with CAES. This includes Salvini
6
that shows the performance of a 4.6 MW recuperated plant in combination with an additional external compressor with storage reservoir in one configuration and further addition of heat exchanger and expander in the other. This study shows that when 14% of the inlet air flow is injected, the PO increases by 30% in the first arrangement, with a further 0.3 MW rise in the second layout. The injection is shown to take place after the compressor, where the stored air mixes with air flow in the GT compressor that subsequently passes through a preheater before the combustor. It is worth noting that the compressed air used is from the external compressor. The investigation indicates a storage efficiency of up to 70% at the maximum injection, owing to a greater power produced in relation to the absorbed work during charging plus fuel consumed. Wojcik and Wang
7
performed simulations on a heavy-duty GT in combined cycle and integrated with an adiabatic CAES. The reported storage volume is half of the Huntorf power plant and assumed to be over-ground storage in this case, with air storage pressure between 70 and 100 bar. This study was performed using EBSILON software, and the configuration developed incorporated intercoolers, aftercooler, additional compressors, expanders and pumps. The air extraction also occurs at the end of the GT compressor that acts as part of a compressor train with other external compressors on the same shaft as the engine. About 47.5% increase in power is recorded for the injection phase. This work also highlights the overall implications for the GT and the efficiency of the CAES, indicating a reduced plant efficiency in the proposed setup. Other studies8,9 also show the impact of the GT in other CAES configurations. Nevertheless, these described studies focus mostly on energy/work balance models and do not account for detailed characteristics matching of the compressor and the turbine; i.e. the explicit requirement of equations (1) to (3), as applied in the modelling in the present study. The implication of this approach is that there is a unique set of operating conditions to satisfy the mentioned constraint for every steady-state operating point. As such, it becomes imperative to adequately identify these conditions using the set of simultaneous non-linear equations (of several unknowns) that embodies the behaviour of the component. An iterative approach is necessary to arrive at a converged and more realistic off-design solution. No GT-CAES study has evaluated the implications of extraction and injection using the described approach (that includes the first two equations, which capture turbomachinery effects) and alongside having separate compressor stages (of individual characteristic maps and their respective stall margins utilized); till date, studies in open literature analyse the GT compressor as one brick. In addition, a variation of the compressor design has been considered by changing the multi-stage design PR distribution of the compressor to ascertain the variability of outcomes due to CAES demands. The overall modelling approach for this stand-alone GT study allows for a better assessment of flow extraction and injection effects and their limits, when conducting the low-fidelity assessment. The following are the new insights not previously presented in open literature; these are:
compressor stage-by-stage performance and characteristic effects (stall and choke) related to varied flow extractions and locations and last stage injections; impact of multi-stage PR distribution on limits for flow extraction and injection; impact of varied control constraint and injection temperatures.
Methodology and engine specification
The tool utilised to assess the engine performance is TURBOMATCH, an in-house software developed in Cranfield University. The calculation procedure is based on satisfying the compatibility of rotational speed and mass flow continuity between the compressor and the turbine. Based on this, the zero-dimensional programme sets a number of equations and variables dependent on the engine model constraints and design/configuration to iteratively solve the non-linear equations using the Newton–Raphson method. The code also uses embedded standard component maps and scales the selected map to match the user-design point specification of PRs, component efficiencies and air flows. This is achieved by a scaling factor (SF) that relates these specified parameters against the corresponding values of the standard map as indicated in equations (4) to (6). This scaling procedure is useful in the absence of having the actual component maps that are proprietary information of engine manufacturers. Further details of the TURBOMATCH calculations can be found in MacMillan
10
and Pellegrini et al.
11


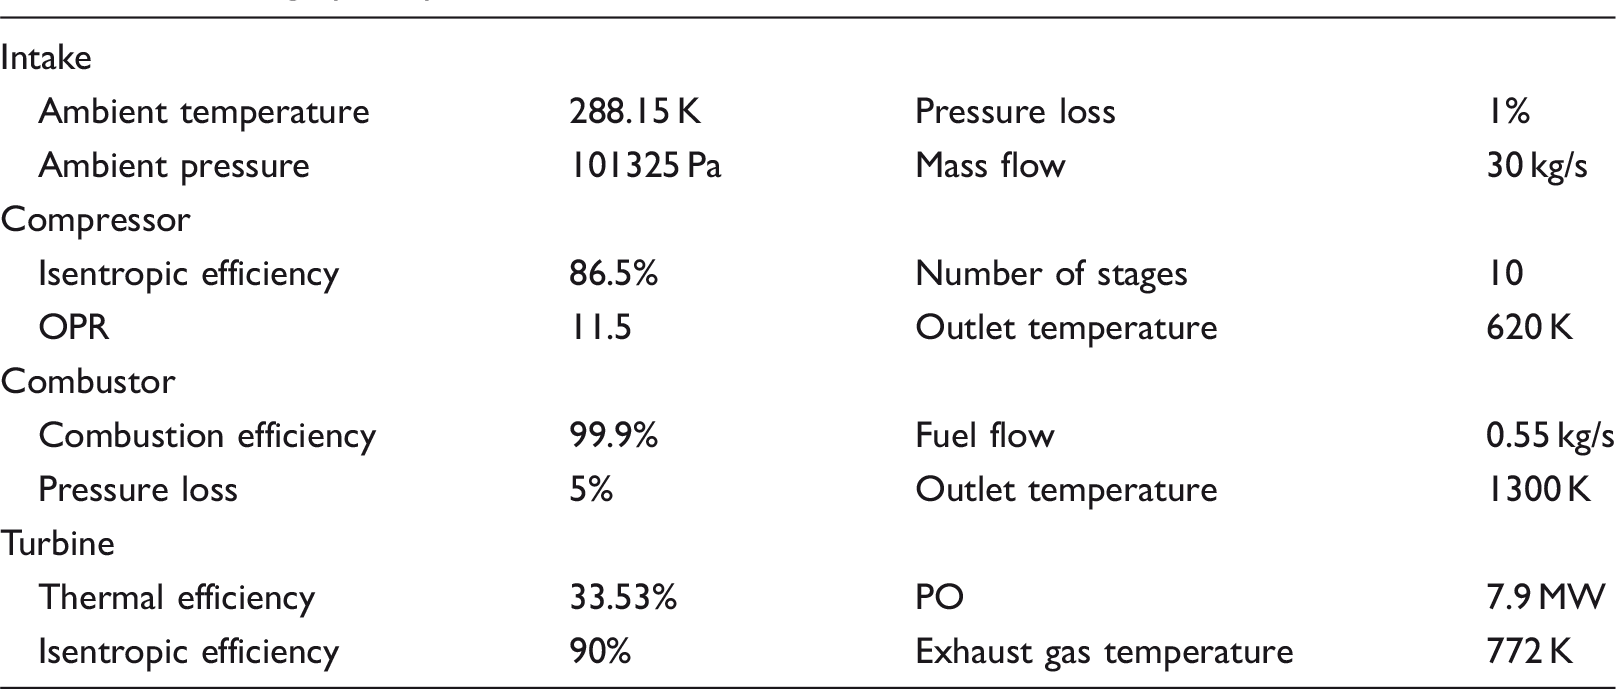
GT design point parameters at ISA condition.
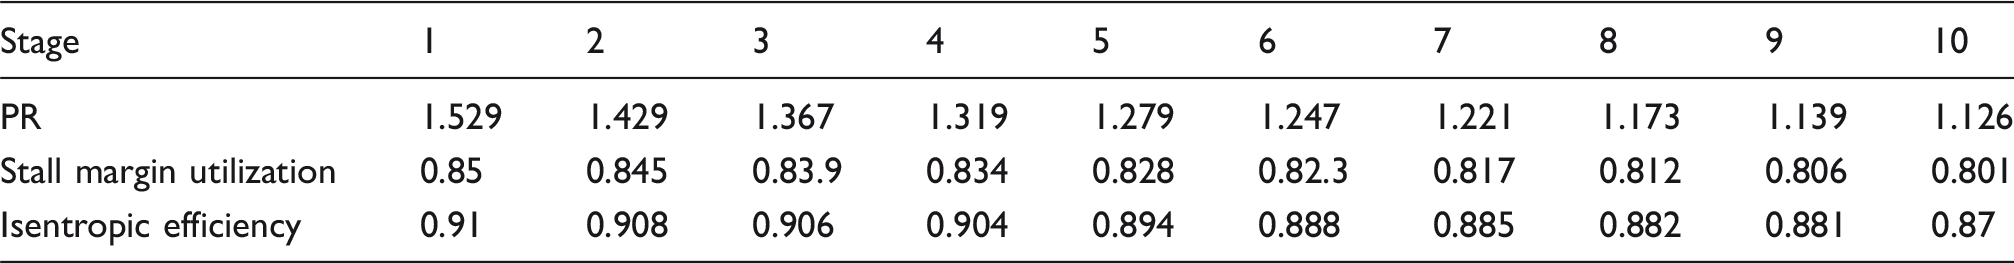
Stage-by-stage performance specification at the design point.
Walsh and Fletcher
12
indicate a surge margin between 15 and 20% as typical for individual stages of axial compressor applicable to power generation. This paper applies this range and adopts a stall margin utilisation factor (SMU) definition as expressed in equation (8). As such, a value towards one tends to stall and high SMU; towards zero, is in the direction of choke and low SMU. The first stage with the highest PR (typically aerodynamic loading) has been specified with the highest SMU. That of the subsequent stages: the middle and back stages that are associated with lower aerodynamic loading have been specified with lower PRs and SMU, due to their typically lower diffusion factor.

Flow extraction – charging
For air extraction, different amounts of air and stage locations have been considered to identify the best safe position to perform this. It is also of interest to identify the maximum amount to be extracted per stage without pushing the compressor into unsafe or unacceptable operating conditions based on SMU. The amount of air extraction considered is from 5 to 20% of the core mass flow (separate from bleed cooling) for locations behind stages 7–10. Only these stages are the focus, due to the interest in storing higher specific heat/energy related to higher temperatures. The extracted flow from the compressor is stored into a virtual tank, thereby reducing the engine model mass flow. However, this approach does not take into account the losses associated with air extraction. Subsequent stages downstream the extraction location operates under reduced mass flow, without some of the expected three-dimensional aerodynamic effects. Aerodynamic studies have shown that the impact of bleed can be beneficial in reducing the blockage effect that is dominant in the downstream stage of the compressor. This can improve the compressor stability when extracted uniformly/circumferentially as demonstrated by Grimshaw et al.
13
that shows an improvement in the stall inception when the flow is extracted in front of the rotor. In a similar but CFD study, Gou et al.
14
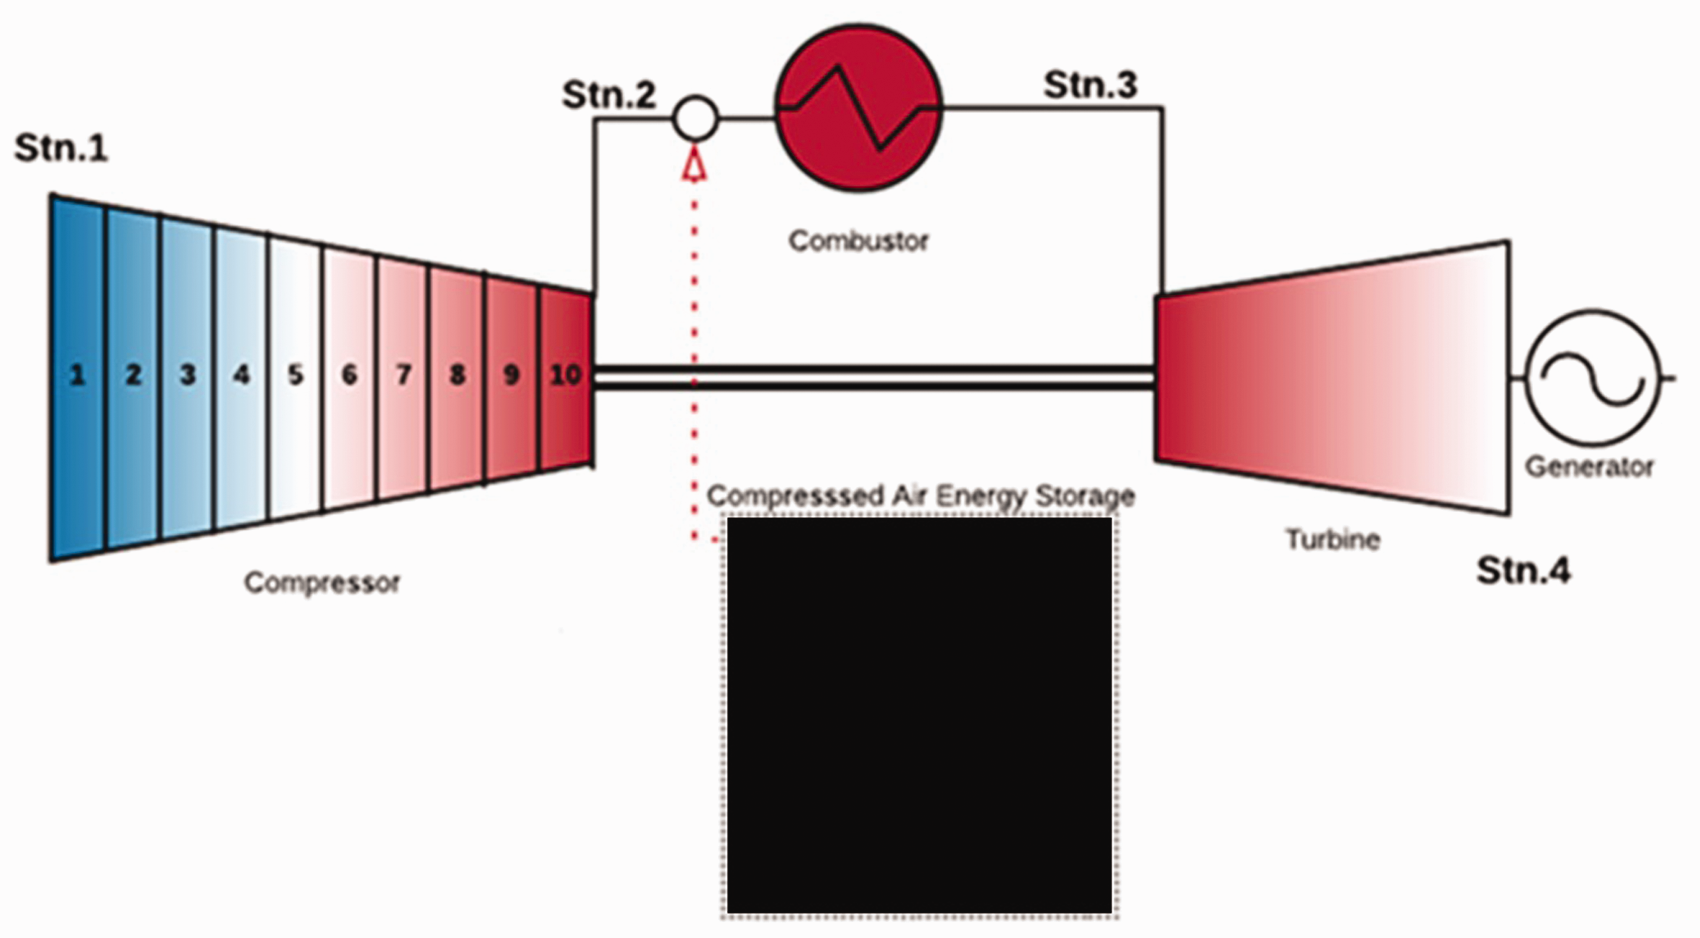
show that the extraction or bleeding brings about an increase in the stage isentropic efficiency, deterioration in the transport of the tip leakage flow to the rotor blade pressure side and a reduction in the blockage. Figure 2 is a simple depiction of the flow extraction locations of the CAES integrated with a GT. It also shows the different stations (stn) of inlet and outlets of the compressor, combustor and turbine, respectively.
GT integrated with CAES – extraction/charging mode.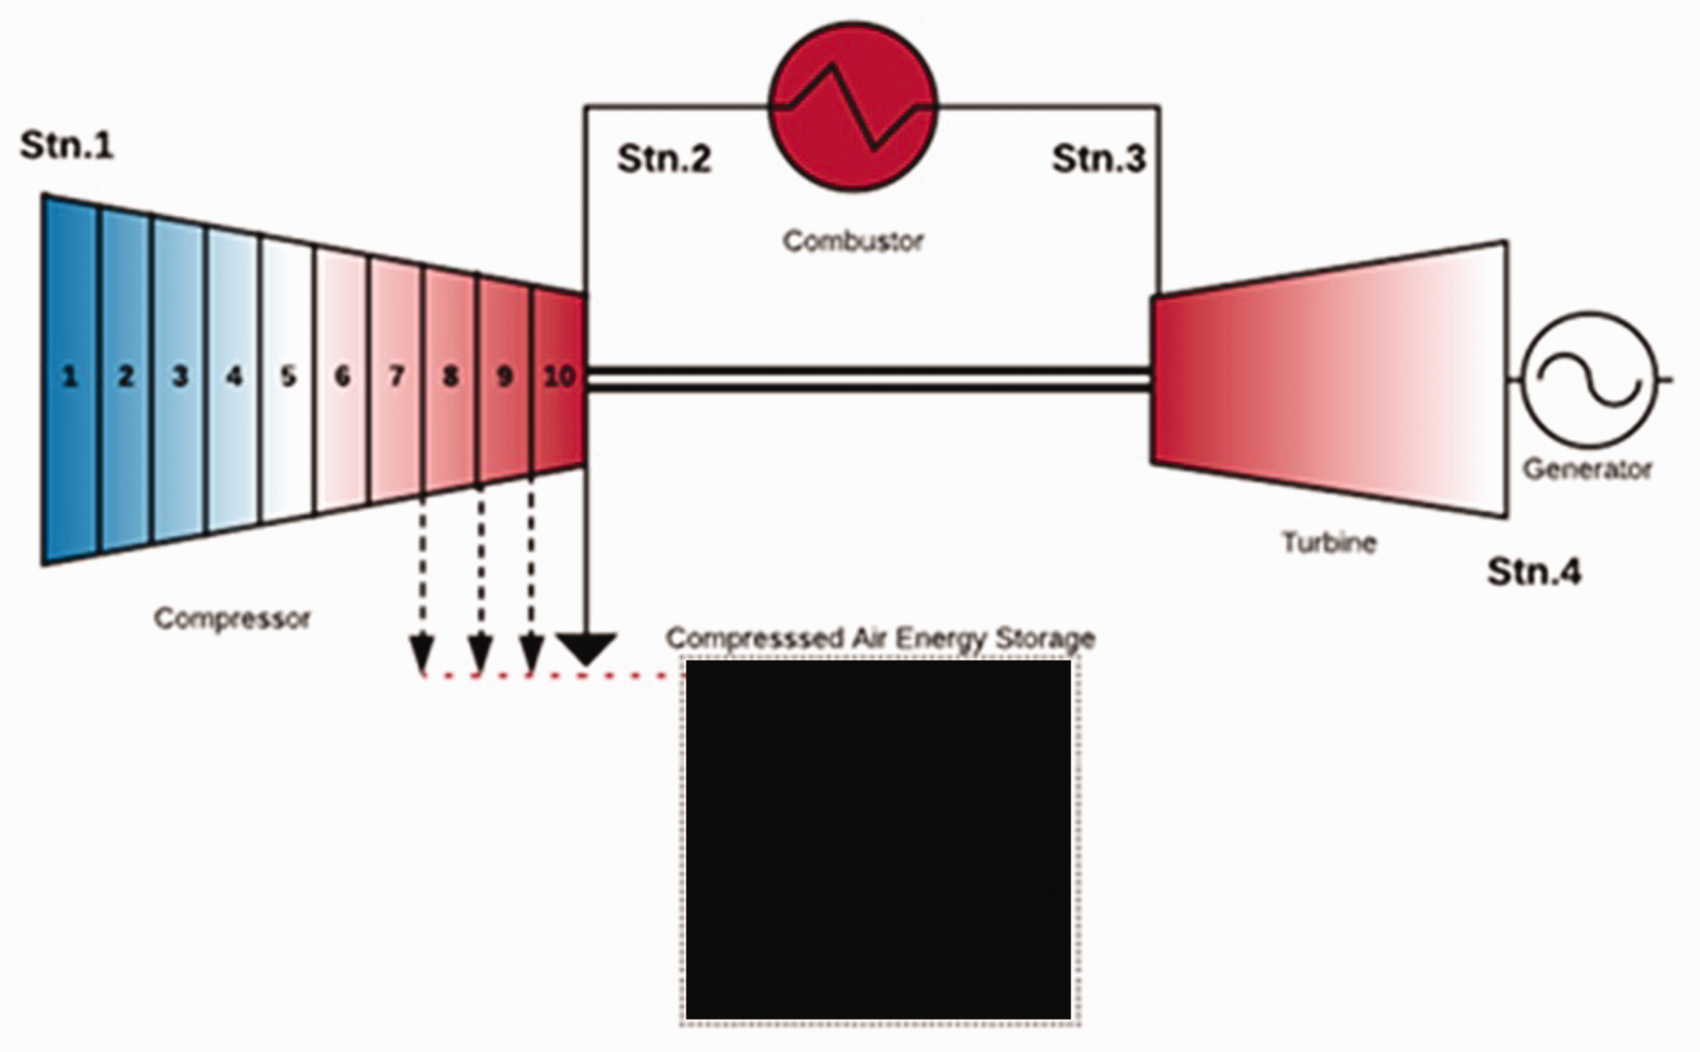
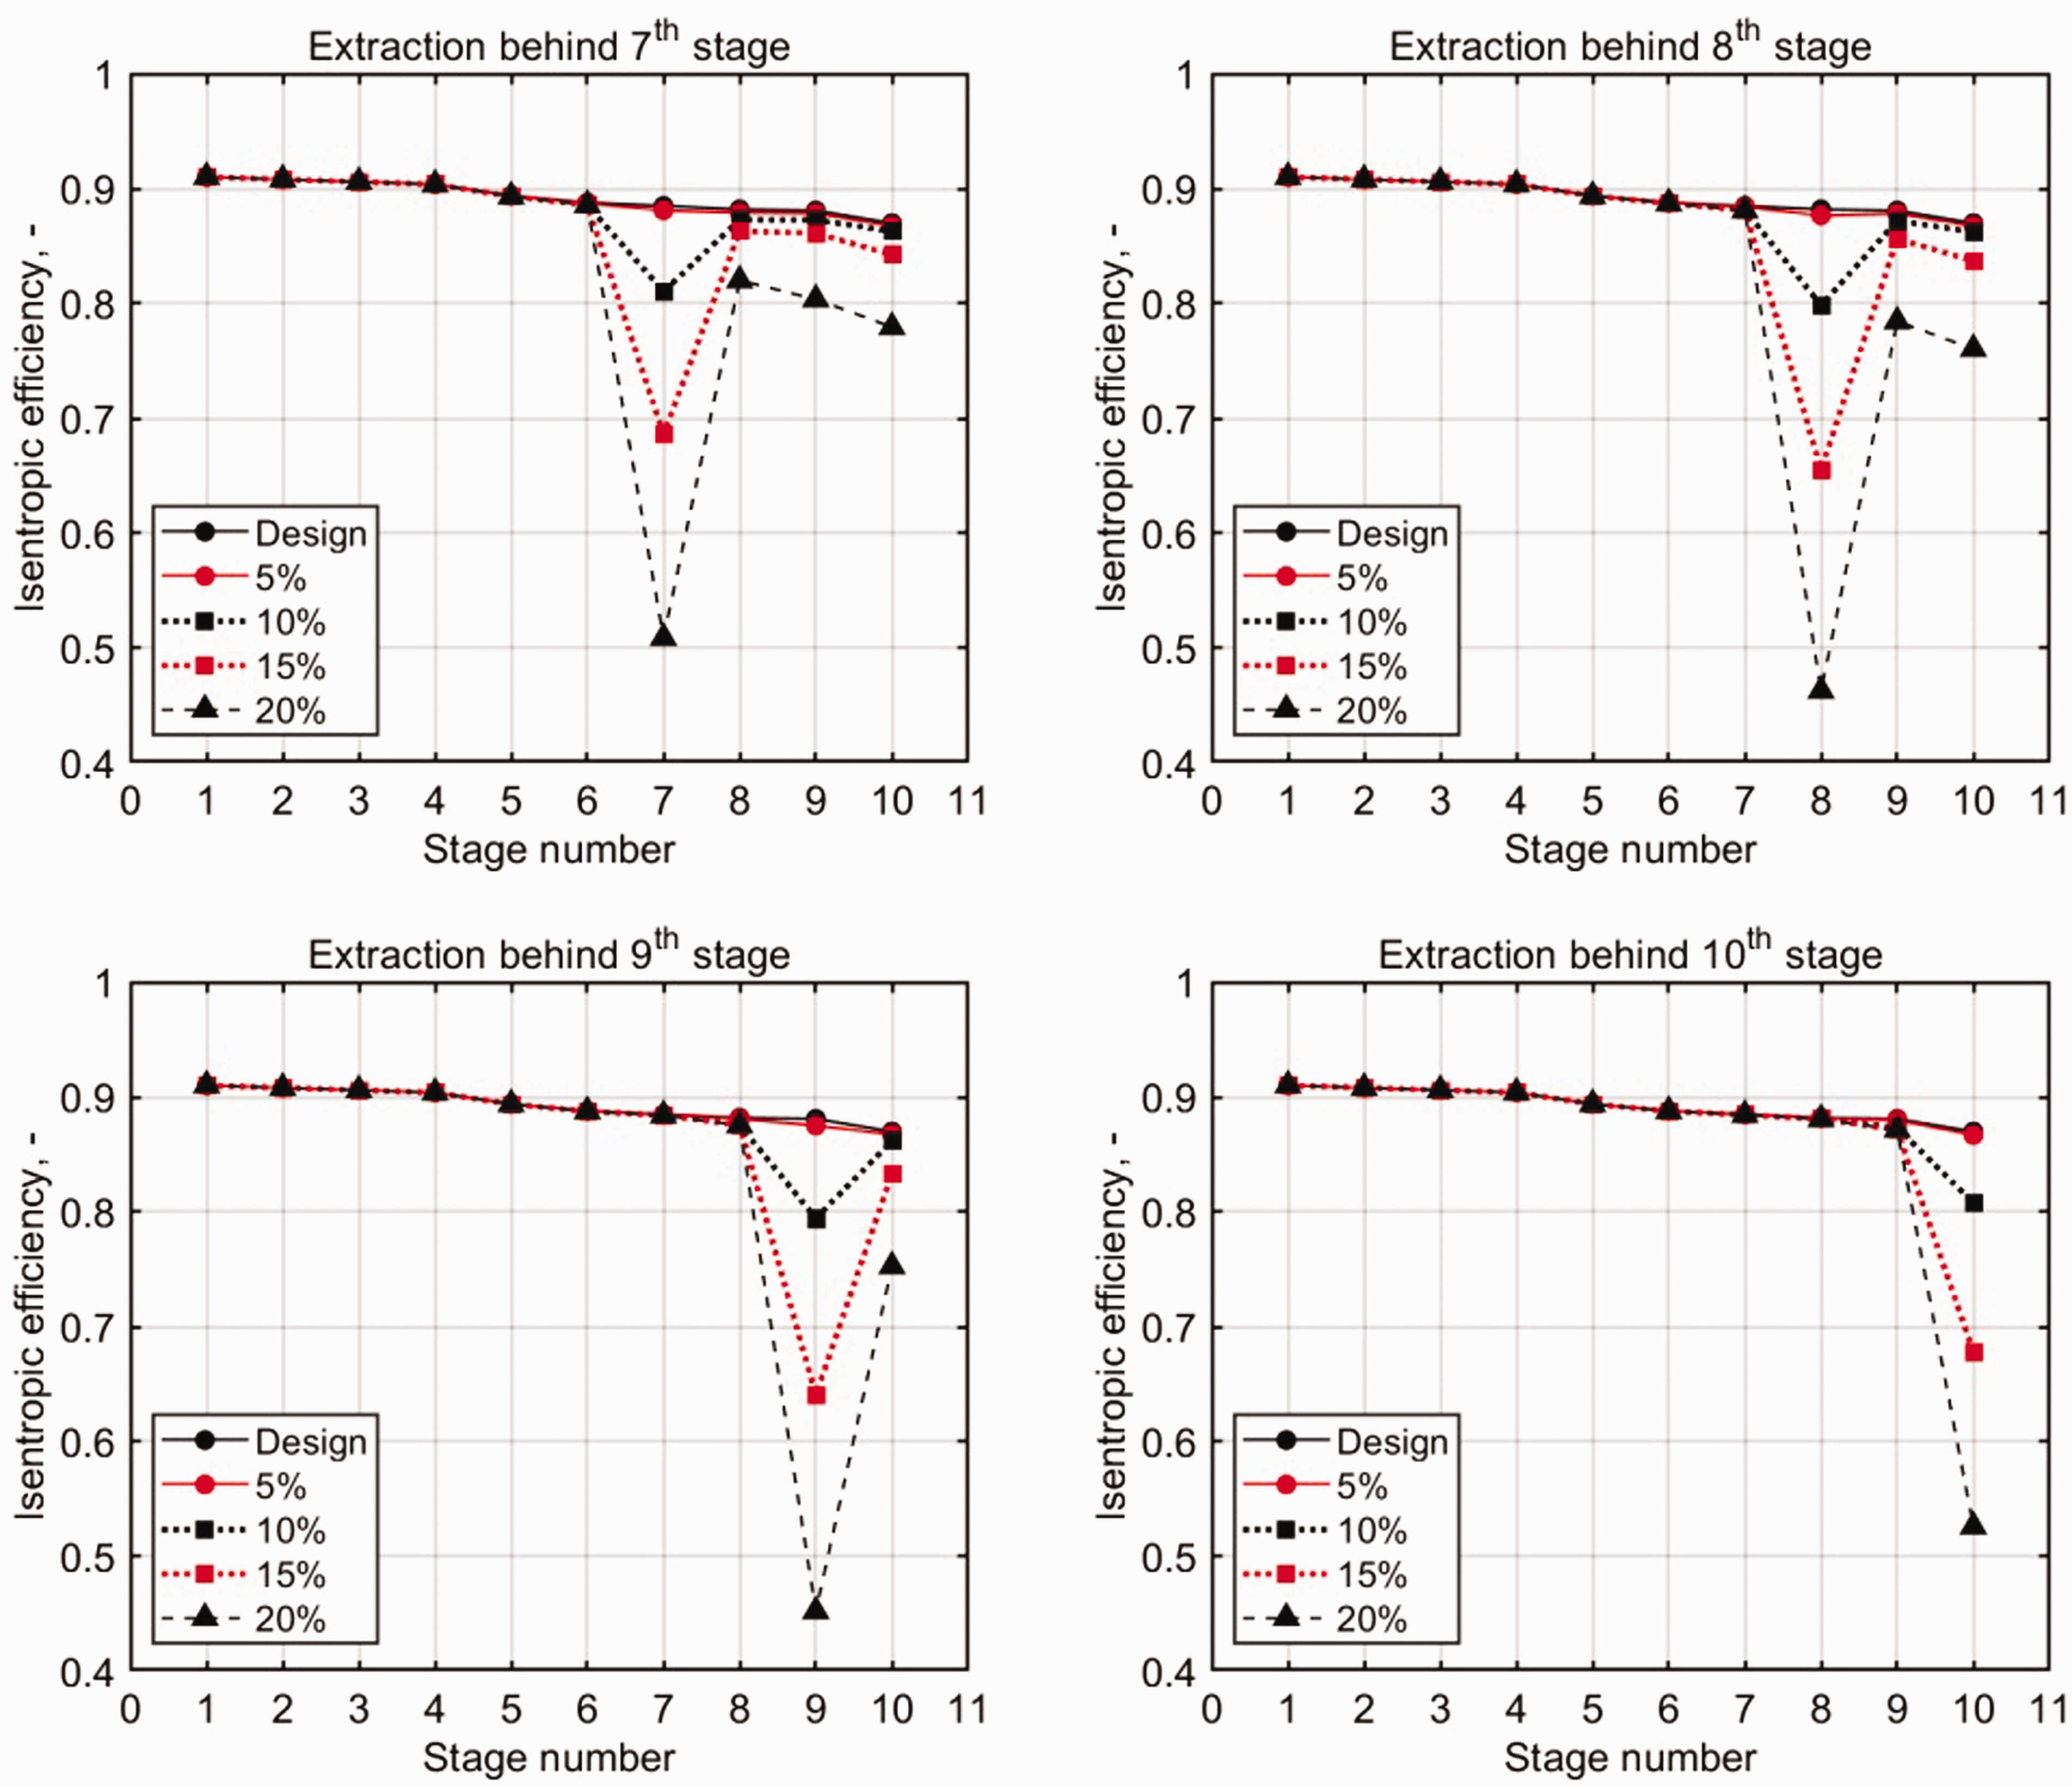
Figure 3 indicates the individual stage PR and SMU for respective flow extractions that occurs at the stage exit. The extraction values investigated here exceed those in the previously referred studies13,14 with a maximum of 5.2 and 6.2%, respectively. The plot of PR shows a drop in the value for the stage behind which the extraction or bleed occurs. This shows the tendency to push the subsequent stages towards a higher PR, therefore increasing their SMU, as shown. This figure suggests that the higher the extraction, the more loaded these subsequent stages will become. As such, stall is reached at least in one successive stage (for almost all the cases with 20% extraction). The only exception to this is when the extraction occurs behind the last stage 10. These effects are reduced by lowering the amount of flow extracted as shown, with the front stages significantly less affected, the farther away it is from the extraction location. For the extraction point, the SMU decreases with the operating point moving towards choke. This is due to pressure loss of extraction that result in a reduced PR of the stage. Below, a SMU of zero in the plots signifies operations outside of the map that will not be allowable, and a PR below one signifies an expansion. As such, 20% extraction will not be a realistic amount for extraction. The 15% bleed appears as the limit from the inference of these simulations. The influence on the individual stage isentropic efficiency is shown in Figure 17 of Appendix 1 that highlights the similar detrimental pattern with an increase in the bleed flows. It is important to highlight that the increased PR in the subsequent stage of extraction is a result of the reduced inlet air pressure and density to this stage. It is such that the non-dimensional or CMF increases due to a greater drop in inlet pressure than mass flow, while the temperature reduces.
Individual stage PR and SMU for varied flow extraction and location.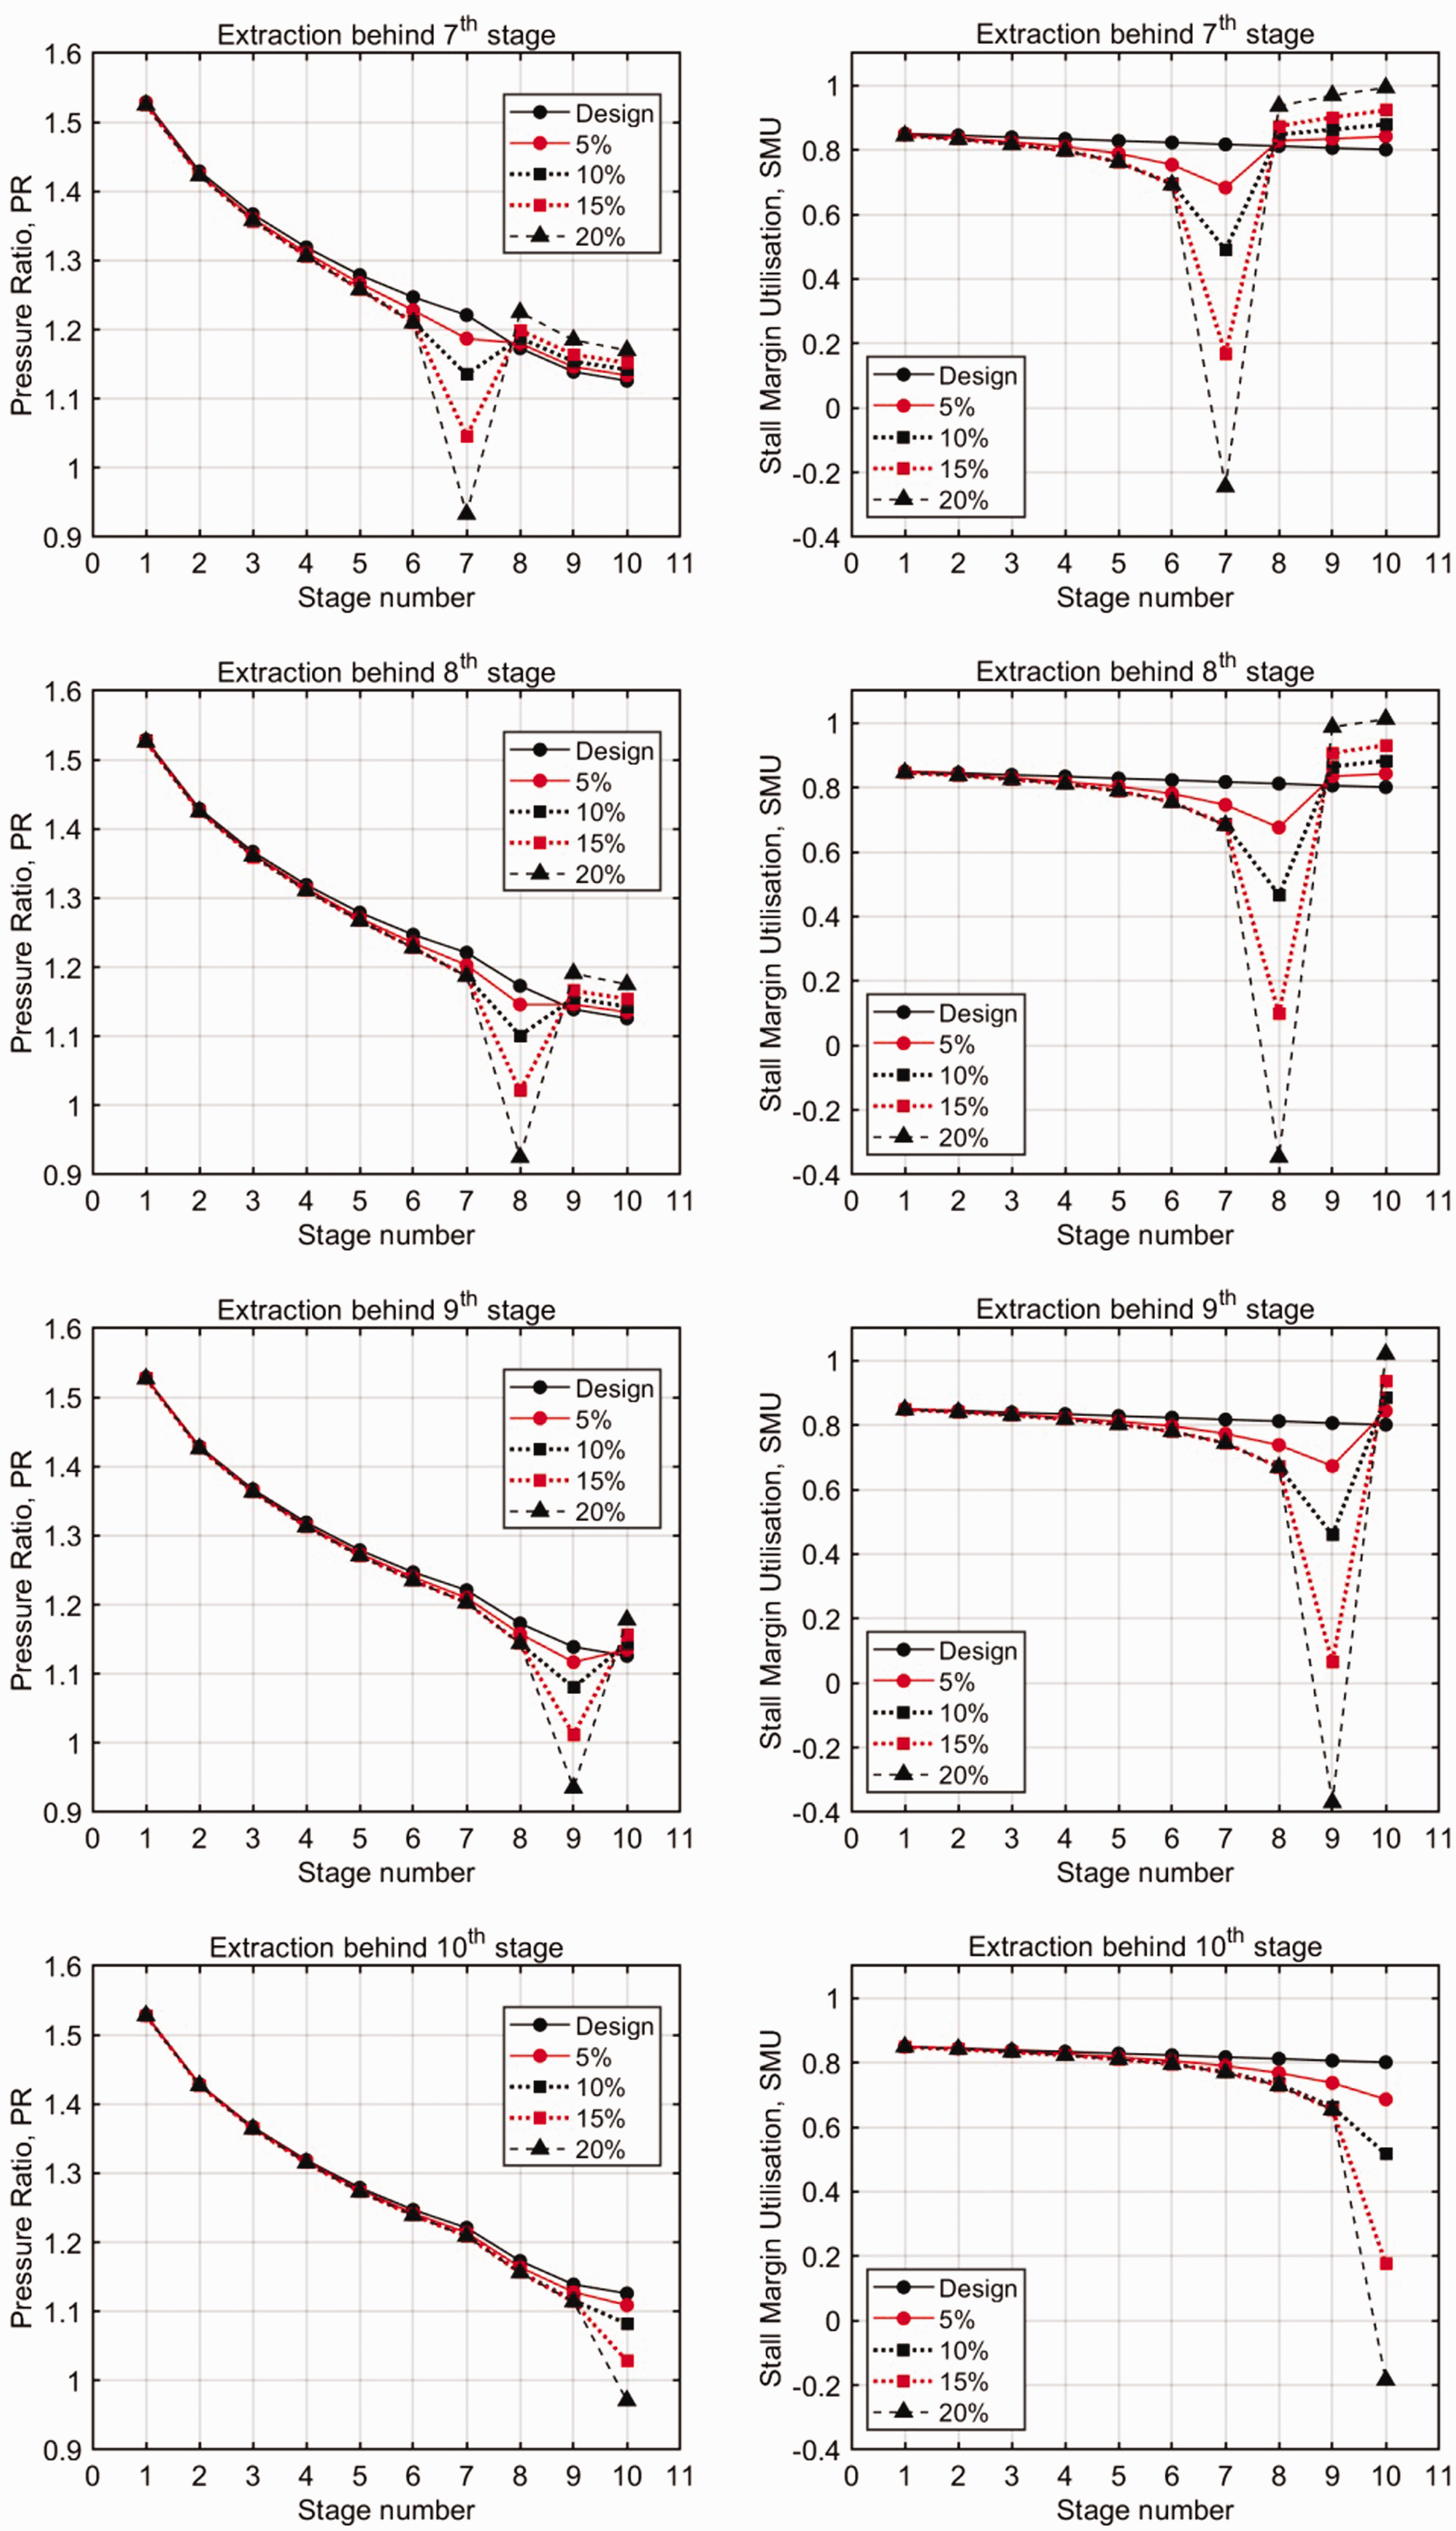
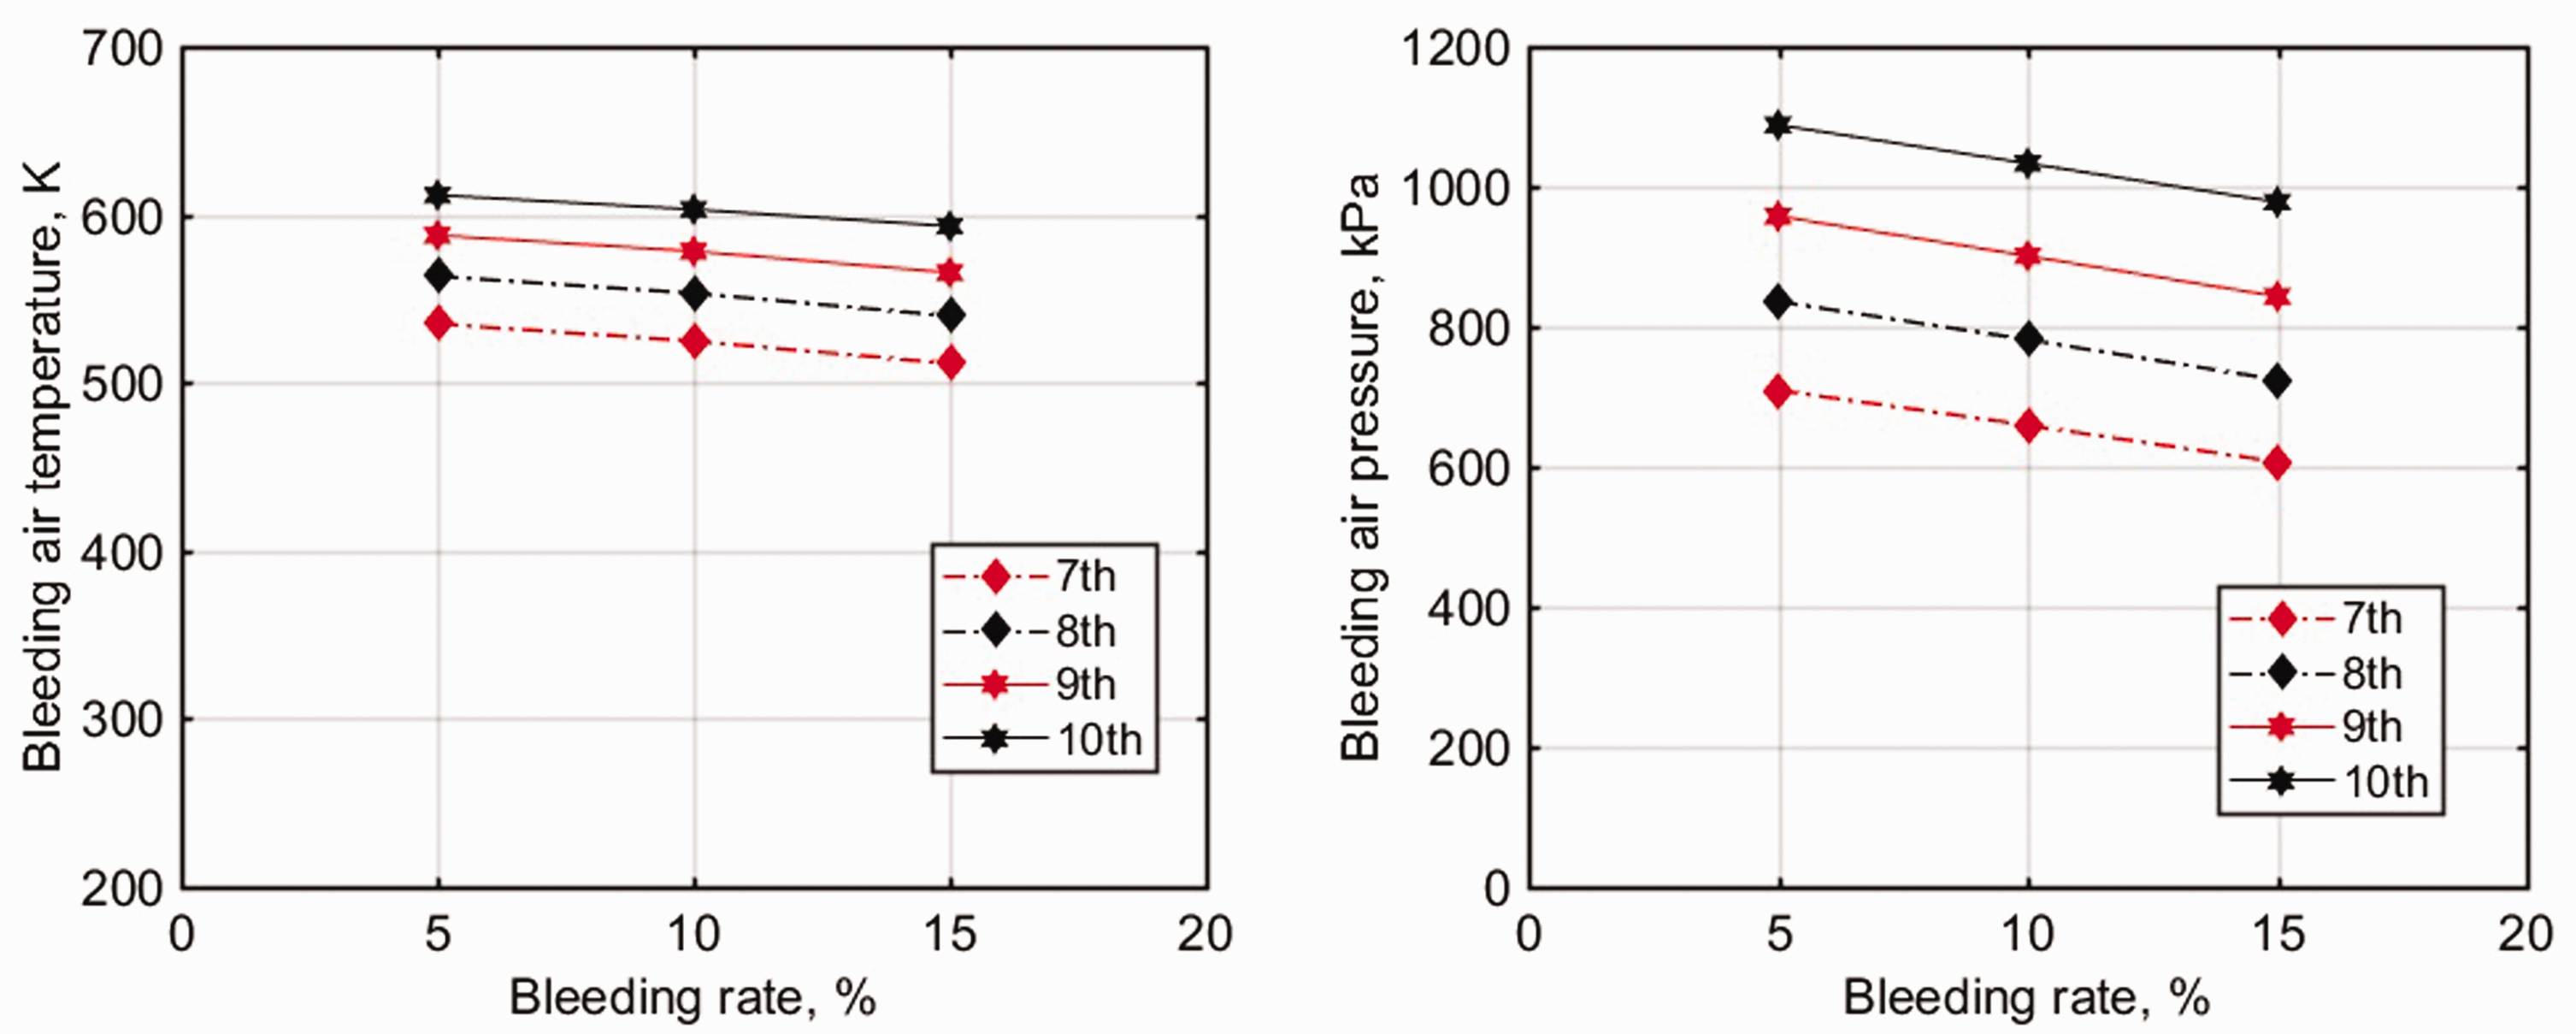
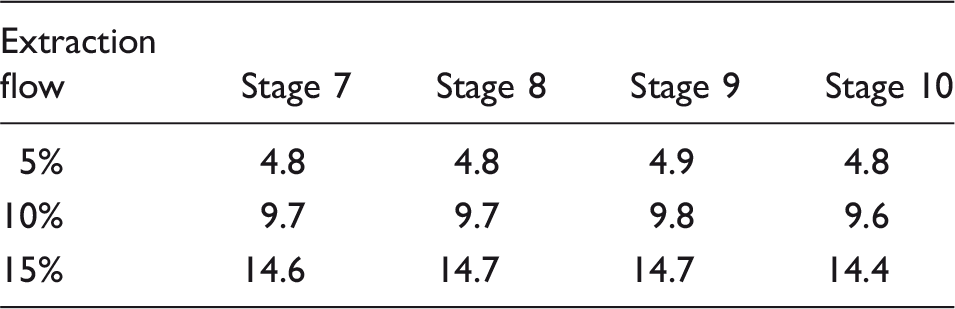
The overall performance changes as a result of these bleeds are presented in Figure 4 showing PO and thermal efficiency. This shows an increasing penalty on engine performance with the amount of extraction as expected (due to a higher mass flow reduction) as well as approaching the latter stage for extraction. The latter is primarily due to bleeding of higher pressure and temperature air as shown in Figure 5. In practice, the loss in power is not likely a concern, as it would be deployed typically when there is an oversupply of power. There are losses in thermal efficiency resulting in low power generated with relatively more fuel used to sustain the fixed COT requirement; this is also worse at high flow extractions. As indicated previously, the key objective is for the storage of compressed air at high temperature. The pressure of the extracted compressed air is also important, as the higher it is, the lesser the supplementary compressor power to pressurize the air in the CAES. Table 3 highlights the compressor percentage OPR reduction from the design value of 11.5. These reductions are influenced by reduced expansions in the turbine section that give rise to higher EGT. The highest value derived is a 22 K rise, for the 15% extraction at the last stage. The table also shows that the percentage OPR reduction is similar, irrespective of back extraction stage location, for the same quantity of bleed flow. This is mainly attributed to off-sets or a counterbalance in other stages when there is a reduction in PR at which stage is bled. The mass flow reduction based on the bleed amount proves to be the more dominant factor in the PO reduction.
Effect of extractions on PO and thermal efficiency for varied locations. Individual stage exit temperature and pressure for varied extraction and location. % OPR reduction for varied flow extraction and location.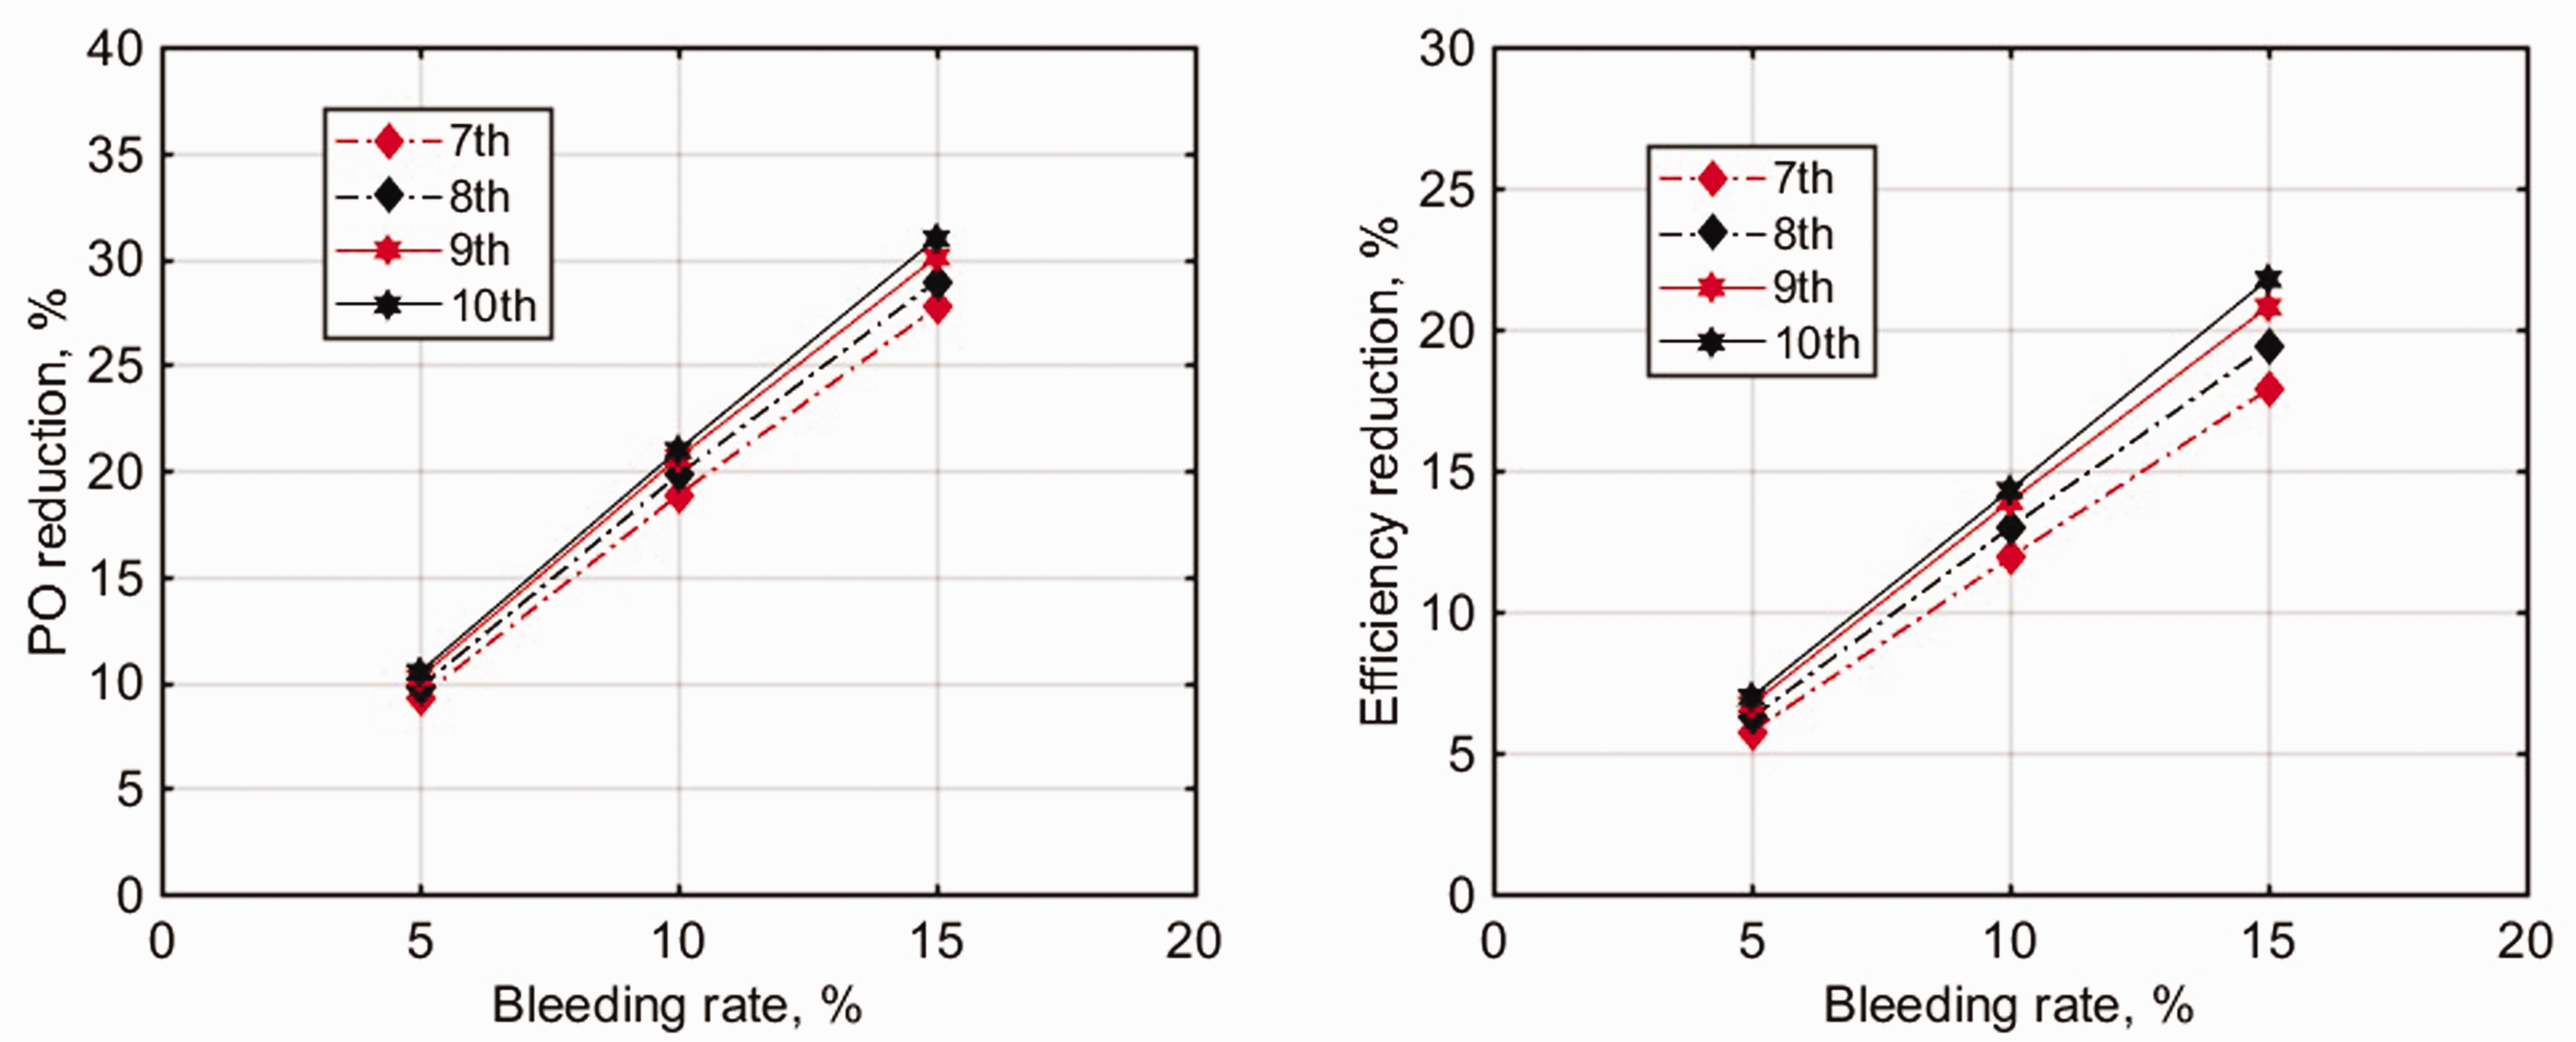
Flow injection–discharge mode
This mode of operation involves the reinjection of the stored air’s heat energy, which is facilitated by the further compression of air in the storage. This will amount to a pressure greater than the maximum operating pressure in the GT. The stored high pressure air will typically be expanded with a throttle valve to obtain a pressure suitable for flow injection into the GT system. Due to the expected thermal losses in a storage system, it is also expected that some of that heat energy will be lost. As such, this study has considered a drop in the injected air temperature as a function of the extracted compressor discharge temperature (CDT), up to a more optimistic case of 1.1 times the design CDT, which can be achieved using a recuperator heat exchanger. Two control constraints are considered here; these are constant COT which allows for a variation in PO and the constant PO operation which varies the COT to maintain the specified constraint value. The rationale for constant PO is that more power may not necessarily be required by the operator.
Figure 6 illustrates the only injection location – downstream of the compressor, considered with 2.5–20% of the inlet mass flow injections. It is also of importance to observe the impact of these injections on the SMU of all the stages. Only the rear of the compressor has been considered as it is reasonable to think that, in practice, the inter-stage injection produces higher aerodynamic distortions and hence losses in the stages following the mixing section. It is advantageous to reduce the mixing losses as much as possible by injecting in a section where the flow has a lower velocity, around the diffuser. With a design CDT of 620 K, the speed of sound that is a function of temperature is about 500 m/s based on equation (9). With a typical Mach number around 0.3, the estimated air flow velocity that will have almost only an axial component is estimated to be around 150 m/s based on equation (10). The static pressure of the injected air has to be greater than the static pressure at the exit of the compressor for injection to take place without flow reversal into the CAES system. This can be achieved with the same total pressure (P2) for both flows as assumed in this study. As a result, the estimated static pressure has to be greater than 1094 kPa in this scenario; this is calculated based on equation (11). The implication of this is a lower injection velocity that is also consistent with the requirement for the combustor.
GT integrated with CAES – injection/discharging mode.


Constant COT control constraint
In this operational setting, the stored pressurized air is injected between the end of the compressor and the inlet of the combustor as already shown. The increased injected mass flow allows for an increase in the fuel flow to achieve the similar fuel-to-air ratio and hence the same COT (or T3). This is characterised by a greater combustor outlet pressure (or P3) that must also rise with an increase in combustor outlet mass flow (M3) to achieve an approximately constant non-dimensional mass flow for a choked turbine as can be inferred from equation (12)

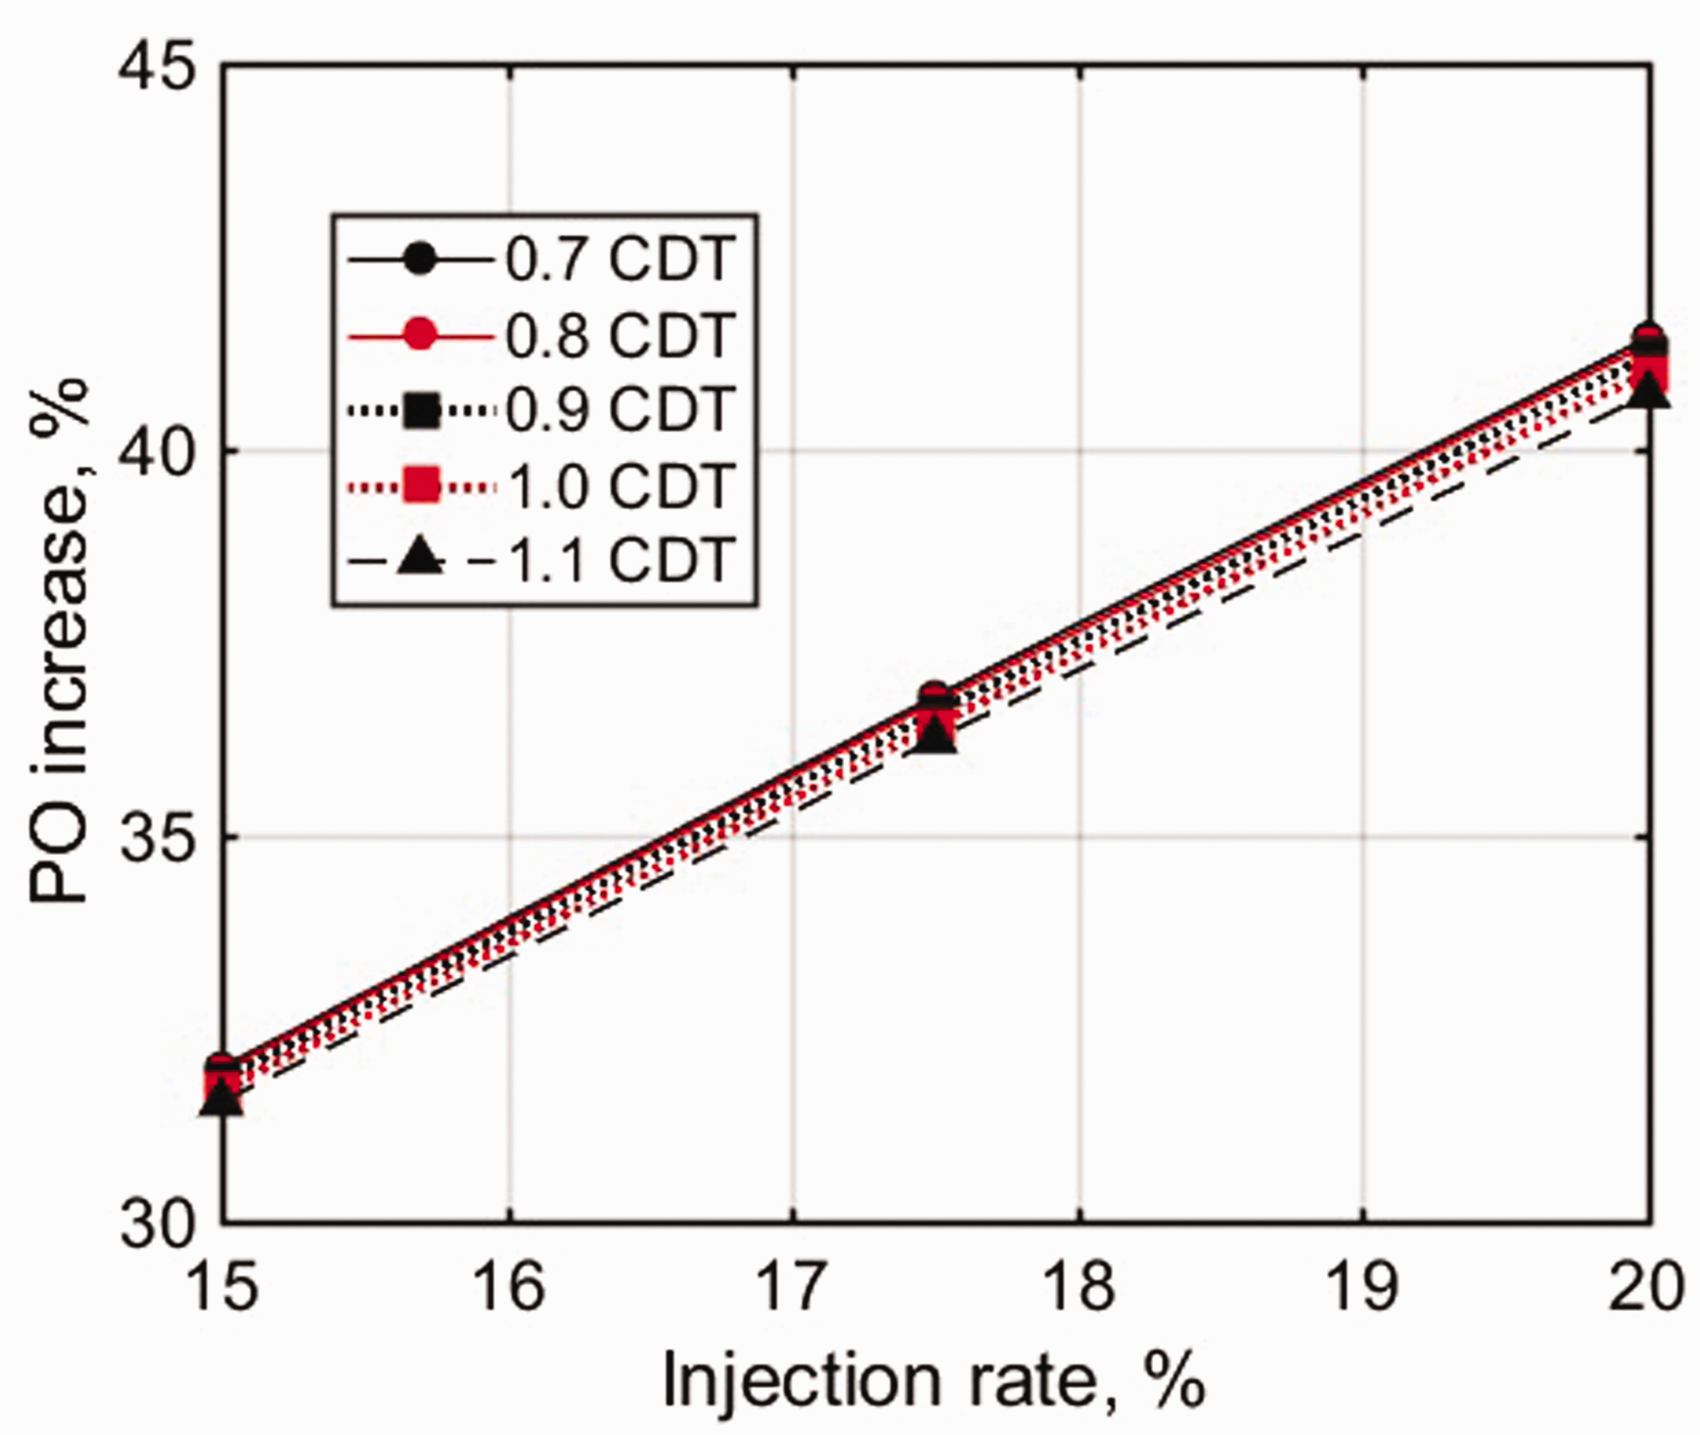
There are greater expansions in the turbine arising from higher inlet pressure to ambient pressure at its exit. This brings about a drop in EGT and greater OPR rise of the driven compressor as shown in Figure 7. This effect increases with the injection rate, and as such, the PO increases alongside the thermal efficiency indicated in Figure 8. The efficiency increases because more PO is generated in relation to the increased fuel flow required to maintain the same COT. These figures also indicate the influence of increased injection temperature from 0.7 to 1.1 times the CDT. There is a comparatively little and reducing effect of these on the PO when CDT increases. However, the thermal efficiency rises for the same injection ratio, as the quality of the energy content (kJ/kg K) of the air into the combustor has an impact on the heat input. In this case, increasing the CDT factor lowers the heat input but also lessens the air density and subsequently the mass flow (related to PO). An enlarged graph of PO increase versus injection rate is provided in Figure 18 of Appendix 1.
Effect of air injections on %OPR and ΔEGT. Effect of air injections on PO and thermal efficiency.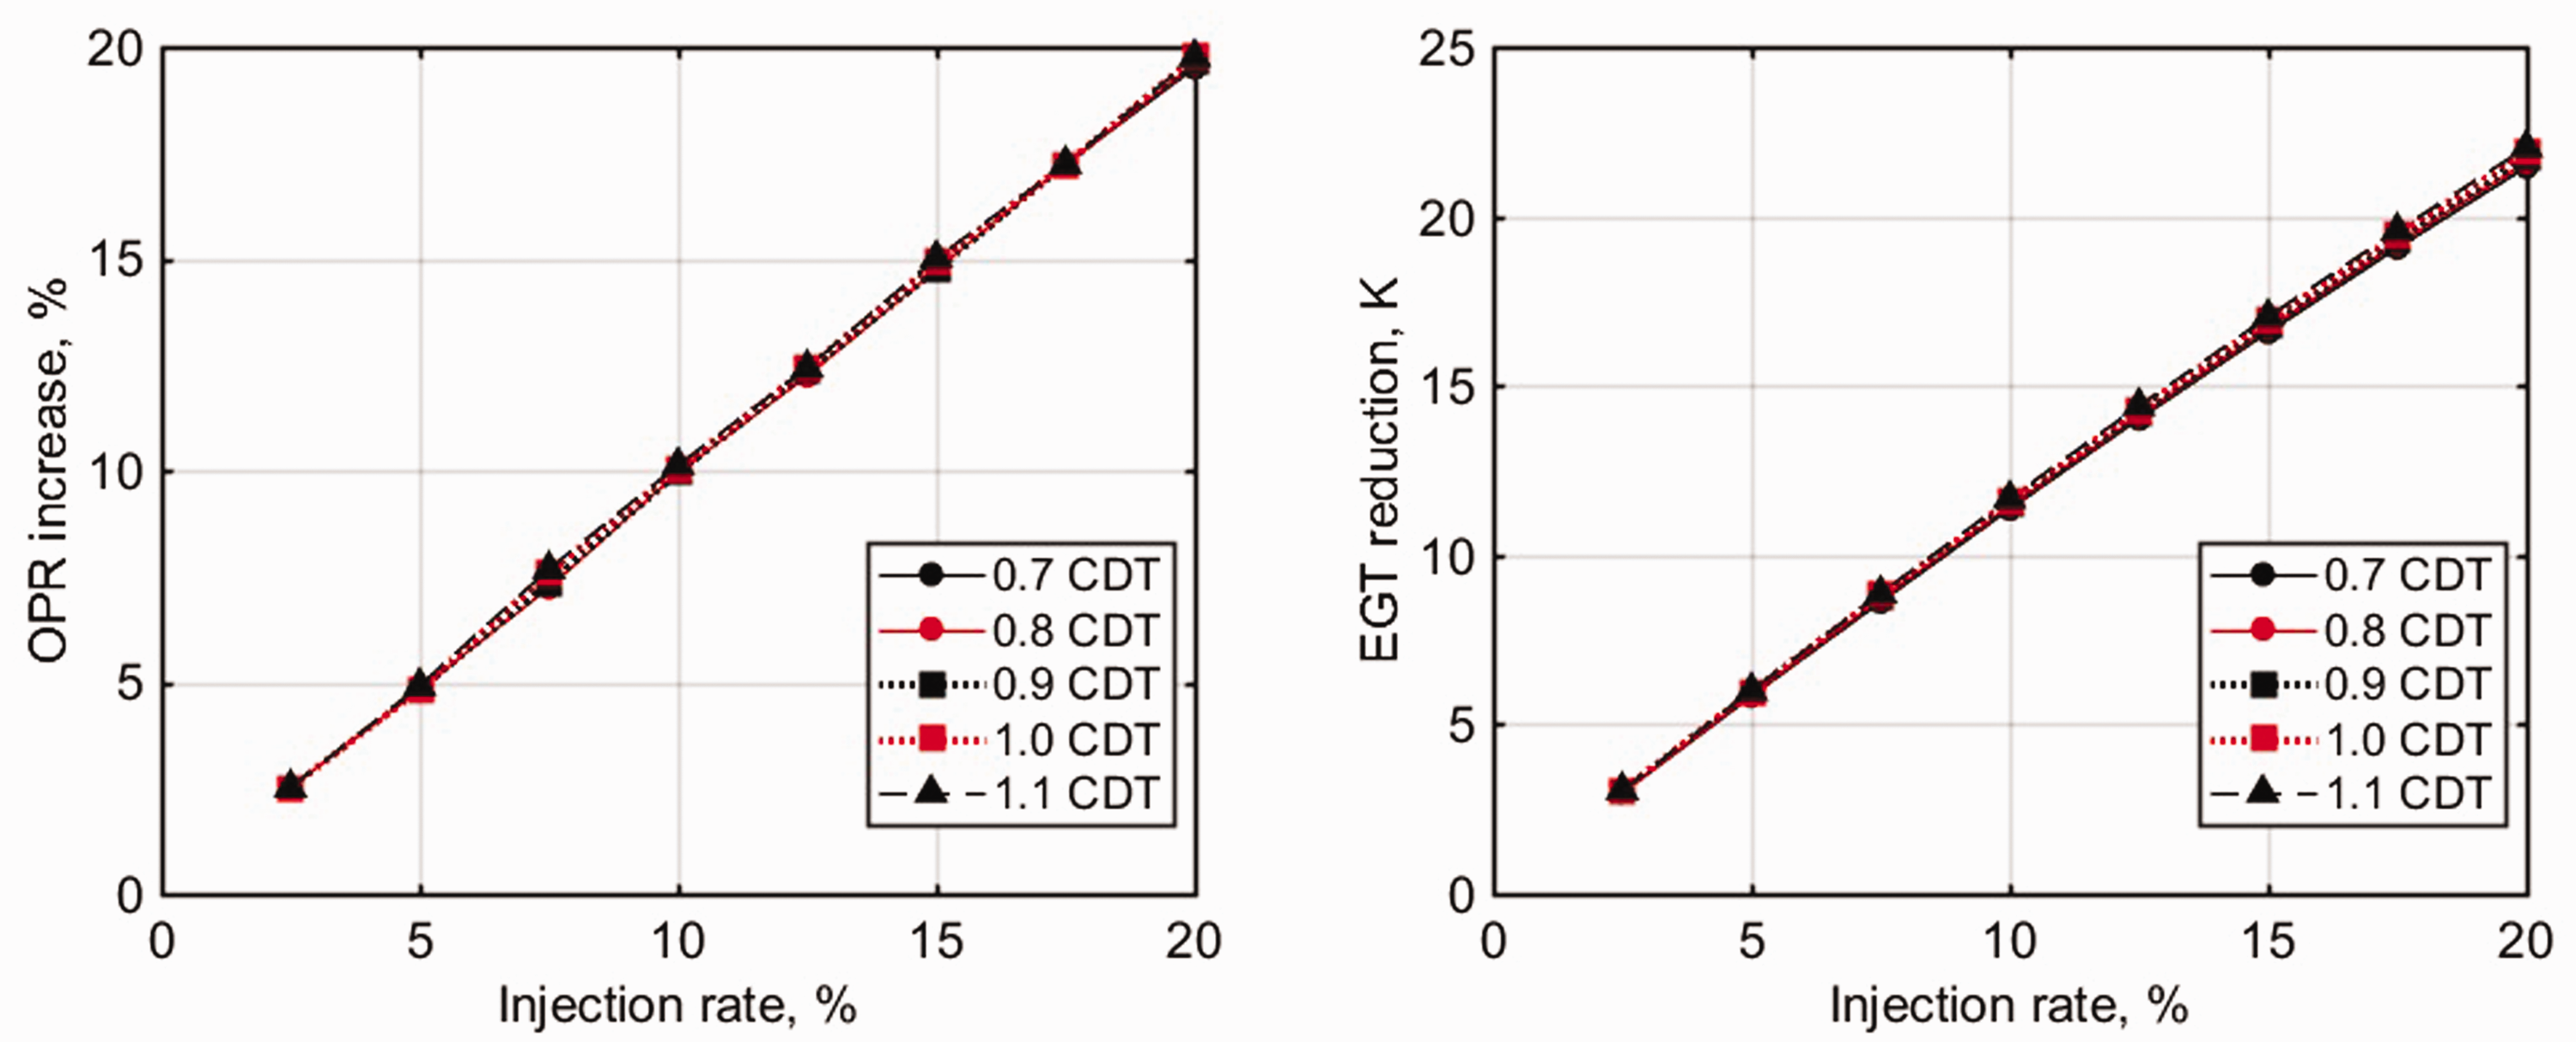
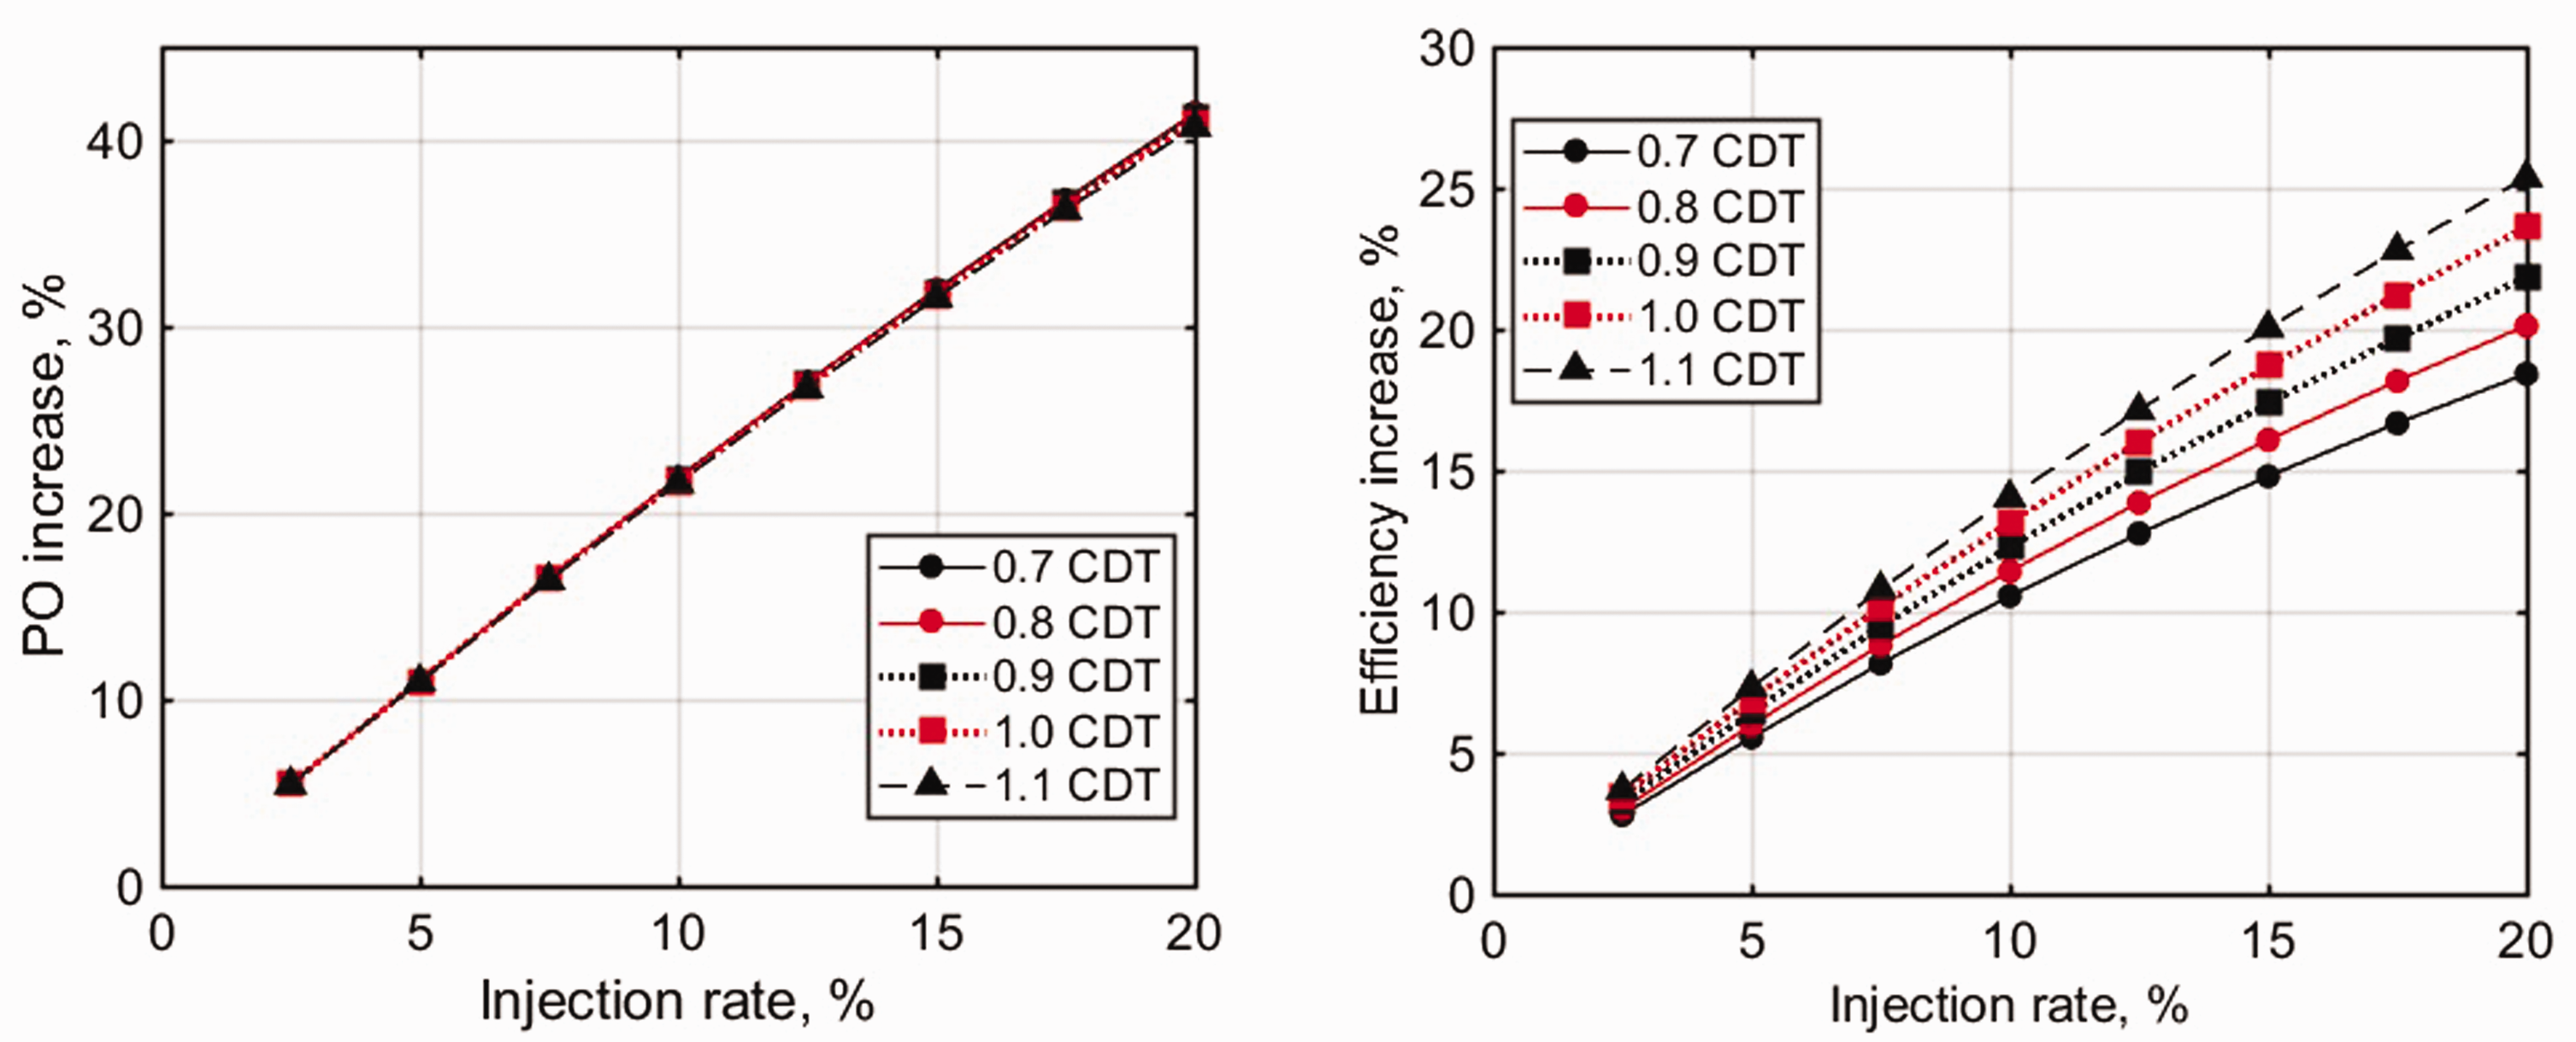
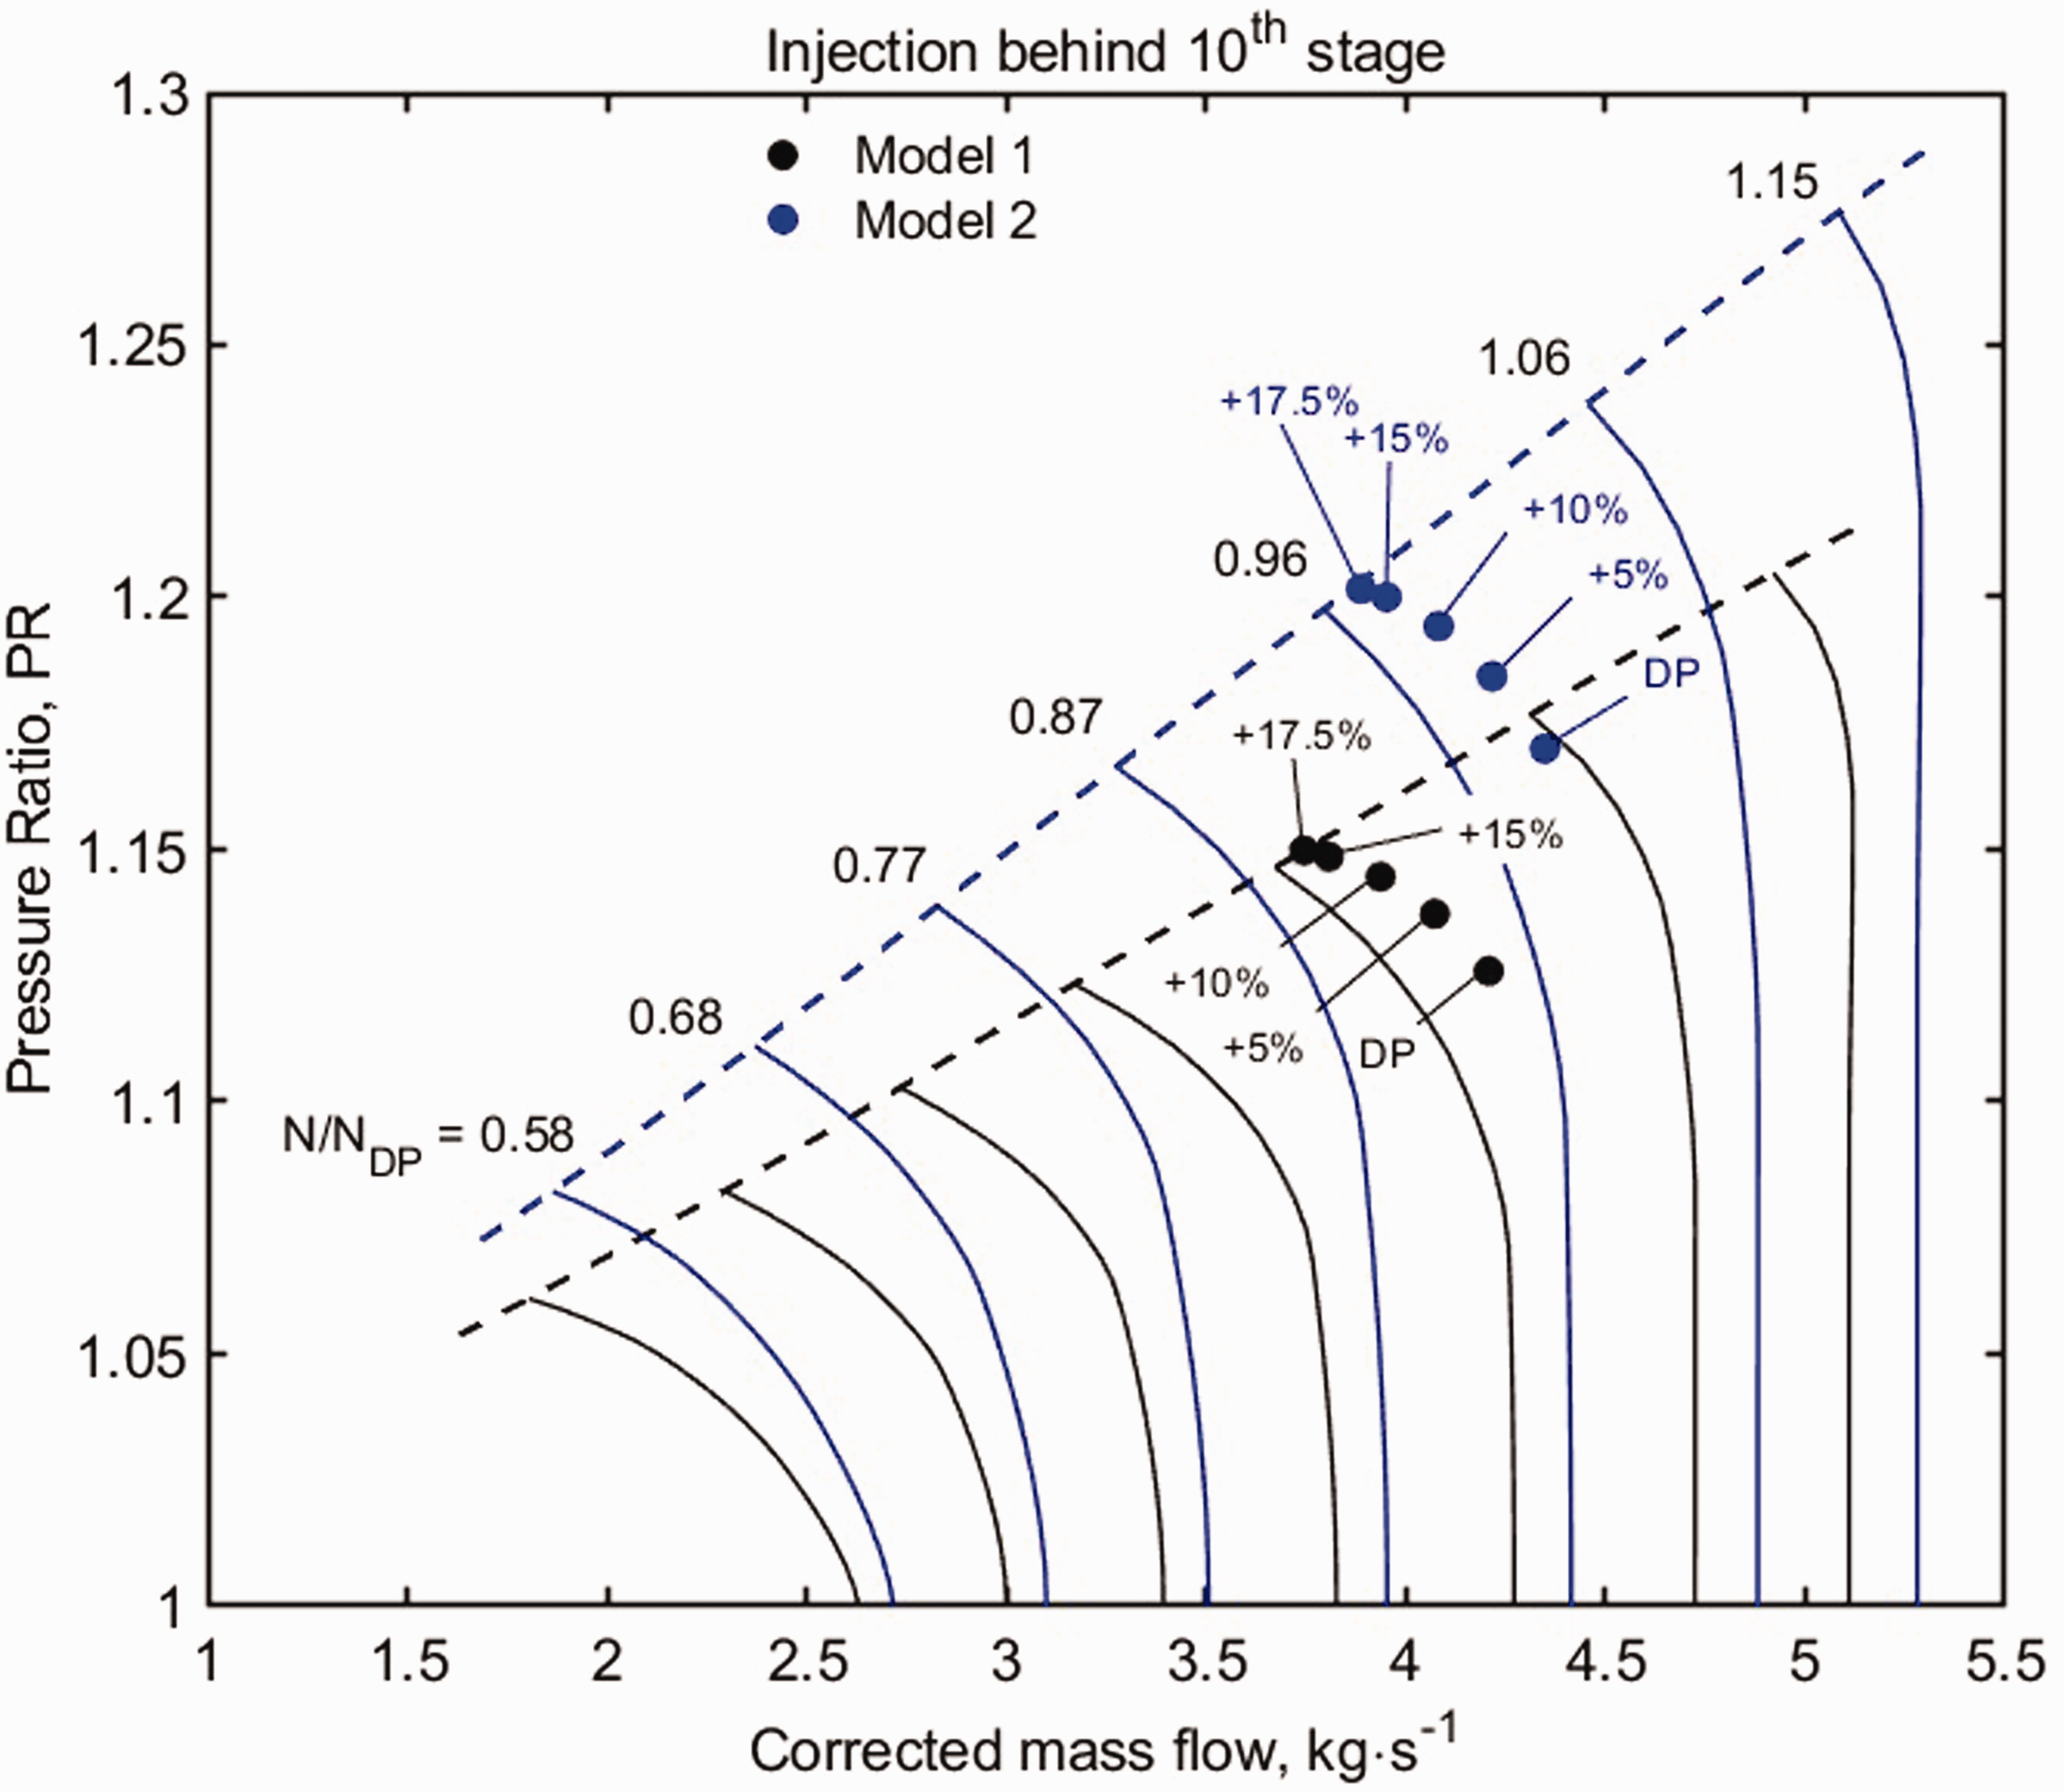
Figure 9 shows the individual stage PR and the variation when different injection rates are considered at the design COT. The results show high PR and SMU at the back stages, closer to the point of injection. This worsens with an increase in injection flow, leading to the arrival of stall point at 20% injection, with 17.5% just about close enough for stage 10 stall. This result also has to be interpreted with respect to the specification of the individual stage SMU at the design point, where lower SMU was specified at the back stages. As such, the onset of stall may slightly differ based on the compressor design. Another influencing factor is the PR distribution across the compressor that this study has considered, which is presented subsequently.
Behind last stage air injection: PR and SMU for varied injections.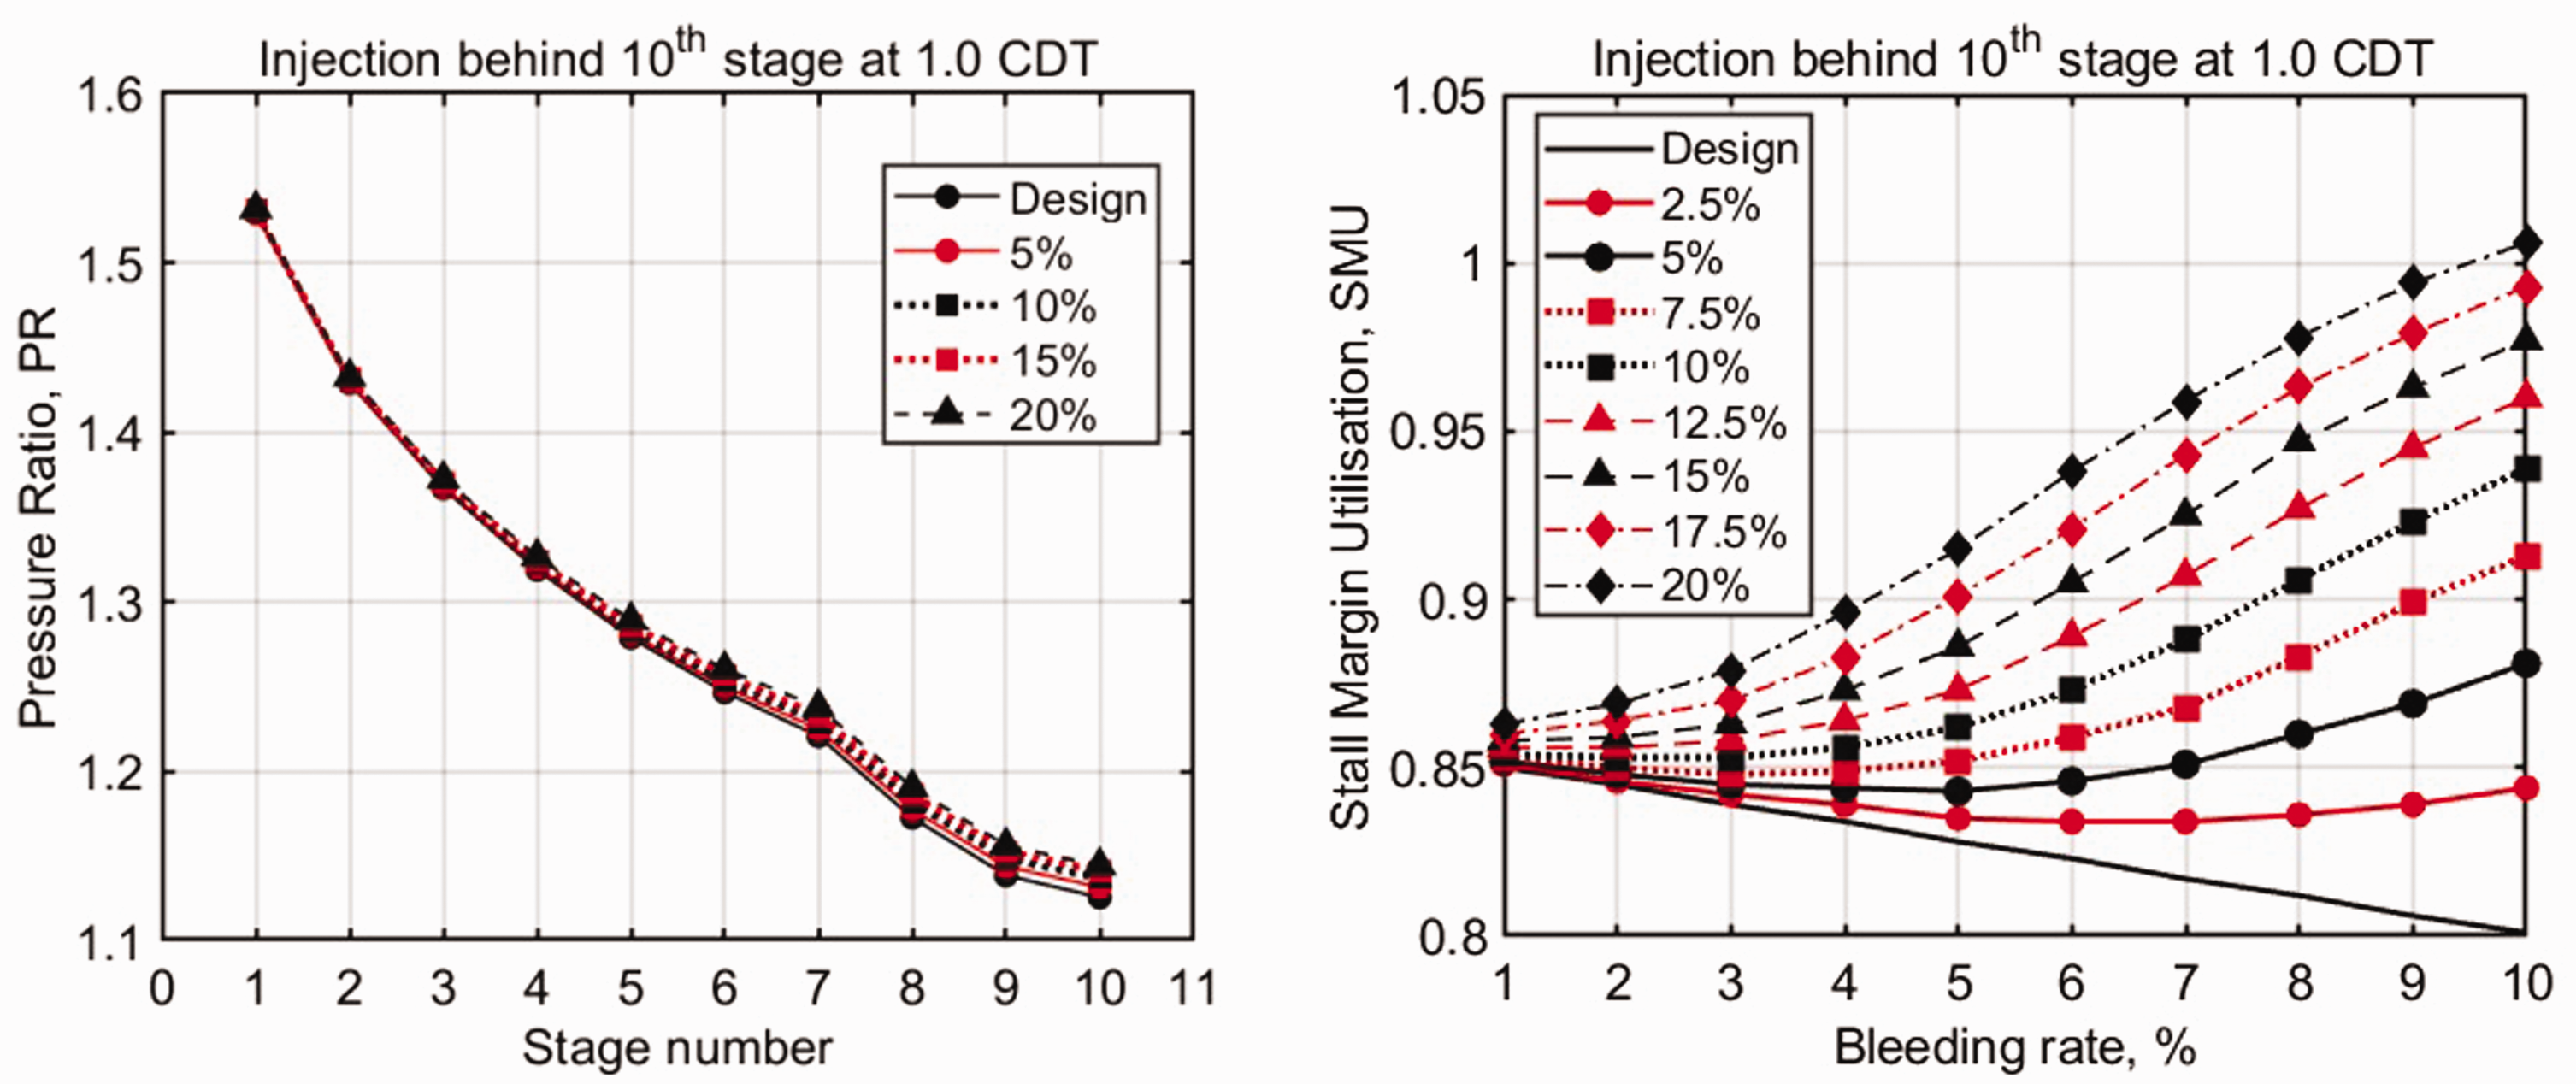
Constant PO control constraint
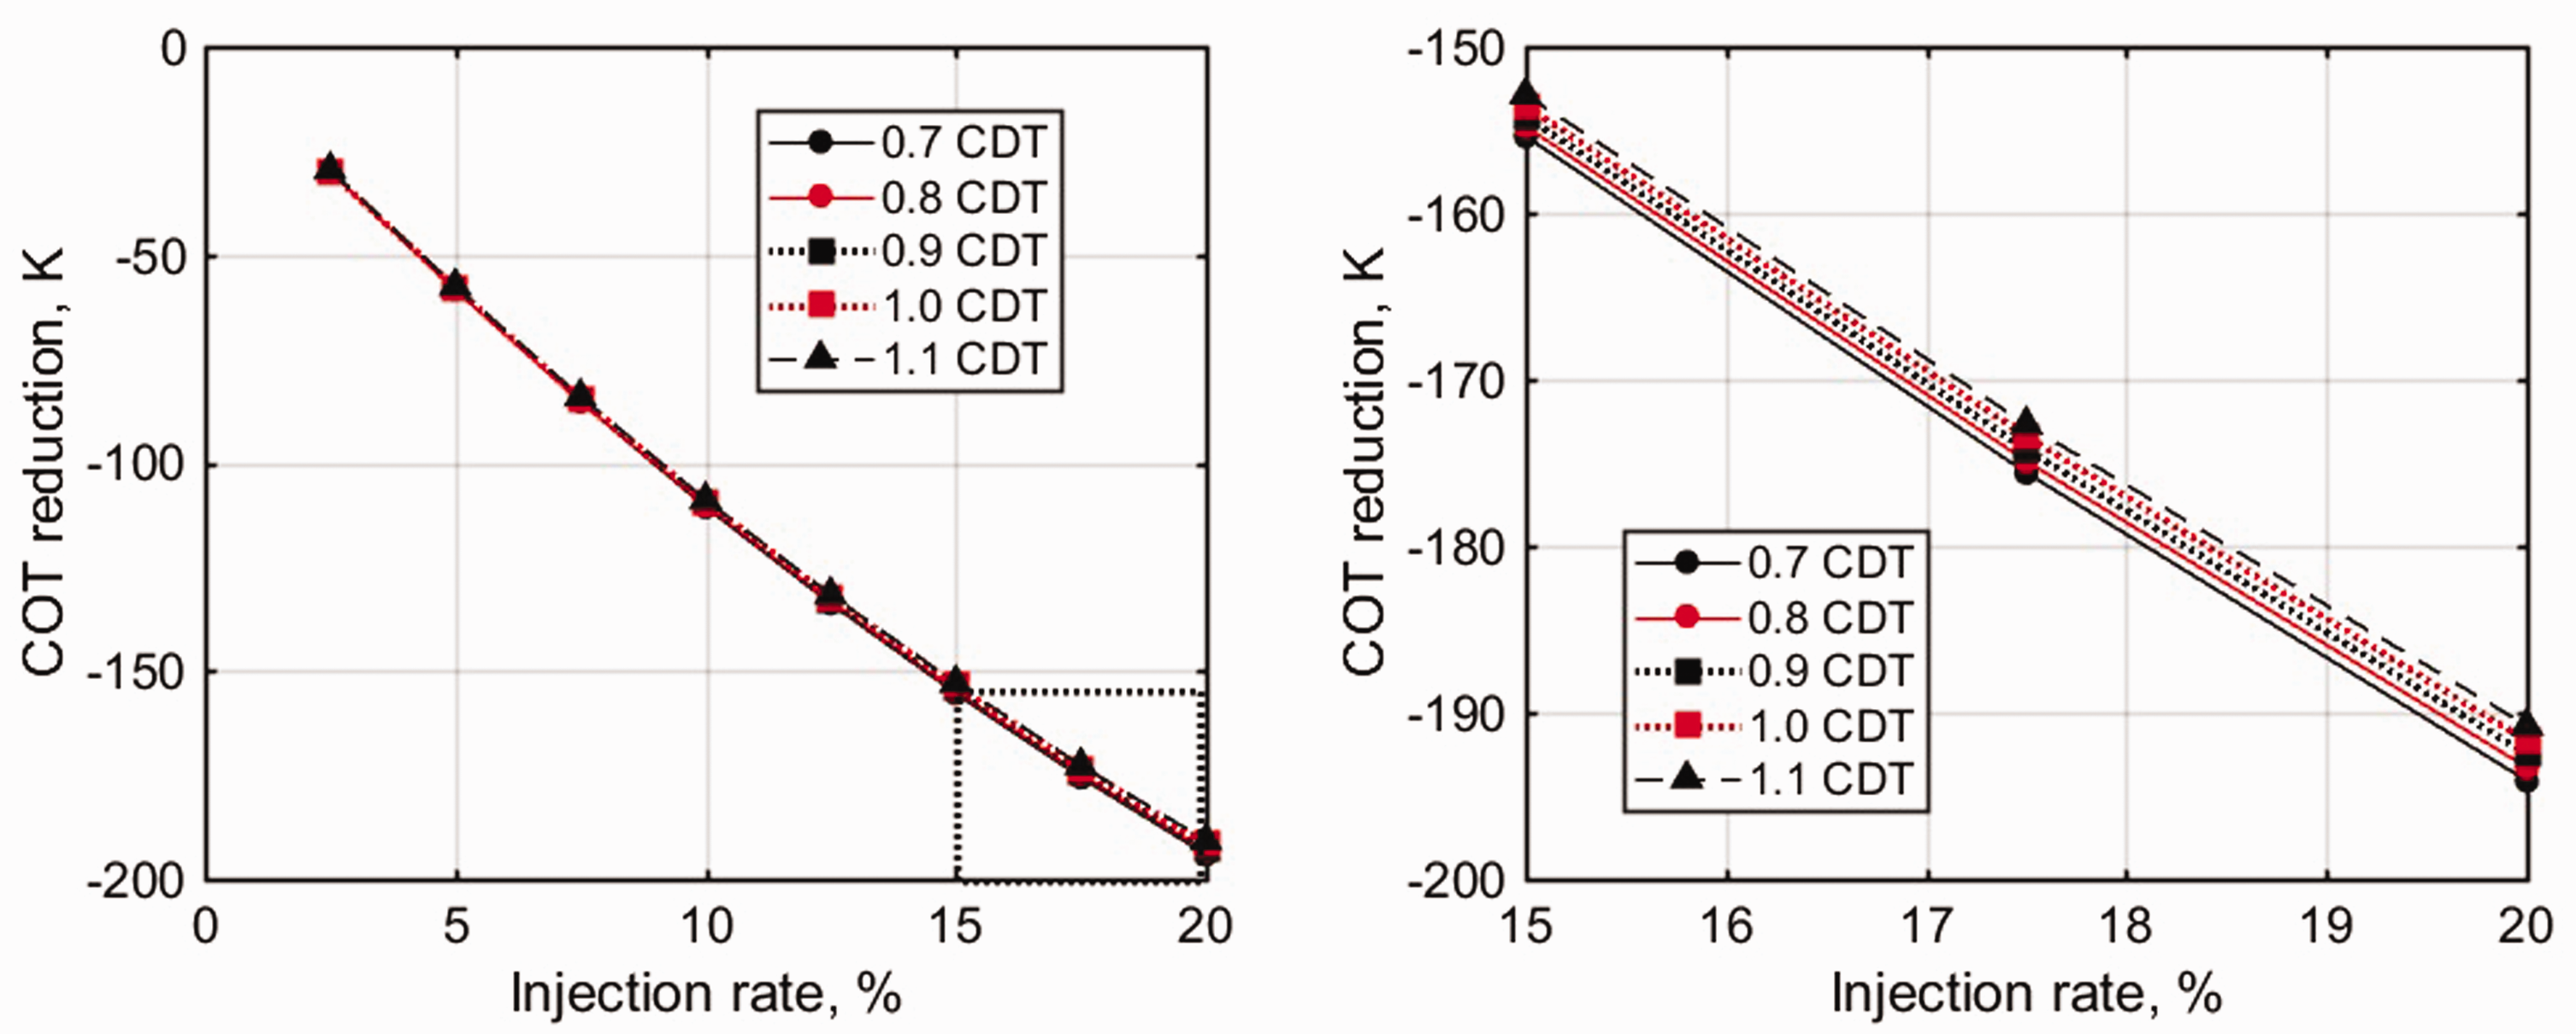
At constant PO operation, the intention is to avoid utilizing the augmenting potential of air injection seen previously. This is achieved by reducing the fuel flow for the increased airflow into the combustor. The fuel-to-air ratio drops as a result, as does the COT. In this case, the flow and temperature into the turbine in comparison to the constant COT case are lower. The expansion taking place in the turbine section is greater, as less fuel has been used to expand the increased air in the combustor. This is reflected in the higher thermal efficiencies obtained here as shown in Figure 10. In this case, the turbine specific work is greater compared to the constant COT case for the same injection. Figure 11 shows the reduction in COT discussed, indicating a drop of up to 195 K that can bring about a significant impact in improving the turbine life. Based on using 15% as a maximum injection rate, about 160 K is a considered limit. These figures also show that an increase in the temperature of the injected flow brings about a considerable drop in the COT due to the increased specific heat of airflow into the combustor as explained previously. At 5 and 15% injection ratio, the reduction in fuel flow is about 6.2 and 16%, respectively, for 1.0 CDT.
Thermal efficiency rise versus injection rate. ΔCOT reduction versus injection rate.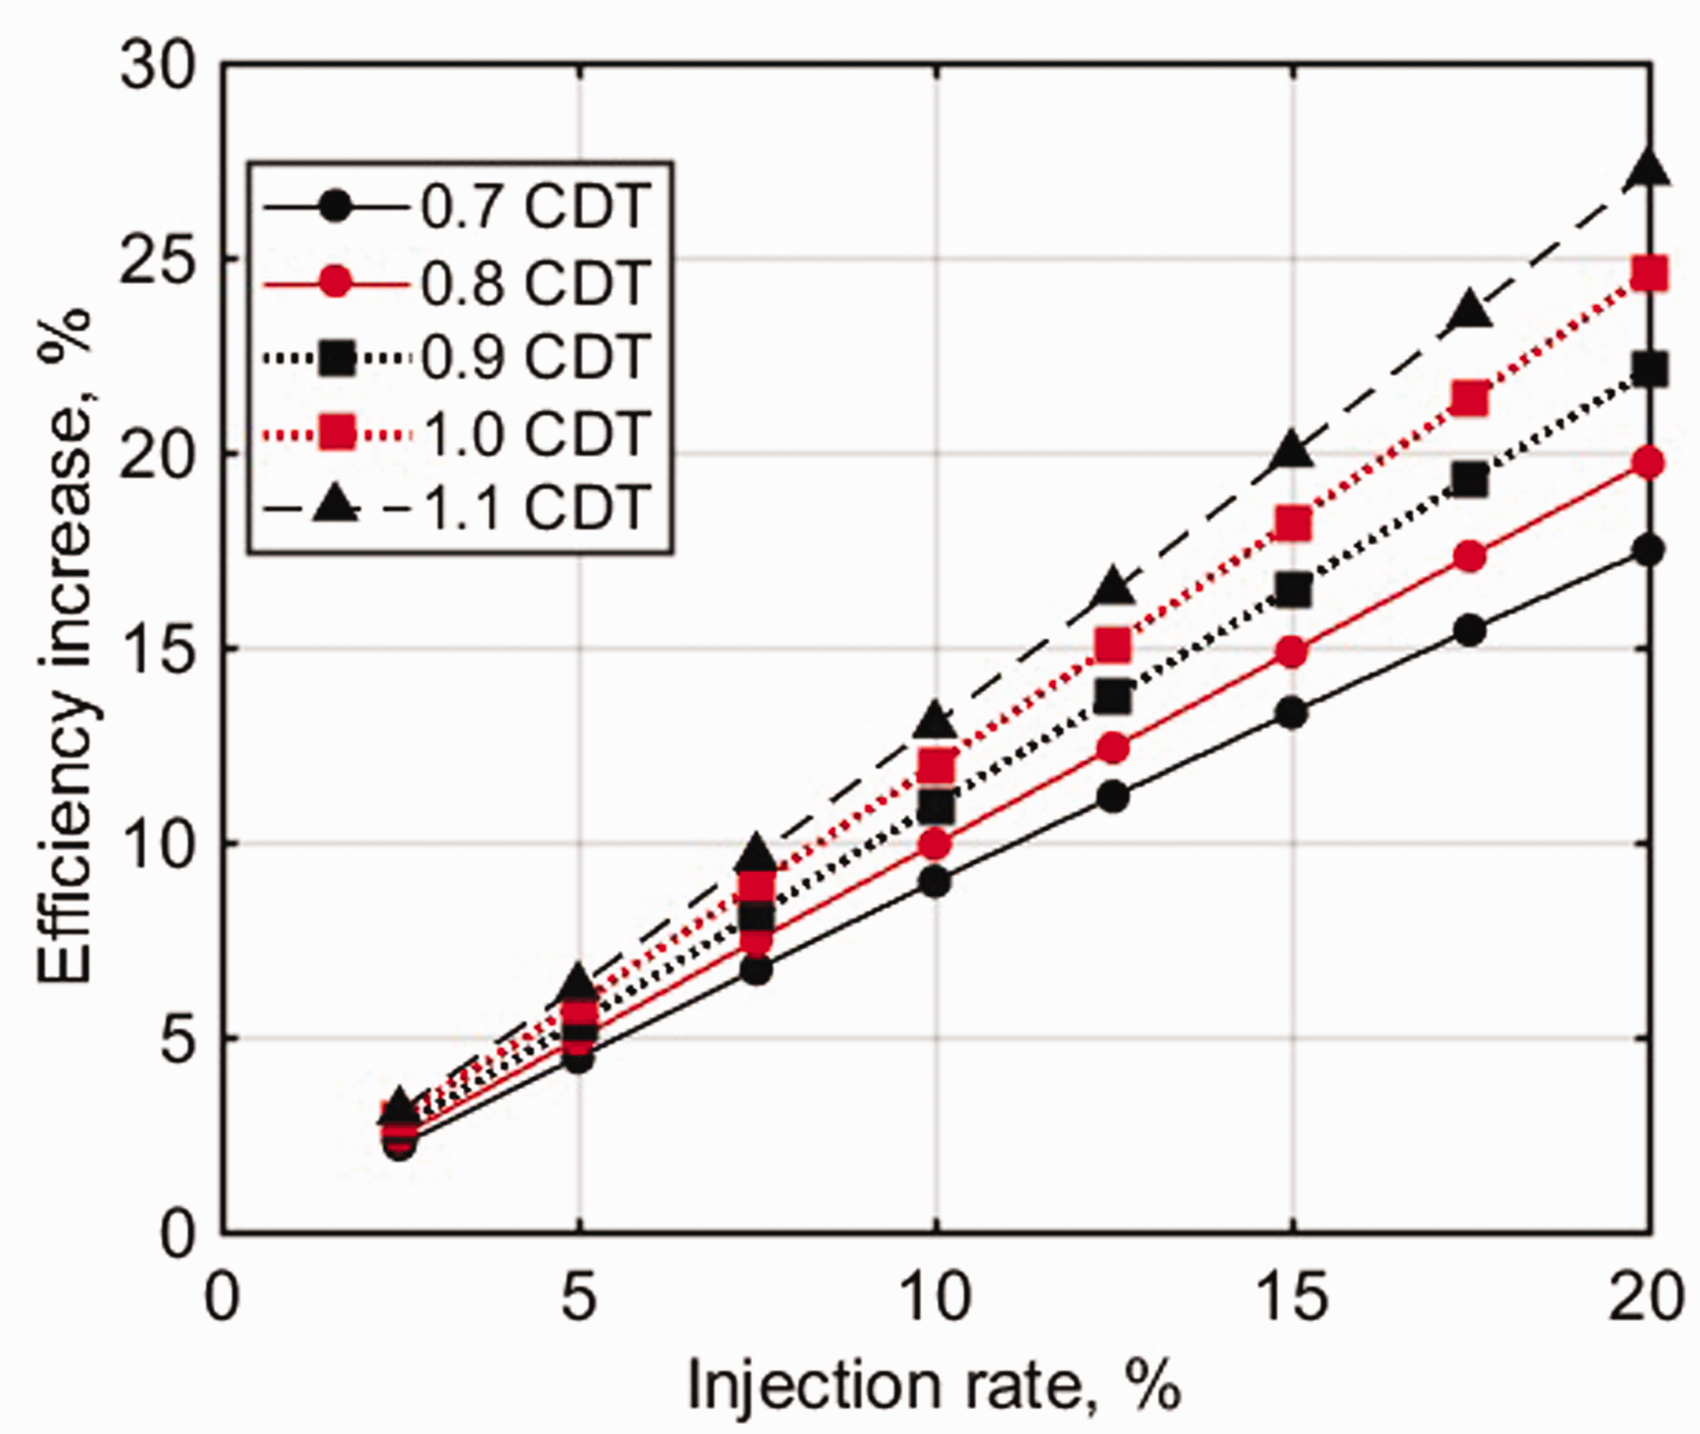
Influence of stage loading distribution
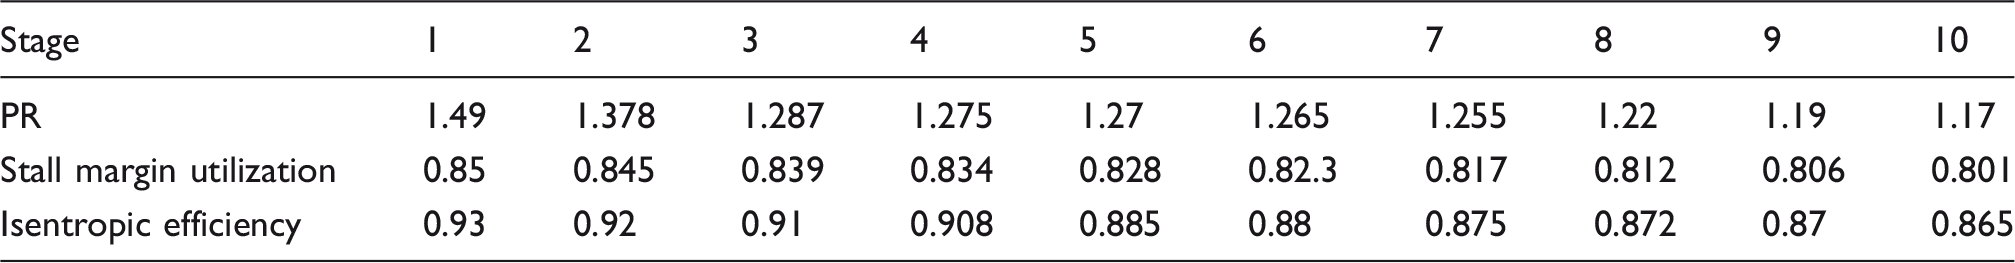
A new model of the engine with a different PR distribution across the compressor stages was developed to observe the possible differences with respect to SMU and overall engine performance. This additional model is referred to as model 2 with the former as model 1 as shown in Figure 12. It indicates that for model 2, the front stage PRs are lower, while the rear stages are greater. Between stages 3 and 7, the PR gradient is lesser than for model 1. The figure also shows that the OPR is the same – i.e. the compressor exit pressures of both models are identical. However, this results in reduced inlet pressure for every stage as observed. It is important to state that the individual stage isentropic efficiencies have also been adjusted to reach the same compressor outlet total temperature. The result of this is also an identical design point compressor isentropic efficiency for both models. For model 2, since its front stage PRs are lower, their individual isentropic efficiency has been increased as shown in Table 4 when compared with Table 2. The corresponding stage SMU has been specified as the same with model 1 to focus on the effect of stage loading that is considered more influential in this type of study.
PR distribution for both models (left) and their stage exit pressures (right). Stage-by-stage performance specification at design point (Model 2).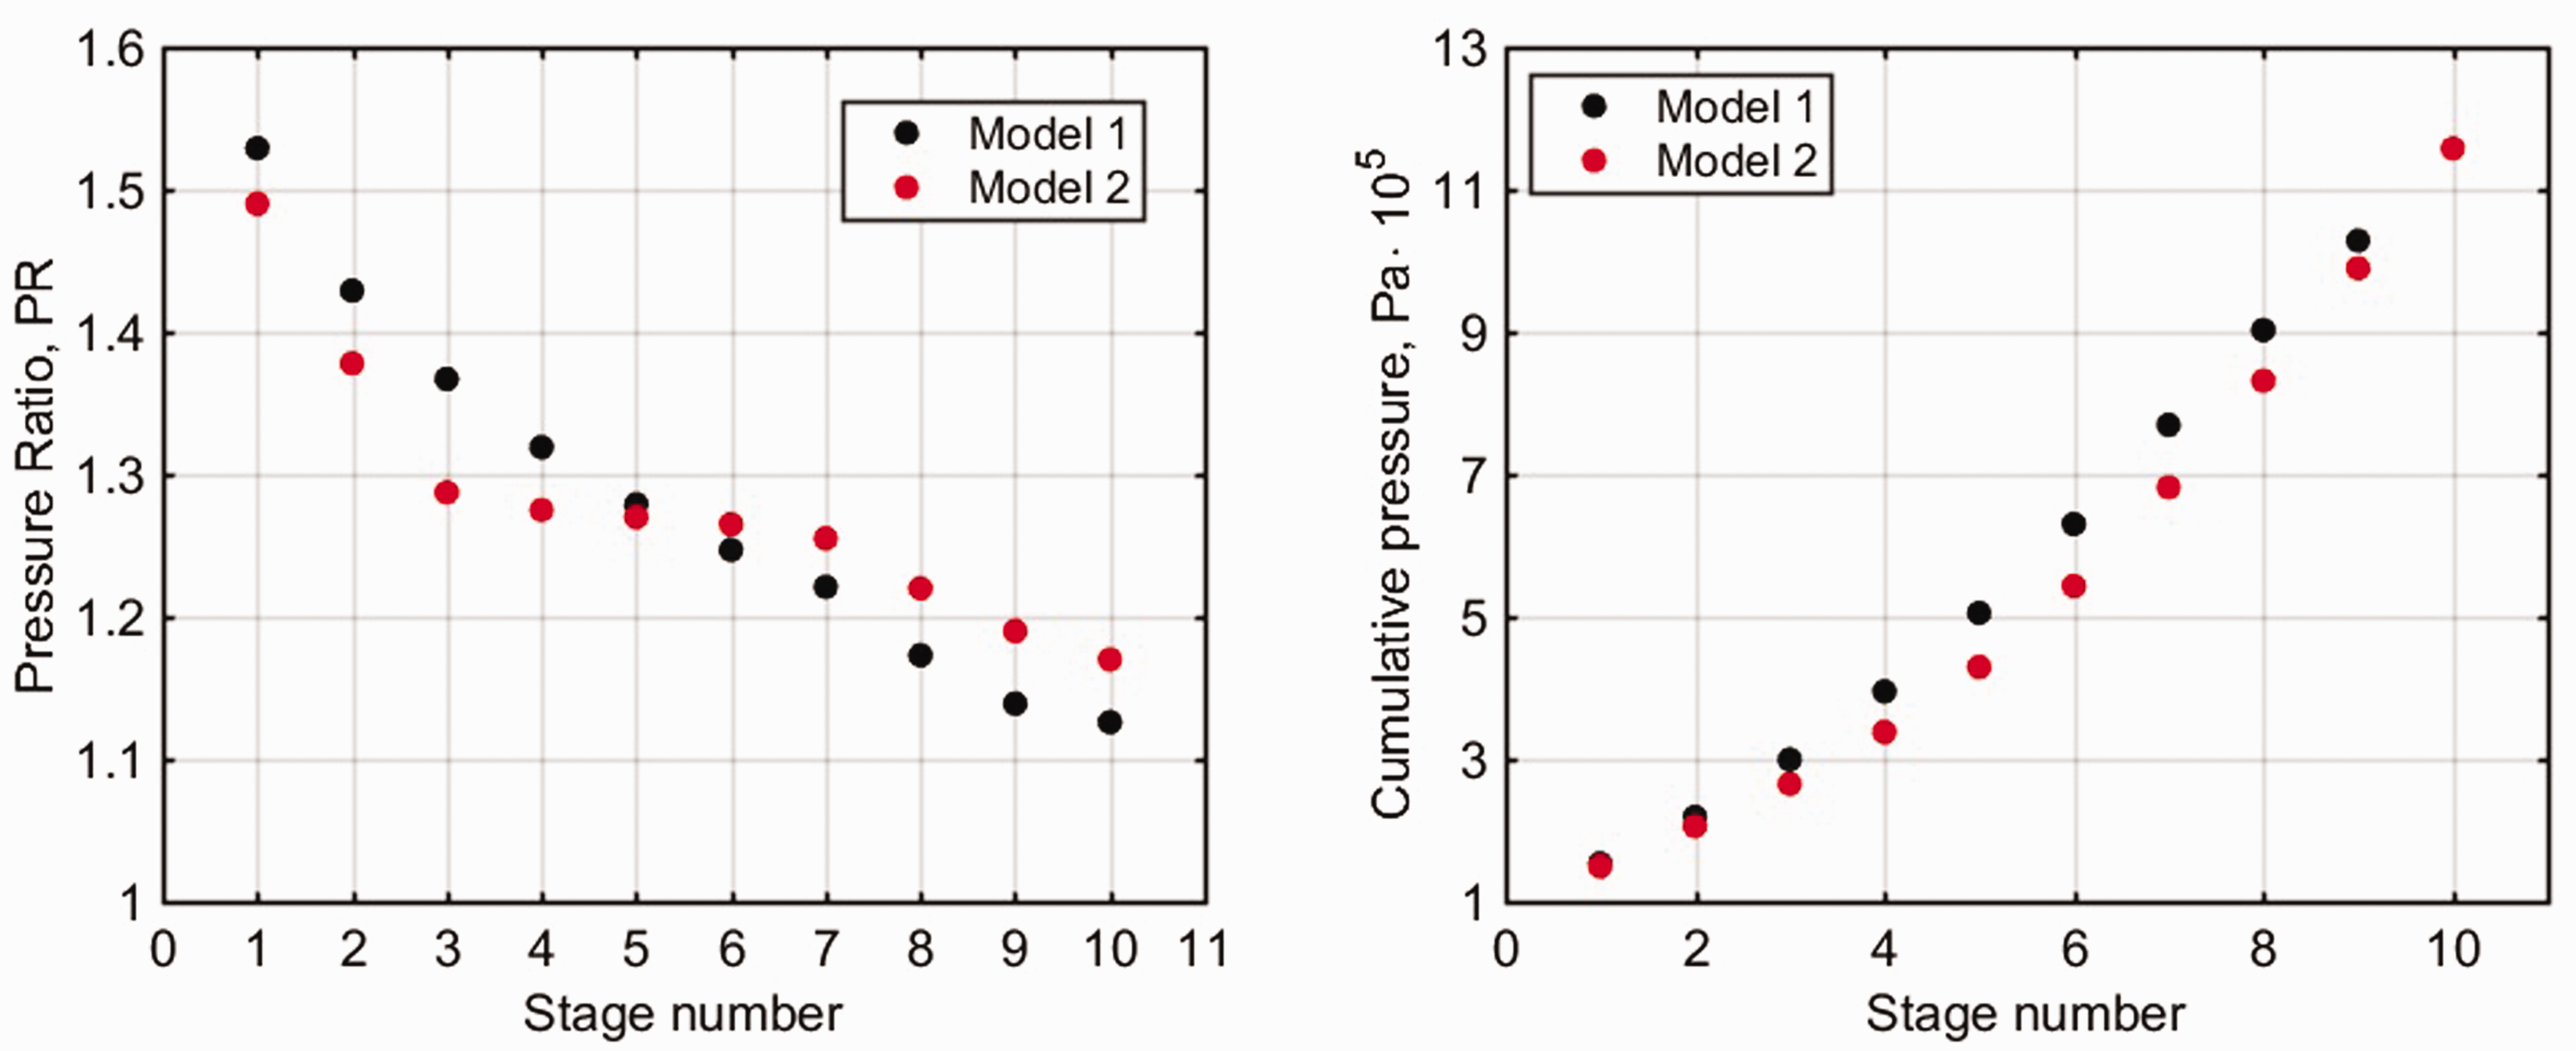
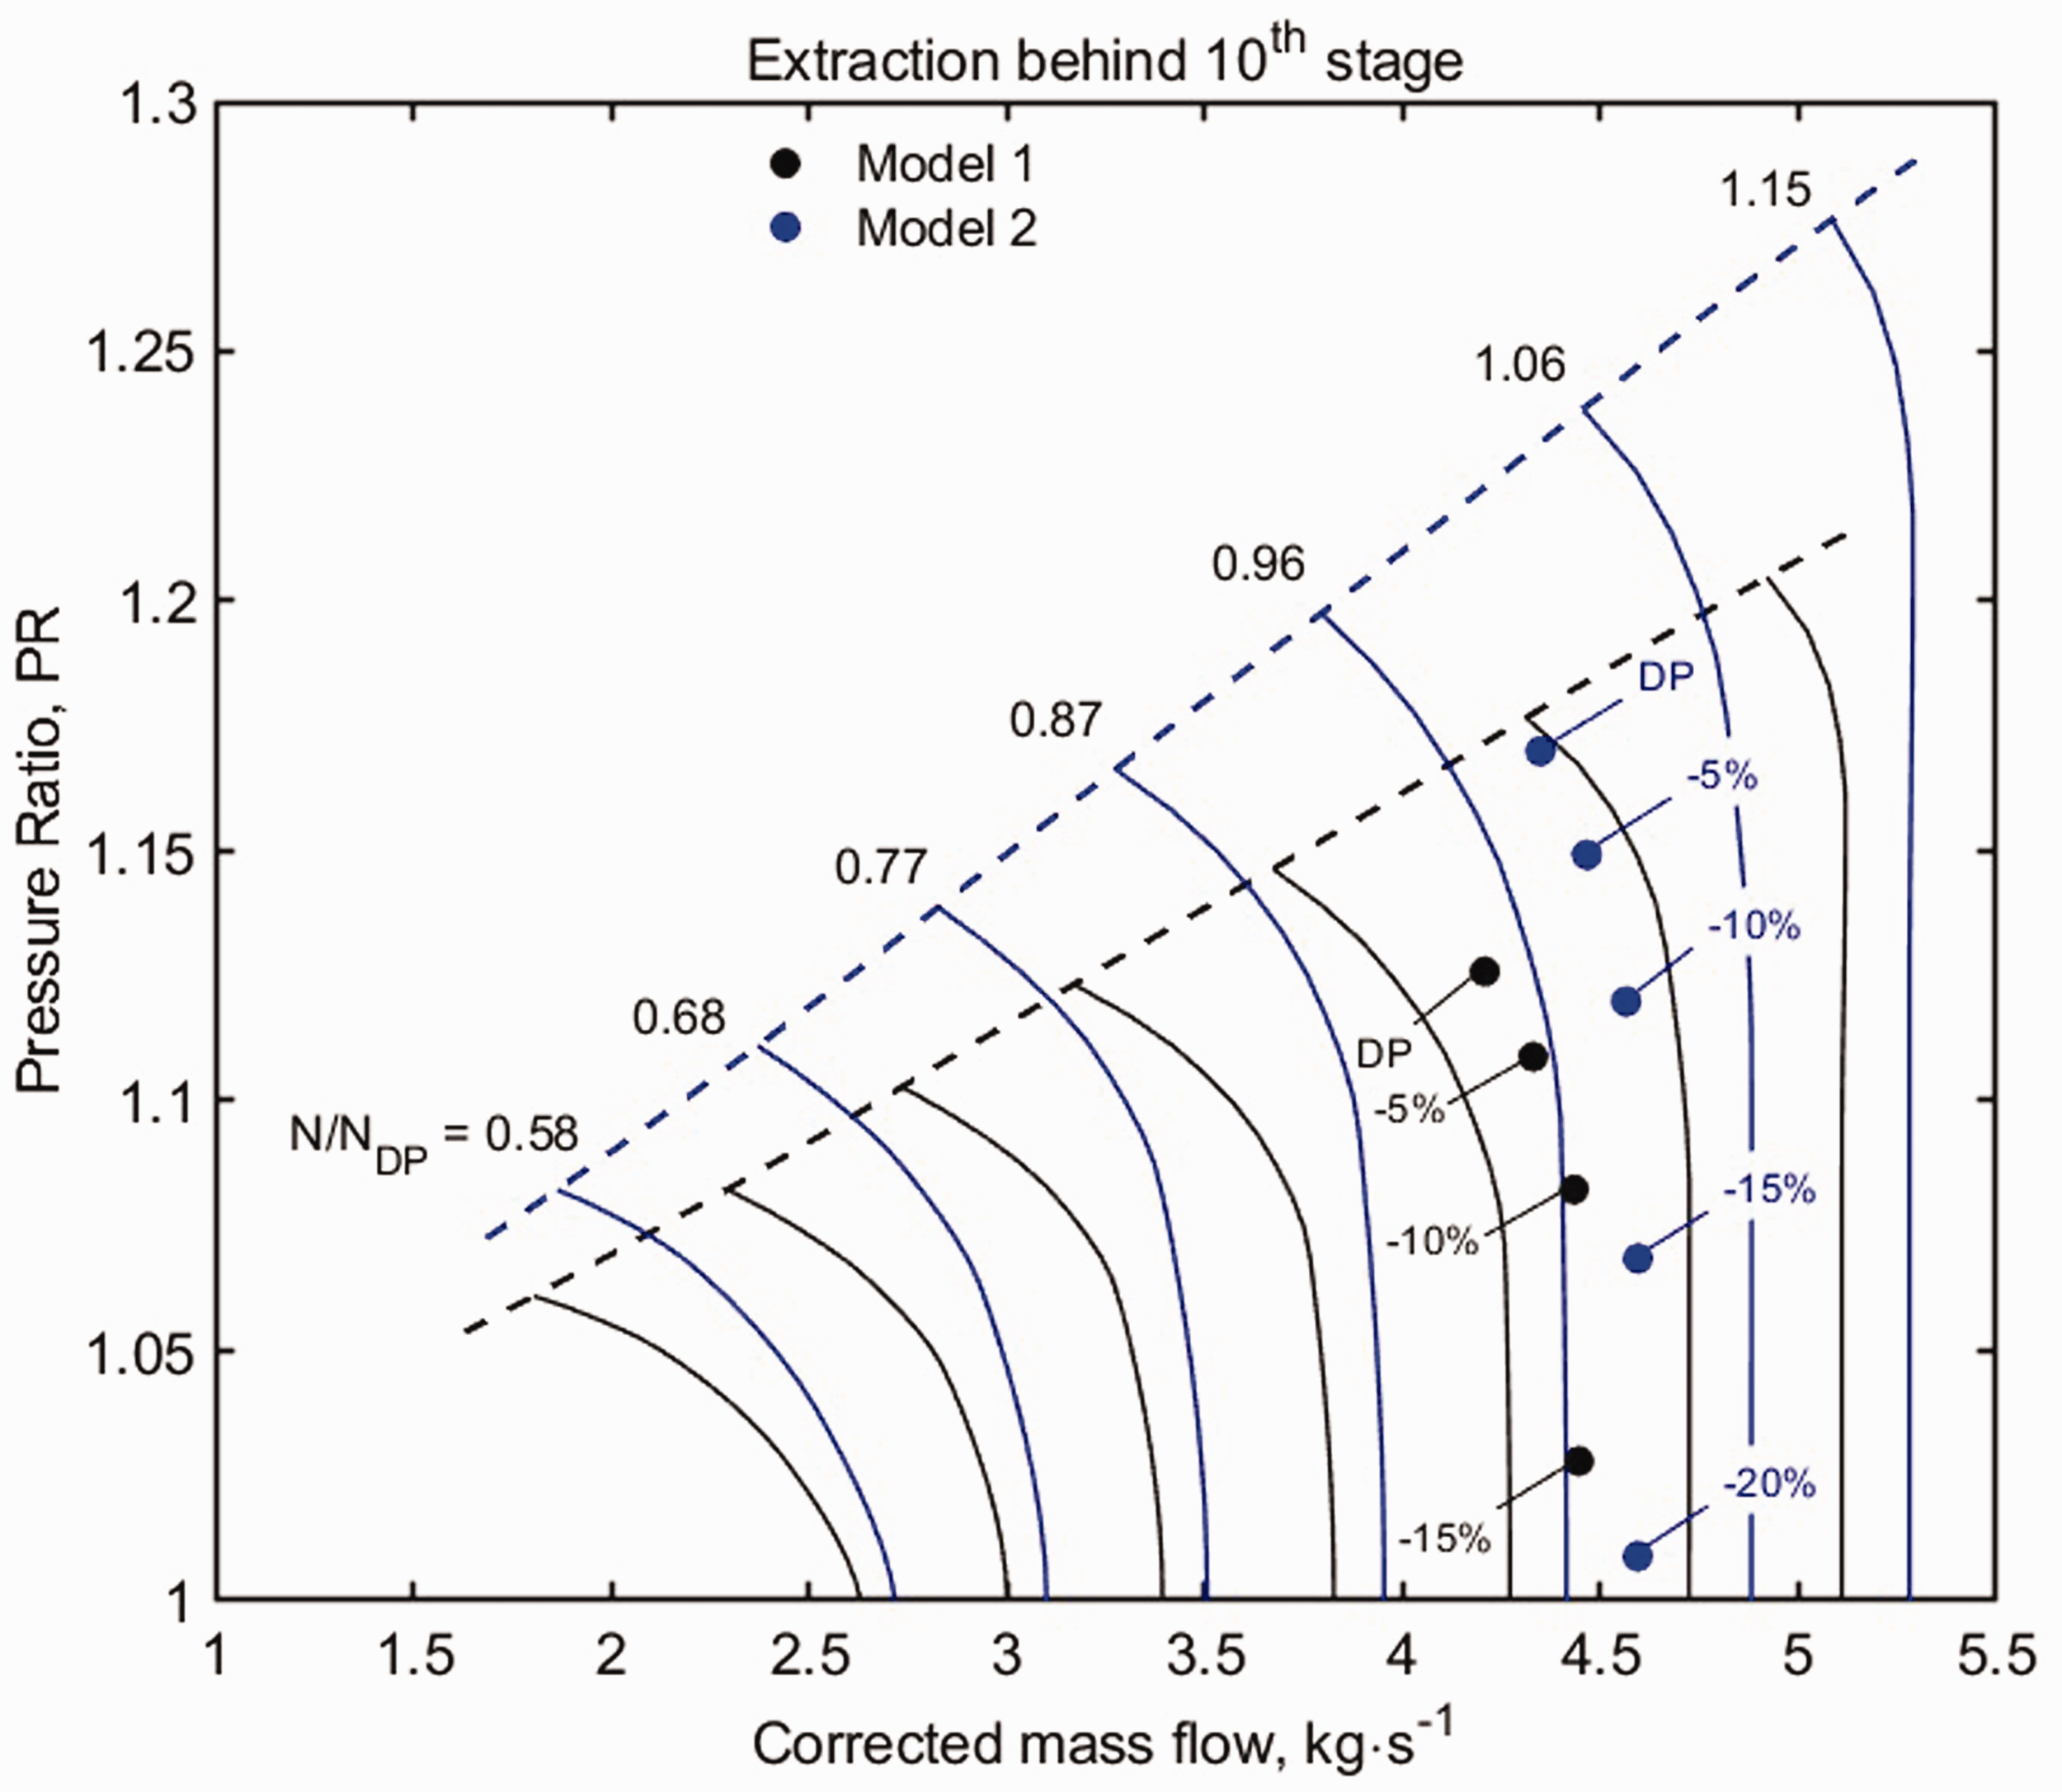
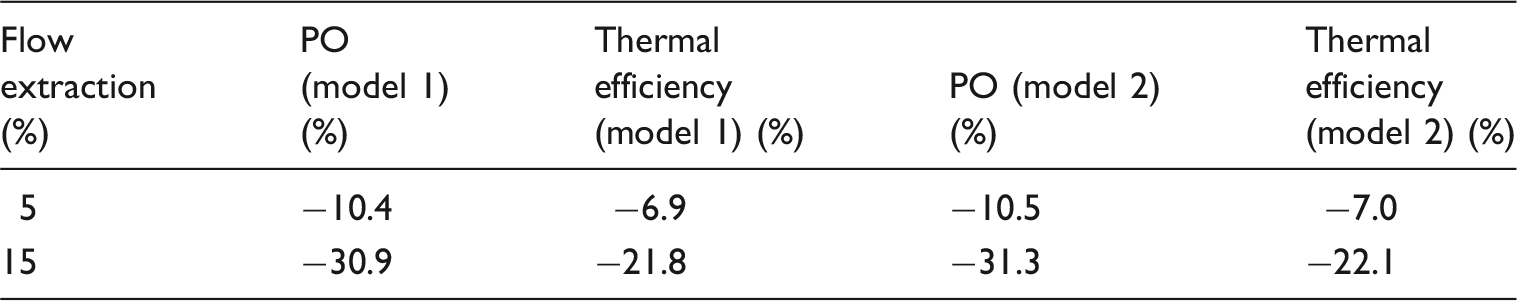
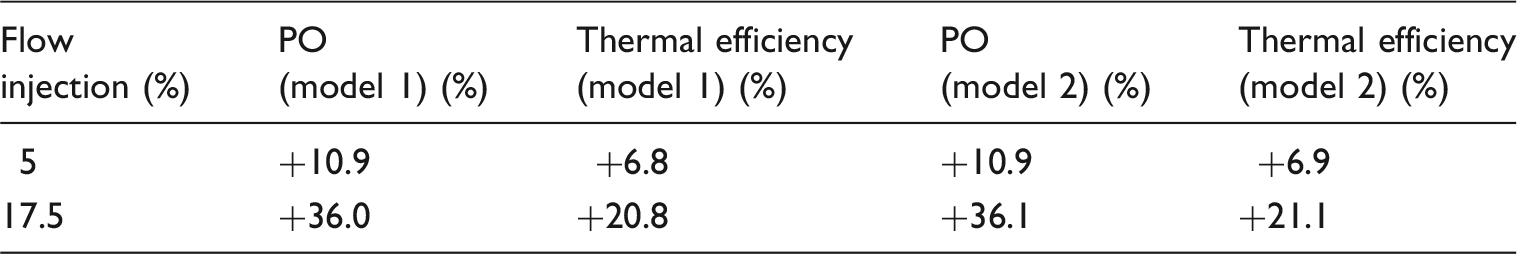
Only selected simulations with regards to extraction and injection are presented here for brevity. For extractions at the critical 9th and 10th stages as shown in Figure 13; the pattern in changes in SMU for both models is similar. There are little differences between the two models in terms of the magnitude of changes for 5% flow extractions. However, that of the 15% extraction is more noticeable, indicating a 10 point improvement with the new model. This translates to a slower arrival at extreme choke conditions for model 2 as shown in Figure 14, signified by the higher PR for the same extraction. This is influenced by the higher design point PR at the rear stages of model 2, in addition to the operation at higher inlet CMF that is a result of lower entry temperatures and pressures. The new load distribution, therefore, shows a benefit potential for an increase in air extraction towards choke flow. The overall performance changes are indicated in Table 5, showing that reductions in PO are very close to model 1.
Individual stage SMU for varied flow extraction at stages 9 and 10 (both models). Map of stage 10 for flow extractions – both models. Performance changes of both models with air extraction behind the 10th stage.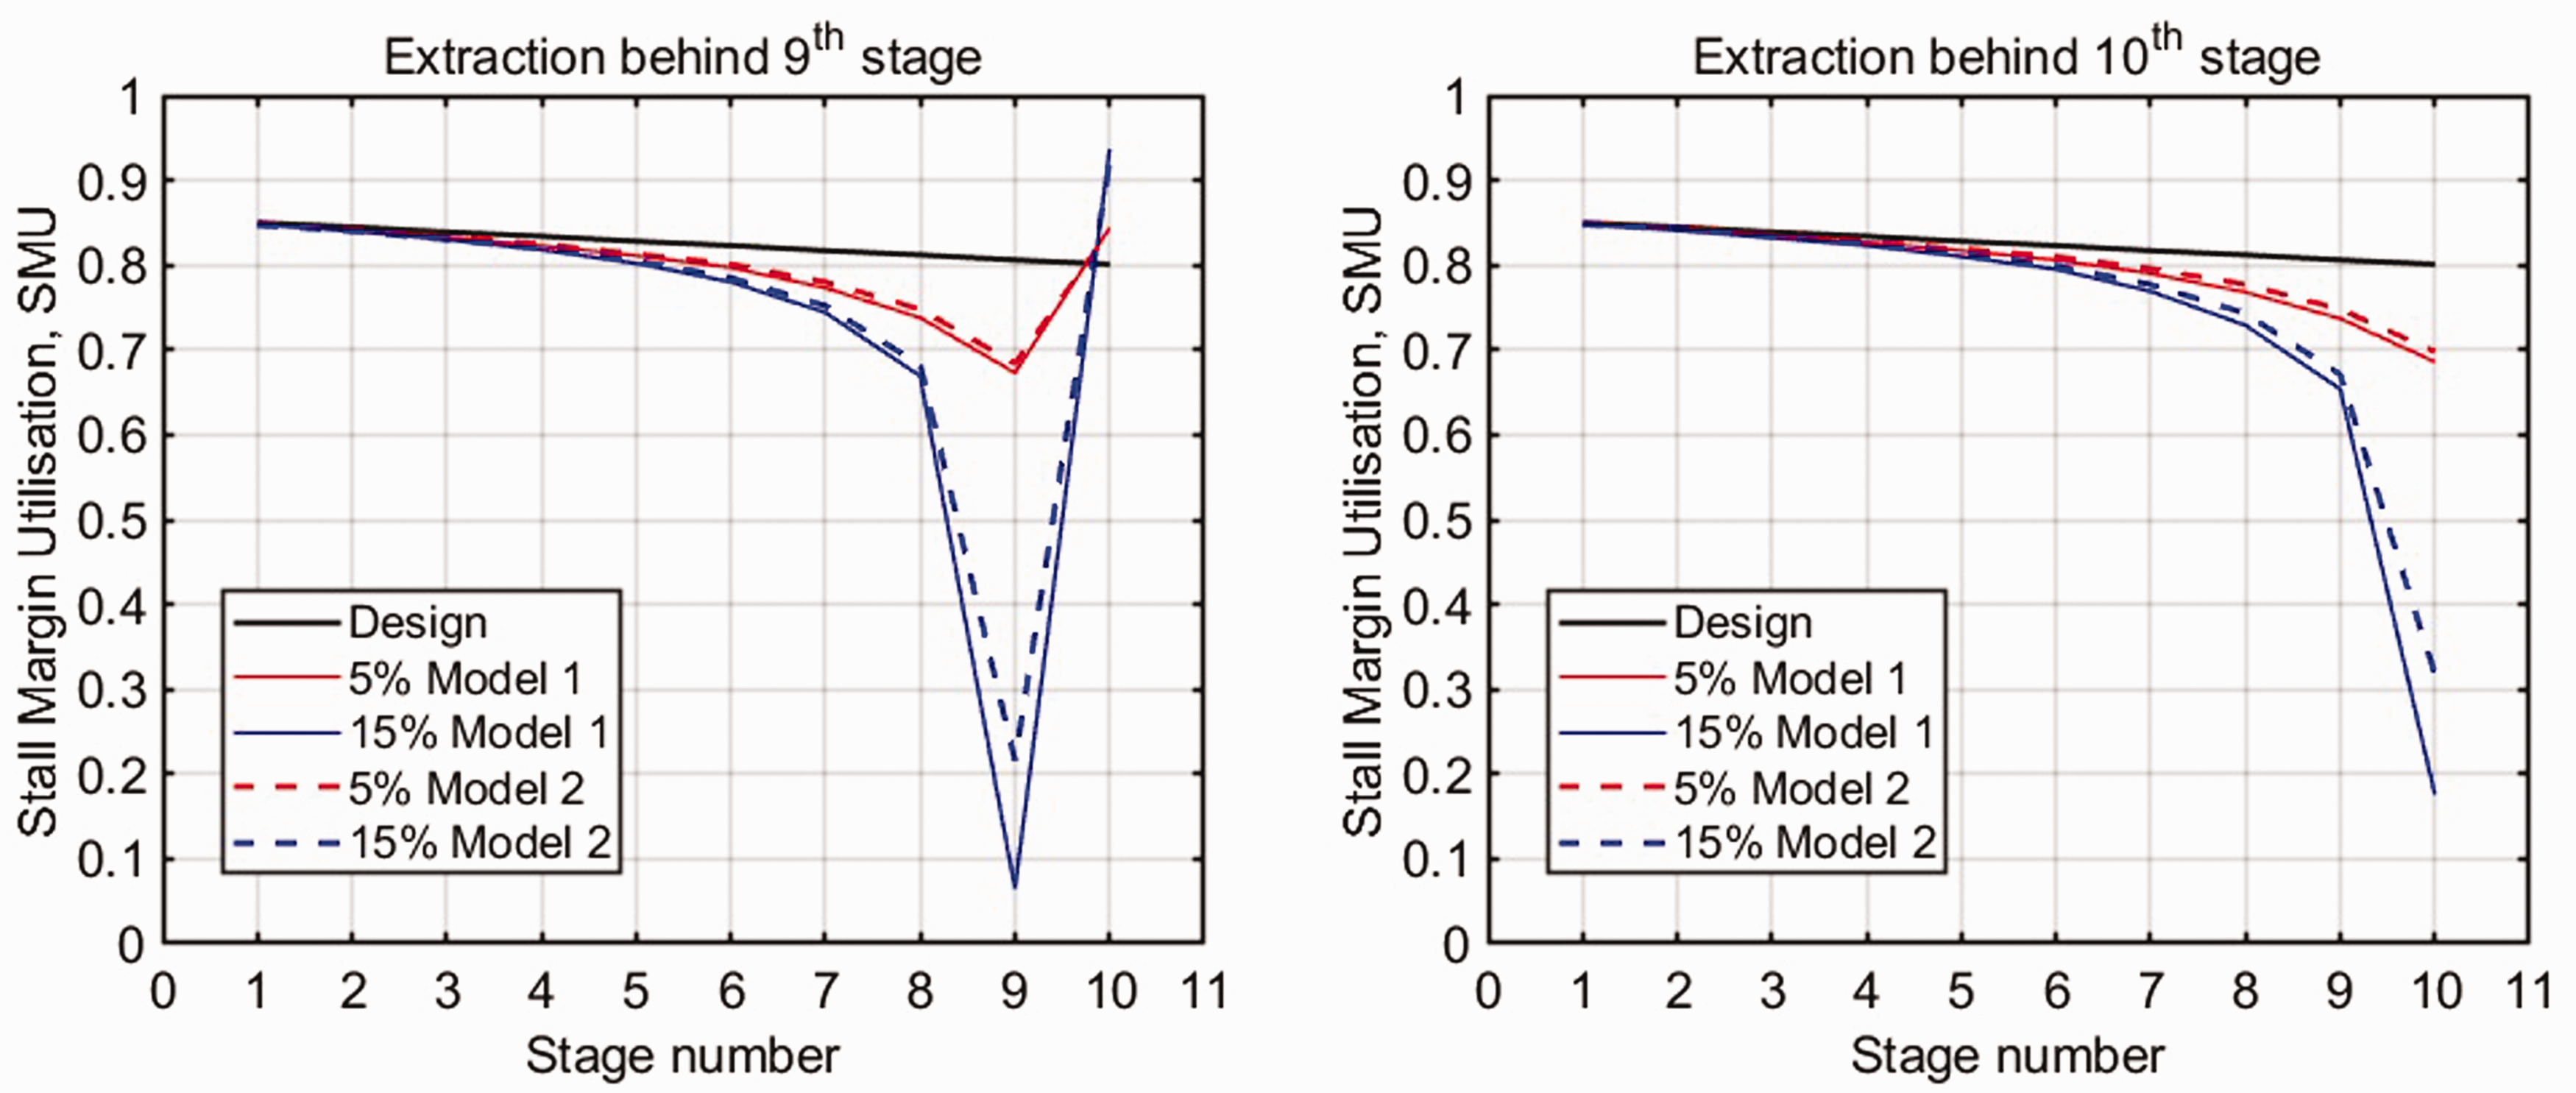
For the injection behind stage 10, model 2 provides a small SMU advantage over model 1 as shown in Figure 15, owing to higher values of stall PRs and CMF that is evident in Figure 16. The stage map in Figure 16 also shows that the CMF at the inlet of the stage reduces. This is a result of the increased back pressure in the turbine; as such, all the stages also experience a reduction in the CMF at their inlet.
SMU for varied flow injection – both models. Map of stage 10th for flow injection – both models. Individual stage isentropic efficiency for varied flow extraction. Effect of air injections on PO – enlarged graph.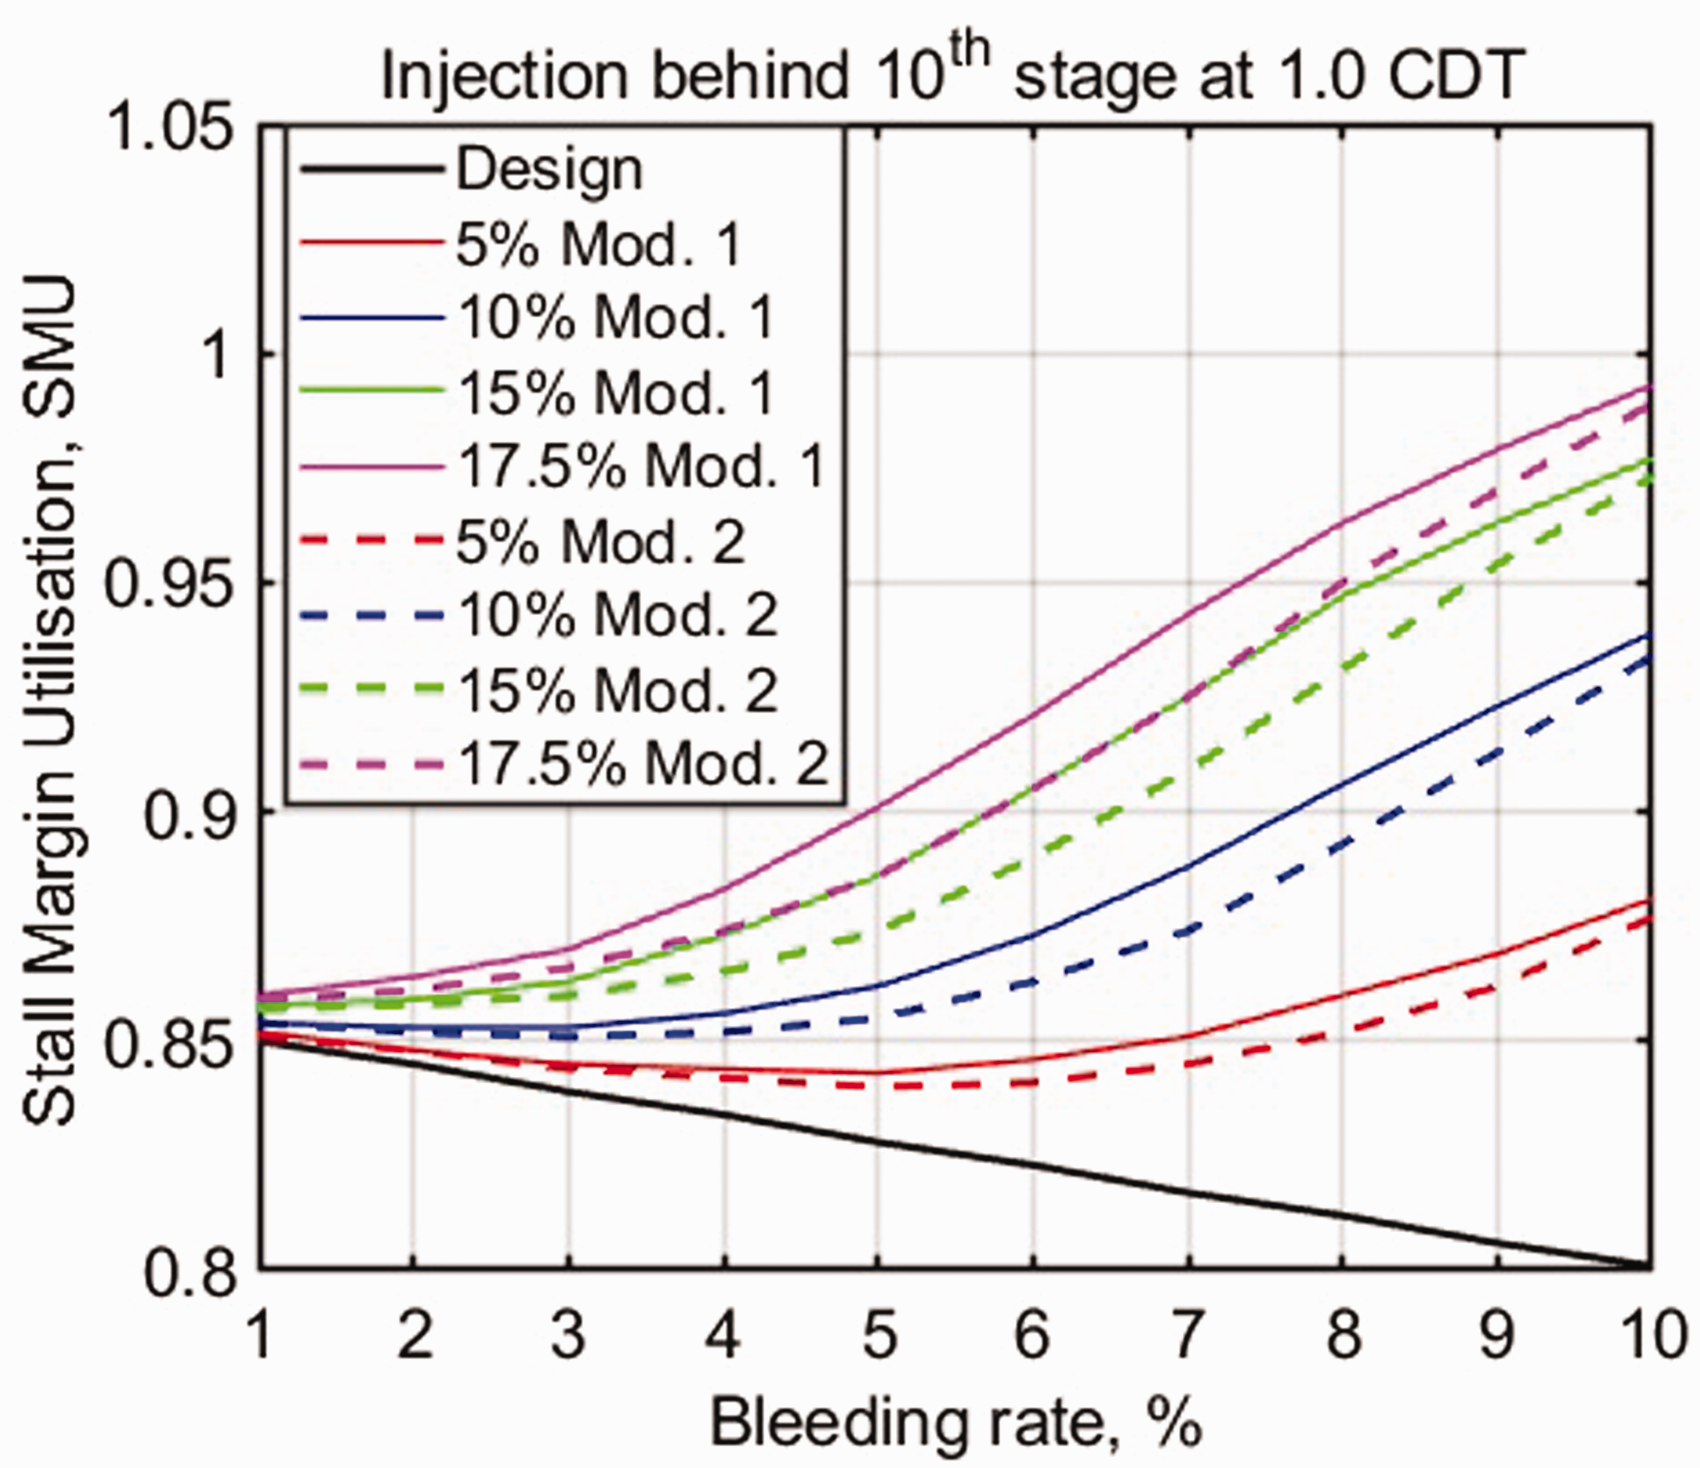
Performance changes of both models with air injection behind the 10th stage.
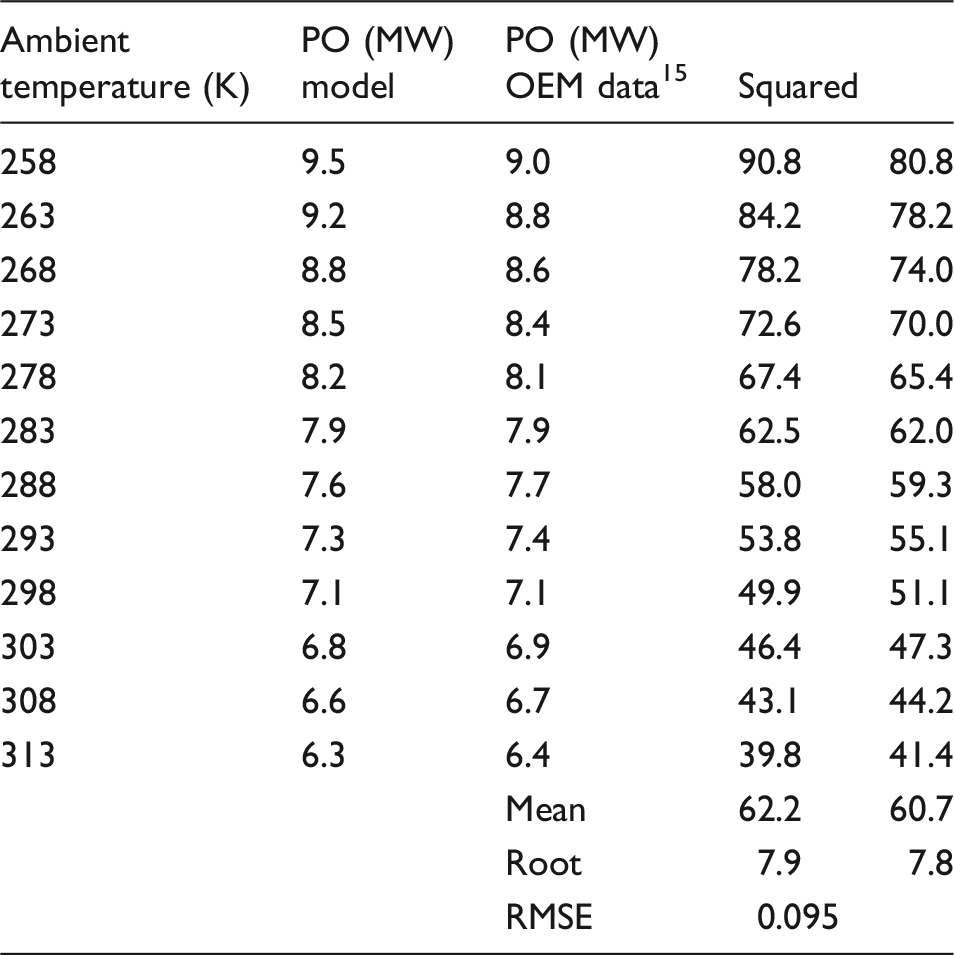
RMSE between model and OEM data for PO versus ambient temperature.
Limitations
Mixing losses associated with aerodynamic effects are not considered in this study. The influence of these on the rear stage extraction and injection typically around a diffuser is expected to be minimal for the compressor. The size and shape of the diffuser for which the flow is mostly axial will determine the extent to which any flow distortion can be accommodated before entry into the combustor.
Conclusion
This study has investigated the impact of energy storage demands and requirements (high specific heat and maximising storage – increased mass flow) on the performance and operability of the GT engine system. For this steady-state analysis, the following is worth highlighting:
Rear inter-stage flow extraction is generally not problematic but only at exceptional bleed values above 15%. This value can be extended when the extraction is after the last stage. Nevertheless, this brings a bigger penalty in loss of power and thermal efficiency due to more bleeding of further compressed air. In practice, this may be less of an issue when the demand for power is low. The best location for air extraction is after the last stage. In this location, all the individual stage SMU are in safe operational range. The inter-stage extraction is shown to increase the PR of the subsequent stages, thereby increasing their SMU. The severity of this is shown to be amplified with a further rise in the bleed amount. The mass flow reduction based on the bleed amount proves to be the more dominant factor in the PO reduction than the location of air extraction. At constant COT and injection behind the last stage, the PO increases up to 41.4% at 20% injection rate. This, in fact, leads to stall in the last stage, and avoidance of this is a choice of 17.5% that brings about a 36% rise in PO. This outcome has to be interpreted also with respect to the specification of the individual stage SMU at the design point, for which larger margins were specified at the back stages. It must be indicated that the high end of the injection rate is less likely to be achieved in practice. The extent of this would be determined by the compressor aerodynamic design. The combustor stability and durability are also of concern, and high fidelity model in CFD and experimental studies is needed to determine the limits of high flow extractions and injections. Increasing the temperature of the injected fluid in relation to the design CDT can bring a benefit to thermal efficiency but decrease in PO that is synonymous to using a recuperator. The results show that the opposite is the case for the lower injection temperature. At constant PO, utilising injected flow can bring about a significant reduction in the COT that can offer benefits in life extension of hot section components, even at low injection ratios. Stage loading or PR distribution can have an influence on the maximum amount of flow extraction. For air injection, both models show closer SMU performance.
Footnotes
Declaration of Conflicting Interests
The author(s) declared no potential conflicts of interest with respect to the research, authorship, and/or publication of this article.
Funding
The author(s) received no financial support for the research, authorship, and/or publication of this article.