
Abstract
The United Kingdom has placed itself on a transition towards a low-carbon economy and society, through the imposition of a legally-binding goal aimed at reducing its ‘greenhouse gas’ emissions by 80% by 2050 against a 1990 baseline. A set of three low-carbon, socio-technical transition pathways were developed and analysed via an innovative collaboration between engineers, social scientists and policy analysts. The pathways focus on the power sector, including the potential for increasing use of low-carbon electricity for heating and transport, within the context of critical European Union developments and policies. Their development started from narrative storylines regarding different governance framings, drawing on interviews and workshops with stakeholders and analysis of historical analogies. The quantified UK pathways were named Market Rules, Central Co-ordination and Thousand Flowers; each reflecting a dominant logic of governance arrangements. The aim of the present contribution was to use these pathways to explore what is needed to realise a transition that successfully addresses the so-called energy policy ‘trilemma,’ i.e. the simultaneous delivery of low carbon, secure and affordable energy services. Analytical tools were developed and applied to assess the technical feasibility, social acceptability, and environmental and economic impacts of the pathways. Technological and behavioural developments were examined, alongside appropriate governance structures and regulations for these low-carbon transition pathways, as well as the roles of key energy system ‘actors’ (both large and small). An assessment of the part that could possibly be played by future demand side response was also undertaken in order to understand the factors that drive energy demand and energy-using behaviour, and reflecting growing interest in demand side response for balancing a system with high proportions of renewable generation. A set of interacting and complementary engineering and techno-economic models or tools were then employed to analyse electricity network infrastructure investment and operational decisions to assist market design and option evaluation. This provided a basis for integrating the analysis within a whole systems framework of electricity system development, together with the evaluation of future economic benefits, costs and uncertainties. Finally, the energy and environmental performance of the different energy mixes were appraised on a ‘life-cycle’ basis to determine the greenhouse gas emissions and other ecological or health burdens associated with each of the three transition pathways. Here, the challenges, insights and opportunities that have been identified over the transition towards a low-carbon future in the United Kingdom are described with the purpose of providing a valuable evidence base for developers, policy makers and other stakeholders.
Keywords
Introduction
The energy and climate change context
Human development is underpinned by energy sources of various kinds that heat, power and transport its citizens in their everyday life. The evolution of modern industrialised society has been interwoven with discoveries of sources and uses of energy, especially the exploitation of fossil fuel resource stocks and the assembly of energy system infrastructures. Endowed with abundant coal reserves, Britain lay at the heart of the first industrial revolution, and from the 1870s electric power underpinned a second industrial revolution in countries like the newly-united Germany and the United States. Nowadays, while energy supplies and technologies underscore continued economic development, they also give rise to unwanted side-effects. They simply differ in terms of their geographic scale and level of severity between different energy options. Arguably the principle environmental side-effect of the energy sector is the prospect of global warming due to an enhanced greenhouse effect induced by combustion-generated pollutants.1,2 Electricity generation, for example, presently contributes approximately 30% of UK carbon dioxide (CO2) emissions;3,4 the principal greenhouse gas (GHG) having an atmospheric residence time of about 100 years. 1 This share mainly arises from the use of fossil fuel (coal and natural gas) combustion for this purpose. Changes in atmospheric concentrations of GHGs affect the energy balance of the global climate system. Thus, human activities have led to quite dramatic increases since 1950 in the ‘basket’ of GHGs incorporated in the Kyoto Protocol; concentrations have risen from 330 ppm to about 430 ppm currently. 2 Prior to the first industrial revolution in the 18th century the atmospheric concentration of Kyoto gases was only some 270 ppm. The most recent (2013) scientific assessment by the Intergovernmental Panel on Climate Change (IPCC) 2 states that it is extremely likely that humans are the dominant influence on the observed global warming since the mid-20th century. The British Government has therefore introduced a tough, legally binding target of reducing the nation’s CO2 emissions overall by 80% by 2050 in comparison to a 1990 baseline 5 in their 2008 Climate Change Act. 6 The 2015 Paris Agreement following the COP21 meeting in that city aims to keep temperatures ‘well below 2 ℃ above pre-industrial levels and to pursue efforts to limit the temperature increase to 1.5 ℃ above pre-industrial levels.’ 7 The 2 ℃ figure is broadly consistent with the 2050 UK CO2 emissions target. However, bottom-up pledges received by countries prior to the Paris Conference (the so-called intended nationally determined contributions (INDCs)) for national GHG mitigation efforts are expected by analysts of the United Nations Framework Convention on Climate Change (UNFCCC) 7 to result in a warming of around 2.7 ℃. So the world still faces a significant challenge of reducing GHG emissions further in order to bring global warming into line with the aspirations in the Paris Agreement.
Energy policy in the United Kingdom has moved over the last decade from an emphasis on climate change mitigation towards considerations of affordability and security of supply. These reflect the three components of what has become known as the energy policy trilemma. 8 End-use energy demand is likely to remain roughly around its current level, although the energy transition out to the mid-21st century will require some switching towards greater electricity use, particularly for heating and transport. Consequently, achieving the UK CO2 emissions reduction target 6 will require a greater emphasis on systems for producing, delivering and using energy that is not only low carbon, but also secure and affordable for consumers both large and small. 8 The preferred route to a decarbonised power generation system 9 is likely to be a mix of renewables (mainly onshore and offshore wind power), nuclear power and fossil-fuelled power plants with CO2 capture and geological storage (commonly known as carbon capture and storage (CCS) 10 ). The UK Government is supportive of building a new generation of nuclear reactors to replace those currently undergoing decommissioning, but their recent cancellation of the £1 bn CCS competition suggests that this technology may have an uncertain future in Britain. In any event, the UK electricity supply network is in need of major renewal and reconfiguration in terms of both power plants and grid infrastructure over the coming decades. 11
The transitions approach
A Dutch transitions approach or transitions theory has influenced their national policy on promoting energy system transitions,
12
and stimulated historical case studies, including applications to the Dutch electricity system.
13
It has been used to examine the dynamic interaction of technological and social factors at different levels, and has generated significant international policy and research interest.14,15 This analytical framework is typically coupled with a multi-level perspective (MLP) for analysing socio-technical transitions, based on co-evolution at and between three levels16,17: niche innovations, socio-technical regimes and macro-landscape pressures (see Figure 118). The landscape represents the broader political, social and cultural values and institutions that form the deep structural relationships of a society and only change slowly. The socio-technical regime reflects the prevailing set of routines or practices used by actors, which create and reinforce a particular technological system.
19
In contrast, the existing regime is thought of as generating incremental innovation, whilst radical innovations are generated in niches. The latter are spaces that are at least partially insulated from normal market selection in the regime. Niches provide places for learning processes to occur, and space to build up the social networks that support innovations, such as supply chains and user–producer relationships. Further conceptual work has developed a more detailed typology of transition pathways
20
in response to critiques and insights in the academic literature.
21
An initial theoretical analysis of past and possible future decarbonisation pathways for the United Kingdom
22
shows the potential for the application of the transitions approach to the United Kingdom. Geels et al.
23
recently illustrated the application of the MLP for a comparative analysis of low-carbon electricity transitions in Germany and the United Kingdom.
Possible ‘Transition Pathways’ and the factors that influence them.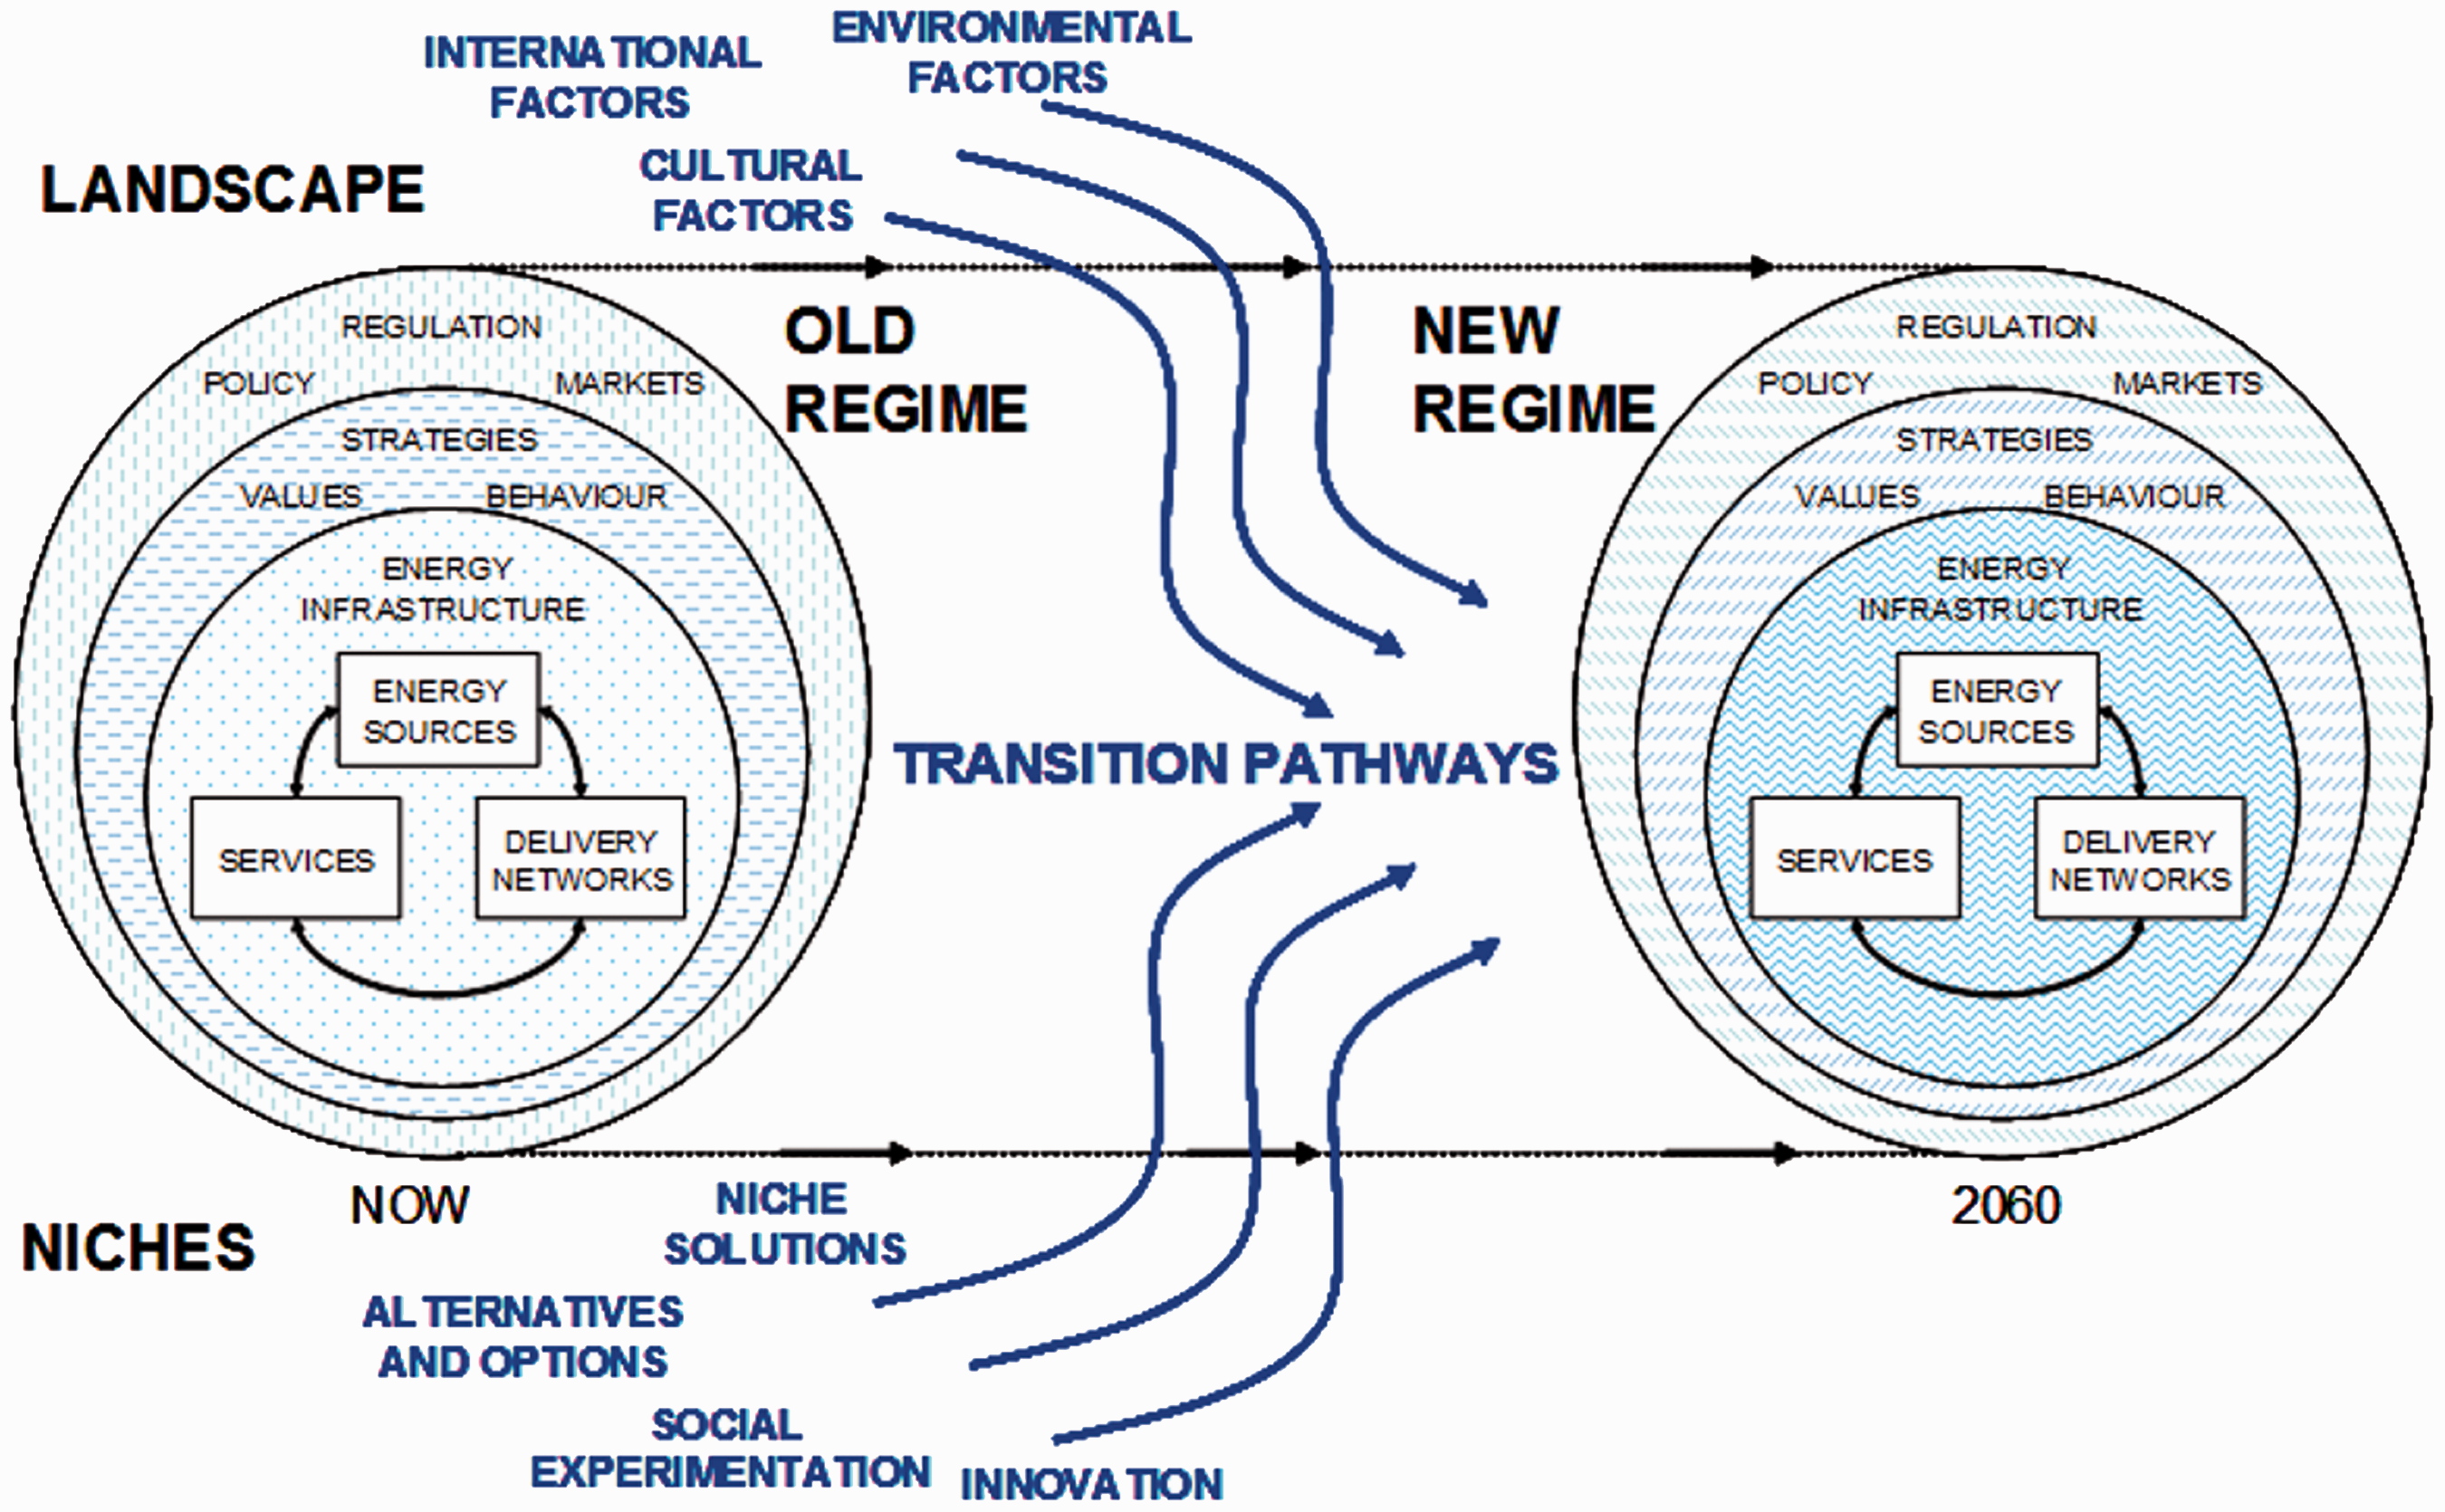
Key characteristics of the UK transition pathways.
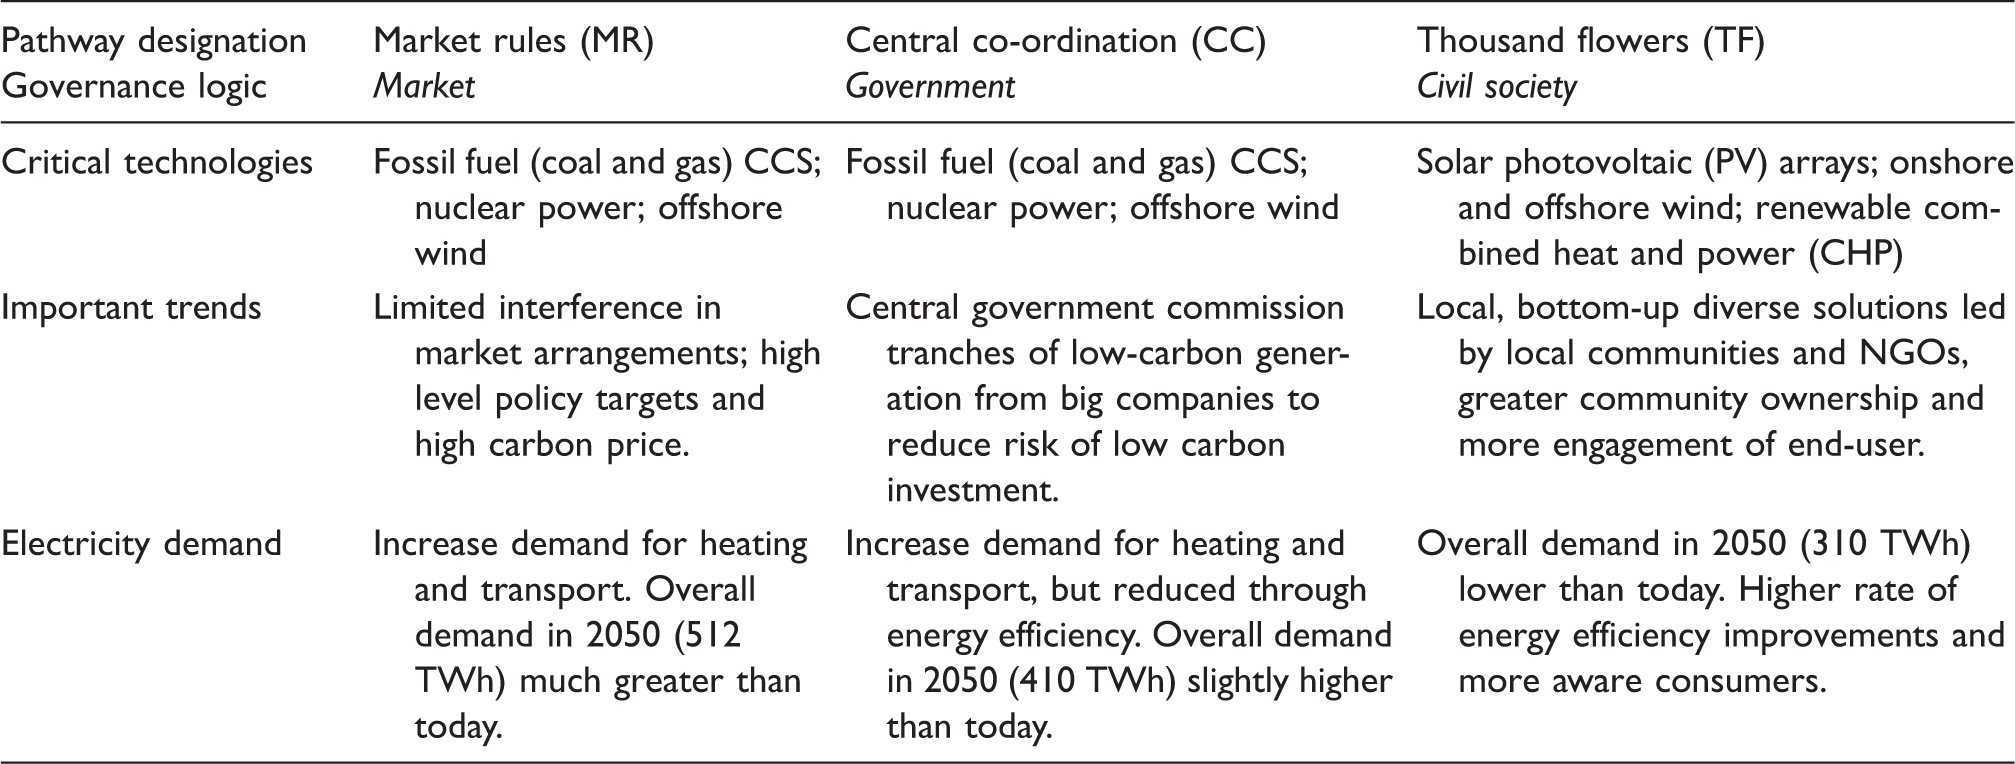
Source: Adapted from Foxon. 24
The issues considered
The successor (second phase) study by the same research consortium is entitled Realising Transition Pathways – Whole Systems Analysis for a UK More Electric Low Carbon Energy Future, and has been funded solely by the EPSRC. It has been aimed at using the pathways to explore what is needed to realise a transition that successfully addresses the energy policy trilemma. The pathways again focus on the power sector, including the potential for increasing use of low-carbon electricity for heating and transport, although within the context of key European developments and policies. Analytical tools were developed and applied to assess the technical feasibility, social acceptability and environmental and economic impacts of the pathways. An assessment of the role of future demand responses was also undertaken in order to understand the factors that drive energy demand and energy-using behaviour, and to explore the growing value of flexible demand as the proportion of intermittent generation on the system increases. A set of interacting and complementary techno-economic models or tools were then employed to analyse electricity network infrastructure investment and operational decisions, in order to assist market design and subsidy mechanisms. This provided a basis for integrating the analysis within a whole-systems framework of electricity system development, together with the evaluation of future economic costs, benefits, risks and uncertainties. ‘A Whole Systems Approach considers all the factors and elements involved, including how they relate to each other, how they work together as a whole, what the system needs to develop, thrive, and evolve in its environment, and how the system impacts and interacts with its surrounding environment, including how the system will be able to respond and evolve as needs and the surrounding environment change’ (after Ward 25 ). Finally, the energy and environmental performance of the different energy mixes were appraised, again on a life-cycle basis, in order to determine the GHG emissions and other ecological or health burdens associated with each of the three transition pathways. These pathways have recently been compared and contrasted with official UK Government energy scenarios, alongside the technology implications. 26 This paper identifies challenges, insights and opportunities in relation to the transition towards a low-carbon future in the United Kingdom by synthesising the range of analysis undertaken within this research, in order to provide a valuable evidence base for developers, policy makers and other stakeholders.
The transition pathways demand and supply portfolios
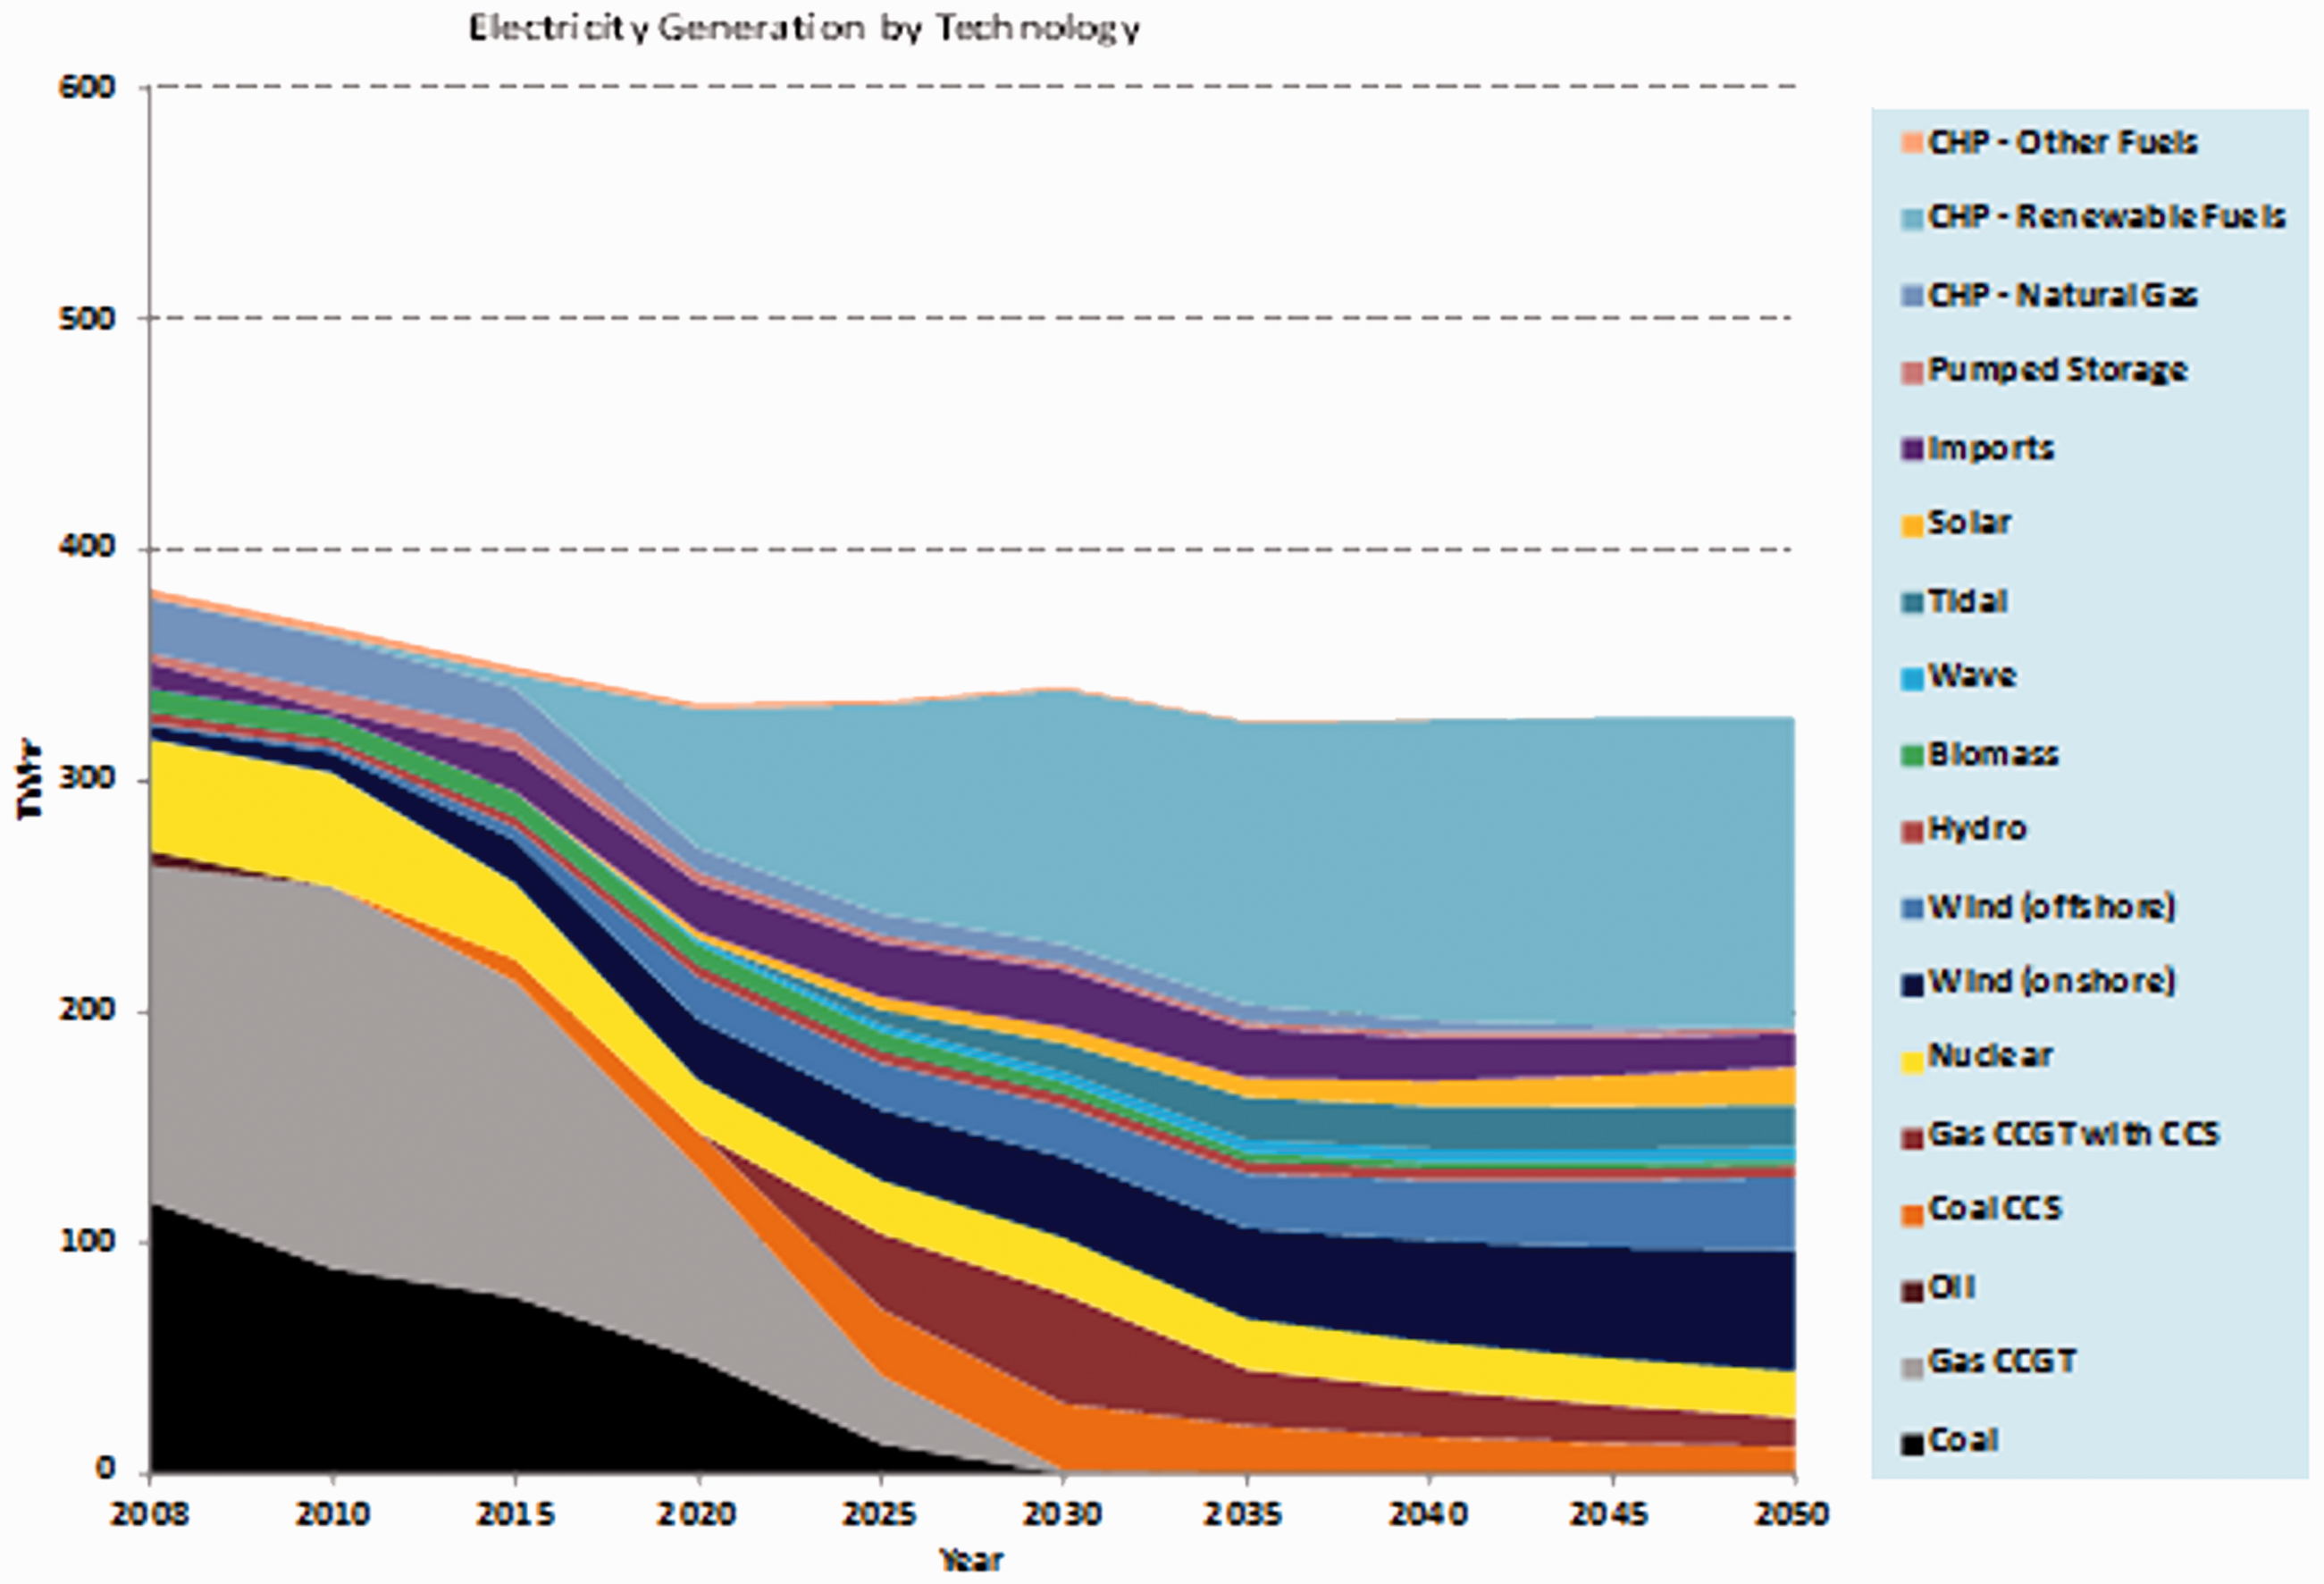
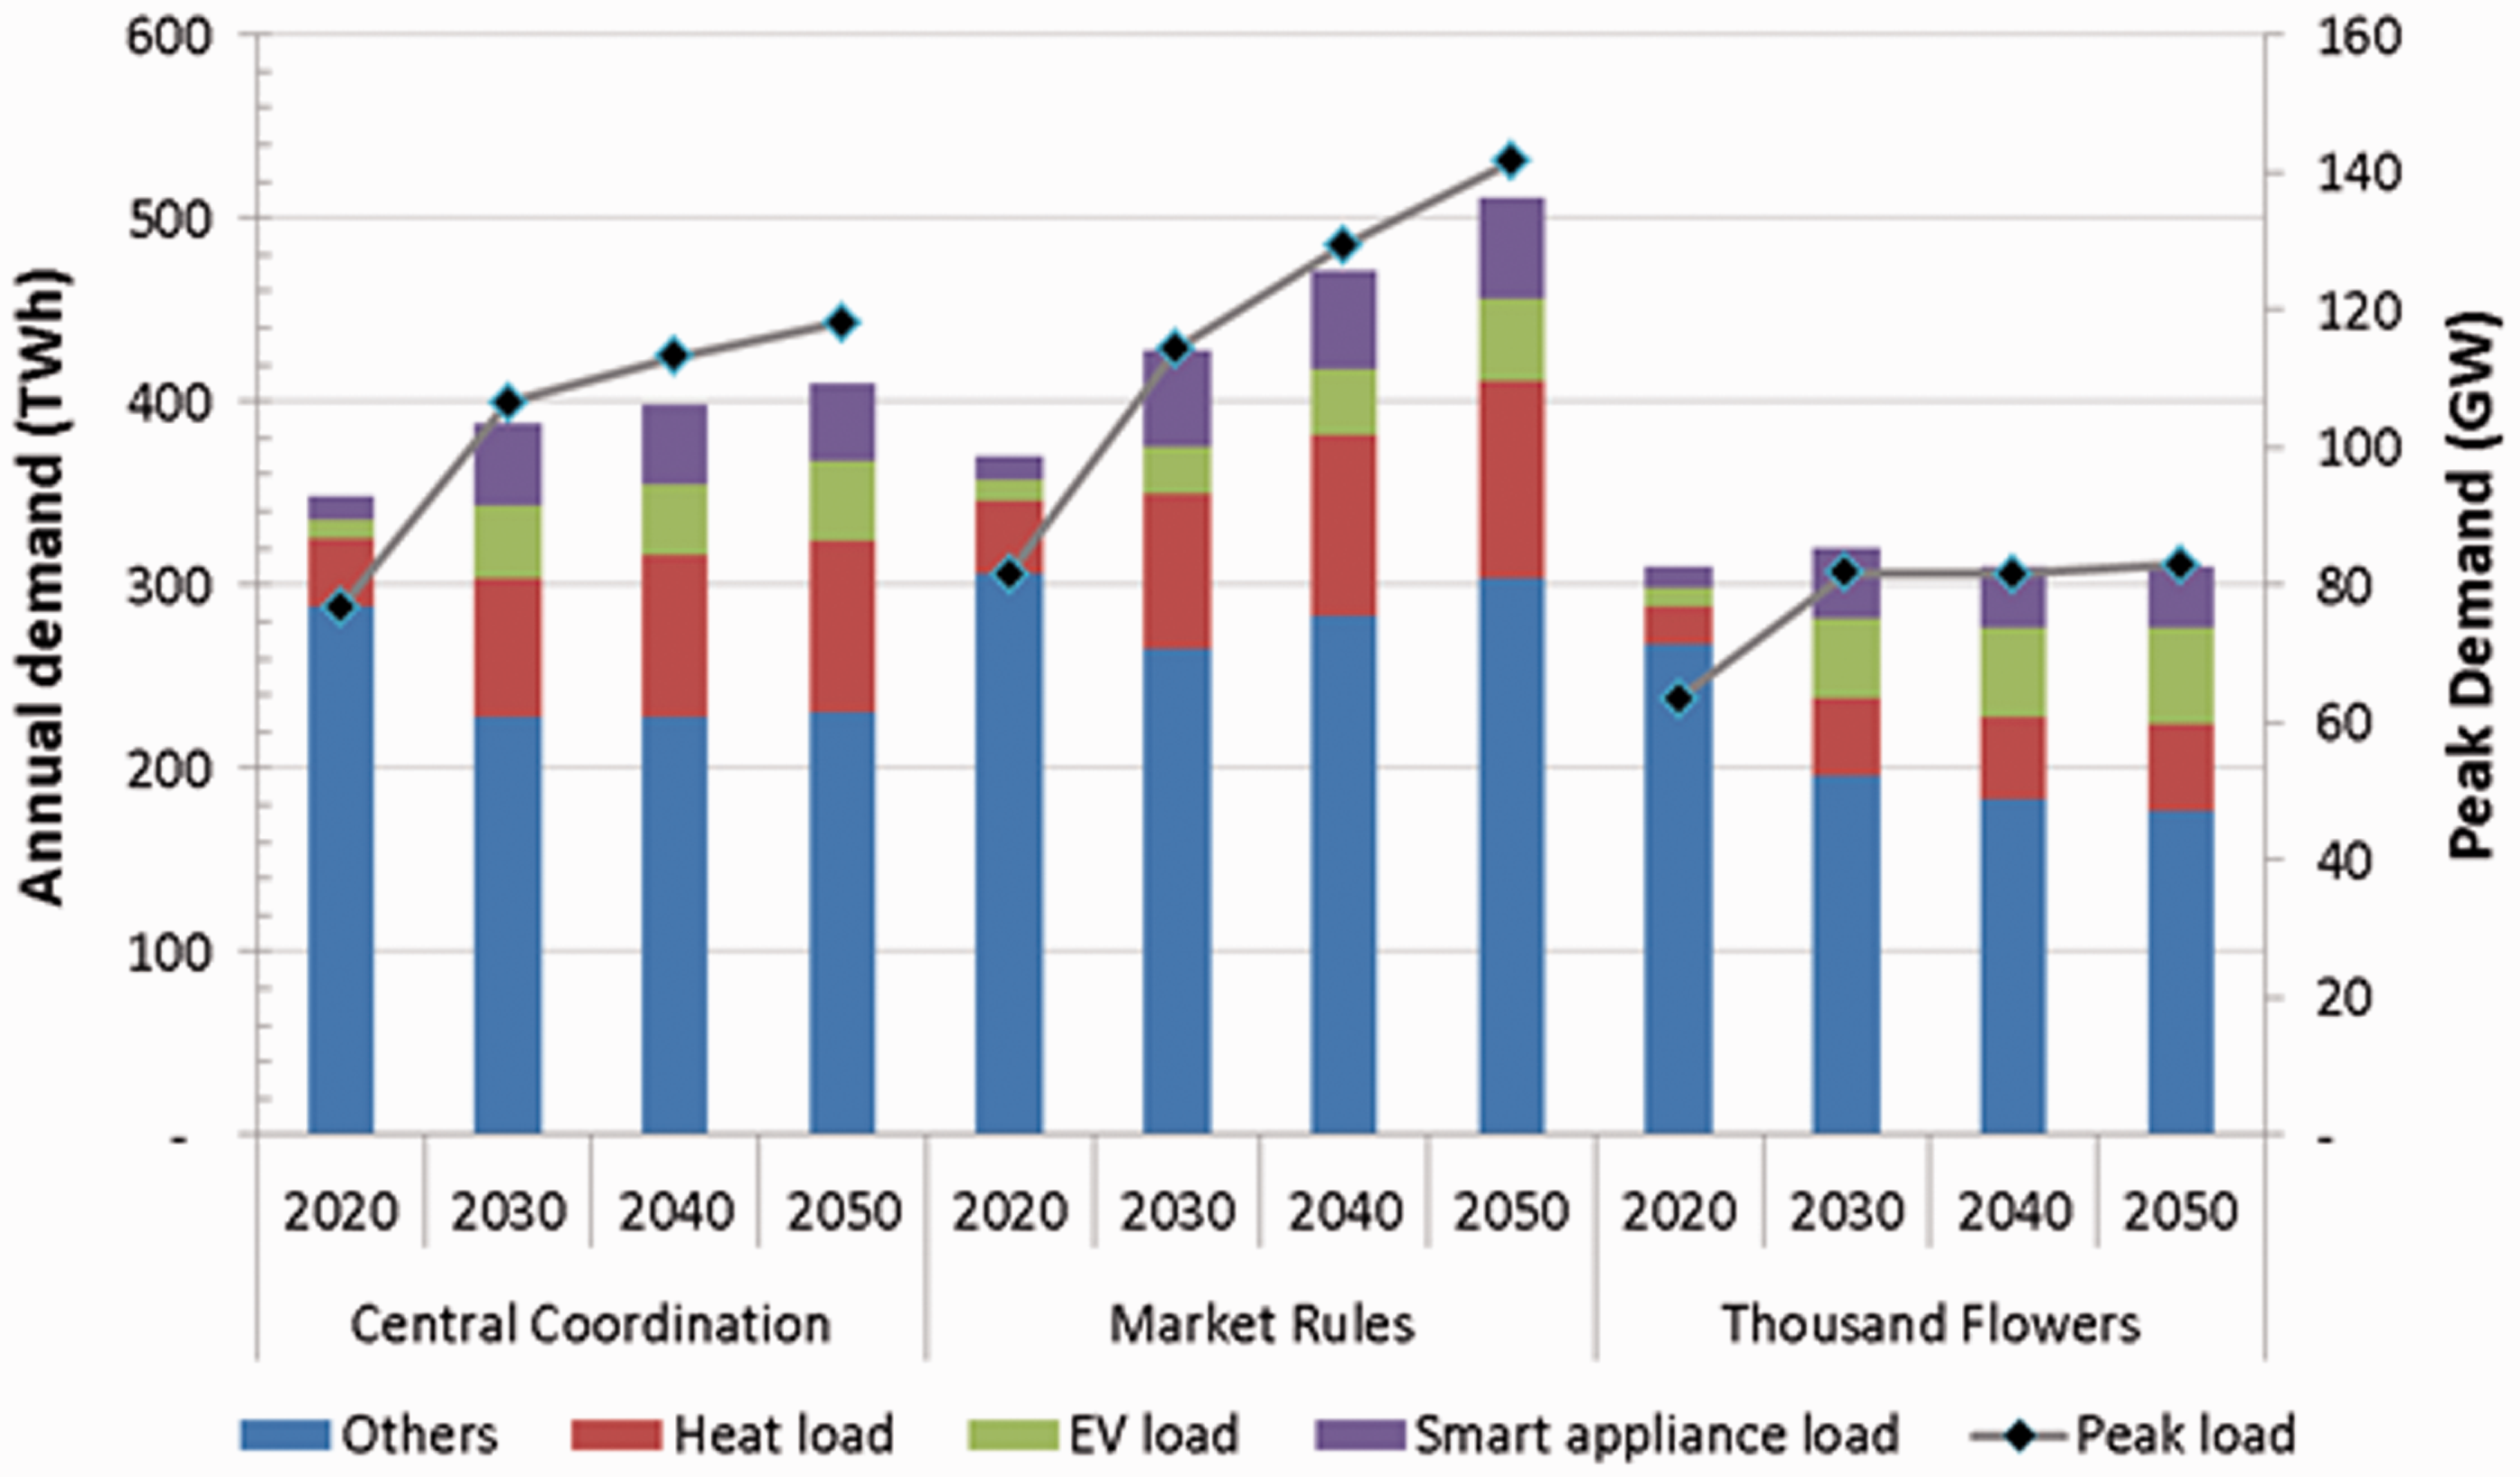
An iterative approach was used to provide quantification of the demand and supply profiles for the transition pathways to 2050, by iterating between the narrative storylines and exploration of the pathways with a range of modelling and analysis tools. 24 Key characteristics of the three transition pathways are summarised in Table 1. 24 The starting point for the quantification of version 2.1 these pathways was the projection of annual electricity demand by sector from 2010 to 2050.26,28 In the MR pathway, annual electricity demand rises from 337 TWh in 2010 to about 512 TWh in 205026,28 (see again Table 1), due to increasing use of electricity for industry, commercial, transport and domestic space heating and hot water. In contrast, annual electricity demand under the CC pathway rises from 337 TWh in 2010 to some 410 TWh in 205026,28 (Table 1). This pathway sees electricity demand rising and then levelling off from 2030 onwards, due to increasing use of electricity for transport and domestic space heating and hot water. However, it suggests higher rates of energy efficiency improvements in the domestic sector, and a smaller, highly efficient industrial sector with lower levels of output. This would imply that some energy-intensive UK production has moved to other countries, increasing the national consumption of goods produced abroad, implying that UK carbon emissions calculated on a consumption basis would continue to diverge from those on a production basis. Finally, under the TF pathway, the annual electricity demand falls from 337 TWh in 2010 to only around 310 TWh in 205026,28 (Table 1). Despite similar levels of electrification of transport to that in the other pathways, electricity demand falls due to even higher rates of energy efficiency improvements in the domestic and commercial sectors. Again, a small, highly efficient industrial sector with low levels of output aids the reduction in electricity demand. In all pathways, a significant amount of energy is used in industry and commerce for space heating and water heating. The provision of this heat is mostly via the same technologies as in the domestic sector of each pathway but often on a larger scale. Thus, in the MR and CC pathways, an increasing amount of electricity is used in heat pumps in the industrial and commercial sectors. This increase in demand for electricity for heating and hot water is additional demand to that required for electrification of transport, and it leads to a significant rise in total final electricity demand in these pathways. However, under the TF pathway, the total final electricity demand remains stable up to 2050, as the increase in transport electricity consumption is offset by reductions in demand as a result of energy efficiency improvements. Thus, there is no rise in electricity demand for heating and hot water under the TF pathway, mainly due to the expansion of community-scale renewable combined heat and power (CHP).
The associated demand projections for version 2.1 of all the pathways
26
are met by rising levels of low-carbon electricity generation, including different generation capacities of renewables, nuclear power and fossil fuels (e.g. coal and, in the future, mainly gas) with CCS, operating at different capacity factors. The detailed generation capacity schedule for each pathway from 2010 to 2050 is reported by Barnacle et al.
27
and Barton et al.
28
: see Figures 2 to 4 (corresponding demand projections were presented graphically by Barton et al.
26
). In 2010, the United Kingdom had around 95 GW of electricity generation capacity, including 29 GW of coal and dual-fuel generation, 33 GW of gas-fired generation, 11 GW of nuclear power, 9 GW of renewable generation and 6 GW of CHP cogeneration.27,28 Significant amounts of capacity are then required to come on stream under the MR pathway in the 2020s
26
(see Figure 2). Subsequently, 21 GW of fossil-fuelled with CCS, 15 GW of nuclear power and 47 GW of renewables (47 GW) by 2030,
26
giving a total capacity of around 130 GW by 2030.27,28 This deployment leads to further increases in capacity in order to meet rising electricity demand over following decades, particularly from industry and electrification of heating and transport.
26
Thus, a total of some 168 GW of capacity is installed by 2050, including 44 GW of fossil-fuelled generation with CCS, 26 GW of nuclear power, and 80 GW of renewable capacity, principally from onshore (23 GW) and offshore (30 GW) wind turbines, tidal power (12 GW) and renewable CHP (9 GW).
26
Generation capacity in the Market Rules pathway for the UK.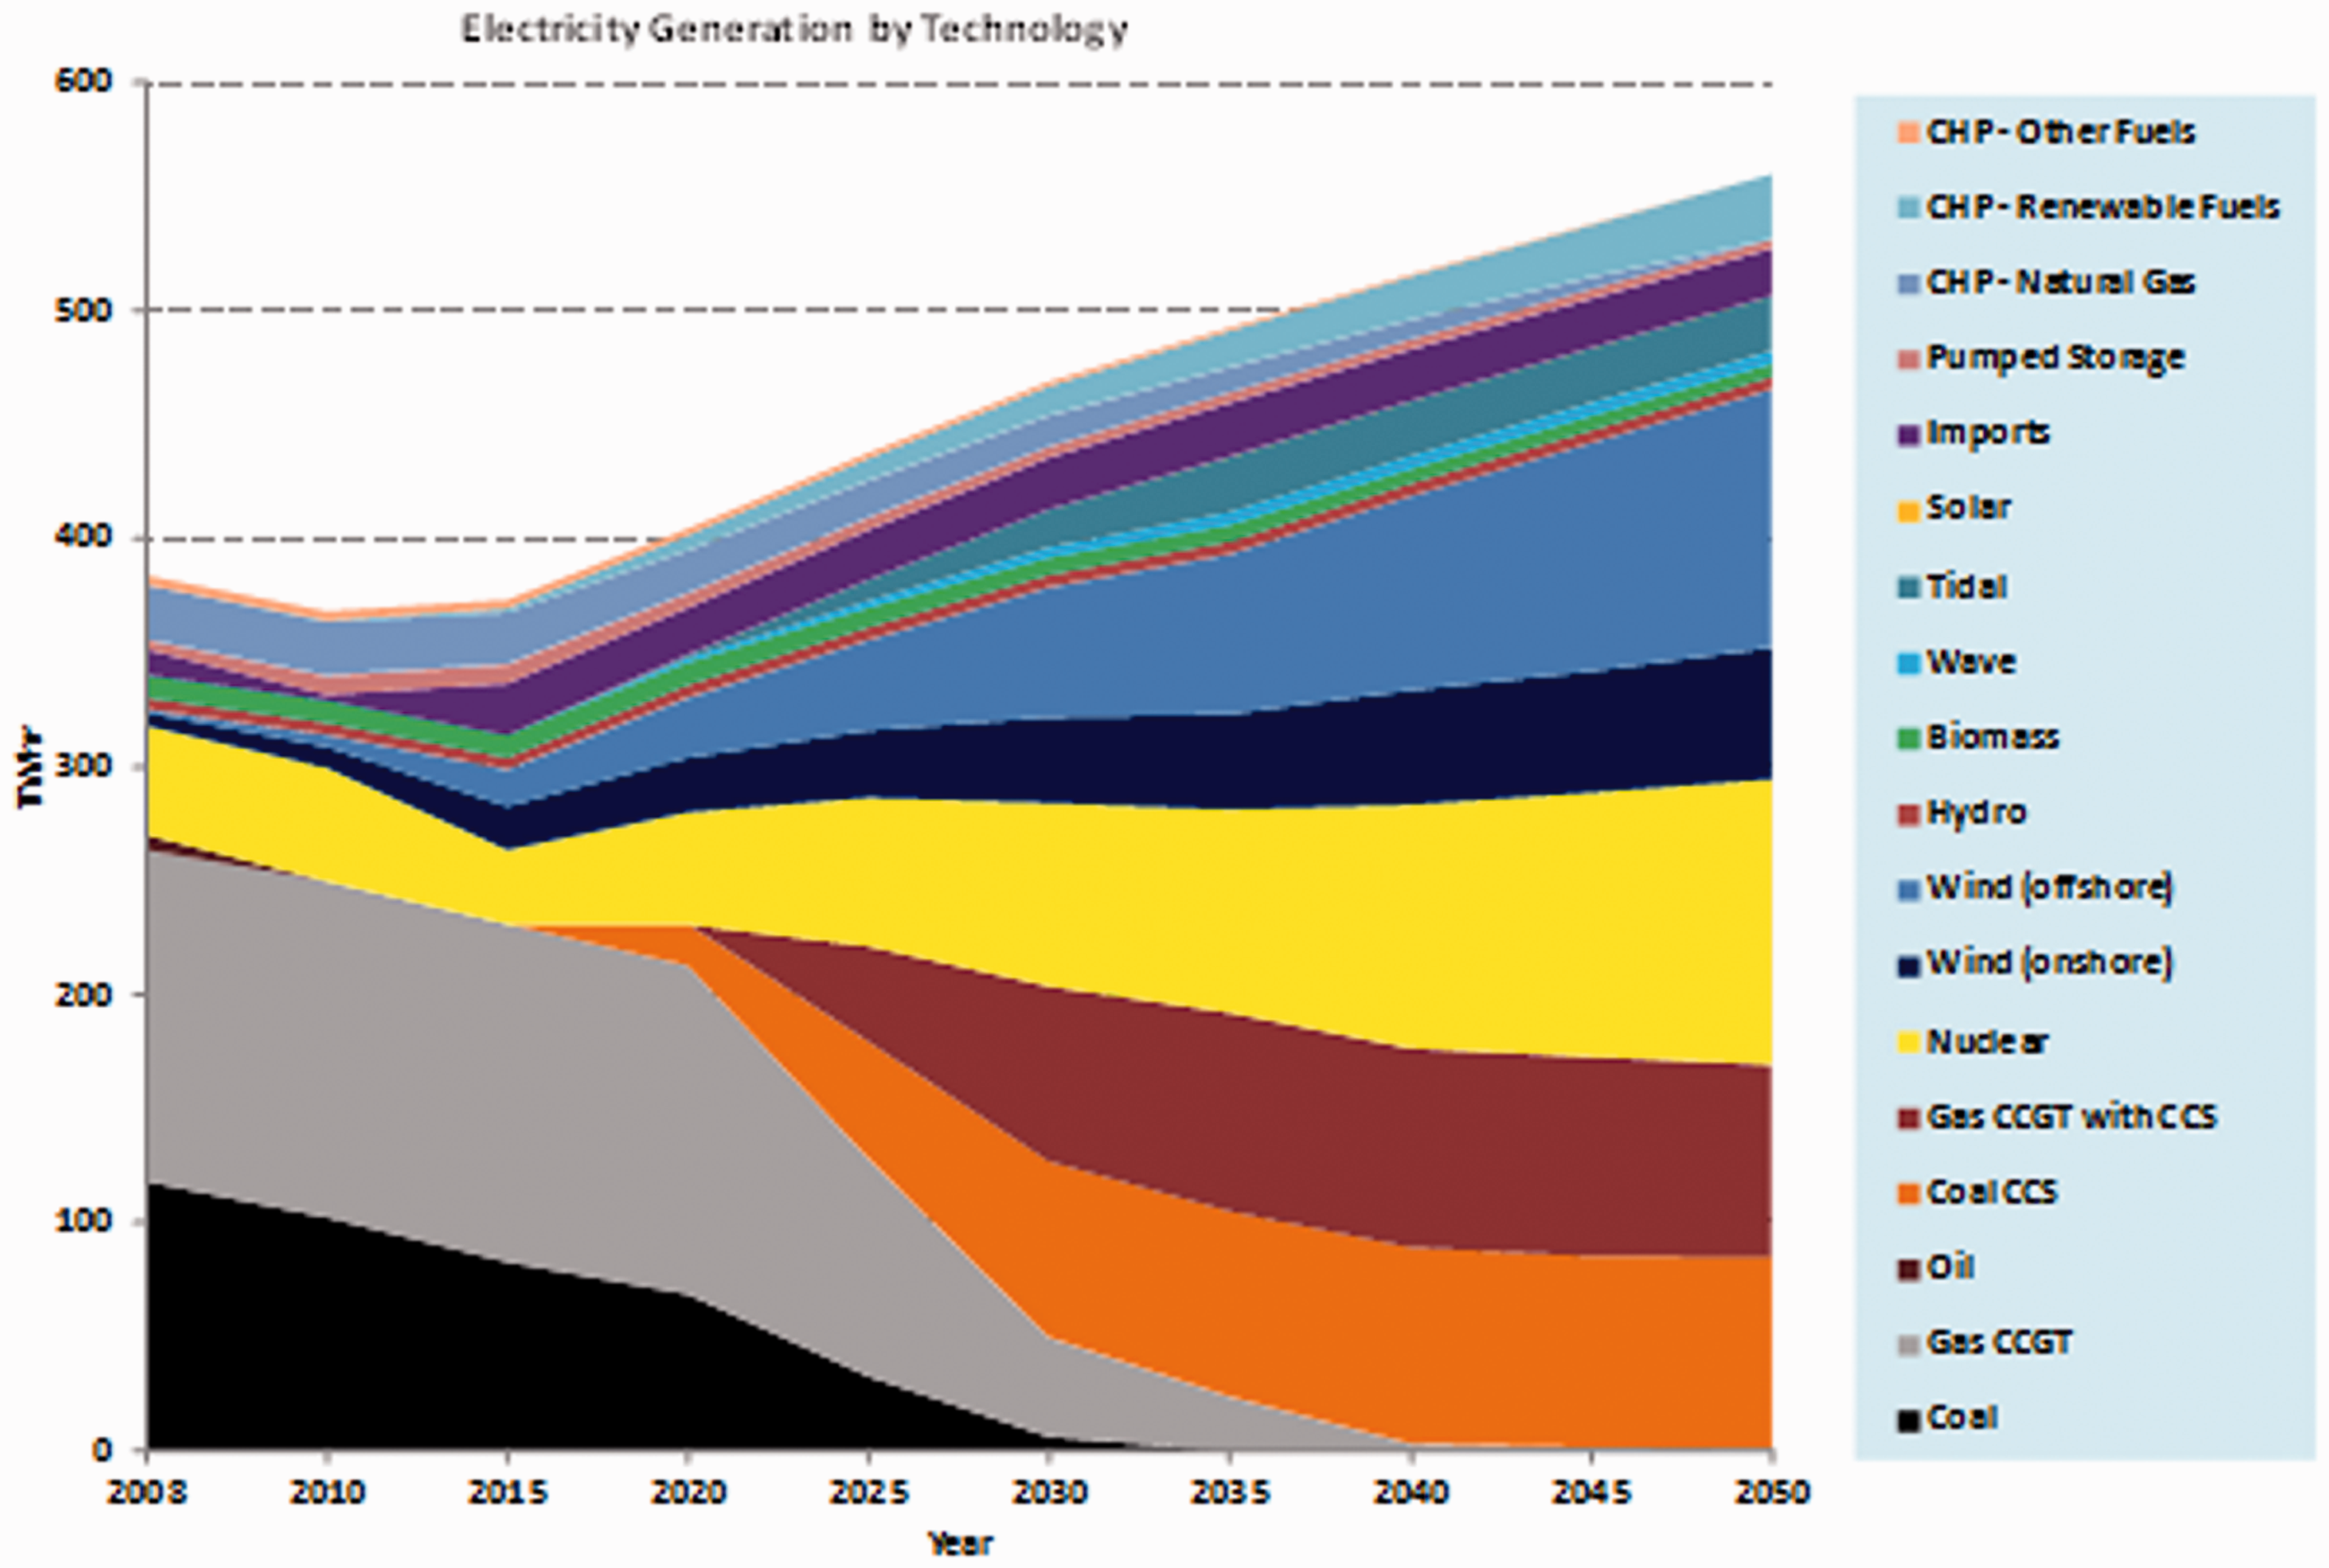
There are likely to be similar investments in all types of low-carbon generation capacity under the CC pathway during the 2020s
26
(see Figure 3); perhaps co-ordinated by a Strategic Energy Agency. This could lead to a total of some 122 GW in 2030, including high levels of nuclear power (22 GW), slightly lower levels of fossil-fuelled power generation with CCS (18 GW), and less renewables (43 GW).27,28 Electricity demand levels off under this pathway, but further power plant deployment would be required in order to increase the capacity to about 151 GW in total by 2050.
26
The main contributions are likely to come from nuclear power (30 GW) and fossil-fuelled power generation with CCS (30 GW), although the latter operates at a lower capacity factor (36%), because it again partly provides a back-up for intermittent renewables (65 GW).
26
Finally, action by community groups as well as local and regional Energy Service Companies (ESCos) under the TF pathway result in a significant expansion of community-based and microscale renewable CHP installed from 2020 onwards.
26
This reaches a total capacity of 37 GW by 2030 and about 149 GW by 205027,28 (see Figure 4). This is at a similar level to that under the CC pathway, although most plant is made up of renewable generation (112 GW). A significant proportion of demand under the TF pathway is met by local-scale renewables
26
; from renewable (biogas) community-scale and micro-CHP systems (44 GW), followed by onshore wind turbines (21 GW), solar photovoltaic (PV) arrays (16 GW) and offshore wind farms (8 GW). There are also likely to be some low-carbon investments in earlier periods; possibly leading to 22 GW of fossil-fuelled power plant with CCS and 5 GW of nuclear capacity by 2050.
Generation capacity in the Central Co-ordination pathway for the UK. Generation capacity in the Thousand Flowers pathway for the UK.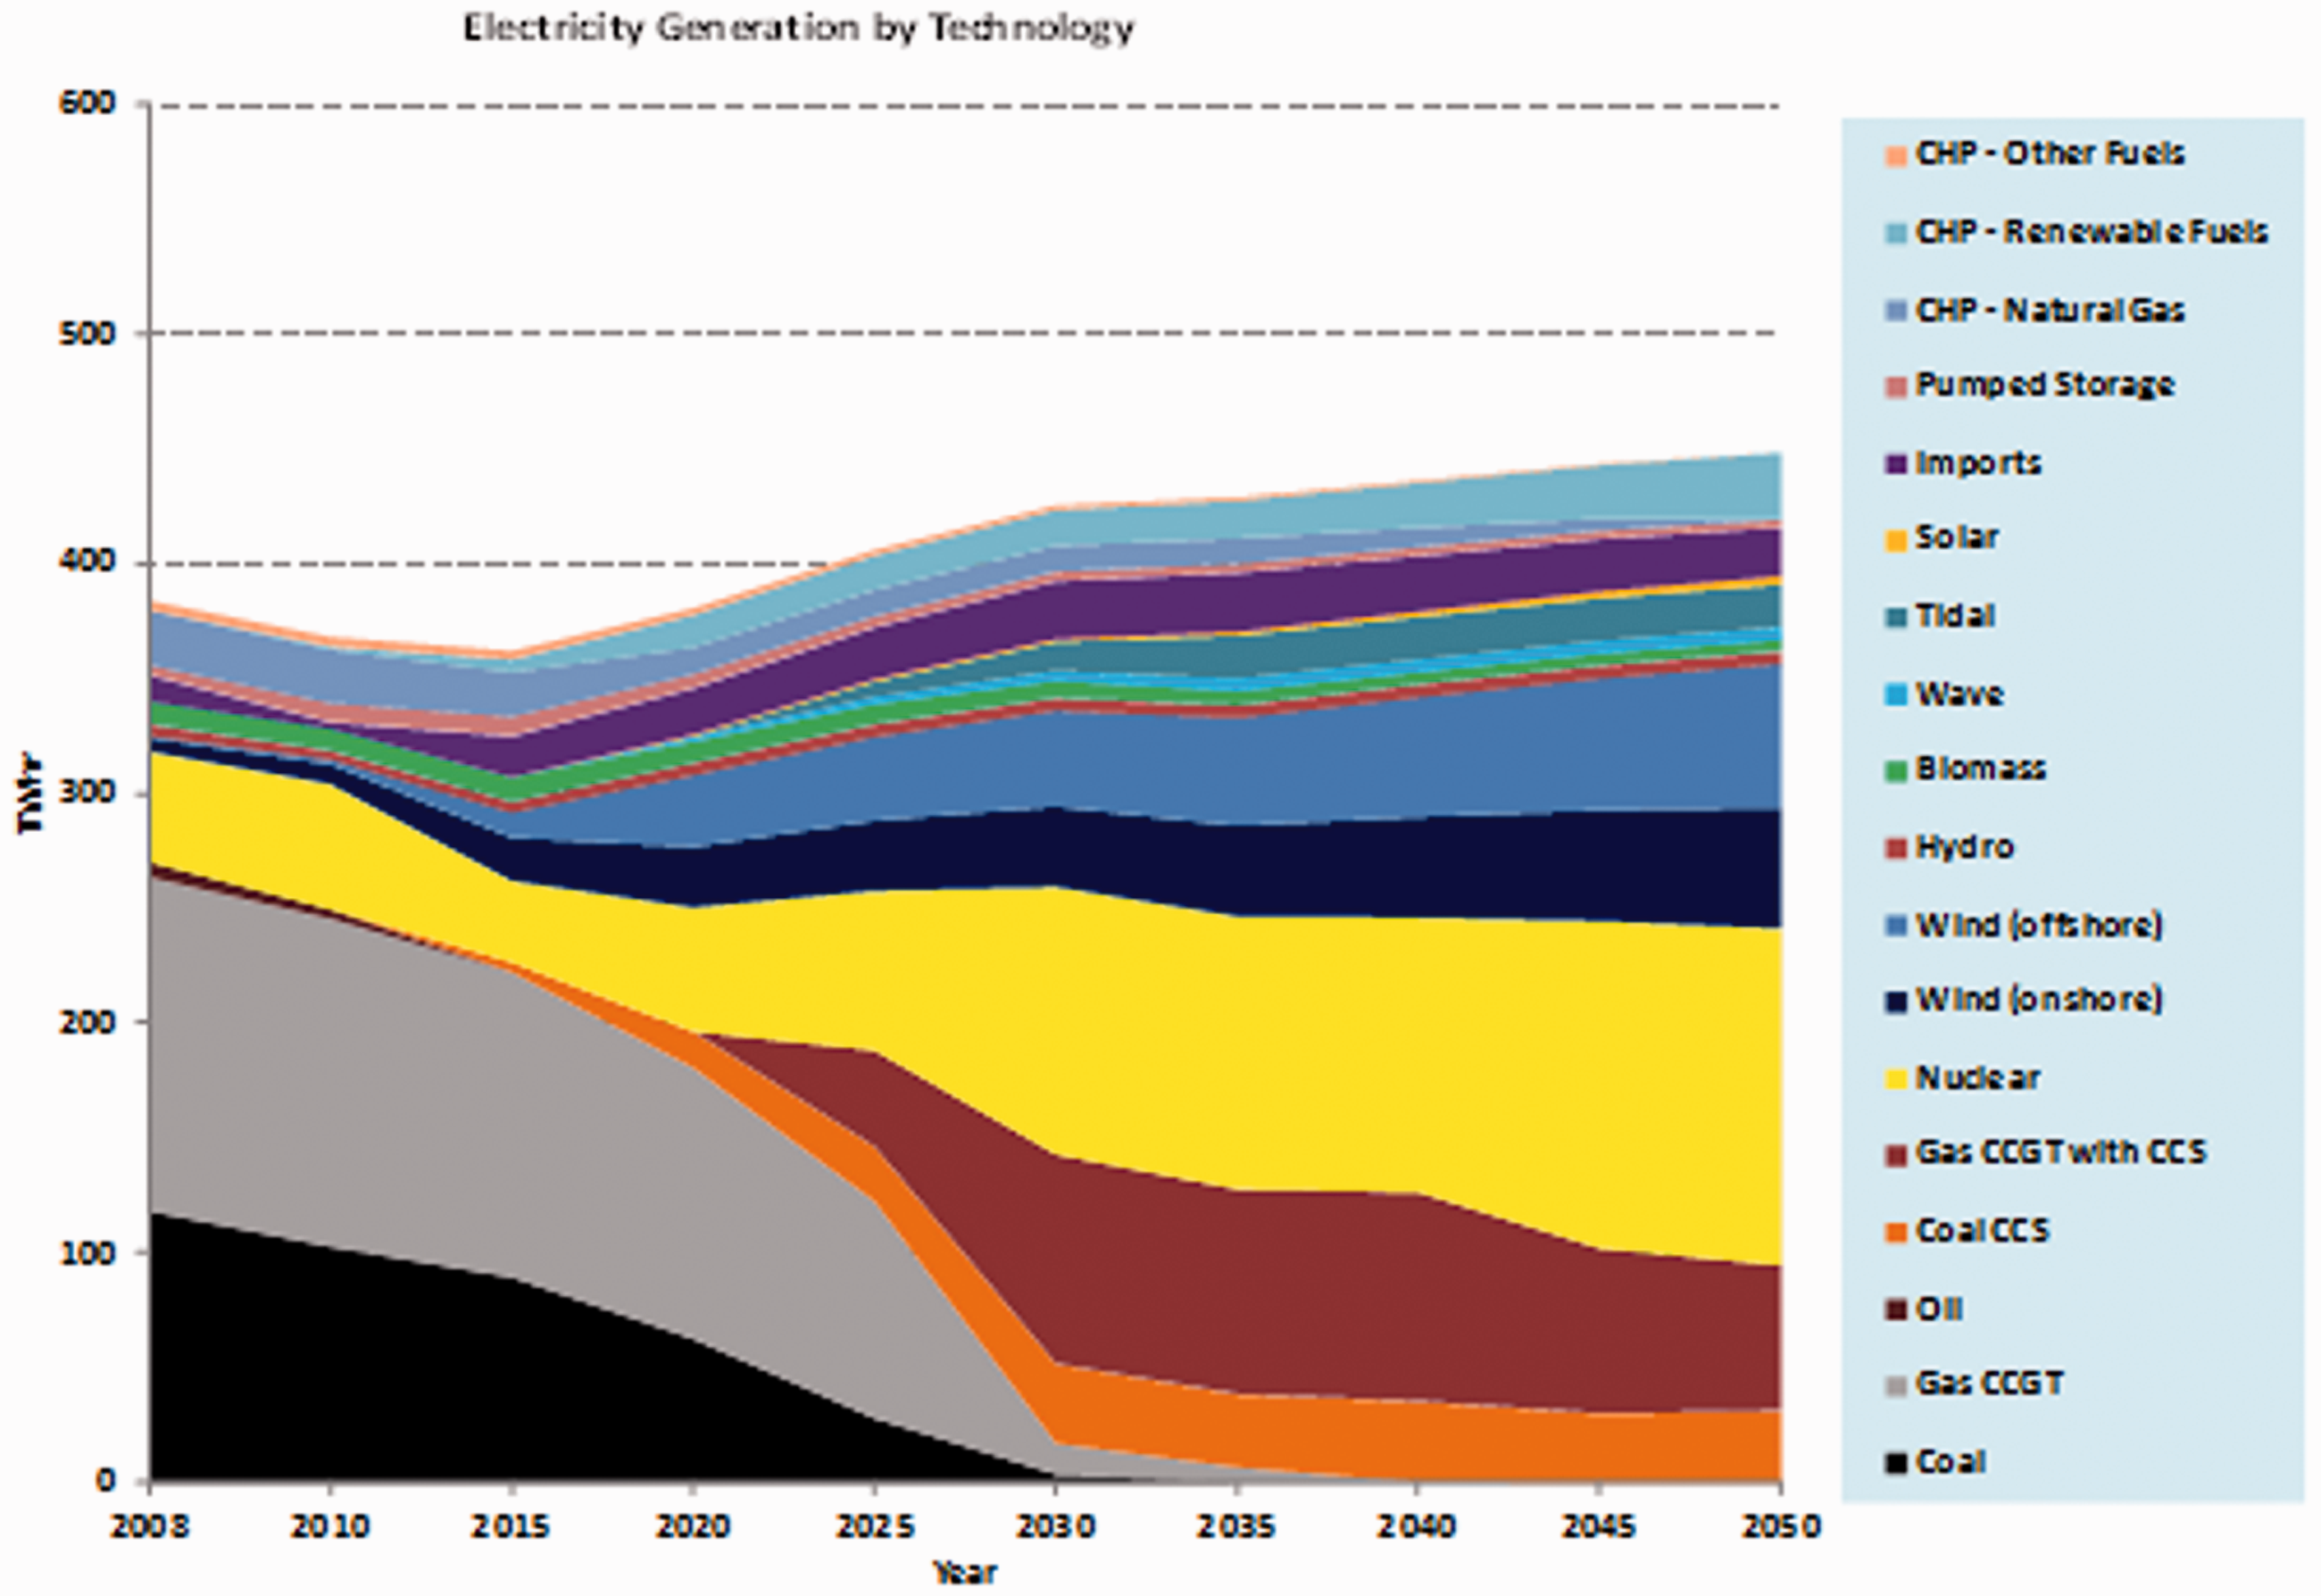
Insights from historical transitions
The present transition pathways consortium has sought to learn from past socio-technical transitions in order to help explore future transitions and what might enable or avoid them. Studies of historical energy and infrastructure transitions have helped understand the dynamics and timing of transitions (see, e.g. Wilson and Grubler 29 ). While most attention has been paid to transition successes, belated attention is now being paid to transition failures and resistance to change by incumbent firms, as well as their fuels, technologies and institutions. Historical case studies also help illustrate the possibility of radical or rapid transformation; and raise questions about the received wisdom regarding past successes/failures of socio-technical transitions, policies and technologies. The value of historical case studies as analogues lies not in their perfect fit with modern technologies or circumstances (which is unlikely), but in being similar in one or more aspects.
Two supply-side case studies have been carried out by Johnson et al.
30
to compare transition experiences and branching points of emerging alternative liquid fuels in Britain during previous recession and growth periods between the First and Second World Wars (WWI and WWII), i.e. 1918–1938. The case studies focussed on alcohol fuel produced by the Distillers Company Ltd. (DCL) for power generation and a petrol-from-coal produced by Imperial Chemical Industries (ICI). Both fuels received government support during a time of rapid growth in the motor industry, fluctuating economic conditions and fears of absolute oil shortages. They represent examples of failed attempts at path creation and transition. Nevertheless, the studies
30
identified the importance of network infrastructure, ownership of this infrastructure, and the impact of energy security on prevailing governance logics. It built on the governance framings or logics of the action-space framework (see Figure 5); conceptualised by Jacquie Burgess, Tom Hargreaves and other colleagues in the predecessor transitions pathways project.
8
It illustrates the three governance logics, or ways of framing energy challenges, whereby interactions in the action-space vary with circumstances and actor agency.
24
Johnson et al.
30
observed that when energy is seen as ‘insecure,’ it tends to be framed as a social service (or article of warlike material) rather than a commodity, with growing political legitimacy of policy interventions. They found that crude oil market instability, support for a declining coal industry, and militaristic needs all motivated the search for these alternative liquid fuels in the inter-war period. Governance of fuel distribution had significant effects on the economic feasibility of both fuels and their ability to penetrate a market dominated by the oil industry incumbents. Changing characteristics of energy security influenced the framing of energy and shifts in government support for alternative transport fuels. Lack of state regulation of incumbent oil company cartels and access to fuel distribution infrastructure impeded emergence of these new fuels. This analysis of failed attempts at path creation
30
can therefore usefully inform understanding of current energy governance and low carbon transitions.
The dynamic relationship between energy security, framing of energy and governance logics.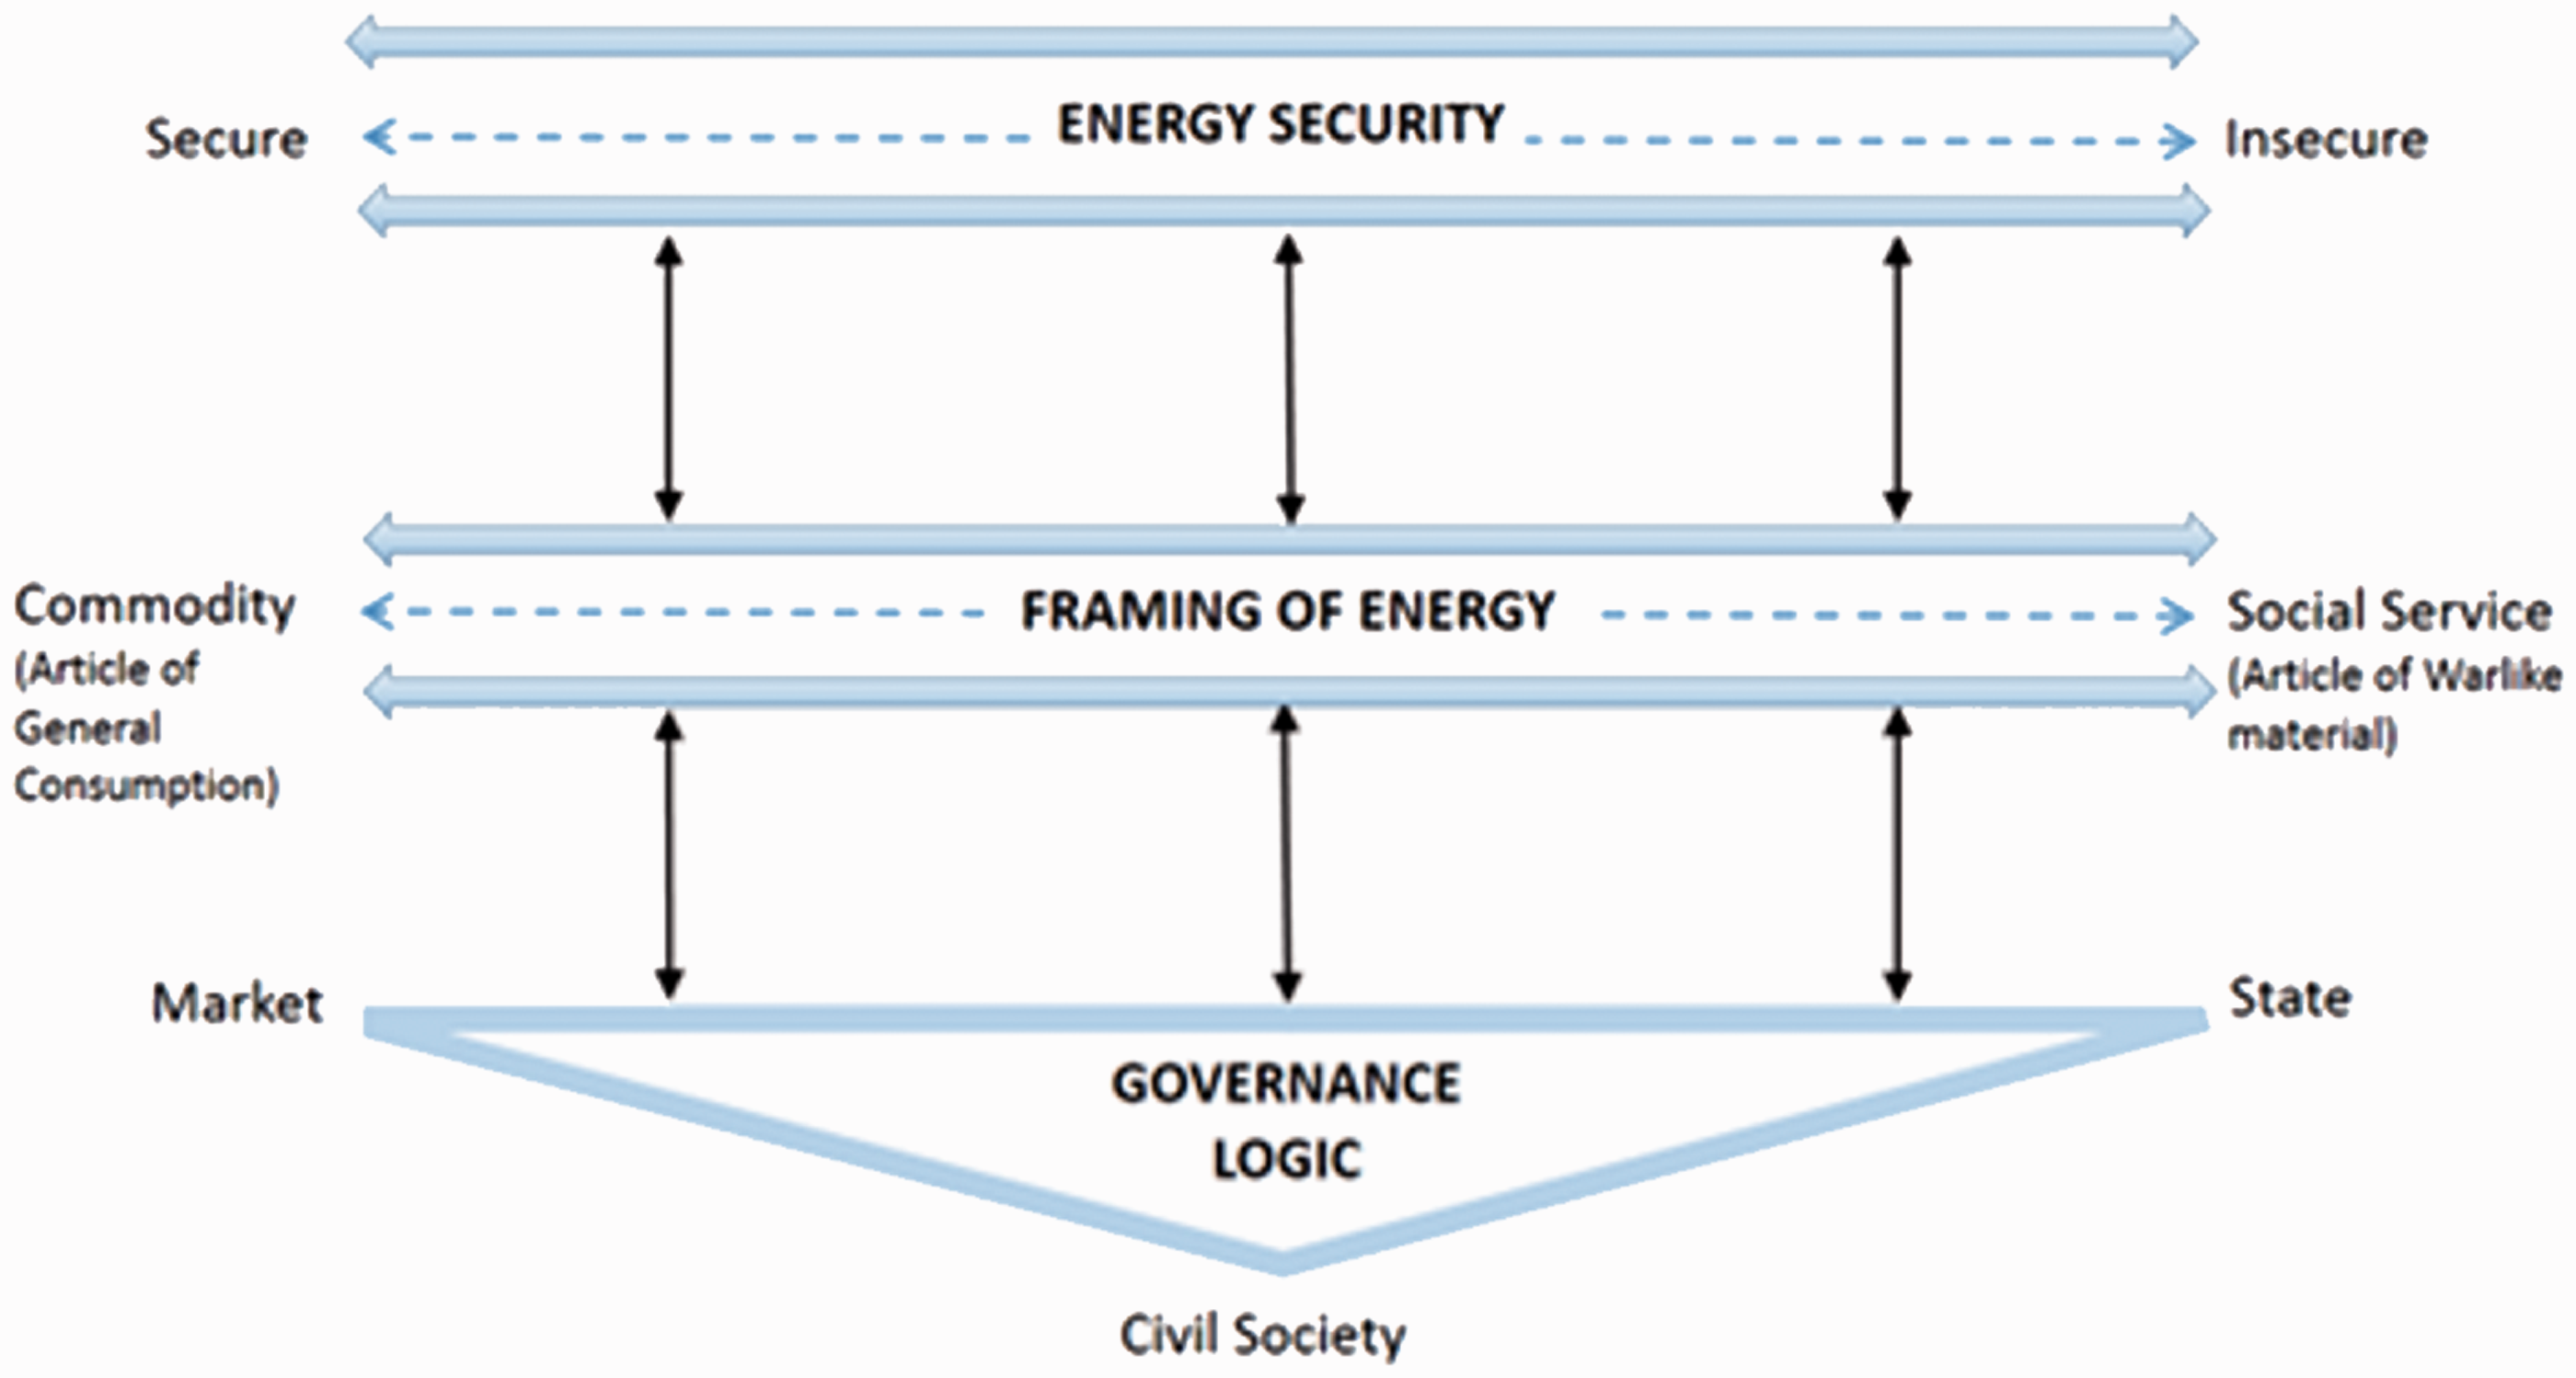
Shifting views about how security affected the framing of energy emerged between WWI and WWII; leading to the prevalence again of hybrid governance. A relational approach was used by Johnson et al. 30 to explore the emergence of policy support for fuels and their final withdrawal. That showed how and why emerging technological substitutes can founder and transitions fail in times of economic instability. It led to shifting hybrid state and market governance between incumbents (i.e. the oil majors) and newcomers (e.g. DCL and ICI). These studies consequently reflect a partial historical analogue for the hybrid roles of the state and the market in energy governance (e.g. UK Electricity Market Reform (EMR)), as well as the changing priorities within the energy policy trilemma between climate change mitigation and the provision of secure and affordable energy services. The case studies also provide insights about technological substitutes and new infrastructures (electrifying transport and heat), as well as concerns about the influence of incumbent actors and institutions influence to either advance or constrain low-carbon transitions.
A further supply-side study of the development of the integrated UK natural gas system over the period 1960–2010 by Arapostathis et al. 31 has illustrated the way in which such integration was closely linked to governance patterns. This explored the development of the gas system in two transitions: (i) from town to natural gas with state governance logic (under the management of the nationalised British Gas Corporation); and (ii) then privatisation and liberalisation after 1987. The latter major structural change is regulated by Ofgem, with a Uniform Network Code (UNC) overseen by the Joint Office of Gas Transporters. Vertical integration has been aided by new control and communication technologies, together with internationalisation via gas interconnectors. That reduced uncertainties, but increased the system’s complexity. This case study 31 provided an analogue for the challenges of integrating large, infrastructural technical systems for a sustainability transition. It is inscribed within the MLP approach yet concentrates on system integration as a complex and uncertain socio-technical process. It indicates how quite dramatic changes in the UK natural gas structure are mirrored in regime formation (see Figure 1).
Little historical work has been undertaken on energy demand reduction. A study of electric heating in early post-war Britain 32 when electric fires were used at peak times and were therefore particularly problematic in terms of energy end-use, offers insights into the challenges often associated with demand reduction. The Electricity Development Association (EDA), originally established as a public relations arm of the UK electricity industry, tried simultaneously to reduce undesirable peak demand, whilst encouraging increased demand more generally. In the late 1940s, it recommended that electric fires should not be used to meet peak demand. However, in the 1950s and 1960s it concentrated on promoting off-peak heating appliances. It first sought to do this in the United Kingdom via under-floor heating, and then block storage heaters typically composed of clay bricks or other ceramic material. The study under the auspices of the transition pathways consortium by Carlsson-Hyslop 32 analysed the way in which the London County Council (LCC) and its tenants adopted and adapted electric underfloor heating. It concluded that attempts by the electricity industry during the period 1945–1964 had only a limited effect on the trend towards rising energy end-use demand. This was, in part, due to EDA promotional efforts. This analysis is consistent with that on households’ engagement with customer-facing elements of a smarter grid, such as smart meters or energy monitors (see, e.g. a predecessor consortium study by Hargreaves et al. 33 ). Social variables like daily routines, individual preferences and social relations in a household were found by Hargreaves et al. 33 to be important for energy demand reduction. This may reflect a co-evolution of technology with social practices, changing routines, and behaviour. It illustrates the kinds of processes, practices, interactions and modes of governance that need to be considered if demand management/energy efficiency are to succeed in containing energy use and GHGs, whilst enhancing the quality of people’s lives.
Policy makers tend to have little institutional memory of what has worked or has not worked in terms of energy sector interventions, because job changes are used to enable UK civil servants to gain experience and avoid accumulating positional or departmental loyalty, and because ministers often serve for short periods (from 2008 to 2015 of the four Secretaries of State for Energy and Climate Change, one served for less than 2 years and another for just over 1 year). Historical analyses/stories of past transitions therefore help them (and other stakeholders) to understand how and why transitions have previously succeeded or failed. They also indicate how long they can take to implement and the reasons why. Overall insights and lessons from such studies can be summarised as:
The historical studies have shown that rapid change is possible, but not necessarily frequent. It may require a recognition of the need to change, openness to experiment and a high degree of co-ordination (e.g. the natural gas transition). These studies illustrate how co-evolutionary and co-constructed are the material or physical aspects with the social, political and institutional aspects. For example, the 1966–1977 conversion from town gas to natural gas required both technical changes, including building the national gas grid and installing new burners in millions of gas appliances, along with major institutional reorganisation, new workforce training and political support.
31
Historical studies of two alternatives to petrol in the inter-war period
30
show how and why emerging technological substitutes can founder and potential transitions fail in times of economic instability, shifting governance and competition between incumbents and newcomers. A further supply-side study of the development of the integrated UK natural gas system over the period 1960–201031 suggests that such integration was closely linked to governance patterns. It indicated how quite dramatic changes in the UK natural gas structure are largely reflected in regime formation and change. There is little historical work on demand reduction. However, the recent study of the EDA and domestic electric heating in post-war Britain
32
suggests that their attempts had limited impacts on the trend of rising demand, and thereby illustrates the challenges facing demand reduction today.
Horizon scanning and technology assessment of energy systems
Technological choices in the UK power sector are likely to vary significantly out to 2050. For example, over the last few years the outlook for both coal-fired power stations with CCS and nuclear power has changed dramatically. The UK Government indicated (in November 2015) their wish to phase out unabated coal-fired power stations by 2025, and giving new gas-fired power stations priority. Likewise, the prospects of new nuclear build has been hit by both concerns following the 2011 Fukushima disaster in Japan and a reassessment of the economics of nuclear power by some of the big players, such as the investment decision by the French utility eDF Energy in regard to the construction of the Hinkley Point C nuclear power plant (in Somerset). These short-term changes in attitudes to low-carbon technologies mean that the technology choices implicit in each of the existing pathways need to be kept under continuous review. Horizon scanning involves a portfolio of methods that enable energy researchers and other power sector stakeholders to increase their awareness of important emerging influences on the UK energy system and its environment. It provides a major strand in proactive risk management 11 and strategic thinking as the UK energy sector moves forward. Parker et al., 34 for example, used a modified Delphi technique for horizon scanning in order to identify some 30 emergent policy issues, which strongly featured science and technology, and which would necessitate public engagement as the policies were being developed. This was driven, in part, by concerns over the use of hydraulic fracturing (or fracking) by fossil fuel companies for shale gas extraction in the United Kingdom. A disparate group of people with interests over the science and policy interface (e.g. policy makers and advisers, academics and the private sector) initially elicited a long list of issues. These were then refined into a shorter list that were viewed as being of top priority for policy makers. They included challenges related to energy and environment, such as policies concerning interdisciplinary whole energy systems science (incorporated by a partner in the Realising Transition Pathways Consortium (Jason Chilvers) 34 ). A variety of alternative techniques are available for use in identifying emerging issues in the UK energy sector. Arup Foresight (part of the independent firm of designers, planners, engineers and consultants) have, for example, employed STEEP (social, technological, economic, environmental, political) analysis to examine drivers for change in both the energy and climate change fields. The Realising Transition Pathways Consortium have used a similar approach, in conjunction with more formal methods of Technology Assessment35,36 to evaluate a number of the main disruptive energy technologies. These studies have sought to identify the components of a balance sheet of technological credits and debits in order to evaluate their societal impacts, and to determine whether they are compatible with Britain’s move towards a low-carbon future in 2050 and beyond.
Indicative energy technology assessments (ETAs) have been carried out for a variety of energy technologies, e.g. UK shale gas extraction, 37 carbon capture and storage (CCS),38,39 advanced rechargeable batteries, 40 rare earth elements (REE) as a constraint on clean energy technologies, 41 nuclear power plants 42 and tidal power barrages. 43 These ETAs were all indicative in the sense of being a simplified evaluation and illustration of the performance of state-of-the-art devices. Nevertheless, such assessments provide a valuable evidence base for developers, policy makers and other stakeholders. Each technology was evaluated using a combination of quantitative and qualitative methods within the spirit of the STEEP approach. The most controversial of these studies was arguably that concerning the benefits and ‘costs’ of shale gas fracking in Britain.34,37 Exploratory drilling in the United Kingdom is at an early stage, with great uncertainty over the scale of the potential shale gas resource. 37 However, such activities are already meeting fierce community resistance. Like all energy technologies, it exhibits unwanted side-effects that simply differ in their level of severity compared to other options. Successful extraction might contribute positively in terms of fuel security and independence, as well as jobs and growth. 37 Shale gas may also make a contribution to attaining the UK’s statutory GHG emissions targets, although potentially harmful environmental impacts need to be satisfactorily resolved via appropriate monitoring and robust regulation. It is unlikely that gas bills for UK household and industrial consumers would fall dramatically as they have done in North America, because Britain is linked to the wider European gas market. Anything produced in the United Kingdom would be a ‘drop in the ocean’ compared to imports via either pipelines or by way of liquefied natural gas (LNG) tankers. Finally, the socio-economic advantages and disadvantages of shale gas fracking are not evenly distributed between various communities and demographic groups. 37 Community engagement in a genuinely participative process – where the government is prepared to change course in response to the evidence and public opinion – will consequently be critically important for the adoption of any new energy option.
CCS facilities coupled to fossil fuelled power plants or industrial sites provide a key climate change mitigation strategy that potentially permits the continued use of fossil fuel resources, whilst reducing the CO2 emissions. Hammond and Spargo 39 highlight the potential design routes for the capture, transport, clustering and storage of CO2 from UK power plants. Both currently available and novel CCS technologies were evaluated. Due to lower operating efficiencies, the CCS plants showed a longer energy payback period and a lower energy gain ratio than conventional plant. There are also several technical and financial obstacles that need to be overcome, 38 including the adoption of an appropriate legislative framework and the need for full CCS chain risk assessments. There are uncertainties over the full-scale power plant CCS technical performance and costs, which may only become clearer when the first demonstrators are operational. Unfortunately, the UK Government cancelled (on 25 November 2015) their £1 bn CCS competition shortly before the winning consortium was due to be announced. Inevitably, the bidding companies were dismayed by this outcome and the prospects for CCS in Britain in the short term now looks rather bleak. Prior to this, the Government had established a CCS Cost Reduction Task Force 44 as an industry-led joint venture to assist with the challenge of making CCS a commercially viable operation by the early 2020s. The main cost-reduction opportunities were seen as being 44 : (i) transport and storage scale and utilisation, (ii) improved financeability for the CCS chain, and finally (iii) improved engineering designs and performance. Greater financial incentives for carbon abatement could, in principal, be secured through a higher carbon price from the European Union Emissions Trading Scheme (EU ETS), although that has been a significant disappointment in terms of the carbon price level. A collaborative study between the Energy Technologies Institute (ETI), a public-private partnership of key industrial companies and UK funders of energy RD&D, and the Ecofin Research Foundation (ERF) 45 has recently examined the conditions required for mobilising private sector financing of CCS in the United Kingdom. They argue that this technology would be a ‘huge prize’ that could cut the annual costs of meeting the 2050 carbon target by up to 1% of gross domestic product (GDP).38,39,45 But they noted that the prevailing financial market conditions are demanding. In order to meet this challenge, they suggest that the United Kingdom needs to build confidence in long-term policy, develop attractive pricing for CCS contracts with suitable risk sharing, put in place an appropriate regulatory and market framework, and devise new ways to offset North Sea storage liability risks. 45 Many believe that the UK Government will need to return to CCS deployment in order to meet its 2050 GHG emissions reduction target in a cost-effective way. 46
Two other large-scale power generators that could be available to help secure a low-carbon future for the United Kingdom are nuclear power plants 42 and tidal barrages. 43 The lives of existing nuclear plant has typically been extended to around 40 years (e.g. Hunterston B was financed for 25 years with an expectation of 35 years, and subsequently extended by 7 years). Nevertheless Britain, as with other nuclear-powered European countries, will be progressively decommissioning its older nuclear power stations during the next decade or so. This will leave only the Sizewell B pressurised water reactor (PWR) station in the United Kingdom, with nuclear power holding a considerably reduced share of electricity generation (perhaps as low as 3% by 2020 from around 20% in the winter of 2013–2014). A new generation of nuclear power stations may therefore need to be part of the power generation mix in order to decarbonise the electricity sector by around 2030–2050. In Europe these plants are likely to be variants of the third-generation European pressurised reactor (EPR) design. Emerging (novel) nuclear reactor designs are thought to be inherently safer and less costly 42 ; perhaps having a 25% lower generating cost than present systems. However, the research by the former UK Sustainable Development Commission 47 suggests that a doubling of Britain’s existing nuclear capacity would only yield an 8% cut on CO2 emissions by 2035. Over the longer term, it is likely that the European governments will want to keep a watching brief on advanced nuclear reactors (including modular designs) that are currently being developed in France/Germany, South Africa and the United States. Nevertheless, they will no doubt want to be reassured that such new technologies will be commercially viable. 42 The adoption of either short- or medium-term technologies would obviously be critically dependent on public attitudes to nuclear power in Britain and elsewhere.1,11,42 Both the Cardiff-Weston and the smaller Shoots barrages on the River Severn between Somerset and south Wales have been evaluated by Hammond et al. 43 using various ETA techniques to determine their net energy output, carbon footprint and financial investment criteria, alongside various critical technical and environmental issues. These tidal power schemes were assessed over their foreseen lifespan of 120 years in terms of its cradle-to-site, operation and maintenance requirements. The proposed Cardiff-Weston Barrage would yield relatively attractive figures of merit in terms of its net energy and carbon emissions, although its financial performance is poorer than alternative power generators. Comparisons were made with the much smaller, Shoots Barrage scheme that would be located up-river of the Severn road crossings, and which is favoured by environmental groups, because of its more benign ecological and environmental impacts. 43
The suitability of advanced rechargeable battery technologies (ARBT) for different applications, such as electric vehicles (EV), consumer electronics, load levelling and stationary power storage, has been the subject of another ETA.
40
These energy storage devices were compared to more mature nickel–cadmium (Ni–Cd) batteries in order to gain a sense of perspective regarding the performance of the ARBT. Lithium (Li)-ion batteries (LIB) currently dominate the rechargeable battery market and are likely to continue to do so in the short term in view of their excellent all-round performance,
40
and firm grip on consumer electronics. However, in view of the competition from Li-Ion Polymer (LIP) batteries their long-term future is uncertain. Although, if safety concerns are overcome and costs fall significantly, there may be growth in the EV sector and to a lesser extent load-levelling, where LIB can exploit their relatively high cycle life.
40
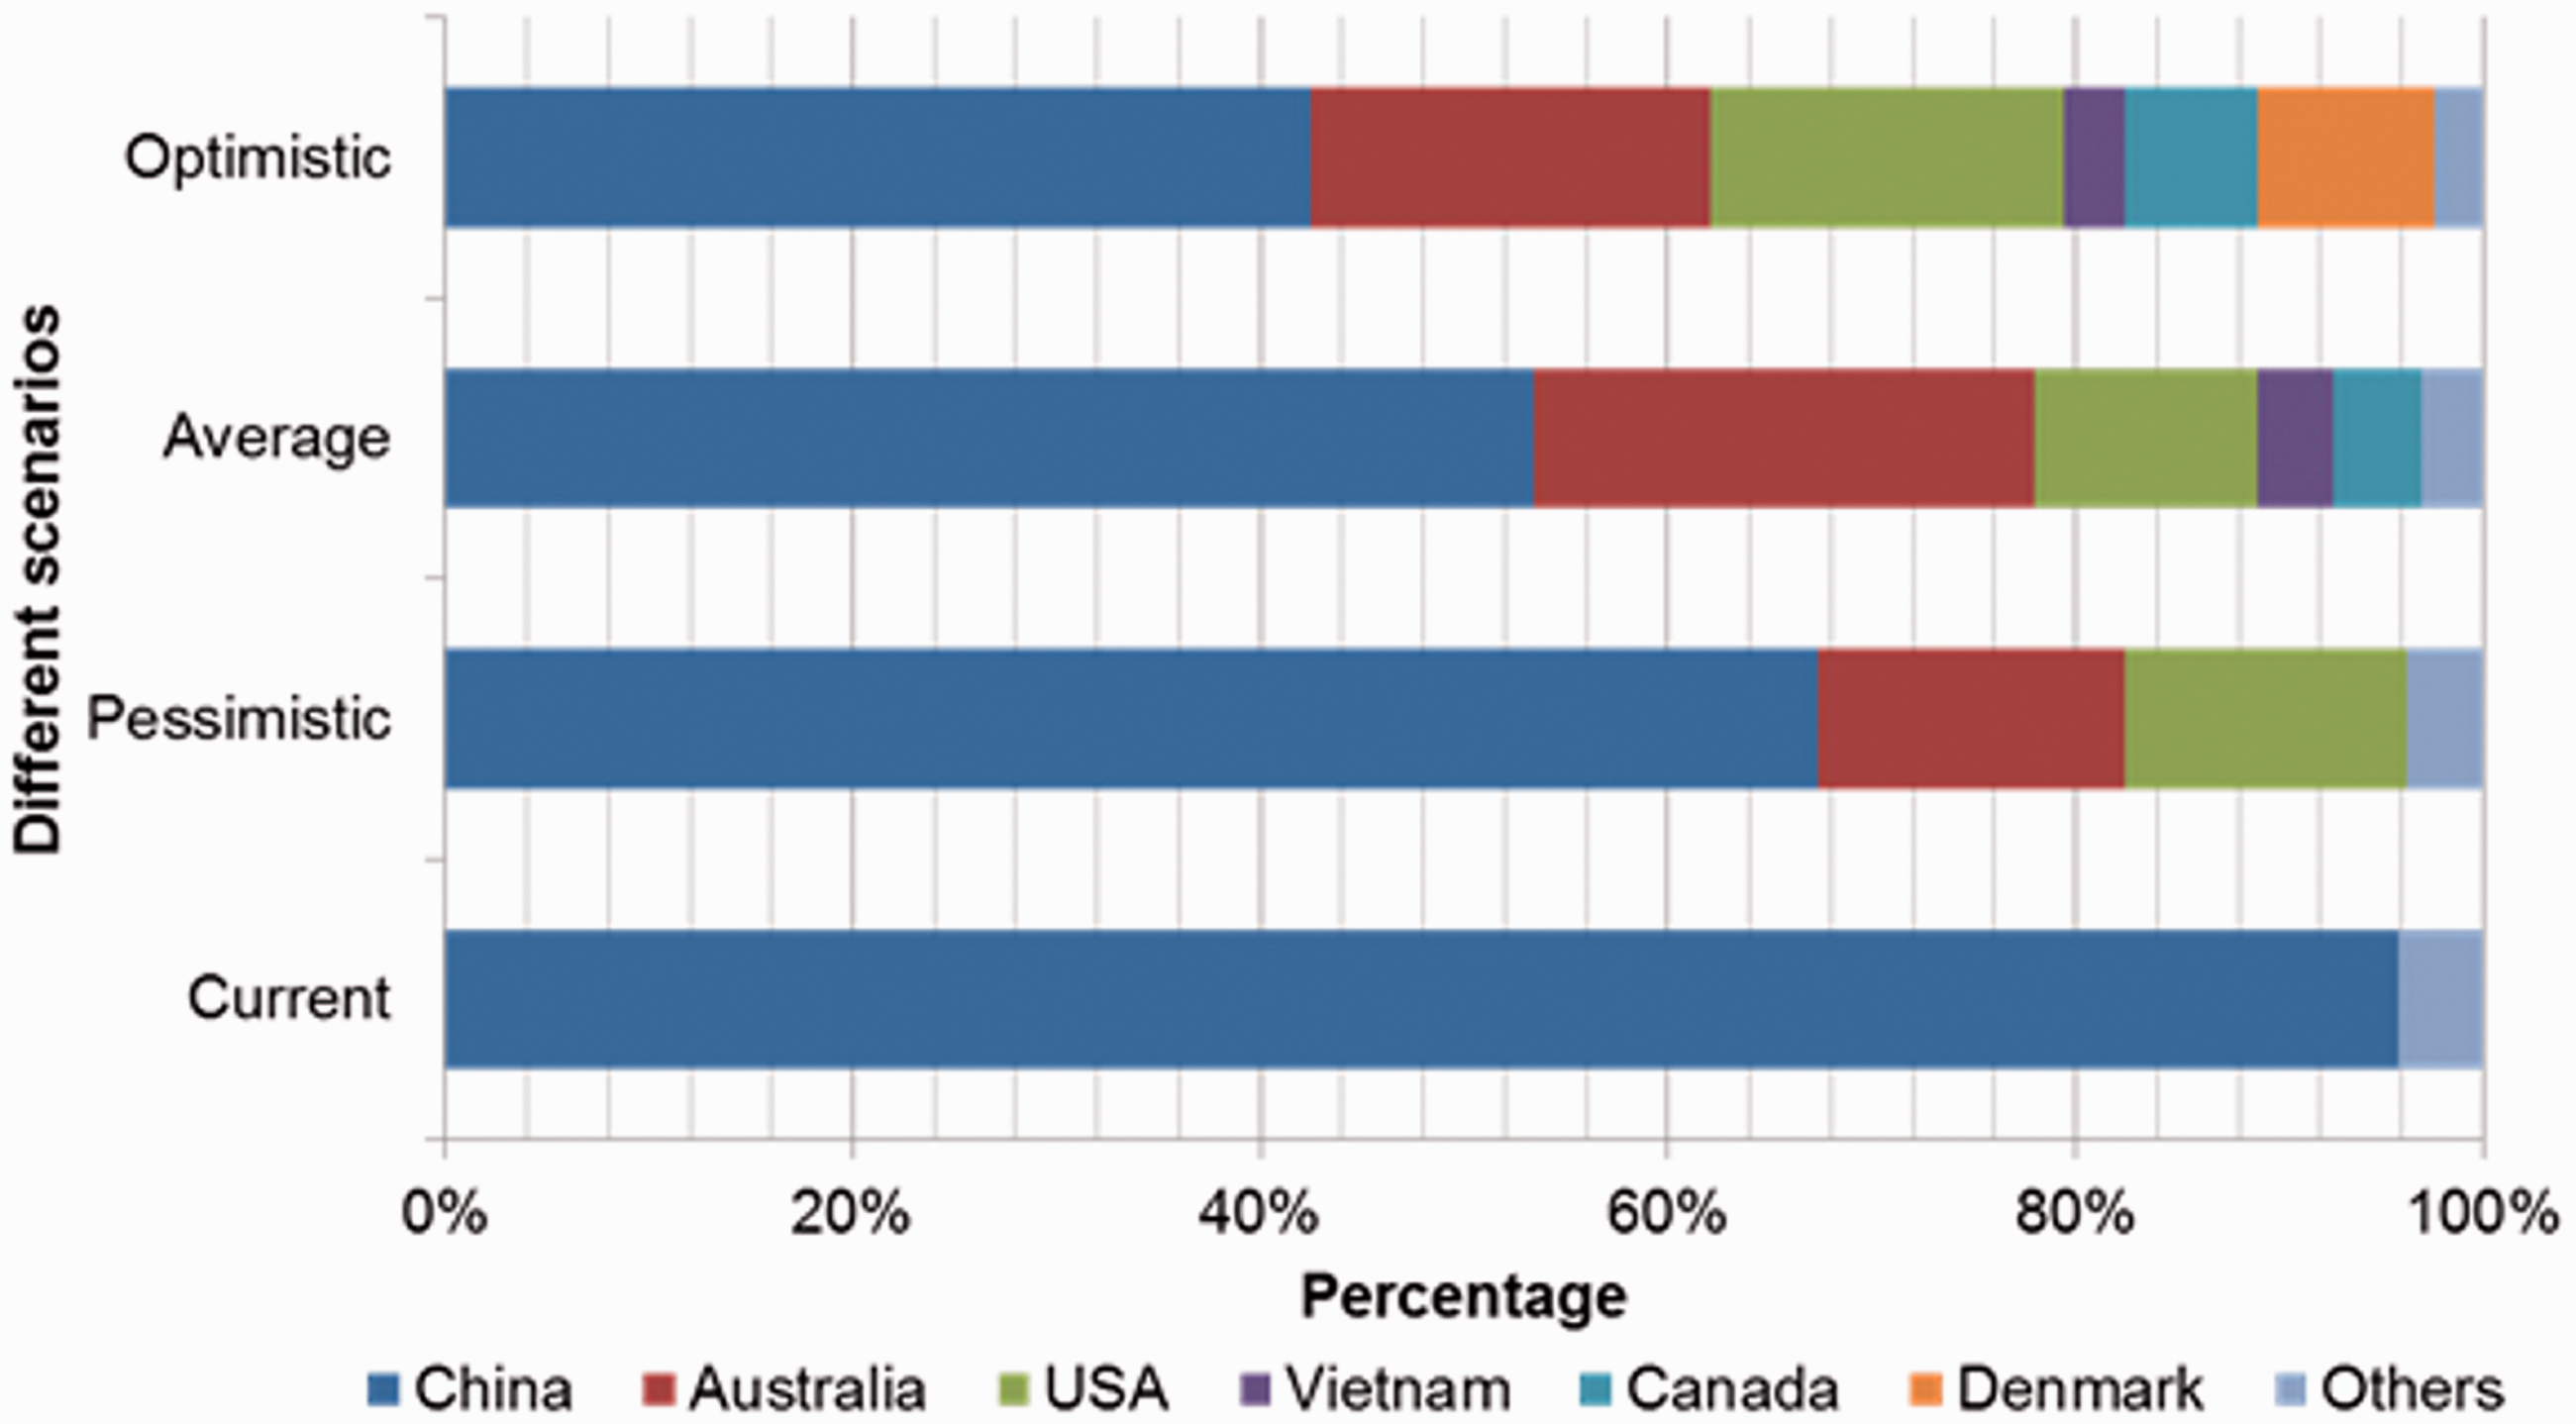
Rare earth batteries and magnets are key elements of hybrid vehicles and gearless wind turbines, and phosphors are critical in energy saving lighting. Hammond and Mitchell
41
argued that ‘rare earth elements' (REE) may place a significant constraint on the development of some low-carbon (or clean) energy technologies. These materials are not actually rare in terms of their abundance, but the number and location of mines are restricted due, in part, to economic considerations. Current REE reserves stand at about 110 million tonnes with around half in the People’s Republic of China (PRC), although other countries like the United States, Commonwealth of Independent States (CIS) (the former Soviet Republics) and Australia hold substantial reserves. Production in China dominates the market, with ∼97% of the global total, and this will remain so until new mines are developed. The PRC has limited its export of REE in order to give preference to the export of manufactured products. Diversity of the global supply chain is therefore a crucial issue moving forward (see Figure 6). It is likely that supply constraints will become less critical in the medium to long term as more mines come into operation, and thus further reserves become available.
41
Such constraints could be eased by reducing the amount of material required per application, or changing the technology altogether. LIB,
40
for example, are already a viable replacement for nickel-metal-hydride units in hybrid vehicles. Their costs have fallen from >£1680/kWh in 1990 to <£140/kWh today. REE are not currently recycled, either pre or post-use. There are processes available that could be utilised for this purpose, although they do not currently appear to be economically viable options.
41
Diversity of global ‘rare earth elements’ (REE) supply over the medium term. Note: ‘Current’ reflects the 2011 baseline.
41
A comparison of the spatial footprints per unit of output from various power generators.
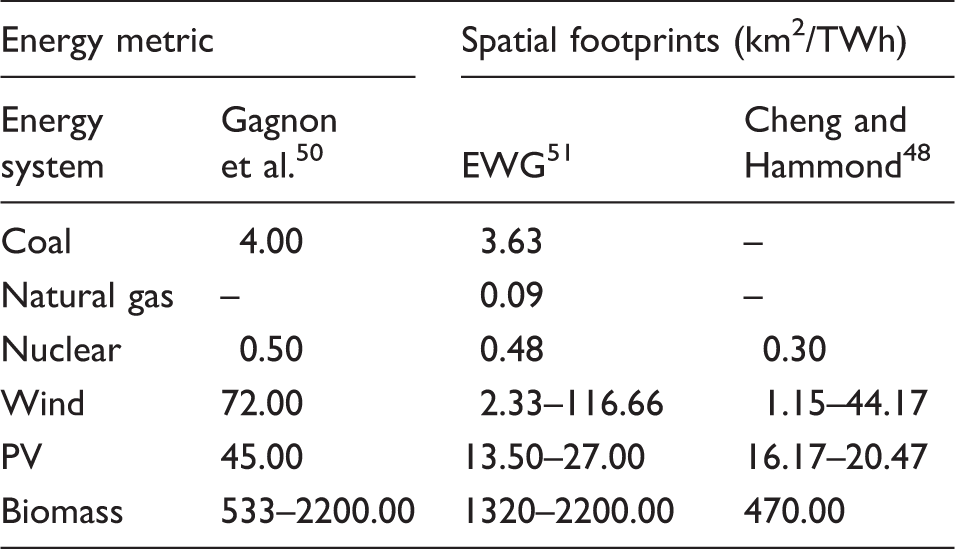
Source: Adapted from Cheng and Hammond. 48
The horizon scanning and technology assessment of the energy options34–36 that will influence the three UK transition pathways contributes to an understanding the future interplay of the energy policy trilemma, i.e. achieving deep GHG emission cuts, whilst maintaining a secure and affordable energy system, and addressing how resulting tensions might be resolved. Overall insights and lessons from such studies can be summarised, for example, as:
Shale gas extraction has potential unwanted side-effects, and is already meeting community resistance and controversy. A balance sheet approach has been used to determine the benefits and disbenefits of shale gas fracking.
37
It may contribute to energy security, jobs and growth, as well as attaining national GHG targets over the medium term. Thus, it might form the basis of a transitional energy strategy for the United Kingdom, although the wider environmental impacts will require appropriate and robust regulations to be enforced. Carbon capture and storage (CCS) from fossil-fuel power stations is likely to be a key technology in achieving a low carbon future in the United Kingdom at a reasonable cost.
38
Energy and carbon analyses have been undertaken, along with indicative cost estimates, for fossil-fuelled power stations with and without CCS.
39
It could significantly cut GHG emissions, provided technological and financial obstacles can be overcome. Large-scale nuclear power plants and tidal power barrages both exhibit attractive figures of merit in terms of their overall energy performance and near-zero carbon emissions, but have very long financial payback periods.40,43 The latter makes them difficult to undertake with the support of only private sector investors. Nuclear power also gives rise to ongoing problems with high and intermediate-level waste disposal,
40
although a deep underground repository is the preferred option. The siting of such a facility has yet to be resolved in the United Kingdom. A tidal barrage built across the Severn Estuary would inevitably give rise to significant ecological modifications to the aquatic environment.
43
The suitability of ARBT have been evaluated for different applications.
40
While LIBs are likely to continue to dominate the rechargeable battery market in the short term, their long-term future is uncertain, because of competition from LIP batteries. There may be some LIBs growth in the electric vehicle sector, if safety concerns are overcome and costs fall significantly, and somewhat less in load-levelling, through their relatively high cycle life. Rare earth batteries and magnets are key elements in the hybrid vehicles and gearless wind turbines, as are phosphors in energy-saving lighting, but short-term economic mining constraints on REE may limit their development.
41
Such concerns could also be eased by using less material per application, recycling REE, either pre- or post-use, or changing the technology altogether. The energy densities and spatial footprints of various power generators were evaluated on a life-cycle basis.
48
The nuclear fuel cycle was found to have the highest energy density, with bioenergy plants having the lowest. Onshore wind power exhibited a relatively promising energy density; being greater than that for its offshore counterpart. The energy density of the latter fell below that of solar PV arrays.
Electricity system and network modelling and evaluation
Background
A number of reputable studies have been undertaken over recent years that support low or zero carbon energy scenarios for the United Kingdom. These include those produced by the British Government’s Department of Energy and Climate Change (the DECC 2050 Calculator 52 ), the UK Energy Research Centre (the UKERC Energy 2050 Project 53 ), and the Tyndall Centre for Climate Change Research. 54 They all enable insights to be drawn regarding the realism of each scenario set, and reflect a range of aspirations from those wishing to achieve 2050 carbon reduction targets: 80% in the case of DECC 52 and UKERC 53 projections. However, the five Tyndall decarbonisation scenarios 54 focused on an earlier 60% carbon reduction target for 2050, although they employ a distinctive backcasting approach generated and reviewed with the aid of stakeholders. On the other hand, the DECC 2050 Calculator is basically an engineering-based, Excel spreadsheet model that is open source and arguably transparent. The tool permits users to select their own combination of technologies to achieve an 80% reduction in GHG emissions by 2050, whilst ensuring that energy supply and demand are balanced. The UKERC Energy 2050 Project 53 employed a core four-scenario core set that was underpinned by a single cost-optimisation model (UK MARKAL). It took ‘an eclectic approach to scenario building’ 53 with a backcasting dimension to achieve a combination of UK energy resilience and climate change mitigation. In contrast, the quantification of the three pathways developed by the Realising Transition Pathways Consortium was underpinned by a suite of multiple models.
From narrative descriptions of the transition pathways to model formulation
A range of models were developed to elaborate/explore demand, supply and infrastructure aspects
26
and feed into revising the pathways, both quantitatively and qualitatively in the second iteration for version 2.1 of the transition pathways. Qualitatively this has involved building narrative stories out to 2050, whilst quantitatively it has necessitated the construction of matching, consistent spreadsheets of demand, supply, technologies and (implicit) infrastructure. This was a challenging and time-consuming process, but one that yielded a valuable learning experience. Electricity models were used to variously address hourly, annual and seasonal balancing on regional, national and international scales. An informative multi-modelling comparison of the pathways was then undertaken to innovatively link and embed narrative storylines to technological, economic, social and institutional drivers and constraints. The framework of eight models and appraisal tools (see Figure 7 for the suite of individual models as of April 2013) were iteratively linked and checked for consistency between the various tools and the narrative descriptions of the pathways. This exercise was undertaken by the postgraduate researchers functioning as what was known in the Realising Transition Pathways Consortium as the Engine Room
55
the researchers working independently of the consortium leadership (the academic co-investigators).
The framework of quantitative models utilised within the Realising Transition Pathways project.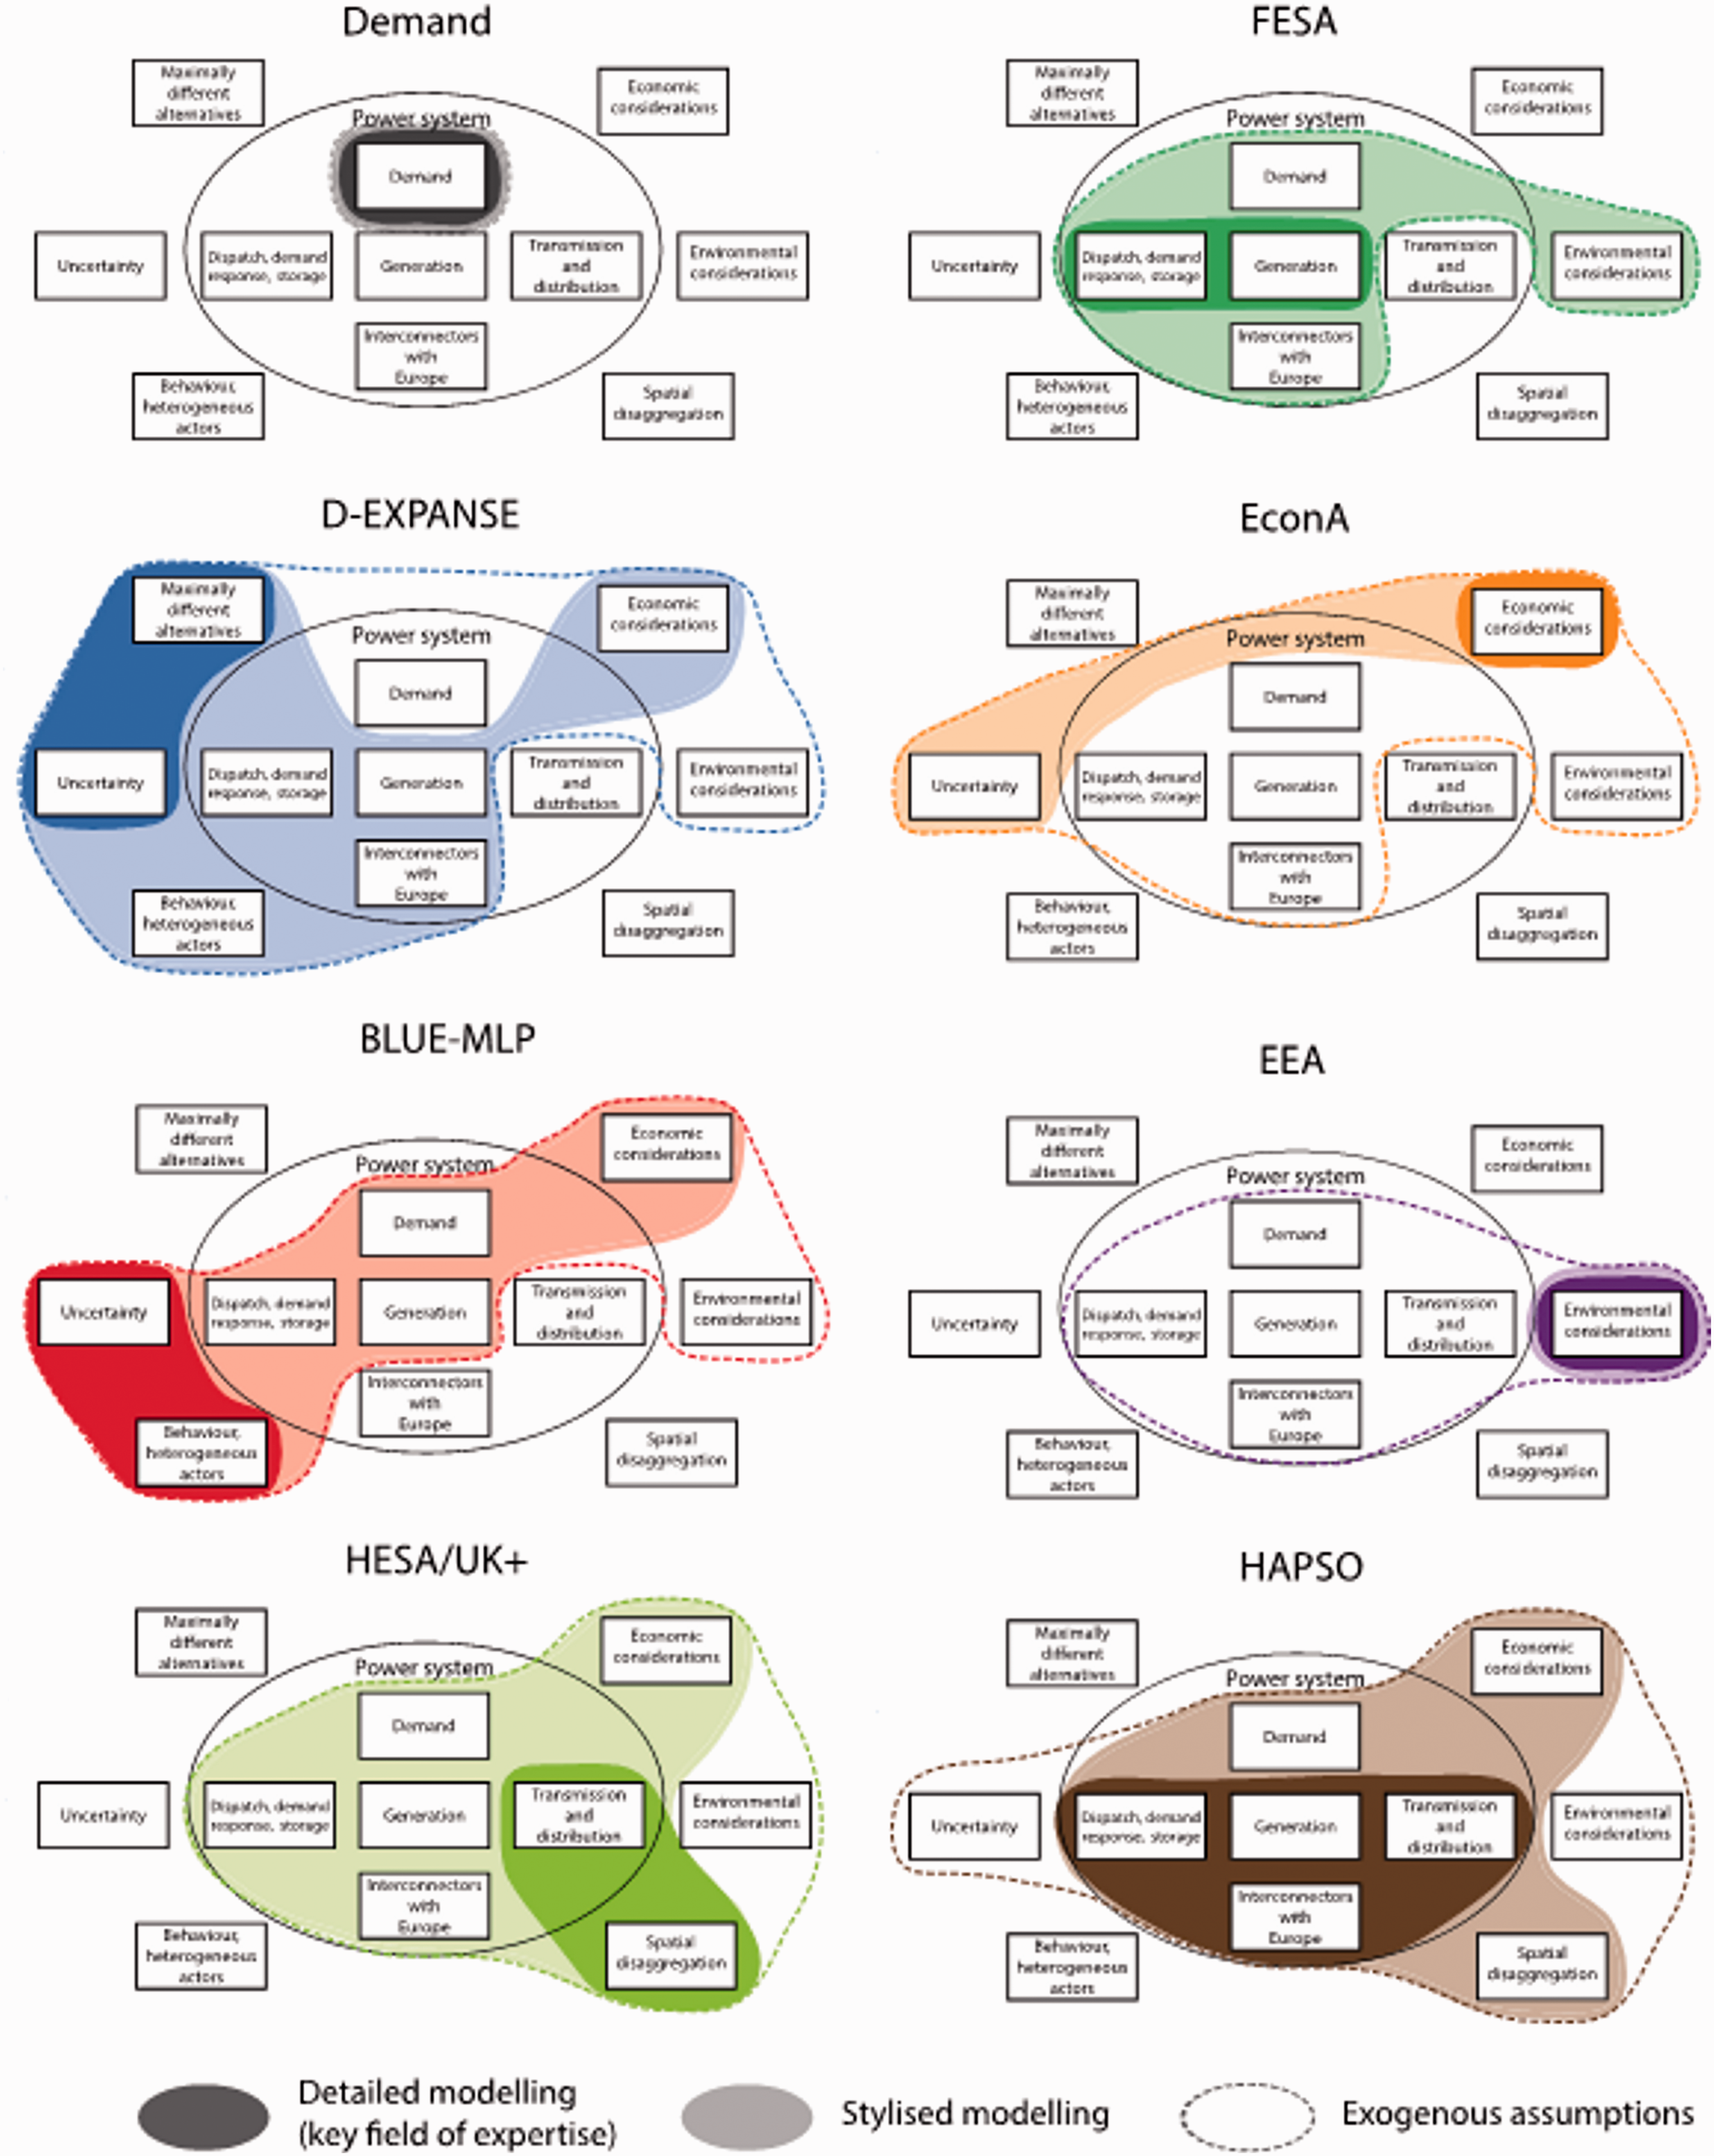
This cross-scale study was based on the storyline or narrative description of the CC pathway,8,24 which was then evaluated via six power system models and two appraisal techniques. It was used to iteratively link the CC narrative with the models/appraisal tools. Harmonised assumptions on power system inputs and system output targets for each model or tool were initially extracted from the CC pathway storyline.8,24 The framework of models (see again Figure 7) was then employed to map the key features of each model/appraisal tool in terms of their temporal, spatial and disciplinary perspectives. Clearly, the narrative description of the CC pathway8,24 was found to be critical for transmitting information about governance logic and the choices of key actors. Nevertheless, many of these parameters were found to be inconsistent. Typically, the CC storyline resulted in an overestimate of demand reduction levels, the uptake of CCS and marine renewables. This is because the narrative storyline tends to underestimate the technical and economic challenges associated with these levels of demand reduction and uptake of CCS and marine renewables. These were subsequently highlighted through the quantitative modelling analysis. Likewise, the narrative description led to an underestimate of the supply-demand balancing requirement, the need for back-up capacity, and the role of nuclear power and interconnectors with Europe, compared to the challenges identified through the modelling in achieving these outcomes.
The eight models and appraisal tools (in the order of their breadth of power system boundaries, and in line with the sequence indicated in Figure 7) were:
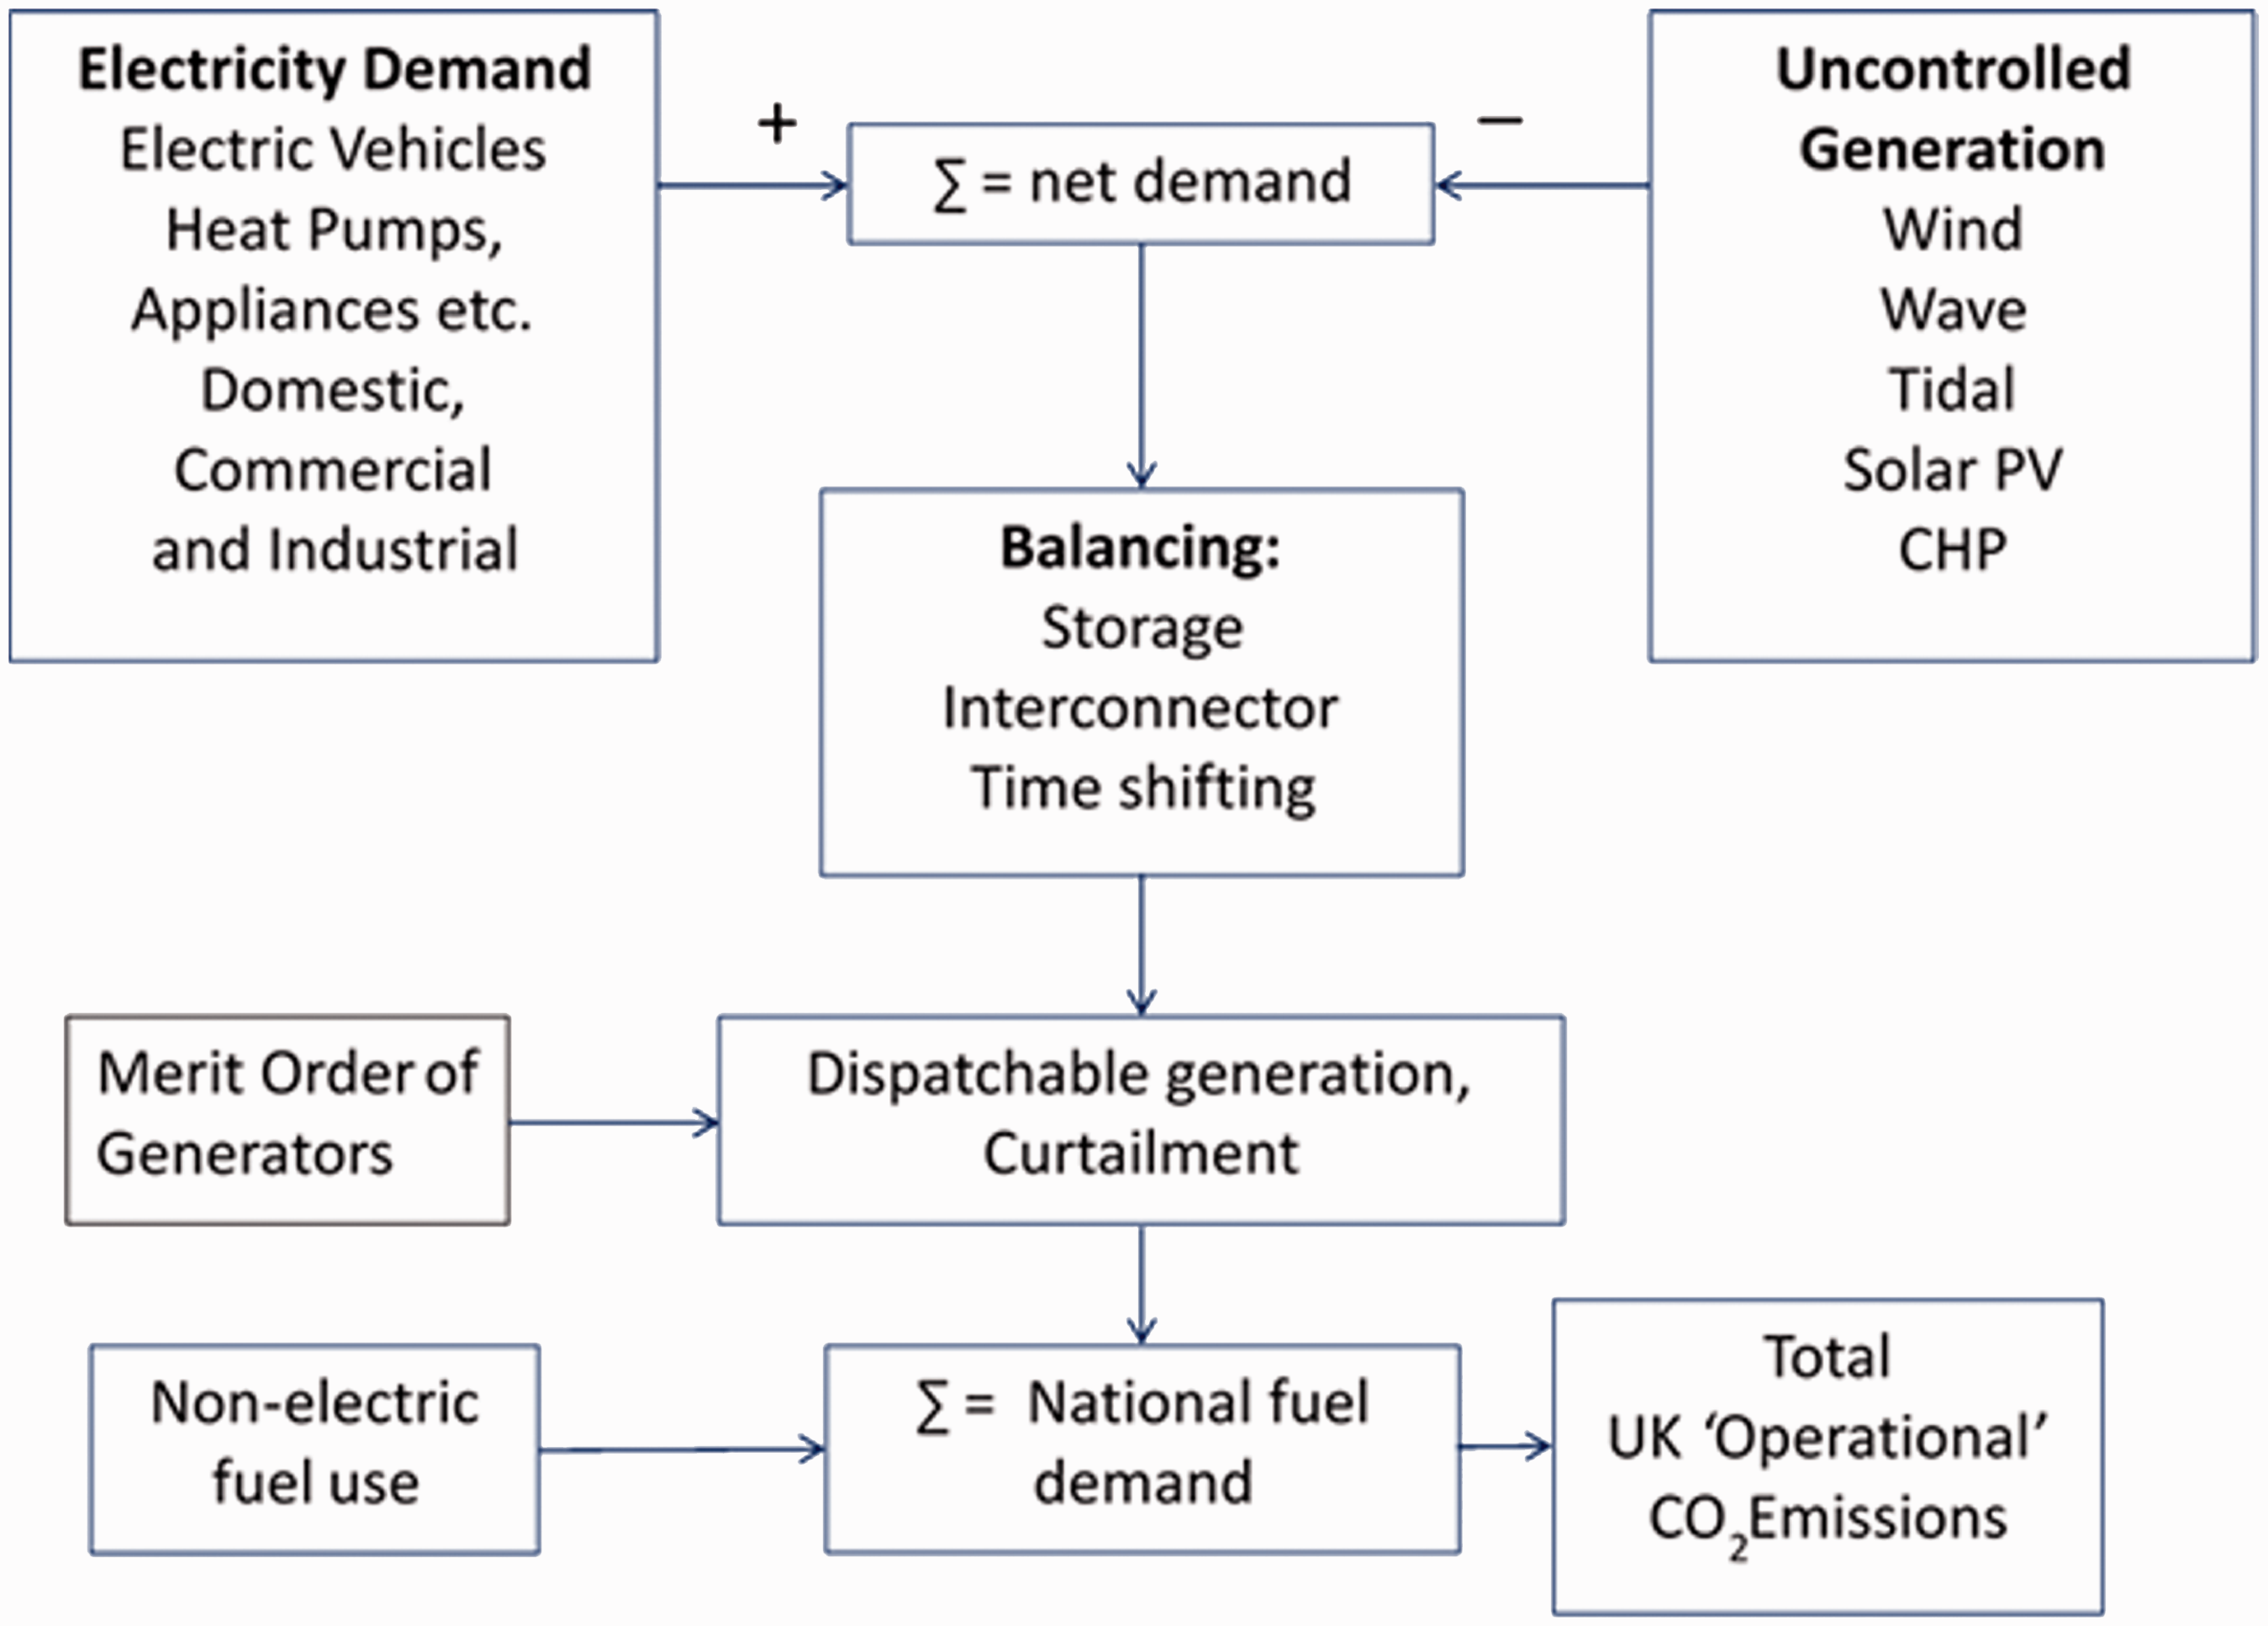
A schematic representation of the Future Energy Scenario Analysis (FESA) model. Source: Updated from Barton et al.
28
These models and appraisals yield a broad spectrum of cross-scales insights 55 covering system boundaries, time, space, and disciplines (see Figure 7). They were found to reveal a rather fragile nature of the transition pathway narrative descriptions or storylines. 55 The CC pathway storyline was found, for example, to imply an overestimation of the potential for power demand reduction and for the uptake of marine renewables. The necessity for CCS to meet the 2050 UK GHG emissions target was likewise overestimated. However, they were found to downplay the challenge of supply-demand balancing and the need to use gas power plants as a back-up capacity, as well as the role of nuclear power and electricity interconnectors with Europe.
These and other findings have benefited from a whole systems and collaborative working aimed at elaborating and examining pathways for realising a transition to a low carbon, secure and affordable UK energy system by 2050. Thus,
A critical review of quantitative models for exploring socio-technical transitions has aided interdisciplinary learning between the different developers and users of the storylines, models and appraisal tools.8,24,26–28,55–58 The iterative improvement of the qualitative narrative descriptions for the pathways, combined with that for a diverse range of models and appraisal techniques, is likely to be a key element in the robust development of future transition pathways and energy scenarios.
55
Annual demand modelling
The Demand model28,55 assembles trends for the overall annual demand for electricity and fuels to 2050. The model builds from bottom-up representations of the energy service demands in the major sectors, the performance of existing buildings and end-use equipment, and the prospects for technological improvements and behaviour changes. Heating technologies in the domestic, service and commercial sectors are modelled in detail; industrial process heat is represented through underlying sub-sector demands and expected trends. Data were drawn initially from the Energy Consumption in the United Kingdom (ECUK) 60 database with further disaggregation by end-use and service employing assumptions about future technical change developed based on multiple sources. 28 The trends for electrification of transport are modelled, linked to work within the project. 61 Assumptions were compared to those in the DECC 2050 Calculator. 52
Introducing the spatial dimension to demand, the HESA model26,27 utilises network theory to calculate flows, the energy hub concept to represent the conversion of energy between carriers (i.e. generation, including renewable energy sources), and deterministic least-cost optimisation (of fuel, generation, transport). The UK+ model includes physical descriptors of all generators, energy demands and storage requirements. It contains the 17 UK onshore nodes, as well as having nodes representing five offshore zones (Norway, Belgium, Netherlands, France and the UK Continental Shelf (UKCS)). The model contains multiple carrier transportation networks to/from international nodes (39 connections facilitate the transportation of electricity, gas, coal, oil, biomass and CO2) with demand and supply capability to represent international nodes (thereby facilitating international trade in energy carriers). HESA and UK+ have been used in combination to model an integrated multi-energy carrier network and applied to local, regional and national scale case studies in the context of the transition pathways, e.g. combined gas and electricity bulk flows with constraints across the United Kingdom.
This combination of models
55
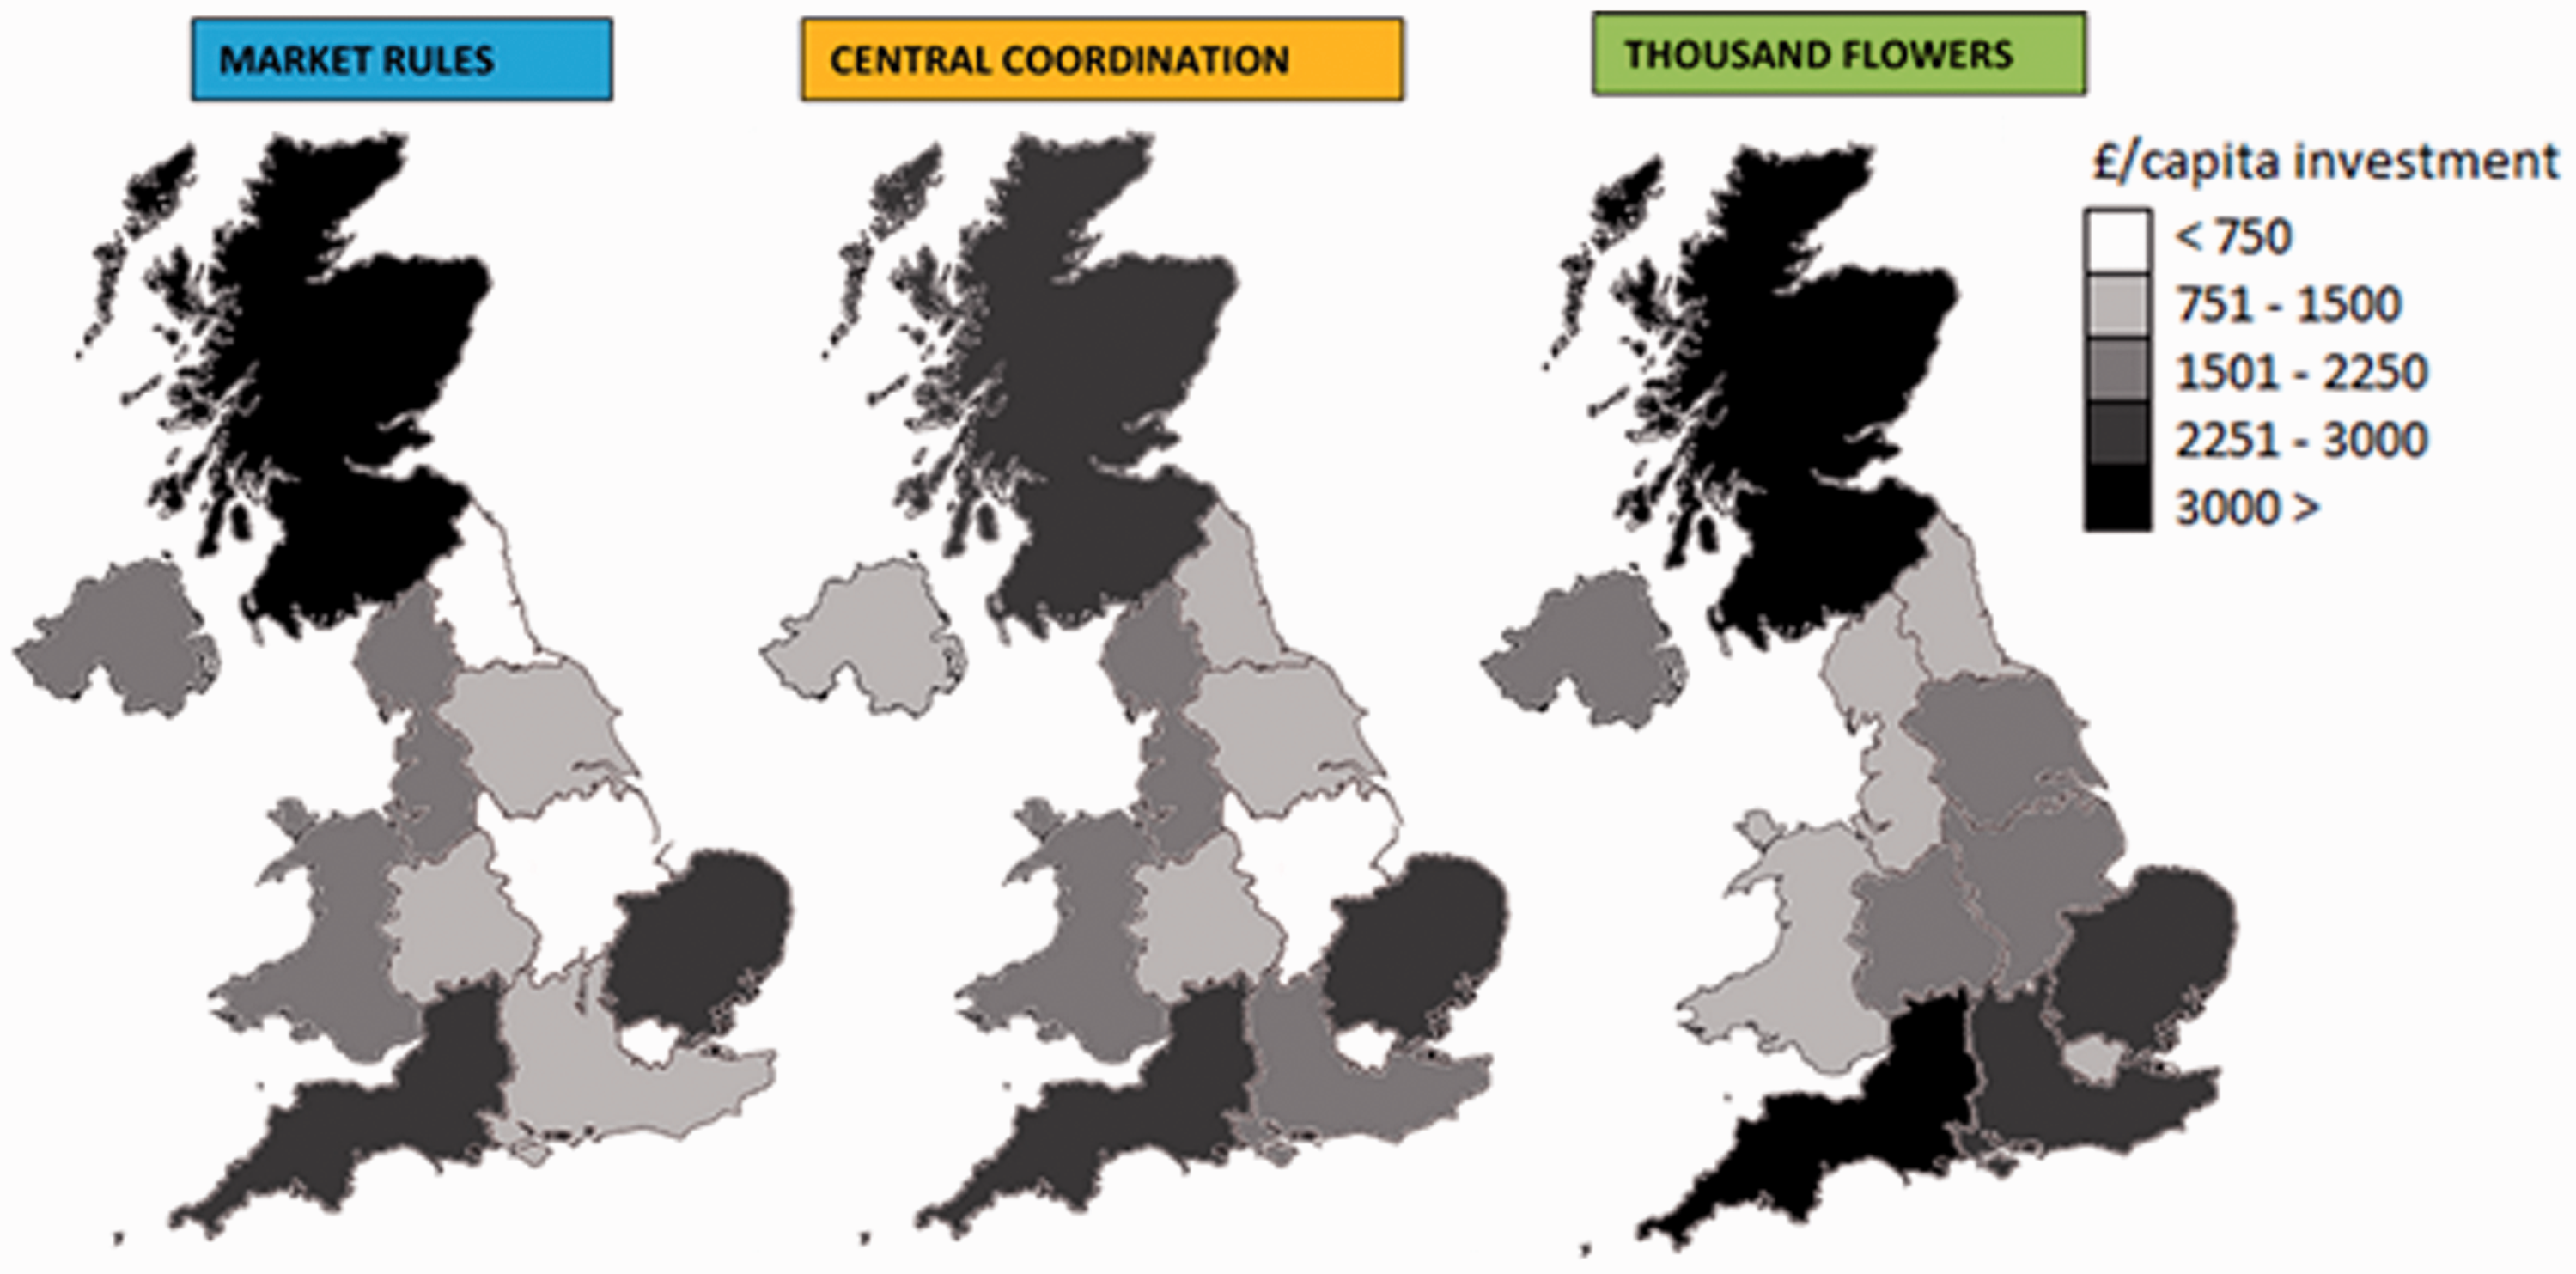
indicates a temporal mismatch between low-carbon supply and demand may lead to very low utilisation factors of dispatchable generation, i.e. power plants that can be turned on, off, or have their output varied in a relatively short time at the request of the network operator or plant owner. This affects financing of gas-fired power stations, as well as hampering the prospects for CCS. Supply-demand balancing leads to increasing curtailment of renewables and additional fossil fuel use, illustrates the potential for electricity storage, but suggests that innovation would be required for longer term storage. This combination of models has also been employed for stress testing, optimisation and uncertainty analysis of the pathways. Different technology mixes were found to drive different regional patterns of investment as displayed in Figure 9. Consistently high investment is required in the South East, South West, East of England and in Scotland. Other regions, such as the North East of England, were found to be exposed to large swings in potential investment under different pathways. Thus, the lessons learned from annual demand modelling were:
An increase in capacity of the electrical North-South corridor is essential for the success of all three pathways. A decrease in use of the national natural gas transmission system as a result of decarbonisation means an under-utilisation of the network. Total transmission and generation costs are likely to increase out to 2050 across all three of the UK transition pathways. Even in a system with greater localised energy sources (such as under the TF pathway) there is still a need for national energy infrastructures for electricity and gas.
Spatial distribution of electricity infrastructure investments under the three UK transition pathways (2010–2050).
Hourly demand profile modelling
The annual demand trends are complemented by the FESA hourly grid-balancing model26–28 (see again Figure 8). FESA has been significantly developed in terms of its internal assumptions, data consistency, the representation of demand response and energy storage. The FESA heating demand has been disaggregated into hourly demand profiles for the domestic and commercial sectors, and space heating separated from water heating, with different profiles taken from industrial sources. Such profiles are necessary for two main reasons, firstly in order to quantify the challenges of system balancing and to consider demand response. The service sector and commercial organisations tend to have similar categories of energy use to each other, and their energy uses are dominated by services directly to people. Industries can be broadly split into high-tech people-intensive activities and large, energy-intensive ones with more diverse energy end uses.
The FESA model has been soft-linked with the D-EXPANSE model 55 so that FESA can take outputs from the D-EXPANSE economic optimisation program. Profiles for commercial and service sector energy uses are assumed to have similar profiles, being almost flat during the day and early evening. Future profiles of electric vehicle (EV) charging, 61 domestic heat pumps 62 and domestic/community CHP include an element of speculation. Simplified Monte Carlo modelling was used for workplace EV charging. 61
The results of this modelling indicate significant periods of electricity surplus under the TF pathway, mainly due to the adoption of significant amounts of CHP. Smart demand side participation (DSP), including EV batteries, water heating and space heating provide only a few hours of storage. They cannot improve CCS capacity factors by much or allow old gas-fired plant to be decommissioned. They do, however, reduce surpluses.
Net demand or load duration curves (LDCs) obtained via the FESA model26–28 are shown in Figure 10 at the baseline year (2008) and under version 2.1 of the three UK transition pathways in 2050 (see Barnacle et al.
27
for the corresponding curves associated with the previous version). It is evident that they are steeper for all three pathways in 2050 than was the case for the UK electricity network in 2008. The MR pathway has by far the highest peak demand at about 90 GW compared to the peak value in 2008 of some 58 GW. This represents an extra 32 GW of generating capacity needed for only about 800 h of the year. The MR pathway also has the largest overall range of 97 GW, down to a minimum of -7 GW net demand, which represents the most challenging grid balancing requirement. The CC pathway exhibits a flatter LDC than does the MR pathway with a lower average level of demand resulting from a peak of only 74 GW, a minimum net demand of about -5 GW and consequently a range of 83 GW. Nevertheless, the top 20 GW is again only required for 800 h, thereby reflecting a similar grid balancing challenge. Finally, the TF pathway has the lowest peak demand at around 41 GW, although in this case the top 10 GW is only needed again for 800 h. The minimum net demand in the TF pathway is -45 GW, giving a total range of 86 GW. Thus, the TF pathway creates by far the biggest challenge with electricity surplus in 2050 lasting for only around 19% of the year (with 14 TWh lost due to curtailment/export). All the pathways result in some surplus of low-carbon generation by the year 2050, even after DSP – whereby customers can participate in the energy market via smart meters and the like – has shifted a few GW of electrical demand by a matter of just hours: surplus power then lasts for about 14% of the year (with around 6 TWh lost by curtailment/export). There are several possible ways to alleviate this temporal mismatch
27
: (i) by exporting electricity via international interconnectors; (ii) making good use of the surplus (e.g. via the replacement of boilers and CHP by resistive heating); or (iii) dispatching some of the low-carbon generation (particularly wind). But conventional plants are limited in terms of their ability to load-follow. Fossil-fuelled plants with CCS, for example, are likely to necessitate 100% operation in order to recover their relatively high capital cost. They are therefore unlikely candidates for load-following duties. Nuclear power has a limit to its turndown ratio, and may give rise to severe thermal fatigue stresses when the plants are turned off completely. Such plants are therefore generally regarded as being non-dispatchable. The 2050 system operator will obviously need to determine the best practical solution for network operation in order to satisfy demanding load-following requirements.
Net demand duration curves (LDCs) in 2008 and under the three UK transition pathways in 2050.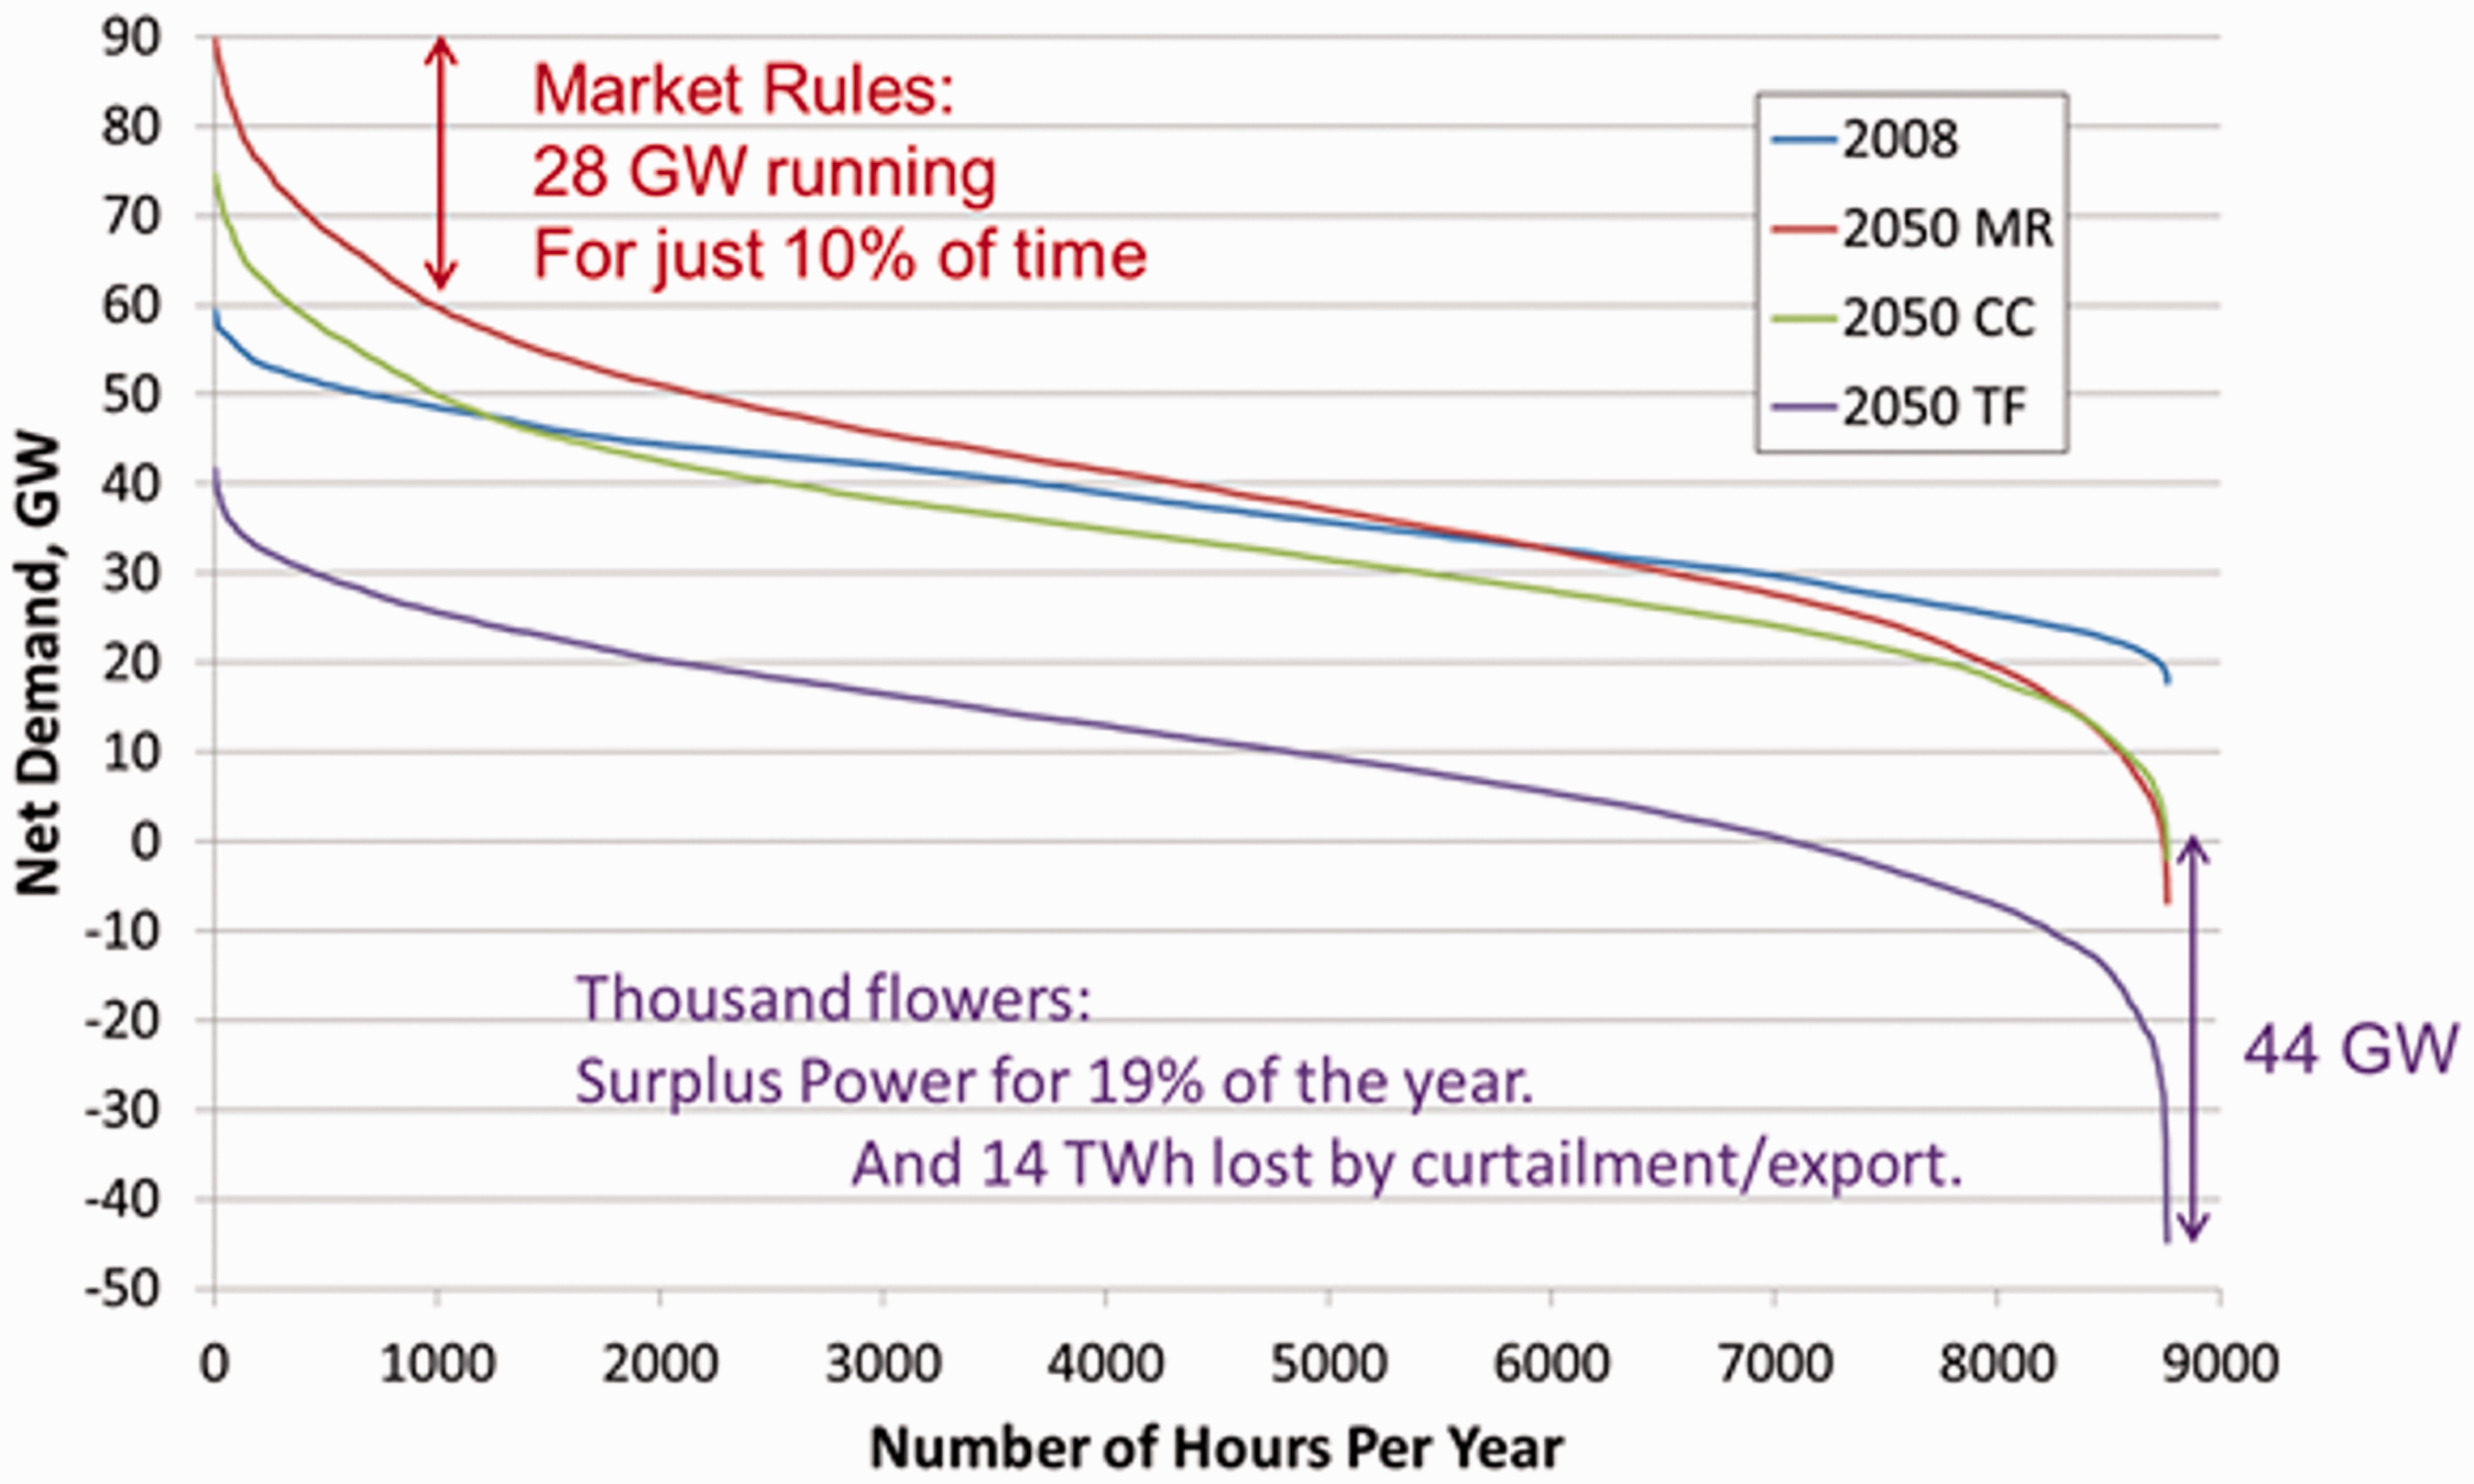
The temporal mismatch between low-carbon generation and demand profiles may lead to very low utilisation factors of dispatchable generation. This is likely to affect financing of gas-fired power stations, and hampers prospects for CCS, which will need to be fitted to fossil-fired generation to achieve long-term carbon budgets. The supply-demand balancing issues will lead to increasing curtailment of renewables and additional consumption of fossil fuel. This leads to significant potential for electricity storage, although innovation will be needed to bring forward options for longer term storage. Thus, overall insights and lessons from hourly grid-balancing can therefore be summarised as:
One year, hourly modelling of Great Britain (GB) – the UK less Northern Ireland – grid balancing using the FESA model indicates a temporal mismatch of low-carbon generation against conventional demand profiles. This presents a much greater challenge to grid balancing than often assumed, e.g. in the DECC 2050 Calculator.
52
Ambitious low-carbon pathways can lead to very low utilisation factors of dispatchable generation, including that with CCS, which could undermine the economic viability of this innovative, disruptive technology. A future system operator (in 2050 or beyond) will need to bear in mind a number of factors in order to secure grid-balancing
27
: the size of the interconnector compared to the peak surplus power requirements; the economic value of exported electricity (which may be quite low) compared to the value of fuel saved by using more resistive heating; and the necessity of maintaining a stable electricity grid (in the frequency and voltage domains) in the absence of conventional, thermal electricity generators. In the absence of very large-scale long-term energy storage, significant curtailment of renewables and additional consumption of fossil fuel may arise at times.
The role and value of demand side response
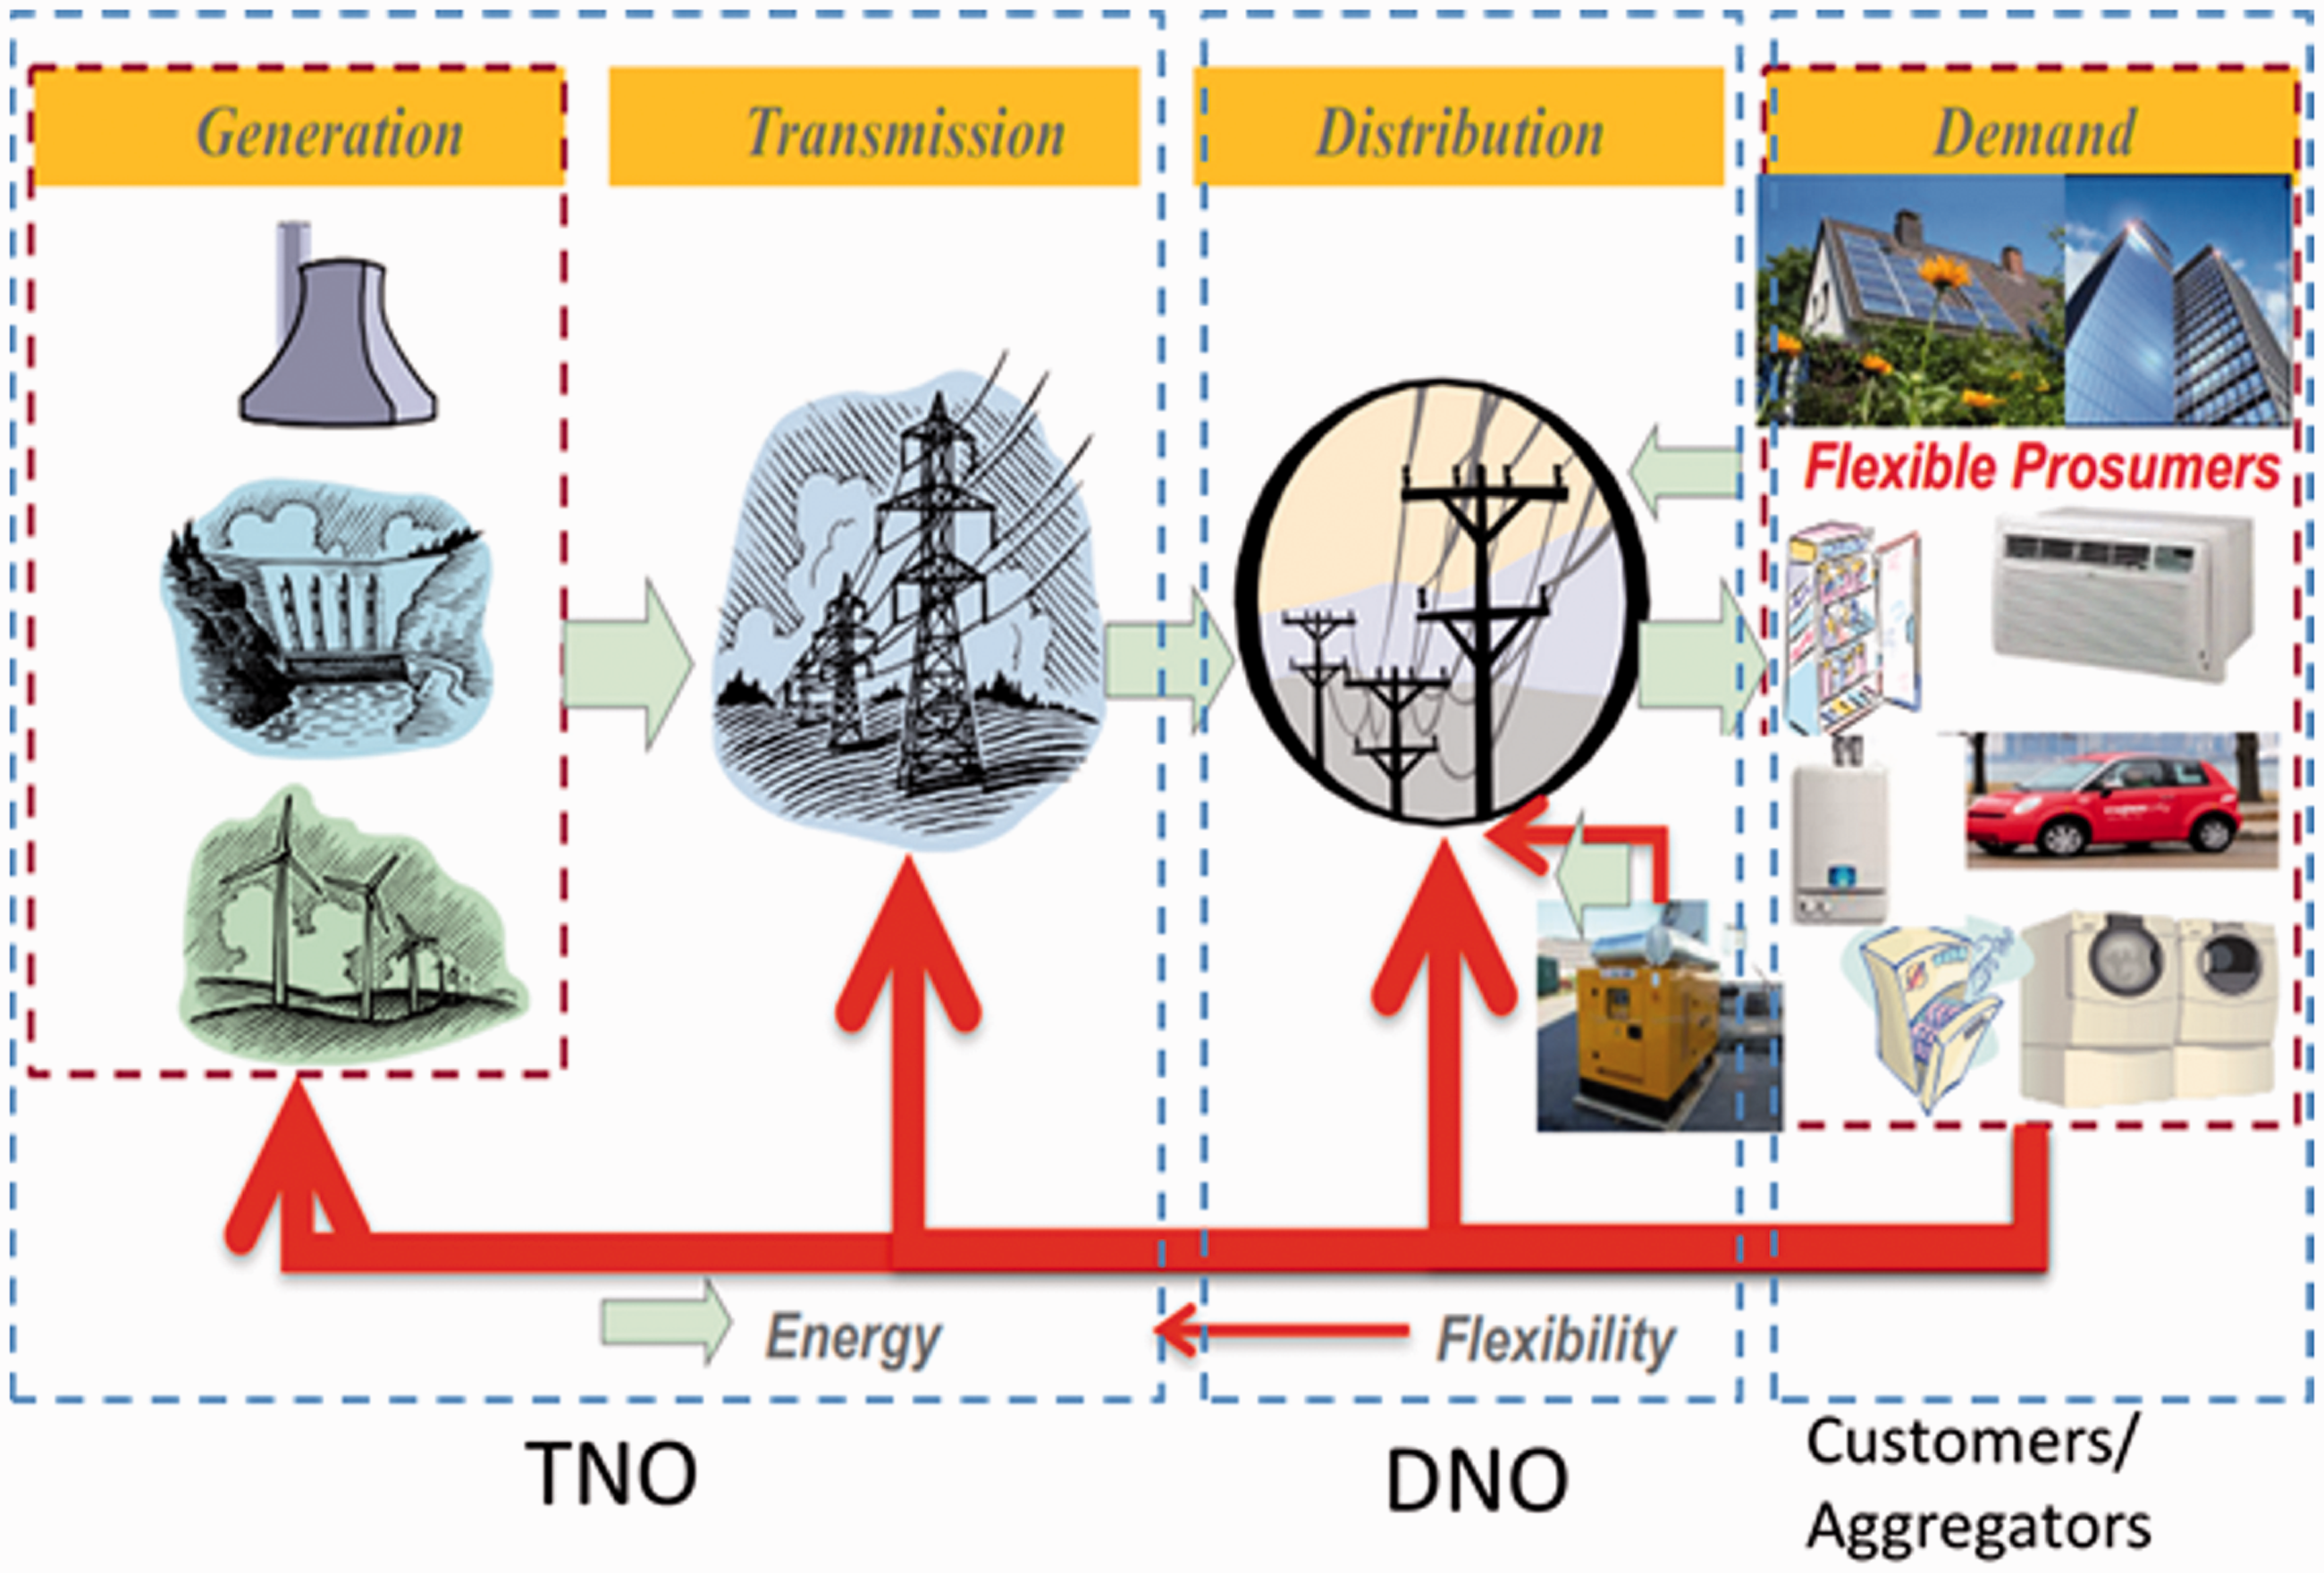
Demand response is a key option for supply-demand balancing28,59,61–65 (see Figure 11), which offers benefits to all parts of the energy system that have been estimated to amount to some £4 bn per year. Electrification of heating and transport services may provide new opportunities for DSR. For example, research into social practices and service expectations combined with technical modelling (see the subsequent section) indicate that, if householders would tolerate a drop in indoor temperature of 1 ℃ for up to ten days a year, between 3 and 9 GW of peak supply capacity could be avoided. The key aim of DSR is therefore to explore the technical performance of various demand response concepts via time-step modelling techniques, but recognising the critical sensitivity to input assumptions regarding the level of expectations of the users. In order to model the potential demand response characteristics of individual load types, data was initially collected on multiple building loads for incorporation into the HESA/UK+ model combination. The data were then exchanged with the Demand and FESA models. An integrated scheduling algorithm was devised as an extension and redevelopment of the FESA model26–28 (see again Figure 8) to allow demand response to compete on a level field against storage and controllable generation. The main calculations were translated into the VBA (i.e. visual basic for applications) code for greater visibility and future flexibility. It has been recognised that changes in the supplier/consumer relationship and in service expectations of consumers will inevitably impact on energy demand out to 2050 and beyond. Consequently, it is important to at least qualitatively ‘model’ consumer practices (see again the subsequent section) and to explore the relationships among customers, suppliers and consumers/prosumers. (Energy prosumers (see Figure 12) are those that produce (via distributed energy resources (DERs)), consume, manage or trade energy according to their own requirements and aspirations.) Smart DSP
28
can help to meet the challenges of flexible demand. Thus, water heating has been found to be capable of time-shifting (see again Figure 11) by around 50% for up to 7 h, space heating by 100% for up to 1 h, and EVs and plug-in hybrid electric vehicles (PHEVs) charging by 100% for up to 7 h.
The challenge of demand side response (DSR): the Thousand Flowers (TF) pathway in Spring 2050 [12 days mostly surplus, 10 days of deficit, 2 days surplus]. Structural opportunities to control flexible demand, including an illustration of the roles of the transmission network operator (TNO), distribution network operator (DNO), and flexible prosumers.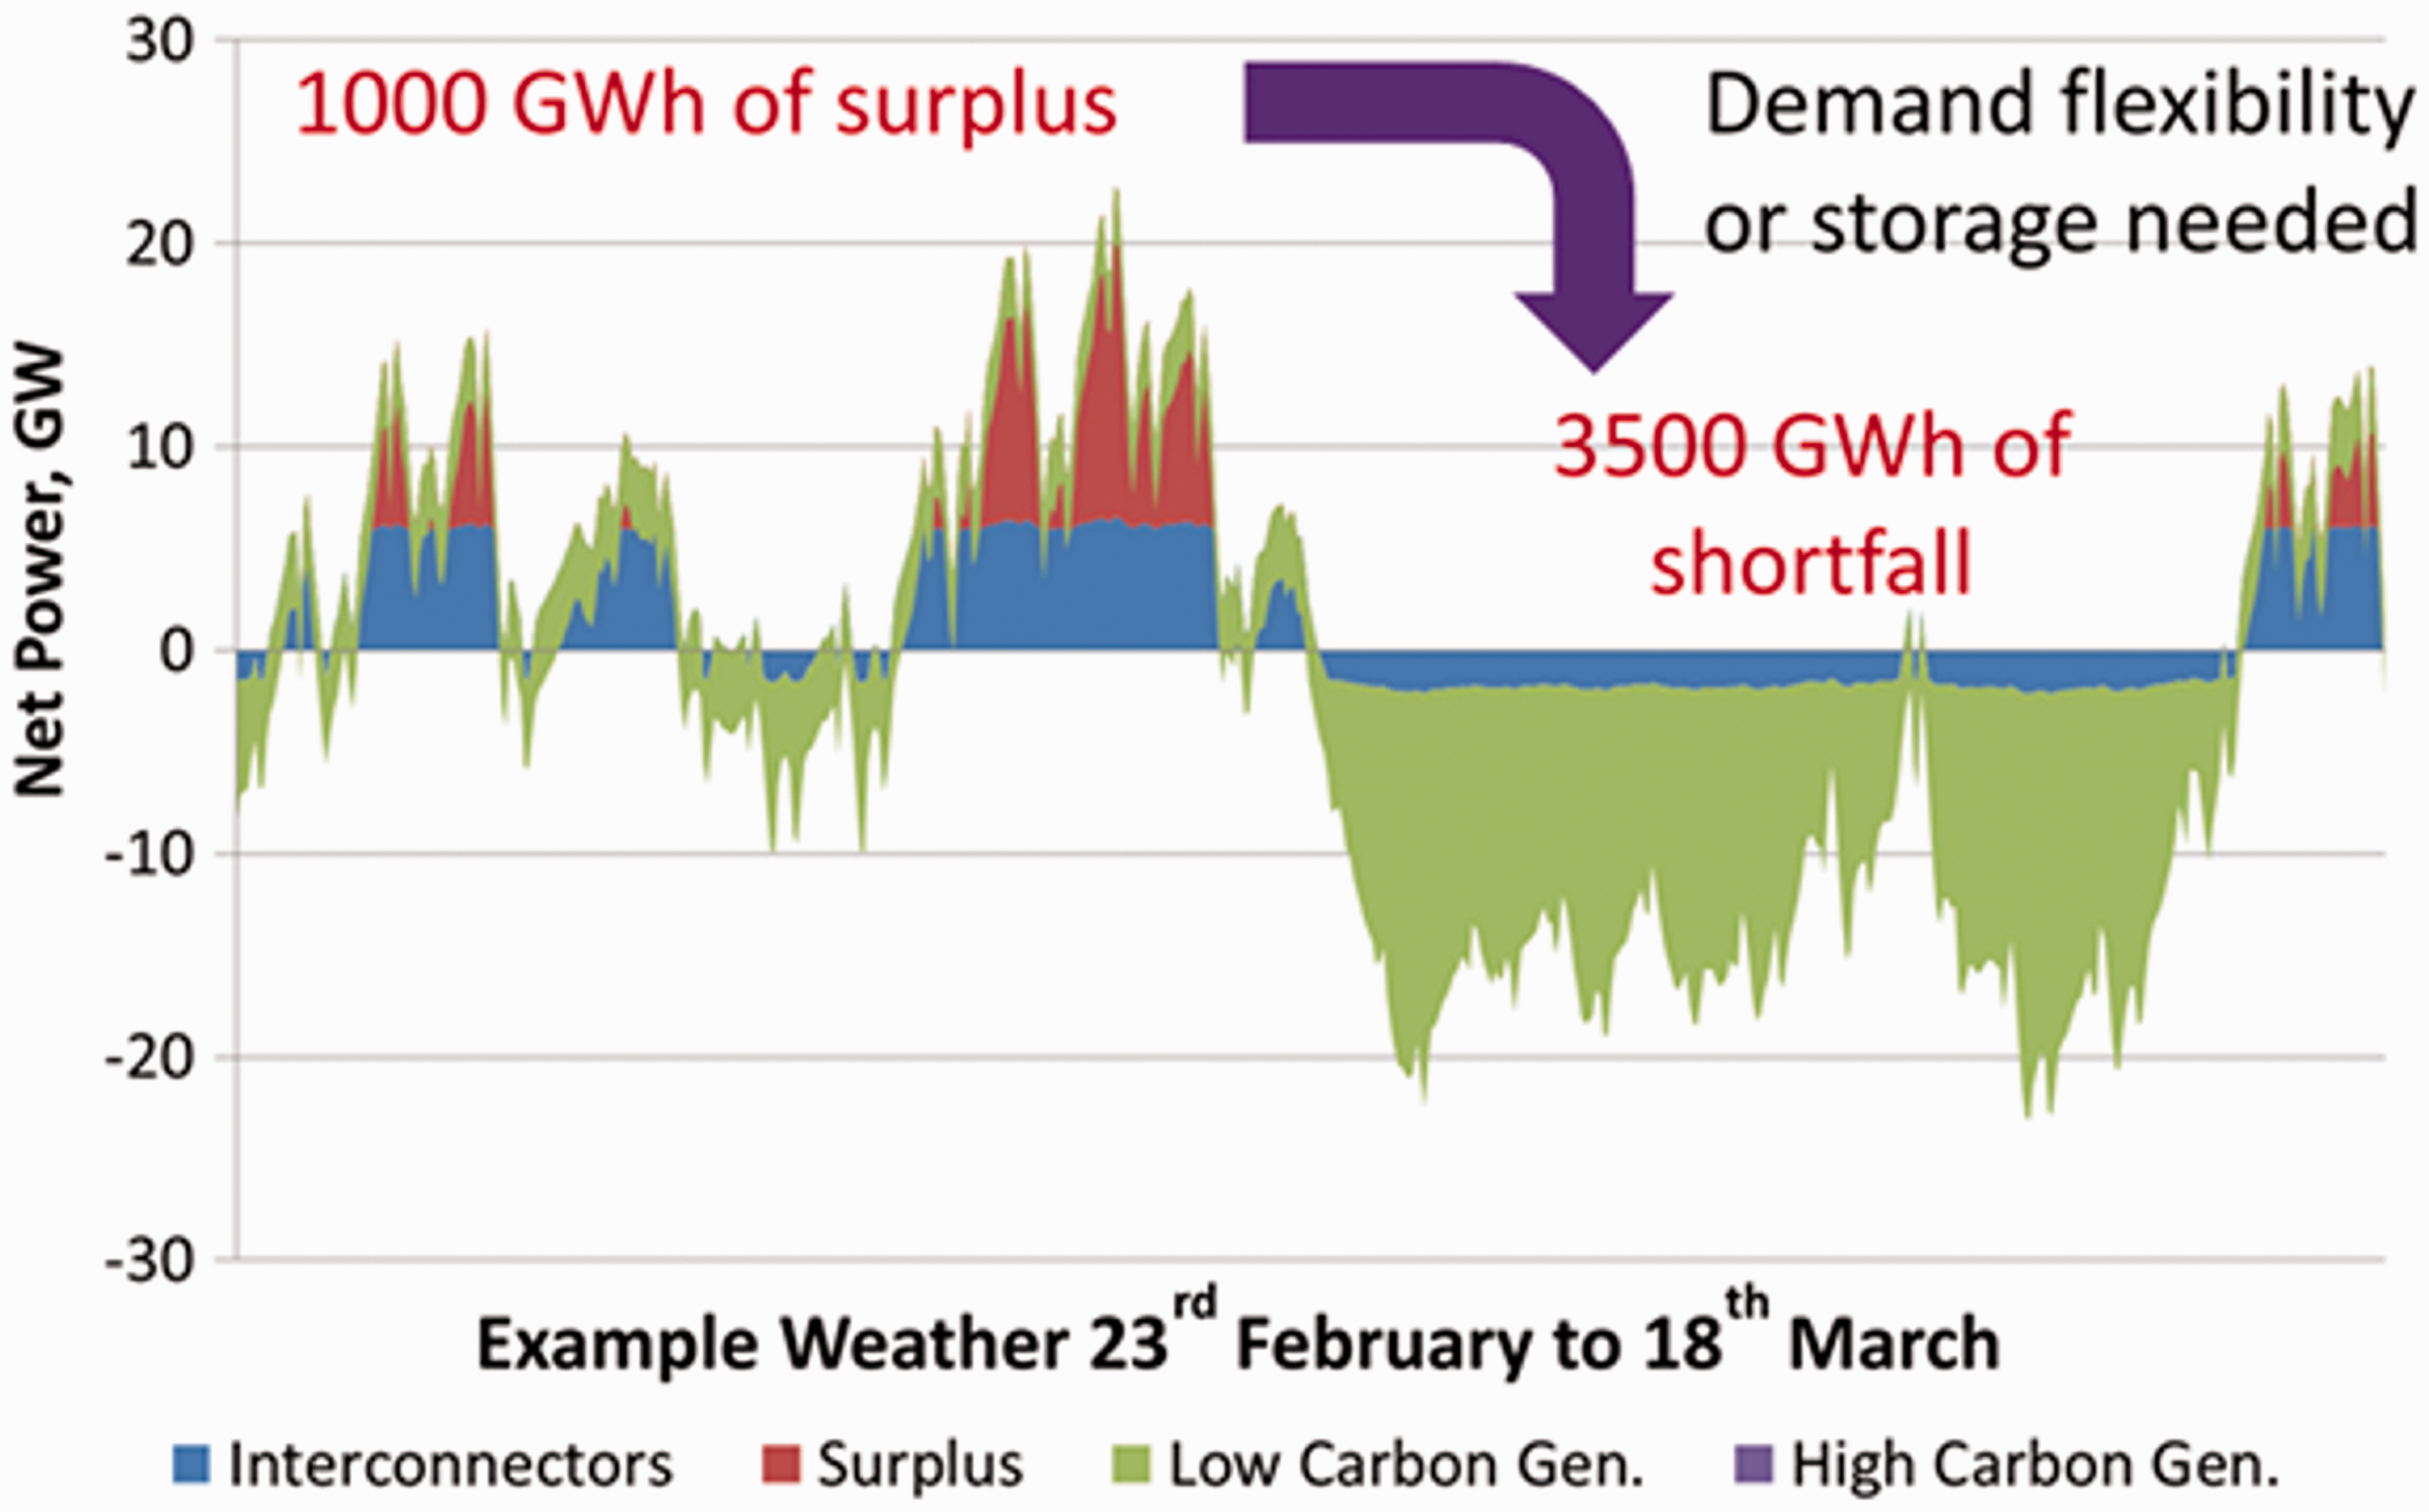
The penetration of renewable generation, particularly onshore and offshore wind turbine arrays, in the UK energy mix may reach as much as 15% by 2020. By that time the number of EVs in use may have reached over one million. Thus, the UK power system will be affected by an increasing imbalance, due to this rise in electricity demand (from EVs) and uncontrolled supply (from wind). Smart EV charging strategies 61 can therefore help the power system cope with high penetrations of local renewable energy sources (RES). Huang and Infield 61 recognised that domestic vehicles are typically parked for around 95% of the time, and hence EVs can be utilised as a ready form of responsive demand. They adopted a Monte Carlo model together with state-of-charge (SOC) information, as part of a whole systems framework, in order to estimate EV charging profiles. Wind farm data was taken from operational sites in Scotland. It was found that the cost over several small EV charging events was essentially free, provided that the surplus wind was greater than 1 MW. Likewise, the impact of the widespread adoption of high-performance heat pumps, alongside the large-scale penetration of wind generators, was recently studied by Cooper et al. 62 They devised a model using dynamic simulations of individual (air-sourced) heat pumps and dwellings, which indicated that increases in peak net-demand is highly sensitive to assumptions regarding the heat pumps themselves, their installation, building fabric (i.e. thermal insulation) performance and grid characteristics. If 80% of dwellings in the United Kingdom were to adopt such heat pumps, for example, then peak net-demand could rise by around 100% (54 GW), although this increase could fall to just 30% (16 GW) under favourable conditions. 62 Smart DSP could reduce this further to 20%, or even 15% with extensive use of thermal storage (as depicted in Figure 11). In contrast, should 60% of dwellings take up heat pumps, then the rise in peak net-demand could be as low as 5.5 GW, and consequently the electrification of heating would be more manageable for the network. 62
Another study by Teng et al. 63 examined the demand for ancillary services under a future GB electricity system as a result of the high penetration of wind generators with limited inertia capability. Under these circumstances, the network may be required to deal with sudden frequency drops following a loss of generator. An advanced stochastic generation scheduling model was employed to quantify the frequency response requirements and the contribution that could be made by DSR. 63 It suggested that the provision of frequency response from DSR could greatly reduce the system operation cost and wind curtailment. These DSR benefits were found to have significant diurnal and seasonal variation, whereas an even more rapid (near-instant) delivery of frequency response from DSR could yield substantial additional value. Competing technologies to DSR that can provide frequency regulation, such as battery storage 41 or more flexible conventional generation could potentially reduce its value by between 15% and 35%. 63 This would still leave significant room to deploy DSR as a cost-efficient frequency response provider within a future low-carbon electricity system.
It is critical to reflect how investors will take decisions to invest in (or to retire) generation plant within a market and policy context. Accounting for the incentives provided to companies through the trading arrangements is hence fundamental for modelling how investors take decisions going forward. As well as power market revenues, renewable and low-carbon generators are also reliant on subsidies to ensure their profitability, which is important for the investment decision-making process. Investors will form ‘rational expectations’ regarding the future when making investment decisions, taking into account power market conditions (e.g. electricity prices, demand growth, demand flexibility, changes in trading and regulatory arrangements, etc.) over the life of the asset based on all the information available to them at the time. Quantitative modelling studies have therefore been conducted in order to evaluate the competitiveness of demand response against other technologies, using a range of GB network case studies related to the transition pathways. A holistic approach (via the whole-electricity system investment model (WeSIM)
64
; a successor to the HAPSO model
55
) has been employed to assess the benefits of demand responses on power generation, transmission and distribution systems under each of the three pathways scenarios (see Figure 13). WeSIM, employed by Pudjianto et al.,
64
is an enhanced model with respect to the modelling of demand and has more functionalities. It was used to provide useful insights on the characteristics of different pathways in terms of the expected increase in future peak demand, driven primarily by electrification of heating and transport sectors,61,62 as well as the consequences for future power system infrastructure requirements. This approach
64
simultaneously optimised investment into new generation, network and storage capacity, while minimising system operation cost, and also considering reserve and security requirements. The analysis distinguished between bulk and distributed storage applications, while also considering the competition against other technologies, such as flexible generation, interconnection and DSR
64
(see again Figure 13). The results demonstrated that the DSR savings are potentially significant and that the MR pathway, for example, could save up to £90 bn of investment by 2050. A key issue arising from these studies is that the postulated generation capacity under the pathways may not be sufficient to meet security standards. This highlights the importance of considering the security of supply aspect in the development of future generation portfolios. Analysis of the electricity price characteristics of the three pathways showed that some generators with relatively very low load factors bring into question the feasibility of generation in an energy-only market. There are significant multi-stream savings that arise from DSR (multiple applications, including energy arbitrage, system balancing and capacity) across all pathways (amounting to some £4 bn/year by 2050). The benefits of whole-system based DSR applications are higher than those of the (non-coordinated) transmission network operator (TNO) or distribution network operator (DNO)-centric DSR applications: see again Figure 12. This highlights the need for such whole system control co-ordination between the TNO and DNO in order to improve the interaction with DSR control.
Energy storage (ES) represents one of the key enabling technologies to facilitate an efficient system integration of intermittent RES in conjunction with the electrification of heating and transport demand (see Figure 11). A stochastic optimisation method was used to quantify the benefit of distributed energy storage from the owner perspective. 65 A large set of case studies were carried out 65 in order to quantify the commercial and emissions benefits of ES in respect to energy and ancillary service markets, the revenue obtained from feed-in tariffs (FiTs), and the consequent reduction in operational CO2 emissions. ES was found to be able to provide opportunities for temporal arbitrage, because of the volatility of day-ahead and real-time (balancing) energy prices with a value of between £100/kWh and £650/kWh. 65 Its value in terms of anciliary services, such as frequency response, was estimated to be up to about £200/kWh on top of the basic value of ES. The value of ES for FiT revenue maximisation was found to decrease with increasing capacity from £108/kWh to £38/kWh. 65 When ES is charged during low-emission periods and discharged in high-emission ones, then the carbon footprint falls by around 10% even with losses taken into account. Teng et al. 65 observed that current and near-term batteries did not appear to be cost-effective for power generation applications. Thus, they noted that LIBs were most effective (∼£480/kWh) for kW/kWh applications with reasonable charge/discharge cycle lives. 41 (The cost of LIBs are today about ∼£140/kWh (similar to the price in 2012 noted by Hammond and Hazeldine 40 of ∼£135/kWh) having fallen from >£1675/kWh in 1990.) This contrasts with sodium-nickel chloride devices (so-called ZEBRA41,65 batteries) at ∼£329/kWh. Teng et al. 65 expect the costs of lithium ion batteries to halve by 2020, although they expect those for the ZEBRA battery technologies to remain largely unchanged.
The technical performance and social acceptability of a range of proposed DSR concepts has been examined via an integrated approach in order to quantify the changes in electricity load profiles of the type represented in Figure 11. The benefits of DSR options to the various classes of consumers were quantified for a range of scenarios appropriate to the different transition pathways. McKenna and Thomson 66 examined, for example, the way in which domestic consumers with rooftop solar PV arrays could benefit financially from time-shifting. They used an internet discussion forum to determine whether consumers with such PV systems engage in DSR activities so that they benefit further from free, self-produced electricity. Washing machines, dishwashers and electric space and water heaters were the most commonly employed appliances to shift demand. 66 The results suggest that, while price is an effective driver of DSR, there are other factors that generate demand response of the sort depicted in Figure 11. They indicate that consumers with PV are often willing to be more flexible than is commonly assumed. This behavioural response could possibly be used in future to devise innovative tariffs that might stimulate demand shifting. 68 These value assessments are important elements in assessing the take-up, scale and effectiveness of DSR that can be expected.
These and other findings have benefited from a whole systems and collaborative working approach for elaborating and examining the transition pathways for realising a low carbon, secure and affordable UK energy system by 2050. Thus, the insights and lessons learned from studying the role and value of DSR were:
Demand side participation (DSP) concepts are mainly short term (minutes to hours), whereas flexibility is needed over several days or more. The rigid patterns of modern living and consumer expectations based on life-long experience of fossil-fuelled supplies make such flexibility challenging, but are important to explore. Fully automated DSR concepts, such as ‘smart’ controllers for EV charging and heat-pumps, have been studied in some detail. Battery energy storage and controlled EV charging helps cut peak demands, but typically provides only a few hours of storage, doing little to address longer term weather-related variations. A Monte Carlo model of EV movements and home based charging
61
has been used to analyse the impact on a typical low voltage distribution network with typical household loads, suggests voltage impacts to be the most critical: voltages could easily become unacceptable without demand side management. The extension of EV charging to allow workplace charging seems to relieve the distribution network loads and help avoid voltages outside the statutory range. Decarbonised electrification of heating could make a useful contribution to the reduction in UK CO2 emissions, but may cause a challenging increase in peak power demand, net of non-dispatchable generation. This can be reduced, although not entirely eliminated by thermal energy storage and DSP. In addition, it has been shown
62
that high-performance (air-sourced) heat pumps, with appropriate installation and better insulated buildings, could make the rise in peak net-demand far more manageable. An integrated market model (developed in WeSIM
64
) has been used to analyse the evolution in electricity prices in different system backgrounds with different DSR technologies, network development, carbon prices and energy policies (related to market integration with the EU). When viewed in the context of a high share of renewable generation (such as under the TF pathway), the magnitude and volatility of electricity prices tend to increase, particularly driven by higher carbon prices and greater variable generation. The price differential between exporting and importing regions also widens from increased congestion in the national/cross-border transmission system. There are significant multi-stream savings from DSR (via multiple applications, including energy arbitrage, system balancing, capacity) across all pathways; amounting to £4bn/year by 2050. These benefits of whole-system based DSR applications are higher than those of (non-coordinated) transmission system operator (TSO) or distribution system operator (DSO)-centric DSR applications. This highlights the importance of whole system control co-ordination. The transition pathways have been costed under very different governance and institutional arrangements. Economic feasibility of generation in all three pathways will depend on the revenue from secondary markets/sources, such as capacity (ancillary service) market, FiT, tax incentives, etc., although the ratio of the revenue needed from primary and secondary markets is case specific.
Attending to the social dimensions of realising transition pathways
There is growing awareness that meeting the challenges of a low-carbon transition will require socio-technical solutions, and that consequently the social sciences have a key role to play in devising them, including working with engineers and physical scientists in an interdisciplinary manner.66–68 A team of social scientists worked work interactively in collaboration with engineers in the present consortium to enhance consideration of the social dimensions of the project. This included work to open up assumptions about actor dynamics and social change as well as roles of the public and civil society in realising the UK transitions pathways.66–68
Building on the concept of the action-space devised in the first phase of the Transition Pathways project8,24,30 (see section ‘Insights from historical transitions’ above), a relational co-productionist approach grounded in ideas form science and technology studies (STS) was developed to map relations between social actors across the UK electricity system and the spaces through which they participate in energy system change was developed to described the way in which different patterns of interaction between market, government and civil society actors lead to particular modes and logics of governance.8,24,30 An important means of mapping actors and action spaces was through a systematic qualitative analysis of twelve contrasting visions of the low-carbon transition. This analysis showed that while some visions assume a technologically focused transition driven by the energy trilemma and centred on economic growth, alternative visions (particularly those from of civil society actors) place more emphasis on social and cultural change, issues of equity and fairness, and do not assume or depend on existing models of economic growth. Chilvers and Longhurst 67 studied four diverse sites of civil society engagement in low carbon transitions: the DECC Energy 2050 Public Dialogue (DECC 2050), the Camp for Climate Action (CCA; direct action events at various coal-fired power stations over 2006–2011), the Visible Energy Trial8,33 (VET) and the Dyfi Solar Club (DSC; a community energy initiative in Machynlleth, Powys, Wales). They revealed that powerful forms of enrolment, exclusion and the partiality of visions and actions are common to all form of participation in transitions. Such analyses play a valuable role in transition pathways analyses through revealing social dimensions and informing how modelling studies frame the energy problem, bound the study system, and communicate uncertainties. It helped the wider consortium and technical analysts realise that that transitions are never smooth and will always be subject to contestation, negotiation and social change.
The other way in which social dimensions of energy transitions were attended to during the second phase of the realising transitions pathways project was through taking forward novel interdisciplinary (ID) experiments to co-produce social science and engineering insights on energy demand response in real time. These studies included a meta-review of social science evidence, leading into the design of small-scale integration experiments. The first of the ID experiments was a Service expectation experiment (see Figure 14, and the summary in Table 3) in which the social science input into existing models was evaluated in order to improve model assumptions about how indoor comfort expectations could change over time. Such service expectations are often held to be stable, but social science literature suggests they vary in different ways. A range of service expectation scenarios were studied based on the outcomes from the review (such as more demanding standards, wider comfort zone and local diversity). The FESA model26–28 (Figure 8) was employed in order to examine various behavioural scenarios with variable service expectations. The work indicated that if householders (consumers or flexible prosumers; see Figure 12) were tolerant of a small internal temperature change either side of their desired set-point, and even allowing these for just a few hours per year this could yield large reductions in peak demands (a few GW): see again Figure 11. This opened up the prospect of new behavioural scenarios for models, new parameters and boundaries. The term framing, used in Table 3, implies the inevitable process of selective influence over the perception of an individual (involved in the experiment) in such a way as to encourage particular (potentially biased) interpretations and to discourage others. This experiment suggested that new levels of detail are required in existing FESA-like models (e.g. around heating/cooling technologies, housing stock, etc.).26–28
Diagrammatic representation of experiments in interdisciplinarity (ID). DR: demand response. Comparative reflections on interdisciplinary (ID) experiments around energy modelling and demand response.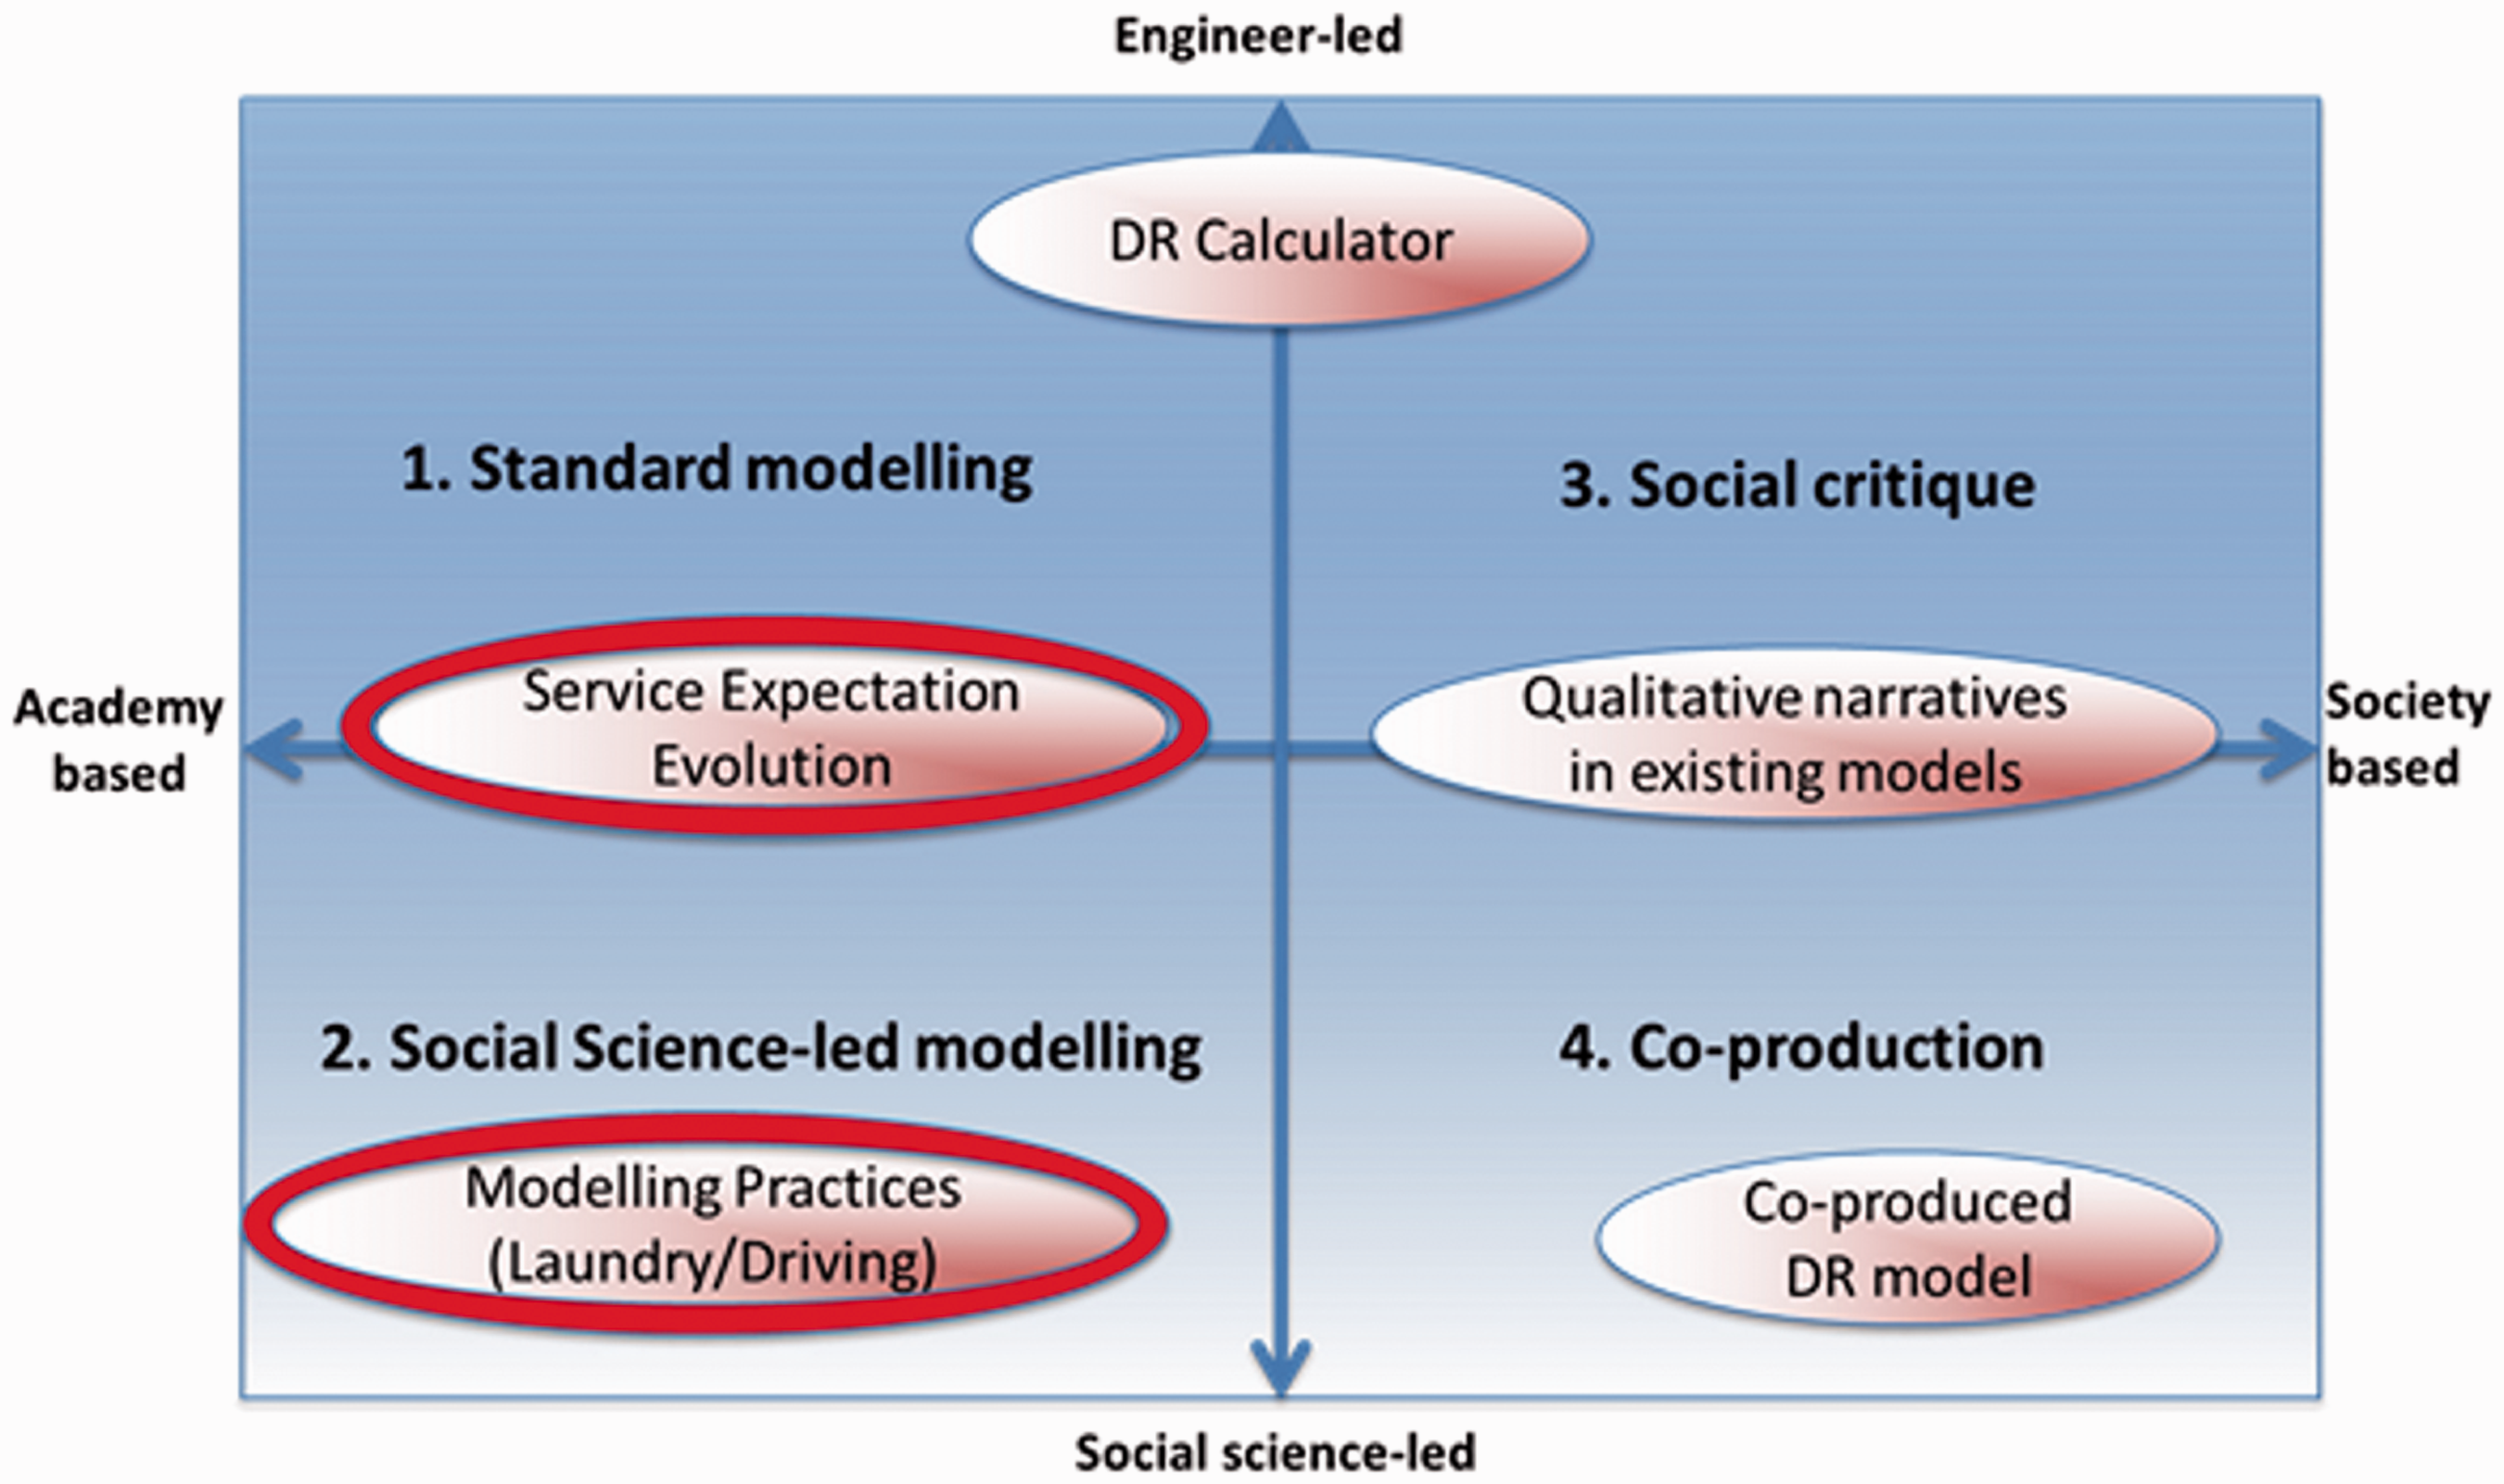
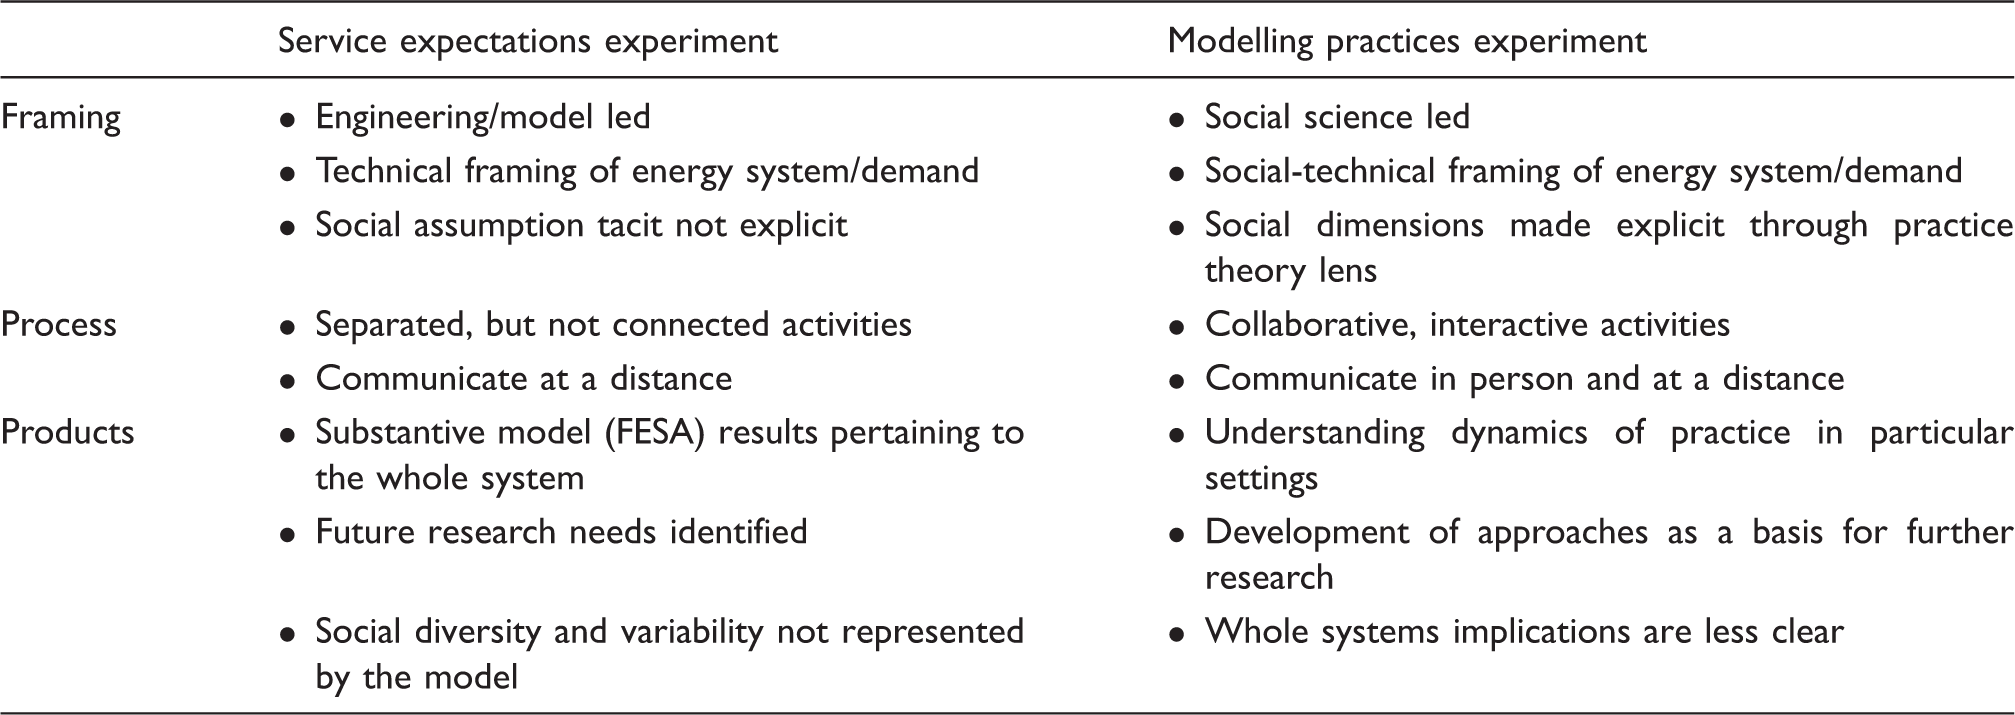
The second strain of social science-led, ID experiment (by Higginson et al.
68
), termed Modelling practices experiment (and again summarised in Table 3), was designed to develop new approaches to modelling based on social science understandings of, and data about, social practices. It encouraged the social scientists to communicate their ideas more clearly, whilst allowing engineers to think critically about the embedded assumptions in their models in relation to society and social change. Social practice theory together with network analysis
68
was adopted to provide a network diagram to visualise different practices. ID participants then collaboratively generate mappings of ecologies of practices: see Figure 15 that illustrates various social activities and practices in the home. The elements of practices – represented by circles – are distinguished in terms of images, skills (e.g. washing) and stuff (e.g. dirty clothes). Thus, washing clothes as an energy service is not merely determined by the washing machine, tumble drier and iron, but depends on much else. These other social factors include the meaning of clean, the way the different schedules in the household come together, the organisation of laundry and the way it is done in the household, and so on, i.e. the images and skills that are part of the practice of laundry. Graphs of practice networks such as this can be populated with empirical survey data. Higginson et al.
68
recently used this approach to examine from a survey of different types (or variants) of laundry practice. They gleaned insights into energy intensity, flexibility and the rootedness of practices, i.e. the extent to which they were entrenched or established. It was argued that this permitted the social practices to be represented graphically using a quantitative format (Figure 15) without being overly reductive. This modelling practices experiment opened up new socio-technical discussions about core/periphery elements, variants of practice and so on, but also closes down discussion about the situatedness of practices (see Table 3).
A simplified network representation linking social activities and practices in the home: identifying ‘hubs’, ‘anchors’ and ‘clusters’.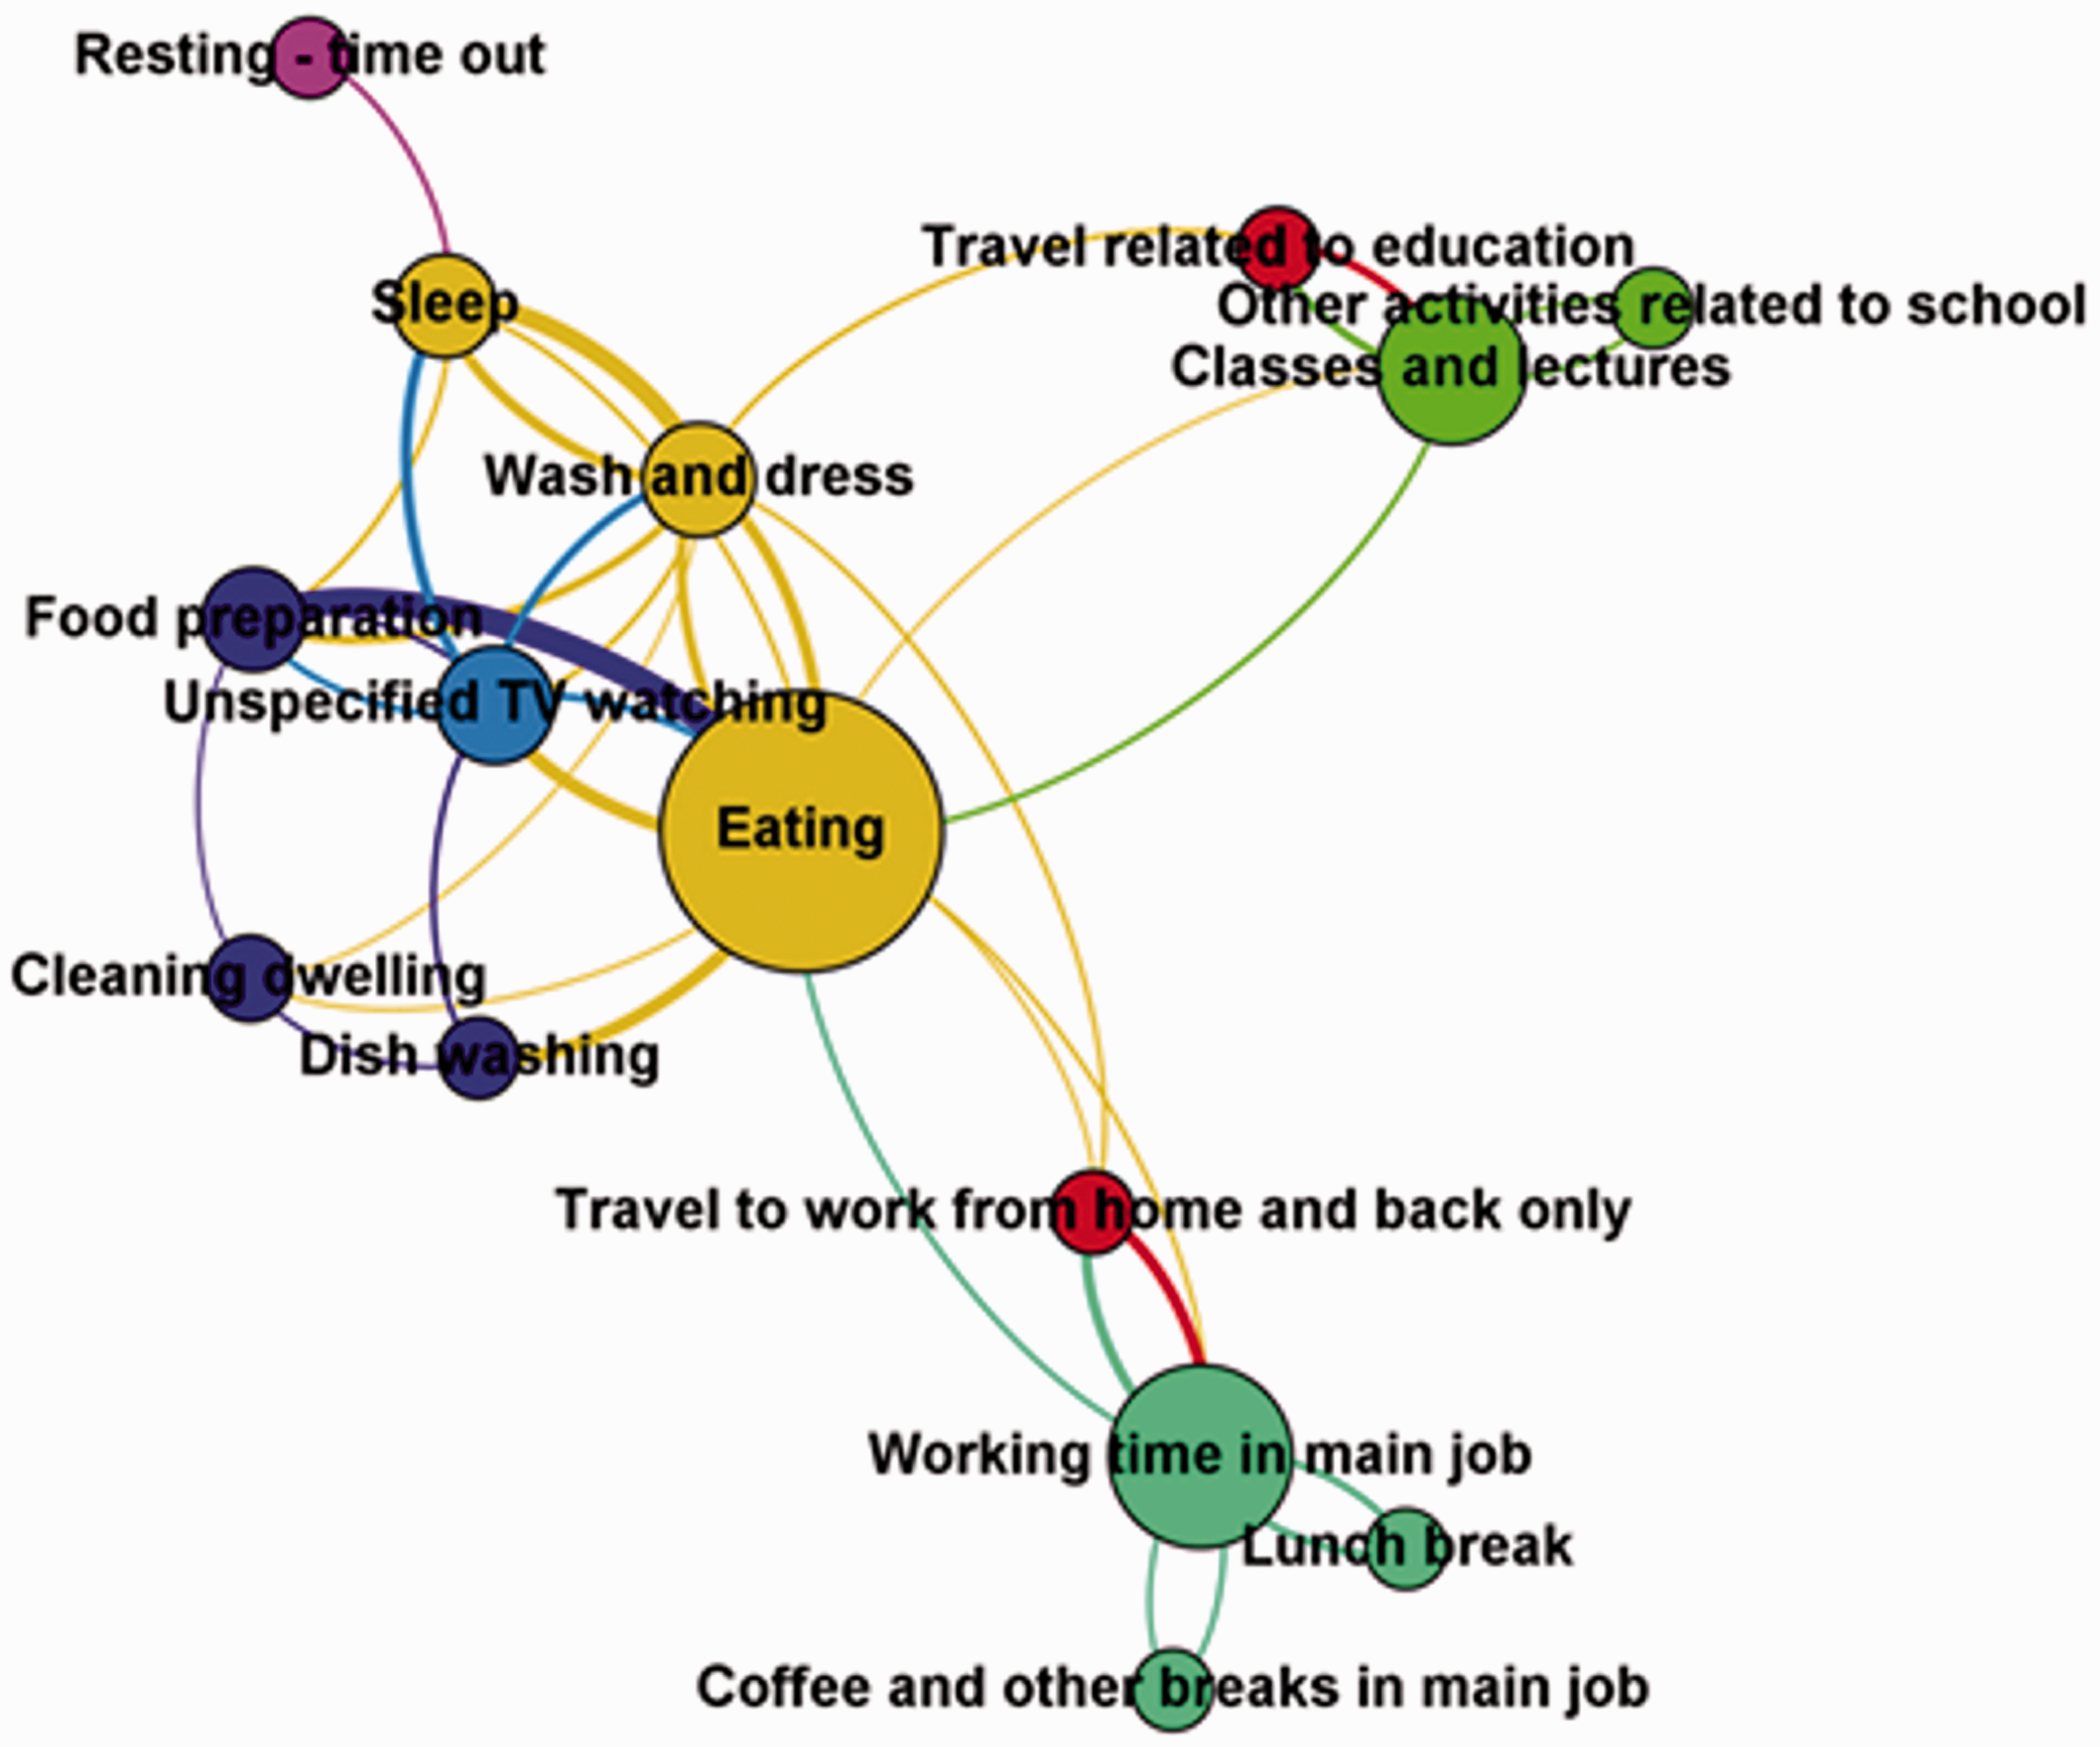
Through these ID experiments engineers had become more aware and reflective of the tacit social assumptions and limitation of their models, while social scientists became more aware of the complexity of energy models and the difficulty of making even small changes to their inbuilt assumptions. Importantly, these collaborations produced new findings and insights only possible through interdisciplinary working. Bringing together practice theory with network analysis extended and scaled up understandings of energy-related practices, generating new insights on the constraints and potentials for modelling flexibility and energy demand response. In the service expectation experiment, integrating social science insights into the FESA model showed how even small changes in thermal comfort expectations can lead to significant savings in terms of energy demand, which could prove crucial in realising low carbon transitions.
Key challenges, insights and opportunities identified in these studies attending to the social dimensions of energy transition pathways include:
New evidence that quantitative energy modelling approaches routinely neglect important social aspects of energy transitions and how society will influence future pathways, including changes in how energy problems are framed, service expectations of users, the roles of public engagement and institutional changes. Social science analyses can provide important new evidence about the relations between actors and forms of participation in energy transitions, which is important evidence in its own right and in sensitising models to alternative framings, social futures and uncertainites inherent to scenarios and model projections. If interdisciplinary collaboration is well designed, open, collaborative and based on trust it is possible to integrate engineering and social science expertise, which produces new insights beyond what is possible with single-discipline approaches – for example, showing prospects for energy demand flexibility and responsiveness greater than previously estimated. There is no single best practice approach to interdisciplinary energy research. An effective approach is to develop forms of integration between social science and engineering modeling approaches that are appropriate, diverse and can be evaluated and learned from over time. Involving social scientists in real-time interdisciplinary collaboration with physical scientists can hold the key to producing whole systems energy models that are more responsible, anticipatory and accountable to the social implications and effects of energy transition pathways.
Distributed energy
The TF pathway explores a low-carbon transition led by civil society, which focuses on decentralised or distributed solutions to energy problems. Currently, less than 1% of UK electricity demand is met by community- or local authority-owned distributed electricity generation. A major driver for the TF pathway is seen to be a step change in the role of the civic energy sector (communities, co-operatives, local authorities, town and parish councils, social housing providers) through participation in, and ownership of, electricity generation schemes. ESCos are presumed to emerge, with incentives aligned with energy efficiency improvements. Because this pathway deviates most from the current energy market, and has no recent precedent, it has interested bodies including the public-private ETI (e.g. their Patchwork scenario) and the UK energy market regulator (Ofgem). The consortium postgraduate researchers (the Engine Room (see section ‘From narrative descriptions of the transition pathways to model formulation’ above); again working independently of the consortium leadership – the academic co-investigators) were asked to evaluate the implications of this novel pathway, and they produced a Distributing Power report. 69 With strong demand reduction and management, 50% of 2050 final electricity usage could be met via distributed generation with emerging technologies, new infrastructures (including interconnections), and new institutions. Although challenging to the current power system operational norms, a transition to 50% distributed generation by 2050 was found to be technologically feasible. However, it would require the installation and full utilisation of smart grid technology, alongside DSP, demand management, and other techniques and technologies. A more distributed system would clearly need regional energy strategies and local capacity building for city regions, municipalities, communities and citizens. A distributed energy system opens up new avenues for energy transition finance, while challenging incumbent utility business models. (The integrated market simulation model (WeSIM 64 ), described in section ‘Hourly demand profile modelling’ above, can be used to optimise real-time dispatch in a chronological fashion, as well as reflecting entry and exit decisions by investors, using an iterative process.) The model for investment in conventional and renewable generation was used to calculate the electricity prices (including energy and scarcity prices that reflect the scarcity in generation capacity during peak demand), generation and transmission revenues. It highlighted the finding that electricity prices are expected to be more volatile in the future and that the impact of demand response on average electricity price is modest but it reduces significantly the volatility.
The Distributing Power report 69 draws on empirical research, engagement with a wide range of stakeholders from the energy sector, and from experience in Germany, Denmark and in the United Kingdom. It offers insights into the barriers and the technological transformation that might be required for a move to a highly distributed energy future. This decentralised generation would be required to satisfy the TF pathway with an increase in regional, national and international interconnection in order to ensure electricity imports from neighbouring countries. 69 Much of the energy value that currently leaks out of the UK economy could then be captured at the local level. Such distributed energy systems have often been equated with increased energy independence. But significant reduction in electricity demand would be necessary, including improved energy efficiency and conservation. Households, for example, would need to more than halve current levels of electricity consumption by 2050. 69 National energy planning with regional and local support for a civic energy sector would be needed. This implies a much greater role for national and local government. The traditional business models of the Big Six incumbent electricity suppliers would inevitably be challenged as they lose market share to local generation and supply businesses. New infrastructure, like smart grids and emerging decentralised technologies (such as in-home fuel cells), would be necessary; requiring a large-scale expansion from 2020 onwards. The impact to consumer bills would only be marginally more expensive out to 2030, 69 although they could be significantly cheaper in the long term (to 2050) compared to the MR and CC pathways. While the Distributing Power report 69 assesses the impact of one distributed generation future, there are others which might see a greater role for solar, onshore wind, or other generation mixes.
Traditionally, renewable electricity generation capacity in the United Kingdom has been built by large-scale commercial developers and/or utilities, whose finances are globally mobile. The Distributing Power report 69 suggests a possible alternative of a proliferation of distributed energy generators, which are owned fully or in part by municipalities, communities, or small-scale investors. (A companion piece to the Distributing Power report, 69 produced by Johnson and Hall, 70 has examined the distributional implications of the TF pathway.) Citizens would thereby gain more control over their energy use. Centralised generation would still be necessary for base-load and peaking capacity. However, for this to be viable in a distributed generation future, the government would need to provide the right incentives for new large-scale plant and infrastructure. The civic energy sector, defined as energy generation by communities, co-operatives, local authorities, town and parish councils or social housing providers, currently relies on motivated individuals and communities and often, voluntary work. The development of a decentralised future along the lines proposed for the TF pathway would require strong project management and professional expertise to deal with a range of technical, financial, legal and administrative issues. In order to move to a distributed approach, regional energy strategies and local capacity building would be essential to aggregate these local energy schemes into a coherent civic energy generation sector.69,70 This would mean complementing national energy planning with regional and local support for a civic energy sector and implies a much greater role for both national and local government.
The launch of the Distributing Power report
69
in February 2015 informed the wider UK energy debate, and is leading to further work with key stakeholders, including an invited submission to the Ofgem non-traditional business models process. The headline messages were:
69
All UK energy projections, including a distributed energy future (such as that encapsulated in the TF pathway), require international interconnection. In addition, the TF pathway relies heavily on energy demand reduction, DSP and demand-side management. Households would need to more than halve their current levels of electricity consumption by 2050. A distributed energy system opens up new avenues for energy transition finance, while challenging incumbent utility business models. Around 50% of final electricity demand by 2050 could be met via distributed generation, but new infrastructures and emerging technologies would be required: from smart grids at a national level and to the likes of in-home fuel cells locally. A large-scale expansion would need to occur under the TF pathway from 2020 onwards. Thus, national energy planning with regional and local support for a civic energy sector would be needed. A high-level of distributed generation would require an increase in regional, national and international interconnection, such as electricity imports from neighbouring countries. Distributed energy systems have often been equated with increased energy independence. Much of the energy value that currently leaks out of the UK economy could be captured at the local level. The traditional business models of the Big Six incumbent electricity suppliers would be challenged as they lose market share to local generation and supply businesses. In order to move towards a more distributed system, regional energy strategies and local capacity building would be essential for city regions, municipalities, communities and citizens. The impact to consumer bills within a highly distributed power system (of the sort proposed for the TF pathway) would only be marginally more expensive in the medium term out to 2030, although it could be significantly cheaper over the long term to 2050 in comparison to those under the alternative MR and CC pathways.
Whole systems energy and environmental appraisal of the different energy mixes
An outline of the strengths and weaknesses of environmental LCA.

Source: Hammond et al. 57
An examination of the whole system environmental burdens of the present transition pathways (version 2.1) was undertaken by Hammond and O’Grady
58
(as an extension of the earlier LCA study by Hammond et al.
75
(of version 1.1 of the pathways)), whereby GHG emissions reflected the sum of both upstream and operational emissions. The latter (‘stack’) emissions are those directly associated with the combustion of fossil fuels within power stations. Thus, the whole system emissions amount to those related to the ‘cradle-to-gate’. The national electricity network (operated by TNOs and DNOs) represents the downstream boundary known as the gate (hence, cradle-to-gate
75
). In the studies by Hammond et al.
75
and Hammond and O’Grady,
58
they highlighted the significance of upstream emissions and their (technological and policy) implications, in contrast to the emphasis on power plant operational emissions conventionally presented by other analysts. These upstream environmental impacts arise from the energy requirements for extraction, processing/refining, transport and fabrication, as well as methane leakages from coal mining activities – a major contribution – and natural gas pipelines. The total carbon dioxide equivalent (CO2e) emissions associated with various power generators and UK electricity transition pathways towards a low carbon future are depicted in Figure 16. This illustrates the GHG trajectory under each of the three transition pathways out to 2050. It was also found that CO2e capture facilities coupled to fossil-fuelled plants deliver only a 70% reduction in GHG emissions (including both upstream and operational emissions), in contrast to the normal presumption of a 90% saving.
‘Whole systems’ (upstream plus operational (or ‘stack’)) GHG emissions under the three UK transition pathways (1990–2050).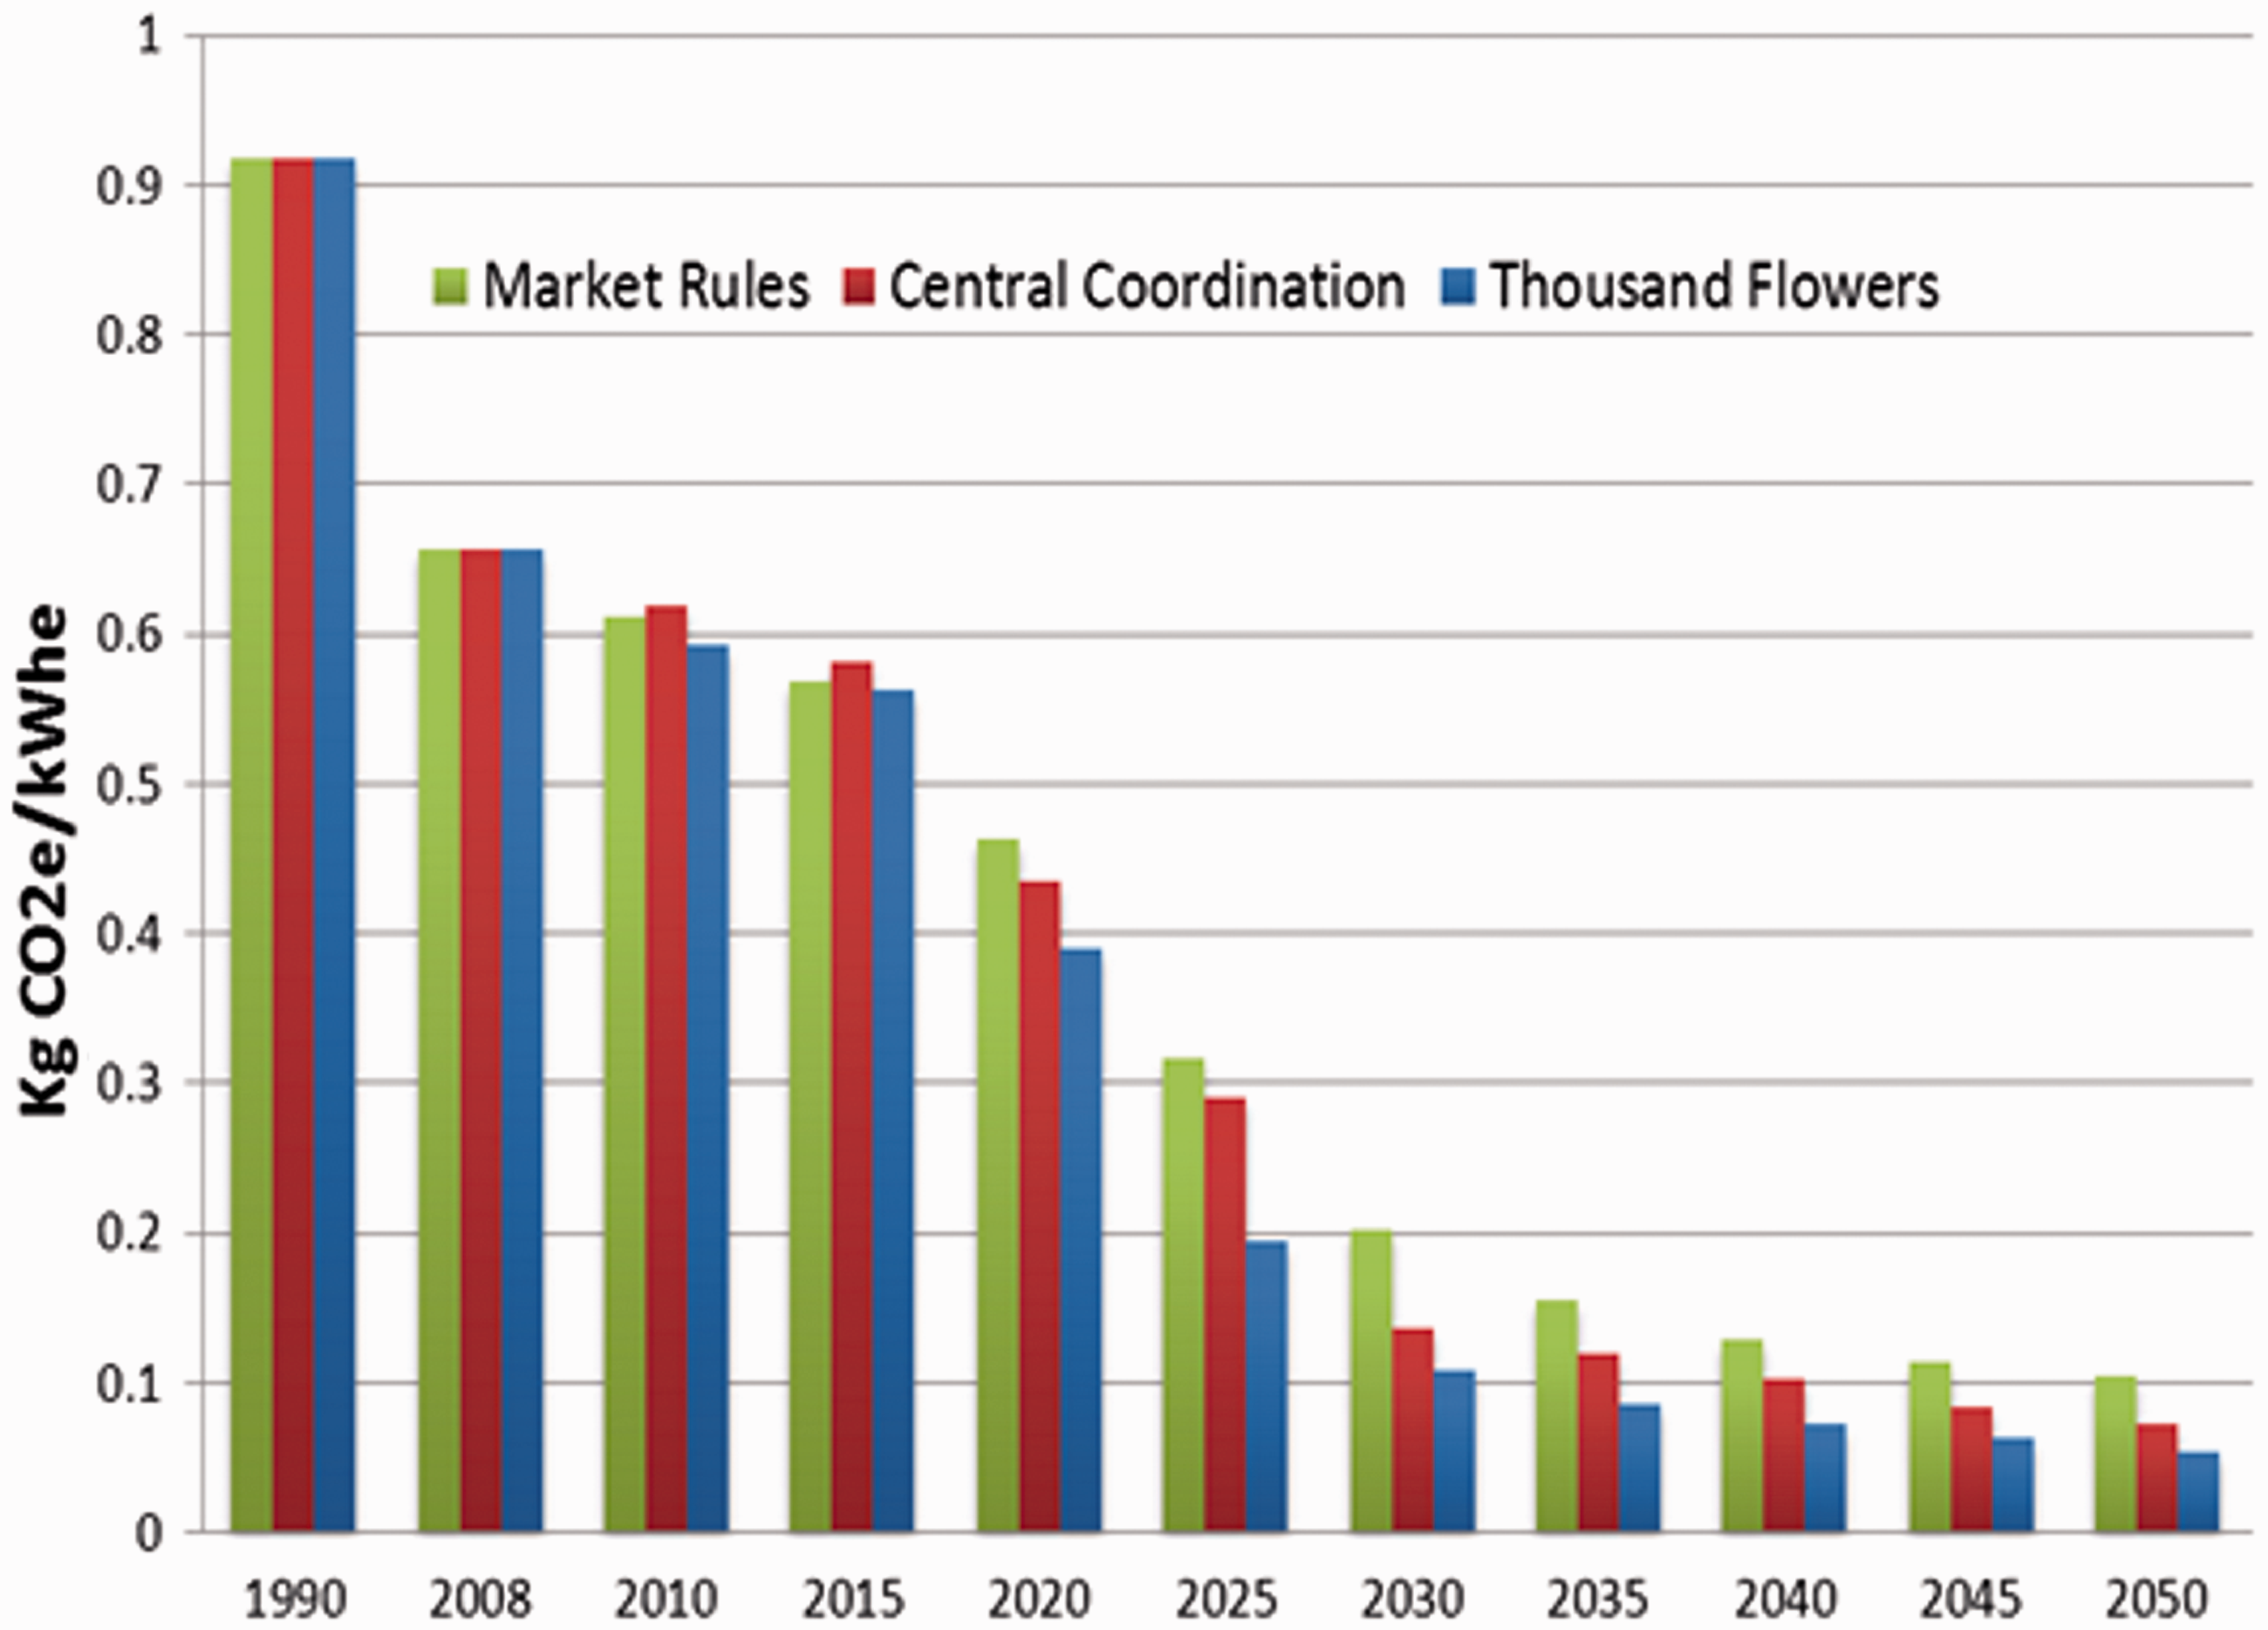
The transition pathways LCA study by Hammond et al. 75 yielded estimates of pollutants or wastes released into the environment as a consequence of the UK ESI in terms of 18 separate impact indicators (together with a tentative single score, aggregate LCA measure). The lower the resulting score for each category (or the single score indicator) the better, although they doesn’t adequately reflect, for example, the impacts associated with nuclear power generation. Nuclear is low carbon, but has a number of other health and environmental impacts associated with the potential release of ionising radiation from nuclear power stations and processing plants. These are generally not effectively accounted for in LCA software tools, 75 because they do not have an underlying basis in ecotoxicology. Statistical weighting of the different LCA categories is normally achieved by the engagement of a panel of experts. It is therefore highly subjective, and this process would not be advisable in many cases. Clearly, it is difficult to manage something like 18 different impact categories, and consequently it is necessary to focus on key categories. Large impacts were found in terms of categories such as Human Toxicity, Freshwater Eutrophication, Marine Ecotoxicity and Natural Land Transformation 75 particularly under the MR pathway. Carbon emissions are the currency of debate in a climate-constrained world,4,58 and consequently GHG emissions are typically given greater emphasis. There is likely to be a significant fall in carbon emissions from the UK power generation sector (see Figure 16) of some 31–51% by 2020, 65–86% by 2030 and 78–93% in 2050. 58 The lower figures relate to the MR pathway, whilst the higher ones are associated with the TF pathway. Notwithstanding the emphasis on GHG emissions, some of the other environmental burdens may need to be monitored.
The British Government’s independent Committee on Climate Change (CCC) has advocated deep cuts in power sector operational emissions through the 2020s, 46 with UK electricity generation being largely decarbonised by 2030–2040. In contrast, the present transition pathways projections (see again Figure 16) 58 indicate that the UK ESI could not be fully decarbonised by 2050 on the whole systems basis employed in the process-LCA studies.58,75 This is because the present estimates take account of upstream, fugitive GHG emissions, whereas the projections by bodies like the CCC and Department of Energy and Climate Change (DECC) generally do not. Nevertheless, the transition pathways suggest that the ESI will be able to bear a significant share of the overall 80% carbon reduction target by 2050. The CCC analysis indicates that average operational emissions from the power generation sector would fall to around 50 gCO2/kWhe by 2030. 46 In contrast, the present MR pathway (Figure 16) indicates that whole system emissions from the UK ESI are likely to only fall, accounting for upstream emissions, to ∼202 gCO2e/kWhe by 2030 and ∼105 gCO2e/kWhe by 2050. 58 The least impactful pathway (TF) suggests 58 that GHG emissions will fall to only ∼108 gCO2e/kWhe by 2030 and ∼53 gCO2e/kWhe by 2050 (Figure 16). If the United Kingdom is to genuinely meet its legally-binding carbon reduction targets, then it will be necessary to account for upstream emissions from power generation.58,75 Otherwise, even if the current UK carbon reduction targets are met, there will remain further emissions upstream.
An alternative way of evaluating the environmental impacts of the three UK transition pathways is via carbon and environmental footprinting.4,71 Environmental or ecological footprints have been widely used in recent years as indicators of resource consumption and waste absorption associated transformed on the basis of biologically productive land area (in global hectares (gha)) required per functional unit (such as kWhe). They represent a partial measure of the extent to which an activity is sustainable.4,71 In contrast, carbon footprints are the amount of carbon (or carbon dioxide equivalent) emissions associated with such activities in units of mass or weight (like kilograms per functional unit), although they can be translated into a component of the environmental footprint (on a gha basis). In order to determine the footprints associated with three UK transition pathways, the overall environmental footprint has been disaggregated into various components
71
: bioproductive and built land, carbon emissions, embodied energy, materials and waste, transport, and water consumption (see Figure 17). The total environmental footprint in the baseline year of 2010 was found from historic data to be 43 Mgha. In this case, the carbon and embodied energy footprint components were responsible for 80% to the total environmental footprint.
Environmental footprints of the three UK transition pathways in 2050.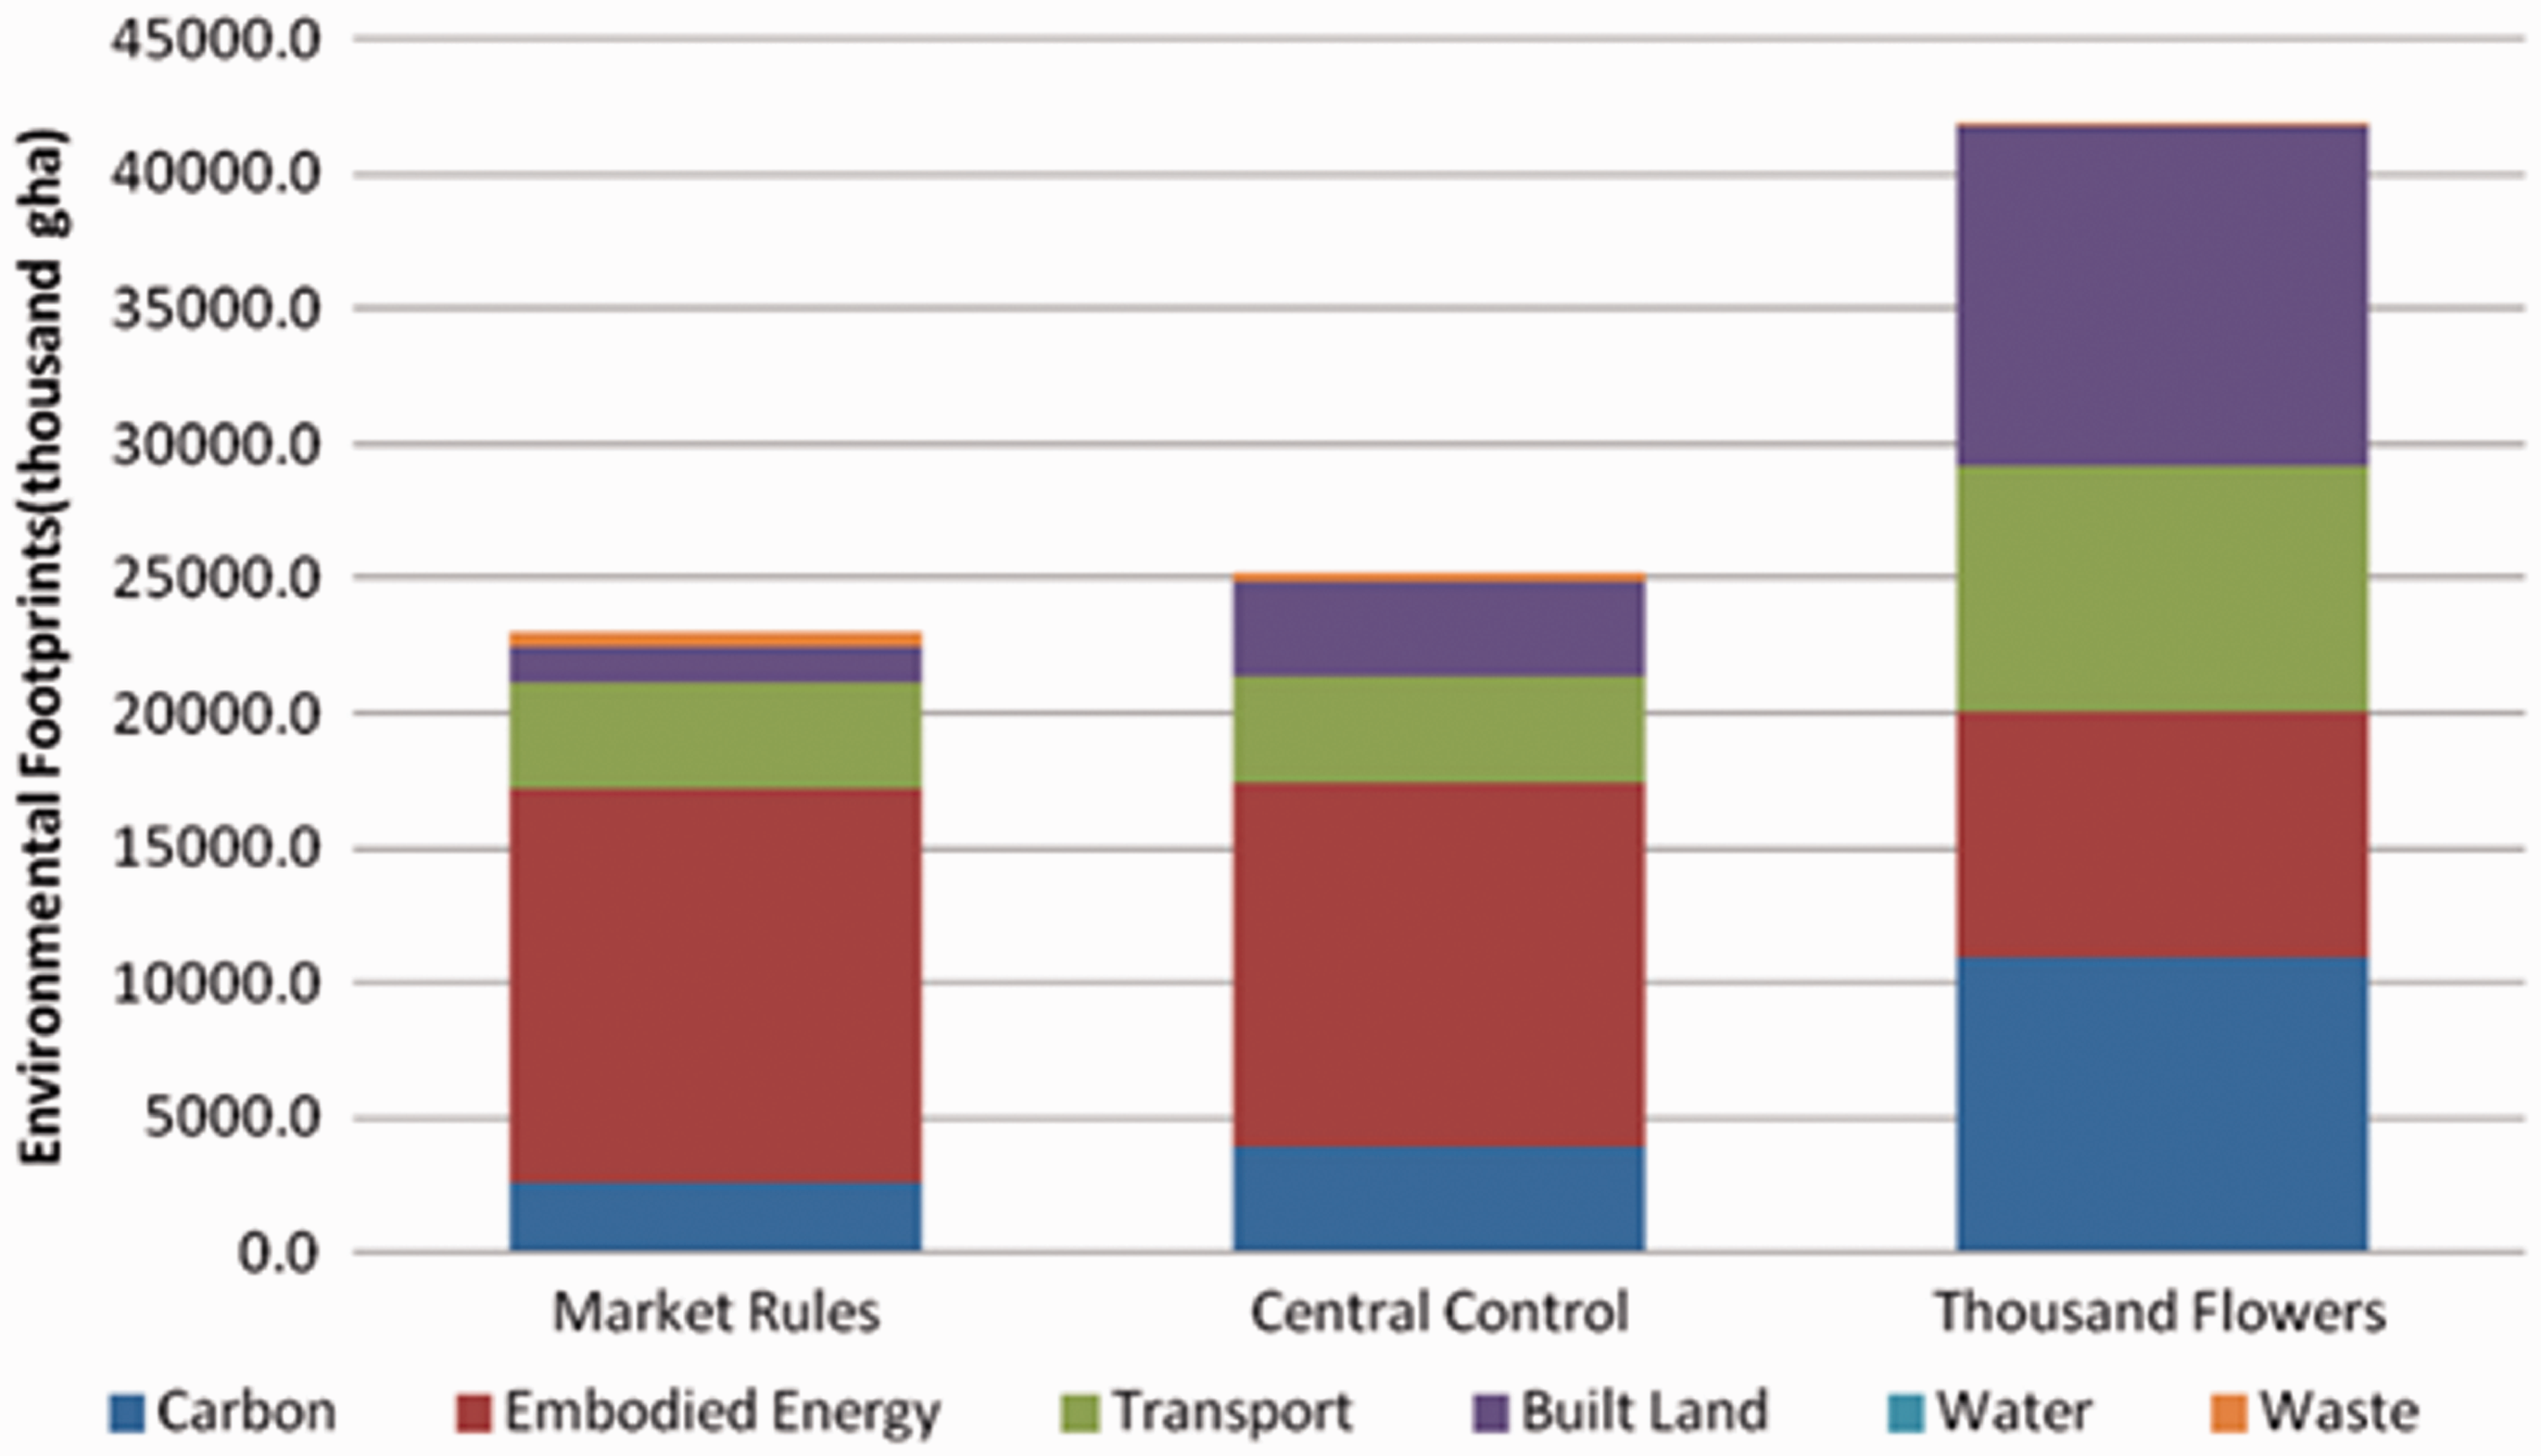
Future environmental footprints were estimated for each of the three transition pathways.4,71 Electricity demand was projected to decrease significantly under the TF pathway by 2050, but its total environmental footprint was nevertheless greater than either that under the MR or CC pathways (see again Figure 17). This is mainly due to the increase in the contribution of the bioproductive and built land component and that of the carbon footprint (rising to 10.9 and 12.5 Mgha respectively by 2050), 71 which are both seen to be higher than in either of the MR and CC cases. Thus increase in these TF pathway components was mainly due to increased usage of solid biofuels for power generation. In order to reduce the overall TF footprint it would therefore be necessary to adopt other renewable power technologies, like offshore wind and solar PV arrays, to satisfy the increase demands caused by electrification of heat and transport. The MR and CC pathways gave rise (see again Figure 17) to footprints of 23 and 25 Mgha respectively in 2050, as compared to 43 Mgha in the 2010 base year. 71 Here, the embodied energy component was the largest amongst the various footprint components; rising to 14 and 13 Mgha respectively by 2050. This was due to the large-scale use of fossil-fuelled power plants. There is a large reduction in carbon emissions under the MR pathway (over an 86% reduction compared to 2010 levels), whilst the CC pathway exhibits a slightly smaller fall (albeit nearly an 80% reduction). On the other hand, the TF pathway displays only 42% reduction in carbon emissions by 2050 (Figure 17). Water and waste footprint components made almost negligible contributions under all three transition pathways (only ∼1% footprint share), although this was recognised as probably being an artefact of the footprint methodology and assumptions adopted. 71 Bioenergy and biofuel footprints and land-take (see again Table 2) reflect relatively large environmental burdens when compared to other fuels.
The carbon and environmental burdens associated with the three UK transition pathways have been assessed via environmental LCA and footprinting methods. Overall insights and lessons from such studies can be summarised as:
A critical state-of-the-art review of this environmental LCA methodology57 has identified its current strengths and weaknesses for energy practitioners and policy analysts. The extraction and delivery of fuel requires energy and creates GHG emissions. The upstream emissions associated with various power generators and UK electricity transition pathways have been evaluated on a whole systems basis. There will remain further emissions upstream that are unaccounted for by the CCC and DECC. They only account for upstream fugitive GHG emissions beyond UK borders.58,75 The carbon and environmental footprints of the three UK transition pathways have also been evaluated.71 The overall environmental footprints were disaggregated into: built land, carbon emissions, embodied energy, materials and waste, transport, and water consumption. This component-based approach has enabled the sustainability challenges to be assessed quite broadly, along with specific issues (e.g. the linkages associated with the so-called energy-land-water nexus).
Economic analysis and appraisal
Any transition pathway in the UK energy system will require very large expenditures in the capital intensive energy sector. The costs and potential benefits of such investments, as well as how these investments position key market participants in relation to a range of economic risks, are a critical element to the economic appraisal of such pathways. Economic considerations are the core consideration of market-led actors, while the government – in its social planning role – has a wider consideration of costs under a multi-criteria approach, but one in which a socially optimal transition pathway would reduce costs as far as possible. Many analysis frameworks of possible future energy transitions conduct only a post-calculation of costs (e.g. via the DECC 2050 Calculator or analysis by the UK energy market regulator (Ofgem)), whereas costs are a critical input into the formulation and decision making process in any transition pathway.
Many existing energy modelling studies have been criticised for their limited treatment of societal actors and associated socio-political dynamics, together with poor representation of the co-evolving nature of society and technology. 76 It has therefore been argued that they consequently find it demanding to analyse socio-technical change. In parallel, it is evident that some of the prominent conceptual frameworks of socio-technical energy transitions (STET) find it difficult to operationalise policy development requirements in quantitative energy analyses. A review and critique of quantitative models for exploring STET was therefore undertaken by Li et al., 76 alongside their application to the energy supply, buildings and transport sectors. They subsequently devised a novel taxonomy for describing STET models 76 for integrating both quantitative modelling and conceptual socio-technical transitions, which incorporated techno-economic detail, explicit actor heterogeneity, and transition pathway dynamics. This study also highlighted a number of the challenges associated with their theoretical and behavioural validation, and proposed future development priorities for STET models. 76
A stylised probabilistic energy system model (BLUE-MLP) has been constructed with key behavioural parameters on price and non-price drivers. The model has been extended to incorporate alternative actors, spatial and temporal detail. The initial version of the BLUE model was critically reviewed and validated by embedding it in the multi-model comparison exercise (see section ‘From narrative descriptions of the transition pathways to model formulation’ above, and Trutnevyte et al. 55 ). In addition, a literature overview for understanding the state-of-the-art research in behaviour and transition modelling was carried out. Participation in the qualitative-quantitative knowledge integration for demand response (see the above section) helped to collect further ideas on developing BLUE. The initial Excel economic appraisal of the transition pathways covers electricity generation, transmission and distribution. It takes account of the temporal and market participant elements. 77 The Excel economic appraisal (EconA) was embedded in the afore-mentioned multi-model comparison activity (see again section ‘From narrative descriptions of the transition pathways to model formulation’ above 55 ) in order to validate its findings against other realising transition pathway models. The implications of the multi-model comparison activity for the EconA and D-EXPANSE model were summarised by Trutnevyte et al. 55 (see both the sections ‘From narrative descriptions of the transition pathways to model formulation’ and ‘Annual demand modelling’ above). The D-EXPANSE model was used to model the UK power sector transition between 1990 and 2010, in order to get insights about the structural uncertainty of cost optimisation, and to systematically translate the transition pathways narratives into quantitative representations.
Clearly the costs and affordability of energy transitions are one of the most influential drivers in terms of the energy policy trilemma. But so also are the interactions between the power sector and other key economic sectors that drive decarbonisation in line with climate targets. A collaborative study between energy-economic modellers and power systems engineers from the Realising Transition Pathways Consortium therefore undertook a cost appraisal of the UK transition to a low-carbon electricity system under alternate governance logics.
77
This novel approach linked the quantitative electricity system transition pathways and their economic appraisal. Retirement of existing power plant capacity and the installation of new build was based on either DECC planned retirements
77
or estimated lifetimes. Costs of the transmission and distribution network infrastructures (see Figure 12) were modelled via the WeSIM
64
model – a successor to the HAPSO model55,77 (see both the sections ‘From narrative descriptions of the transition pathways to model formulation’ and ‘Hourly demand profile modelling’ above). Outside the power system, only the costs of heat-producing devices (such as resistive heaters and gas boilers, community-scale and micro-CHP, and heat pumps) were included in the analysis. It focused on monetary costs and did not account for externalities, associated with the costs of different impacts on the environment
77
(like those considered within an LCA study, such as that described in the above section). The results (see Figure 18) contrast the dominant market-led MR transition pathway with alternate pathways that have either stronger governmental control elements (CC pathway), or bottom-up proactive engagement of civil society (TF pathway). The MR pathway exhibited the lowest investment costs out to 2050, whereas the CC pathway had slightly higher total system costs; presuming its implied government policies could be enacted and maintained. The bottom-up, more decentralised (TF) pathway was found to come at the expense of higher investment costs,
77
although it encourages wider participation with civil society. It requires significantly higher investment in renewable electricity generation, electric heating, and particularly EV transport. The spatial distribution of investment requirements under each UK pathway was another issue explored by the partnership of energy-economic modellers and power systems engineers (see Figure 9) (and section ‘From narrative descriptions of the transition pathways to model formulation’ above).
Relative capital investment costs for the three UK transition pathways out to 2050. Source: Updated estimates based on Trutnevyte et al.
77
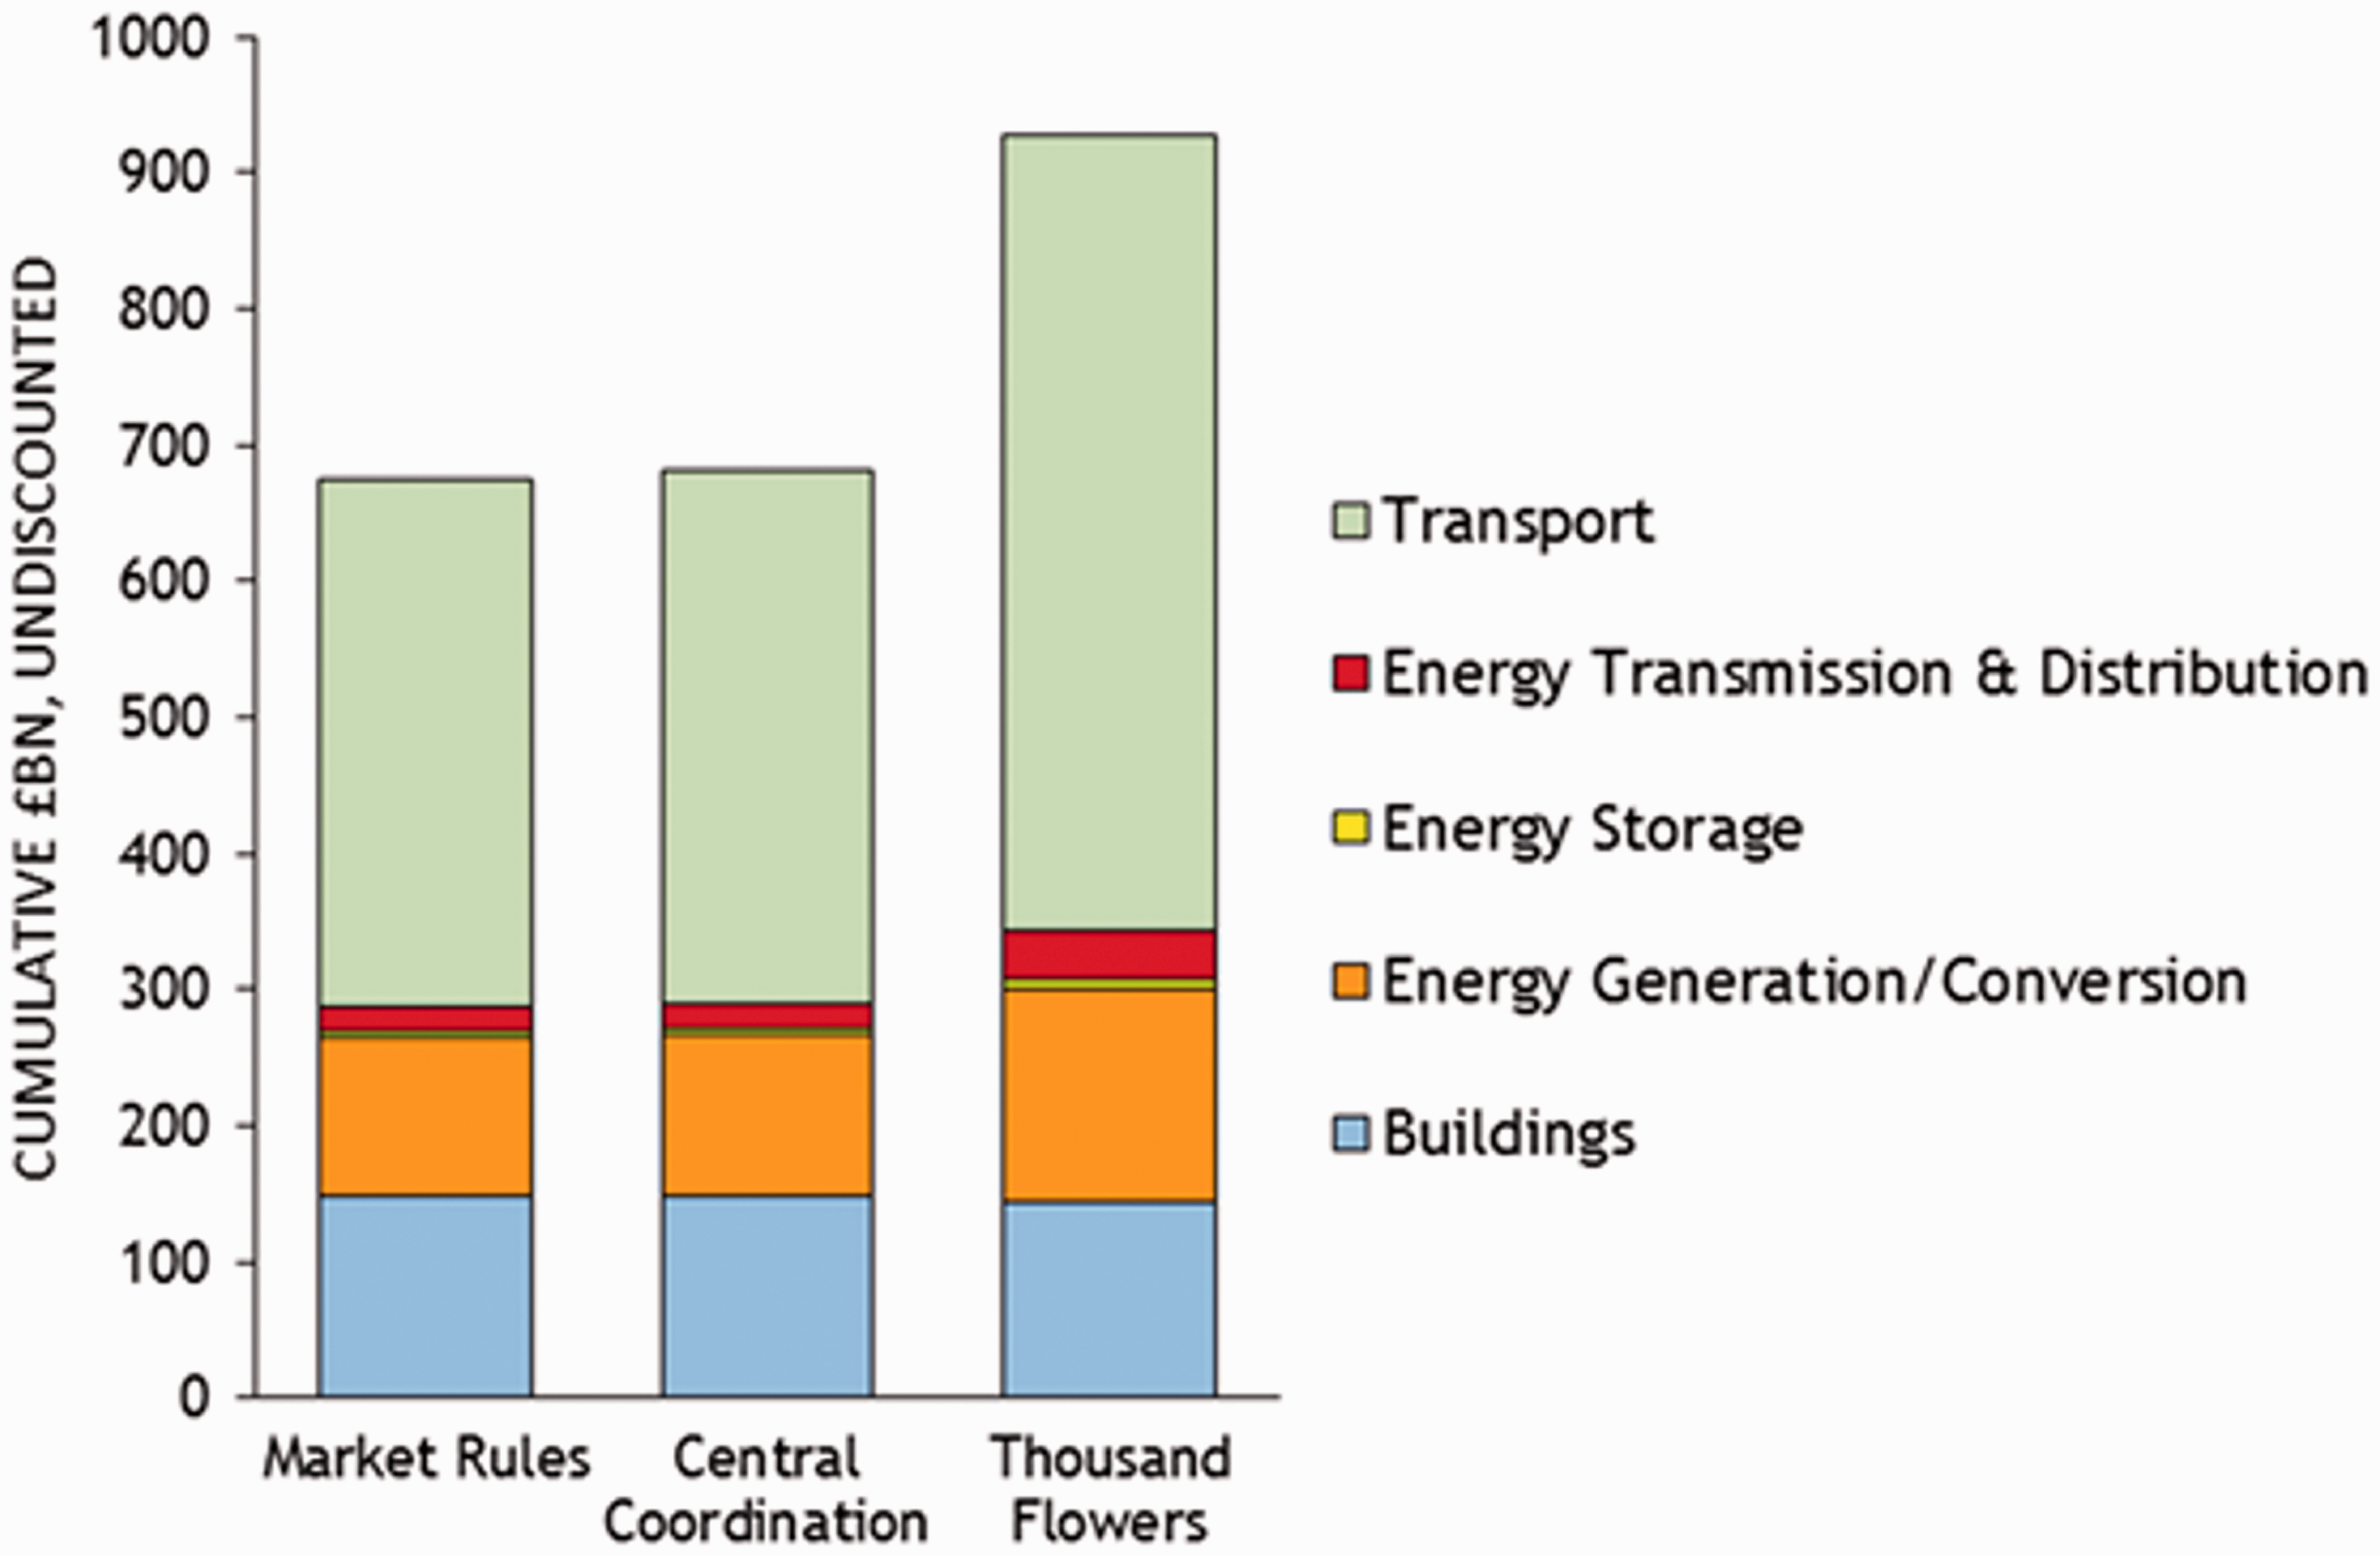
Economic appraisal of the three UK transition pathways55,76,77 contributes to an understanding the future interplay of the energy policy trilemma, i.e. achieving deep GHG emission cuts, whilst maintaining a secure and affordable energy system. The insights and lessons from these studies can be summarised as:
Investment costing of the three UK transition pathways under very different governance and institutional arrangements was achieved via a novel collaborative study between energy-economic modellers and power systems engineers.
77
It showed that the TF pathway gave rise to the highest investment costs, due to the need for large-scale renewables (such as wind farms), electric heating, and principally EVs and their transport/charging infrastructure. From this novel STET taxonomy for integrating both quantitative modelling and conceptual socio-technical transitions,
76
methodological improvements in economic analysis of transition pathways were identified as being as important as the analytical insights from any given modelling comparison. For example, firstly understanding the spatial and temporal boundaries of any cost calculation, and secondly assessing if demand reductions are induced by policy instruments (a welfare loss) or attributed to lifestyle evolutions (no welfare loss) are fundamental challenges.
Stimulating investment in low-carbon options
Analysis of historical energy transitions30–32 (see section ‘Insights from historical transitions’ above) demonstrates that rapid change is possible, but not frequent, and requires a high degree of co-ordination of actions, driven by recognised need to change, e.g. the shift from Town Gas to natural gas. Potential low-carbon investors in the United Kingdom are faced with uncertainty about national policy priorities, and there are structural constraints on low-carbon investment, including immaturity of the sector and mismatches between fund manager and renewable energy investment timescales. 80 The economic feasibility of generation under all three transition pathways will depend on revenues from secondary markets/sources (e.g. the capacity market, FiT and various tax incentives). However, the ratio of the revenue needed from primary and secondary markets is case specific. Comparison with the situation in Germany demonstrates the valuable role that can be played by locally focused institutions, where civic ownership is supported by a local banking sector. 83
A review of socio-technical systems research by Bolton and Foxon 78 argued that this approach can be operationalised to assess policy and societal challenges of large-scale investments in the low-carbon infrastructure. They observed that the United Kingdom is moving into a new phase of energy governance with significant demand for new investment to meet long-term climate policy objectives, as well as shorter term energy security challenges. The UK Government’s recent EMR aims to promote investment in large-scale low carbon technologies, through incentive schemes such as the contract for difference (CfD) and FiTs. They provide a guaranteed price for low carbon generation and thereby remove one significant uncertainty, although policy and political risks still remain. In further research, Bolton et al. 79 interviewed a range of energy policy and industry stakeholders, revealing different views on governance of energy systems. Those in favour of a liberalised market approach thought that the government should just set the rules, but otherwise not interfere to address price and other risks. In contrast, the mainstream investment community continues to be concerned that other risks could prevent large-scale investment in low-carbon generation. The Levy Control Framework, which was put in place out to 2020 with no clarity as to if it will be extended beyond that, has created an additional policy uncertainty for investors. Capacity markets have been introduced in order to ensure security of energy supply, indicating that this has greater priority than meeting carbon budgets (as reflected in recent UK Government energy policy pronouncements). This again creates uncertainty for investors, as experience indicates that regulatory frameworks and incentives are liable to change over time. In order to bring in new actors, such as mainstream institutional investors, better understanding of how they perceive these risks and uncertainties is required.
A socio-technical approach has been employed 78 to this important area of policy debate in three specific areas: understanding long-term uncertainty and investment risks; avoiding technological lock-in; and accelerating the diffusion of low carbon finance niches. It explored the dynamics of long-term structural change in capital intensive systems (such as energy, housing and water supply with the aim of seeking to redirect them towards more sustainable long-term trajectories. Bolton and Foxon 78 argue that interventions need to balance the demands of private investors with wider social objectives. A better understanding of investment risk and uncertainty is required. Insights from the MLP of transitions theory suggest that it is necessary to avoid lock-in to current technologies, and the need to support low carbon finance niches.
In a follow-up study, Bolton et al. 79 examined the way in which actors in the UK electricity sector are attempting to deliver investment in low-carbon technologies. Such generation capacity is relatively immature and is capital intensive, although they have low operational costs. Empirical research 79 investigating the agency of incumbent regime actors in the face of uncertainty was based on interviews with 36 stakeholders from private and civic energy companies, mainstream and alternative investors, renewables project developers, energy policy makers and civil society. It was found that low-carbon generation does not readily fit into existing electricity markets and investment templates that were designed for a fossil fuel based energy system. The findings of Bolton et al. 79 can inform contemporary debates on the politics and governance of sustainability transitions and offers critical insights on the role of markets and finance in shaping socio-technical change. Key electricity market and infrastructure policies in the United Kingdom were analysed 79 in order to determine ways that low carbon technologies could be made investable. This research argued that this could be achieved by reducing uncertainty, better management of investment risks, and repositioning actors within the electricity socio-technical regime.
The role of financial markets in capitalising low-carbon energy systems and long-term change has been explored. 80 Capital requirements for energy system transitions are typically very large, and yet the literature has been curiously quiet on the role of capital markets in financing energy transitions. Stakeholder interviews identified that there are relatively few deals, whilst learning and adaptation are slow. Economic incentives, such as the CfD and FiT strike prices, or renewable obligation certificates (ROCs), are only one type of driver for change. This implies that providing stable incentives may not lead to market penetration of renewables investment. Hall et al. 80 have analysed the UK EMR process and the provision of renewable energy finance, and argued that an adaptive market hypothesis provides a useful framework for understanding the evolution of electricity markets in response to low carbon policy incentives. They demonstrated that the market for renewable energy finance does not conform to the standard efficient markets hypothesis, due to structural and behavioural constraints on investment. However, considering financial markets as being adaptive enables the range of policy responses for the acquisition of low-carbon investment to be much broader. 80
Primary data collection was undertaken by Hall and Foxon 81 to characterise the importance of a smart grid infrastructure within a UK energy transition. The UK economy and electricity system have co-evolved, but there remains a mismatch between the distribution of benefits and costs of investing in this infrastructure; leading to a problem of value capture and redeployment. Some benefits of smart grids are less easy to price directly, and are more accurately classified as public goods, such as energy security and decarbonisation. Hall and Foxon 81 drew on semi-structured interviews and focus groups involving UK smart grid stakeholders. This led them to identify municipal-scale developments as potential sources for new business models to deliver smart infrastructure. Municipalities may thus pursue specific economic opportunities with DNOs to make smart grid investments. This supports recent practical interest in an expanded role for municipalities as partners and investors in smart grid infrastructures.
Transforming energy distribution networks will also play a key enabling role in a low-carbon energy transition in the energy, water and mobility sectors. But Bolton and Foxon 82 have argued that there is relatively little understanding of the social and institutional dimension of these systems, or appropriate institutional challenges to their transformation. This may be because the prevalent model of infrastructure governance in the energy and other sectors has prioritised short-term time horizons and static efficiencies. Bolton and Foxon 82 therefore discuss the appropriate governance strategies for developing flexible and sustainable systems of energy distribution. They draw on ideas from the social shaping of technology in order to develop a broader understanding of infrastructure change as a dynamic socio-technical process. A range of governance challenges to the development of electricity and heat networks are examined along the different phases of the infrastructure life cycle. Lessons are then drawn for the development of governance frameworks for the transformation of energy infrastructure more widely. 82 In the case of electricity distribution in Britain, the regulator (Ofgem) has sought to design suitable incentives to overcome barriers to long-term investment and innovation, although these are at an early stage of implementation. UK local authorities, by contrast, have struggled to finance large-scale infrastructure investments in the area of district heating (so energy-efficient and popular in the Scandinavian countries).
A comparative analysis of recent energy policy developments in selected European countries (e.g. the German Energiewende) and on the implications of developments at a European level on UK energy policy (e.g. carbon pricing and market unbundling) has been reported by Hall et al. 83 Field research on the German situation drew out the implications for ownership, governance and financing of low carbon energy infrastructure. The German system differs from UK system in at least four ways. It had a much greater degree of decentralisation and municipal ownership, following post-War reconstruction. Their low-carbon transition or Energiewende was seen as a national priority. More decentralised political institutions in the German federal system enable a greater degree of energy policy experimentation. Finally, a more bank-based financial system in Germany, including a well-developed local banking system, contrasts with the centralised and market-based financial system in the United Kingdom. These local German banks have often built on local knowledge and encouraged small-scale renewable investment. They became key promoters of civic and community ownership of electricity generation assets. Such municipal ownership might again enable a similar, more long-term perspective to be taken in the United Kingdom, with a focus on good, safe, reliant energy infrastructure. Further economic and social benefits might then accrue to local municipalities.
These roles of actors, governance arrangements and regulations have been analysed in relation to realising market-led, government-led and civil society-led low carbon transition pathways, leading to the following findings:
Energy systems can best be understood as socio-technical systems made up of interacting technological and institutional elements, coevolving over time. Governance and regulatory frameworks are critical in managing risks for decision-makers and investors. Changes to investment support for low-carbon electricity generation have led to increasing risks and uncertainties, and concerns that long-term governmental commitment to decarbonisation may be undermined if the salience of energy security and cost priorities grows. Analyses of energy finance as an adaptive market
80
help identify the lack of a mature community of investors, mismatches between investment and fund manager timescales, and lack of suitable investment vehicles. Capital markets are likely to change over the long-term to yield more adaptive markets for energy finance. The economic feasibility of generation in all three pathways will depend on the revenue from secondary markets/sources, such as the capacity (ancillary service) market, FiT, and various tax incentives, although the ratio of the revenue needed from primary and secondary markets is case specific. A comparative UK–Germany analysis
83
has shown the importance of the local banking sector in facilitating civic ownership structures there. The possibility of a low-carbon, decentralised transition (like that envisaged under the TF pathway) driven by civic energy systems has highlighted the role of local banking systems, and of shared values (including public service and local economic development).
83
Concluding remarks
The British Government has set a legally binding target of reducing the nation’s CO2 emissions by 80% by 2050 in comparison to a 1990 baseline. 6 This would ideally require the UK ESI to be decarbonised by around 2030–2050 in order to give more head room for carbon mitigation in other, more challenging sectors (such as industry and transport). 46 A set of three low-carbon transition pathways were developed and analysed via an innovative collaboration between engineers, social scientists and policy analysts. The pathways focus on the power sector, including the potential for increasing use of low-carbon electricity for heating and transport, within the context of critical European Union developments and policies. Their development started from narrative storylines regarding different governance framings, drawing on interviews and workshops with stakeholders and analysis of historical analogies. The quantified UK pathways were named Market Rules (MR), Central Co-ordination (CC) and Thousand Flowers (TF); each representing a dominant logic of governance arrangements – recently described by the Chief Executive Officer of a prominent UK renewable electricity supplier and generator company (unconnected with the project) as reflecting blue, red and green pathways respectively. These pathways have been used to explore what is needed to realise a transition that successfully addresses the so-called energy policy trilemma, i.e. the simultaneous delivery of low carbon, secure and affordable energy services. Such energy transitions are never smooth and always subject to contestation, negotiation and social change. The UK ESI has already undergone quite rapid change over the last few years. 84 Coal power station closures, for example, have amounted to 15 GW between 2010 and 2015; with combined cycle gas turbine plant closures accounting for a further 4 GW. In contrast, there has been a rapid rise in solar PV systems that now stands at around 853,000 installations, for which rooftop solar alone now accounts for >1% of UK electricity supply. 84 The recent British Government energy policy reset, the components of which will only become clear during 2017 (although some senior executives in the UK power sector speculate that it will propose roughly 30% nuclear, 30% renewables, and 30% gas) will lead to additional changes going forward. Thus, if the three transition pathways were being developed today they would no doubt contain rather different energy mixes. The TF pathway might contain more solar PV, but less bioenergy, for instance. Nevertheless, the insights gained from this exercise still provide a valuable evidence base for developers, policy makers and other stakeholders.
A fundamental requirement for identifying and addressing the multiple challenges and opportunities posed by energy policy and climate change necessitates a combination of academic knowledge with that from industry, commerce, regulatory bodies, political and societal communities. This ambitious goal appears to be more achievable in processes that combine the analytic (the systematic application of expert knowledge) with the ‘deliberative’ (the systematic application of opportunities for face-to-face discussions between experts, stakeholders and citizens).85,86 The ‘Realising Transition Pathways’ Consortium has adopted the practice of the co-production of knowledge to explore and integrate different kinds of expertise in order to provide opportunities for reflection and evaluation. It has attempted to achieve a level of joint working that allows the effective sharing of disciplinary-specific and professional expertise. New evidence and case studies of UK energy transitions provide practical advice on how sustainable energy transitions will depend on science and policy institutions becoming more responsive and adaptive to distributed societal actions. Here the challenges, insights and opportunities that have been gleaned from this research are highlighted (via bullet point summaries at the end of each principal section above).
Analytical tools were developed and applied to assess the technical feasibility, social acceptability, and environmental and economic impacts of the pathways. Technological and behavioural developments were examined, alongside appropriate governance structures and regulations for these low-carbon transition pathways, as well as the roles of key energy system actors (both large and small). An assessment of the part that could possibly be played by future demand responses was also undertaken in order to understand the factors that drive energy demand and energy-using behaviour. A set of interacting and complementary engineering and techno-economic models or tools were then employed to analyse electricity network infrastructure investment and operational decisions to assist market design and subsidy mechanisms. This provided a basis for integrating the analysis within a whole systems framework of electricity system development, together with the evaluation of future economic benefits, costs and uncertainties. Likewise, the energy and environmental performance of the different energy mixes were appraised on a life-cycle basis to determine the GHG emissions and other ecological or health burdens associated with each of the three transition pathways. The UK Carbon Budgets 46 are presently on track for an 80% reduction (in production emissions) by 2050, although it has been observed here 58 that the impact of upstream (and consumption) GHG emissions are generally excluded. The impact of such upstream emissions on the carbon performance of technologies (such as combined heat and power (CHP) and CCS) and the transition pathways themselves 58 distinguish the present findings from those of other analysts, such as the CCC and DECC. None of the three pathways yield zero GHG emissions by 2050, which suggests that the UK electricity sector cannot realistically be decarbonised by 2030–2040 as advocated by the CCC. 46
Socio-technical solutions are required on both the demand and supply-side of any future UK energy system. Reduction in energy demand for heat, power and transport will be a significant element of any energy strategy aimed at limiting global warming to <2 ℃ under whatever pathways actually results out to mid-century.87,88 Improvements in energy efficiency can be obtained from better thermal insulation of the building fabric, smart appliances and controls, alongside the adoption of efficient heating systems, such as heat pumps, community energy schemes and the like. In addition, lifestyle or workplace changes, DSR and DSP may well be needed, but these will be partially offset by so-called rebound effects. Decarbonising the supply-side is likely to see the continued adoption of new nuclear build (although the whole system costs may be prohibitive), offshore wind, and rooftop solar PV. It will inevitably need the take-up of CCS (as well as carbon capture and utilisation (CCU)) for a cost-efficient transition, together with sustainable bioenergy and biofuels, and possibly hydrogen (H2) as a fuel and energy storage media in the long term. Unfortunately, there are constraints over the use of bioenergy resources, including uncertainties over the availability of UK sustainably-sourced biomass, land use challenges, and competition with food supply. Finally, the energy infrastructure in Britain will need renewal in order to make it more resilient (e.g. to climate change impacts) and to potentially accommodate greater decentralised or distributed generation, including greater use of both large and small energy storage devices. Significant generation, transmission and distribution network reinforcements (operating with much lower utilisation factors) will be needed to meet future changes in demand and generation patterns. However, smart power innovations (a combination of interconnectors, storage and demand flexibility (or DSR)) could generate £8 bn per year of savings (according to a report for the recently-established UK National Infrastructure Commission 89 ; for which a member of the Realising Transition Pathways Consortium (Goran Strbac and his team) played a key role 90 ). Indeed, in a risk assessment study of the UK power sector, Hammond and Waldron 11 found that lack of investment in new infrastructure to be ranked the second highest risk to the power sector by different stakeholder groups (academic researchers, civil servants, electricity companies, green groups, power system engineers and various others). The electricity grid was found to be arguably the most vulnerable part of the power system; reinforcing the case for UK network renewal and reconfiguration by the middle of the 21st century.4,11 Innovation, systems integration, and whole systems thinking to identify sustainable energy options (sometimes termed optionality in industry), as examined in the present study, will therefore be critically important in the transition towards a low-carbon future.
Footnotes
Acknowledgements
The authors are particularly grateful for the critical, but supportive, views of members of the project Advisory Board (chaired by James Smith, former chairman of Shell UK and presently chairman of the UK Carbon Trust) made up of industrial representatives, UK Government policy makers and other stakeholders. The authors are also grateful for insights provided by an anonymous reviewer from climate, energy and innovation policy perspectives. However, the views expressed in this paper are the responsibility of the authors alone and not the external collaborators or the funding body.
The authors’ names are listed alphabetically.
Declaration of Conflicting Interests
The author(s) declared no potential conflicts of interest with respect to the research, authorship, and/or publication of this article.
Funding
The author(s) disclosed receipt of the following financial support for the research, authorship, and/or publication of this article: This work draws on research undertaken as part of a major research grant awarded by the UK Engineering and Physical Sciences Research Council (EPSRC) entitled ‘Realising Transition Pathways - Whole Systems Analysis for a UK More Electric Low Carbon Energy Future’ [under Grant EP/K005316/1]. The authors are grateful to this sponsor, as well as for the interchanges with the main UK-based post-doctoral researchers associated with the project (see the project website ![]() for a full list of those involved).
for a full list of those involved).