
Abstract
Thermodynamic (energy and exergy) analysis can give rise to differing insights into the relative merits of the various end-uses of electricity for heat and power. The thermodynamic property known as ‘exergy’ reflects the ability to undertake ‘useful work’, but does not represent well heating processes within an energy sector. The end-use of electricity in the home, in the service sector, in industry, and the UK economy more generally has therefore been examined in order to estimate how much is used for heat and power, respectively. The share of electricity employed for heat and power applications has been studied, and alternative scenarios for the future development of the UK energy system were then used to evaluate the variation in heat/power share out to 2050. It was found that the proportion of electricity used to meet these end-use heat demands in the three sectors examined were likely to be quite high (∼50–60%), and that these shares are insensitive to the precise nature of the forward projections (forecasts, transition pathways or scenarios). The results represent a first indicative analysis of possible long-term trends in this heat/power share across the UK economy. Whilst the study is the first to consider this topic within such a timeframe, some of the necessary simplifying assumptions mean there are substantial uncertainties associated with the results. Where end-use heat demands are met by electricity, energy and exergy analysis should be performed in parallel in order to reflect the interrelated constraints imposed by the First and Second Laws of Thermodynamics. An understanding of the actual end-uses for electricity will also enable policy makers to take account of the implications of a greater end-use of electricity in the future.
Keywords
Introduction
Background
Human development is underpinned by energy sources of various kinds that heat, power (work per unit time) and transport its citizens in their everyday life. The evolution of modern industrialised society has been interwoven with discoveries of sources and uses of energy, especially the exploitation of fossil fuels and the construction of energy system infrastructures. Such energy supplies and technologies underscore continued economic development, but nowadays they are also recognised as giving rise to unwanted ‘side-effects’. 1 The principle environmental side-effect of the energy sector is arguably the prospect of global warming due to an enhanced ‘greenhouse effect’ induced by combustion-generated pollutants1,2 from heating systems, power generation, and internal combustion engines in the transport sector. Endowed with abundant coal reserves, Britain lay at the heart of the first industrial revolution, and from the 1870s electric power underpinned a second industrial revolution in countries like the then newly united Germany and the USA. 3 Electricity production now accounts for about 30% of the UK carbon dioxide (CO2) emissions;4,5 the principal ‘greenhouse gas’ (GHG) having an atmospheric residence time of about 100 years. 1 These emissions mainly arise from the combustion of fossil fuels (primarily coal and natural gas) for power generation.
The history of electricity generation since the time of Edison has been largely based around the utilisation of centralised power stations. Thus, the bulk of electricity in Britain is still generated by large thermal (fossil-fuelled and, recently, nuclear) power plants that are connected to a high-voltage transmission grid, and is then distributed to end-users via regional lower-voltage distribution networks.4,6 The whole UK energy sector is represented schematically in Figure 1,
1
where the electricity network is identified as part of the ‘generation’ and ‘distribution’ systems. This centralised model has delivered economies of scale and reliability,4–6 as well as substantial improvements in energy and exergy efficiencies,
7
but there are significant drawbacks. It suffers, for example, from overall energy system losses of about 65% in terms of primary energy input.2,7,8 These losses predominantly result from heat wasted during electricity production (58%), although there are smaller losses arising in transmission and distribution – approximately 1.5% and 5%, respectively.1,7 The UK Electricity Supply Industry (ESI) is also heavily reliant on primary fuels, particularly coal and natural gas. Much of the electricity grid was constructed in the 1950s and 1960s. It is therefore heavily reinforced in former coal-mining areas, and is nearing the end of its design life.3,6 There are ‘bottlenecks’ restricting power flow from Scotland to England [2.2 Giga Watts electrical (GWe)], and via the power interconnectors (in the form of high-voltage undersea cables) to France, Northern Ireland and the Netherlands3,4 [1 GW = 31.5 PJ/year]. The grid now requires not only renewal, but also reconfiguration in order to accommodate distributed generation (DG). It has recently been predicted that DG could provide 30–40% of the country’s electricity needs by 2050.5,6
Simplified representation of the UK energy system. (Source: Hammond
1
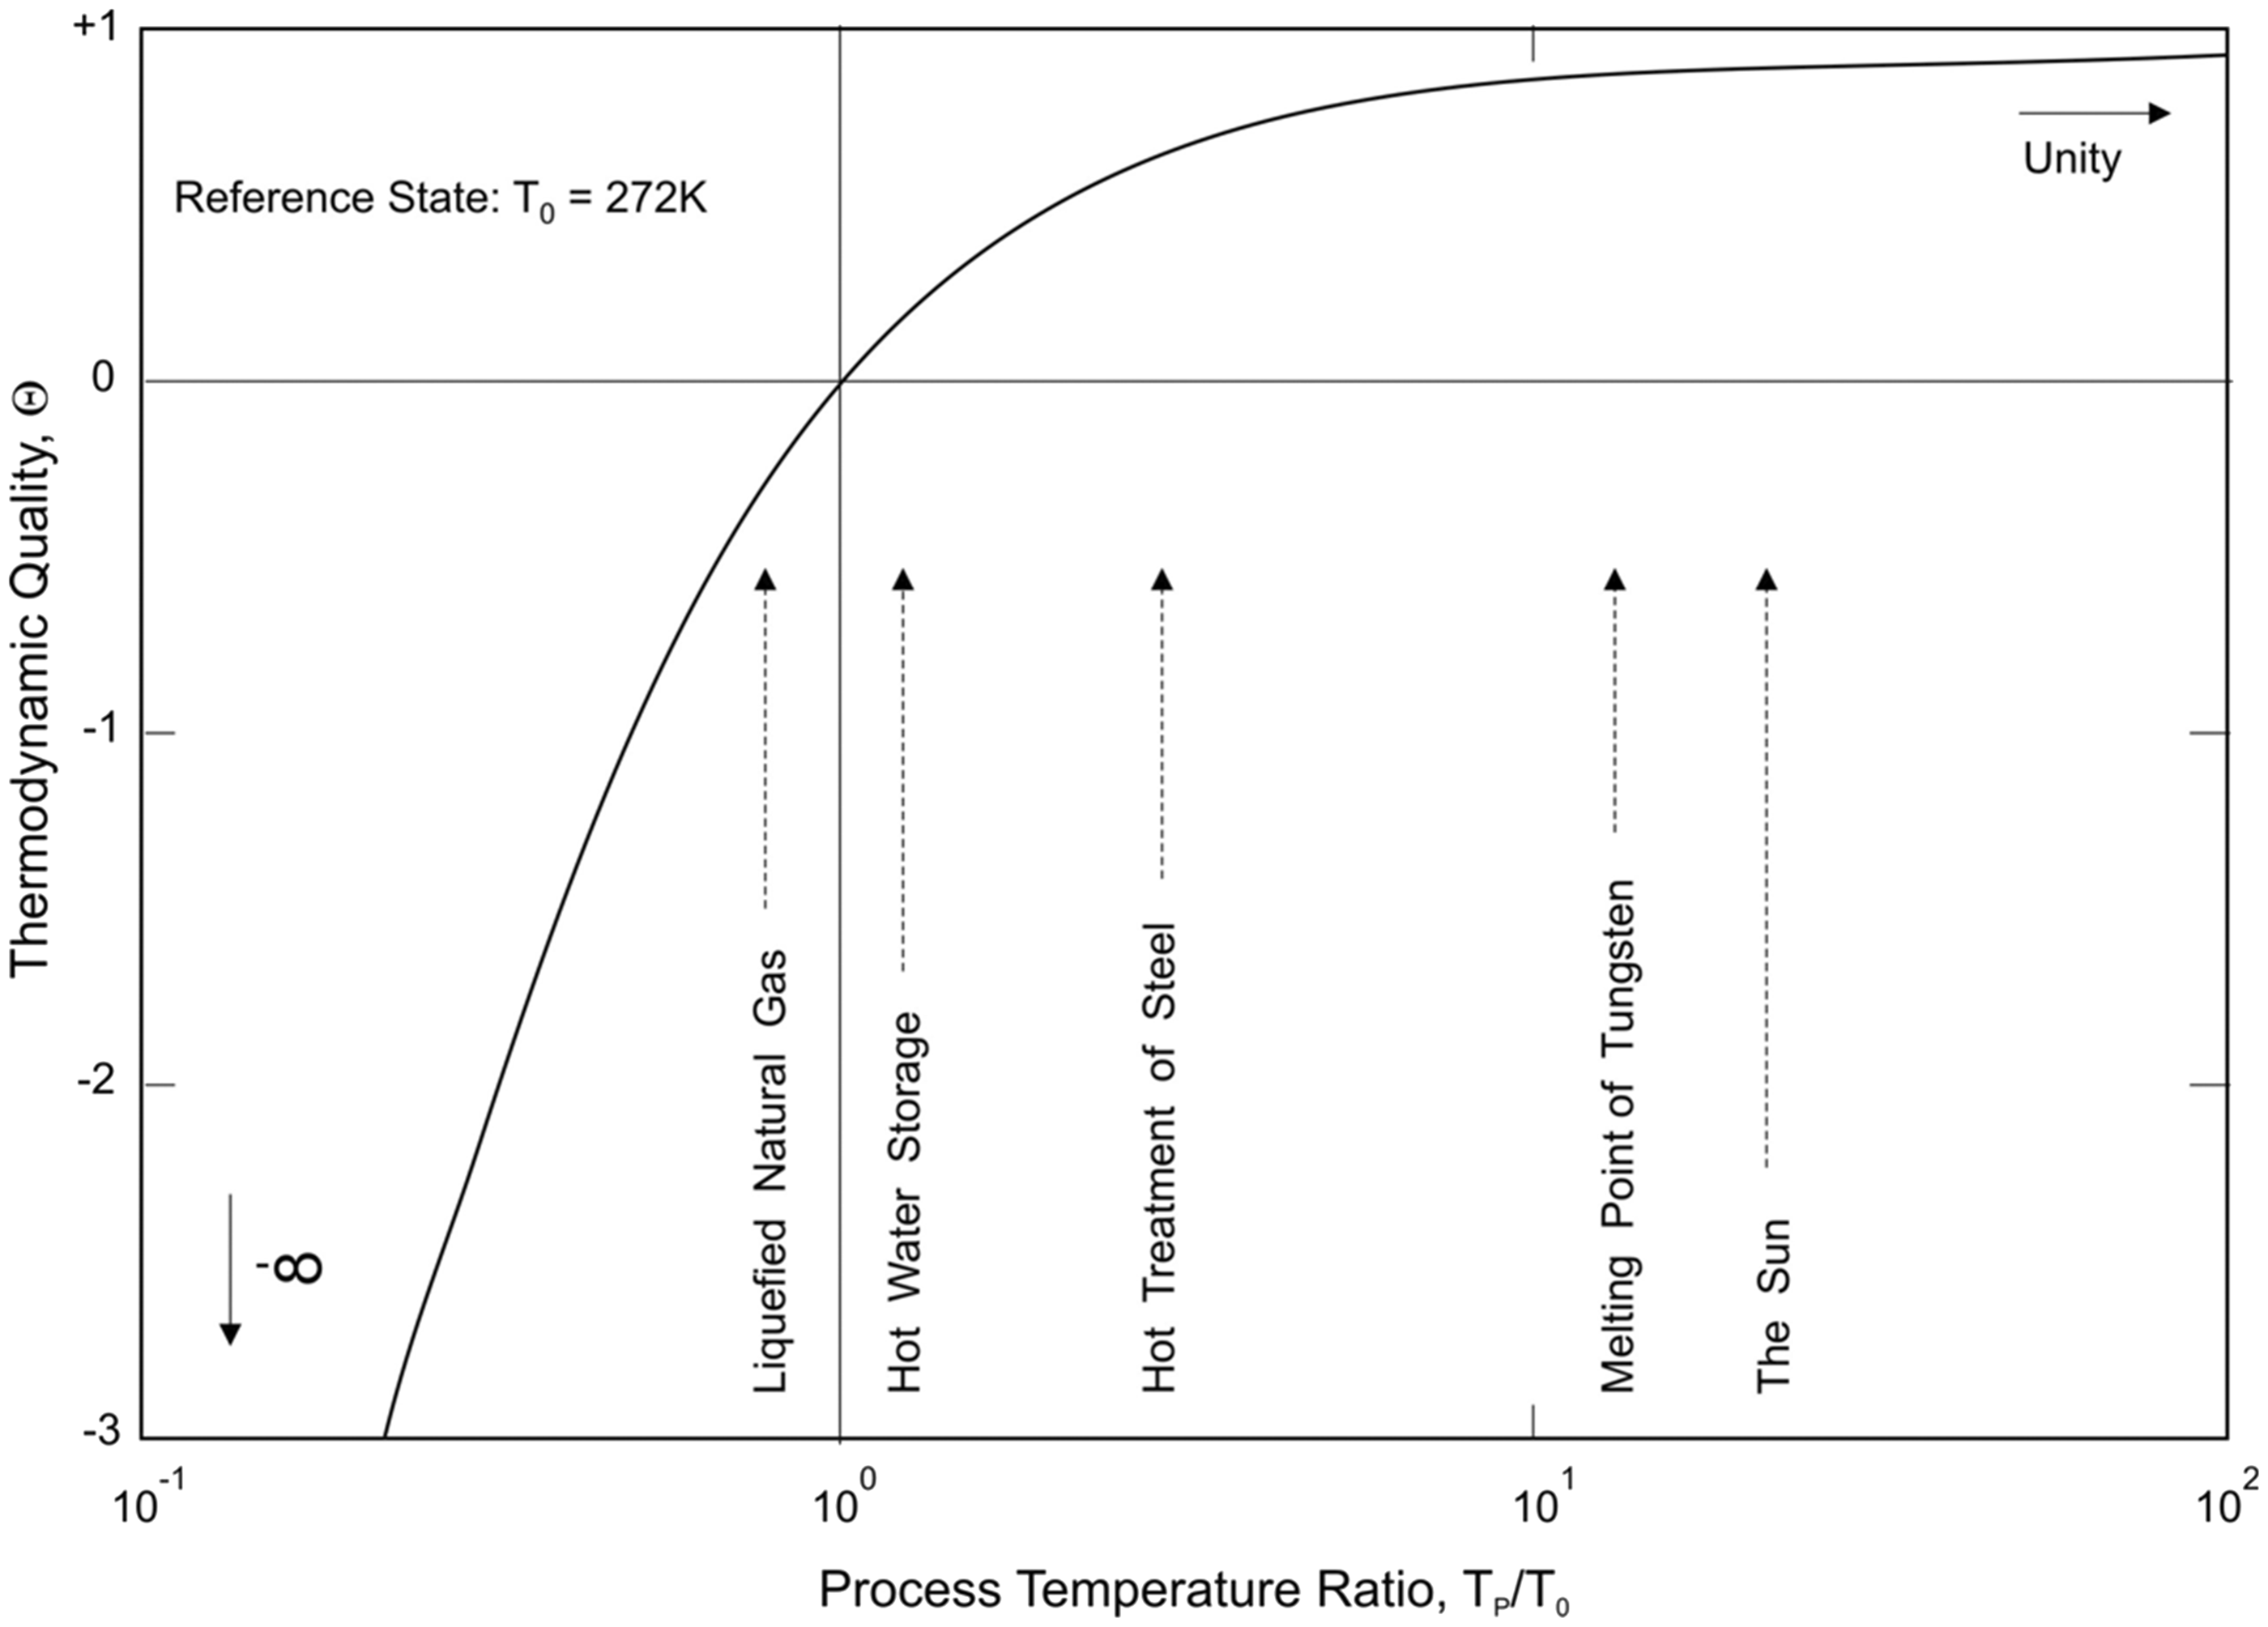
). Temperature dependence of thermodynamic quality. (Source: Hammond
9
; with a minor correction).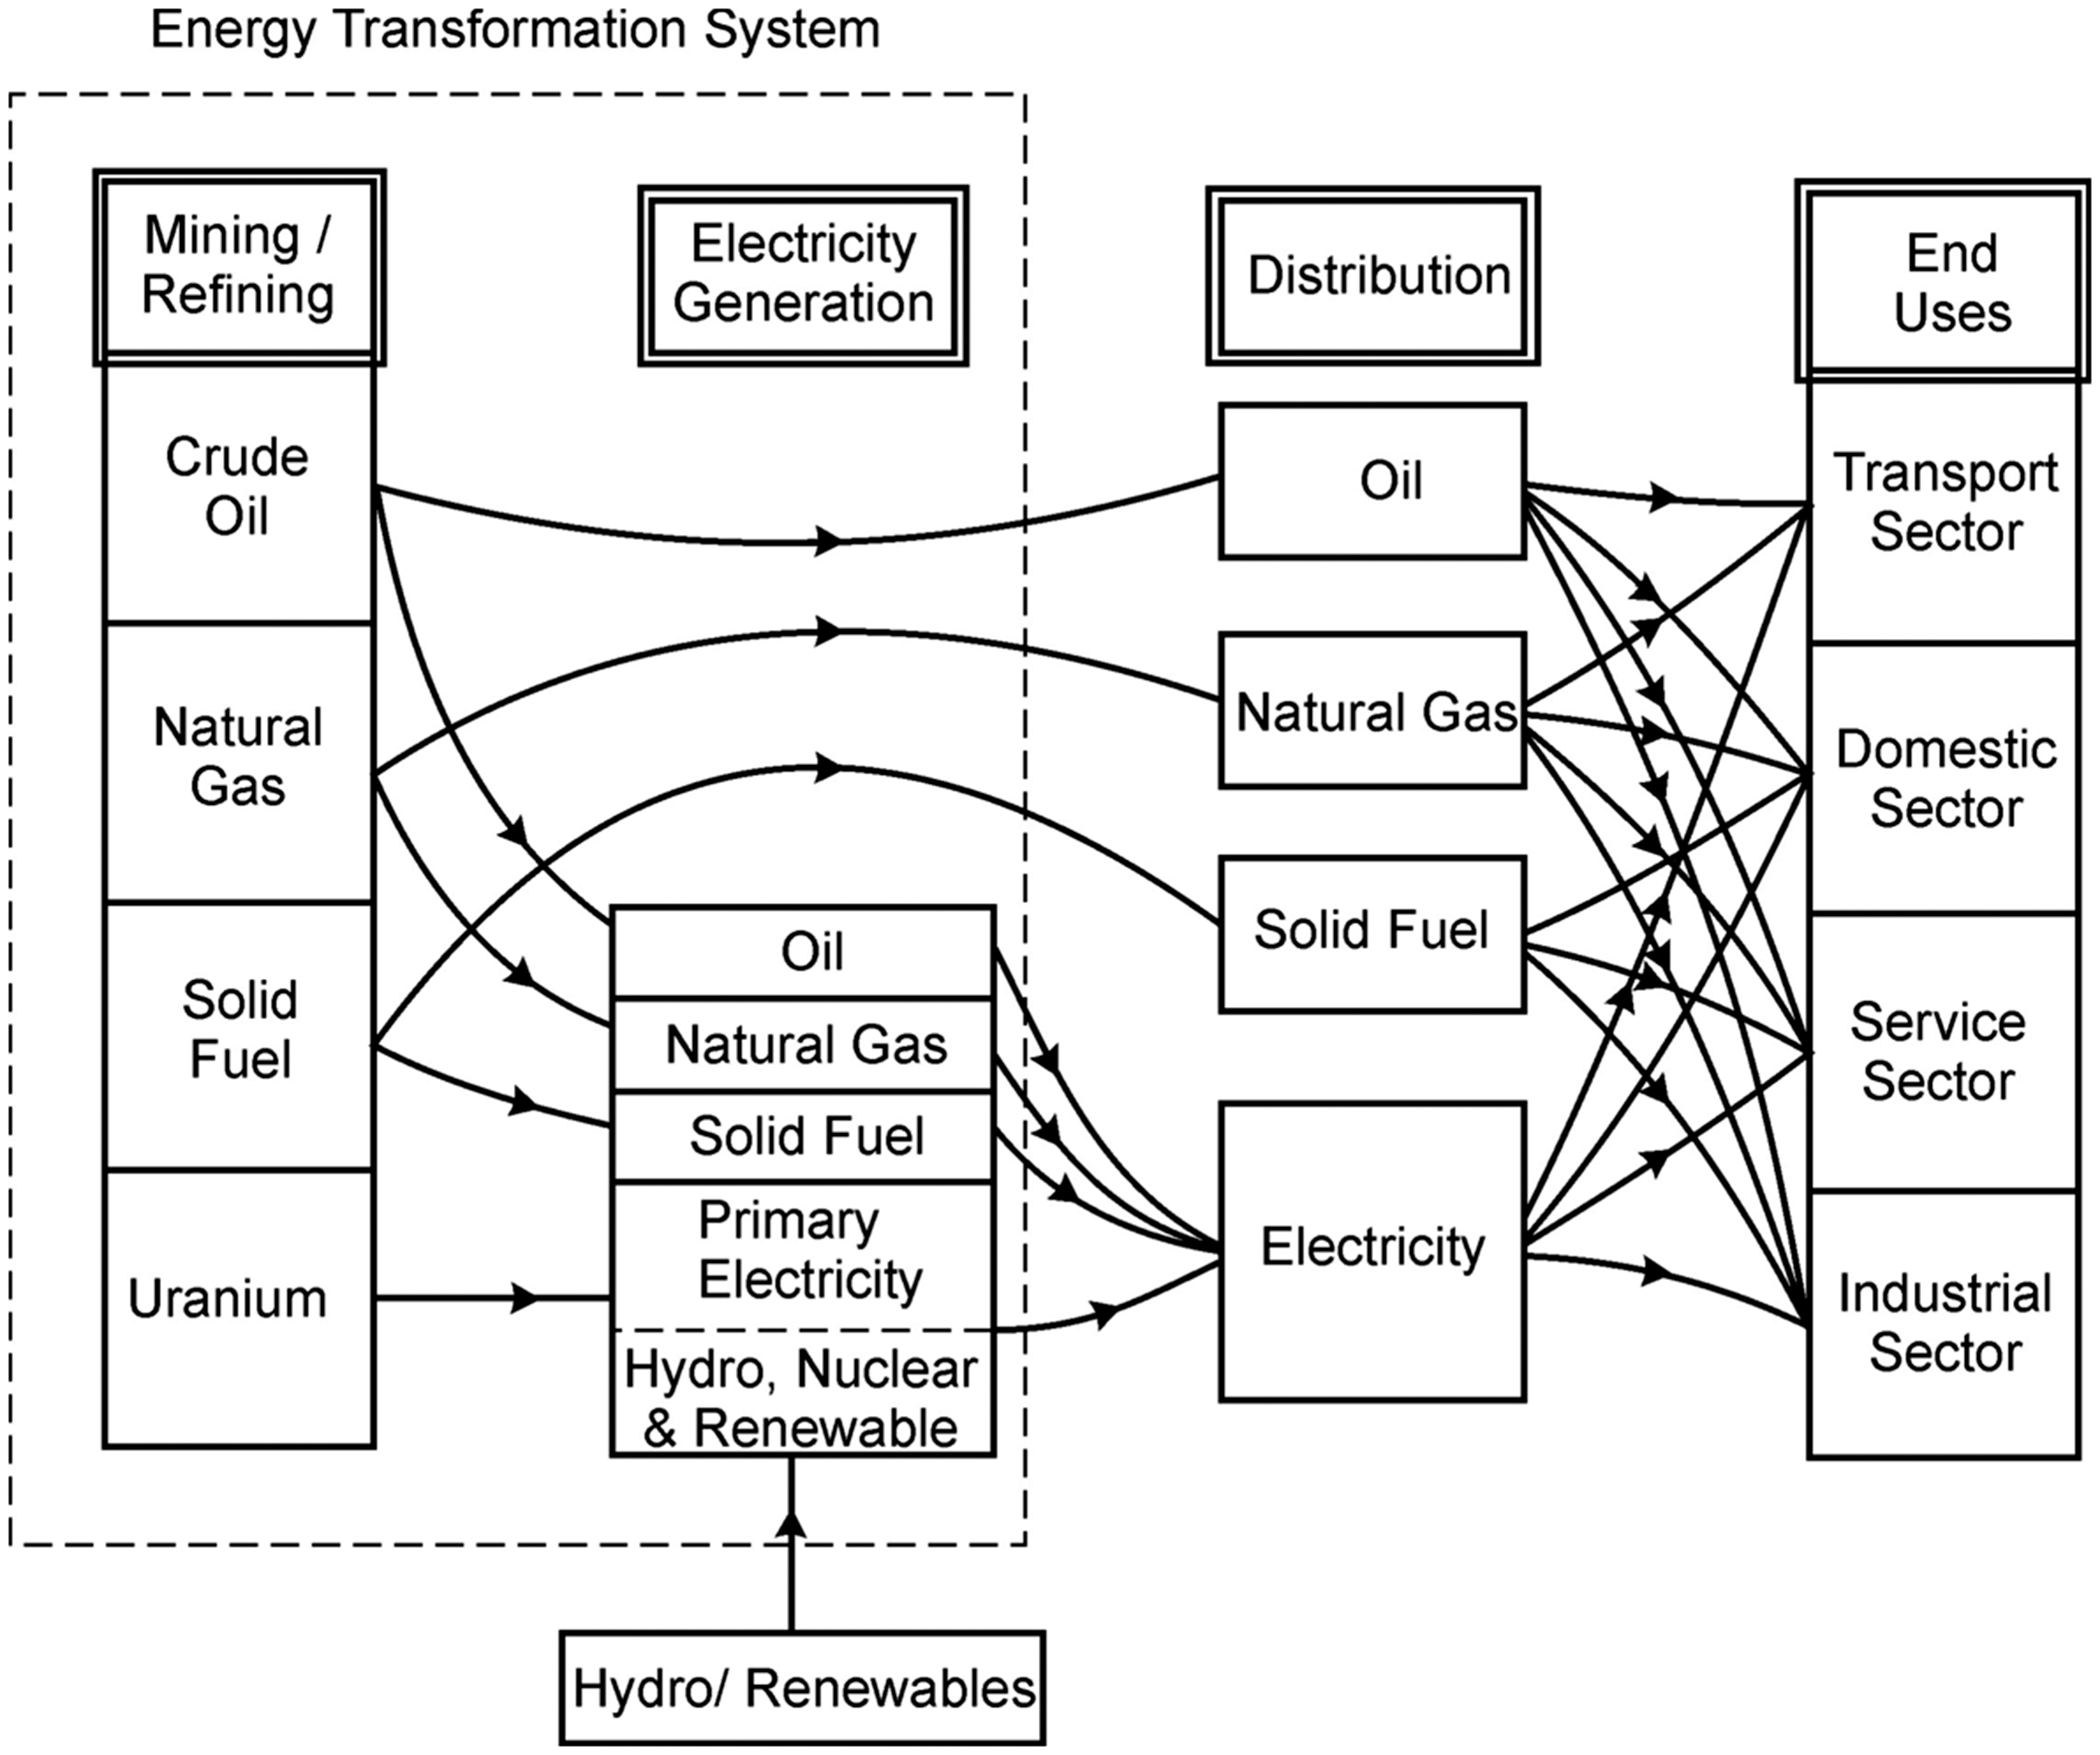
Electricity generation and use
Electricity is a high-grade energy carrier in the sense that it can be used to provide either power or heat. In a thermodynamic sense, it has a high ‘exergy’.8,9 Large energy losses occur during generation unless used in conjunction with combined heat and power (CHP) systems. Hammond 1 also noted that it is wasteful in thermodynamic terms to convert fuels to electricity only to employ it for heating. Heat is wasted and energy is ‘lost’ at each stage of energy conversion and distribution, particularly in the process of electricity generation. If process or space heating is required, then it would be far more efficient to burn fossil fuels to produce heat directly. However, the same argument does not necessarily apply in the case of ‘renewable’ electricity, which does not have the same implications in primary energy and climate terms. Electricity is also difficult to store on a large scale, and has therefore traditionally been mainly used instantaneously. If the large and rapid developments of renewable energy supply in the UK in recent years continue, however, it is widely accepted that both increased capacities of existing and novel types of energy storage will be required. 3 But electricity has other benefits. There is, for example, an increasing end-use demand for such a high grade and controllable energy carrier.
Energy flows across the UK economy are again depicted in Figure 1, 1 reflecting a simplified model of the energy system. This schematic energy flow diagram hides many feedback loops in which primary energy sources (including fossil fuels, uranium ore, and hydro-electric sites) and secondary derivatives (such as combustion and nuclear-generated electricity) themselves provide upstream energy inputs into the ‘energy transformation system’.1,8 The latter is that part of the economy where a raw energy resource is converted to useful energy, which can meet downstream ‘final’ or ‘end-use’ demand. ‘Renewable’ energy sources are taken to mean those that are ultimately solar-derived: mainly solar energy itself, biomass resources, and wind power. These renewable energy technologies (that utilise ambient or ‘free’ energy inputs) promise to drastically change the structure of the energy system as shown in Figure 1 in two main ways. First, more distributed feed-in of renewable electricity means that the energy flows are no longer linear (left to right in the figure), and second, much more integration between sectors and energy carriers (such as gas, power, heat, transport) will be required.
Analysing energy systems: Thermodynamic ‘quantity’ versus ‘quality’
Energy systems pervade industrial societies and weave a complex web of interactions that affect the daily lives of their citizens. In order to analyse rigorously the energy and environmental consequences of changes in supply and demand of energy-intensive goods and services, it is necessary to draw the system boundary quite widely; the nation state for policy decisions within the competence of national governments (e.g. those influencing urban transport and air quality), regional co-operation to tackle problems on a continental scale (such as acid rain deposition), and globally for problems of the potential magnitude of the enhanced greenhouse effect.1–3,5,6
The First Law of Thermodynamics reflects the principle of conservation of energy, and gives rise to the notion of an energy (or enthalpy) balance applied to the system.1,8 It is an extensive property of matter that represents the thermodynamic ‘quantity’ associated with an energy vector. This approach became known as ‘energy analysis’ or ‘energy accounting’ in the late 1970s,10–12 and has been used1,8,9 to determine the overall energy efficiency of the UK electricity generation. Energy analysis enables energy or heat losses to be estimated, but gives no information about the optimal conversion of energy. In contrast, the Second Law of Thermodynamics indicates that not all the energy inputs into a system can be converted into useful work. It therefore provides the basis for the definition of parameters that facilitate the assessment of the maximum amount of work achievable in a given system with different energy sources. 8 Exergy is thus the available energy for conversion from a donating source with reference to a specified datum; usually the ambient environmental conditions (typically 5–25℃).8,9 In a sense it represents the thermodynamic ‘quality’ of an energy vector, and that of the waste heat or energy lost in the reject stream. Exergy analysis provides a way of determining where the thermodynamic quality of the source is degraded in processes or in society, and enables the scope for energy (or heat) cascading to be determined. It is possible, of course, to estimate exergetic-type improvements without explicitly adopting what has become known as ‘exergy analysis’. Indeed Chapman 10 correctly discerned the waste inherent in using nuclear-generated electricity for space heating, rather than for electrical appliances or mechanical drives. He employed (First Law) energy analysis, but supplemented this via an implicit understanding of the Second Law issues.
The issues considered
Britain aims to reduce its GHG emissions by some 80% by 2050 from a baseline of 1990. It is recognised that, in order to achieve this legally binding target, 13 the UK power sector (i.e. the ESI) needs to be decarbonised. Indeed, the Committee on Climate Change (CCC), who provide independent advice to the UK Government, has advocated deep cuts in power sector ‘operational’ emissions through the 2020s, with electricity generation being largely decarbonised by 2030–2040. 14 In parallel, the provision of heat services in Britain is now recognised by the UK Government as an important and under-researched area.
The aim of the present study is therefore to examine the end-use of electricity in the home, in the service sector, in industry, and the economy generally in the UK in order to estimate how much is used for heat and power, respectively. An understanding of the real-world end-uses for electricity enables policy makers to take account of the consequences of greater end-use electrification out to 2050. Hence, British electricity end-use shares have been estimated from 1970 to 2050, using future energy scenarios that had previously been developed by Jardine and Ault 15 in connection with the UK SUPERGEN Research Consortium on ‘Highly Distributed Power Systems’ (HDPS). The original purpose of these scenarios was to study the potential for extensive penetration of micro-generators into the British electricity network. They were produced from a synthesis of those that had been earlier devised for future network technologies on the one hand, and domestic energy demands on the other. Three resulting scenarios were characterised as ‘Business As Usual’ (BAU), ‘Low Carbon’ (LC) and ‘Deep Green’ (DG) futures, and yielded possible future electricity demands to 2050. In many ways, this work is a companion piece to the environmental footprinting study by Alderson et al., 5 who examined all three HDPS projections/scenarios in order to determine their resulting environmental and carbon footprints.
Thermodynamic (energy and exergy) analysis of various energy demand sectors can give rise to differing insights into the relative end-use merits of heat and power. The thermodynamic property known as ‘exergy,’ for example, reflects the ability of undertake ‘useful work’, but does not represent well heating processes within an energy sector. The share of electricity employed for heat and power applications has therefore been studied in a recent historical context (from a baseline of 1970). Alternative HDPS energy scenarios for the future development of the UK energy system were then used to evaluate the variation in heat/power share out to 2050. The present contribution seeks to provide a better understanding of the actual end-uses for electricity and their thermodynamic implications. This will enable policy makers to take account of the consequences of a greater end-use of electricity in the future.
This work forms part of an ongoing research effort aimed at evaluating and optimising the performance of various sustainable energy systems1,5,6,8–16,17–19 in the broad context of transition pathways towards a low carbon future for the UK. 3 In the following section, an overview of the background and current status of the UK electricity system is given, before the UK energy futures section presents the SUPERGEN scenarios employed in this work. The thermodynamic methods of analysis section then introduces the salient aspects of thermodynamic energy and exergy analysis as employed in this work, followed by an explanation of the methodology and assumptions, in general (the General methodology for estimating UK end-use shares for heat and power section) and for the residential sector (the Electricity end-uses in the residential sector section). The results are then presented and discussed in the Results and discussion section, and the paper closes with some concluding remarks in the Concluding remarks section.
The UK electricity system
Power production in the UK was shared between a variety of generator types in 2014 7 : coal (∼30%), natural gas (∼30%), nuclear (∼19%) and renewables (∼19%), with oil and other sources amounting to about 3%. The electricity supplied accounted for about 14% of (seasonally adjusted and temperature-corrected) total energy consumption in that year. But the ESI had already undergone quite rapid change over the last few years. 7 Coal power station closures, for example, have amounted to 15 GWe between 2010 and 2015, with CCGT plant closures accounting for a further 4 GWe. In 2015, the British Government announced that it planned to phase out unabated coal-fired power stations by 2025 as a climate change mitigation measure, provided that security of electricity supplies can be otherwise assured.
Nuclear power generation continued to expand in the UK post-1980, although a large proportion of the ensuing plant will reach the end of its economic lifetime and therefore need to be decommissioned during the period 2015–2030. The present UK Government aims to see much of this older nuclear power capacity replaced by ‘new build’ plant, probably based on European Pressurised Reactor (EPR) designs. In addition, natural gas consumption in the UK increased dramatically during the 1980s (in the so-called ‘dash for gas’). It became a significant player in terms of electricity generation via combined cycle gas turbine (CCGT) plant, due to their relative fuel prices, construction costs and times, and potential ‘low carbon’ benefits. 1 Britain became a net importer of natural gas in 2004 as reserves in the UK continental shelf declined.6,7 A recent British Government ‘energy policy reset’, the components of which will only become clear during the latter part of 2016, will lead to additional changes going forward. Imports of natural gas for CCGT power plants brings with it potential ‘security of supply’ risks in the long term. In 2014, the UK produced 425 Tera Watt hours (TWh) of indigenous natural gas, with its net imports amounting to some 477 TWh 7 [1 TWh = 3.6 Peta Joules (PJ)]. Whilst there are considerable uncertainties about the security of imported gas supplies in the long term, 6 gas imports are likely to continue to grow quite rapidly in the near future, 5 unless the ‘shale gas revolution’ comes to pass. 16 In contrast, there has been a rapid rise in renewable electricity generation in general, including mainly onshore and offshore wind, bioenergy/waste and PV (with 9.2, 5.1, 5.2 and 9.2 MW installed capacity in 2015 7 ). Solar PV systems now stands at around 853,000 installations, for which rooftop solar alone now accounts for >1% of UK electricity supply. 7
The ESI is made up of companies performing different functions: the generators, network companies and suppliers. 6 The National Grid (NG) acts as the system operator with responsibility for balancing power supply and demand. The ‘generators’ own and operate large power stations: coal-fired stations, CCGT plant, nuclear power stations, wind farms, and various smaller contributors. Thirty large (>1 GWe) power plants meet the bulk of electricity demand.4,5 This is typically ∼40 GWe, although it rises to ∼60 GWe at peak. NG was the ‘Transmission Network Operator’ (TNO) for England and Wales from 1995 to 2005, whilst ScottishPower and Scottish and Southern Energy (SSE) were the TNOs in Scotland. In April 2005, the British Electricity Trading and Transmission Arrangements (BETTA) was established, and brought together the three independent grid systems for England and Wales, Scotland, and Northern Ireland, along with the power interconnectors. 7 The ‘grid’ is made up of ∼25,000 km of high voltage overhead lines (275 kV or above) that minimise energy losses over distance. There are currently some 14 regional distribution networks in Great Britain with 800,000 km of overhead lines and underground cables.4,5 They deliver lower voltage (132 kV and below) power from grid supply points to consumers. These regional networks were originally managed, in turn, by seven companies that act as Distribution Network Operators (DNOs). BETTA now facilitates bilateral trading between market participants (e.g. generator companies, suppliers, traders, and a range of large and small customers) and greater choice for end-use power consumers. 7 This is achieved through forwards and futures markets, together with a balancing system operated by NG, and a regulated settlement process 7 . The UK Government and electricity market participants recognise that the supply network is in need of major physical renewal and reconfiguration in terms of both power plants and grid infrastructure over the coming decades. 6
The UK energy futures
The parent scenarios
The scenarios employed for the present study were created by Jardine and Ault 15 as a synthesis of the earlier SUPERGEN Future Network Technologies (FNT) scenarios of Elder et al. 20 and the UK Domestic Carbon Model (UKDCM2) produced by Layberry. 21 The FNT scenarios 20 were supply-side focused and described six high-level UK electricity networks as they might appear in 2050. Each considered various technical, economic, environmental and regulatory constraints on the UK ESI. They yield different penetrations of centralised generators (including large-scale renewables) and capacity mixes, as well as network infrastructures. In contrast, the UKDCM2 model 21 takes a demand-side approach, with energy use and carbon dioxide emissions from the UK housing stock being determined from inputs on household numbers, house type, thermal efficiency, and appliance efficiency, together with the number and efficiency of micro-generators used. It was employed to estimate electricity demand for households based on the assumed stock of lights and appliances, as well as building type (insulation levels, internal temperatures, and occupancy). The total electricity demand was then determined from the sum of this and non-domestic power demand split between industrial and other uses.
The SUPERGEN highly distributed power systems scenarios
The Highly Distributed Power Systems (HDPS) scenarios
15
were developed from a synthesis of those previously devised (and outlined in The parent scenarios section above) for future network technologies on the one hand, and domestic energy demands on the other. Jardine and Ault
15
created a set of three normative scenarios in order to examine the specific consequences of extensive penetrations of micro-generators into British electricity networks. The integration of the two sets of predecessor scenarios
15
kept the level of details of each parent approach, while allowing for key parameters that influence electricity networks. They have provided a useful tool for unifying contributions across HDPS project partners,
19
quantifying the scale of the change required (moving from a centralised system to one where perhaps 1/3 of electricity comes from distributed sources), and to ensure that the suggested futures were in line with the UK Government’s initial target of a 60% reduction in CO2 by 2050. This level of distributed power presents significant challenges, including reverse power flow on networks, load balancing, storage requirements, phase unbalance, harmonics, and ancillary services.
22
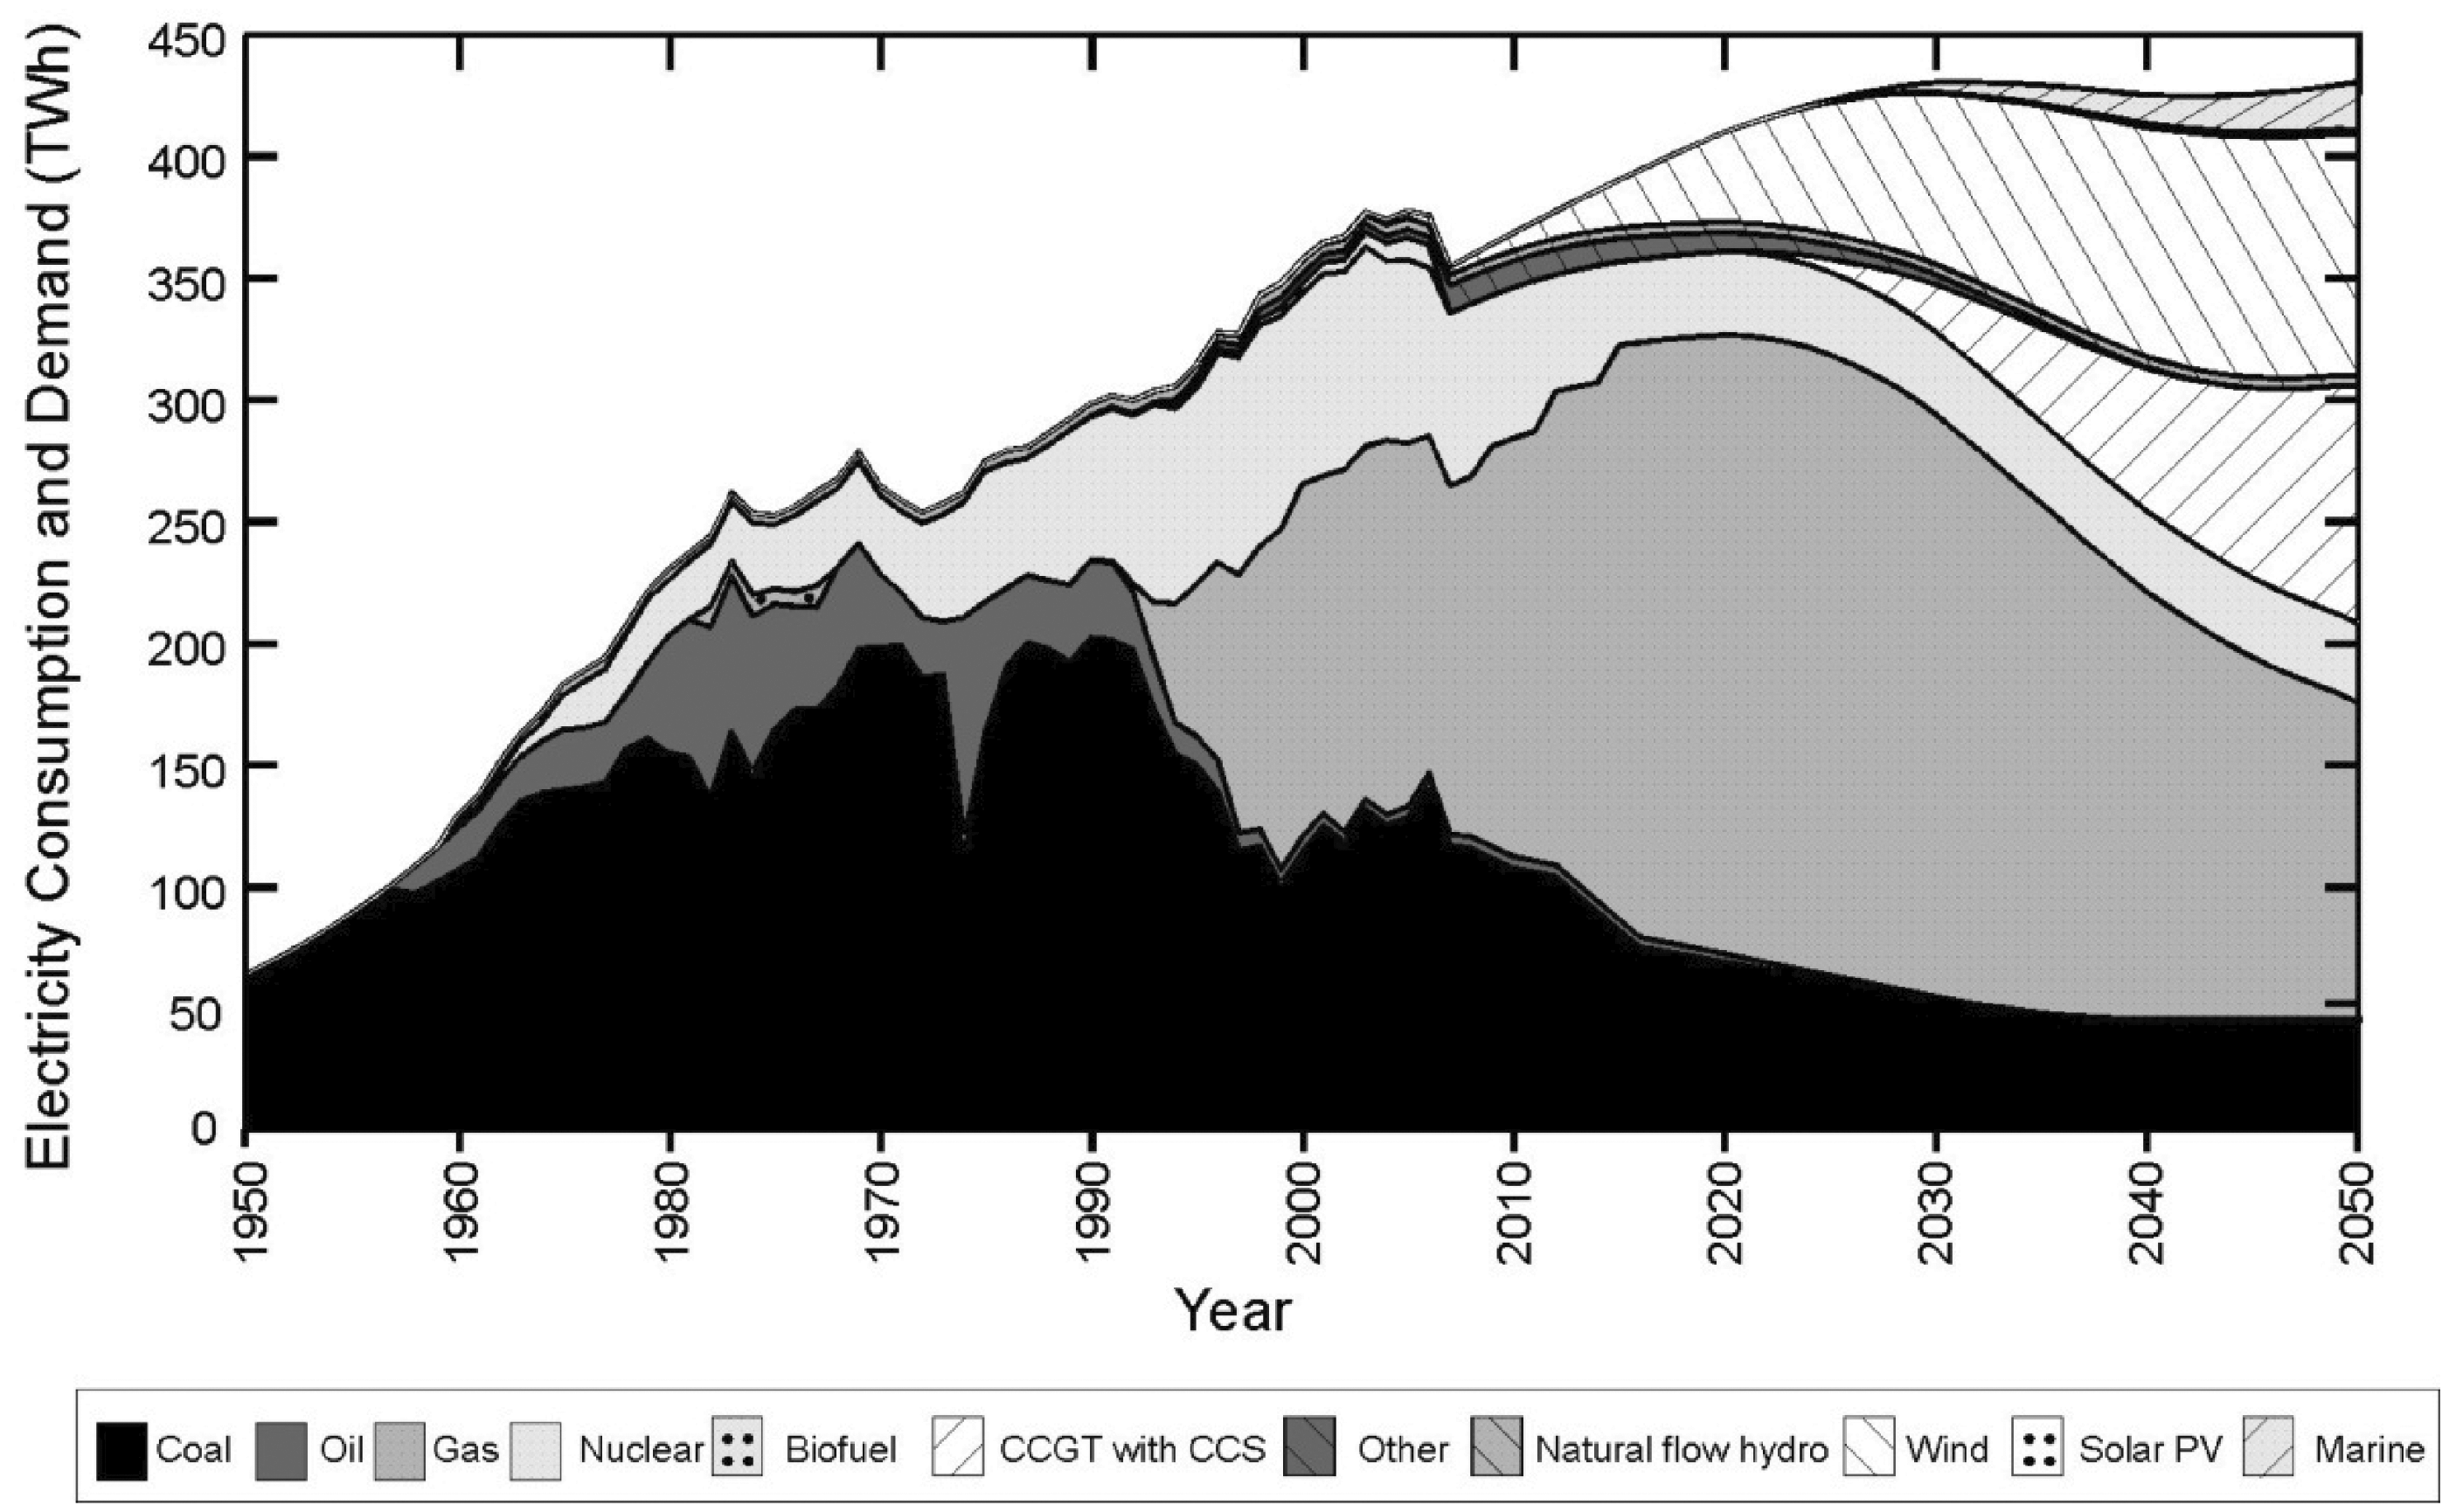
The resulting three scenarios were characterised as ‘Business As Usual’ (BAU), ‘Low Carbon’ (LC) and ‘Deep Green’ (DG) futures, and yielded possible electricity demands to 2050. The BAU scenario
15
is based on incremental change over time with a continuation of near-term trends in technologies, as well as energy policy responses to the climate change and energy security challenges. Growth in the take-up of decentralised energy resources (DERs) is assumed to be consumer-led, rather than stimulated by an act of government policy intervention (see Figure 3). In contrast, the LC scenario
15
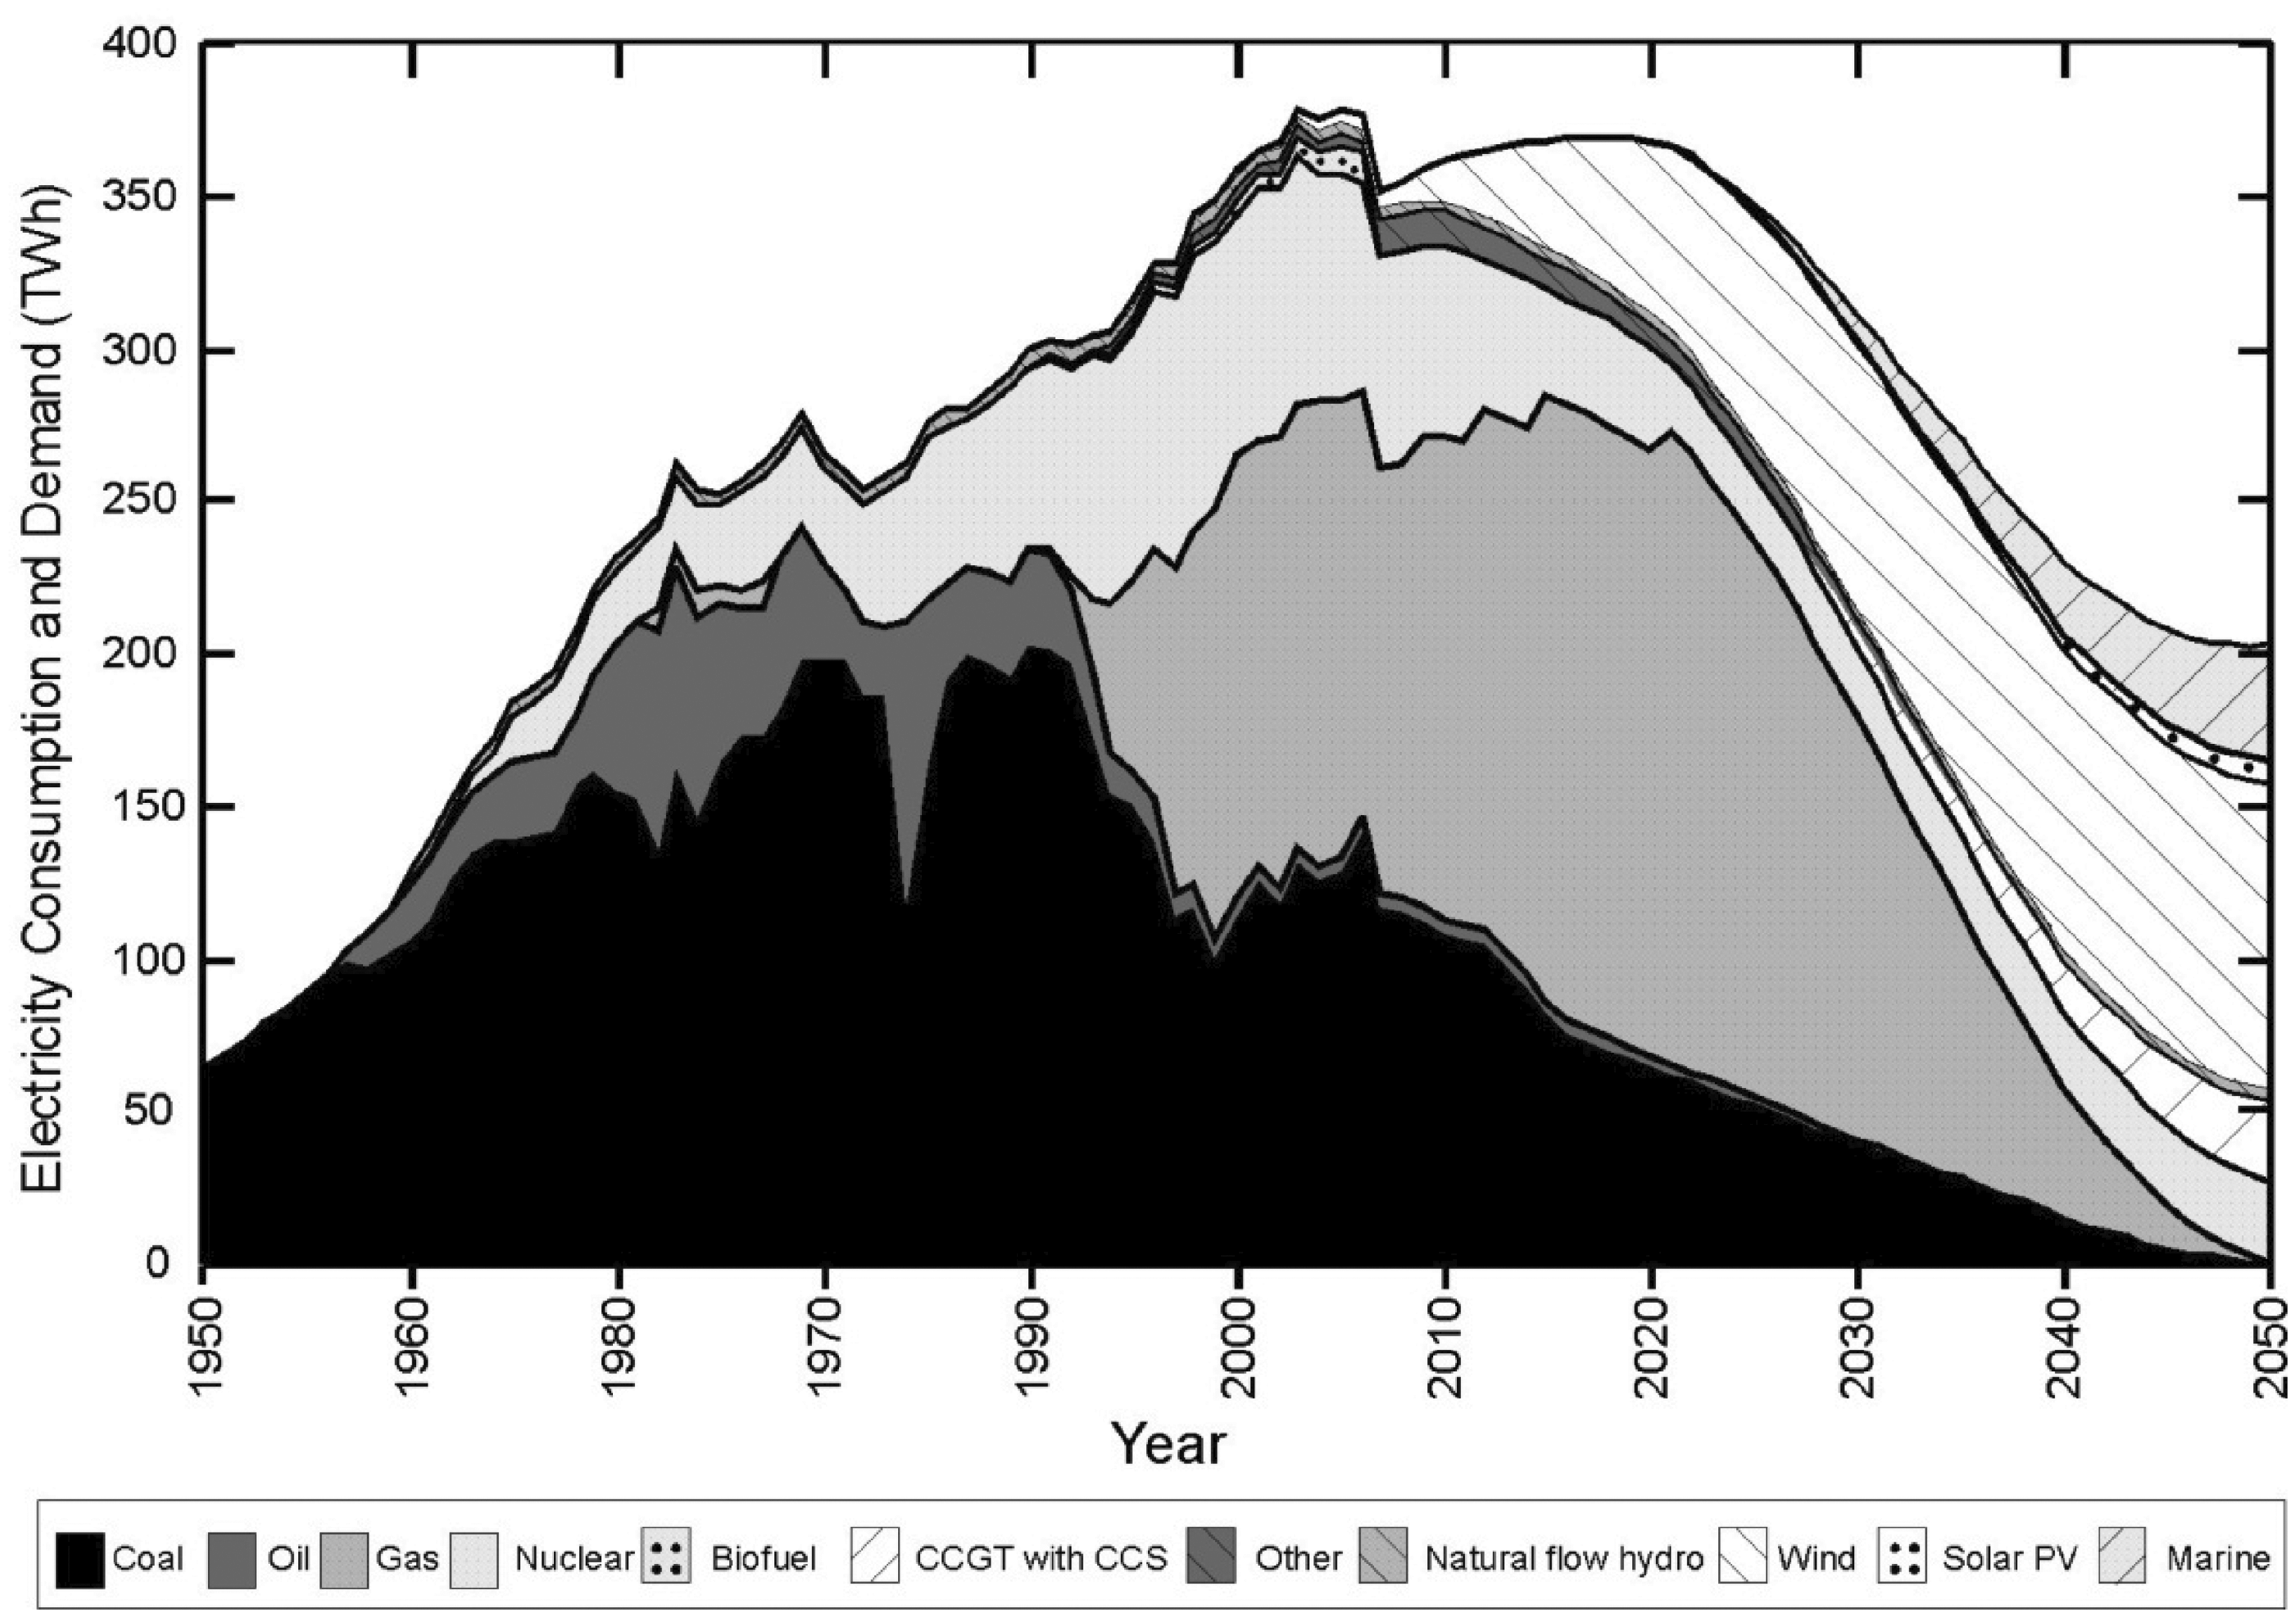
implies an extensive penetration of micro-generators in the home to satisfy heat and power demands. However, these are minimised by way of improved insulation of the building fabric and other demand reduction measures. Under this scenario, DERs contribute ∼44% of the UK electricity supply by 2050, and residential dwellings are significant net exporter of power (see Figure 4). Finally, the DG scenario
15
presupposes a network where centralised renewable energy technologies – mainly large-scale onshore and offshore wind turbines – have a significant role in power generation. Demand reduction again plays an important role (as in the LC scenario), but fossil fuel power generation is effectively eliminated. The scenarios do not take account any increase in electricity demand associated with the possibility of much greater use of electric heat pumps for home heating or electric vehicles for transport. This was justified on the basis of a ‘like-for-like’ comparison.
15
Thermodynamic methods of analysis
The enthalpy of energy carriers and ‘energy analysis’
The First Law of Thermodynamics is typically viewed in terms of a steady-state process for which the energy balance may be represented by
9


The exergy content of energy carriers and ‘exergy analysis’
First Law or ‘energy’ analysis (see, for example, Chapman, 10 Roberts 11 and Slesser 12 ) takes no account of the energy source in terms of its thermodynamic quality. It enables energy or heat losses to be estimated, but yields only limited information about the optimal conversion of energy. In contrast, the Second Law of Thermodynamics indicates that, while work input into a system can be fully converted to heat and internal energy (via dissipative processes), not all the heat input can be converted into useful work. It therefore suggests the need for the definition of parameters that facilitate the assessment of the maximum amount of work achievable in a given system with different energy sources. ‘Exergy’ is such a property that reflects the ability of an energy system to undertake useful work. Electricity, for instance, may be regarded as an energy carrier having a high quality, or exergy, because it can undertake work. In contrast, low temperature hot water, although also an energy source, can only be used for heating purposes. Thus, van Gool, 23 and later Hammond,9,24 has argued that it is important to employ exergy analysis (see, for example, Kotas, 25 Szargut et al. 26 and Bejan et al. 27 ) alongside a traditional First Law energy analysis in order to illuminate these issues. It provides a basis for defining an exergy efficiency, and can identify what van Gool called the exergetic ‘improvement potential’ of systems. 23
The exergy function itself is another ‘extensive’ property8,9,24,28 which is defined by reference to a ‘dead’ or equilibrium state (in terms of temperature To, pressure Po, and species component µio)8,9,24


It is clear from equation (4) that exergy stems from the First
Van Gool
30
suggested that the thermodynamic quality of a flow stream may be represented by the ratio of its exergy to enthalpy

Electricity is normally generated in advanced, industrialised countries using either depleting fossil or nuclear fuels1,8 with the renewable energy sources, such as solar energy and tidal, wave and wind power, still only making a relatively modest contribution (∼19% for the UK in 2014 7 ). In contrast to electricity (a high quality energy carrier with Θ = 1 as indicated above), low temperature hot water (Θ ≈ 0.2) can only be used for heating purposes. The variation in van Gool’s thermodynamic quality (Θ) with the process temperature ratio (Tp/T0) is shown in Figure 2. 9 This was produced using the environmental datum temperature adopted by Hammond and Stapleton 8 for their energy analysis of the UK: −1℃ (or T0 = 272 K). They indicated that the exergy efficiency of various domestic heating appliances was quite sensitive to the choice of this reference temperature, when the process temperature is close to the selected environmental datum. However, the thermodynamic quality (Θ) is insensitive to the choice of this environmental temperature when plotted against the process temperature ratio, 9 as depicted in Figure 2. Here a very wide variation in Tp/T0 is displayed, and various heat sources are shown for comparison purposes. Their associated process temperatures span the range from liquefied natural gas (LNG) at about −50℃ to the optical temperature of our Sun at around +5500℃.
Thermodynamic analysis in the present context
It may be argued that thermodynamic methods form an indispensable part of the ‘toolkit’ needed to secure a sustainable future. 9 Exergy analysis can certainly provide a useful tool for the understanding of complex energy systems.9,23–27 It was used by Reistad 29 to identify the true nature of losses in power plant. He noted that enthalpy losses arise in the condenser, and therefore offer little prospect of improvement other than by way of a ‘bottoming cycle’. However, exergy losses are associated with combustion processes and with heat exchangers. Making improvements at that end of the cycle have a ‘knock-on’ benefit of also giving rise to higher First Law efficiencies. Hammond and Stapleton 8 argued that the feasibility of such changes is not as important as a proper comprehension of the thermodynamic processes involved. In contrast, there is a tendency for some thermodynamicists to elevate exergy analysis to a pivotal position. Gaggioli, 31 for instance, viewed exergy as representing thermodynamic ‘value’, and regarded exergy efficiency as being the ‘true’ efficiency. This is not warranted, and Hammond and Stapleton 8 have argued that it should be discouraged. Hence, Hammond 9 subsequently advocated the use of exergy analysis alongside the more traditional First Law energy analysis, as well as several other quantitative approaches that should be employed to study energy systems (e.g. carbon accounting, 5 environmental footprint analysis, 5 environmental life-cycle assessment (LCA), 32 etc.). In the present contribution, this wider understanding of the thermodynamic implications of electricity use for heat and power applications represents the basis for its long-term analysis in a UK context.
General methodology for estimating UK end-use shares for heat and power
Historical data series
Historical data on UK electricity use since 1970 was mainly taken from the Energy Consumption in the UK 2015 33 (ECUK 2015) factsheet produced by the UK Department for Energy and Climate Change (DECC); specifically Table 3.04 for the domestic sector, Table 4.07 for industry, and Table 5.11 for the services sector. [These data are consistent with that reported in the Digest of United Kingdom Energy Statistics 2015 (DUKES 2015) 7 – Table 1.1.5 ‘Overall final user energy consumption’; also published by DECC. The ‘Other final users’ sector in this table includes agriculture, but this is assumed to be small and this end-use category was therefore taken as a proxy for the services sector.] In general, energy service demands (ESDs) 18 were not considered directly here; instead the technology used to meet these demands was taken to be a proxy for that ESD. This means that, for example, the fact that traditional (incandescent) lighting converts most of the input electricity to heat is overlooked. Similarly, compressed air and refrigeration end-uses are considered to be power applications because they both currently employ motors to drive pumps and/or compressors (which overlooks alternative means of meeting the same ESDs).
Electricity use data for the residential sector from 1970 was mainly taken from ECUK 2015 33 (Table 3.04). This data is again equivalent to that given in DUKES 2015 7 and represents ‘delivered energy’, i.e. the quantity of electricity actually used by the households. 18 However, the present approach does not consider the end-user’s demand for the actual energy services. Here, delivered electricity was broken down into a variety of end-use categories. ECUK 2015 was used to provide estimates of the historical split of electricity between heat and power applications. In addition to ECUK 2015 33 (Table 4.07 and Table 5.11), other historical sources have been used for the industrial and service sectors, respectively. These were the influential study by Leach et al. 34 of the whole UK economy covering all end-use sectors (together with projections out to 2025). They broke the energy market down into some 400 end-use fuel and appliance categories. [However, Hammond 35 subsequently noted, with the benefit of hindsight, that although these forecasts of total primary energy consumption were much in line with data in the mid-1990s, the reasons for this and the structure of the competitive UK energy market were quite different from that originally postulated by Leach et al. 34 ] In addition, the study by Pout 36 was used to supplement the data from ECUK 2015 (Table 5.11). It describes the specification of the N-DEEM model, which is used by the UK Building Research Establishment (BRE) to generate much of this data.
Future projections to 2050
Two of the HDPS SUPERGEN scenarios have been employed for the present study, namely the ‘Business As Usual’ (BAU) and ‘Low Carbon’ (LC) futures (see again Figures 3 and 4, respectively for the annual UK electricity consumption by network generator type in each case), which yielded possible UK electricity demands out to 2050. Alderson et al., 5 who examined the carbon and environmental footprints stemming from all three HDPS scenarios, observed that the LC and ‘Deep Green’ (DG) scenarios gave rise to quite similar trajectories over the period 2010–2050. Consequently, it was felt that only one of the two ‘greener’ scenarios needed to be evaluated here. [Full details of these HDPS scenarios can be found in Jardine and Ault. 15 ] The basic methodology in developing heat/power curves for the domestic, services and industrial sectors, respectively, was a regression of the historical data and HDPS (BAU and LC) projections/scenarios in turn. This determines the overall electricity demand for each sector: domestic, services and industry.
Only end-use electricity data for the domestic sector are broken down sufficiently for the current purposes within DUKES 2015 7 and ECUK 2015 33 datasets (see the Historical data series Section). Therefore, the trends in sub-sector heat and power use in the services sector and industry were (linearly) extrapolated out to 2050. This extrapolation provided the ratio of heat-to-power use over the period 1970–2050. This ratio is then used to scale the curve for overall electricity demand, and thus generate heat/power curves under each scenario. A literature search of published projections failed to find any alternative indication of the likely evolution of the heat/power split out to a 2050 future. Due to the long time period over which the historic data were collected (i.e. 45 years), and the significant gaps in it, the extrapolation of trends is only indicative and is not expected to provide a representation of likely future trends to a very high accuracy. Much more, the process should be understood as a ‘thought experiment’, in which a future extrapolation of historic trends is employed in order to analyse one possible evolution in the heat/power ratio out to 2050. In both the industrial and services sectors, a range for the fraction of electricity used in heat and power applications or categories was calculated. The mid-point of each range was taken as a representative value, and the potential deviation about this mid-point was estimated. For industry, the relative error was some 10–20%, meaning that the determined split of the heat-to-power ratio had a minimum accuracy of ±10%. For services sector, the relative error was in the range of 0–26%; giving a minimum accuracy of ±13%. Hence, the overall accuracy of the heat-to-power shares determined in the present study, based on historic data for the time period of 1970-2010, was of the order of ±13%.
Electricity end-uses in the residential sector
Post-1970 historical data
There are two sources within ECUK 2015 33 that enable this data acquisition. Table 3.04 provides DECC estimates based on secondary analysis of data from the BRE and modelling by Cambridge Architectural Research [using the Cambridge Housing Model (V2.9)]. The second ECUK 2015 source for residential electricity end-uses is Table 3.10, which provides estimates from the UK Department for Environment Food & Rural Affairs (Defra) ‘Market Transformation Programme’ (MTP). The advantages of the MTP numbers are that they provide historical estimates all the way back to 1970, and that they involve a greater degree of disaggregation. The disadvantage of the MTP estimates is that they consider only a portion of total electricity use.
The categories provided in ECUK 2015 33 Table 3.10 break down as follows: lighting (internal); cold (chest freezers, upright freezers, fridge-freezers and refrigerators); wet (dishwashers, washing machines, tumble driers and washer-driers); consumer electronics (TVs, video players and recorders, set-top boxes and external power supplies/battery chargers); home computing (computers, monitors, printers); and cooking (hobs, ovens, microwaves and kettles). The unallocated proportion could contain any household appliances that are not considered within the MTP categories, but it is assumed here to be dominated by a mixture of space and water heating, for the following reasons. For the period post-1990, the unallocated portion varied between approximately 100 and 130 PJ/year, which is roughly equal to the space and water heating allocation (1 PJ/year = 0.031742 GW).
Estimated breakdown of residential electricity use from historic data – comparison with 1975 and 1982 published figures.
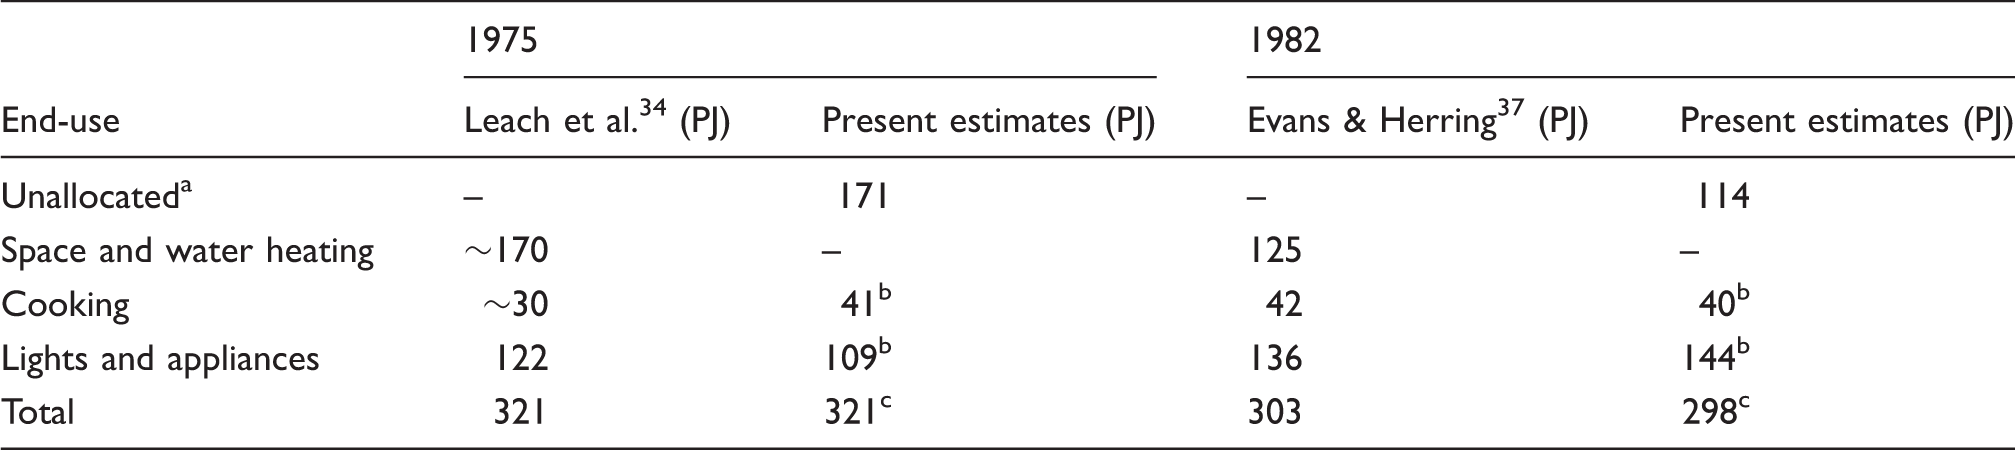
Unallocated – taken to principally include ‘Space and water heating’.
The cooking category in Table 1 was assigned to heat, while the remaining categories were assumed to be power applications. Some of the power categories may, in fact, include some heating applications, most notably ‘tumble driers’ and ‘washer-driers’ within the wet category. These end-uses involve both work (the motor driving the rotation of the drum) and heat (where the drying or water-heating is achieved through electrical resistance heating). Detailed disaggregation within each category is not given by ECUK 2015, 33 and hence the issue has been ignored in making the present estimates. Such misallocation is likely to make only a small difference to the overall heat-to-power split, since these ambiguous categories are a small proportion of the total. It should also be noted that some categories, such as lighting, adventitiously provide heat to the household. All other things being equal, more effective and efficient lighting would emit less ‘waste’ heat and hence potentially increase the space-heating demand.
Scenarios of future residential electricity use to 2050
The SUPERGEN HDPS scenarios of Jardine and Ault 15 have been used to make estimates of the overall electricity usage in the domestic (or residential), service and industrial sectors over the period out to 2050. For the residential sector, Jardine and Ault 15 drew on the modelling results of the UK Domestic Carbon Model (UKDCM2) produced by Layberry. 21 It is a demand-side model of the UK housing stock that was developed to model the energy use and carbon emissions of the residential sector out to 2050. Since it estimates electricity demand on the basis of ‘bottom-up’ modelling of the various uses of energy within households, it was possible to determine a split between heat and power applications. Two of the HDPS scenarios for future development of residential electricity demand are considered by Jardine and Ault 15 and are therefore analysed here: the BAU scenario and the LC scenario. UKDCM221 provided corresponding estimates of space and water heating demand in the residential sector. The breakdown employed in this model was used in the current study to identify and separate heat and power applications for the period 1970–2050.
Results and discussion
HDPS SUPERGEN scenarios: Assumptions and content
‘Business as Usual’ scenario
The Business as Usual (BAU) scenario represents a future where change is incremental, and reflects near-term trends, technological development, environmental attitudes and policy (see Jardine and Ault 15 ). Society is assumed to be unrestricted in its use of energy, and improvements in energy efficiency continue to be outweighed by an increase in demand for energy services. The consumer-electronics sector in particular was assumed to continue to be a major growth area, with plasma TVs, PCs and digital services commonplace. This is one of the factors underlying the projected growth of the power applications category out to 2050. Over this period, the overall electricity use for space heating, water heating and cooking will remain broadly constant. Outdoor products (‘conservatories’, ‘hot tubs’ and ‘pools’) were presumed, in this instance, to be heating applications which, under the BAU scenario, are projected to increase out into the future. Heat pumps were defined as a power application, for consistency with the industrial and services sectors, and because they use a power input to move heat from a lower-temperature ‘source’ to a higher-temperature ‘sink’.
The projected electricity consumption by fuel type according to the BAU scenario is illustrated in Figure 3. It can be seen that total demand is projected to gradually rise to around 430 TWh per year by 2025 and thereafter it remains fairly stable. Jardine and Ault 15 assumed that there will be a gradual decline in electricity generated from coal-fired power plants to less than 50 TWh per year over the next 30 years, which will initially be balanced by a rapid increase in natural gas. They also anticipated that CCGT plants with carbon capture and storage (CCS) facilities 39 would be introduced around 2020. These would gradually replace conventional gas-fired power station, with CCGT/CCS schemes reaching a total output of 98 TWh by 2050 compared to 130 TWh from conventional gas. Oil and other thermal fuels, only a small contribution (∼3%) to electricity generation in 2014, was assumed to be slowly phased out, 15 and nuclear power would decline to approximately 33 TWh per year by way of ‘replacing nuclear by nuclear’, i.e. exchanging decommissioned nuclear power plants with ‘new build’ nuclear power reactors. 5 Much of the initial increase in demand was presumed to be met by onshore and offshore wind power, which was projected by Jardine and Ault 15 to continue to grow and replace conventional generators up to about 100 TWh in 2050. Finally, marine technologies (tidal barrages, tidal stream and wave power devices) were assumed to be introduced around the mid-2020s, and slowly become established to produce around a modest 20 TWh by 2050.
‘Low Carbon’ scenario
The Low Carbon (LC) scenario represents a future in which environmental objectives are a priority, and energy demands are reduced compared to the BAU scenario. Electricity demands are also lowered under a LC scenario (again compared to those for the BAU scenario) due to falls in the power-using category. This is based on the suggestion by Jardine and Ault 15 that strong product standards secure the technical potential in energy savings, and LED lighting and vacuum-insulated refrigerators (or ‘fridges’) become the norm. In contrast, electricity use for (resistance) heating is decreased only slightly, presumably through lower demand via improved insulation and because indoor temperatures are assumed to saturate at 22℃, rather than the BAU assumption of 23℃. 15
The projected electricity consumption by fuel type under the LC scenario is shown in Figure 4. It can be seen that total demand was expected by Jardine and Ault 15 to fall dramatically over time as a result of energy conservation, technological innovation and product efficiency, environmental awareness, and changes to lifestyles and government policies. By 2050, the demand was projected to reduce to about 200 TWh per year. Coal, conventional natural gas, and other thermal fuels were anticipated to be completely phased out in favour of CCGT/CCS. 15 The latter was assumed to be the only remaining fossil fuel generating capacity in 2050, producing about 30 TWh of electricity per year (see Figure 4). Nuclear power generation, due to a policy of ‘replacing nuclear by nuclear’, will be stabilise at around the same level as CCGT/CCS by 2050. 15 Approximately half of the electricity demand, around 100 TWh, was presumed to be generated by onshore and offshore wind power with an increasing contribution from marine power schemes reaching almost 40 TWh per year by the end of the projection/scenario timescale. The remaining demand would be made up by small contributions from solar PV and small-scale (or natural flow) hydropower. 15
Electricity end-uses in the domestic (or residential) sector
The two SUPERGEN scenarios presented above give alternate visions of the future on the basis of a variety of assumptions specified in the UK Domestic Carbon Model (UKDCM2) produced by Layberry,
21
and summarised in Jardine and Ault.
15
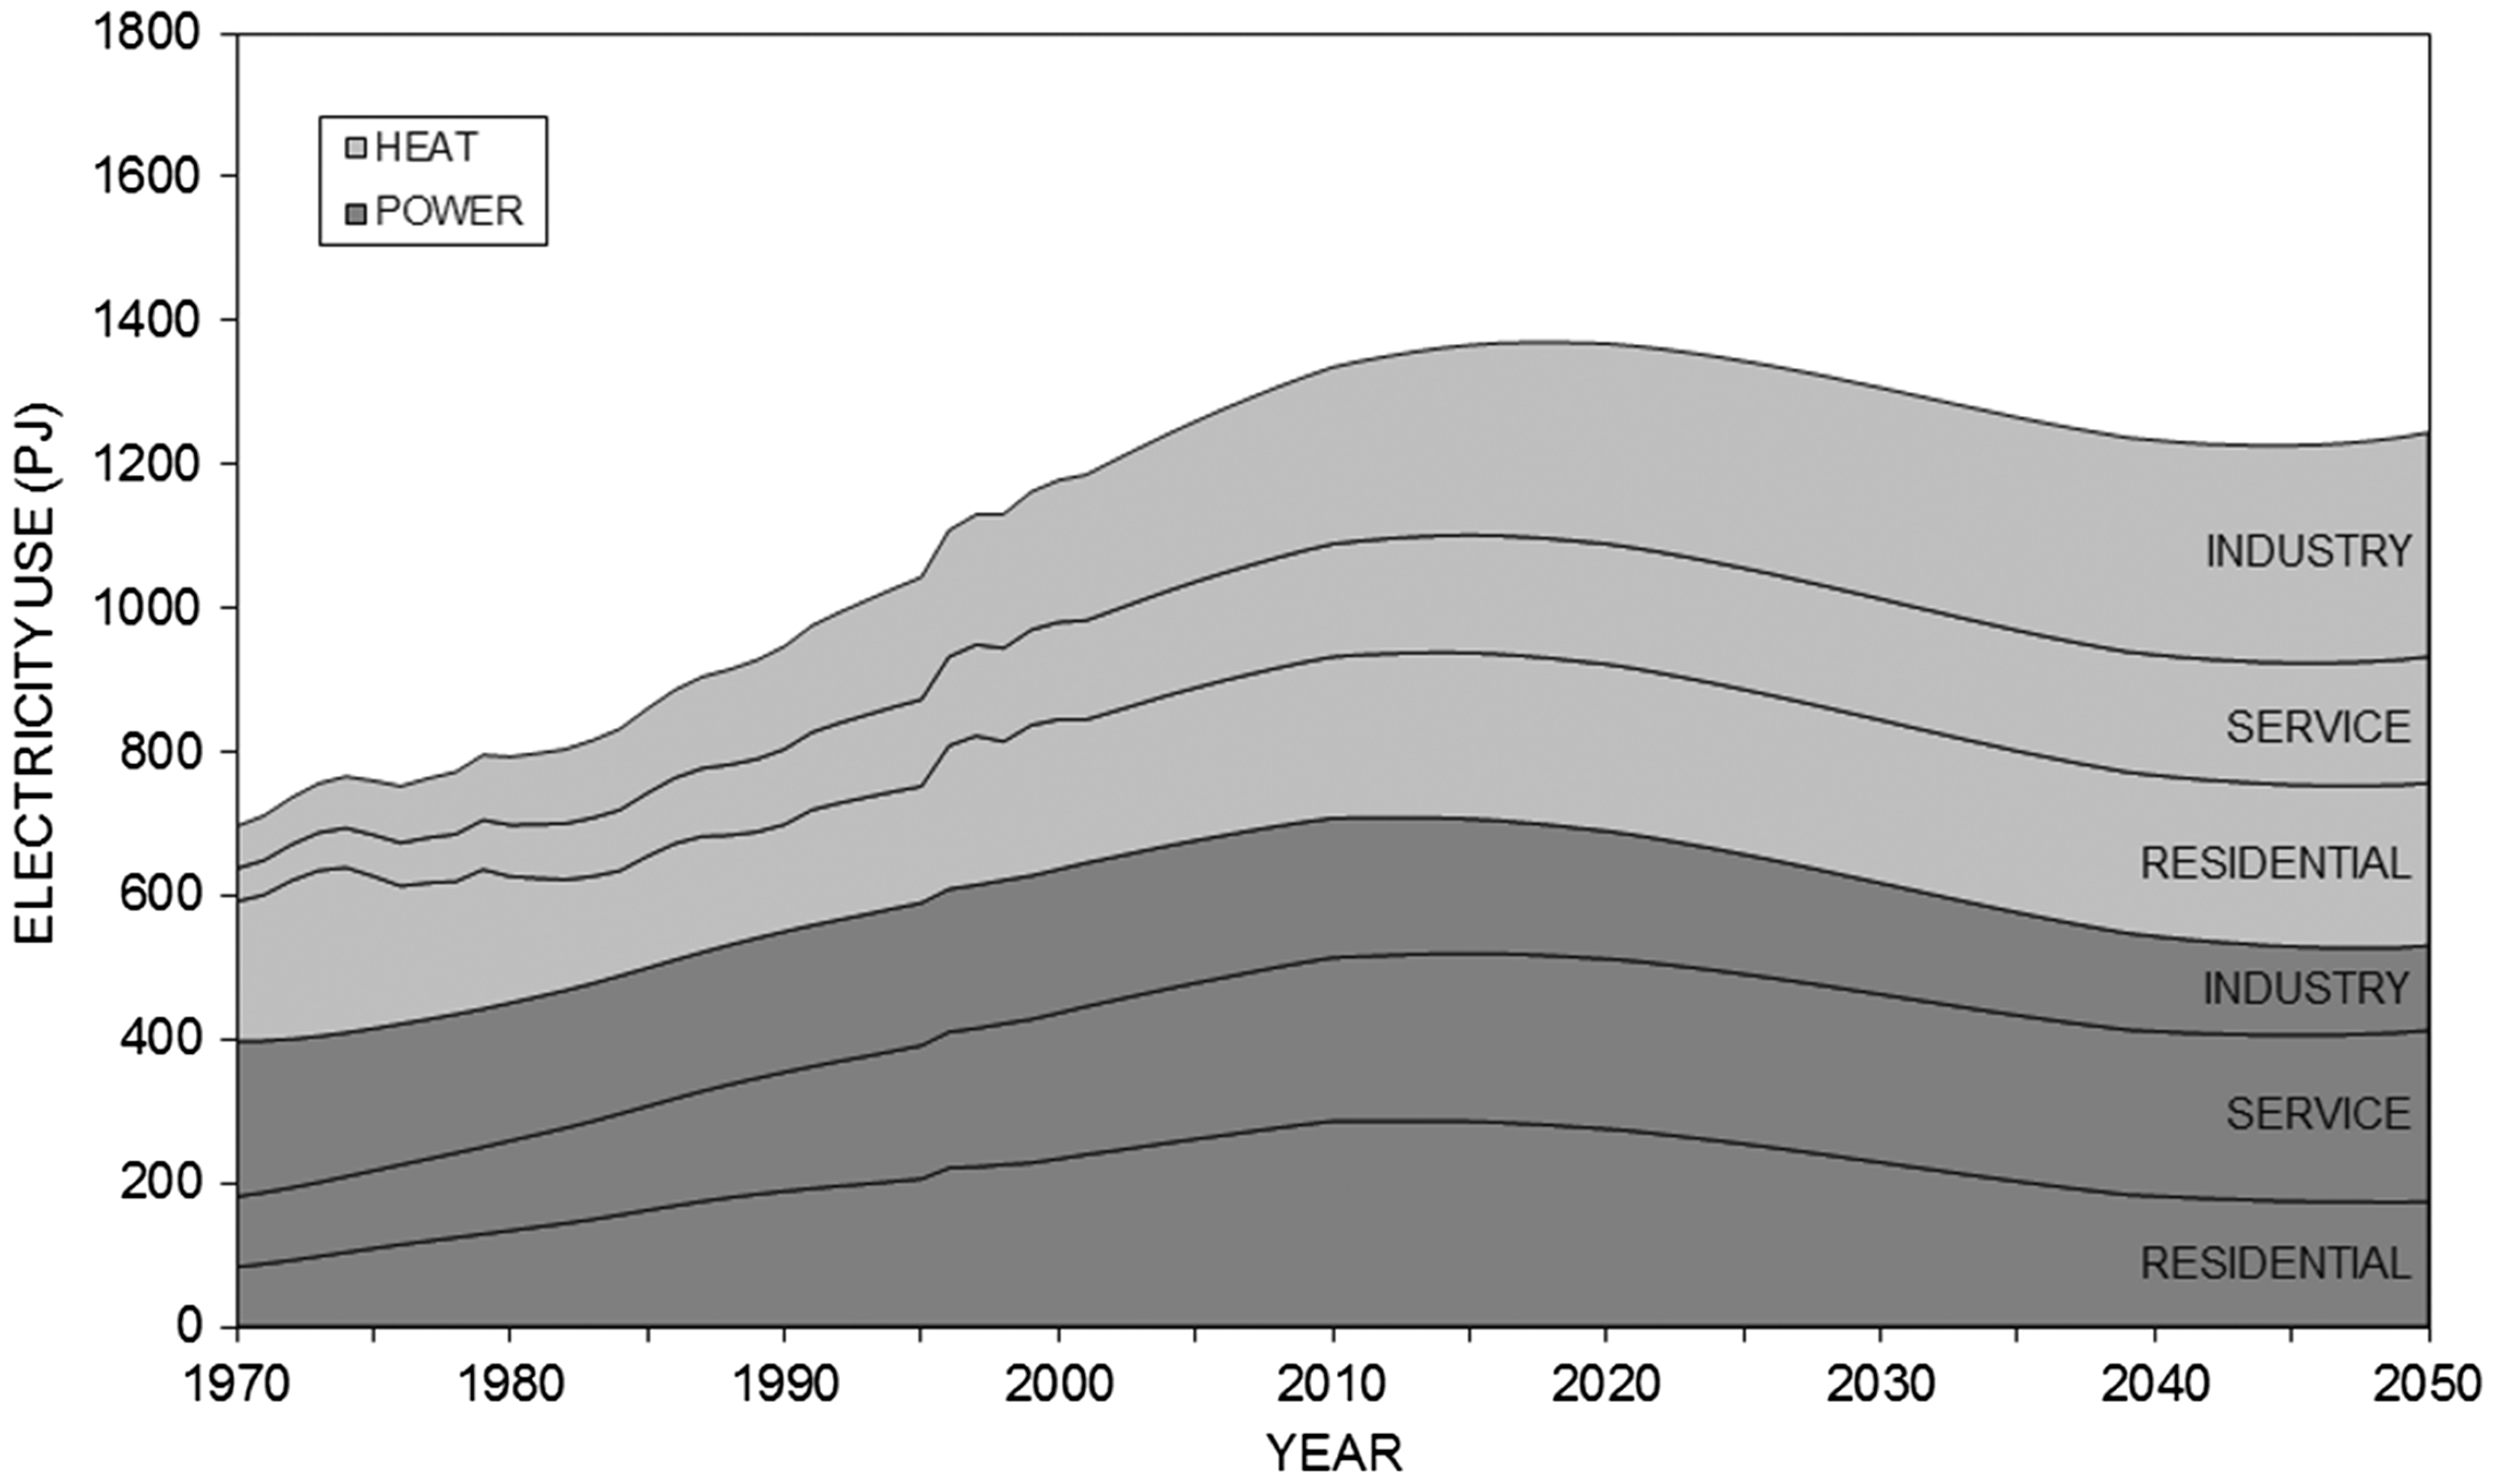
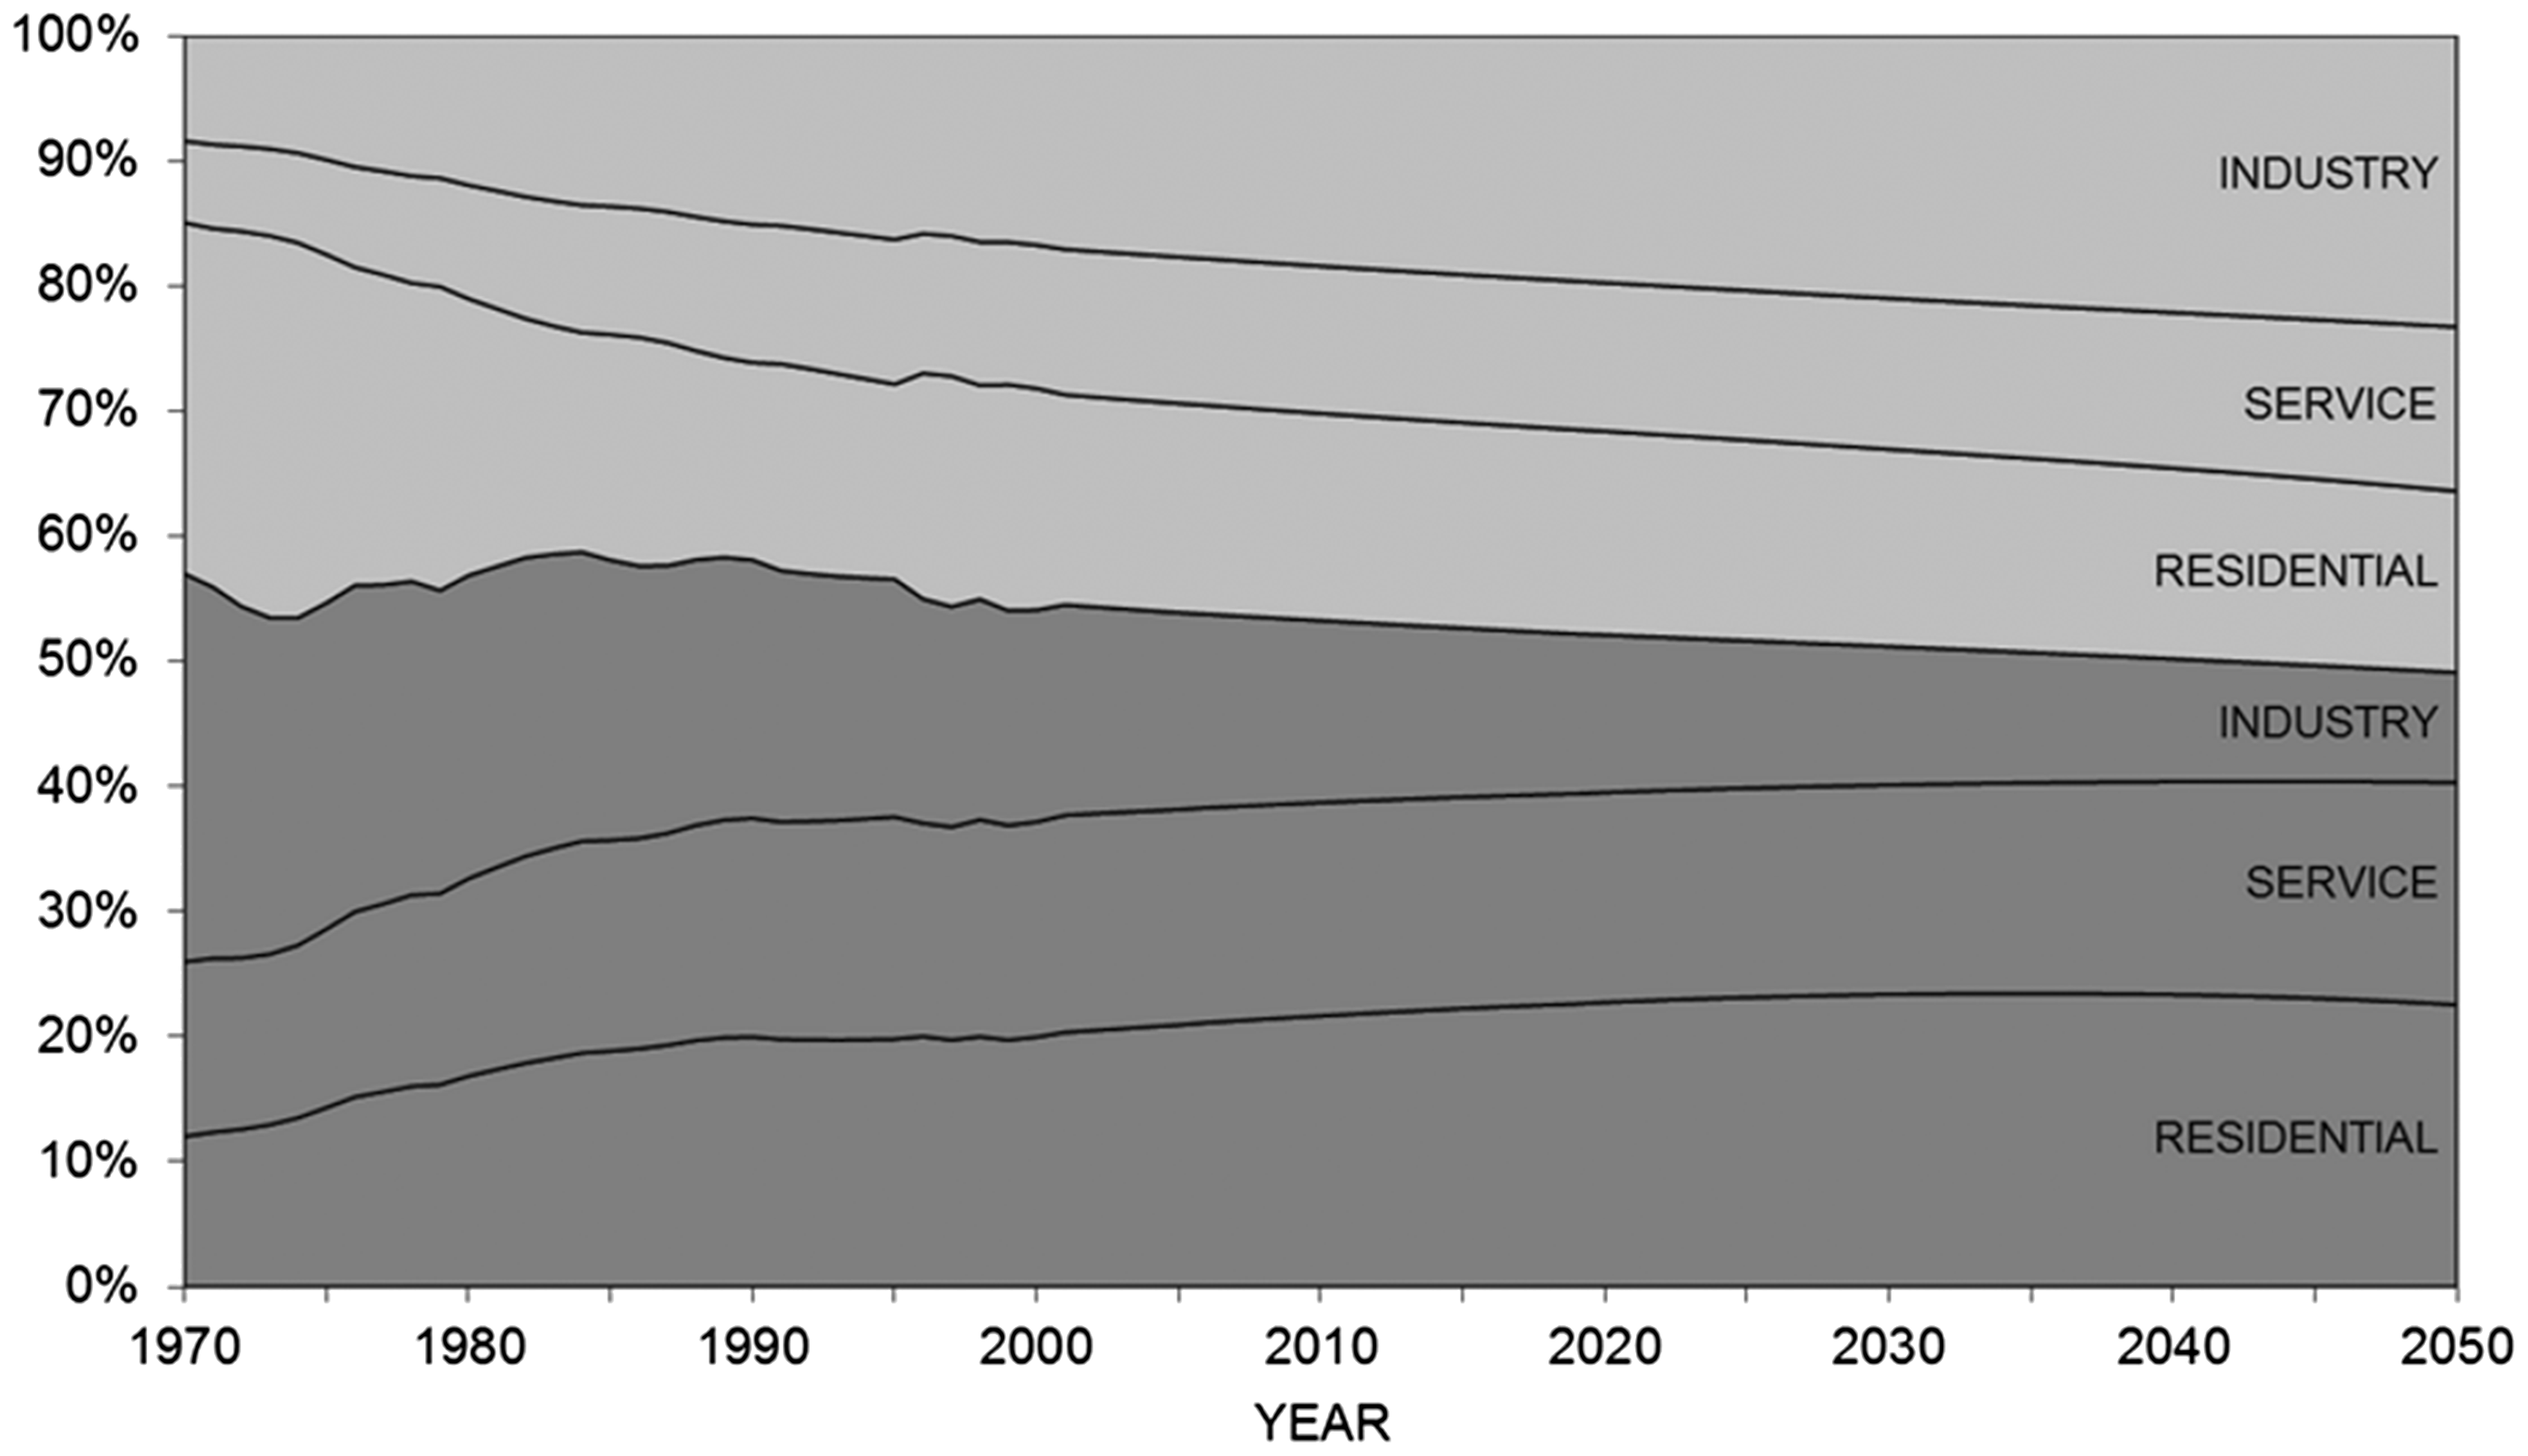
The Low Carbon (LC) scenario presents a vision in which society ‘values’ carbon and therefore energy-saving measures are adopted, and in which strong product policy plays a key part in enabling electricity savings by 2050 compared to a Business As Usual (BAU) situation. In 2050, the overall residential electricity use is 635 PJ in the BAU scenario (see also Figure 5), compared to 400 PJ in the LC scenario (see Figure 6) [1 PJ = 0.27778 TWh]. Thus, heat end-use of electricity remains fairly constant over the period 1970–2050 under both the BAU and LC scenarios. In contrast, power applications rise from 195 PJ in 1970 to 225 PJ in 2010 before falling again to 170 PJ by 2050 under the LC projection, whereas it more than doubles under the BAU scenario. Virtually all of the LC savings are achieved by power-consuming lights, appliances and information technology (IT) equipment, and therefore the proportion of electricity used for power applications is lower in the LC scenario than in the BAU scenario by 2050. In 1970, the shares of residential electricity end-uses were 70% for heat and 30% for power applications. This switches to a 40% share for heat and 60% for power applications under the BAU scenario by 2050 (see Figure 7), whereas the shares are approximately reversed under the LC scenario (i.e. 55% heat and 45% power: see Figure 8).
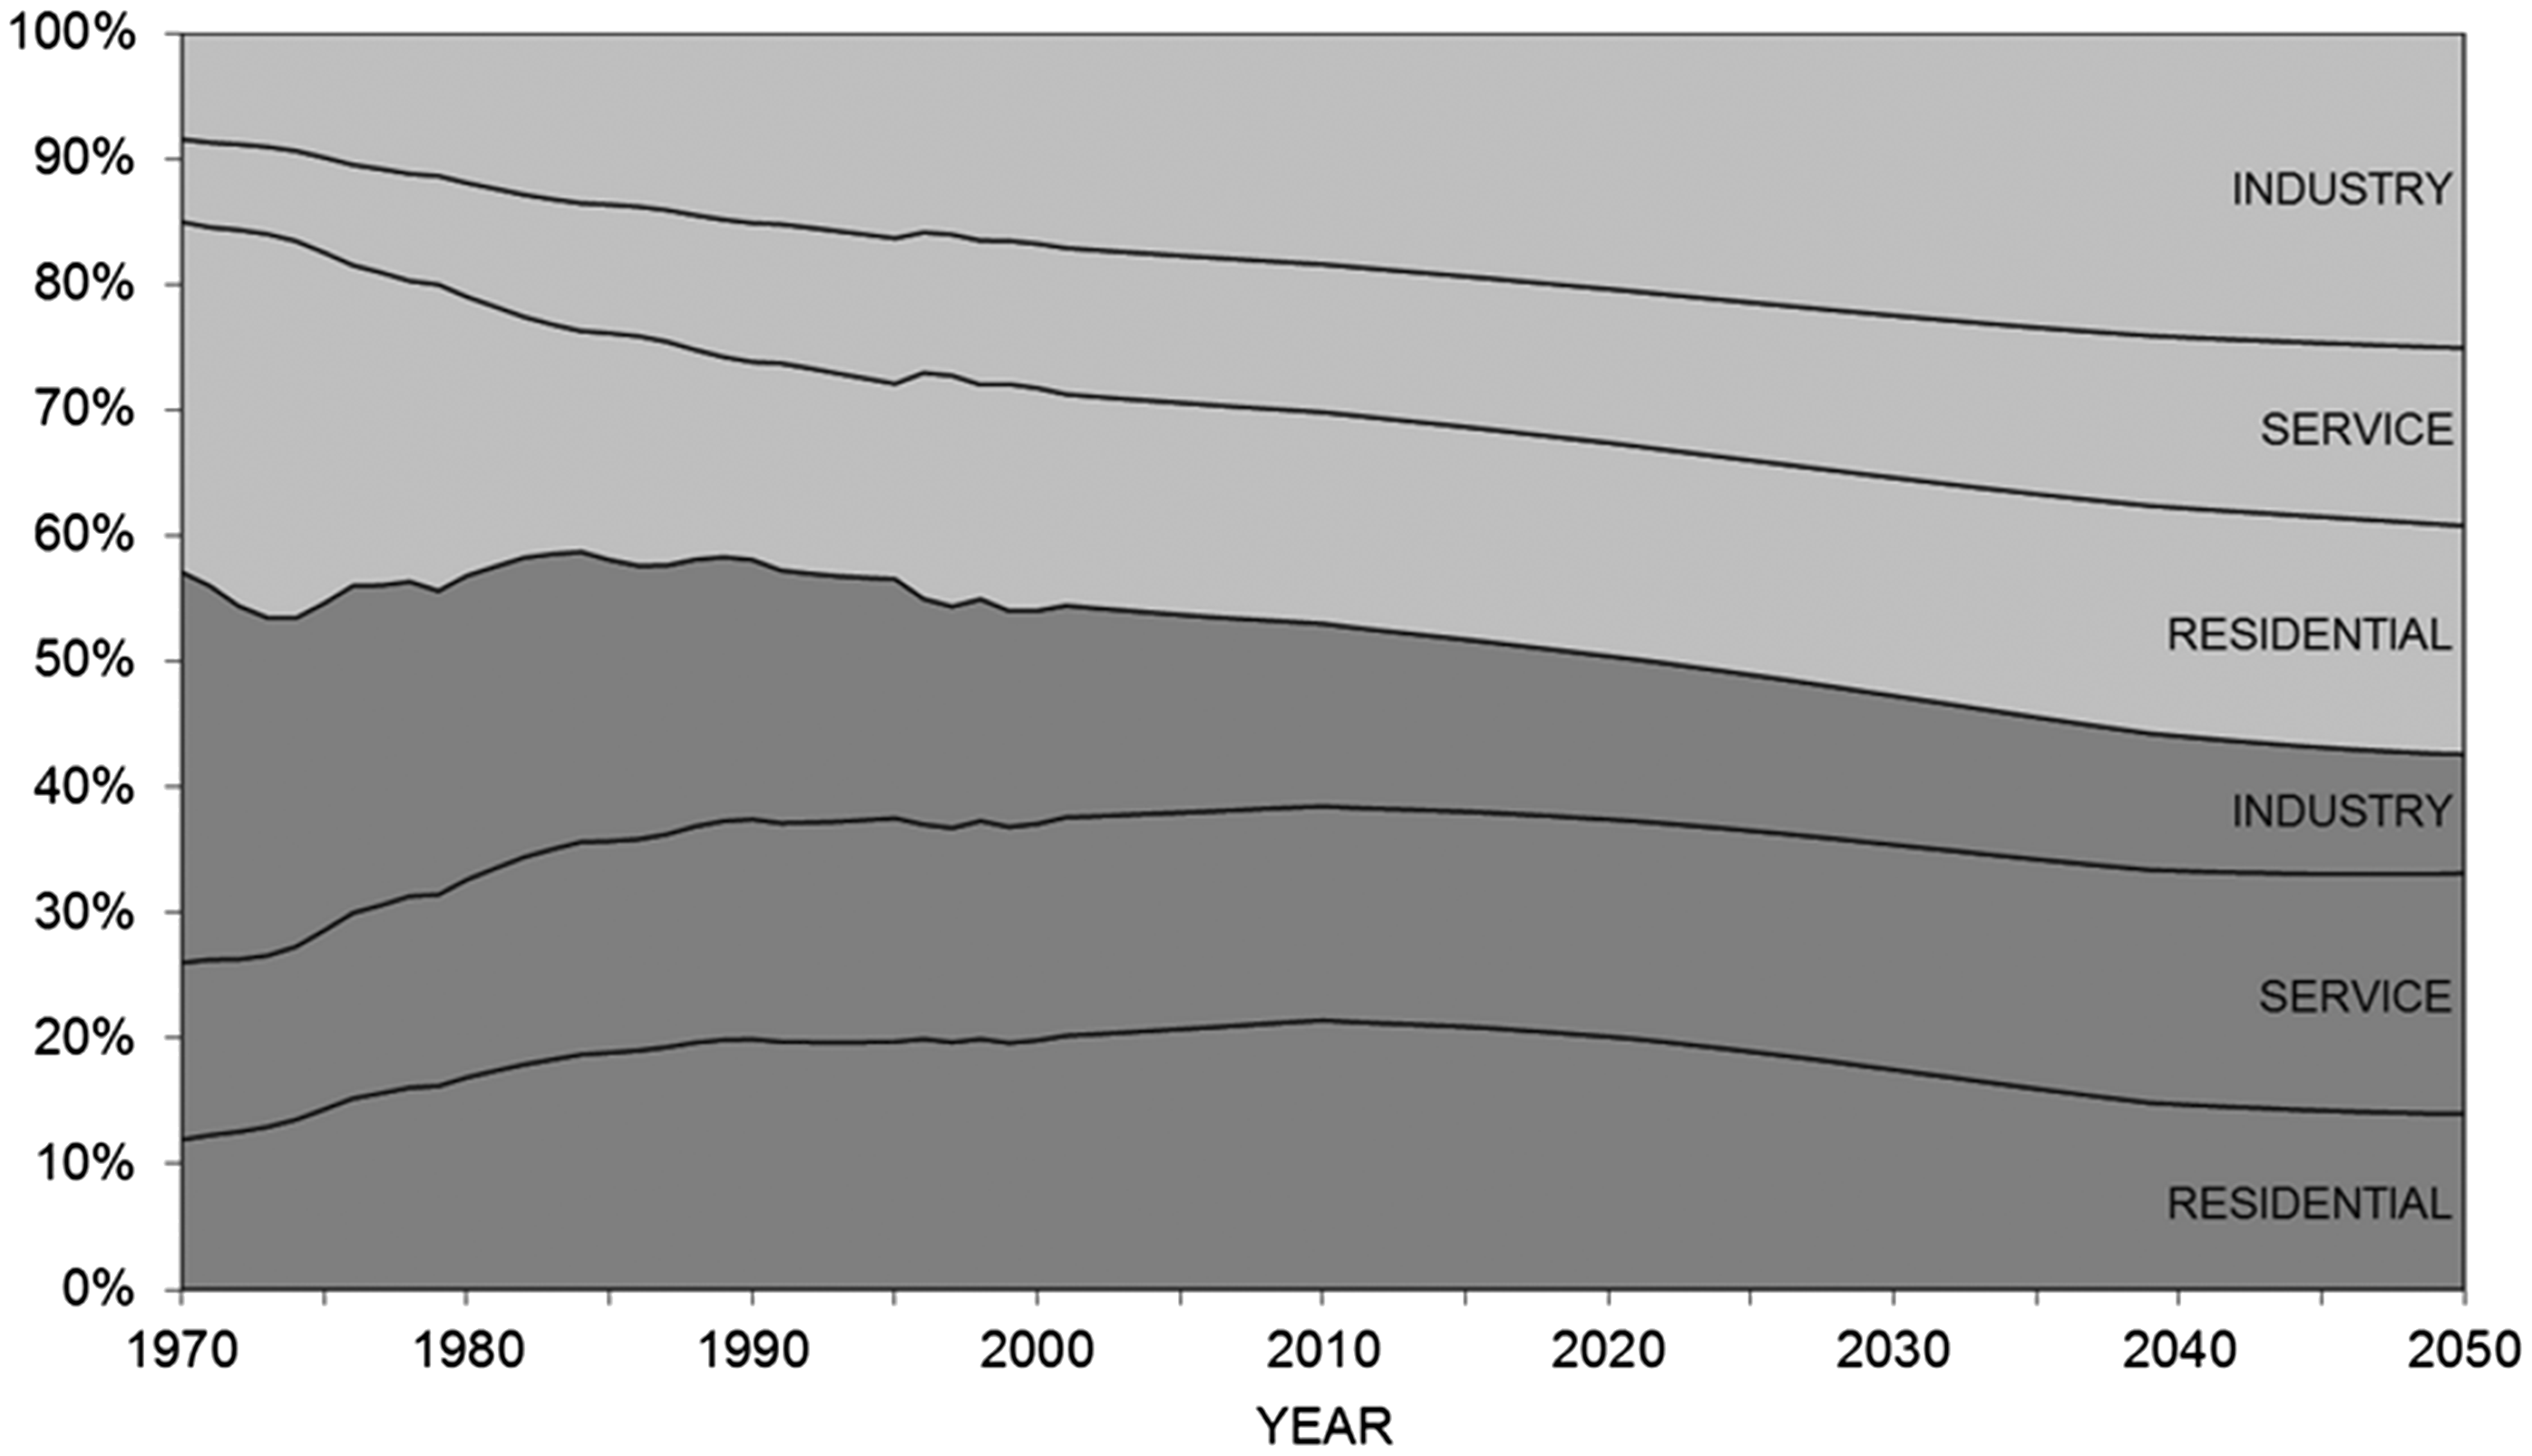
Annual UK electricity demands for the residential (or domestic), services, and industrial sectors under the ‘Business as Usual’ (BAU) scenario: 1970–2050. Annual UK electricity demands for the residential (or domestic), services, and industrial sectors under the ‘Low Carbon’ (LC) scenario: 1970–2050. Proportion (% share) of heat and power applications for each of the residential (or domestic), services, and industrial sectors under the ‘Business as Usual’ (BAU) scenario: 1970–2050. (Dark shading – power applications; lighter shading – heating applications.) Proportion (% share) of heat and power applications for each of the residential (or domestic), services, and industrial sectors under the ‘Low Carbon’ (LC) scenario: 1970–2050. (Dark shading – power applications; lighter shading – heating applications.)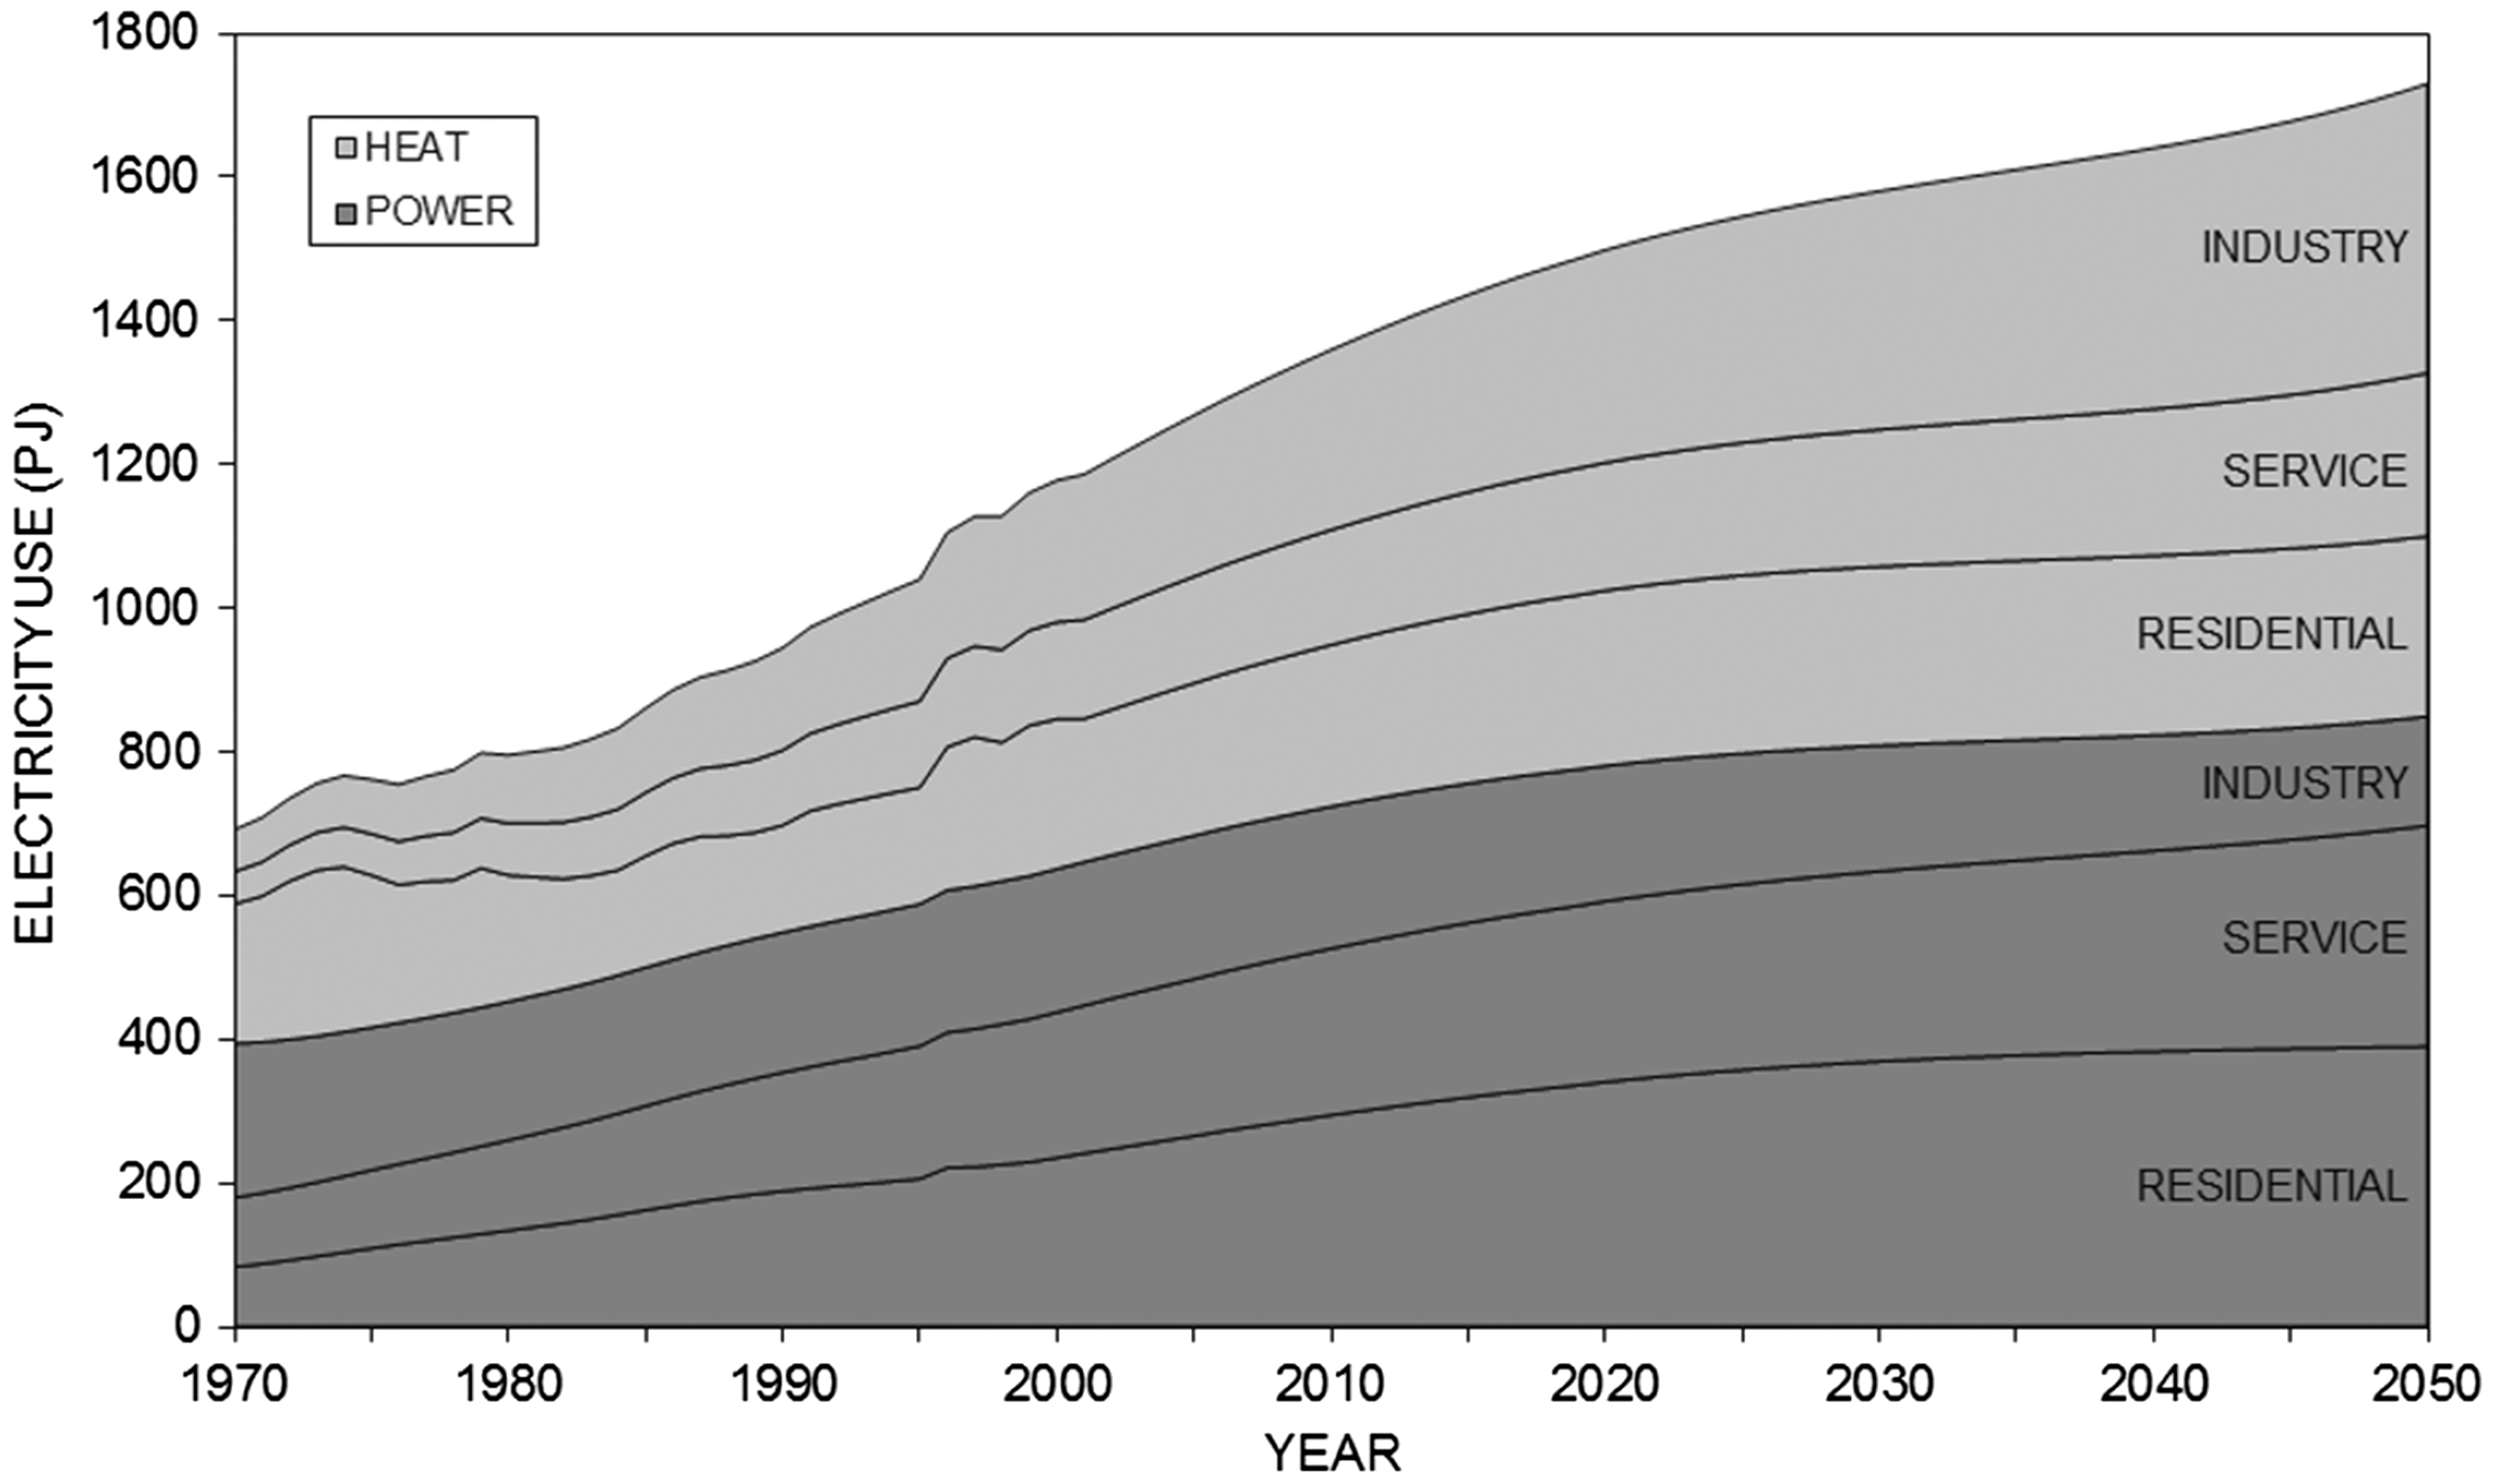
The LC scenario of Jardine and Ault 15 was originally created to investigate how the residential sector might contribute to achieving a 60% reduction in carbon emissions by 2050 (see The SUPERGEN Highly Distributed Power Systems (HDPS) scenarios section). There are other ways in which significant cuts could be achieved, and thus the LC scenario should be viewed as just one strategy amongst various possibilities. The UK Energy Research Centre (UKERC) Energy 2050 scenarios, 40 for example, involved a range of different scenarios that reach an 80% cut in carbon emissions by 2050. In many of these, residential emission savings are achieved, on the supply-side, through a combination of significant electricity decarbonisation and a shift to electricity-based heat pumps instead of gas-fired boilers for space and water heating. This is a very different vision of future heat-supply technologies within the residential sector compared to the LC scenario of Jardine and Ault, 15 where heat pumps were a marginal technology. The split between heat and power applications under the UKERC 2050 Energy Scenarios 40 would therefore be different to those presented above, although they could not be quantified here due to lack of access to the underlying UKERC data. These scenarios tend to give rise to reduced overall UK primary energy supply, but the researchers involved (see again Skea et al. 40 ) recognised uncertainties in their scenarios and modelling.
Electricity end-uses in the services sector
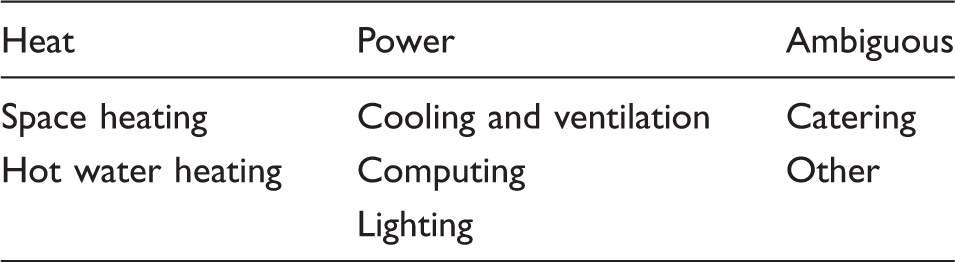
UK service sector breakdown into different end-uses into heat and power applications.
UK industrial sector breakdown of different end-uses into heat and power applications.
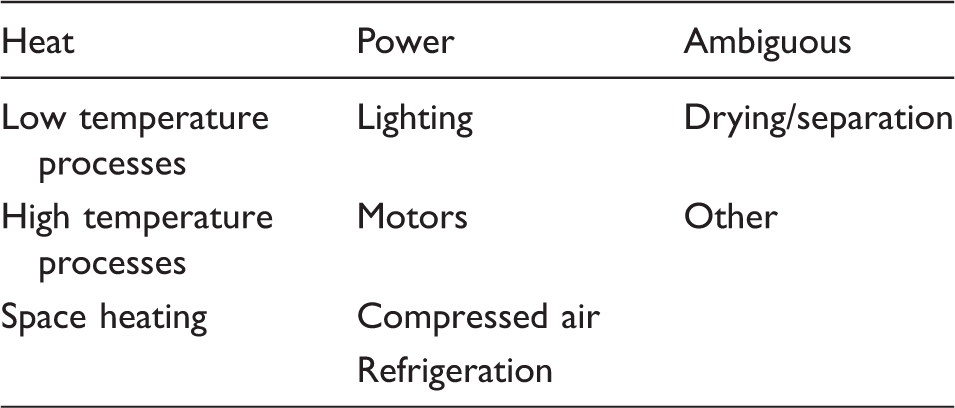
Source: categories broadly adapted from Leach et al. 34
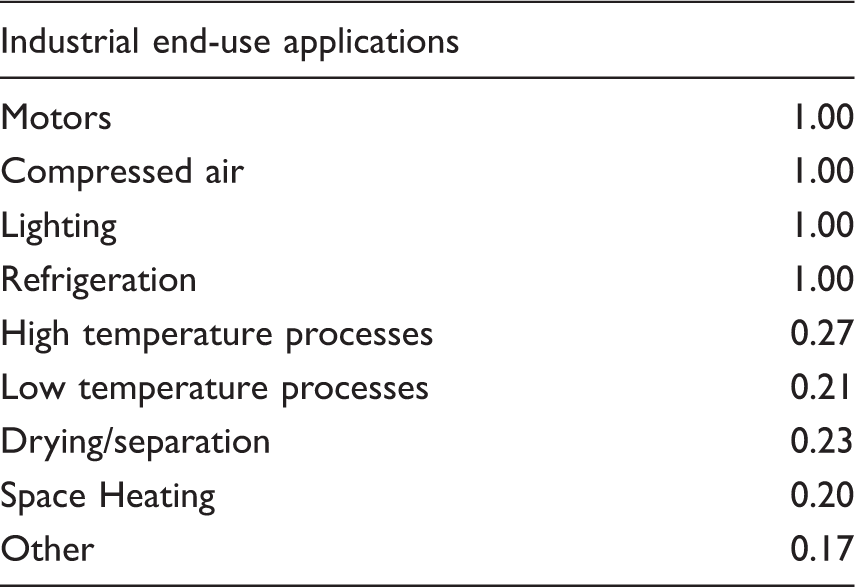
Fractions of each UK industrial sector energy end-use demand met with electricity.
Shares of UK electricity end-use demand for heat and power applications respectively (%): each decade commencement year based on historic data (1970–2010), as well as Business as Usual (BAU) and Low Carbon (LC) scenarios/projections (2020–2050).
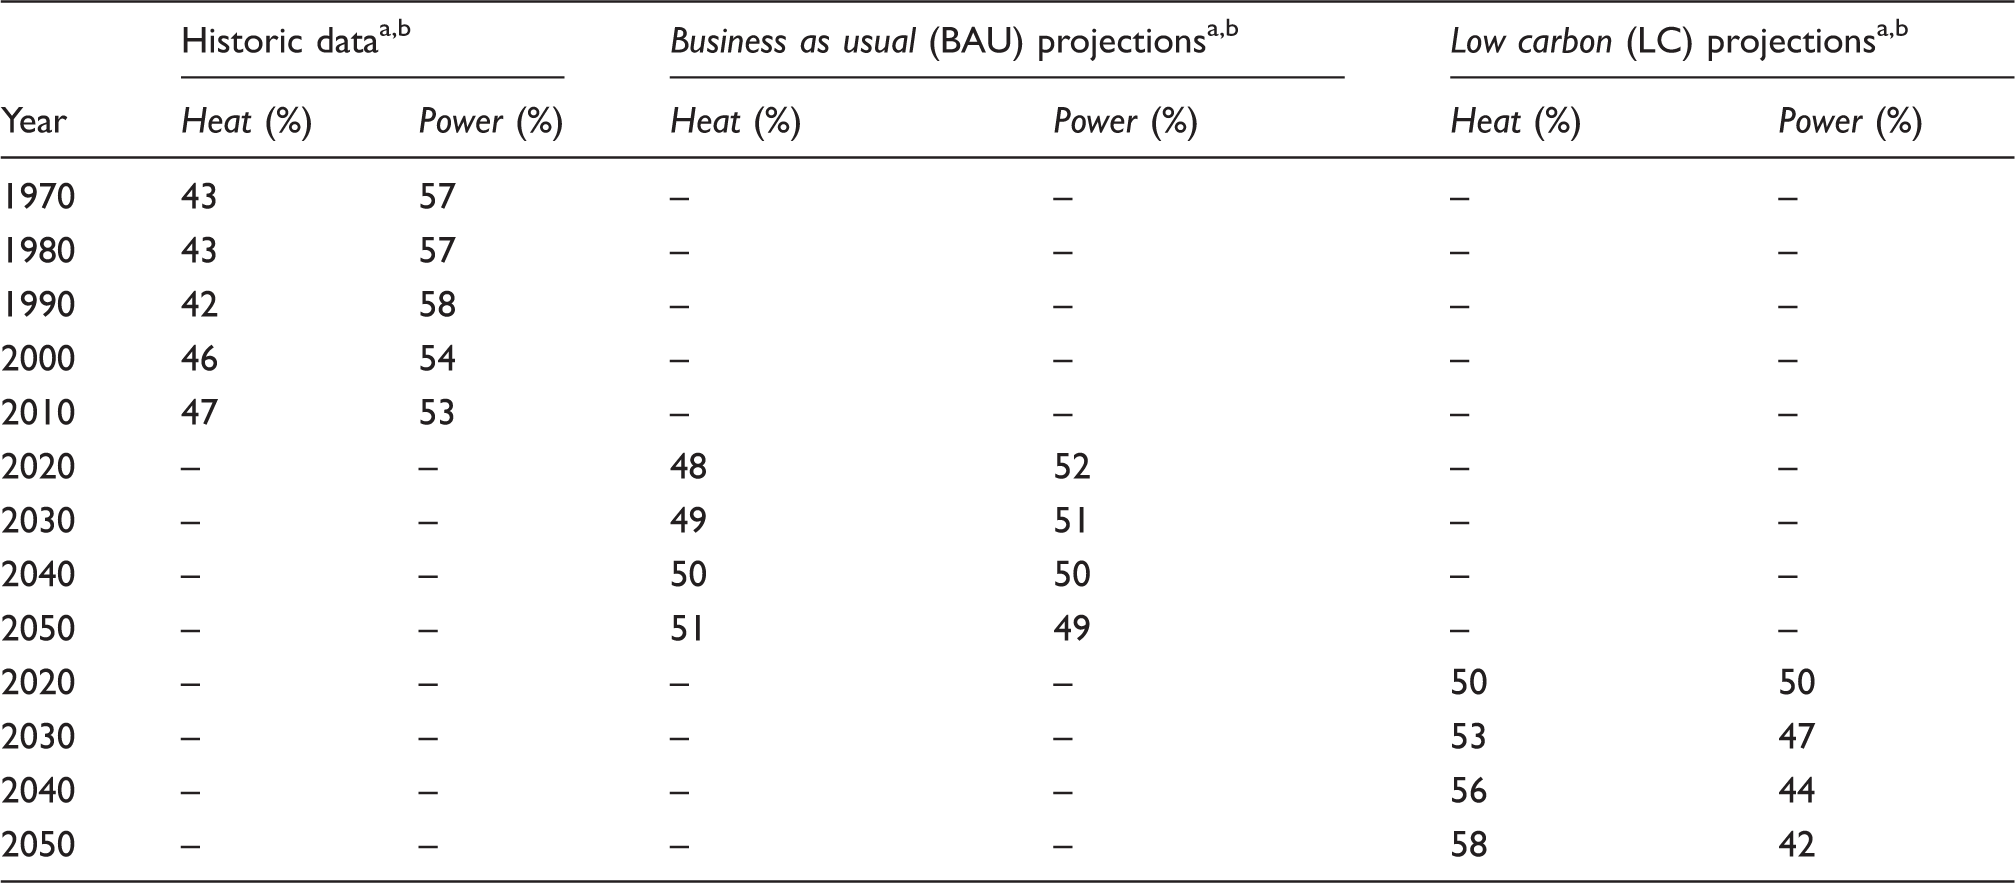
A combination of residential (or domestic), services, and industrial sectors.
Percentage shares rounded to two significant figures.
The heat/power electricity shares for the services sector were 30% and 70%, respectively, in the baseline year of 1970 (see Figures 7 and 8). Under the BAU scenario, they rise to 40% and 60% by 2010 (Figures 7), and thereafter stabilise. Similar shares are observed under the LC scenario of 45% and 55%, respectively, by 2050 (Figures 8). Thus, the end-use shares vary only a little, despite quite wide changes in overall annual electricity consumption out to 2050 as reflected by the alternative BAU and LC scenarios (see again Figures 3 and 4).
Electricity end-uses in the industrial sector
Both the studies by Leach et al. and Langley broke down electricity use in industry by various end-uses, although their categorisation was not the same. Leach et al. 34 broke energy use down into Process Energy (either steam or direct-fired, including electrochemical processes), Space and Water Heating, Motive Power and Other. Langley employed only four end uses, namely Electrochemical & Process Heat > 300℃, Process Heat < 300℃, Space Heating and Motive Power & Lighting. Only the latter category was taken to be a power application for the purpose of the current study; all others were therefore classified as heating applications. Electrochemical uses of electricity were assumed to be heating applications, because these mainly involve electrolysis and/or electric arc furnaces. Thus, the breakdown of industrial energy end-uses here is displayed in Table 3 for the various heat and power applications. ECUK 2015 33 (Table 3.10) only provides the breakdown of ESDs into (primary and secondary) fuels in a given year. Hence, the corresponding fraction of each end-use met with electricity was required. The assumed values are given in Table 4. Consequently, the assumed industrial end-use data were indirectly obtained from ECUK 2015 33 (Table 4.07), Leach et al. 34 and Langley.41,42 It should be noted that the fractional end-use demands met by electricity (displayed in Table 4) are reflections of the variation in their process temperatures. As the process temperature ratio (Tp/T0) falls, so does the corresponding value of van Gool’s thermodynamic quality (Θ): see again Figure 2.
For the industrial sector, similar differences between the Business as Usual (BAU) and Low Carbon (LC) projections 15 were observed to that found for the service sector (see Figures 5 and 6); again due to a reduction in electricity use for power applications. This fall, from 215 PJ in the baseline year of 1970 to 150 PJ under the BAU scenario in 2050 and 120 PJ under its LC counterpart, is because electricity is an attractive, versatile energy carrier that is being, and will progressively be, widely employed for efficient heating applications (such as through induction heating) and is likely to be so in the future. In 1970, the shares of industrial electricity end-uses were 20% for heat and 80% for power applications. This switches around to a 70% share for heat and 30% for power applications under both the BAU and LC scenarios by 2050 (see Figure 7). As the electricity generation system becomes decarbonised, use of electricity for heating applications will also become favourable over the direct firing of fossil (or other) fuels. In a similar manner to that observed for the services sector, the efficiency of power (e.g. motor-driven) applications is likely to improve in the next 40 years. This will therefore facilitate a reduction in power demand for the same or comparable levels of output.
Heat/power electricity shares in the three UK end-use sectors
Estimates for the split between heat and power applications of electricity in three end-use electricity demand sectors examined here [residential (or domestic), services, and industrial] during the period 1970–2050 were estimated on the basis of the historical data from ECUK 2015 33 and two HDPS SUPERGEN scenarios of Jardine and Ault. 15 In the baseline year of 1970, the total electricity end-use for heat amounted to 300 PJ (see Figures 5 and 6) rising to 625 PJ in 2010. The corresponding figures for power application were 395 PJ in 1970 and 720 PJ in 2010, respectively. Under the BAU scenario (see Figure 5), the electricity end-use for heat was projected to be 715 PJ in 2050, whereas that under the LC scenario (see Figure 6) was estimated to be 875 PJ. Thus, both heat and power end-uses of electricity were projected to more than double between 1970 and 2050 under the BAU scenario. In contrast, the electricity end-use for power applications is seen to fall between 2010 and 2050 from 705 PJ to 520 PJ under the LC scenario (see Figure 6), whereas the end-use for heat roughly doubles. Nevertheless, a differential shift can be observed (see again Figures 5 and 6) between electricity end-uses within the residential, services and industrial sectors over the period 2010–2050. Power applications decline in services, for example, but increase within the industrial sector.
The results of the present study indicate that the heat/power electricity shares for the combination of the three UK end-use demand sectors representing residential (or domestic), services, and industrial demands (see Figures 7 and 8, as well as the summary data in Table 5) vary only a little, despite quite wide changes in overall annual electricity consumption out to 2050 as reflected by the alternative BAU and LC scenarios (see again Figures 3 and 4). The consequent share of heat met by electricity is projected to rise from 47% to just 51% under the BAU scenario compared to 47–58% under the corresponding LC projection. It was found that the proportion of electricity used to meet these end-use heat demands in the three sectors examined were quite high (∼50–60%) and that these shares are insensitive to the precise nature of the forward projections (forecasts, transition pathways or scenarios). The overall accuracy of the heat-to-power shares in each UK sector was found to be of the order of ±13% for the historic data (1970–2010).
Concluding remarks
The end-use of electricity in the home, in the service sector, in industry, and the UK economy generally has been examined in order to estimate how much is used for heat and power. It is wasteful in thermodynamic terms to convert fuels to electricity only to employ it for heating (see the Electricity generation and use section). If process or space heating is required, then Hammond 1 argued that it is far more efficient to burn fossil fuels (for example) directly to produce heat. This argument is certainly valid for today’s energy sector, although in future energy systems (that may be dominated by renewable energy technologies) the case is less clear. Electric resistance heating could play a minor role in future if the ambitious 80% carbon reduction target for 2050 is to be met, although the majority of electric heating would be based on heat pumps. 43 In addition, electric heating possesses several advantages that make it particularly attractive for integrating fluctuating and partly unpredictable renewable electricity, especially its high degree of controllability and instantaneity.
The share of electricity employed for heat and power applications has therefore been studied here in a recent historical context (from a baseline of 1970) and with the aid of two HDPS scenarios for the future development of the UK electricity system. 15 This historic database and the alternative projections have been also used to evaluate the variation in the heat/power share of end-use electricity out to 2050. The two HDPS SUPERGEN scenarios employed in the present study, namely the ‘Business As Usual’ (BAU) and ‘Low Carbon’ (LC) futures, yielded possible UK electricity demands out to 2050 (see again Figures 3 and 4). Alderson et al., 5 who examined the carbon and environmental footprints stemming from all three HDPS scenarios, observed that the LC and ‘Deep Green’ (DG) scenarios gave rise to quite similar trajectories over the period 2010–2050. Consequently, it was felt that only one of the two ‘greener’ energy scenarios needed to be examined here. [These HDPS scenarios are qualitatively not unlike the UK low carbon transition pathways 3 termed ‘Market Rules’ (MR) and ‘Thousand Flowers’ (TF), respectively, although the drivers and modelling details clearly differ.]
The results of the present study indicate that the heat/power electricity shares for the combination of the three UK end-use demand sectors representing residential (or domestic), services, and industrial demands (see again Figures 7 and 8, as well as the summary presented in Table 5) vary only a little, despite quite wide changes in overall annual electricity consumption out to 2050 as reflected by the alternative BAU and LC scenarios (see Figures 3 to 6). Thus, over the period 2010–2050, the share of heat met by electricity rises from approximately 45% to just 50% under the BAU scenario, compared to 45–60% under the corresponding LC projection (Table 5, rounded figures). It may therefore be concluded that, first, these shares are insensitive to the precise nature of the forward projections (forecasts, transition pathways or scenarios) and, second, that the proportion of electricity used to meet end-use heat demands in the three sectors examined here are quite high (50–60%, again rounded). The overall accuracy of these UK end-use heat-to-power shares was found to be of the order of ±13% for the historic data (1970–2010), although significant uncertainties are attached to these shares by 2050. The most important of these is probably the lack of granularity on the demand side, which does not allow a considering of energy service demands and the underlying trends that drive them into the future.
The thermodynamic property known as ‘exergy’ (derived from the First and Second Laws) reflects the ability to undertake work,8,9,17–19,23–30 particularly the use of electricity within an energy system or across the economy. However, it does not represent well heating processes within an energy sector. Heat has a variable thermodynamic quality depending on the ratio of the process temperature to the environmental temperature or datum (see again Figure 29). Where end-use heat demands are met by electricity, energy and exergy analysis should therefore be performed in parallel in order to accurately reflect the interrelated constraints imposed by the First and Second Laws. The proportion of electricity required for this purpose was found to be ∼50–60% in the present study. That is a significant amount of end-use power consumption in the three UK demand sectors considered here: across households, services, and industry. It is for this reason that the UK Government and its energy and climate change advisory bodies7,14,33,44 have recently taken a keen interest in the provision of heat services in Britain. An understanding of the actual end-uses for electricity as studied here, for the first time over this timeframe as far as the authors are aware, will enable policy makers to take account of the implications of a greater end-use of electricity in the future.
One key assumption underlying the methodology is that the future trends in the heat/power ratio in various sectors are the same as in the past. In particular, there are inherent uncertainties associated with developments in energy prices, energy-political frameworks, etc., which could all result in a much different future than the one embodied in scenarios. In addition, it is very challenging to anticipate the so-called ‘game changers’, ‘shocks’ or ‘tipping points’ 3 within the energy system that could fundamentally transform its structure and operation. One obvious example is batteries, 45 which at the time of writing are just becoming economical. This, combined with the ‘grid parity’ of PV electricity, i.e. its (levelised) generation costs being at or below the price of grid electricity, makes attempts at part or complete electrical autonomy economically attractive from an end-user perspective. Whilst the diffusion of such autonomous energy ‘pockets’ in the future would not drastically change the findings of the present work, it could make the use of self-generated electricity for heat and power applications more economical and thus attractive.
Footnotes
Acknowledgements
The authors are grateful for the interaction with other members of these various consortia made up of participants from many UK universities. Prof. Hammond presented early results of this work at the E.On UK Engineering Research Centre at Ratcliffe on Soar in Nottinghamshire and to the Ofgem Sustainability Team in London, both in conjunction with the research programme of the Realising Transition Pathways Consortium. However, the views expressed here are those of the authors alone, and do not necessarily reflect the views of the collaborators or the policies of the funding bodies. The authors’ names are listed alphabetically.
Declaration of Conflicting Interests
The author(s) declared no potential conflicts of interest with respect to the research, authorship, and/or publication of this article.
Funding
The author(s) disclosed receipt of the following financial support for the research, authorship, and/or publication of this article: The research reported here was partially supported by a series of UK research grants awarded by the UK Engineering and Physical Sciences Research Council (EPSRC), originally as part of the SUPERGEN ‘Highly Distributed Power Systems’ (HDPS) Consortium (grant no. GR/T28836/01, for which Prof. Hammond was a co-investigator). Dr Allen’s doctoral research was funded under this grant. It was renewed in 2009 as the ‘Highly Distributed Energy Futures’ (HiDEF) Consortium (grant no. EP/G031681/1, for which Prof. Hammond was again a co-investigator). During the preparation of this piece, Prof. Hammond jointly led a large consortium of nine university partners funded by the EPSRC entitled ‘Realising Transition Pathways: Whole Systems Analysis for a UK More Electric Low Carbon Energy Future’ [under Grant EP/K005316/1]. He also led a small consortium of three university partners studying ‘Industrial Energy Use from a Bottom-up Perspective’ funded by the UK Energy Research Centre (UKERC) [under the Phase 2 Grant NE/G007748/1]. Dr McKenna’s doctoral research was also funded via an interdisciplinary studentship awarded by UKERC. Finally, Prof. Hammond continues to work in the field of industrial energy use and carbon emissions reduction supported by the EPSRC ‘End Use Energy Demand’ (EUED) Programme, as a Co-Director of the Centre for Industrial Energy, Materials and Products (CIE-MAP) (grant no. EP/N022645/1); a national research centre made up of four university partners studying the potential for reducing industrial energy and material use in supplying UK needs.