
Abstract
Internationally, there has been a move by nations to decarbonise their electricity systems in an effort to tackle rising territorial emissions. No consensus has been fully reached on best approach, which has led to significant divergence in energy policy between countries and a consequential lack of long-term clarity. Additionally, recent UK policy failures, in terms of stimulating greater energy efficiency and encouraging energy innovation, highlight the huge challenge involved in developing and achieving a low carbon future. Steps to decarbonise electricity whilst also providing a secure and affordable supply, can lead to varying life-cycle environmental consequences. A UK research consortium developed three pathways to explore this move to a more electric low carbon future out to 2050. These pathways have been previously evaluated in terms of their life-cycle energy and environmental performance within a wider sustainability framework. Over the course of the project, greater understanding of the generation technologies and the functionality of the overall system under the different regimes were gained. Here, the environmental consequences of the most recent version of the pathways are presented on a life-cycle basis from ‘cradle-to-gate.’ Thus, the environmental impact of technological trends in UK energy policy and their effect on the pathways are explored through a series of sensitivity analyses. The three UK energy futures incorporating ‘disruptive’ technological options were examined based on the phase out of coal use in favour of gas-fired power, ranging penetration levels of carbon capture and storage, and the allocation and fuel type used for combined heat and power. Recommendations are proposed to help frame future energy policy choices in order to limit the environmental consequences of future electricity systems.
Keywords
Introduction
Over the past decade, energy policy in the United Kingdom has been driven by three fundamental objectives, which are to deliver an affordable, secure and sustainable energy system, more commonly known as the ‘energy trilemma.’1,2 The relative importance of each objective has changed over time leading to various energy policy shifts. 3 Since the Climate Change Act in 2008, climate change mitigation has received substantial attention. 4 This Act places a legal obligation on the UK government for an 80% reduction in greenhouse gas (GHG) emissions from a 1990 baseline across the economy by 2050. Significant progress has been made in the interim period, which saw renewable sources grow to 7% of total energy consumed. 5 This rise was mainly the result of a series of green policy instruments implemented to support the growth of renewable energy; such as, the Feed-in Tariff scheme, Renewables Obligation, and Renewable Heat Incentive. As a result, national territorial GHG emissions are 36% lower than 1990 levels. 6
Decarbonisation of the electricity sector has played a central role in reducing the UK’s GHG emissions, through initial fuel-switching from coal to natural gas, followed by the recent influx of renewables. 7 The Committee on Climate Change (CCC), an independent, statutory body providing evidence-based advice to the UK Government and Devolved Administrations, has long advocated that early decarbonisation of this sector is crucial in order to meet the UK climate change targets, with all associated GHG emissions largely eliminated by 2050.7,8 Currently, the electricity sector still accounts for 122Mt CO2e, equating to 24% of total UK GHG emissions. 9 Recent energy policy announcements have seen the focus shift from climate change, towards affordability and security,3,10 in response to rising energy prices, economic recession and energy security concerns. Nonetheless, the UK government remain committed to targets, and are currently developing legislation for the fifth carbon budget. 7
A succession of green policy interventions have been reversed in recent months 11 to make way for a new direction, or ‘reset,’ for UK energy policy 10 (particularly regarding electricity generation). The UK Energy and Climate Change Secretary, Amber Rudd, recently announced that all unabated coal-fired power stations were to close by 2025, and that their usage would be restricted from the year 2023, in order to reduce GHG emissions. 10 This would represent a seismic shift for the UK power sector, as coal generation currently accounts for 30% of total UK electricity generation. 5 Following the government’s Autumn Spending Review, the Department of Energy and Climate Change (DECC) have also scrapped a £1 billion funding competition aimed at bringing commercial-scale carbon capture and storage 12 to market in the United Kingdom. 13 This move was seen as a major setback for the UK CCS industry, raising serious doubts over its future, halting the progress of all planned UK carbon capture projects. 12 The implications of such energy policy shifts on both climate change targets, and wider environmental concerns have yet to be determined, although it is widely recognised (by bodies like the CCC and the public-private Energy Technologies Institute) that the potential national costs of carbon mitigation could double without CCS. 9
Deeper decarbonisation of the electricity sector is envisaged to be achieved through the increased use of bioenergy.14–16 Bio-sourced alternatives can be substituted for all fossil fuels, reducing society’s dependency whilst also reducing their GHG emissions, and providing necessary back-up to more intermittent renewables.16,17 The deployment of combined heat and power (CHP) fuelled by biofuels is predicted to grow over the coming years in the United Kingdom, as measures are taken to decarbonise both the heat and electricity sector. 18 Its high fuel efficiency helps maximise the exploitation of a bioenergy resource. However, developing a long-term policy framework to incentivise large-scale bioenergy supply chains, which are both sustainable and economical, has proven to be a difficult undertaking. 19 This lack of policy certainty adds to the uncertainty over the availability of sustainable biomass resources, and makes it challenging to both suggest how this sector may develop and to forecast which bioenergy pathways will prove most effective.
The contribution of this paper is to provide a wider understanding of the potential environmental life-cycle consequences associated with large technological policy shifts in a decarbonising electricity system. In parallel, the implications of the resulting systemic change in delivering the Nation’s long-term carbon targets were also explored. The merits of enacting potential policy shifts have been investigated in this paper from an environmental perspective, particularly in the context of electricity system undergoing a major transformation. Previous research in this area has primarily focused on examining uniform technological trajectory change20,21 to meet a specific climate policy objective. Consequently, the impact of shifting energy policies on the development of future electricity generation systems, have been largely overlooked.
Three socio-technical energy scenarios for the United Kingdom, known as the Transition Pathways, were employed to explore the impact of these policy shifts on the future UK electricity sector. The pathways were developed to examine low-carbon electricity system futures for the United Kingdom under different governance arrangements. 1 The result was three vastly different pathways to deliver a low carbon transition. As such, they allowed a wide range of potential implications of energy policy shifts to be evaluated. Energy scenarios are often misinterpreted as the only possible futures. Instead, they should been seen as a set of pathways ‘indicative of a spectrum of possibilities’ for the future; a spectrum which would be impossible to fully cover and adequately interpret. 22 Energy scenarios cannot reflect the full complexity of an evolving energy system (a limitation they share with economic forecasts) and, therefore, must not be used to provide exact projections. 23 Nonetheless, they are the best available tool to assess the scale of necessary transformation to support policy. 23 They allow useful information to be deduced about the potential risks and benefits of a particularly policy or investment strategy in the face of an uncertain or undetermined future.22,23 It has been widely recognised in energy research that there is a limit to how many scenarios can be understood and contrasted by policymakers and other stakeholders at the same time. 24 Hence, a smaller set of scenario are often chosen to be explored in greater detail, which are more manageable and easier to interpret for policymakers. This approach has been employed by many high profile scenario studies undertaken by bodies such as Intergovernmental Panel on Climate Change (IPCC), 25 the UK Government’s Committee on Climate Change (CCC), 9 its Department of Energy & Climate Change (DECC), 26 the public-private Energy Technologies Institute27,28 and the UK grid system operator, National Grid. 29 Similarly, the Transition Pathways have been used in this paper to help indicate the long-term impact of policy shifts on a range of UK energy futures to support policy-making.
The environmental impact of shifting technological trends in UK energy policy and their effect on the pathways are examined through a series of sensitivity analyses. The three UK energy futures were assessed incorporating different energy policy options, such as, the phase out of coal use in favour of gas-fired power, ranging penetration levels of CCS, and different bioenergy supply chain for renewable CHP plants. These sensitivities analyses do not attempt to predict the full response of the system to these policy shifts but rather provide an indication of their potential environmental consequences for the future UK electricity sector. This work builds on the previous environmental life-cycle appraisal of the Transition Pathways,30,31 which has been enhanced in the interim. The lifecycle environmental impacts of these pathways were first fully evaluated in order to act as a base reference case for comparison, denoted in this paper as the ‘original’ pathway.
Whilst this analysis has been carried out in a UK context, its findings and insights have international relevance for other electricity systems, particularly within industrialised countries. Similar shifts in energy policy may be witnessed internationally as the world’s energy supply transforms in an effort to mitigate climate change. The findings of this paper could help to frame future energy policy choices in order to limit the environmental impact of the future electricity systems.
The paper begins with a brief introduction to the development of the Transition Pathways in the upcoming section, followed by a description of the methodology and assumptions. The results of the environmental assessment of the original pathways are presented later, followed by the results of the series of sensitivity analyses to assess the environmental consequences of these energy policy shifts. Finally, the implications of these results for the future UK electricity sector are discussed in the last section.
Development of the Transition Pathways
Transition Pathways overview: Adapted from Foxon. 1
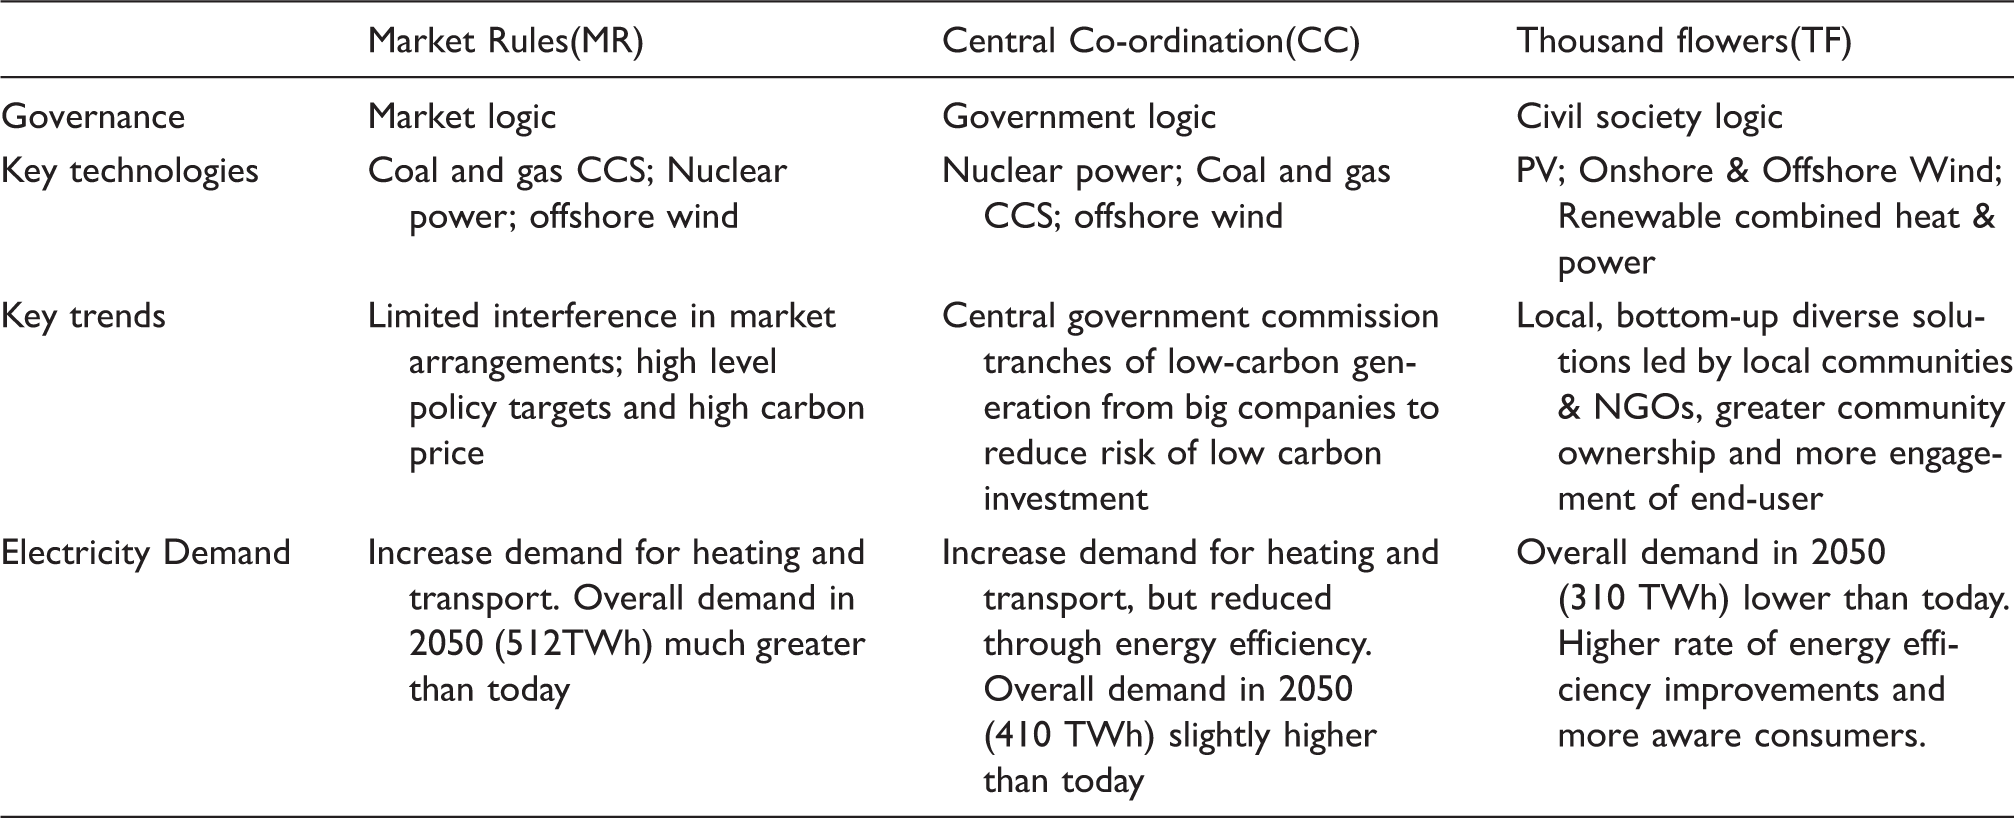
The three Transition Pathways storylines were first developed through stakeholders’ workshops, including representatives from policy, energy companies and non-governmental organisations. 32 A more detailed account of their development can be found here,1,33 with the full storylines available online. 34 The technical elaboration of these storylines were subsequently carried out by an interdisciplinary team (known as the Technical Elaboration Working Group) to provide quantitative representation of the storyline, expanding and further developing the socio-technical storylines in order to support detailed technical examination of these energy futures.
An iterative approach was taken to produce a quantitative representation of the storyline, feeding in findings from ongoing research, to develop increasingly encompassing quantitative representation, which was more coherent and consistent. Two main interdisciplinary research streams were used to interrogate the initial quantitative representation of pathways. Firstly, a spectrum of cross-scale quantitative models (used to investigate and evaluated the pathways) was systematically linked to the central coordination storyline. 35 The system boundaries and depth of analysis covered by these models were mapped, and the main area of expertise of each model was identified. The models were then tuned to match a set of harmonised assumption in line with the storyline, to allow inconsistencies in modelled results to be identified. Secondly, a detailed interdisciplinary assessment of the Thousand Flowers pathway, outlining the technical and institutional transformation required to support a move from a centralised to this highly distributed energy system. 17 The feasibility of this latter pathway was determined through a succession of interdisciplinary workshops, including input from community groups, OFGEM and external academics. The findings from this work were consolidated with insights from individual researchers’ work across the project. Together they were utilised to guide the next iteration of the quantitative representation for all three pathways.
The identified irregularities and weaknesses were consolidated by the Technical Elaboration Working Group to produce a final quantitative representation of the pathways version 3.2 (which acts as the reference case in this paper). The resulting pathways were far superior, comprehensive and more technically robust. Modifications which had a direct impact on the environmental performance of UK energy futures were: improved modelling of industrial CHP, increased installation rates for renewables (such as solar and offshore wind, reflecting more recent trends); greater back-up generation included to balance the system; more detailed modelling of community and micro CHP; the incorporation of alternative CHP fuel sources; new treatment of transmission and distribution system losses, and better representation of electricity demand on generators (particularly in regard to pumped storage).
Energy and environmental appraisal of the Transition Pathways
The environmental impact of the three Transitions Pathways (v3.2) (Market Rules (MR), Central Coordination (CC) and Thousand Flowers (TF)) for more electric low carbon futures were assessed by means of energy analysis and environmental life-cycle assessment (LCA). LCA is an environmental management tool that quantifies the environmental impacts of a product, or system over its entire life cycle.36,37 Every stage of the life cycle is systematically analysed from resource acquisition, production, through use and disposal.38,39 This holistic approach, encompasses every stage, over a wide range of environmental impact categories, makes it a very useful comparative tool; potentially circumventing problem-shifting. 40 Energy analysis was conducted in parallel to LCA, accounting for the quantity of energy been consumed across the life cycle, differentiating its origin between non-renewable (e.g. fossil fuel) and renewable energy resources.
The appraisal of the Transition Pathways and their associated environmental burdens were evaluated, by means of two functional units; in terms of 1 kWh of electricity produced, and related to the UK total electricity demand (e.g. in TWh). The system boundaries of this assessment were defined as ‘cradle-to-gate’ electricity provision (as shown in Figure 1). The ‘cradle-to-gate’ system boundaries included all upstream processes from material extraction, manufacturing, transportation and construction of the power plant. The downstream boundary was effectively taken as the point of electricity end-use: delivery to the home, the commercial service provider or to the factory. A range of assessment indicators were employed to quantify the environmental impact of the pathways with primary focus given to indicators such as GHGs and cumulative energy demand (CED). The global warming potential (GWP) of GHGs was measured in kilograms of CO2 equivalent (kgCO2eq) and benchmarked in accordance with figures published by the IPCC
25
(in their Fifth Assessment Report (AR5) of 2013) over a 100-year time horizon. The ReCiPe life-cycle impact assessment methodology was used in this study, employing 18 midpoint indicators, in order to account for wider environmental concerns (See Table SI_2 for overview of these indicators and their reference units).
41
This methodology accounts for the GWP of GHGs (under the climate change category) in accordance with figures originally reported by the IPCC
42
(in their Fourth Assessment Report (AR4) of 2007); again on a 100-year time horizon. The AR4 GWPs were retained here (in contrast to the AR5 results), in order to assess the impact of advancing climate change science on the GHG intensity of the UK electricity sector. One of most significant changes made by IPCC between their AR4 and AR5 reports was the increase of the GWP of fossil methane from 25 gCO2eq over a 100 year time horizon to 34 gCO2eq for biogenic methane,
25
and to 36 gCO2eq for fossil methane; this implies that it is a far more potent GHG than previously realised.
System boundary diagram for the life-cycle assessment of UK electricity provision from ‘cradle to gate.’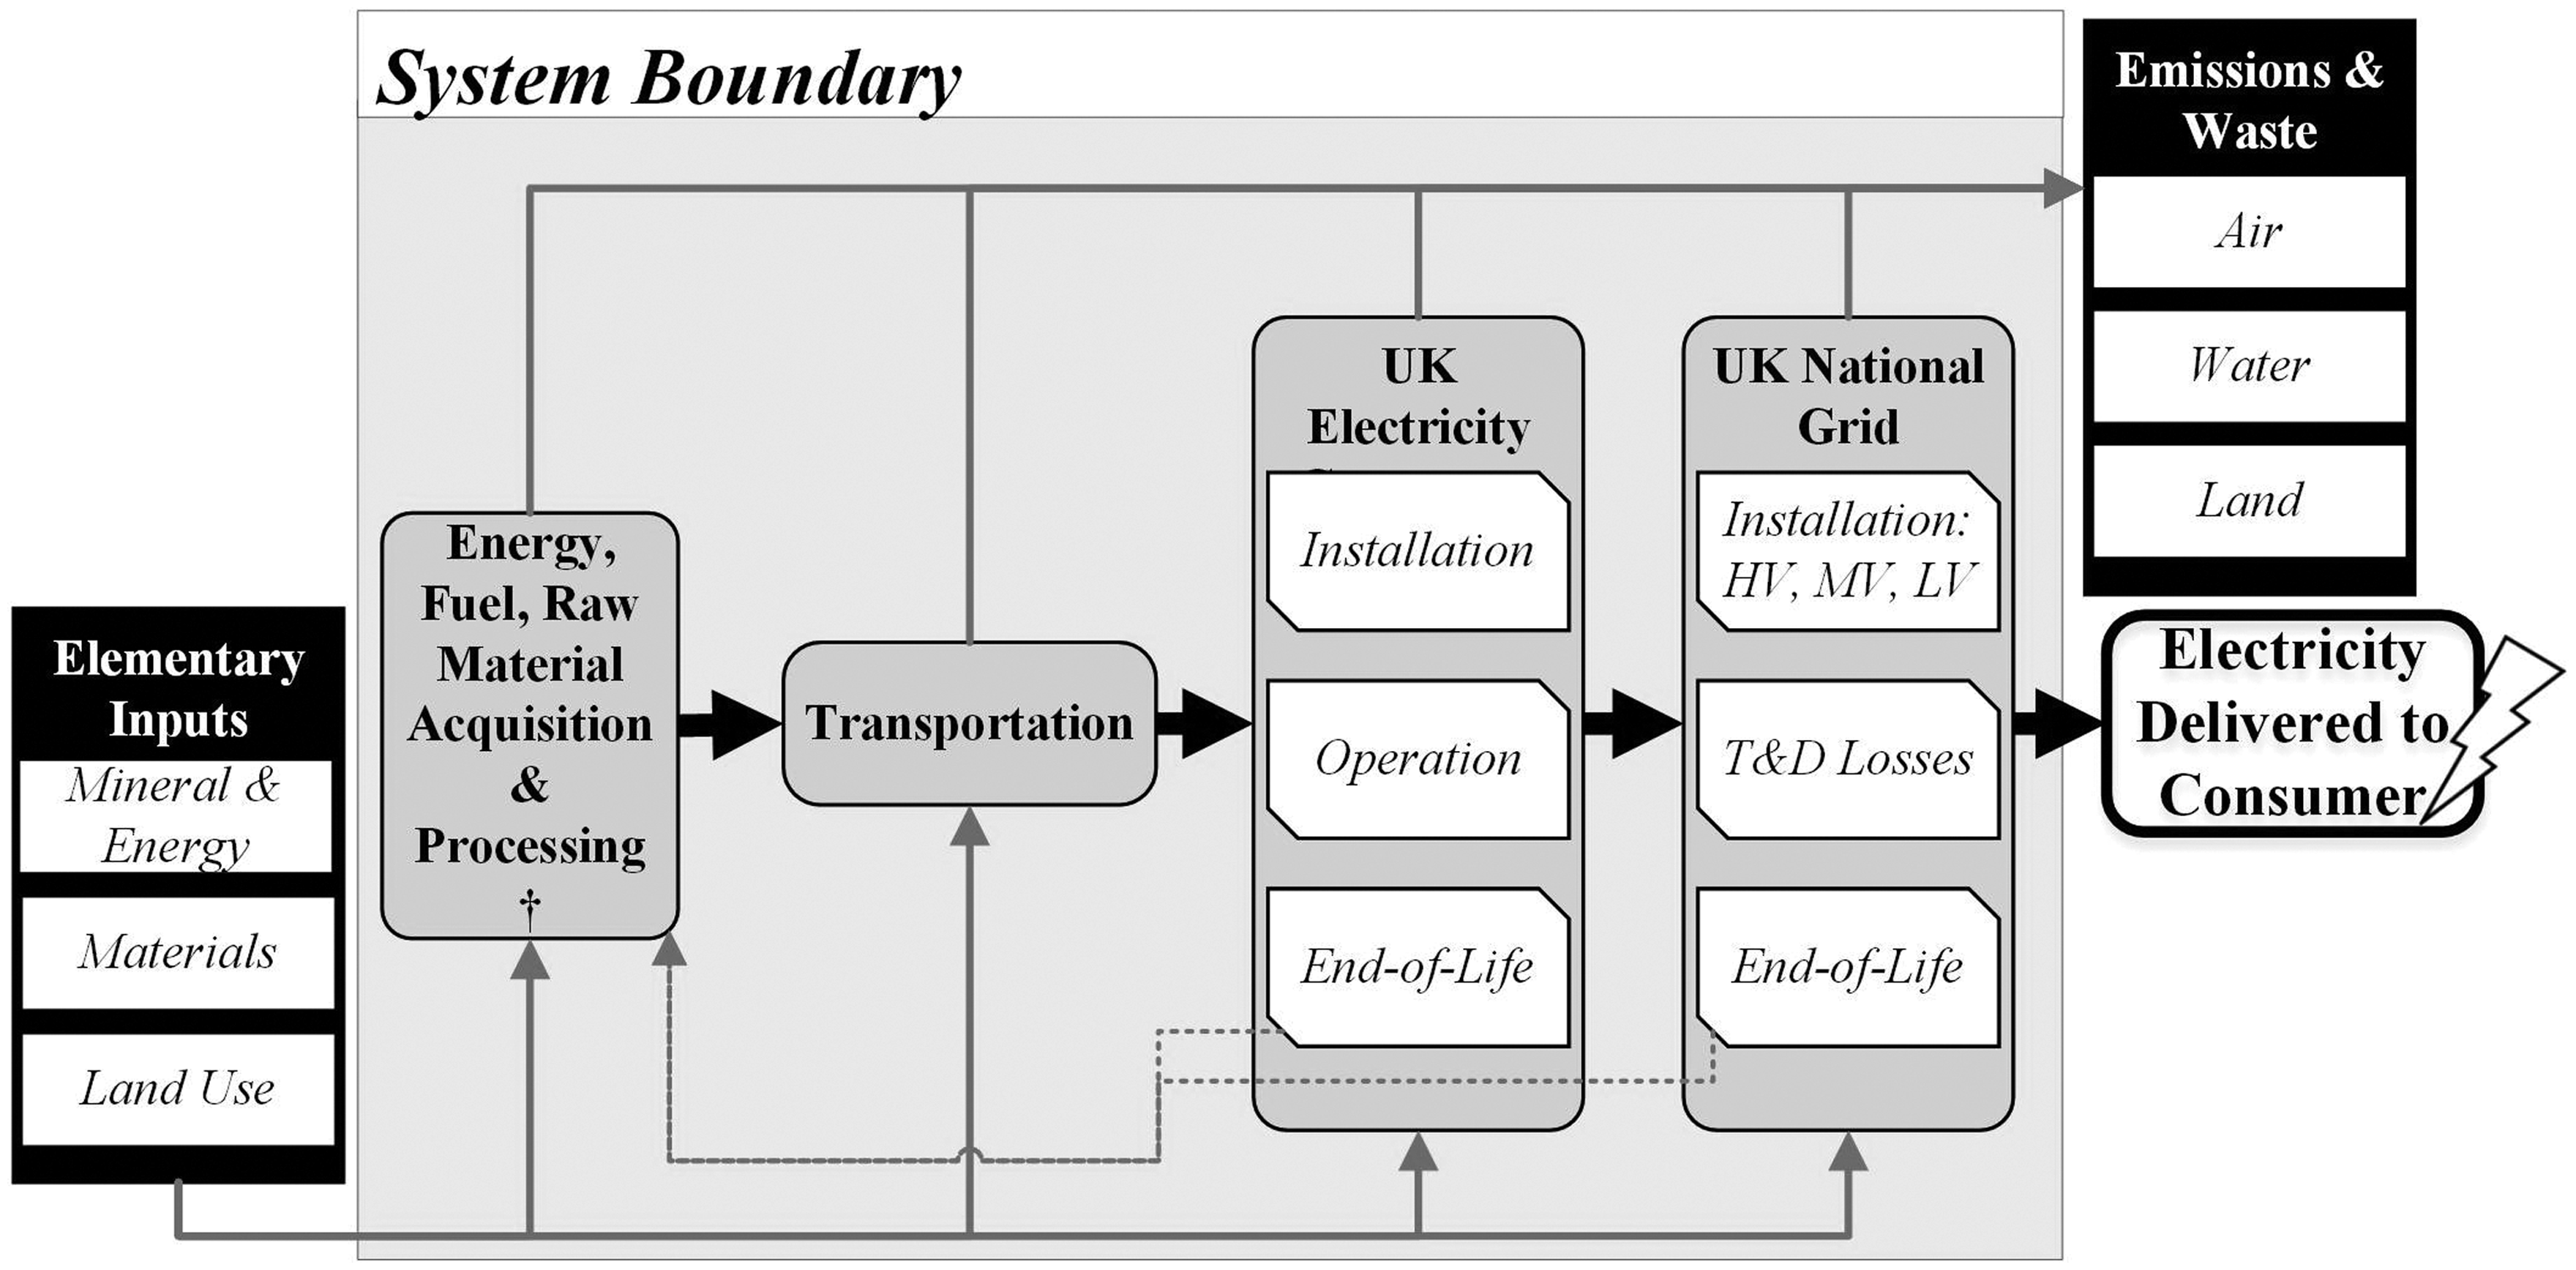
The life-cycle impacts of the UK power generators, specified in these transitions, were determined using LCA datasets from the Ecoinvent database (version 2.2), 43 populated with real-life data compiled from current operational power plants.44,45 For more novel technologies, such as tidal and wave, proxy datasets were developed in accordance with studies of these technologies.46,47 Current life-cycle data for different generators was used to account for future plants and uncertainties in their technological improvements; an inherent limitation when carrying out future-oriented research.
International grid interconnection becomes increasingly important for all pathways, particularly TF (due to its highly distributed nature 17 ). Accounting for the impacts associated with electricity produced in interconnecting countries was outside the scope of this study. Instead, average impacts of domestic generation was assigned to net imports and included into total electricity generation. Improved community and new micro-CHP datasets were developed since earlier GHG accounting of the pathways, 30 drawing on enhancements completed during the technical elaboration of the pathways. The modelled biogas supply was based on the current supply out to 2030. 48 Taking into account wider consortium research, 17 there was an assumed 15% penetration of biomass gasification post 2030, with the remainder of the feedstock allocated according to current supply.
A series of sensitivity analyses were conducted to explore potential environmental consequences of UK energy policy shifts. The three UK energy futures incorporating disruptive technological options were examined based on the phase out of coal use in favour of gas-fired power, ranging penetration levels of CCS, and different bioenergy supply chain for renewable CHP plants. These energy policy choices, and the assumptions taken in modelling their impacts into the future, are outlined in the following section. The results of these sensitivity analyses were contrasted with original results to assess the environmental consequences of these energy policy shifts.
The Transition Pathways were developed through a series of workshops with experts and stakeholders from policy, energy companies and non-governmental organisations. 1 The pathways development was also informed by various power system models and their technical feasibility (over various temporal load profiles across the year) verified by power system models to ensure system balancing. 49 Any changes to these tested pathways, greatly increases the associated uncertainty, and brings into question their technical feasibility. The sensitivity analyses have been performed for explorative means only, and do not attempt to predict how the system would precisely react to such policy shifts but rather indicate the range in their potential environmental implications.
Phase out of coal by 2025
The total phase out of unabated coal generation was recognised from the onset of the Transition Pathways research as a key requirement for a transition to a low carbon economy. As such, unabated coal generation is completely phased out of all three pathways by 2035, with only a minor contribution still present by 2030. Coal generation with CCS remains a key technology up until 2050 in the latest pathways (i.e. version 3.2), particularly in terms of providing dispatchable back-up generation to intermittent renewable technologies. Although the recent policy announcement does not necessarily rule out the use of coal CCS, a significant future for this technology out to 2050 is now considered unlikely, particularly in view of the increased uncertainty caused by recent CCS demonstrator funding cuts (see next section). A sensitivity analysis was carried out to explore the potential implication of transitioning all coal generation to gas generation (both unabated and with CCS), in line with policy reset speech by the UK Secretary of State for Energy and Climate Change. 10 Both nuclear and gas generation were declared to be ‘central to our energy secure future’ in this speech. However, it was recognised that a challenge with nuclear generation, as with other low carbon technologies, was to deliver nuclear power at a reasonable cost. No additional nuclear plants were assumed to replace the phase-out of coal generation as there was already considerable new nuclear power included in the generation portfolios of all three pathways. The installation of further plants, above this projected level of capacity, would be very unlikely, given the significant delays already experienced with the first planned new UK nuclear plant in decades. 48 Although GHG emissions are the main focus here in terms of policy, the impact on the full spectrum of environment concerns has also been explored.
The future of CCS
The pathways were investigated with both 0%, and 50% penetration of CCS, with the remainder being modelled as unabated coal and gas, in order to explore the role of CCS in achieving future UK climate change targets. Only GHG emissions and CED have been considered in this sensitivity analysis. Other environmental impacts would vary in response to the fossil fuel used to meet additional load for CCS processes.
Combined heat and power: Fuel source and allocation method
In the initial appraisal of the environmental impacts of the Transition Pathways, 31 all renewable CHP was modelled as biomass fired-CHP. Greater interdisciplinary analysis of the pathways using a whole system approach (particularly the in-depth examination of the TF pathway 17 ), established that biogas was more likely be the dominant fuel type for CHP. A sensitivity analysis is carried out here to explore the consequences of both fuel types on the overall environmental performance of the TF pathway. The TF pathway was examined because its results would be most influenced by the prevalence of CHP in this pathway.
A CHP system produces both heat and power, increasing the efficiency of fuel usage, and therefore reducing total costs and emissions. Three future electricity systems were compared in this assessment, requiring the environmental burden associated with these two energy co-products (i.e. electricity and heat) to be separated. Expansion of the assessment system boundaries to include the heating provision would circumvent this co-product issue, but this is not always plausible. This is particularly the case when a diverse range of technologies are utilised in different systems (which is the case here for the Transition Pathways). Furthermore, the generation of heat and power are often treated separately in energy policy in the United Kingdom 17 as elsewhere. Selecting an appropriate allocation method would prove useful in guiding policymakers towards the most reliable and representative comparison of options.
No consensus has been reached within the LCA community on the best practice for allocation of these emissions, and it can generally depend on the particular application of a given CHP system. 50 Various allocation methods can be applied, based on a range of considerations, from thermodynamic performance to monetary value. Each are considered valid, but can bear a significant influence on results. 51 In this assessment, the Digest of UK Energy Statistics (DUKES) fuel allocation method was employed to reflect the value of the resource as both an electricity and heat provider across the economy. The DUKES allocation method is based on typical efficiencies of CHP plants, and assumes that it is twice as hard to generate electricity as to produce heat. Energy and exergy allocation methods have also been applied here to explore their implications on results. Exergy allocation accounts for the quantity and quality of the energy streams, which results in most of the environmental burden being allocated to electricity (the higher quality output), which can produce more useful work. The energy allocation only accounts for the quantities of the two energy streams, with a large proportion of the environmental burden thereby being allocated to heat.
Environmental appraisal of the original Transition Pathways
The environmental impacts of the Transition Pathways (v3.2) are presented here, as a base reference case, from which the consequences of energy policy shifts on these future electricity systems can be explored.
GHG emissions
The MR pathway experienced the least decarbonisation by 2050, still emitting 63.7 Mt CO2e on an annual basis. Comparatively, CC and TF had much greater success giving rise to 36.5 Mt CO2e, and 37.8 Mt CO2e in 2050, respectively. MR only achieves a 75% GHG reduction compared to 1990 emissions levels on a life-cycle basis, whereas both the CC and TF pathways achieve around 85% reduction on the same basis. The remaining emissions reported in 2050 were largely the result of upstream emissions (highlighted in Figure 2), which have been previously explored in greater detail by the authors.30,52 The CC pathway had the lowest life-cycle GHG emissions, but only by a small margin: generating just 1.45 Mt CO2e fewer emissions than the TF pathway on an annual basis by 2050.
Total GHG emissions for the electricity sector (Mt CO2e) 1990-2050 under the three Transition Pathways on a life-cycle basis. (Upstream emissions have been highlighted. All remaining emissions emitted as direct emissions from generators.)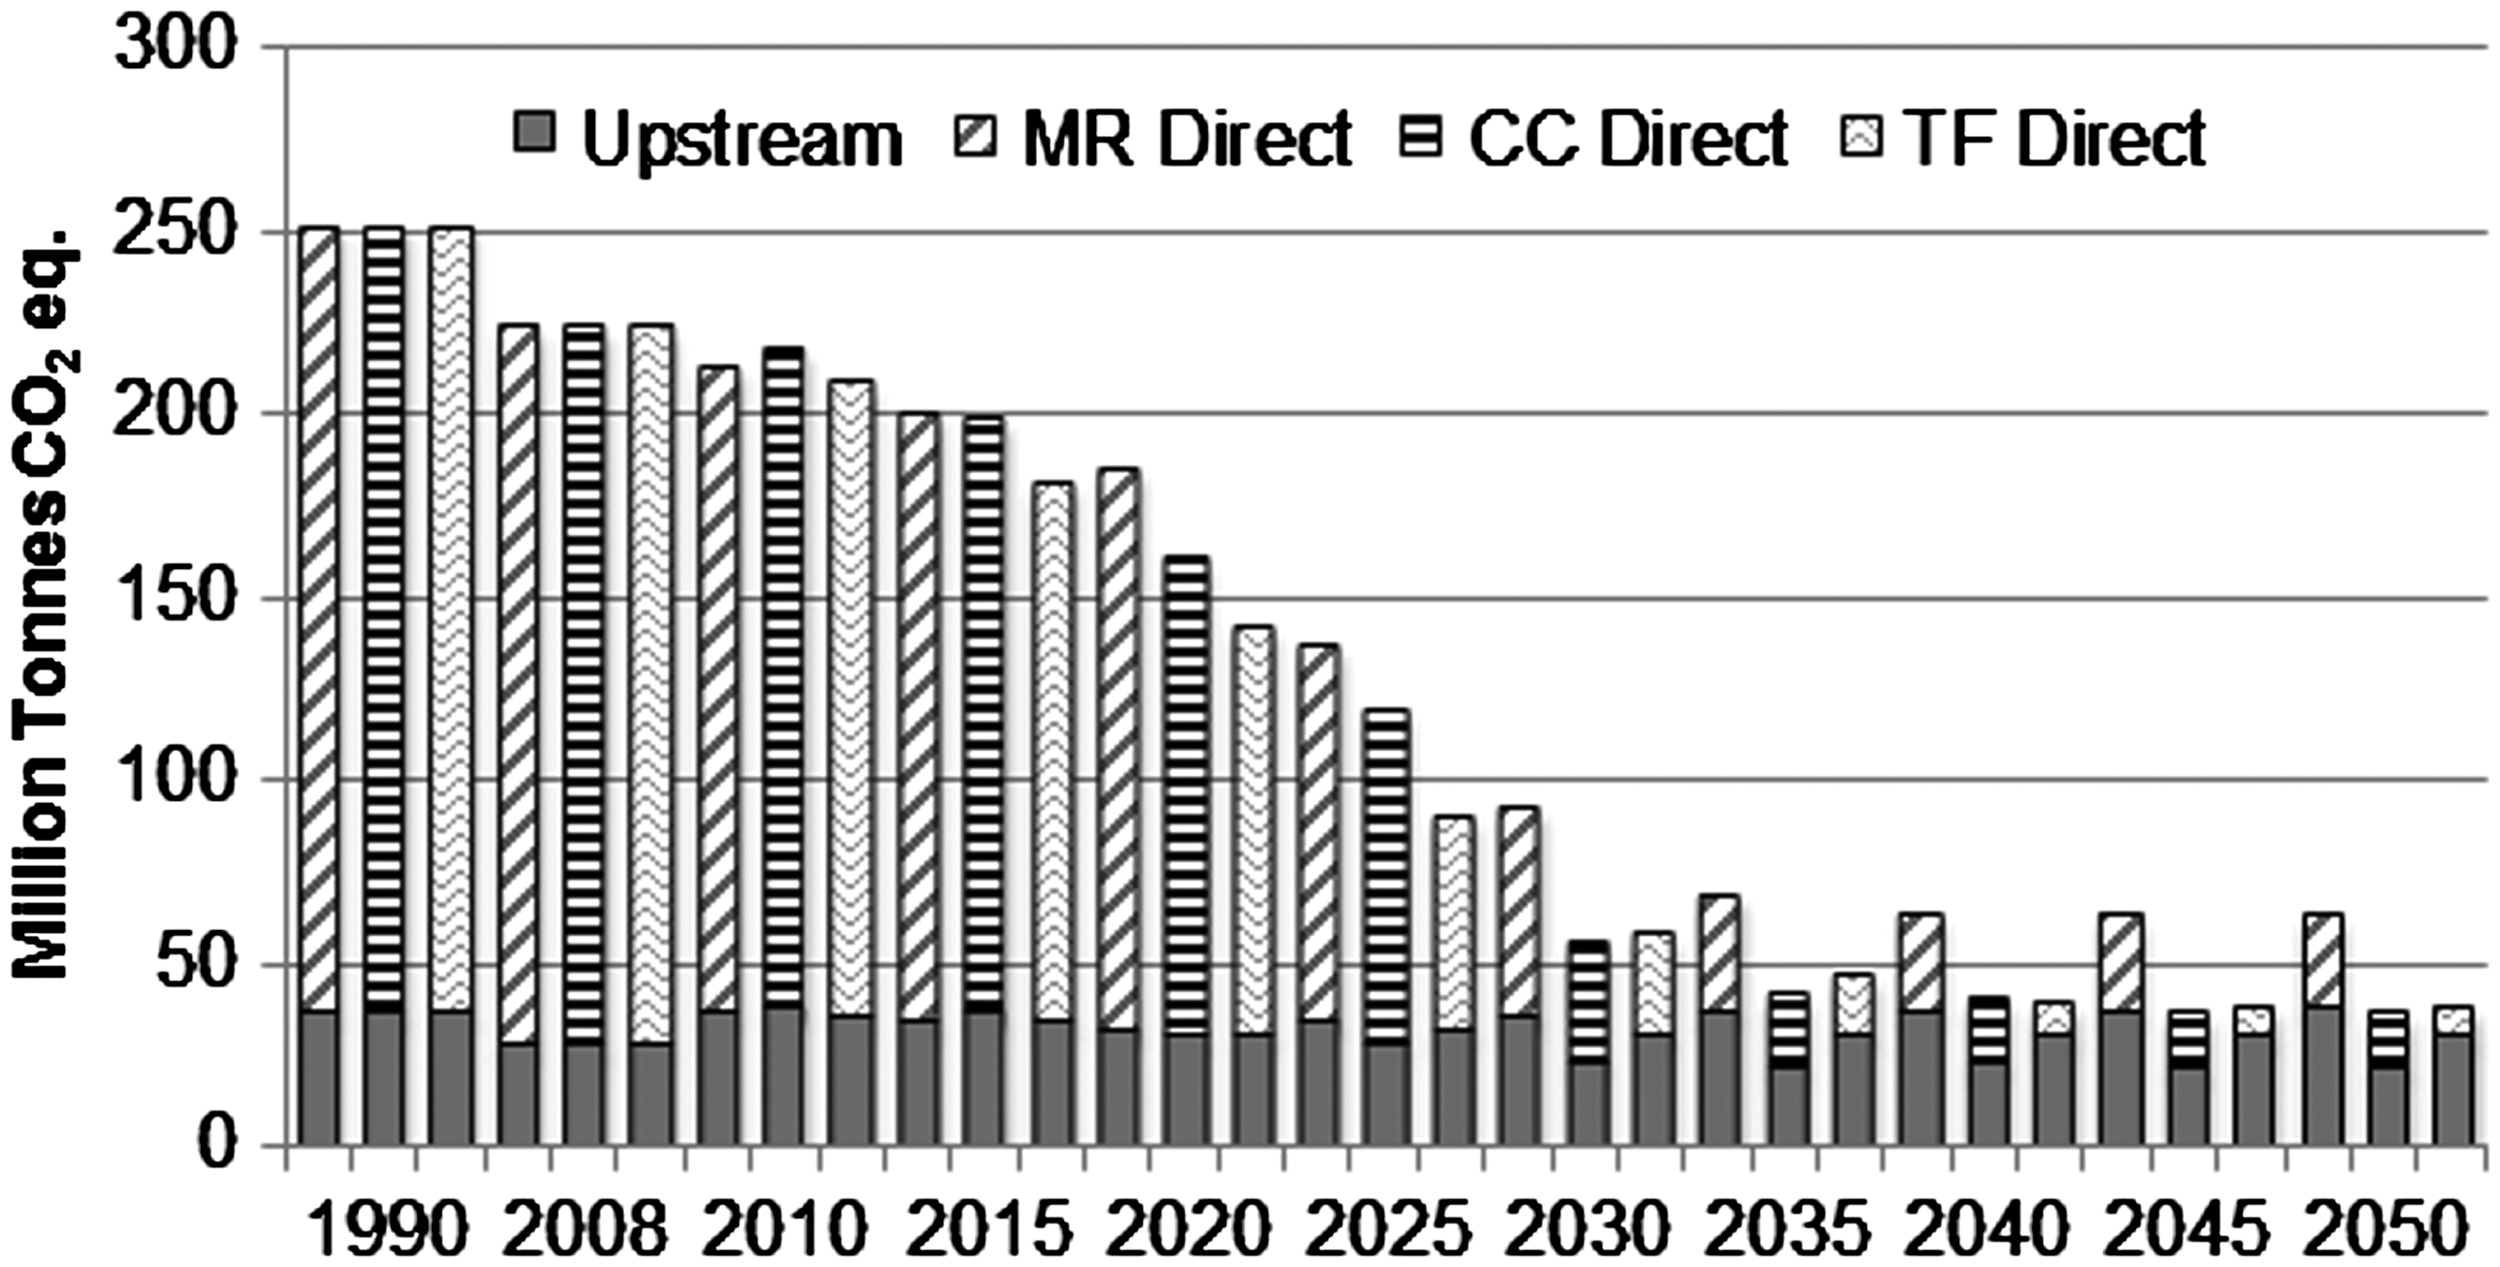
Examining the three pathways in terms of per unit of electricity supplied (see Figure 3), the CC pathway had significantly lower associated life-cycle emissions than its two counterparts, resulting in only 88 g CO2e/kWh. The MR pathway had the highest associated GHG emissions, emitting 121 g CO2e/kWh supplied, whereas the electricity supplied in the TF pathway had a GHG intensity of 107 g CO2e/kWh. Nevertheless, the TF pathway almost achieved the same level of decarbonisation exhibited by the CC pathway over the total system, despite having higher associated emissions per unit of electricity. These results demonstrate the significant role of demand reduction in lowering life-cycle GHG emissions regardless of the performance of the technologies installed.
Contribution of each generating technology to overall GHG intensity of supplied electricity (kgCO2e/kWh) under all three Transition Pathways, from 2008 to 2050.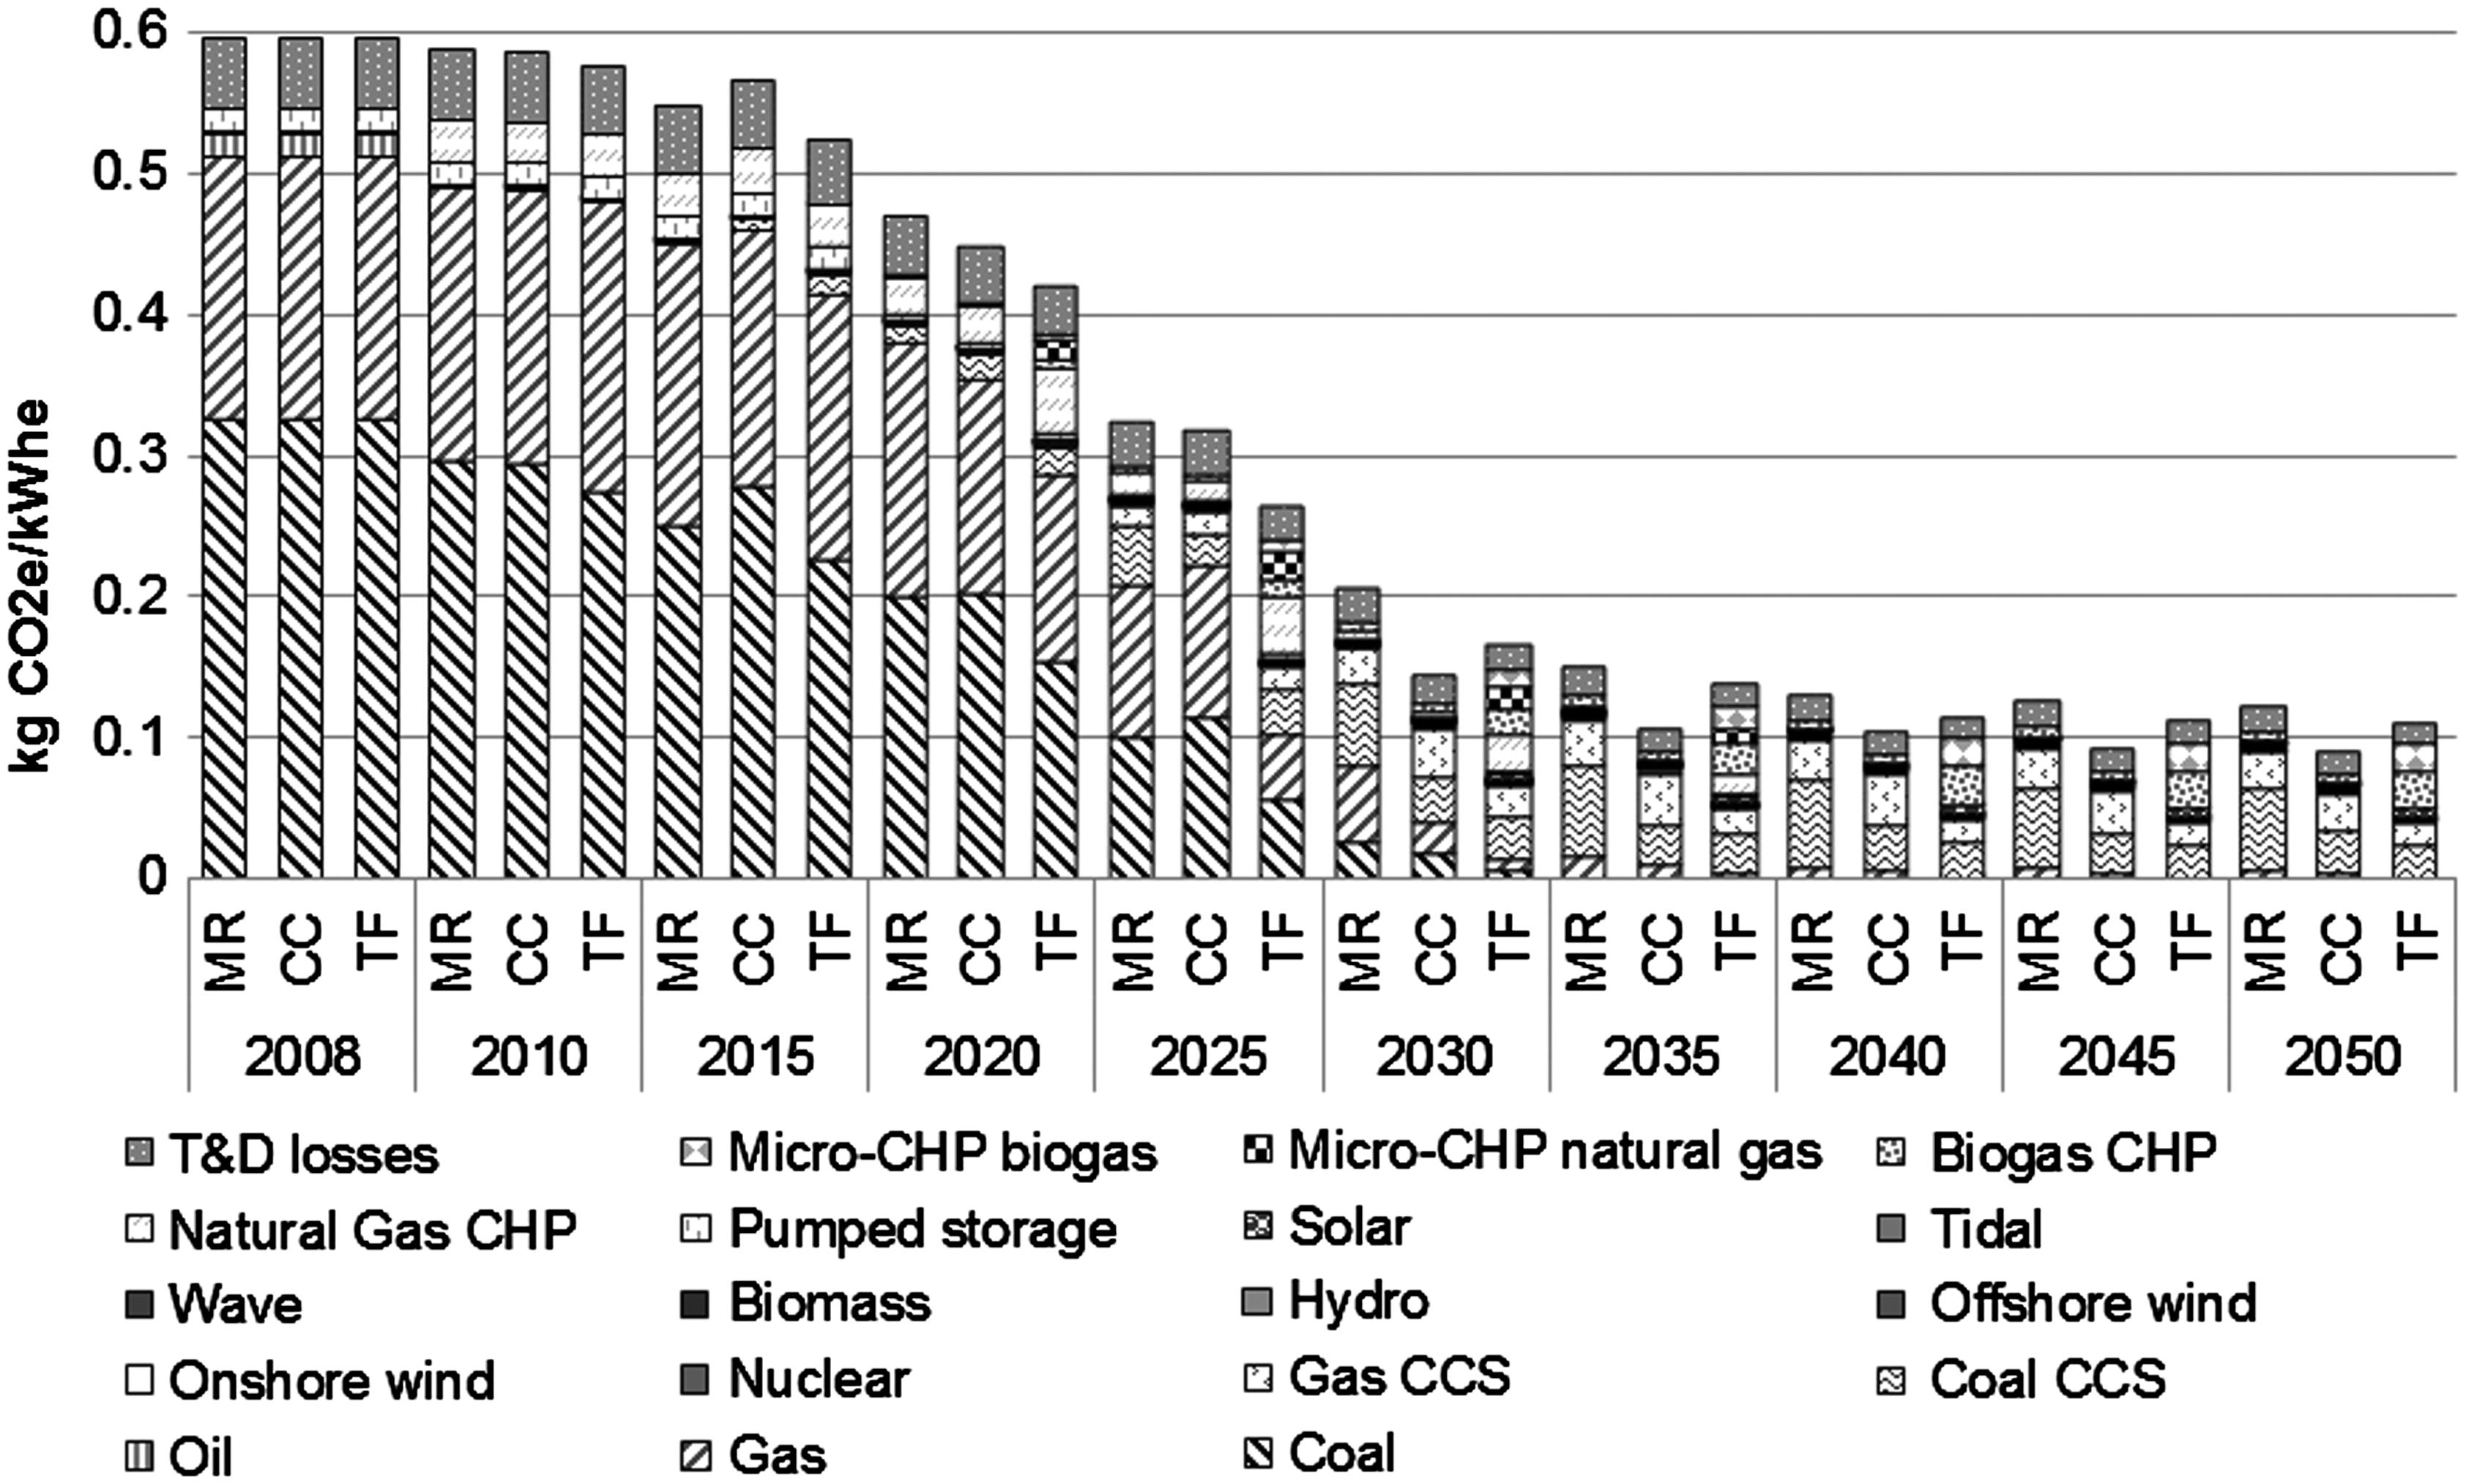
Direct emissions from the three Transition Pathways in 2050 were 25.0 Mt CO2e for MR, 14.6 Mt CO2e for CC and 7.2 Mt CO2e for TF. When considering only direct emissions, TF pathway is by far the most decarbonised pathway by 2050, reaching 97% reduction in direct GHG emissions compared to 1990 levels. This is considerably more than the 85% reduction experienced by the TF pathway on a life-cycle basis. These comparisons highlight the importance of considering the full life cycle when assessing system change, and the inadequacy of considering only direct GHG emissions alone.
The MR and CC pathways also experienced greater perceived emissions reduction from 1990 levels based on direct emissions alone; GHG emissions were seen to fall by 88% for MR pathway, and 93% for the CC pathway. Decarbonisation of the electricity sector at such levels suggest that all three pathways could play their part in achieving the statutory target of reducing 2050 national territorial direct emissions by at least 80% from 1990 levels. 4 Of course, this would require other sectors, such as heat and transport also to be predominately decarbonised on the same timescale. Direct GHG emissions in 2050 ranged from 20 to 46 g CO2e/kWh supplied, where the upper limit relates to MR, and the lower limit relates to the TF pathway. In the most recent power sector scenarios reported by the CCC, direct emissions were reduced to just under 100 g CO2e/kWh for each of their three main scenarios by 2030. 9 Both CC and TF pathways experience greater direct emission reduction by 2030, only emitting 80 and 74 g CO2e/kWh supplied, respectively. Nevertheless, the MR pathway struggles to decarbonise sufficiently: emitting 124 g CO2e/kWh supplied in 2030 on a direct emissions basis.
In the wider LCA, employing the ReCiPe life-cycle impact assessment methodology of Goedkoop et al., 41 AR4 IPCC 2007 GWPs were purposely retained to compare with the updated results using AR5 GWPs. GHG emissions for the pathways using AR5 GWP factors were found to only be marginally higher than those reported using AR4 GWP factors. The MR pathway showed the largest difference of all three pathways, experiencing an increase of 1.53 Mt CO2e over AR4 results. In contrast, the CC pathway displayed the least change, with GHG emissions only rising by 0.65 Mt CO2e, whereas in the TF pathway these emissions rose by 0.74 Mt CO2e. Both MR and TF pathways were influenced more strongly than their CC counterpart, owing to the higher penetration of gas-fired and biomass-fired generation in the former pathways (which result in greater associated methane emissions).
Cumulative energy demand
The CED (see Figure 4) for both the MR and CC pathways followed a similar trend to that of the overall electricity demand (see Table SI_1 and Figure SI_1). CED reached its lowest level in 2015 for the MR pathway, and in 2020 for the CC pathway, at around 3.6 and 3.5 billion GJ respectively. The slightly delayed reduction compared to demand, was due to greater contribution of coal generation in the preceding period mixes, despite slightly lower overall electricity demand. The CED peaked at 5.24 billion GJ for the MR pathway by 2050, signifying a 37% rise on 2008 levels, whereas, a more modest peak of 4.07 billion GJ was realised by the CC pathway in 2050, representing only a 4% rise on 2008 levels. In contrast, CED for the TF pathway was seen to decouple from overall electricity demand, exhibiting steeper reductions than as a result of decreases in demand alone. CED was seen to continuously drop in the TF pathway (Figure 4), as a consequence of the large reduction in non-renewable energy (NRE) use.
Cumulative Energy Demand for the UK electricity sector from MR, CC and TF pathways from 2008 to 2050. Both total cumulative energy demand (CED) and non-renewable energy demand (NRE) are shown for the three pathways.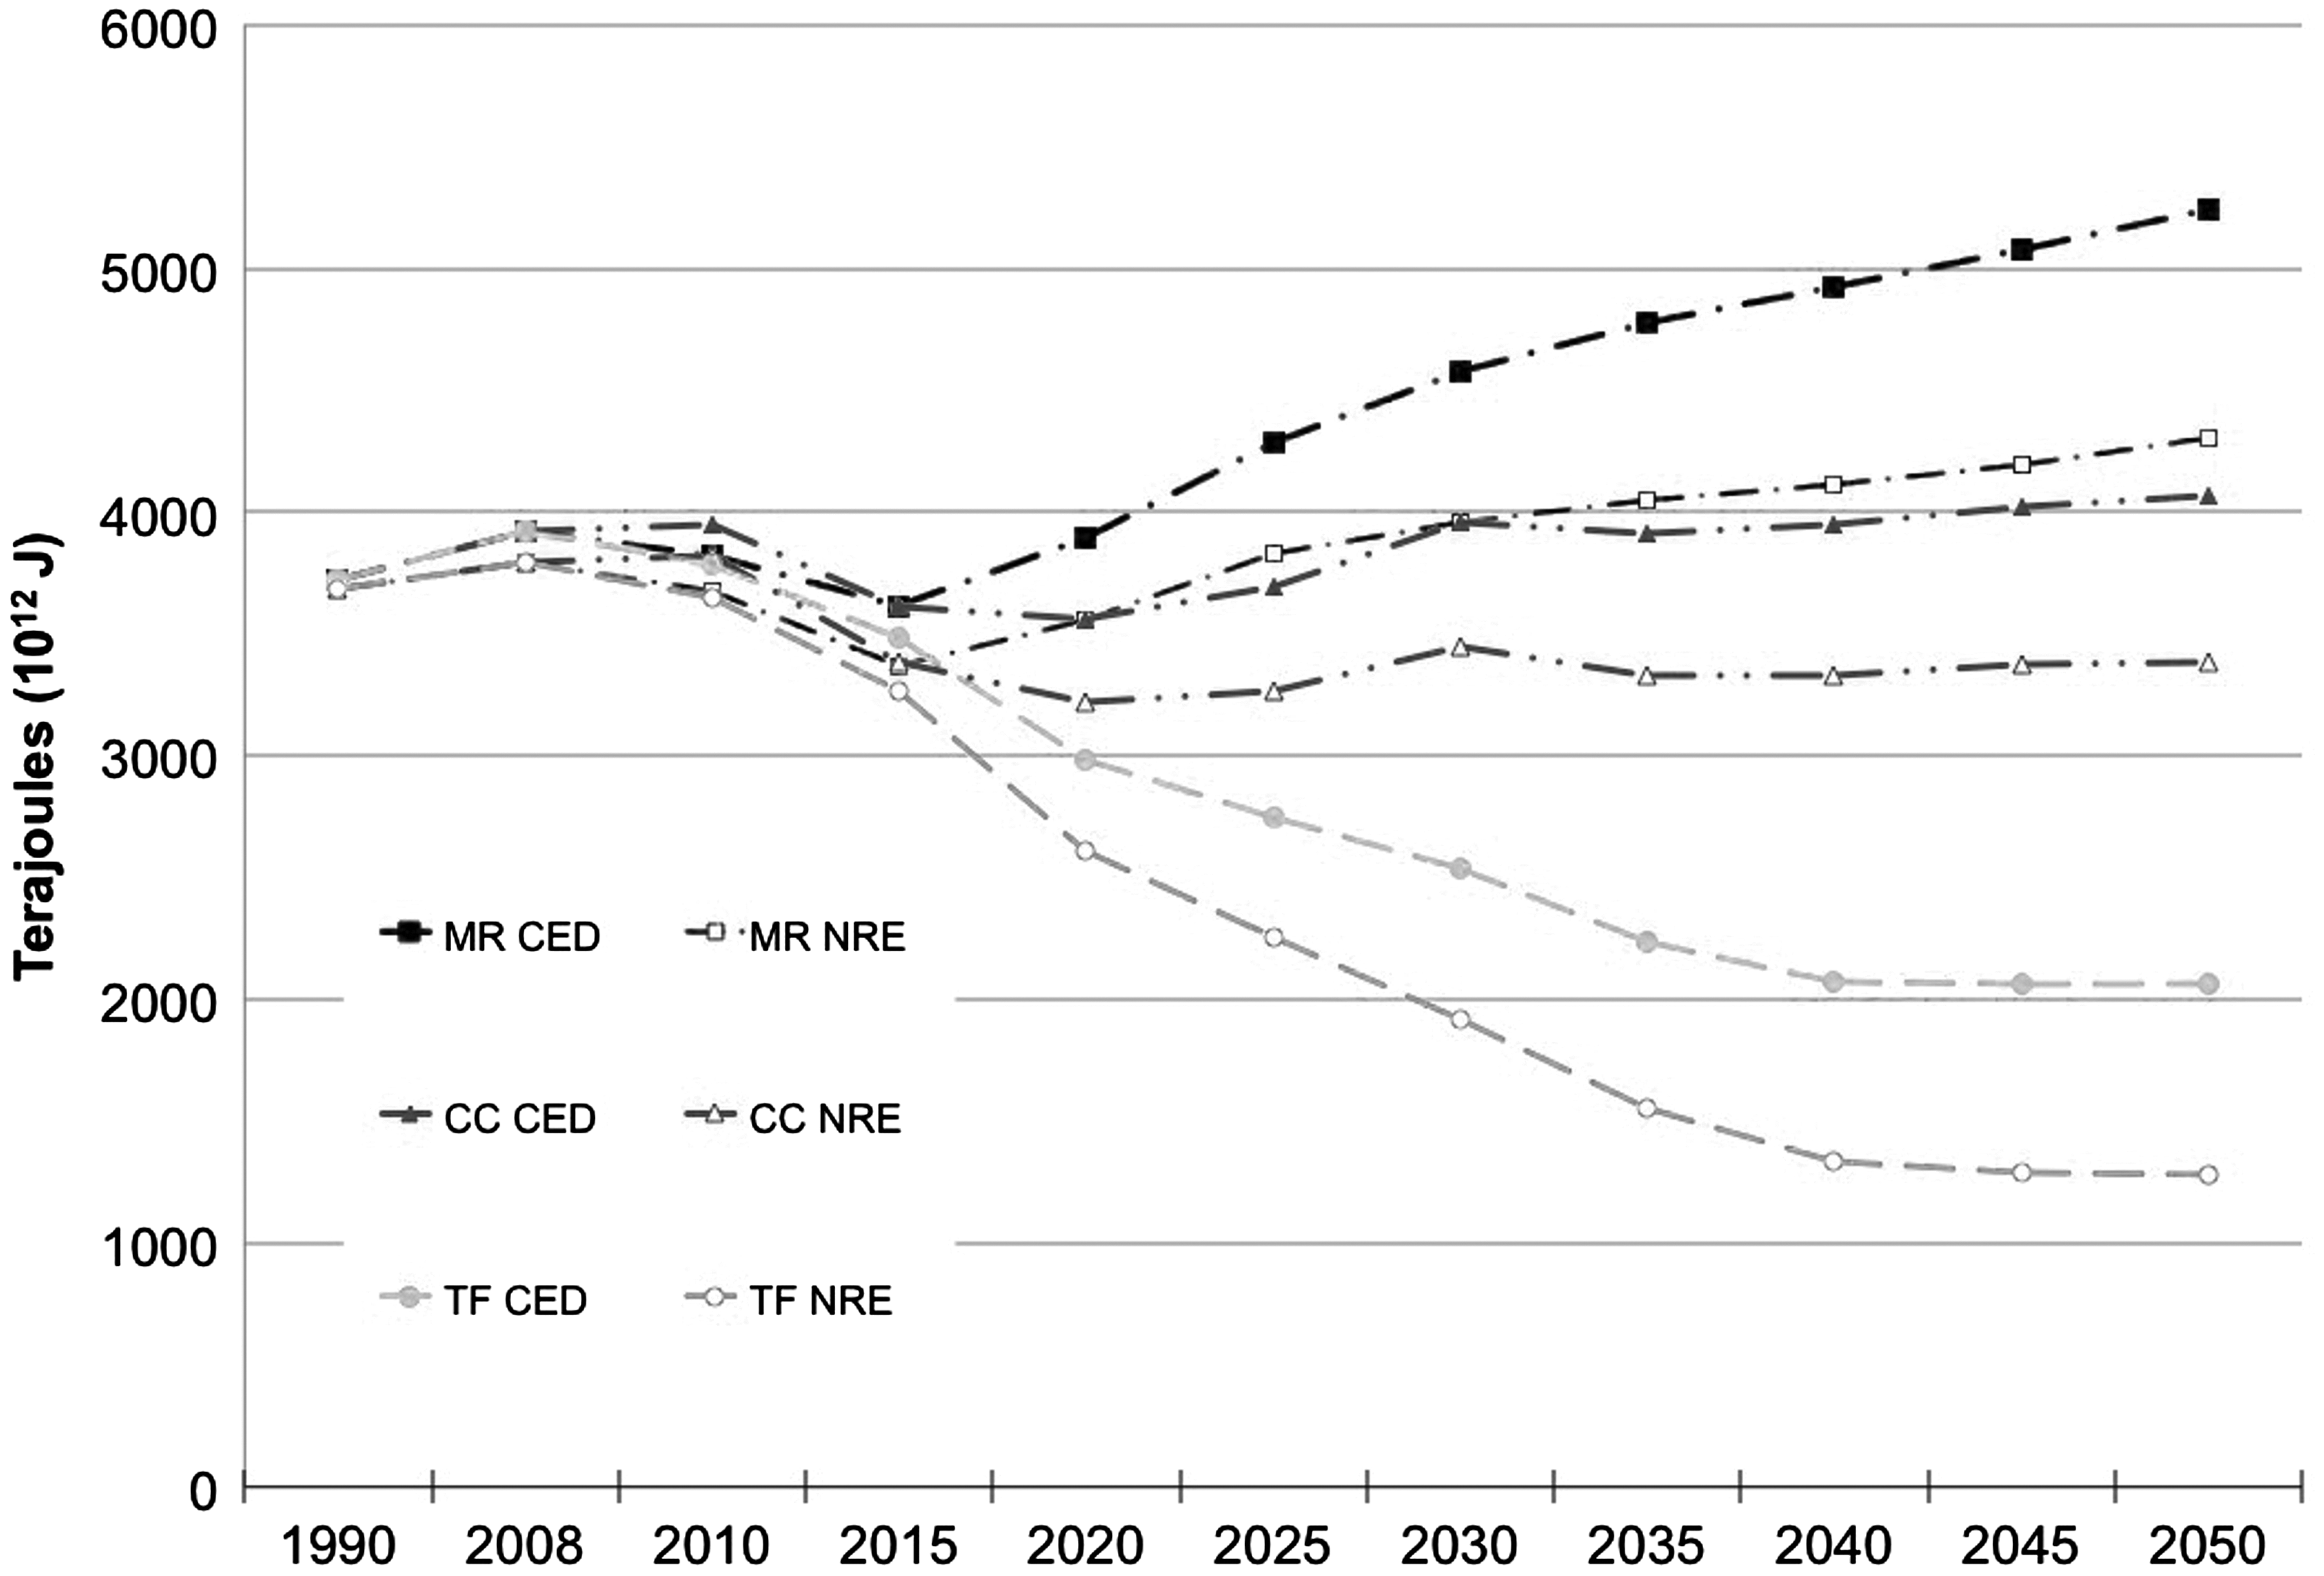
NRE demand is the proportion of total energy demand across the life cycle of the electricity production that originates from non-renewable energy sources, such as fossil fuels (coal, gas and oil) and nuclear power. They represent the proportion of energy source completely consumed by the UK electricity sector, which cannot be renewed. The MR pathway displayed the highest NRE as can be seen in Figure 4 (hitting 4.3 billion GJ by 2050), whilst TF had the lowest at 1.2 billion GJ. The NRE for the CC pathway was closer to that of MR, reaching 3.4 billion GJ by 2050. Despite the CC pathway having the lowest GHG emissions per kWh of all three pathways, it had the highest NRE per unit of electricity, consuming 8.1 MJ/kWh supplied. MR was marginally lower at 8 MJ/kWh supplied, whilst the TF pathway consumed less than half that of its counterparts (at 3.6 MJ/kWh). The dominance of nuclear in the CC pathway, gives rise to less investment in renewable generation capacity, resulting in electricity with the greater dependence on NRE sources.
Wider environmental concerns
Over the course of such large systematic changes (i.e. rapid low carbon transformations) as assessed in these pathways, it is crucial that wider environmental issues are monitored in order to avoid and limit other kinds of environmental damage. In this study, 17 other environmental impacts were therefore assessed in parallel with the climate change category to help inform decision-making. The environmental issues assessed range from Human toxicity, Freshwater Eutrophication to Land Occupation. The UK electricity sector for the year 2008 (the baseline year for the Transition Pathways) was compared to the sector in 2050 for all three pathways. This enabled the evaluation of changes in environmental impact due to the provision of electricity for the United Kingdom via alternative generator mixes. The environmental trade-offs between the three pathways in 2050 and 2008 are shown in Figure 5, in terms of percentage change of characterised LCA impacts against the 2008 system. Not all environmental impacts can be considered separately here (due to space restrictions), but the most significant results are discussed. However, the characterised results for all 18 environmental categories assessed for the three Transition Pathways are available in the supplementary information for year the 1990, and years 2008–2050 (see Table SI_4-6).
Variation in characterised embodied LCA impacts of the electricity sector for the three Transition Pathways; year 2050 compared to 2008.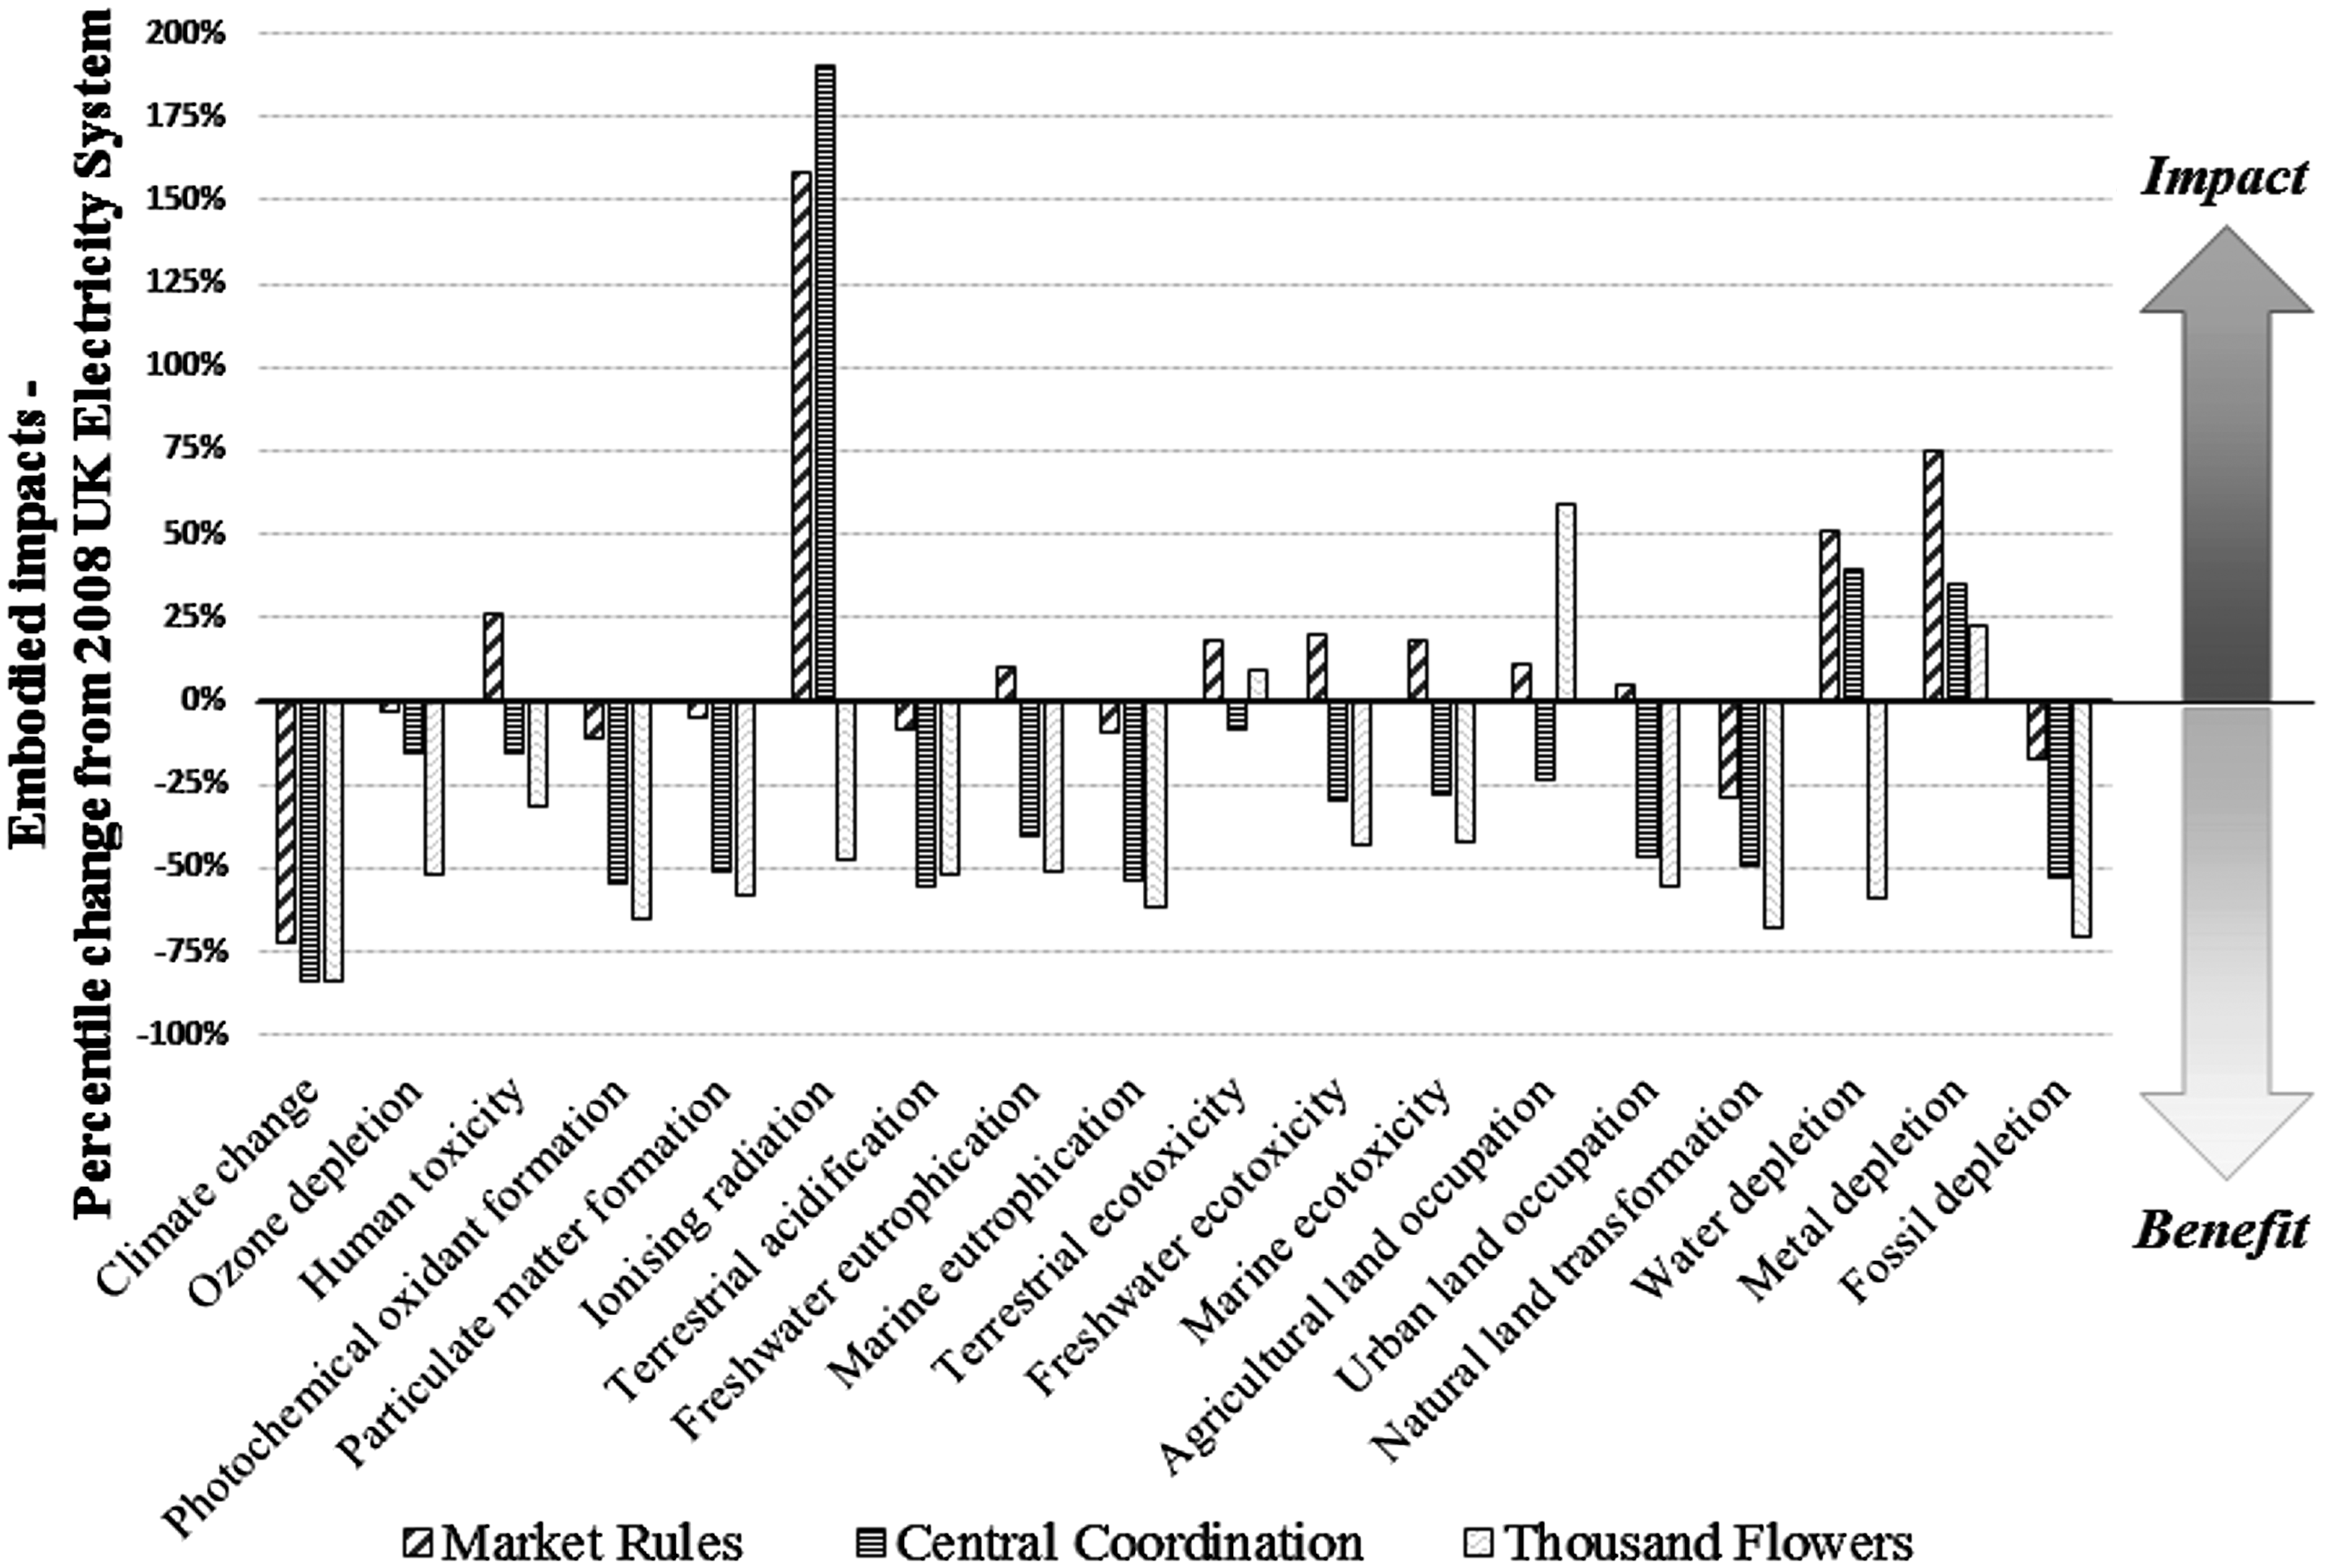
The focus here has been on the most significant changes in embodied impacts between the 2008 and 2050 electricity systems (or three Transition Pathways). The contributing factors to these impacts are discussed below. A positive percentage change in Figure 5 suggests an increased environmental impact over the 2008 electricity system, whilst a negative percentage change suggests an environmental benefit (or a reduction in impact).
Market Rules proved to be the most impactful Transition Pathway across the majority of impact categories (see Figure 5). The embodied impacts of the 2050 MR electricity system increased in 10 out of the 18 categories assessed when compared with 2008 levels. The TF Transition Pathway had the most associated environmental benefits, realising the greatest reduction in 13 categories out across all three pathways; only increasing impacts on the 2008 system for metal depletion, agricultural land occupation, and terrestrial ecotoxicity. Metal depletion was seen to rise for all three pathways, which is discussed later in this section. The increased demand for biogas as CHP fuel was predominately accountable for the hike in both land occupation and terrestrial ecotoxicity, for which the biogas was partially derived from energy crops and other biomass resources. The TF pathway therefore saw a considerable increase in agricultural land occupation impacts, with an almost 60% increase over the 2008 power system. It expanded from 6.7 × 10⁹ to 1.06 × 10¹⁰ m2. The CC pathway experienced the lowest agricultural land occupation, falling to 5.17 × 10⁹ m2 by 2050; 23% lower than 2008 levels.
Although the CC pathways achieved the greatest decarbonisation, it did not reduce other environmental burdens at a similar rate, experiencing much lower environmental benefits than those provided by the TF pathway. The only categories, apart from climate change, where the CC pathways led to greater environmental benefits than its TF counterpart, were for terrestrial acidification, terrestrial ecotoxicity and agricultural land occupation. This was due to the significant role of biogas-CHP in the TF pathway. The CC pathway had the highest impact out of all three pathways in terms of ionising radiation as a result of the large increase in nuclear power generation. This led to a large (191%) increase over 2008 levels, rising from 6.2 × 10¹⁰ kg U235 eq to 1.8 × 10¹¹ kg U235 eq.
Human toxicity, particulate matter formation and photochemical oxidant formation impact assessment categories are all associated with increased human mortality. 41 Only human toxicity was seen to increase under the MR pathway: 27% higher than 2008 level, rising to 7.4 × 10¹⁰ kg 1,4-DB eq. In contrast, the TF pathway led to the lowest associated human toxicity; dropping 30% to 4 × 10¹⁰ kg 1,4-DB eq. The MR pathway only saw marginal reductions in particulate matter formation and photochemical oxidant formation, reducing by 4% and 10% respectively. Both the CC and TF pathways realised much better environmental benefits in these categories, with reductions of between 50% and 58% in particulate matter formation, and reductions of between 54% and 65% in photochemical oxidant formation.
Fossil fuel depletion fell below 2008 system levels for all three pathways by 2050. Despite achieving greater levels of decarbonisation, the MR pathway only experienced a 16% drop in Fossil fuel depletion (to 6.2 × 10¹⁰ kg oil eq by 2050), due to the high levels of coal and gas-fired generation (albeit with CCS).The TF pathway achieved the greatest reduction in fossil fuel depletion, decreasing by 70% on 2008 levels, to 2.2 × 10¹⁰ kg oil eq. In contrast, metal depletion was the only impact category where all three pathways displayed an increase on their 2008 system embodied impacts; rising by over 75% in the MR pathway, 35% in the CC pathway, and 23% under the TF pathway. Renewable energy technologies, such as solar PV, wave, tidal and wind generation are all associated with high levels of metal depletion, and to a lesser extent nuclear generation. As the electricity system endeavours to decouple from fossil fuels, reliance on metal resources will steadily grow as the renewable energy sector develops.
Environmental consequences of UK energy policy shifts
The environmental consequences of UK energy policy shifts are presented in this section. The results are contrasted with the base reference case from the previous section, to investigate the environmental merits of enacting these energy policy shifts on the decarbonising UK electricity system.
Phase out of coal by 2025
The phase out of coal-fired power plants reduces GHG emissions associated with all three pathways; however, the MR pathway demonstrated the greatest benefit from this policy shift. Lifecycle GHG emissions were reduced by 31% for the MR pathway, 22% for the CC pathway, and only 12% for the TF pathway for the year 2050. To investigate the full benefits of the coal phase out it is necessary to look at the GHG emissions curtailed over the course of the 2015–2050 transition. A total of 872.4 Mt CO2e of life-cycle GHG emissions are avoided through this phase out of coal under the MR pathway. This equates to 3.9 times the life-cycle GHG emissions associated with the 2008 baseline system. In contrast, the phase out of coal under the TF pathways only avoided 294.5 Mt CO2e of life-cycle GHG emissions over the transition period; equating to 1.3 times life-cycle GHG emissions of the 2008 system. The phase out of coal under the MR pathway avoided 441.3 Mt CO2e direct GHG emissions; equivalent to 2.2 times the 2008 direct emissions. Whereas, the phase out of coal under the TF pathways only avoided 92.9 Mt CO2e direct GHG emissions, which equates to just under half of the 2008 direct emissions.
A significant investment in new gas generation capacity will be required to replace the coal plants in such a phase-out scenario. The system would be locked into a given level of emissions over the lifetime of the new gas-fired plants, which is typically around 35 years. 53 There was an additional 95 TWh of gas generation with CCS required in 2050 as a result of the coal phase out in MR. Primary demand for gas in 2050 would rise from 8.9 × 10⁸ to 1.7 × 10⁹ GJ for the MR pathway, which is a rise from 1.1 times to almost 2.2 times the 2014 gas demand of the UK electricity system. 5
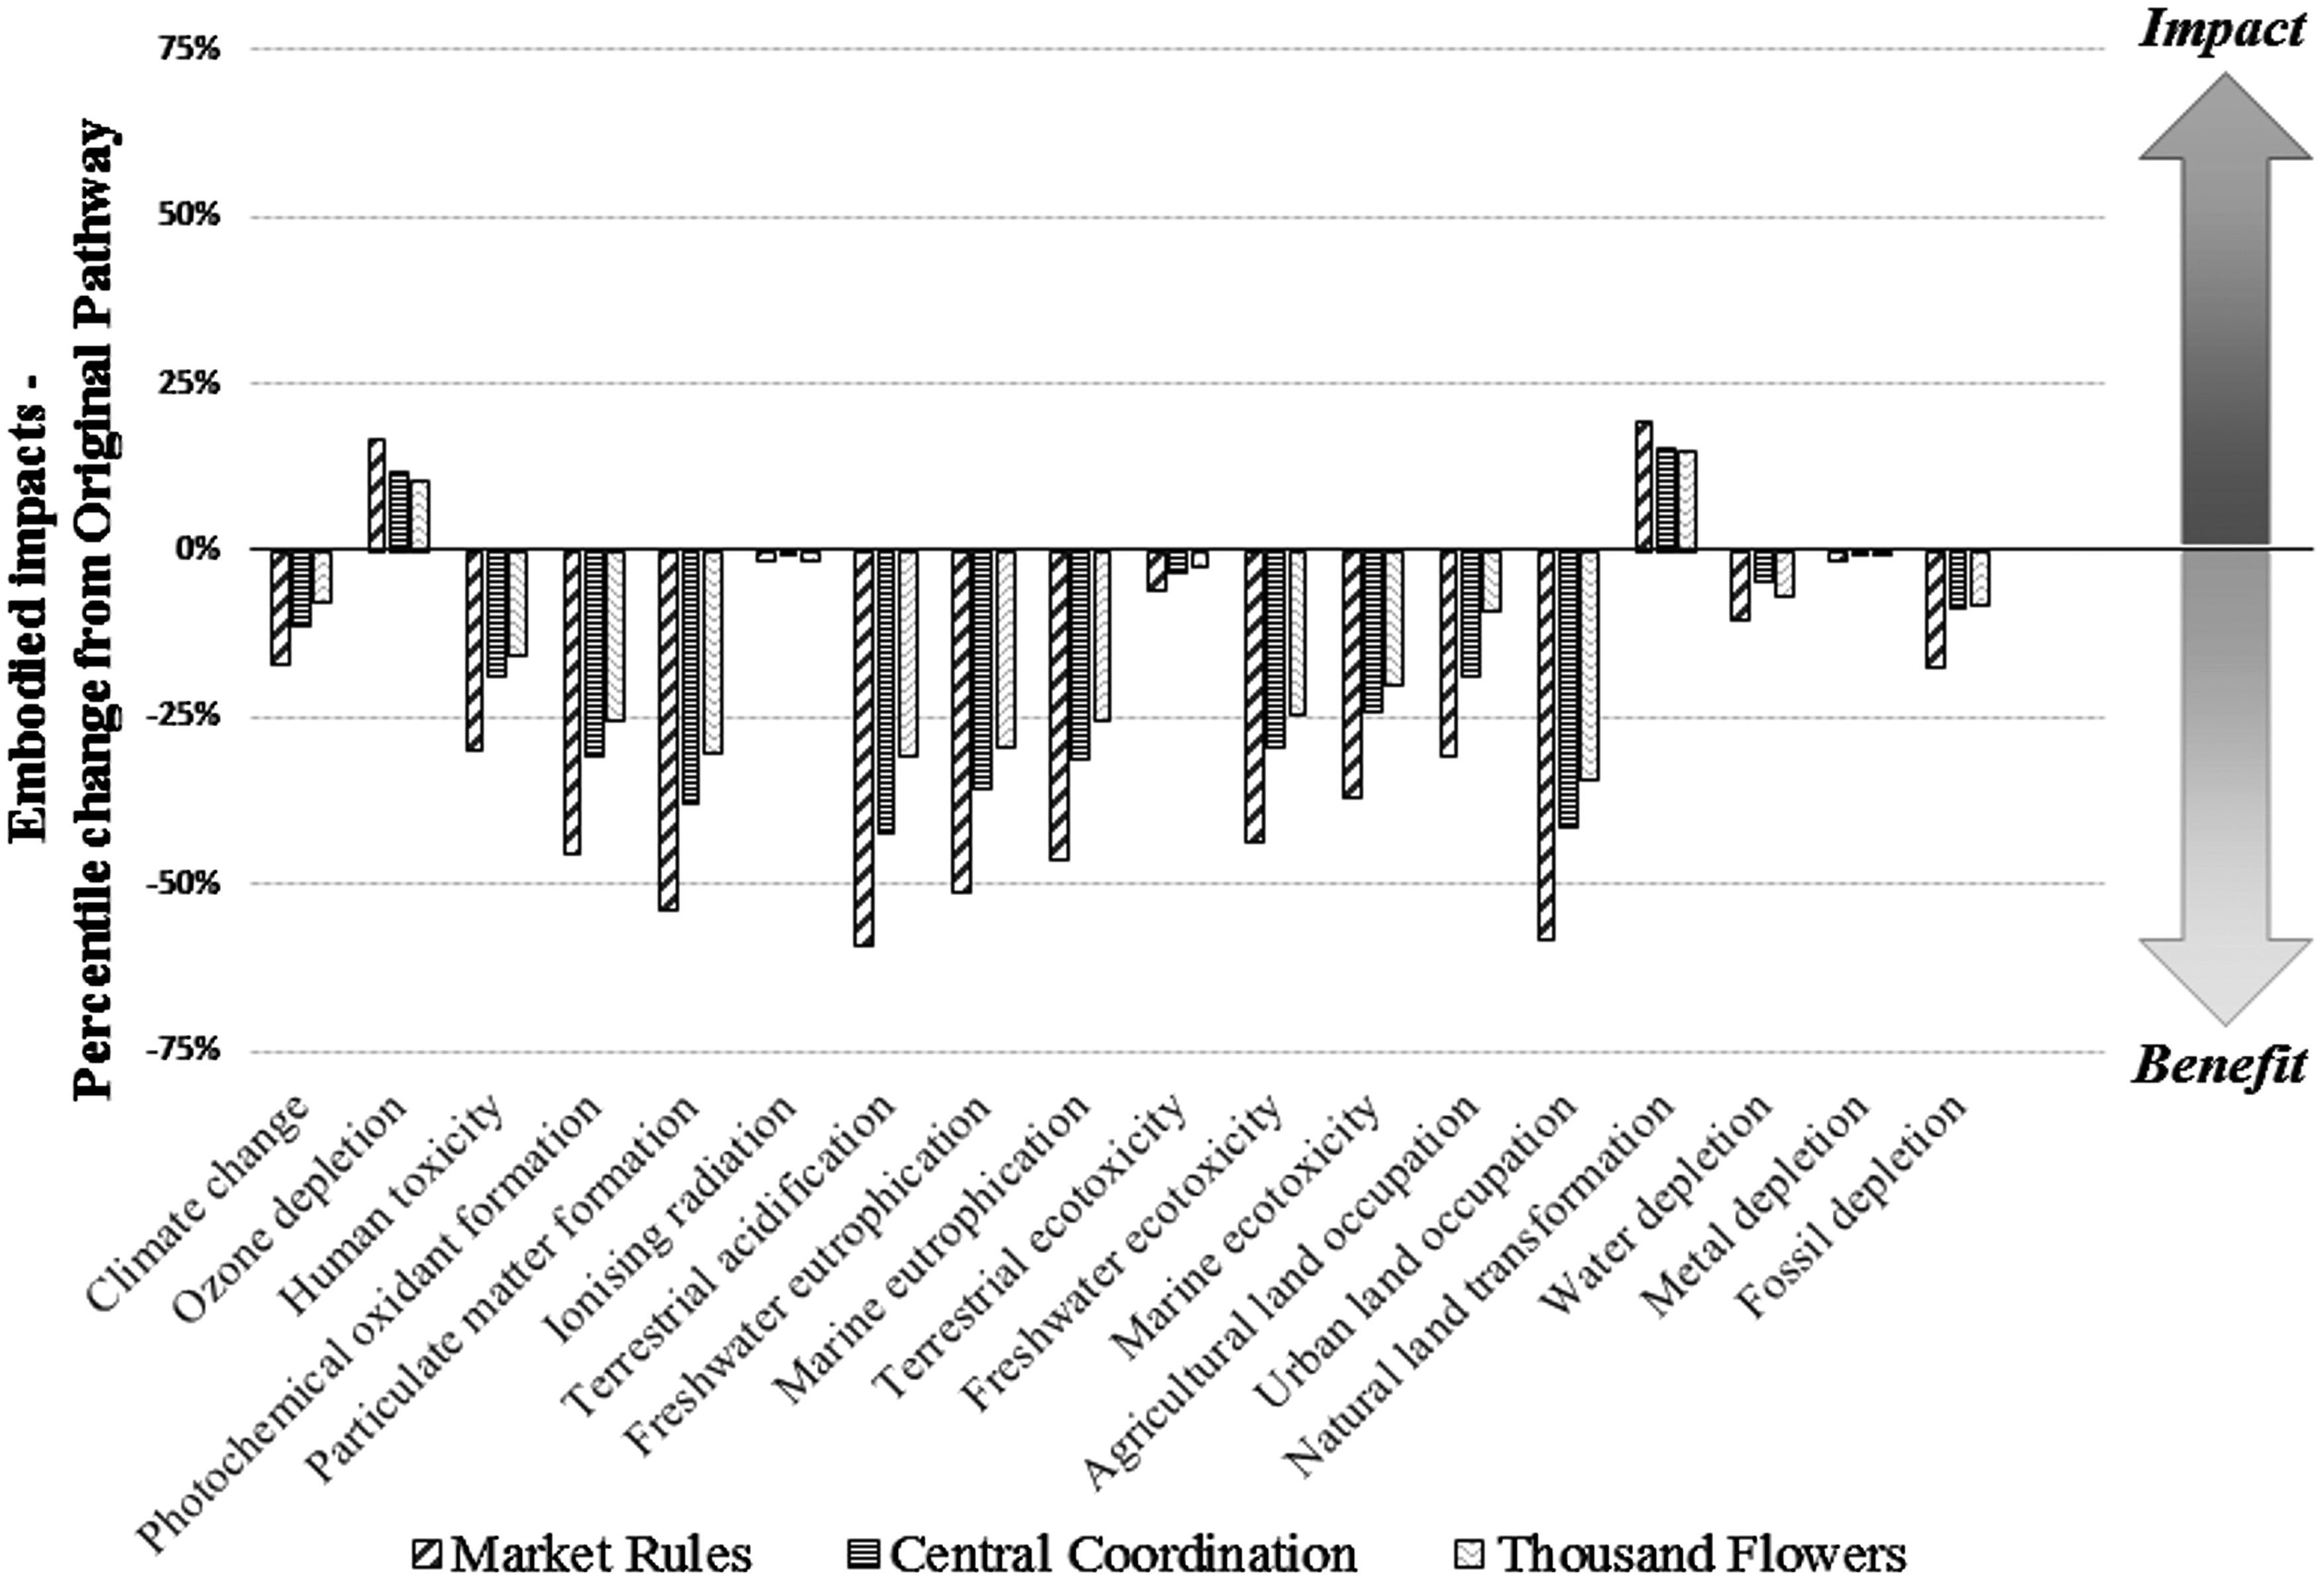
Once again, the MR pathway experiences the greatest environmental benefits from all three pathways due to the higher levels of coal generation and coal CCS present in this pathway. The percentage changes in total embodied impacts over the course of the three Transition Pathways, from the original pathways, have been presented in Figure 7 in order to explore the implications of the coal phase out. The characterised results of the original Transition Pathways, along with results for the transitions with coal phase out have been included in supplementary information (see Table SI_4-9). The majority of categories assessed (15 of the 18 categories) unsurprisingly demonstrated environmental benefits as a result of the coal phase out. A substantial reduction was seen in human toxicity, photochemical oxidant formation and particulate matter formation. These environmental impacts reduced by between 16% and 30%, 25% and 46%, and 30% and 54%, respectively; demonstrating that the phase out of coal will have far wider environmental benefits than the reduced GHG emissions alone. Two assessment categories showed a rise in impact, namely, ozone depletion and natural land transformation. Ozone depletion increased by between 10% and 16%, while natural land transformation rose by between 15% and 19%.
Total GHG emissions for the electricity sector (Mt CO2e) 1990–2050 under the three Transition Pathways on a life-cycle basis, compared to pathways with coal phase out. Variation in characterised embodied LCA impacts of the electricity sector from the original pathways, in response to the coal phase out, over the course of the three Transition Pathways from 2008 to 2050.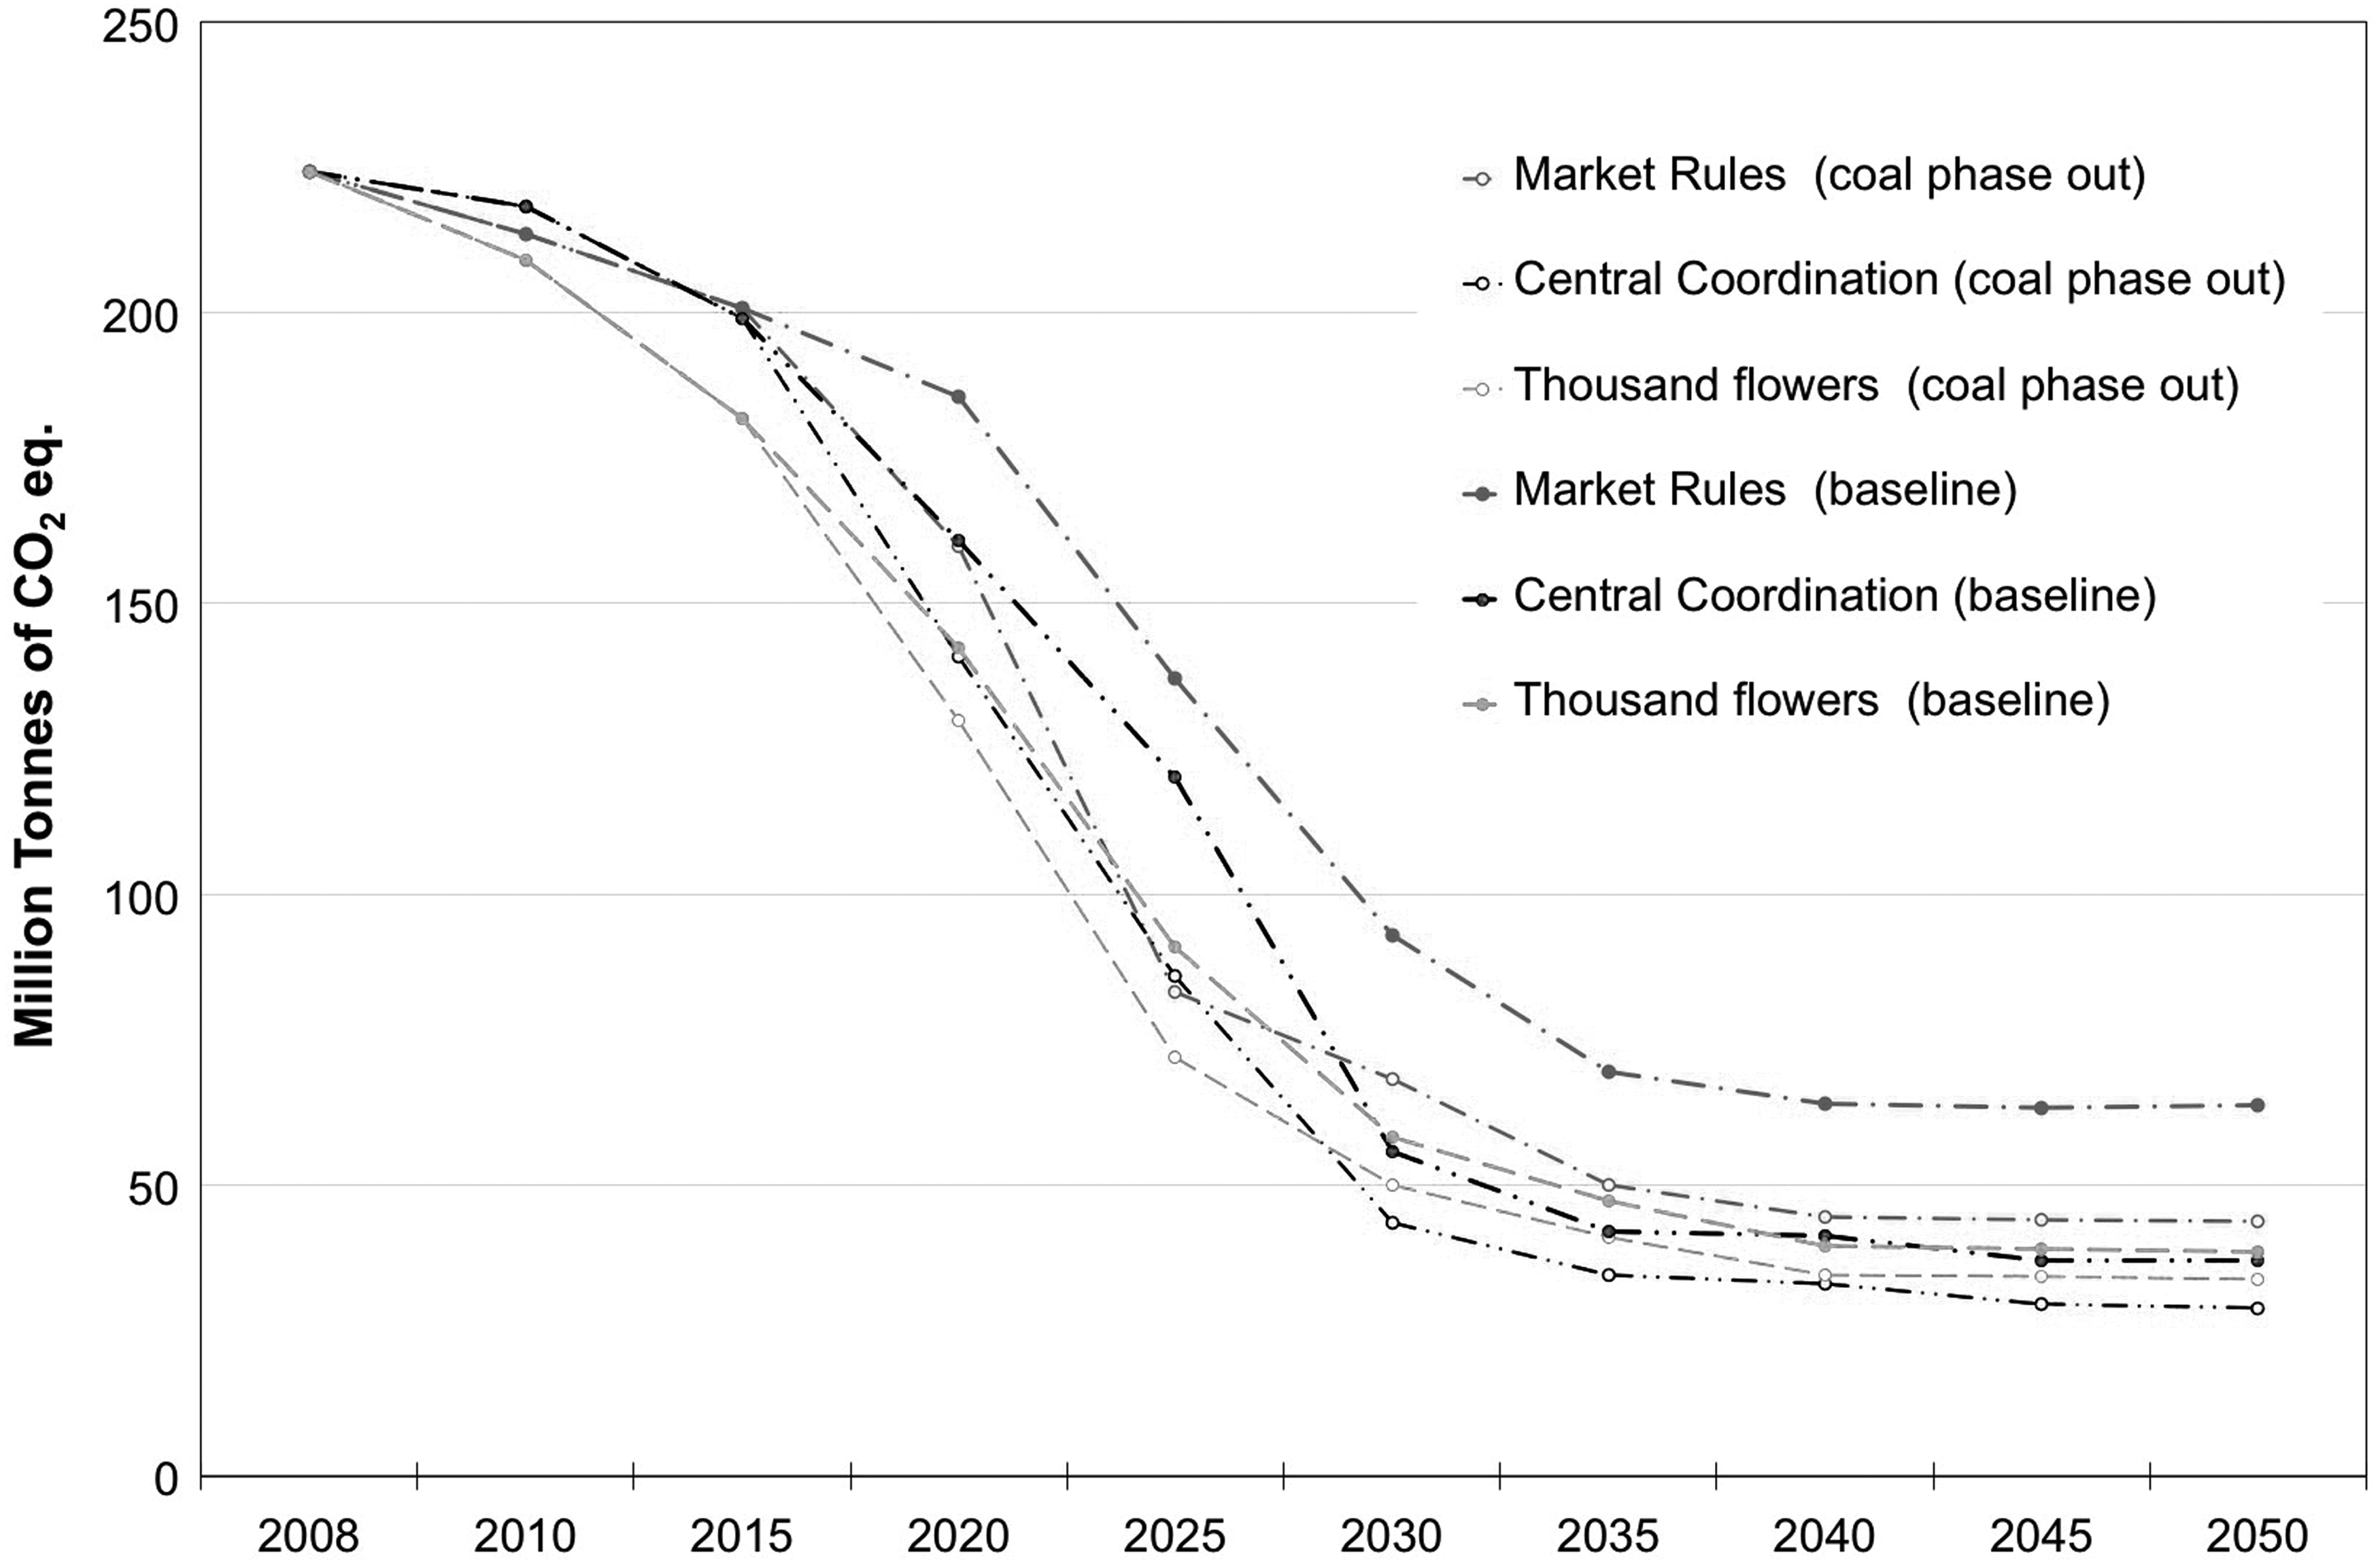
The future of CCS
The role of CCS in UK’s energy future has been explored here in terms of both life-cycle GHG emissions, and direct GHG emissions basis. Life-cycle emissions have been investigated to explore the technology’s full climate change mitigation potential, while direct emissions have been examined to explore the role of CCS in adhering to future UK climate change targets. The CCC recommend UK carbon budgets (or interim targets) that will ultimately stretch out to 2050 based on territorial or ‘production’ GHG emissions within the country, and not ‘consumption’ emissions that incorporate those arising from (or embodied in) the importation of materials and products (e.g. from exporting countries, like China). This is because only production emissions make up the national targets embedded in the Kyoto Protocol (and its likely 2020 successor). Total GHG emissions for the electricity sector from 2008 to 2050, under the three Transition Pathways with varying levels of CCS on a life-cycle basis, are shown in Figure 8. The growth of CCS in the UK electricity sector has a much greater potential to mitigate GHG emissions than the phase out of coal from the electricity system. Contrasting the original pathway results, with that of the 0% CCS scenario, suggests that CCS could mitigate between 2639 and 1105 Mt CO2e (where the higher figure relates to the MR pathway, whereas the lower figure is associated with the TF pathway) over the course of the transition on a life-cycle basis.
Total GHG emissions for the electricity sector (Mt CO2e) 2008–2050 with varying levels of CCS under the three Transition Pathways on a life-cycle basis.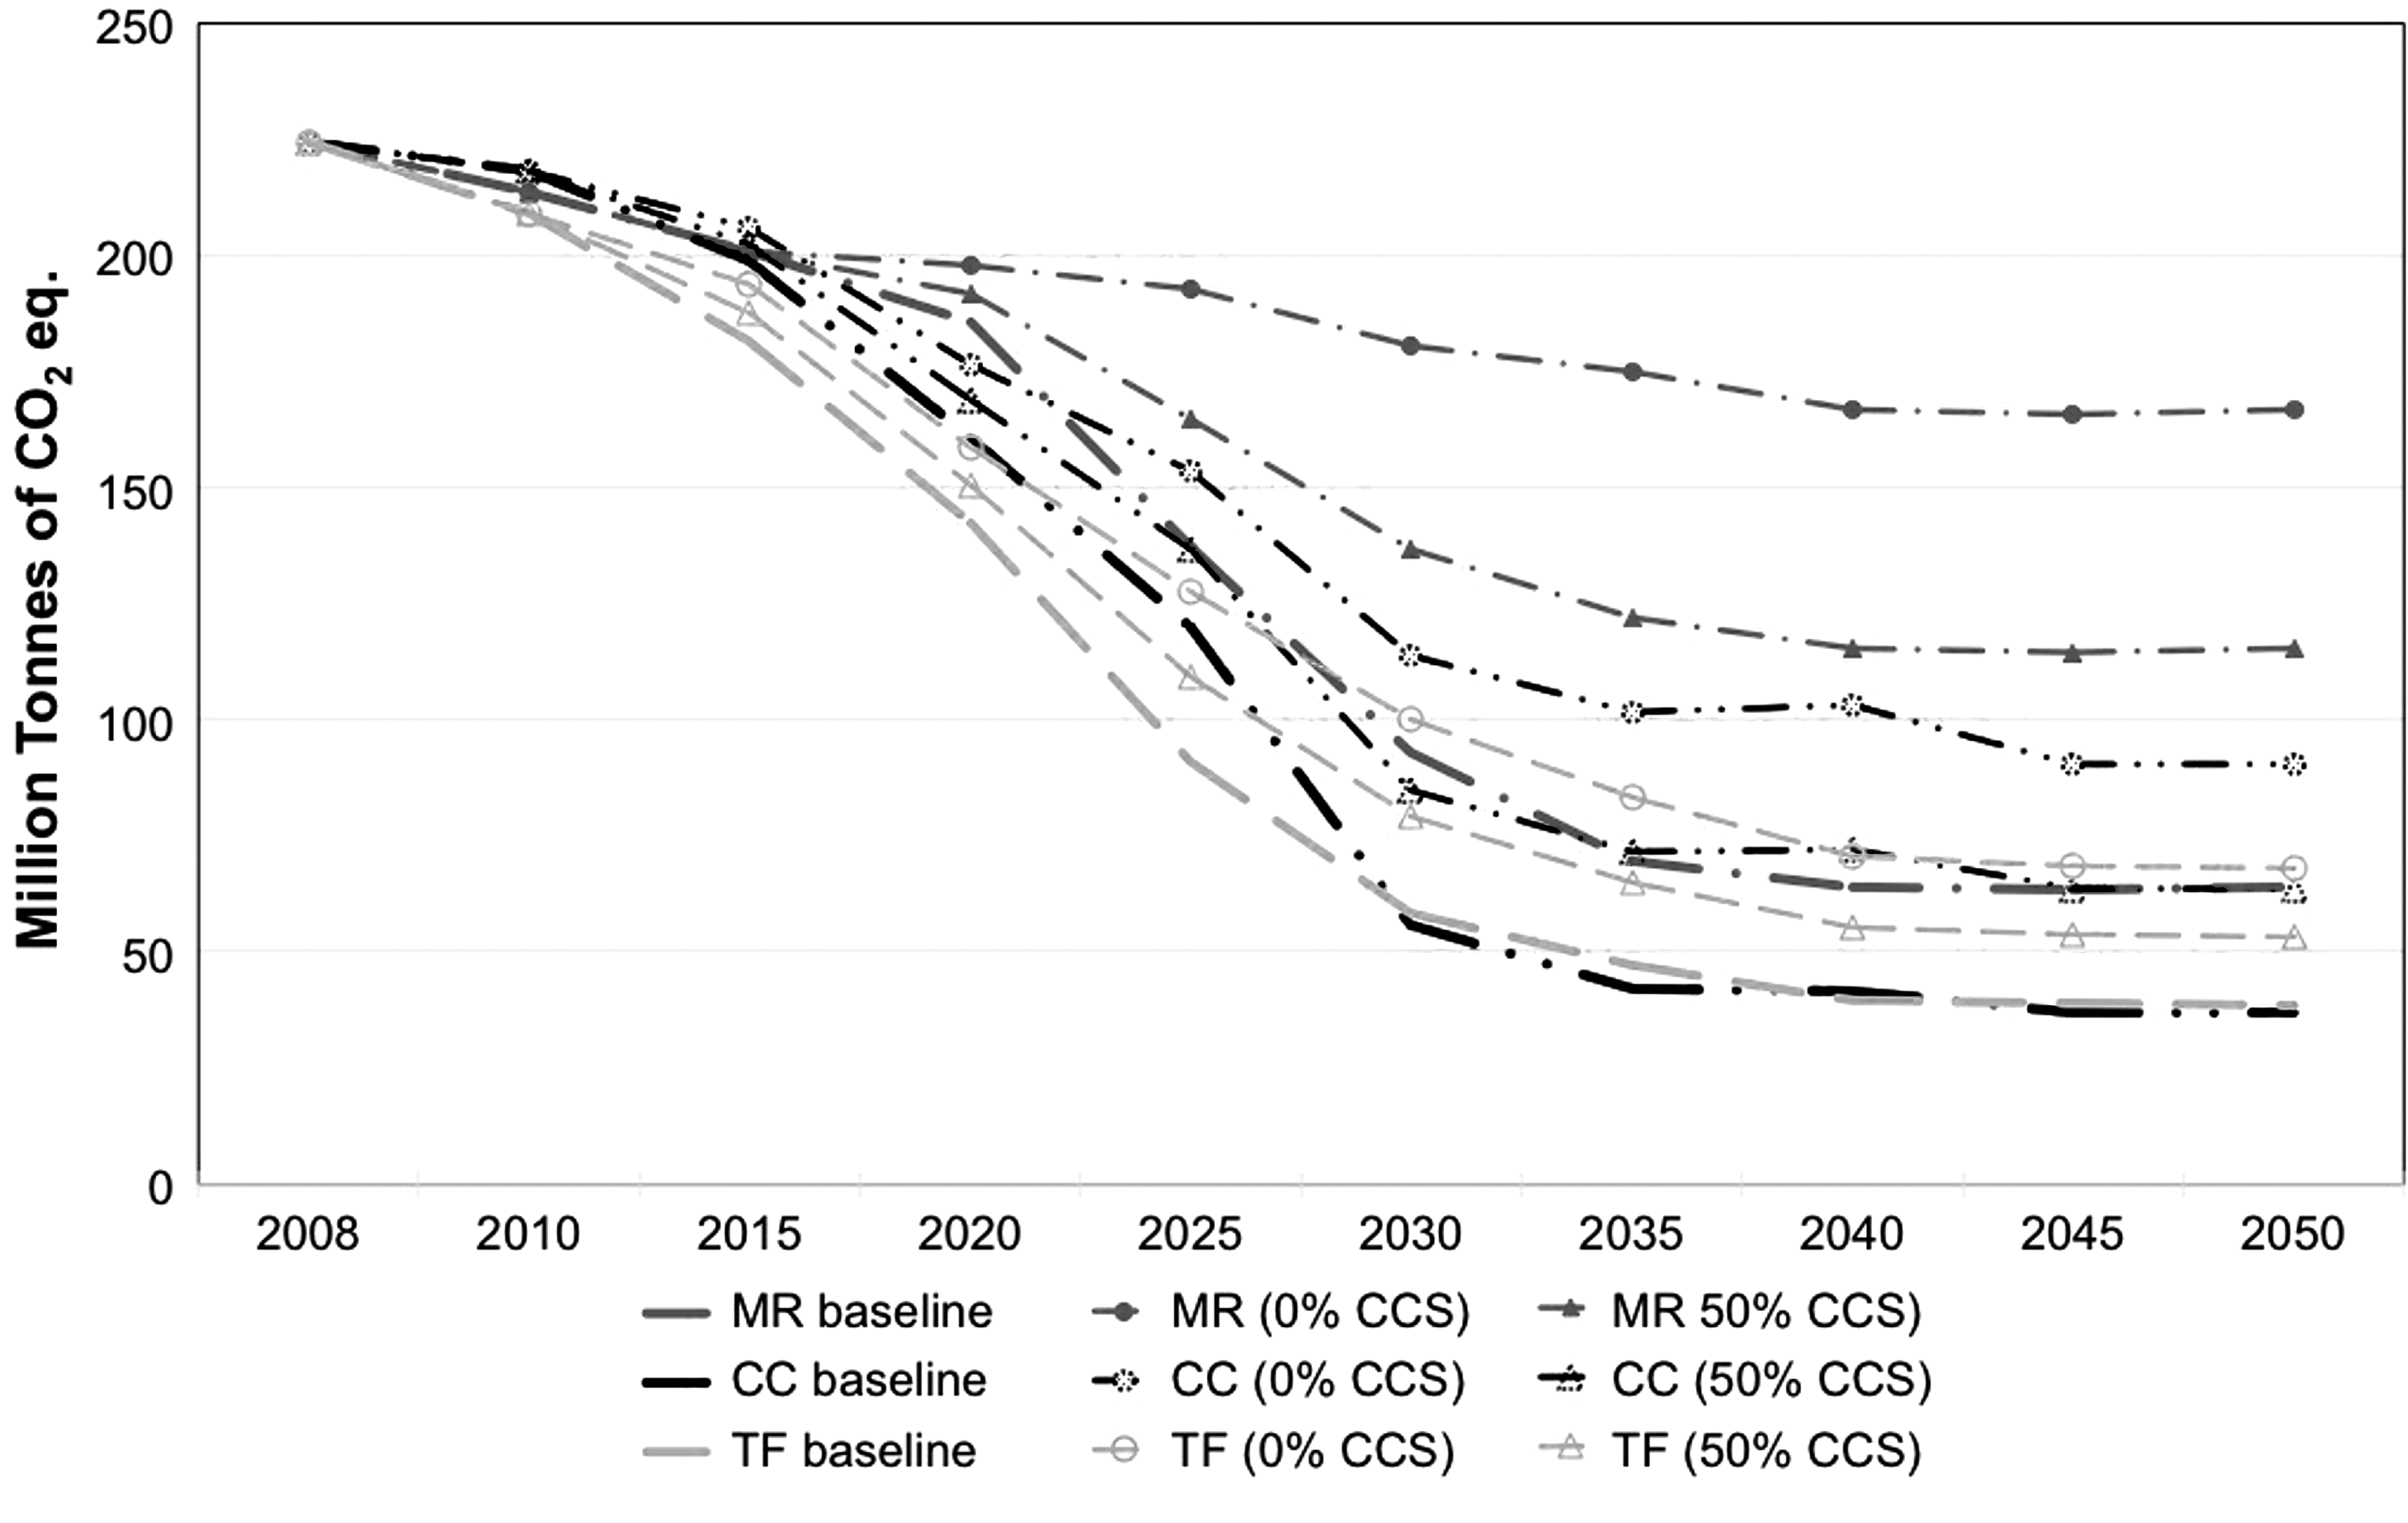
Life-cycle GHG emissions were seen to increase from 64 Mt CO2e for the original MR pathway to 167 Mt CO2e for the MR power sector with 0% CCS in 2050; only attaining a 25% reduction on 2008 life-cycle GHG emission levels. Direct emissions for the MR pathways in 2050 are seen to increase from 25 to 79 Mt CO2e for 50% CCS, and to as high as 130 Mt CO2e for 0% CCS. The reduction in direct emissions achieved by the MR pathway, on 1990 levels, would fall from 88% for the original pathway, to 63% for 50% CCS, and to as little as 40% for a pathway where no CCS is present. Evidently, the realisation of CCS is crucial to the decarbonisation of this pathway. Conversely, TF decarbonisation is only moderately impacted by the absence of CCS, with direct emissions rising from 7.2 to 22 Mt CO2e for 50% CCS, and 38 Mt CO2e for 0% CCS. This represents a drop in GHG reduction on 1990 levels from 97% for the original pathway, to 90% for 50% CCS, and 82% for 0% CCS.
The variation of CCS penetration in the UK electricity system for all three pathways has a much lower effect on CED compared to life-cycle emissions. The greatest reduction in energy demand occurred under the MR pathway in response to the higher penetration of CCS under this pathway. CED dropped by 4.6 × 10⁸ GJ in the MR pathway for 0% CCS case, representing an 8.7% reduction from the original pathway (v3.2). The TF pathway saw the smallest change in CED, only dropping by 6.7 × 10⁷ GJ for 0% CCS, signifying a 6.7% drop from the CED of the original TF pathway.
Fuel type for combined heat and power and its allocation
Two version of the TF pathway were examined to evaluate the potential impact of CHP plants as a disruptive technology: one where all CHP was primarily fuelled by biogas, and another fuelled by biomass. Additionally, three allocation methods were employed to explore their impact on the environmental performance of CHP. The life-cycle GHG emissions range from 27 to 45 Mt CO2e in 2050 under the TF pathway, compared to the original (v3.2) pathway result of 38.6 Mt CO2e. The TF pathway with biogas CHP, using the exergy allocation method had the highest associated GHG emissions, whilst TF pathway with biomass-fired CHP, using energy allocation had the lowest. Total system life-cycle GHG emissions for the TF pathways, therefore, could be up to 30% less, or 17% greater than quantified in the original (v3.2) pathway depending on these considerations.
Furthermore, the use of biomass or biogas to fuel CHP could lead to shifts in the wider environmental performance of the electricity system. Although the 2050 TF pathway electricity system with biogas-fired CHP was shown to emit greater GHG emissions than the system with biomass-fired CHP, it had lower associated environmental impacts over a wide variety of impact categories. Assessing systems using DUKES allocation, human toxicity was lower by 2.8 × 10¹⁰ kg 1,4-DB eq., photochemical oxidant formation lower by 4.1 × 10⁷ kg NMVOC, and particular matter formation lower by 3.9 × 10⁶ kg PM10 eq. (68%, 26% and 4% lower respectively from the system with biomass-CHP). The 2050 TF pathway electricity system with biogas-fired CHP also demonstrated considerably lower terrestrial ecotoxcity and agricultural land occupation, as well as slightly lower ‘urban land occupation.’ However, there was much higher associated terrestrial acidification and also increased associated ozone depletion (Full life-cycle impact assessment results for each 2050 TF pathway system explored can be found in Table SI_ 10).
Concluding remarks
A series of energy policy shifts have been recently announced by the UK Government signifying a new direction, or ‘reset’, for energy policy.10,11 This paper represents the first attempt of evaluating the environmental consequences of these policies for the future UK electricity system. Furthermore, the environmental consequences of a potential policy shift relating to bioenergy supply chains were also investigated. The impacts of these policy shifts were explored employing three Transition Pathways to a more electric low carbon future, which were developed to meet the 2050 UK climate change targets. Both environmental LCA and energy analysis were applied in parallel from ‘cradle-to-gate’ to evaluate the consequences on the performance of the future UK electricity sector.
The three reference pathways (before potential policy changes) were all seen to decarbonise sufficiently to contribute to the statutory target of 80% reduction on direct GHG emissions across the UK economy against 1990 levels. The most decentralised TF pathway has the lowest GHG emissions on a direct basis experiencing a 97% reduction on 1990 levels compared to 88% for the MR pathway, and 93% for the CC pathway. Nonetheless, no pathway succeeds in completely eliminating emissions by 2050 as advocated by the CCC. 9 All the pathways demonstrated much lower reductions on a life-cycle basis, as a result of their upstream emissions, some of which occur outside the national border and are thereby excluded from UK carbon budgets. 30 The MR pathway only achieves a 75% GHG reduction compared to 1990 emissions levels on a life-cycle basis, whereas the CC and TF pathways both achieve around an 85% reduction in GHG emissions. Furthermore, the CC pathway proved to have the lowest life-cycle GHG emissions by 2050. The difference between the direct and life-cycle GHG performances of the three pathways, demonstrate the importance of considering the whole system in order to avoid unaccounted negative effects upstream.
The application of LCA to the pathways highlighted an increase in some environmental burdens across all three pathways compared to the 2008 baseline system. Hence, the decarbonisation of the electricity sector will have to be balanced across the spectrum of environmental issues in order to limit wider environmental damage. As the electricity system endeavours to decouple from fossil fuels, and their associated high GHG emissions, regardless of the pathway, reliance on metal resources will steadily grow as the renewable energy sector develops. For all three pathways, metal depletion increased significantly in terms of 2008 embodied impacts, rising by 75% for the MR pathway, 35% for the CC pathway and 23% for the TF pathway. Despite the CC pathway having the lowest life-cycle GHG emissions, its TF counterpart had the largest associated environmental benefits of all the pathways, realising the greatest reduction in 13 out of 18 impact categories. Additionally, the TF pathway was the only one to decouple its CED from overall electricity demand as a consequence of the large reduction in the NRE use. Globally, GHG emissions have become the central focus in the fight against climate change. These results demonstrate the importance of a fuller consideration of wider environmental concerns, and not just GHG emissions alone.
A key focus of this research was to examine the recent policy shift to eliminate coal generation (the most GHG polluting generator, and presently 30% of the generation mix) in an effort to decarbonise the electricity sector.5,10 This research investigates the effectiveness of this decarbonising strategy, and also the wider environmental implications that may result from the removal of such a dominant technology. GHG emissions did indeed decrease with diminishing coal generation, but at varying rates depending on the Transition Pathway concerned. However, such a move could affect UK security of supply by inducing a significant higher demand of gas even with the possible development of a UK shale gas industry over the medium to longer term. Gas demand for electricity was seen to rise by up to a factor of 2.2 over current levels by 2050 in the MR pathway. Financial difficulties in securing new nuclear power plants in the United Kingdom 54 are likely to exacerbate this issue. The phase out of coal generation could mitigate between 294.5 and 872.4 Mt CO2e of GHG emissions on a life-cycle basis over the course of the transition period to 2050: a reduction of between 7% and 16% in life-cycle GHG emissions, where the larger figures are associated with the MR pathway and the lower figures are associated with the TF pathway. On a direct emissions basis, between 92.9 and 441.3 Mt CO2e of GHG emissions could be mitigated (a reduction of between 4% and 11% direct GHG emissions). The coal phase out was seen to have significant environmental benefits across a wide spectrum of burdens; with 15 out of 18 impact categories exhibiting improvements.
With the government recently withdrawing support and funding into carbon capture and storage 12 development, this paper attempts to measure the significance of our continued use of GHG generators without carbon abatement strategies. A significant finding is that the adoption of CCS in the United Kingdom has much greater potential to mitigate GHG emissions than the early phase out of coal across all pathways. The TF pathway was the only one that secured sufficient decarbonisation (on a direct, operational or ‘stack’ basis) in the absence of CCS to potentially adhere to UK carbon budgets. Direct emissions reduction was seen to fall from 97% against the original pathway on 1990 levels to 82% for the pathway with no CCS incorporated. Nevertheless, all sectors across the economy would need to reach the same level of decarbonisation without carbon capture (i.e. the 2050 80% reduction on 1990 GHG emissions levels). According to the CCC, 9 such a future could double the cost of reaching the UK carbon target. In the absence of CCS, the UK electricity sector must quickly reduce its reliance on both coal and natural gas to a minimum, and also secure large advancements in energy demand reduction in line with the TF pathway.
This work explores the adoption of bioenergy to displace fossil fuels in order to obtain a deeper decarbonisation in the electricity sector. The exact policy decisions to lead this transition are a matter of wider debate. Two different bioenergy pathways, biomass and biogas CHP, are compared in order to help inform these decisions. Both generation types are touted as likely technologies for the exploitation of bioenergy. Results indicate that although GHG emissions associated with biomass were lower than biogas fuelled CHP, it gave rise to greater environmental burdens across other assessed impact categories. The variation in bio-feedstocks was shown to have a significant impact on the life-cycle GHG emissions. Additionally, life-cycle impacts were seen to vary considerable between allocation methods. A standard allocation procedure needs to be selected when informing policy to provide clarity; a matter which requires attention. Although both forms of generations are considered ‘carbon neutral’ (where the uptake in carbon during cultivation balances the bioenergy direct emissions, considered effectively zero under direct carbon accounting practices), the life-cycle emissions were seen to vary considerably; ranging between 30% less or 17% greater than the original (v3.2) pathway in 2050. As the electricity system continues to decarbonise, these GHG emissions from the bioenergy supply chains may become increasingly influential, as seen here in the TF pathway, effectively locking the system to a potentially higher level of emissions. An increased demand for bioenergy supply will inevitable result in various environmental trade-offs, these will be largely dependent on specific choices taken, and as highlighted in this work, which must be assessed comprehensively.
This study quantifies the wide range of environmental consequences that are likely to result from policy shifts – some in the recent UK energy policy ‘reset’ – on future UK low carbon electricity systems. This work illustrates the guiding principles of LCA as a valuable tool to measure the effects of proposed policy decisions, and in the case of bioenergy choices as a proactive tool in the shaping of new policy choices ahead. The shifting energy policies had different impacts depending on the future pathway and disruptive technologies examined, but indicated that environmental trade-offs were unavoidable. The value of any new policy direction must be evaluated not only against medium-term climate change goals, but against long-term, system-wide goals over a wide spectrum of environmental metrics.
Footnotes
Acknowledgements
The authors are grateful for the interaction with other members of the Consortium (and its predecessor) made up of participants from nine UK universities. However, the views expressed here are those of the authors alone, and do not necessarily reflect the views of the collaborators or the policies of the funding body.
Declaration of Conflicting Interests
The author(s) declared no potential conflicts of interest with respect to the research, authorship, and/or publication of this article.
Funding
The author(s) disclosed receipt of the following financial support for the research, authorship, and/or publication of this article: This work is part of a programme of research at the University of Bath on the technology assessment of low carbon energy systems and Transition Pathways that is supported by a series of UK research grants and contracts awarded by various bodies. In the present context, Professor Hammond is jointly leading a large consortium of university partners funded by the UK Engineering and Physical Sciences Research Council (EPSRC) entitled ‘Realising Transition Pathways: Whole Systems Analysis for a UK More Electric Low Carbon Energy Future’ [under Grant EP/F022832/1]. Áine O’ Grady is wholly funded via this grant. The authors’ names are listed alphabetically.