
Abstract
This paper presents a discussion of the development of wind energy generation in the United Kingdom and the challenges faced by the wind industry including reliability, performance and condition monitoring, particularly in the offshore environment. The worldwide installed capacity of offshore wind has now risen to over 7 GW, with an ever increasing deployment rate of new assets. About 90% of the global currently installed capacity is in Northern Europe, with the United Kingdom having the world's largest share at 4 GW. Capacity factor data from UK offshore wind farms is presented, providing an insight into the current performance of large Round 2 offshore wind farms compared to the earlier Round 1 farms and to onshore farms. The data reveal that the United Kingdom's Round 2 offshore farms are achieving an average monthly capacity factor of 38.3% with a peak value of 75.8%. The older Round 1 farms have a lower average capacity factor of 33.6% while large onshore farms with capacities above 100 MW have achieved 25.6%. Offshore wind turbine performance has improved over time, and the industry is applying the learning from early experiences to achieve better performances at the more recently installed farms. Despite these improvements in turbine availability, the cost of energy from wind, particularly offshore, remains too high for it to be a commercially viable form of generation without subsidies. Reducing the cost of energy from wind to economically sustainable levels is the most important challenge facing the industry today. Operation and maintenance costs constitute up to 30 % of the total cost of energy from wind in large farms. The industry must overcome the challenges associated with improving component reliability and the development and adoption by operators of appropriate condition monitoring systems and maintenance strategies, in order to reduce costs to sustainable levels. Research and development work carried out with these goals in mind is also reviewed in the paper.
Introduction
The challenges of climate change, energy security and cost of energy are becoming ever more present for governments across the world. As a result, governments are changing their approaches to electricity generation and countries are seeing significant diversification in their energy generation mixes, moving towards renewable sources, nuclear and clean conventional plant.
The exploitation of renewable energy resources is central to European Union (EU) environmental and energy policy goals. The EU has committed to a legally binding target of meeting 20% of its total energy demand (heating, transport and electricity) from renewable sources by 2020. If this target is to be realised it means that 34% of electricity generated 1 will need to come from renewable sources by this date. In a communication entitled ‘A policy framework for climate and energy in the period from 2020 to 2030,’ the EU proposes increasing the share of renewable energy to at least 27% of EU energy consumption by 2030 with the aim of decarbonising the economy by between 80% and 95% by 2050. 2
Wind energy has become the strongest and fastest growing renewable energy technology worldwide over the last 30 years, thanks largely to recent technological advances and commercial growth. It now plays a central role in the immediate and longer-term energy strategies of many countries.
By the end of 2013, the global installed capacity of wind turbines (WT) stood at 318.1 GW, of which 117.3 GW was installed in the EU. 3 Projections by the European Wind Energy Association (EWEA) in 2011 suggest that 230 GW of wind capacity will be installed in the EU by 2020, rising to 400 GW by 2030 and 735 GW by 2050. 4 In 2007, the European Commission reported 5 a lower target installed capacity of 146 GW by 2030 of which 129 GW would be onshore and 17 GW offshore. The EWEA 2014 European Statistics report 6 shows 128.8 GW of installed capacity in the EU with approximately 120 GW onshore and 8 GW offshore. These current figures suggest that the EU is on course to pass the European Commission expectation for 2030; however, there is a long way to go before the EWEA projections are realised.
A significant proportion of this forecast installed capacity is expected to be offshore, with many new large-scale sites already identified for development in Europe due to the favourable wind resources and sub-sea conditions.
Offshore wind has advantages over onshore both technically and in terms of public perception. Offshore average wind speeds are higher and turbulence is generally lower than in the onshore environment, which results in greater energy capture for a given wind farm size. Politically and in terms of public perception, offshore wind has the advantage that visual impact and noise concerns are largely mitigated by distance, although challenges remain with respect to marine life. There is also significant potential for very large-scale offshore sites to be developed. Onshore farms are generally much more limited in capacity due to space constraints; however, large-scale sites have been developed in the USA where the large plains can deliver favourable wind conditions.
The worldwide installed capacity of offshore wind current stands at approximately 7 GW 3 and is increasing on a daily basis. Around 90% of this capacity is in northern Europe. The United Kingdom is the world leader in offshore wind with an installed capacity of over 4 GW. Industry projections suggest that there will be 8 GW of UK offshore capacity by 2016 rising to around 18 GW by 2020, supplying 18–20% of UK electricity demand. 7
The performance of offshore wind farms is explored in this paper by making use of extensive capacity factor data from large UK onshore and offshore wind farms. This data also allows the improvement in wind farm performance as operators gain experience to be assessed.
The cost of energy from wind farms is one of the main barriers that is currently restricting wider adoption of this form of renewable energy generation. Operating and maintenance (O&M) costs are significant, particularly for offshore wind. The technical challenges that must be overcome in order to reduce O&M costs are also discussed in the paper.
Performance of UK wind farms
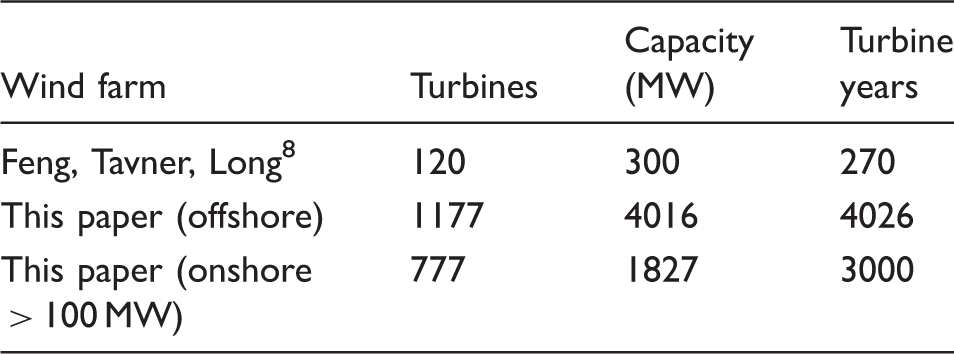
Initially, concerns existed over the feasibility of offshore wind in the United Kingdom, with reliability and potential reduced availability due to access difficulties, being cited as core issues. However, the launch in 2001 of the ‘Offshore Wind Capital Grants Scheme’ by the UK Department of Trade and Industry led to investment in five farms of 60–90 MW scale (North Hoyle, Scroby Sands, Kentish Flats, Barrow and Burbo Bank). All of these have now been fully operational for at least 7 years. The sites offered the potential for the United Kingdom to gain vital experience of offshore technology and operations. Under the Capital Grants Scheme, a number of reports on the operating history of the wind farms were made publicly available. The data, analysed in Feng et al., 8 found that the farms were achieving an overall average availability of 80.2% with an average capacity factor over 3 years of 29.5%. 9 However, the capacity factor remained below the estimate for EU offshore wind farms of 35%, based on Danish experience. This was partly due to the low availability of 80.2%.
UK offshore wind farms. Data collated by the Renewable Energy Foundation (REF), 10 covering the 10-year period from July 2004 to June 2014.
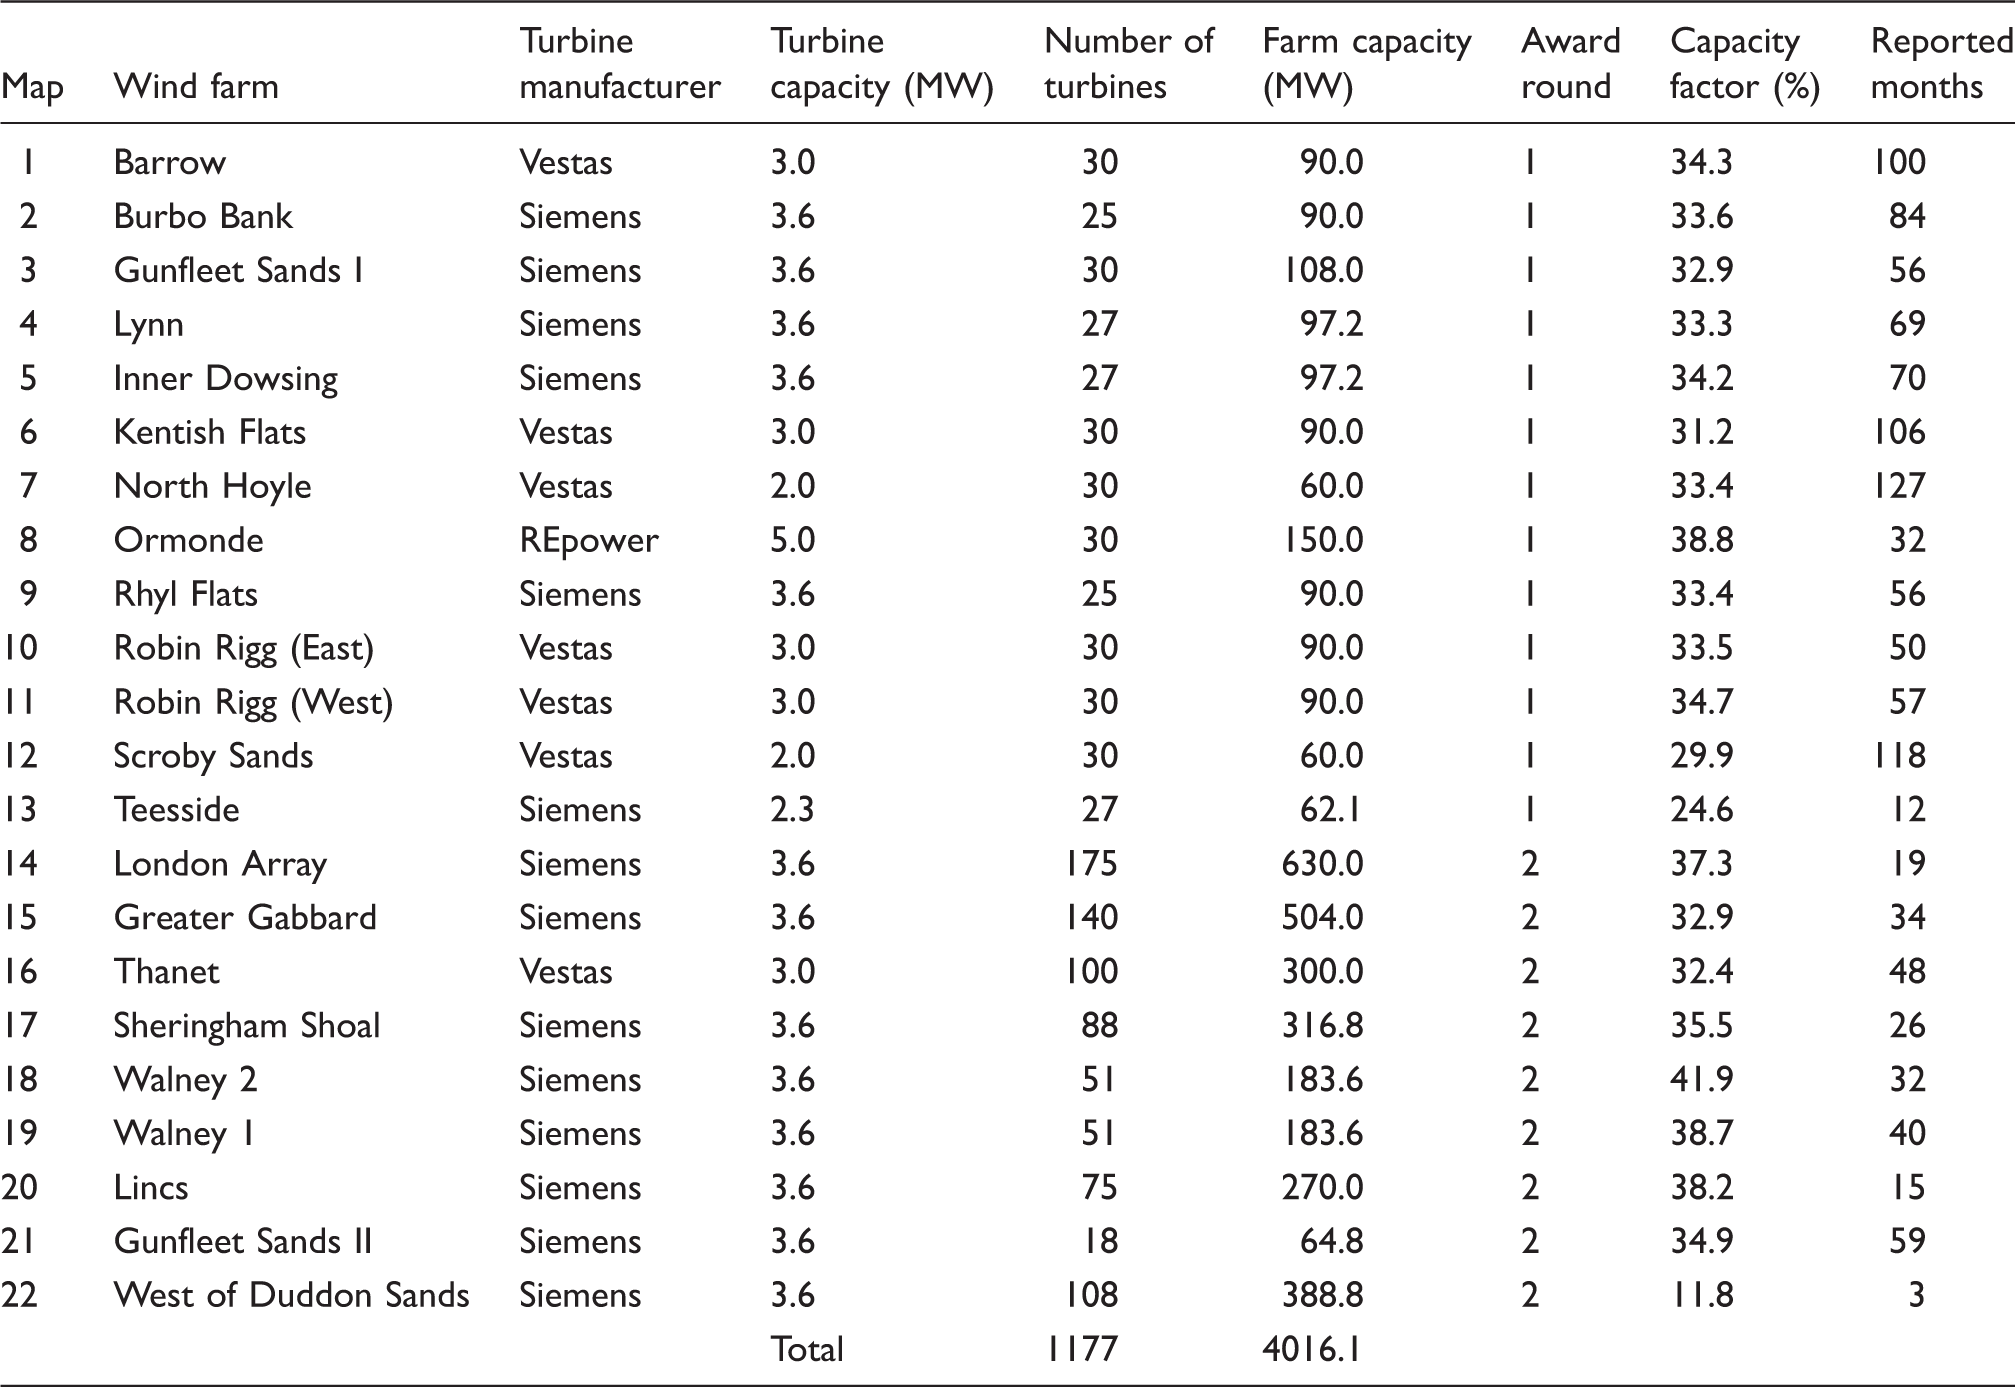
In addition to the farms listed in Table 1, the United Kingdom has two test sites, each with two turbines. The two 2 MW Vestas turbines at Blyth, Northumberland, were the United Kingdom's first offshore turbines. These have been operating intermittently since the year 2000. The Beatrice wind farm, in the Moray Firth, features two 5 MW REpower turbines. These were constructed in order to assess the feasibility of installation and operation in deeper waters than the United Kingdom had previously experienced. No continuous data is available from these test sites. The map numbers in Table 1 correspond to the map of offshore wind farms in Figure 1.
Map of UK offshore wind farms. Map data: Google, SIO, NOAA, US Navy, NGA, GEBCO, Image Landsat.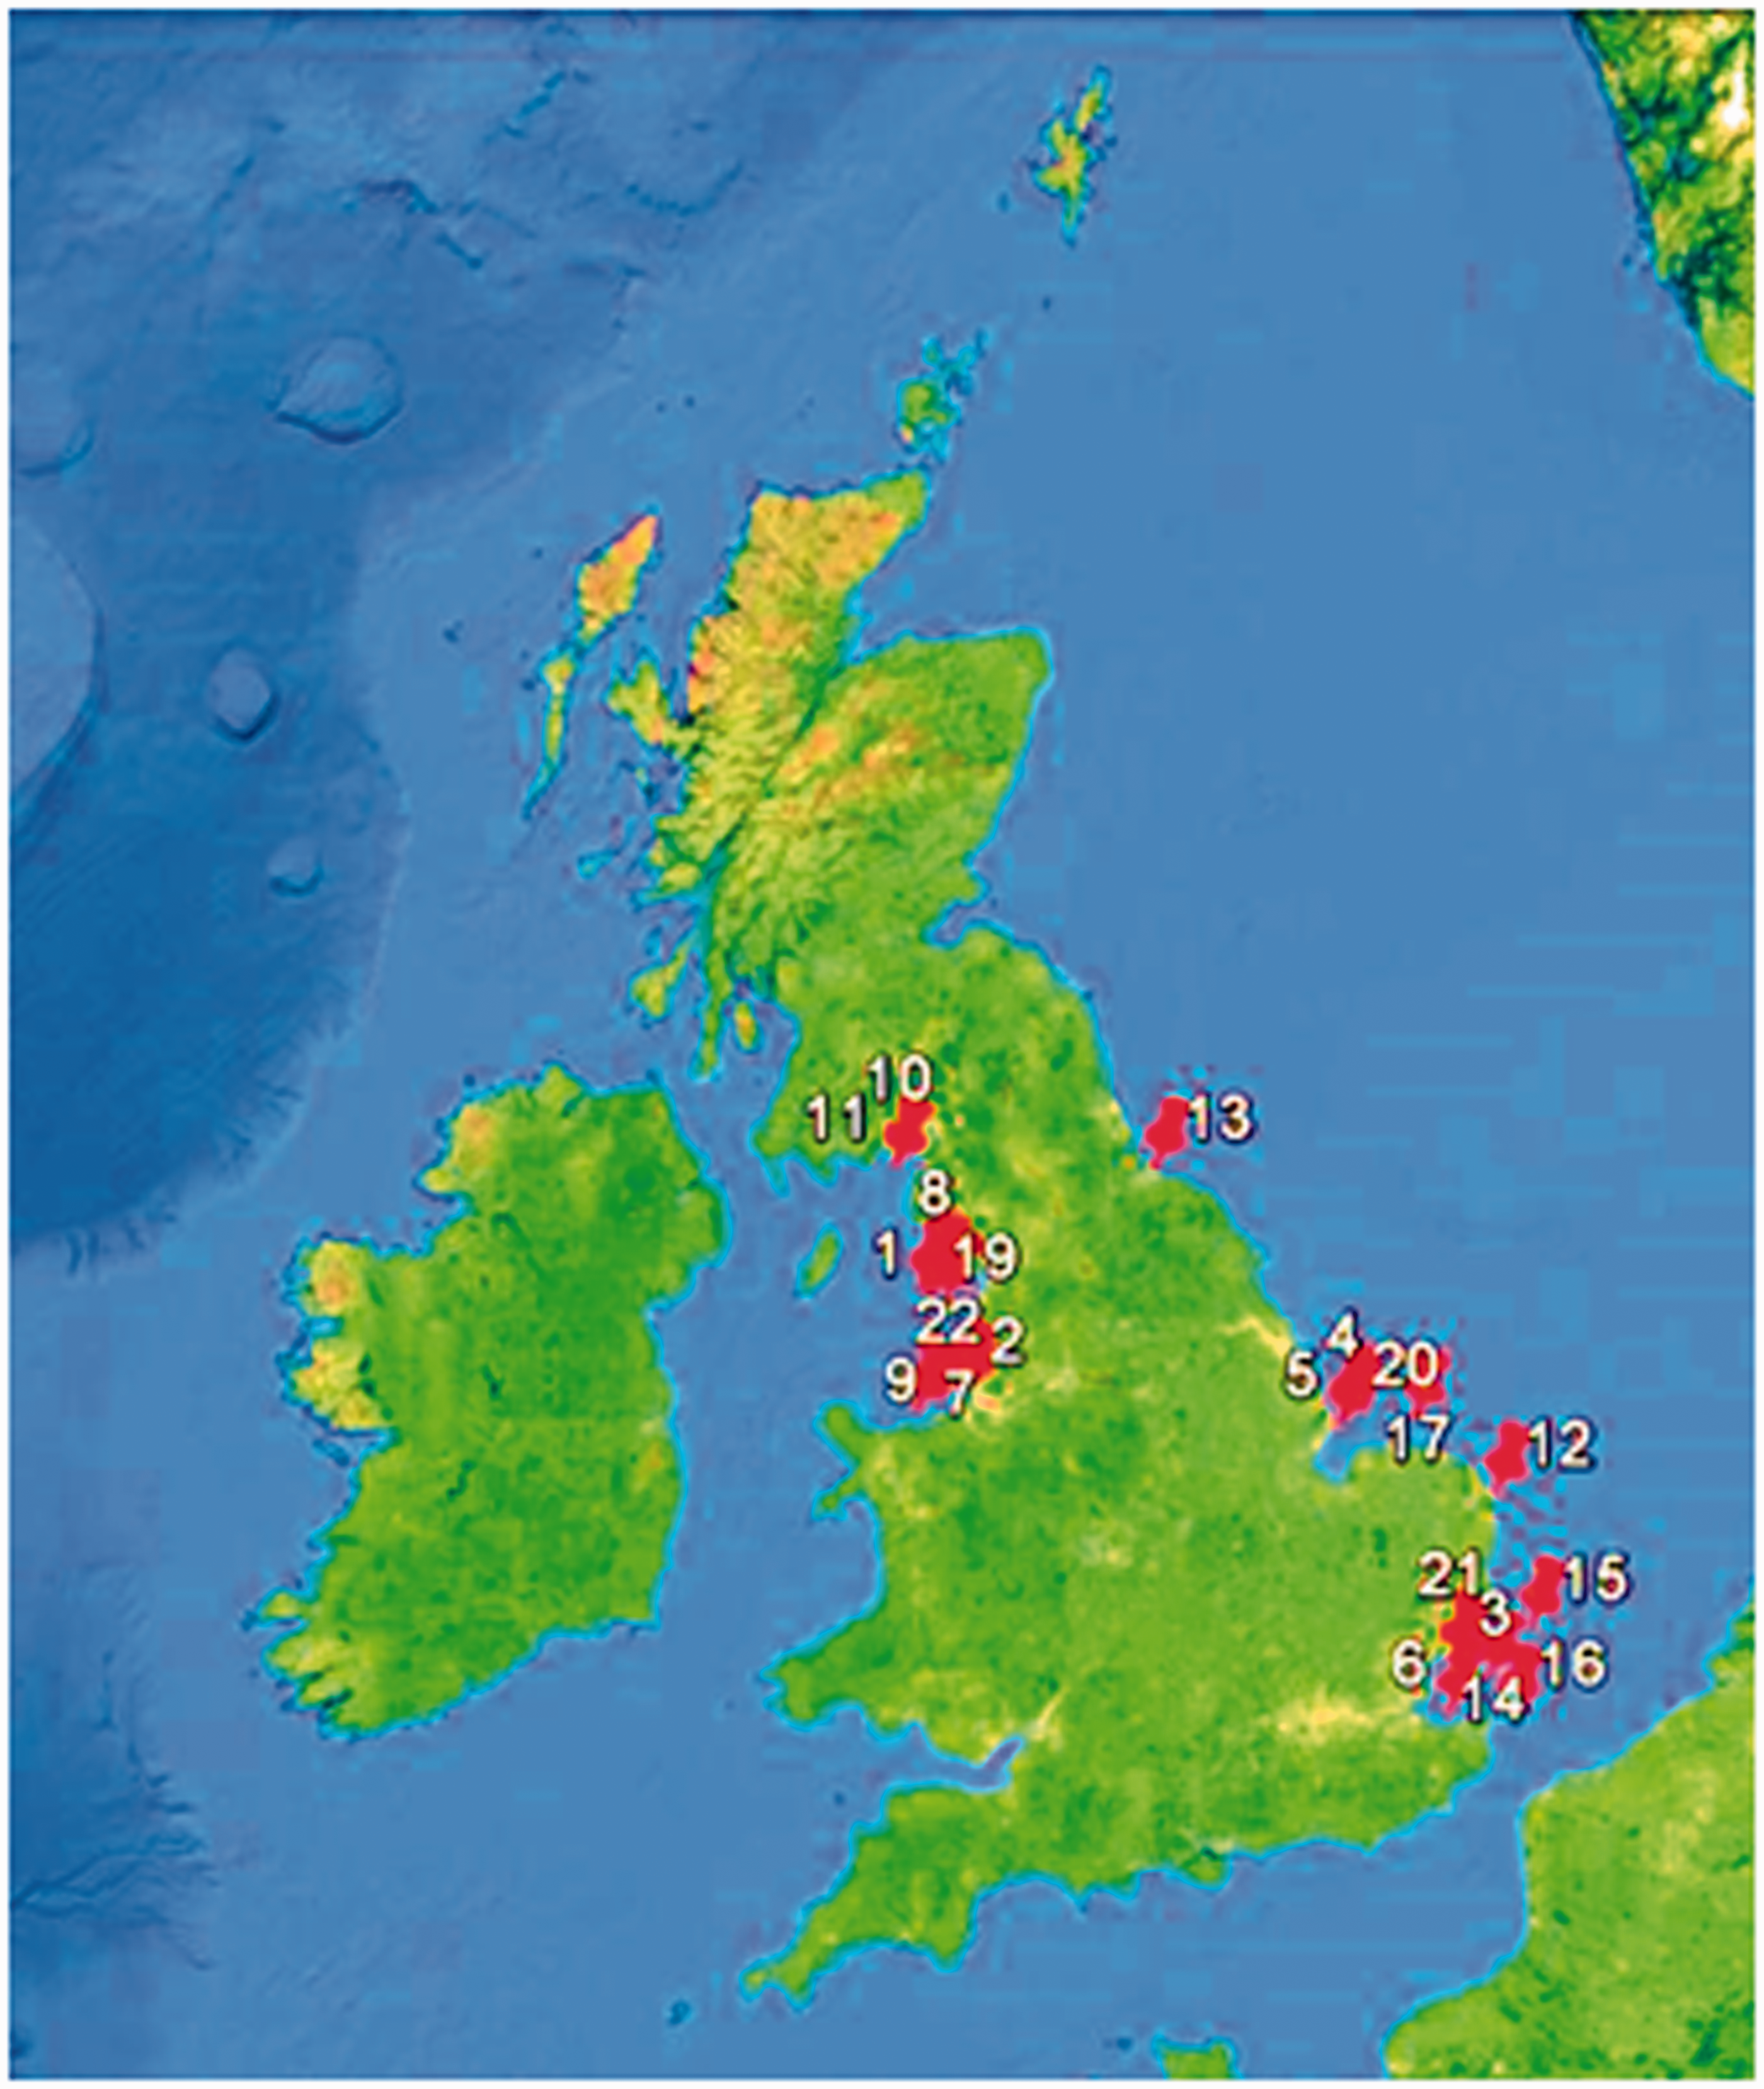
The performance of the full-scale offshore wind farms can be investigated by examining available capacity factor or production data. Capacity factor is defined as the delivered annual energy yield (MWh) divided by the theoretical maximum energy production of a farm or turbine over a 1-year period i.e. rated power (MW) multiplied by the 8760 h in a year.
11

Capacity factor data is also calculated on a monthly basis using a similar definition to that given above, but for a 1 month rather than 1-year time period.
Monthly capacity factor data has been reported by each of the wind farms in Table 1 through a number of different schemes:
Renewable Obligation subsidy certificates (ROCs) Renewable Energy Guarantees of Origins (REGOs) Climate Change Levy Exemption Certificates (LECs)
Data from these three sources have been compiled by the Renewable Energy Foundation and is publicly available via their online database. 10 The 2010 study of the UK Round 1 sites 8 included data from North Hoyle, Scroby Sands, Kentish Flats and Barrow wind farms, with a total of 270 turbine years summarised within the capacity factor data. The offshore wind farm capacity factor data used in this study 10 is much more extensive than this, including approximately 4000 turbine years.
Capacity factor data are also available for onshore wind farms from the Renewable Energy Foundation.
10
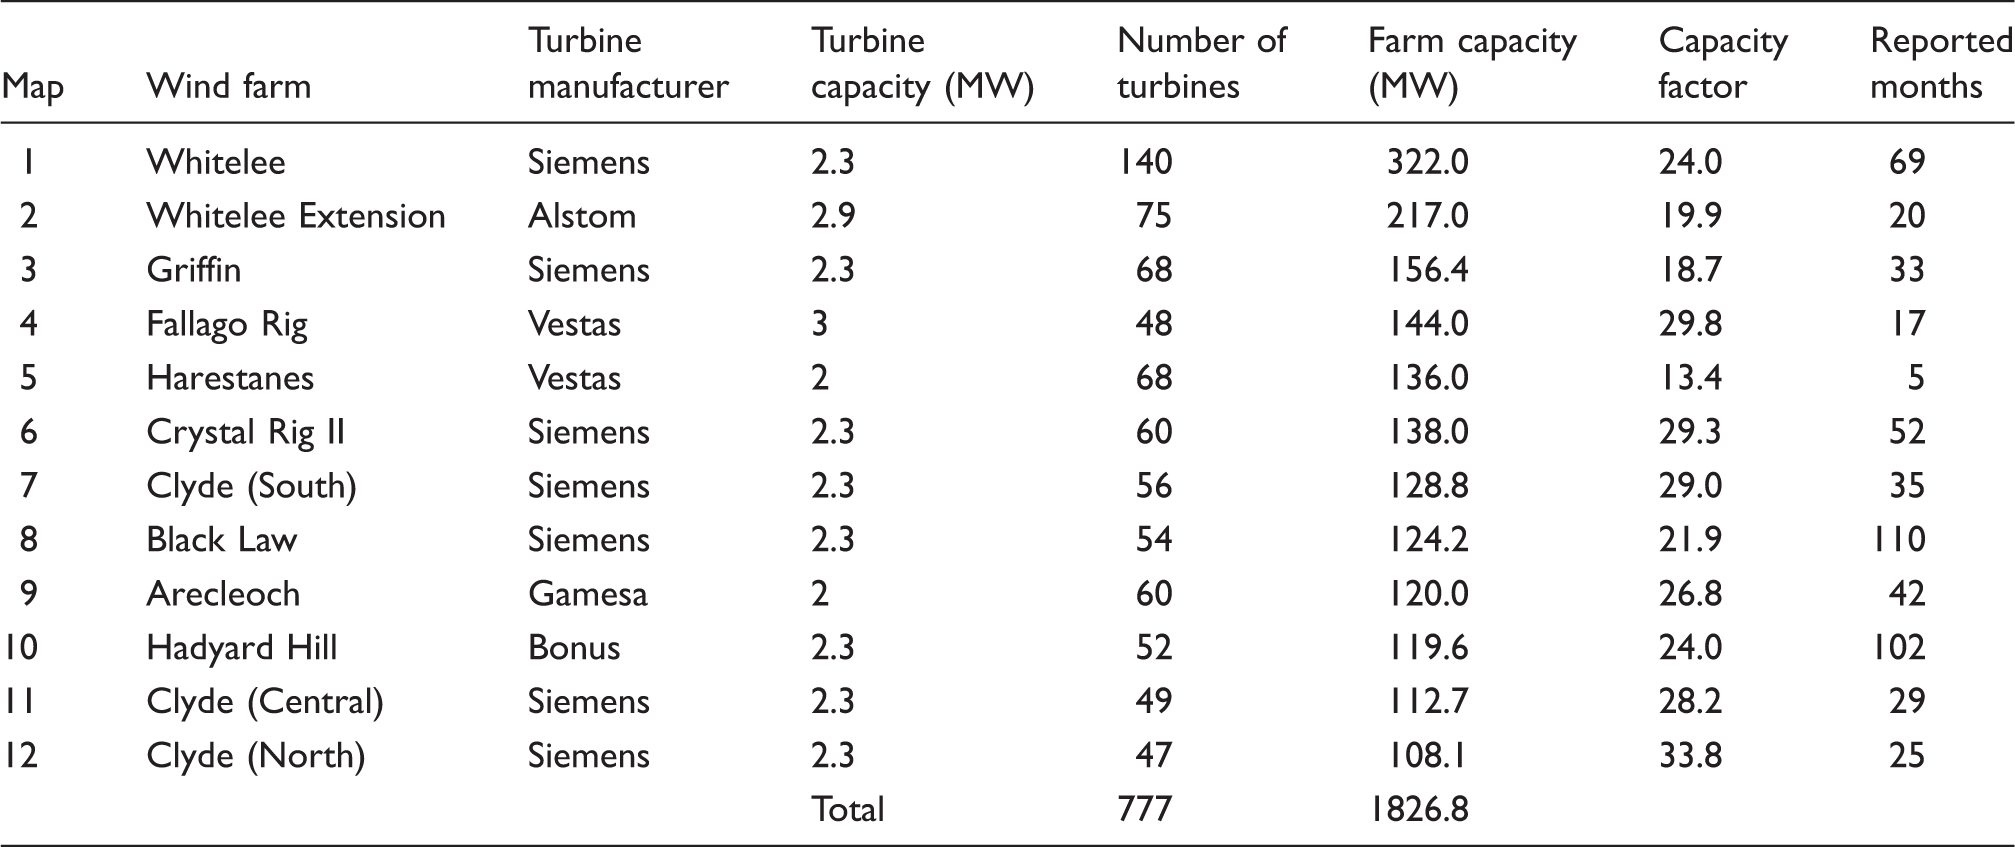
To allow a reasonable comparison between onshore and offshore wind farms, 12 onshore wind farms with capacities greater than 100 MW are considered. The available data, covering approximately 3000 wind turbine years, is summarised in Table 2. The map numbers in Table 2 correspond to the map in Figure 2.
Map of UK large (> 100 MW) onshore wind farms. Map data: Google, SIO, NOAA, US Navy, NGA, GEBCO, Image Landsat. UK onshore wind farms with capacity greater than 100 MW. Data collated by the Renewable Energy Foundation (REF),10 covering the 9-year period from October 2005 to June 2014.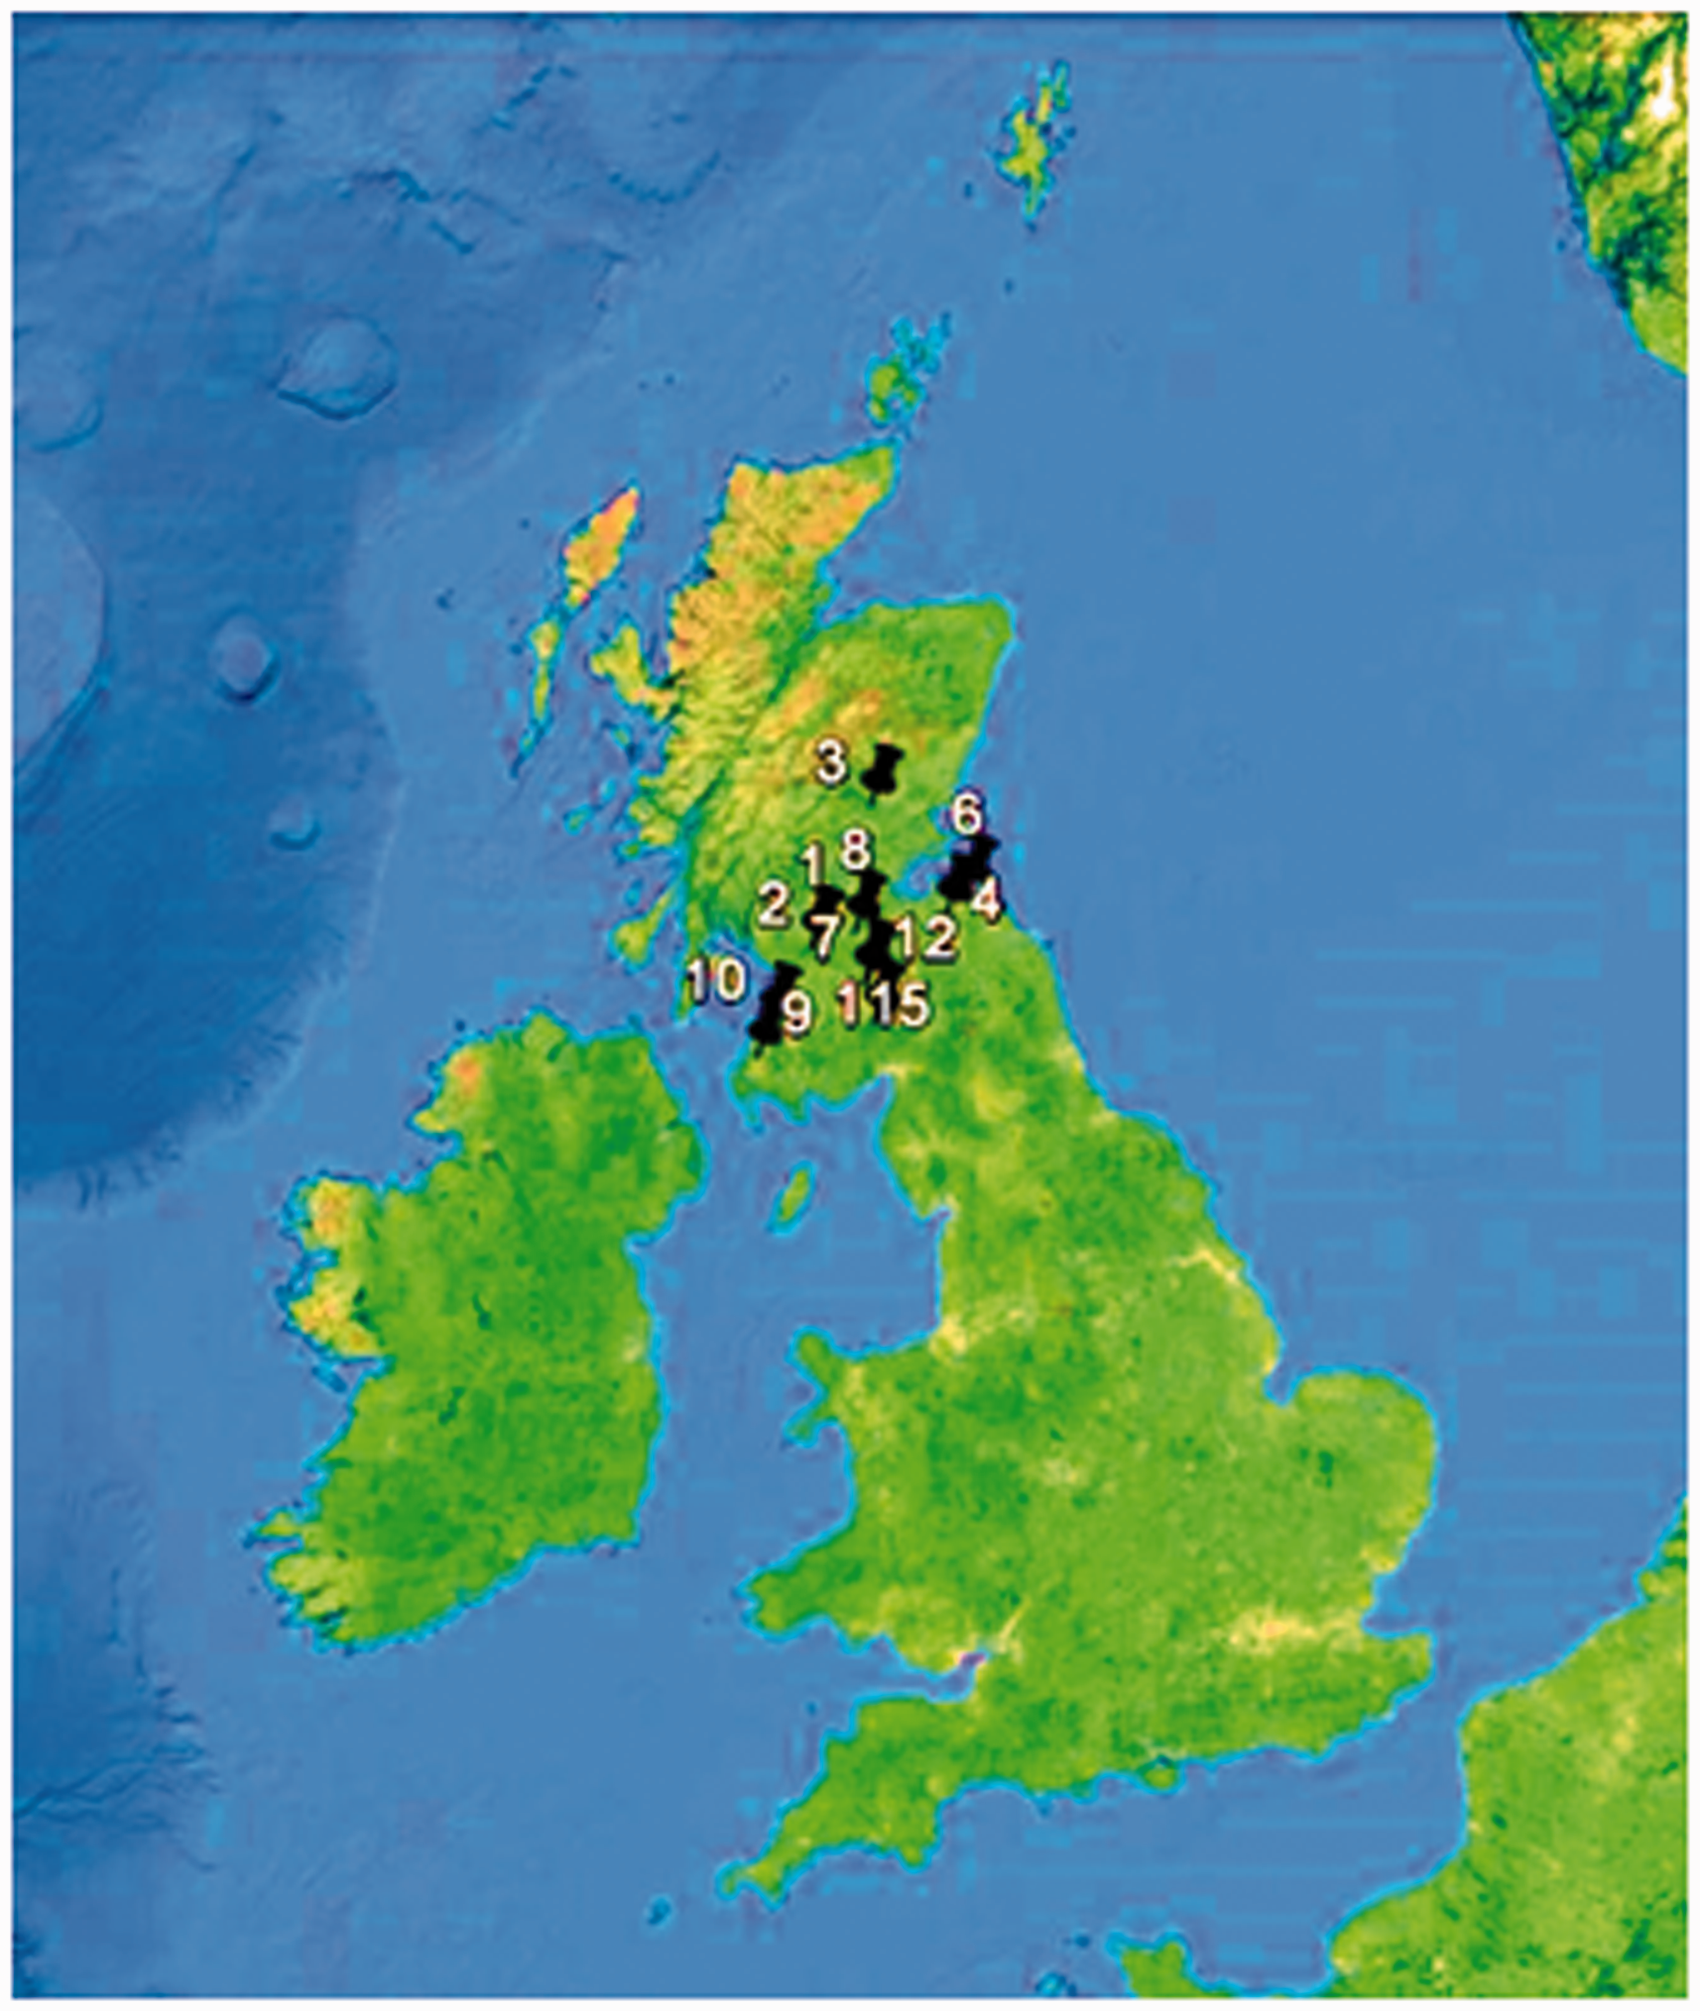
Capacity factor data population for this and previous studies.
For the majority of the wind farms in Tables 1 and 2, the turbines were commissioned as they were constructed. This resulted in initially very low farm-level capacity factors being reported during periods when only a small number of turbines were generating and many more were still under construction. Previous studies, including 12 removed the early data based on a threshold capacity factor in order to ensure that the data used was representative of normal operation of the farm.
Summary of original and cleaned data.
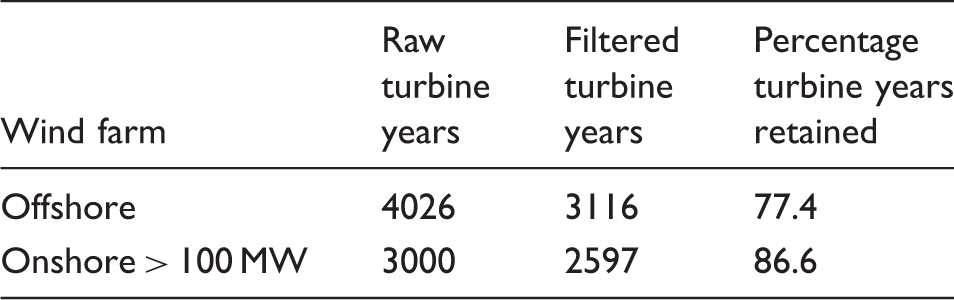
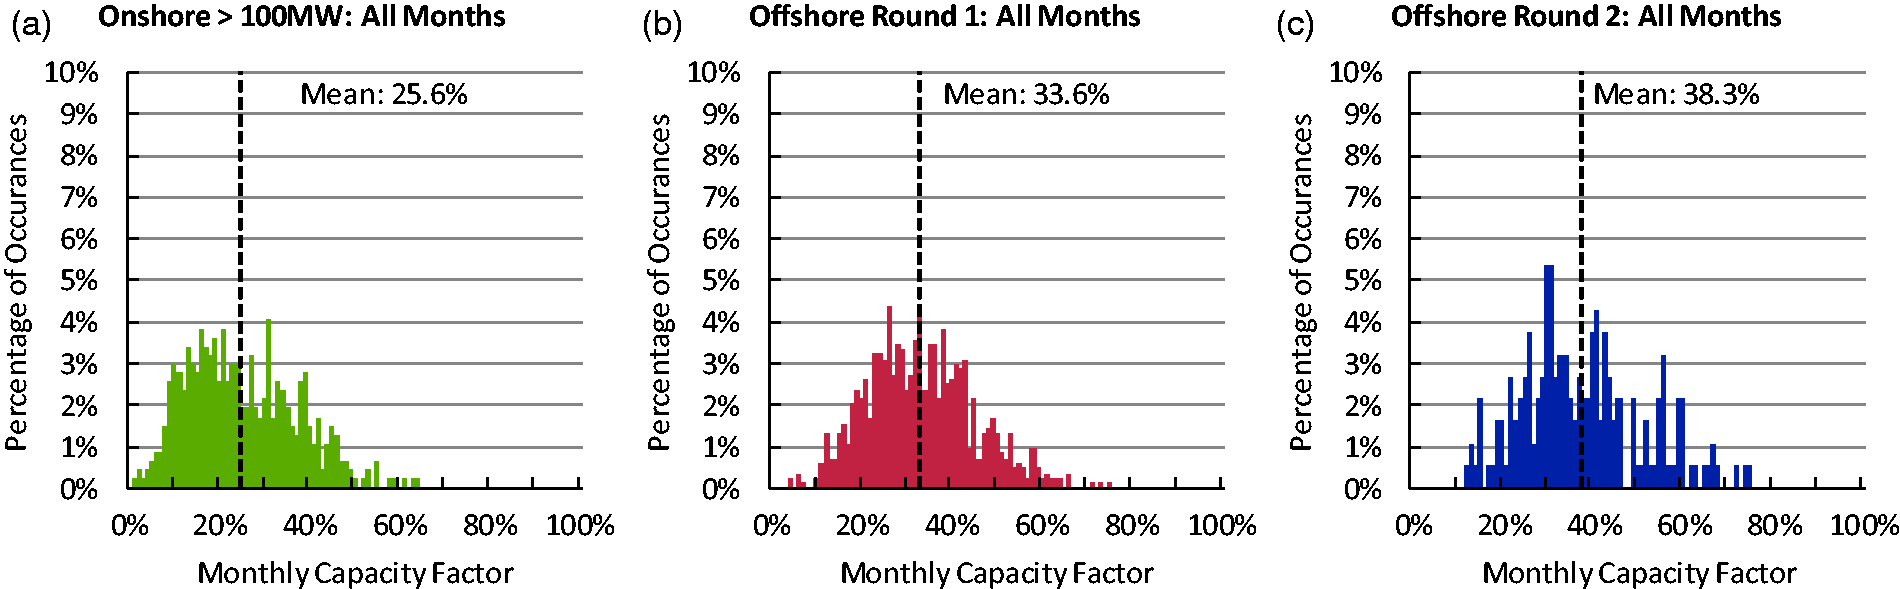
Figure 3 shows the number of reporting wind farms with farm age from date of commissioning split into offshore Round 1, Round 2 and Onshore > 100 MW categories. The most comprehensive historical data is available for Round 1 offshore wind farms, with some farms now having completed 10 full years of operation. Figure 4 summarises the performance of turbines for each of the three wind farm categories, over their lives to date. The distributions are clear and suggest that few extremes of operation are being encountered. It should be noted that the data in Figure 4(c) is relatively sparse and therefore not as statistically significant as the other categories; however, the distribution obtained from the data is similar to the other datasets shown.
Number of reporting wind farms with farm age from commissioning for: (a) large onshore, (b) offshore Round 1 and (c) offshore Round 2 wind farms. Histogram of capacity factors normalised to the total number of reported months for: (a) large onshore, (b) offshore Round 1 and (c) offshore Round 2 wind farms.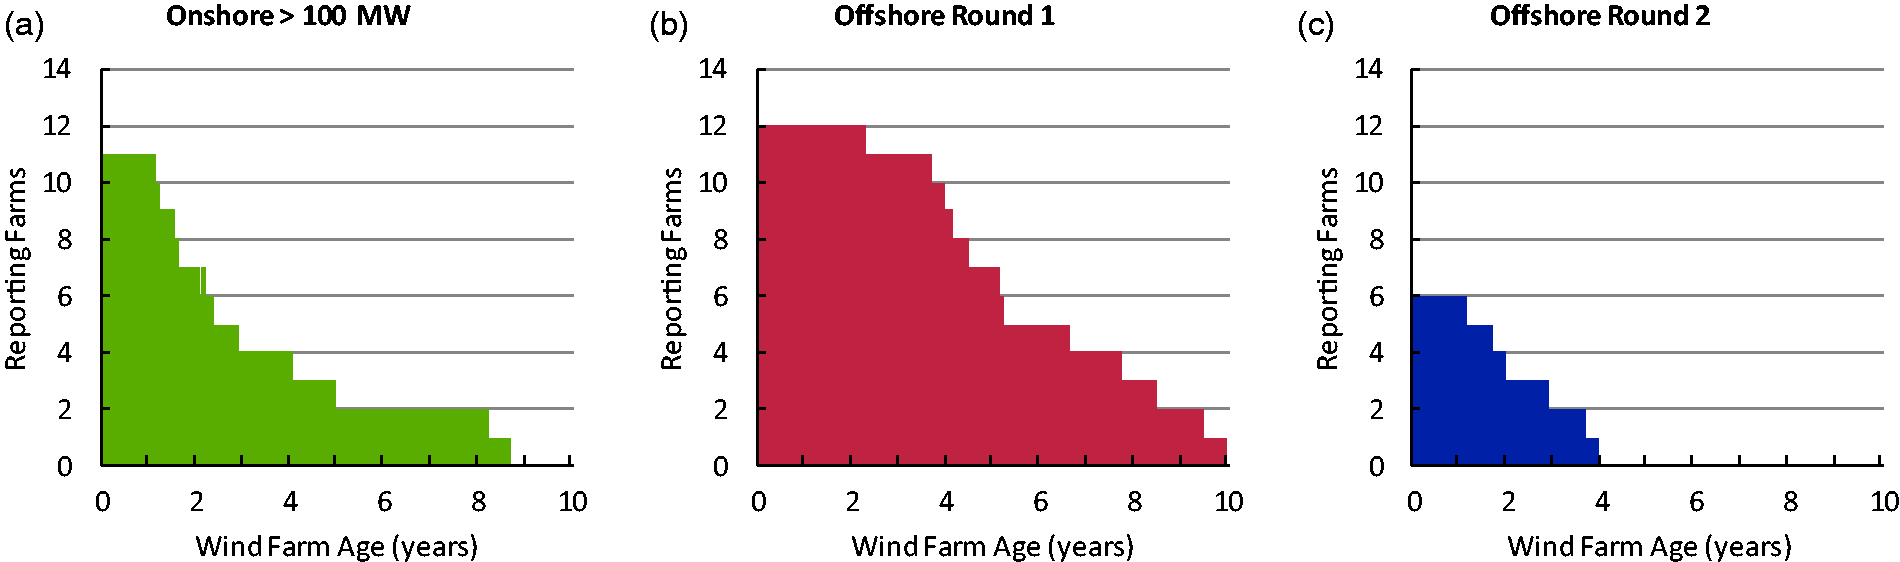
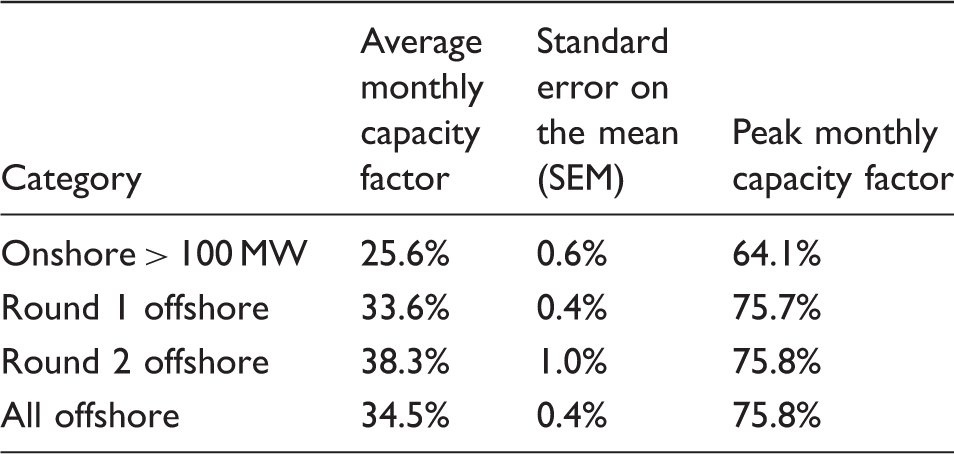
Summary of capacity factors for UK large onshore and offshore wind farm fleets.
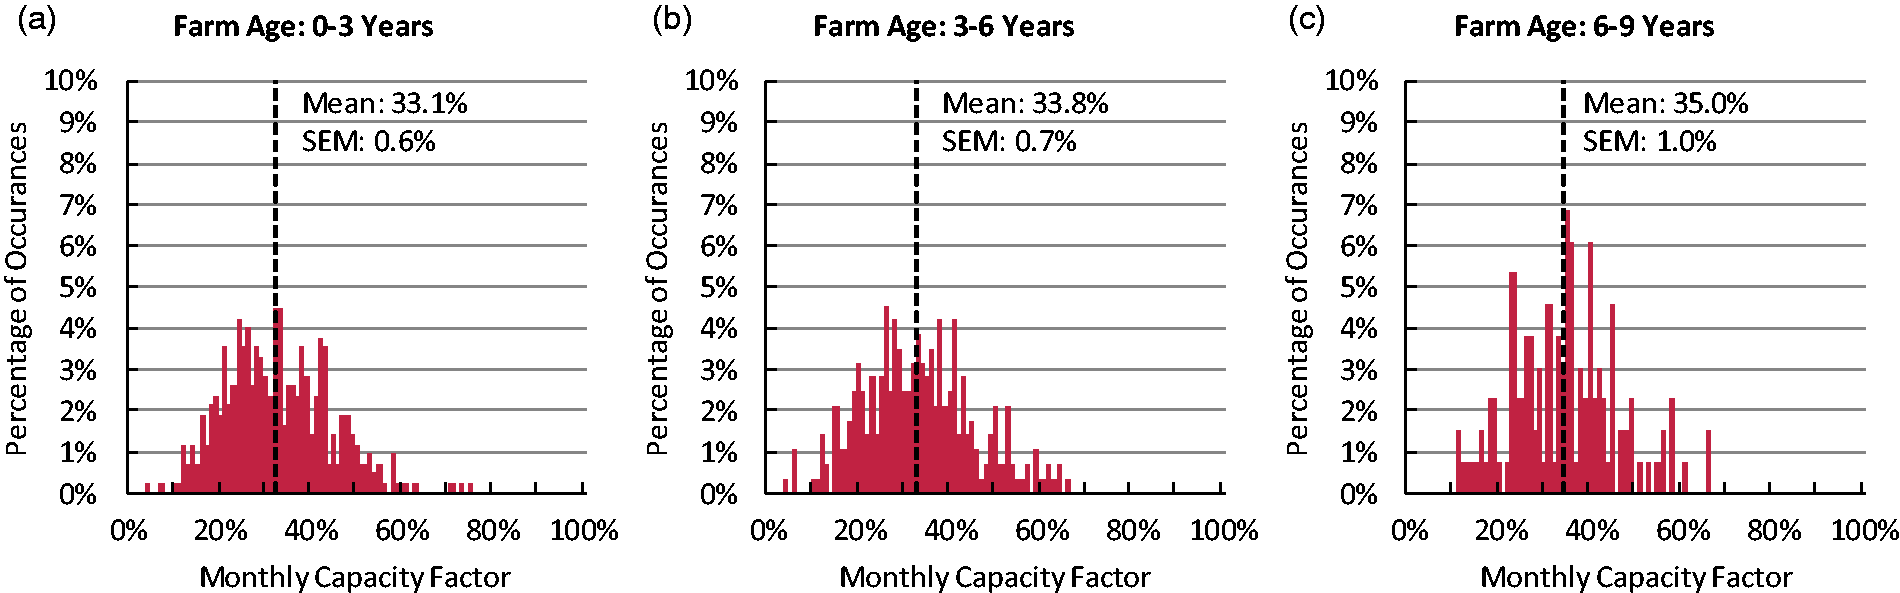
The distributions of capacity factor can be broken down to illustrate performance over time. Figures 5 and 6 show histograms of capacity factor with turbine age for, respectively, onshore > 100 MW and Round 1 offshore sites. For Round 2 sites, not enough data is available to form a meaningful histogram beyond year three. There is a noticeable different between Figure 5 and Figure 6 in that the average capacity factor with time increases offshore but decreases onshore. It can also be seen that the distributions become less stable over time, with greater noise present, particularly beyond year six because of the fewer observations for older farms. The causes of this change in capacity factor distribution cannot be directly inferred from the data as capacity factors depend on a number of variables including wind speed, turbine availability and curtailment, for example. However, the data can be compared with findings from Hughes
12
and Staffell and Green
15
which state that turbine performance is decreasing over time as machines age. The data in Figure 6 (Round 1 offshore) suggests improving performance over time, with average monthly capacity factors over 3-year periods by year of operation increasing from 33.1% to 35%. Two possible explanations for this improvement are that average monthly wind speeds may have increased continuously over the 9-year period of operation, leading to higher energy yield, or that operation and maintenance regimes have matured to reduce downtime, leading to increased availability for energy production. Further study is required to fully understand why the capacity factor of Round 1 offshore wind farms has increased with time despite ageing assets.
Capacity factor distribution with age for onshore wind farms >100 MW. Capacity factor distribution with age for Round 1 offshore wind farms.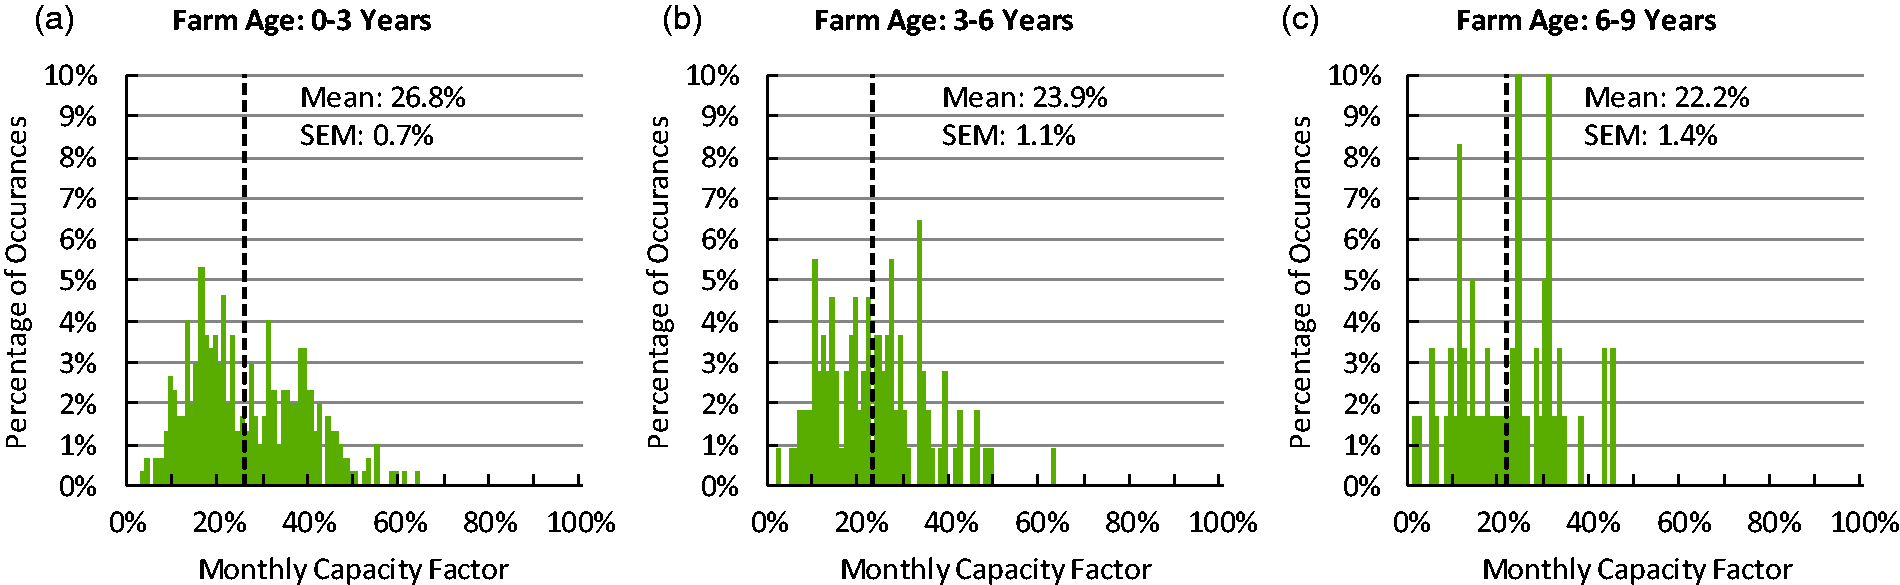
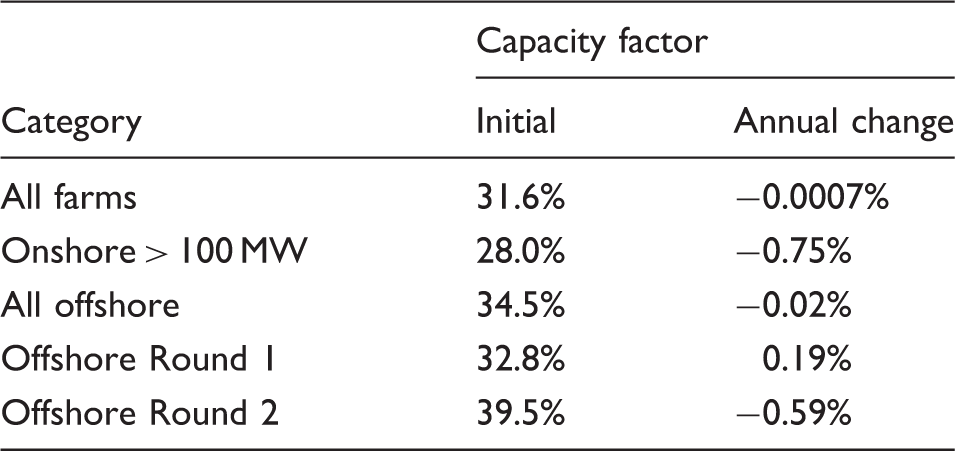
The data for large onshore farms (>100 MW) show a decrease in capacity factor with age, when the distributions are plotted by farm age (Figure 5). This could result from a number of factors which cannot be understood directly from the available data. Figure 7 goes some way to illustrating the challenge of interpreting capacity factor data and explaining the downward trend. It is generally expected that newer wind farms will include more modern turbines and will be subject to the more developed maintenance strategies. This is likely to skew results in some manner. The effect is most noticeable in Figure 7(a), showing the 12-month moving average of monthly capacity factor for each large onshore wind farm (individual grey lines) and the average (thick black line). The moving average smooths the variation in performance of the different farms and reveals a downwards trend in capacity factor with increased variation beyond 36 months. However, it can be seen that those wind farms operating for more than 60 months have been consistently operating at lower capacity factors throughout their lives. The overall downward trend results from the addition of new, higher performing wind farms which raise the average capacity factor in early years. With the constant addition of new technologies to the UK wind generation portfolio, it is difficult to produce statistically reliable results from such a dynamic dataset.
Twelve-month moving average monthly capacity factors with overall average by month of operation for: (a) large onshore > 100MW, (b) offshore Round 1 and (c) offshore Round 2 wind farms.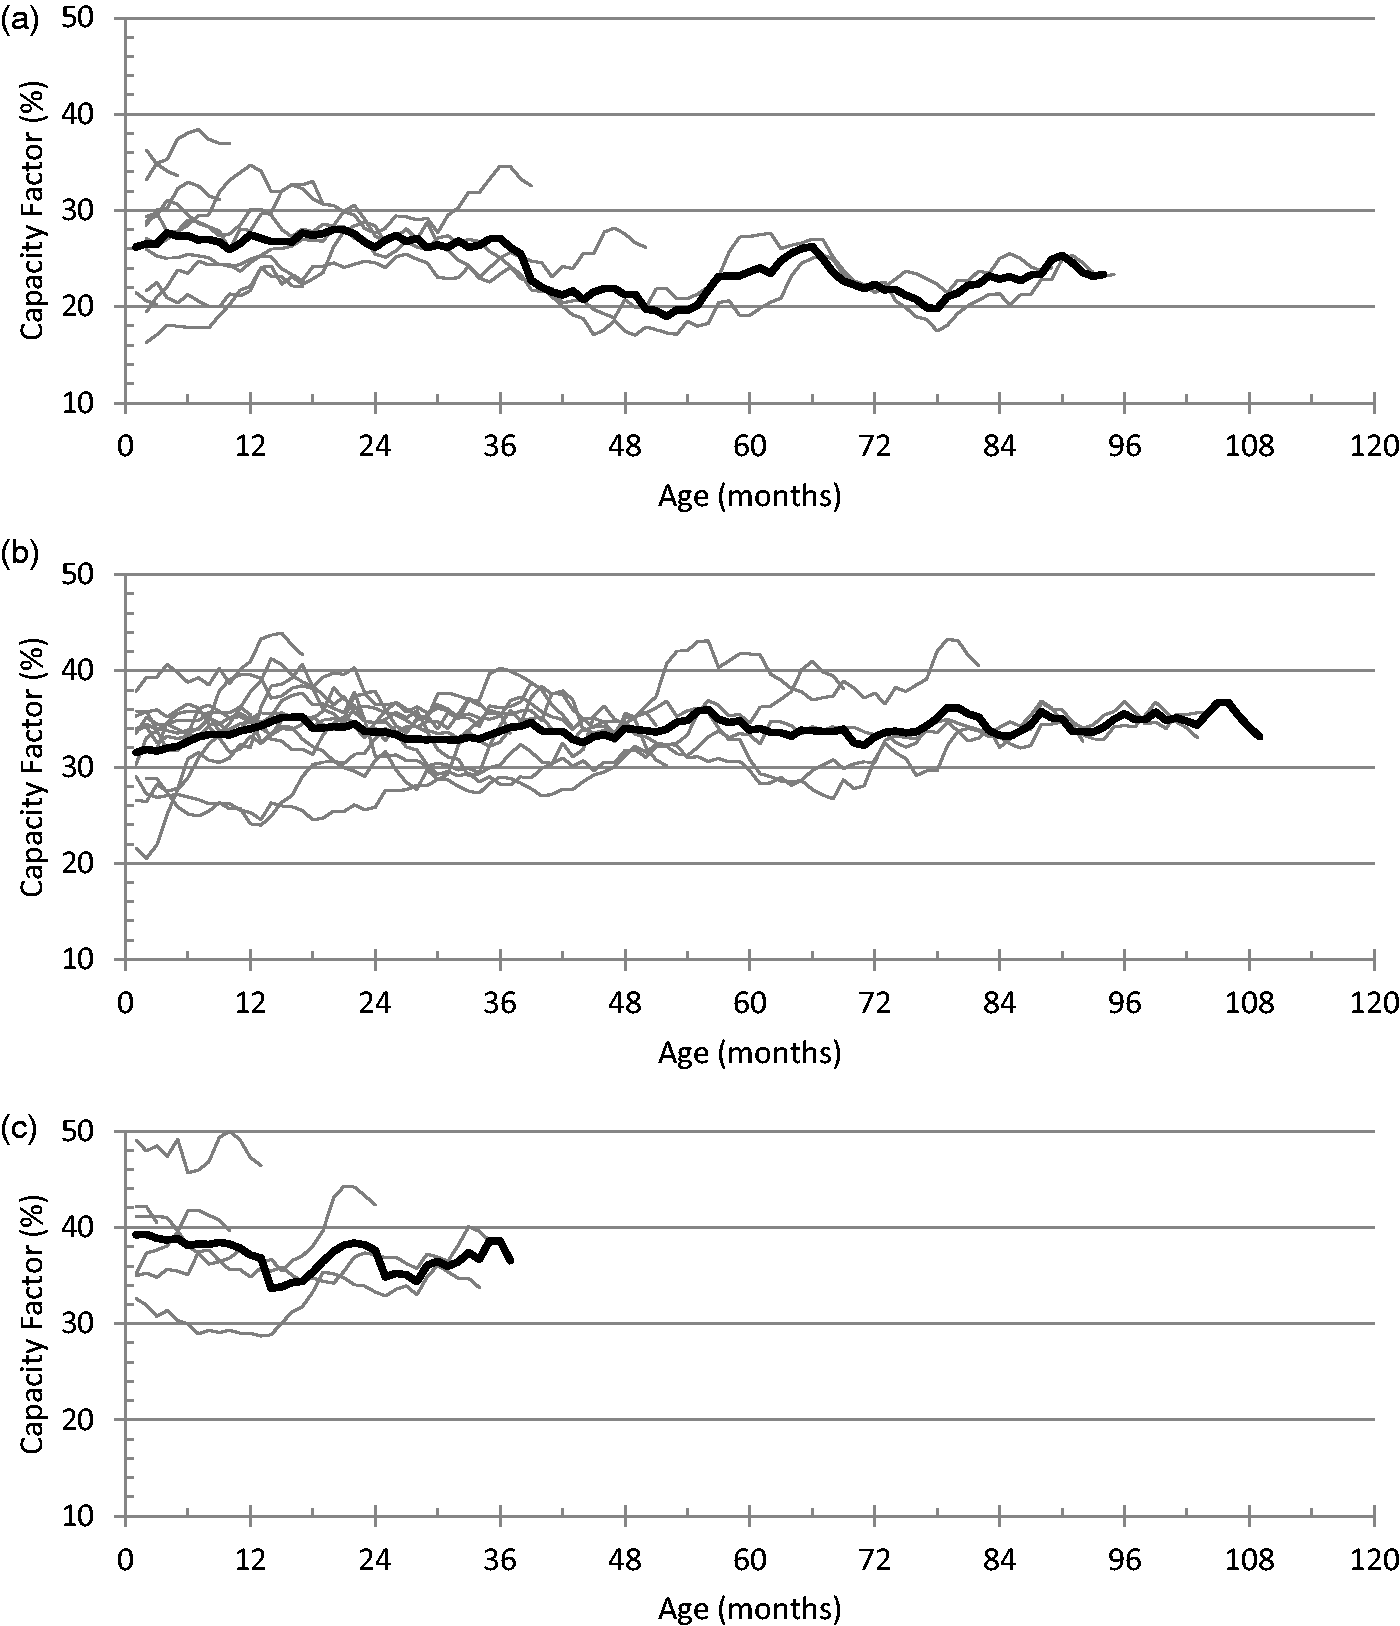
Conversely, Figure 7(b) shows the same data but for Round 1 offshore farms. In this case the capacity factor remains essentially constant with time. This is caused by the higher performing newer assets compensating for the low early performance of the older assets (as shown in Figure 6). For Round 2 offshore farms, little data is available at present for 12-month averaging. It is interesting to note from the data shown in Figure 7(c) that early indications are that Round 2 wind farms are achieving higher capacity factors on average than the Round 1 sites. In summary, the limited data available for fully-commissioned farms indicates that the older farms are either maintaining or improving their capacity factors whilst newer developments are coming online with higher capacity factors.
Figure 8 shows the distribution of annual capacity factors, calculated from the monthly capacity factors, for all farms and for different subsets of the farms. For all farms there is virtually no change in capacity factor with age. Figure 8(b) shows that the greatest decline in capacity factor with age occurs for large onshore farms, with increased variation in the early years due to the emergence of newer, better performing farms within the data. The changes in absolute capacity factor are given in Table 6. The change in onshore capacity factor, plotted in Figure 8(b), illustrates a decrease of 0.75% per annum from an initial value of 28%. This data for large onshore wind farms indicates a greater rate of degradation than that found in Staffell and Green
15
which, using the same approach, deduced a degradation rate of 0.44% per annum from an initial value of 29.2% from the data used in this study for UK onshore farms. The comparison between these results from different studies gives an indication of the likely scatter in results due to the statistical significance of the datasets that are currently available. Results in Staffell and Green
15
are derived from data covering all UK onshore wind farms, including those with capacities below 100 MW. The lower degradation rate in Staffell and Green
15
might imply that the performance of high-capacity farms declines at greater rate than that of lower capacity farms, as argued in Hughes.
12
It should be noted that the magnitude of the decline described in Hughes
12
does not seem to agree with findings in this paper or Staffell and Green.
15
This possible difference between the performances of farms of different capacities is an interesting and important area for further study if the performance of modern wind farms is to be understood and optimised.
Annual capacity factors (averaged from monthly capacity factors) for: (a) all farms, (b) large onshore > 100 MW, (c) all offshore, (d) offshore Round 1 and (e) offshore Round 2. Changes in annual capacity factors.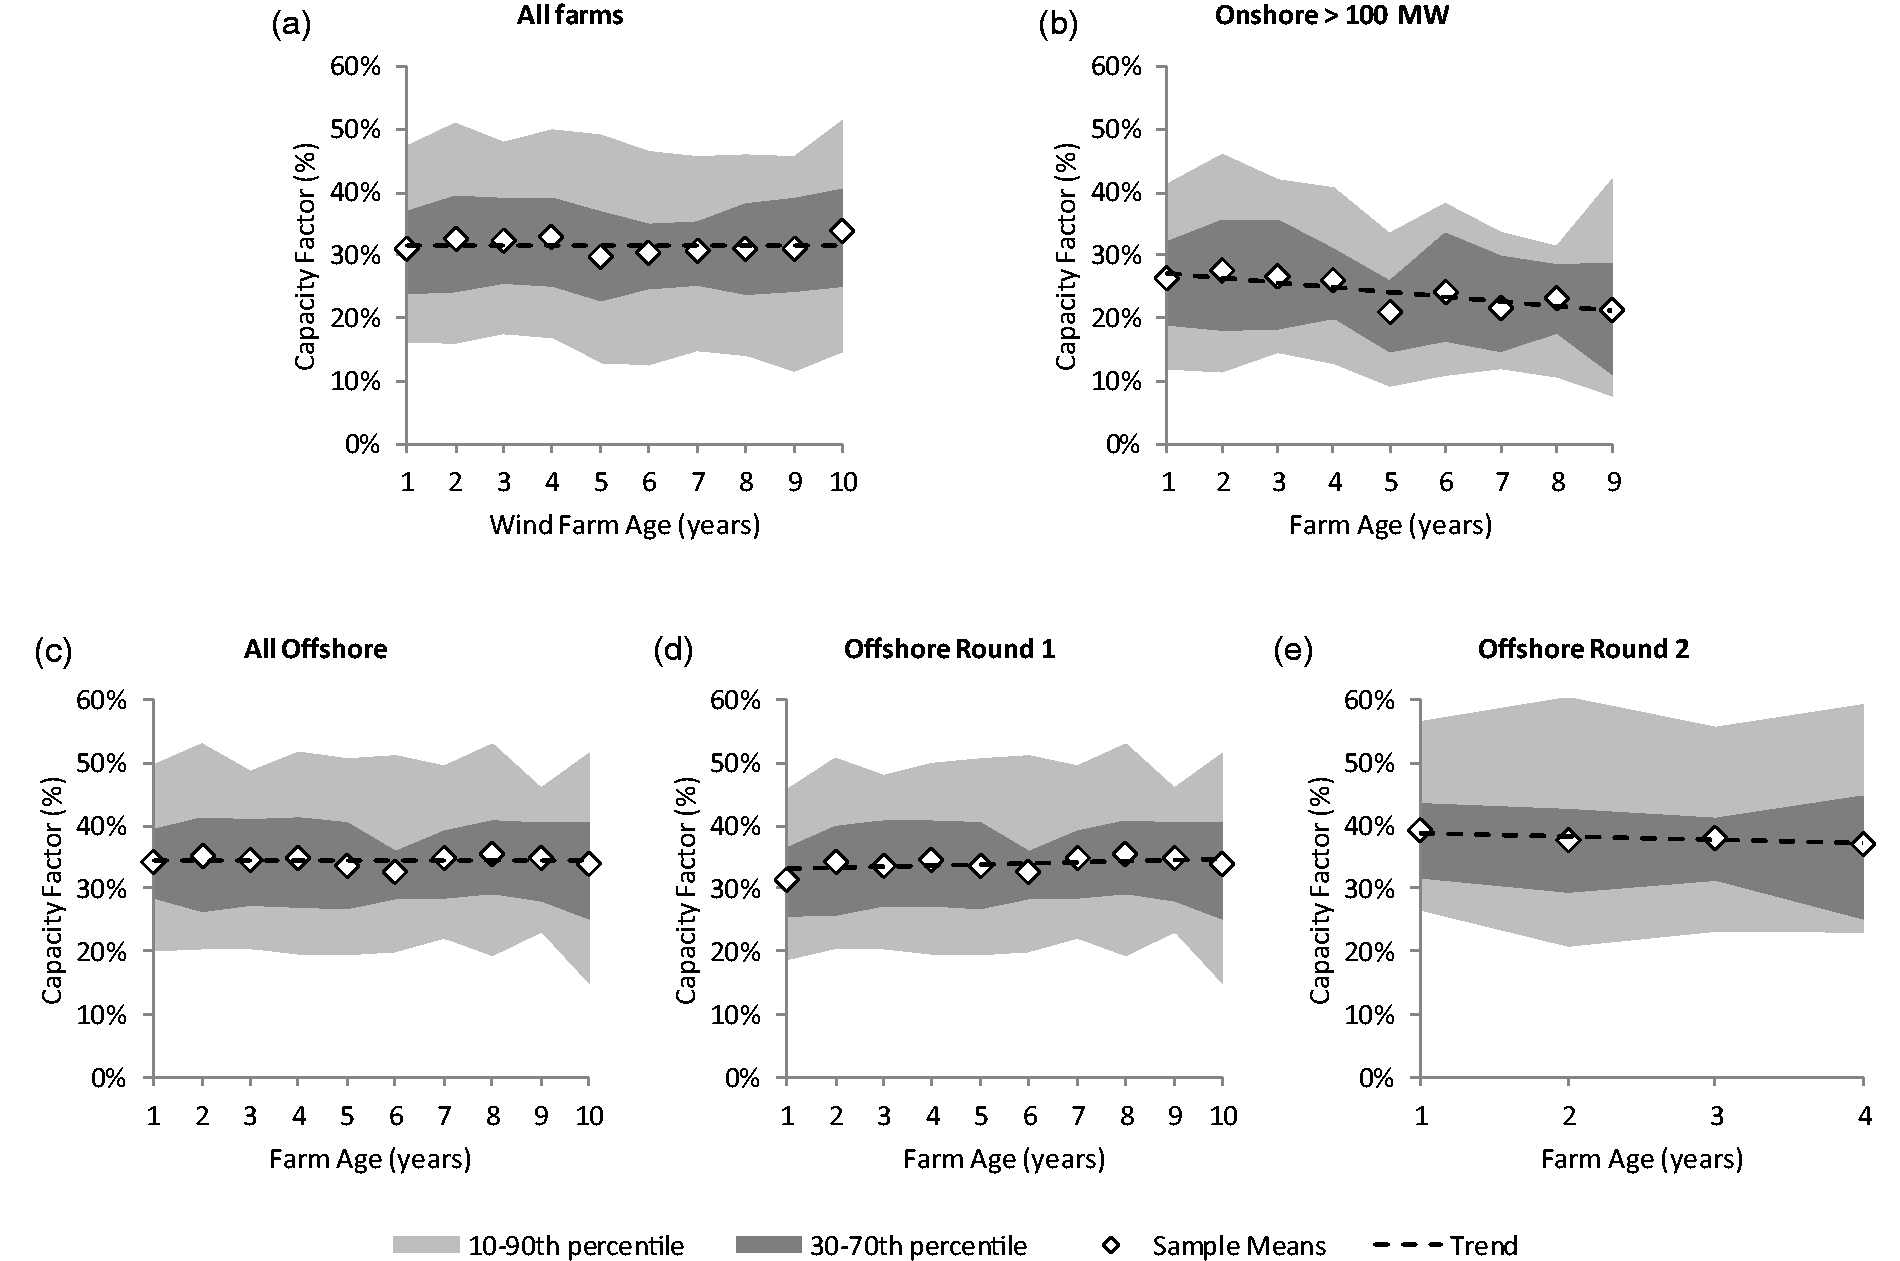
As noted earlier, Round 1 offshore wind farms demonstrate a slight increase in absolute capacity factor over time, with an increase of 0.19% per year from a higher initial value of 32.8%. The Round 2 offshore farm data has also been included in Table 5 for completeness, although the value for annual change for these farms is subject to much greater uncertainty than the other values in the table, due to the relatively small numbers of years of operating data that is currently available for the Round 2 sites.
It is also useful to examine the monthly average capacity factors with date rather than year of operation. This is shown in Figure 9. The effect of newer wind farms is visible from the data with increasing monthly capacity factors for Round 1 (Figure 9(b)) and Round 2 (Figure 9(c)) farms. The large onshore farms in Figure 9(a) also show an upward trend with no marked deterioration in capacity factor and the newer farms tending to operate at increasing capacity factor levels.
Twelve-month moving average monthly capacity factors with overall average by date for: (a) large onshore > 100 MW, (b) offshore Round 1 and (c) offshore Round 2 wind farms.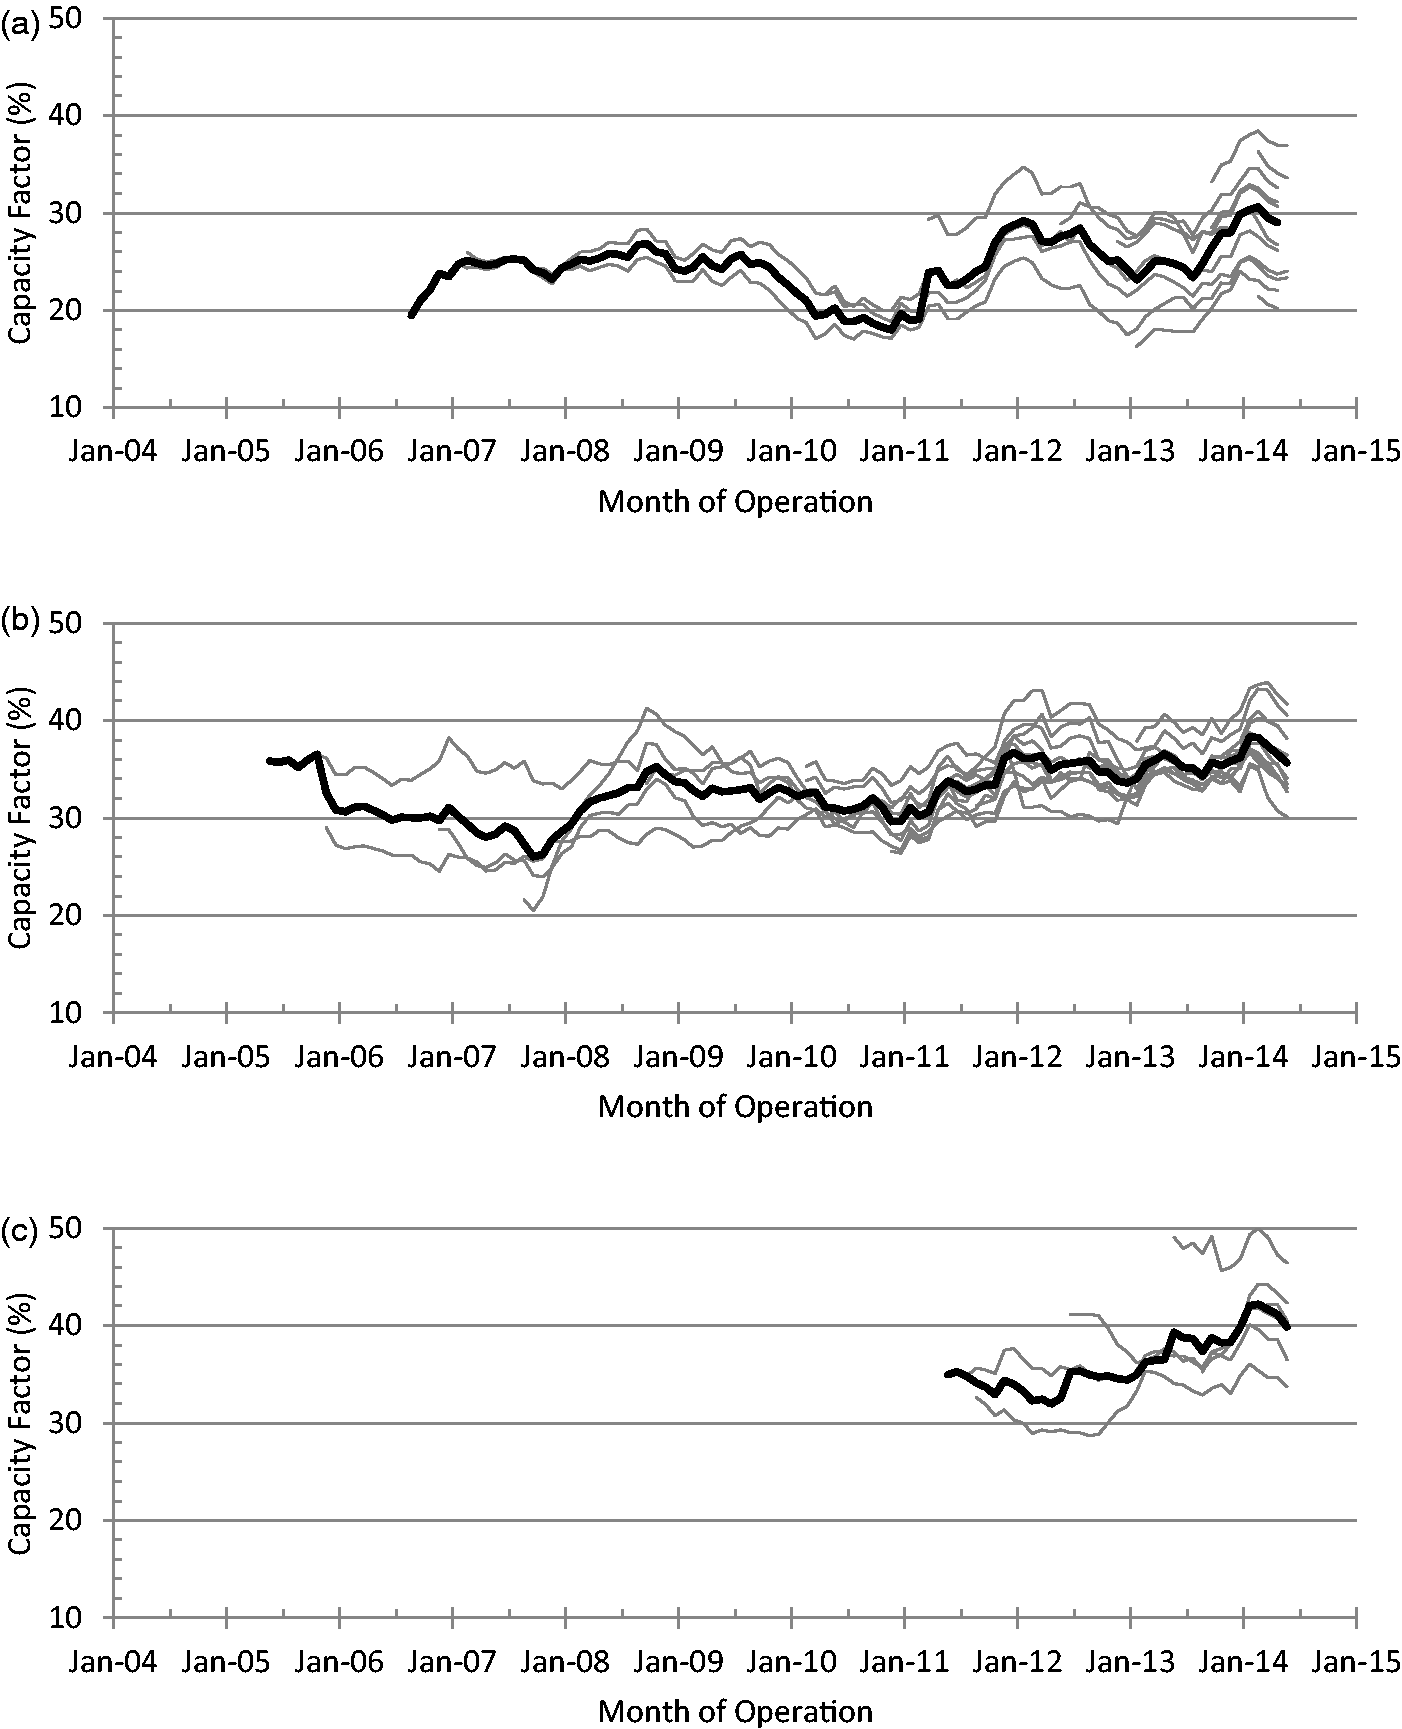
Wind energy challenges
There are many technical, commercial and political challenges facing the growth of the offshore wind industry. Challenges associated with operations and maintenance is of particular interest to the majority of developers. Some of these challenges are discussed in this section.
Cost of offshore wind
Whilst progress is being made, the deployment of offshore wind farms is not growing as quickly as was envisaged a decade ago, despite significant technological advances being made during this period. The primary reason for slower than expected growth, is that offshore wind is still more expensive than conventional plant. Compared to onshore, offshore farms present greater risk to return on capital invested due to higher and more uncertain installation and O&M costs. Whilst going offshore results in improved capacity factors and higher yields, capital costs and operating costs both increase substantially, compared to onshore locations. However, this situation is changing with the recent technological improvements in the size and design of turbine technology, the increasing numbers of offshore assets being deployed and the increase in experience gained by the operators. Evidence of this progress can be seen in the wind farm performance data described earlier. The UK offshore wind industry's plans are ambitious and so cost reduction is a subject of considerable interest.
Certain wind farms are now generating at a cost close to that of conventional plant, primarily onshore coastal sites. 16 The estimated cost of offshore energy varies depending on the site location and project scale; however, it is clear that offshore projects remain significantly more expensive than those that are onshore.
Contrary to expectations, the costs of offshore wind energy in the United Kingdom has increased significantly since the first commercial scale wind farms came online in the mid-2000s, with capital costs for offshore of currently around £3m/MW installed,17,18 compared to around half that value 5 years ago.16,19 The rise in offshore costs has been driven by both increased material prices (particularly for steel) and by more specific factors such as supply chain bottlenecks, sub-optimal reliability and the move to deeper waters.
Some of the United Kingdom's offshore projects have now achieved a stable levelised cost of energy (LCOE) of around £140/MWh.20–23 Failing to significantly lowering this value to allow offshore wind to compete with conventional forms of power generation without the need for subsidies, is the most critical risk to the long-term economic sustainability of offshore wind power. The UK Renewable Energy Roadmap 24 states that the LCOE for offshore wind will need to reduce to around £100/MWh by 2020, if it is to gain a significant market share and achieve parity with other forms of power generation. Recent evidence from the Crown Estate 20 and the Offshore Wind Cost Reduction Task Force 25 suggests routes for achieving this goal, as the technology is scaled up, despite the move further offshore and into deeper waters.
The £100/MWh target should be realisable by 2020, but requires investment from manufacturers, developers and operators to optimise both capital expenditure (CAPEX) and operational expenditure (OPEX). Figure 10 shows the comparison of the breakdown of CAPEX and OPEX for a typical offshore wind farm, according to six recent published studies, including journal publications
27
and technical reports by wind industry specialists26,28 and UK government experts.20,22,29
The CAPEX is taken to include all one-time expenditure associated with wind farm development, deployment and commissioning, such as
30
:
the turbine costs including the transformer, transportation to the site and installation; the electrical connection infrastructure cost, including cables, sub-station, connection and power evacuation systems; the civil work cost, including the foundations, road construction and buildings; other capital costs, including development and engineering costs, licensing procedures, consenting and permits, SCADA (Supervisory, Control and Data Acquisition) and monitoring systems,
30
etc.
OPEX includes all ongoing expenditure, whether one-time or recurring, to operate and maintain the farm, measured on an annual basis. The most important OPEX costs of a wind energy project are
30
:
the costs of the running of the site, including land and sub-station rental, insurance and taxes, management and administration; scheduled O&M activity costs, including provisions for repair and spare parts and maintenance of the electric installation; allowances for unplanned maintenance to repair unforeseen failures.
Although the CAPEX and OPEX component classification varies according to the reference source considered, including different levels of details, Figure 10 shows that upfront CAPEX costs recovered over the life of the wind farm account for typically 70%. Thus wind farms are capital-intensive compared to conventional fossil fuel fired technologies such as a natural gas power plant, for which principally fuel charges increase OPEX costs to typically between 40% and 70% of the LCOE. 16
The work by Coultate 22 shows an overall OPEX for offshore wind of around 24%, which is consistent with the other cost sources cited in Figure 10. Heptonstall et al. 27 break the total capital cost down into the major components and separate the O&M costs into costs related to physical maintenance and costs related to non-physical services such as insurance. The contribution of the physical O&M is around 20%, representing a significant part of the total LCOE.
Most offshore projects have a design lifetime of at least 20 years. The O&M strategy employed will influence not only the annual OPEX, but also the lifetime of the farm. A balance must be struck between high levels of maintenance to ensure longevity and lower levels to reduce running costs. To date, most O&M activities have been contracted to WT manufacturers to run in parallel with key equipment warranties, typically for the first 5 years of operation. Following the warranty period, the bigger operators might take full control of the farm assets; however, many less experienced or smaller scale operators may prefer to continue to contract for O&M to the turbine manufacturer. O&M costs are generally considered to scale with the number of turbines, as this number determines the number of personnel transfers per year and the number of replacement parts. GL Garrad Hassan examined the expected O&M costs for a 500 MW wind farm comprising 6 MW WTs, situated 55 km from shore and using an O&M strategy based around work boats with helicopter support. 28 The total OPEX was estimated to be around £430,000 per turbine per year, with an annual spend per turbine on O&M of around £290,000, averaged over a farm design life of 20 years.
The figures above demonstrate the importance of having a well-defined and well-managed approach to O&M activities, as a reduction in costs could dramatically affect the economic viability of large offshore wind farms and the degree to which offshore wind becomes competitive in the electricity market.
Reducing the cost of the energy produced by offshore wind projects is a major focus for the offshore wind industry 20 and for the UK Government. 25 Finding ways to reduce the cost of O&M services and optimising asset performance have crucial roles in reducing the LCOE from offshore wind moving forward.
It is worth noting that the costs of operation are considerably lower than the costs of maintenance. Operating costs include costs associated with high-level asset management, including remote system monitoring, environmental monitoring, electricity sales, marketing and administration.
Maintenance optimisation
Maintenance actions account for the majority of O&M costs incurred in large wind farms, the purpose being to achieve a desired level of performance from a component or system.
Corrective maintenance is the current O&M strategy used for existing onshore and offshore wind farms.31,32 In case of a failure, a maintenance action is launched at the first opportunity to carry out the repair, resulting in an additional visit to the WT over any planned maintenance visits. Corrective maintenance practice is successfully employed onshore, with minimal interference from environmental conditions, but it is largely impractical offshore. Faults require a range of different responses from a simple inspection and restart of a WT, which might take a couple of hours, through to the replacement of an offshore sub-station transformer, which could take weeks or even months to implement. Difficult-to-access locations and the high cost of the specialist personnel and access equipment needed, means that offshore O&M costs have been quantified as three to five times greater than those for onshore.33,34 The cost difference could potentially increase even further for next generation wind farm developments, which will be situated further offshore in higher average wind speeds and with more challenging sea conditions. Unscheduled maintenance at day-rate costs of up to €1000 per operative 35 has been shown to account for approximately 70% of the O&M costs. 36 These high figures emphasise the need for optimising the O&M strategy for unmanned offshore wind farms to reduce unexpected turbine downtime, avoid lost revenue and improve the availability, so that competitive prices for the produced electricity can be achieved. 37
A Condition Based Maintenance (CBM) preventive practice can contribute significantly to minimising the offshore O&M costs, by lowering the number of inspection visits and corrective maintenance actions needed.38–42 This maintenance approach involves repair or replacement of components based on their state of health and on the operating history of the particular machine in question. Advanced and reliable monitoring and analysis techniques are needed to plan CBM using data from the SCADA systems and Condition Monitoring Systems (CMS) that are already fitted to WTs.
Reliability
WT reliability plays a key role in the economic success of a wind farm projects. Poor reliability directly affects the project's revenue stream through both increased O&M costs and reduced availability to generate power due to turbine downtime.
Detailed measurements of offshore WT failure rates are not available in the public domain in statistically significant numbers. For this reason the available literature on reliability focuses principally on publicly available onshore data. However, operators and manufacturers are usually extremely reluctant to disclose data about reliability because the WT industry is extremely competitive and failure data concerning a manufacturer's technology has strong commercial relevance for both the procurement and operation of assets. As a result, the sources of this type of information are restricted to a few publicly available databases.43–49 An increasingly strong argument exists for the WT industry to find ways of ending this restrictive practice, in favour of the collective benefit that will arise from sharing of data on improving the overall economic performance of WT assets compared to other available generating technologies. At present, the available reliability studies use data from different WT populations, types and sizes; however, the failure statistics show a considerable agreement.
Figure 11 summarises the analysis of reliability data taken from three of the most comprehensive failure statistics datasets for onshore WTs that are currently available. These are data from the German Wissenschaftliches Mess-und Evaluierungsprogramm (WMEP),
46
the German Landwirtschaftskammer (LWK)
47
and the Ekofisk Swedish
45
surveys. Failure and downtime data have been categorised by WT sub-assembly. The analysis of the datasets reveals common trends and provide valuable insights into the reliability of the various onshore WT drive train components.
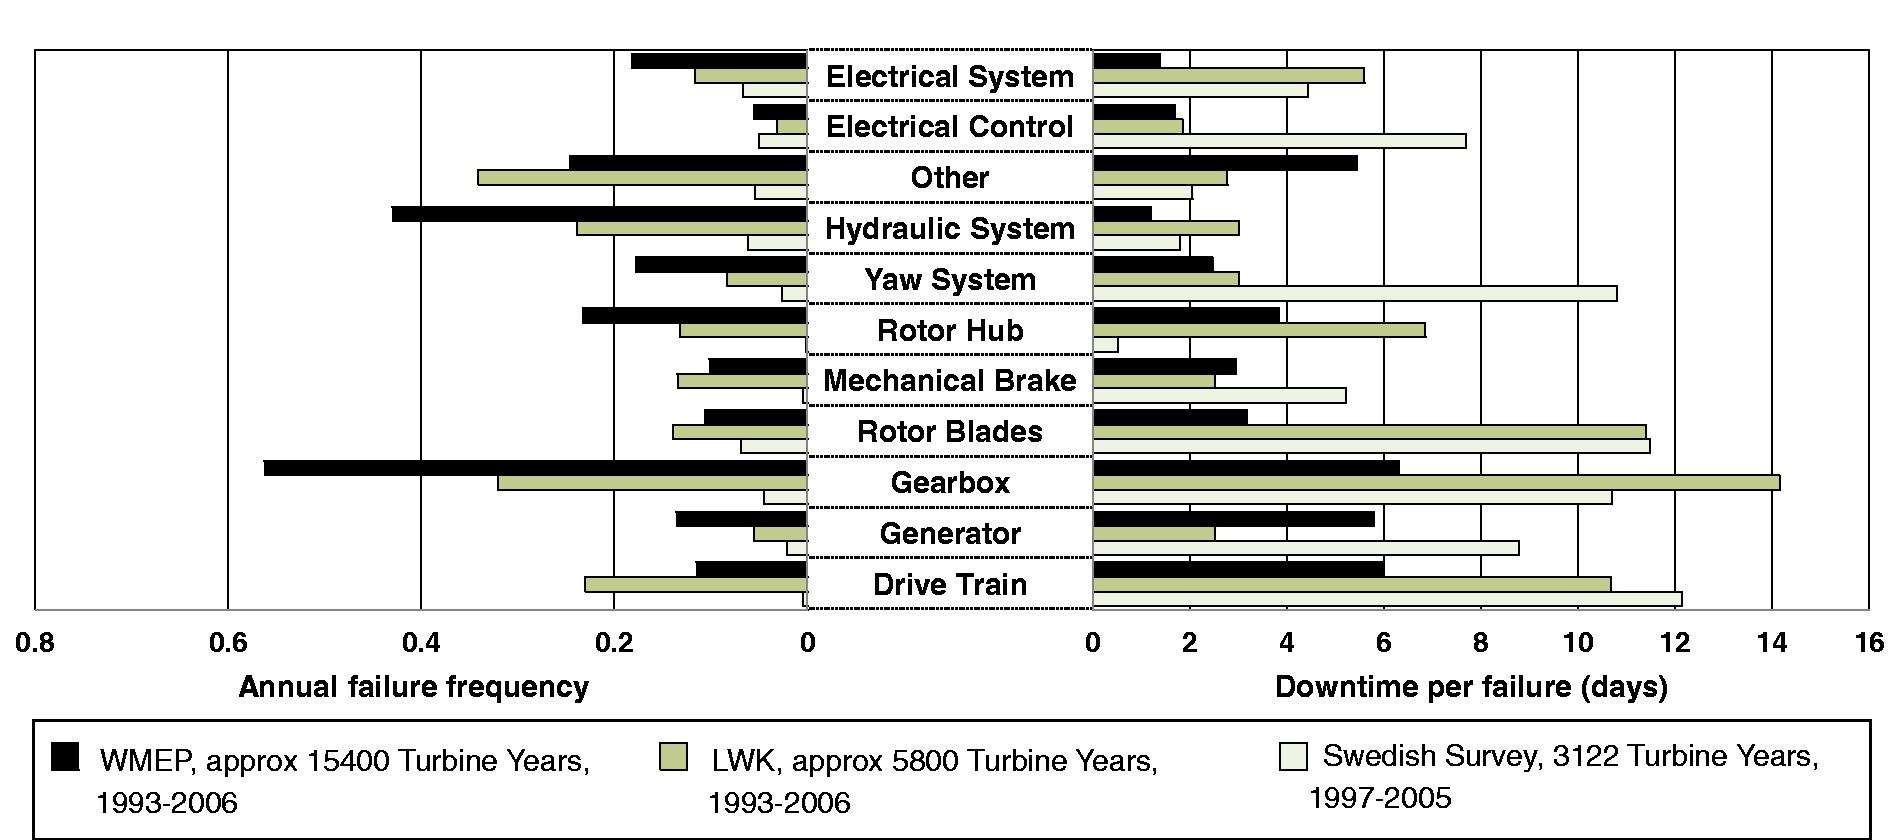
Figure 11 highlights that for onshore wind assets the highest failure rate sub-assemblies do not necessarily cause the most downtime. Whilst electrical sub-assemblies appear to have higher failure rates and shorter downtimes, mechanical sub-assemblies, including blades, gearbox and generator components, tend to have relatively low failure rates but very long downtimes. Similar results have been obtained by Pinar Perez et al. 51 where data were compared from a selection of major reliability studies from the literature, giving confidence in the validity of the information shown in Figure 11.
The WMEP, LWK and Swedish datasets have some important limitations. The data was collected during 1993–200646,47 and 1997–2005
45
and the majority of the turbines surveyed are much lower power than current-day turbines and use some technologies that have now been superseded. The more recent ReliaWind study
49
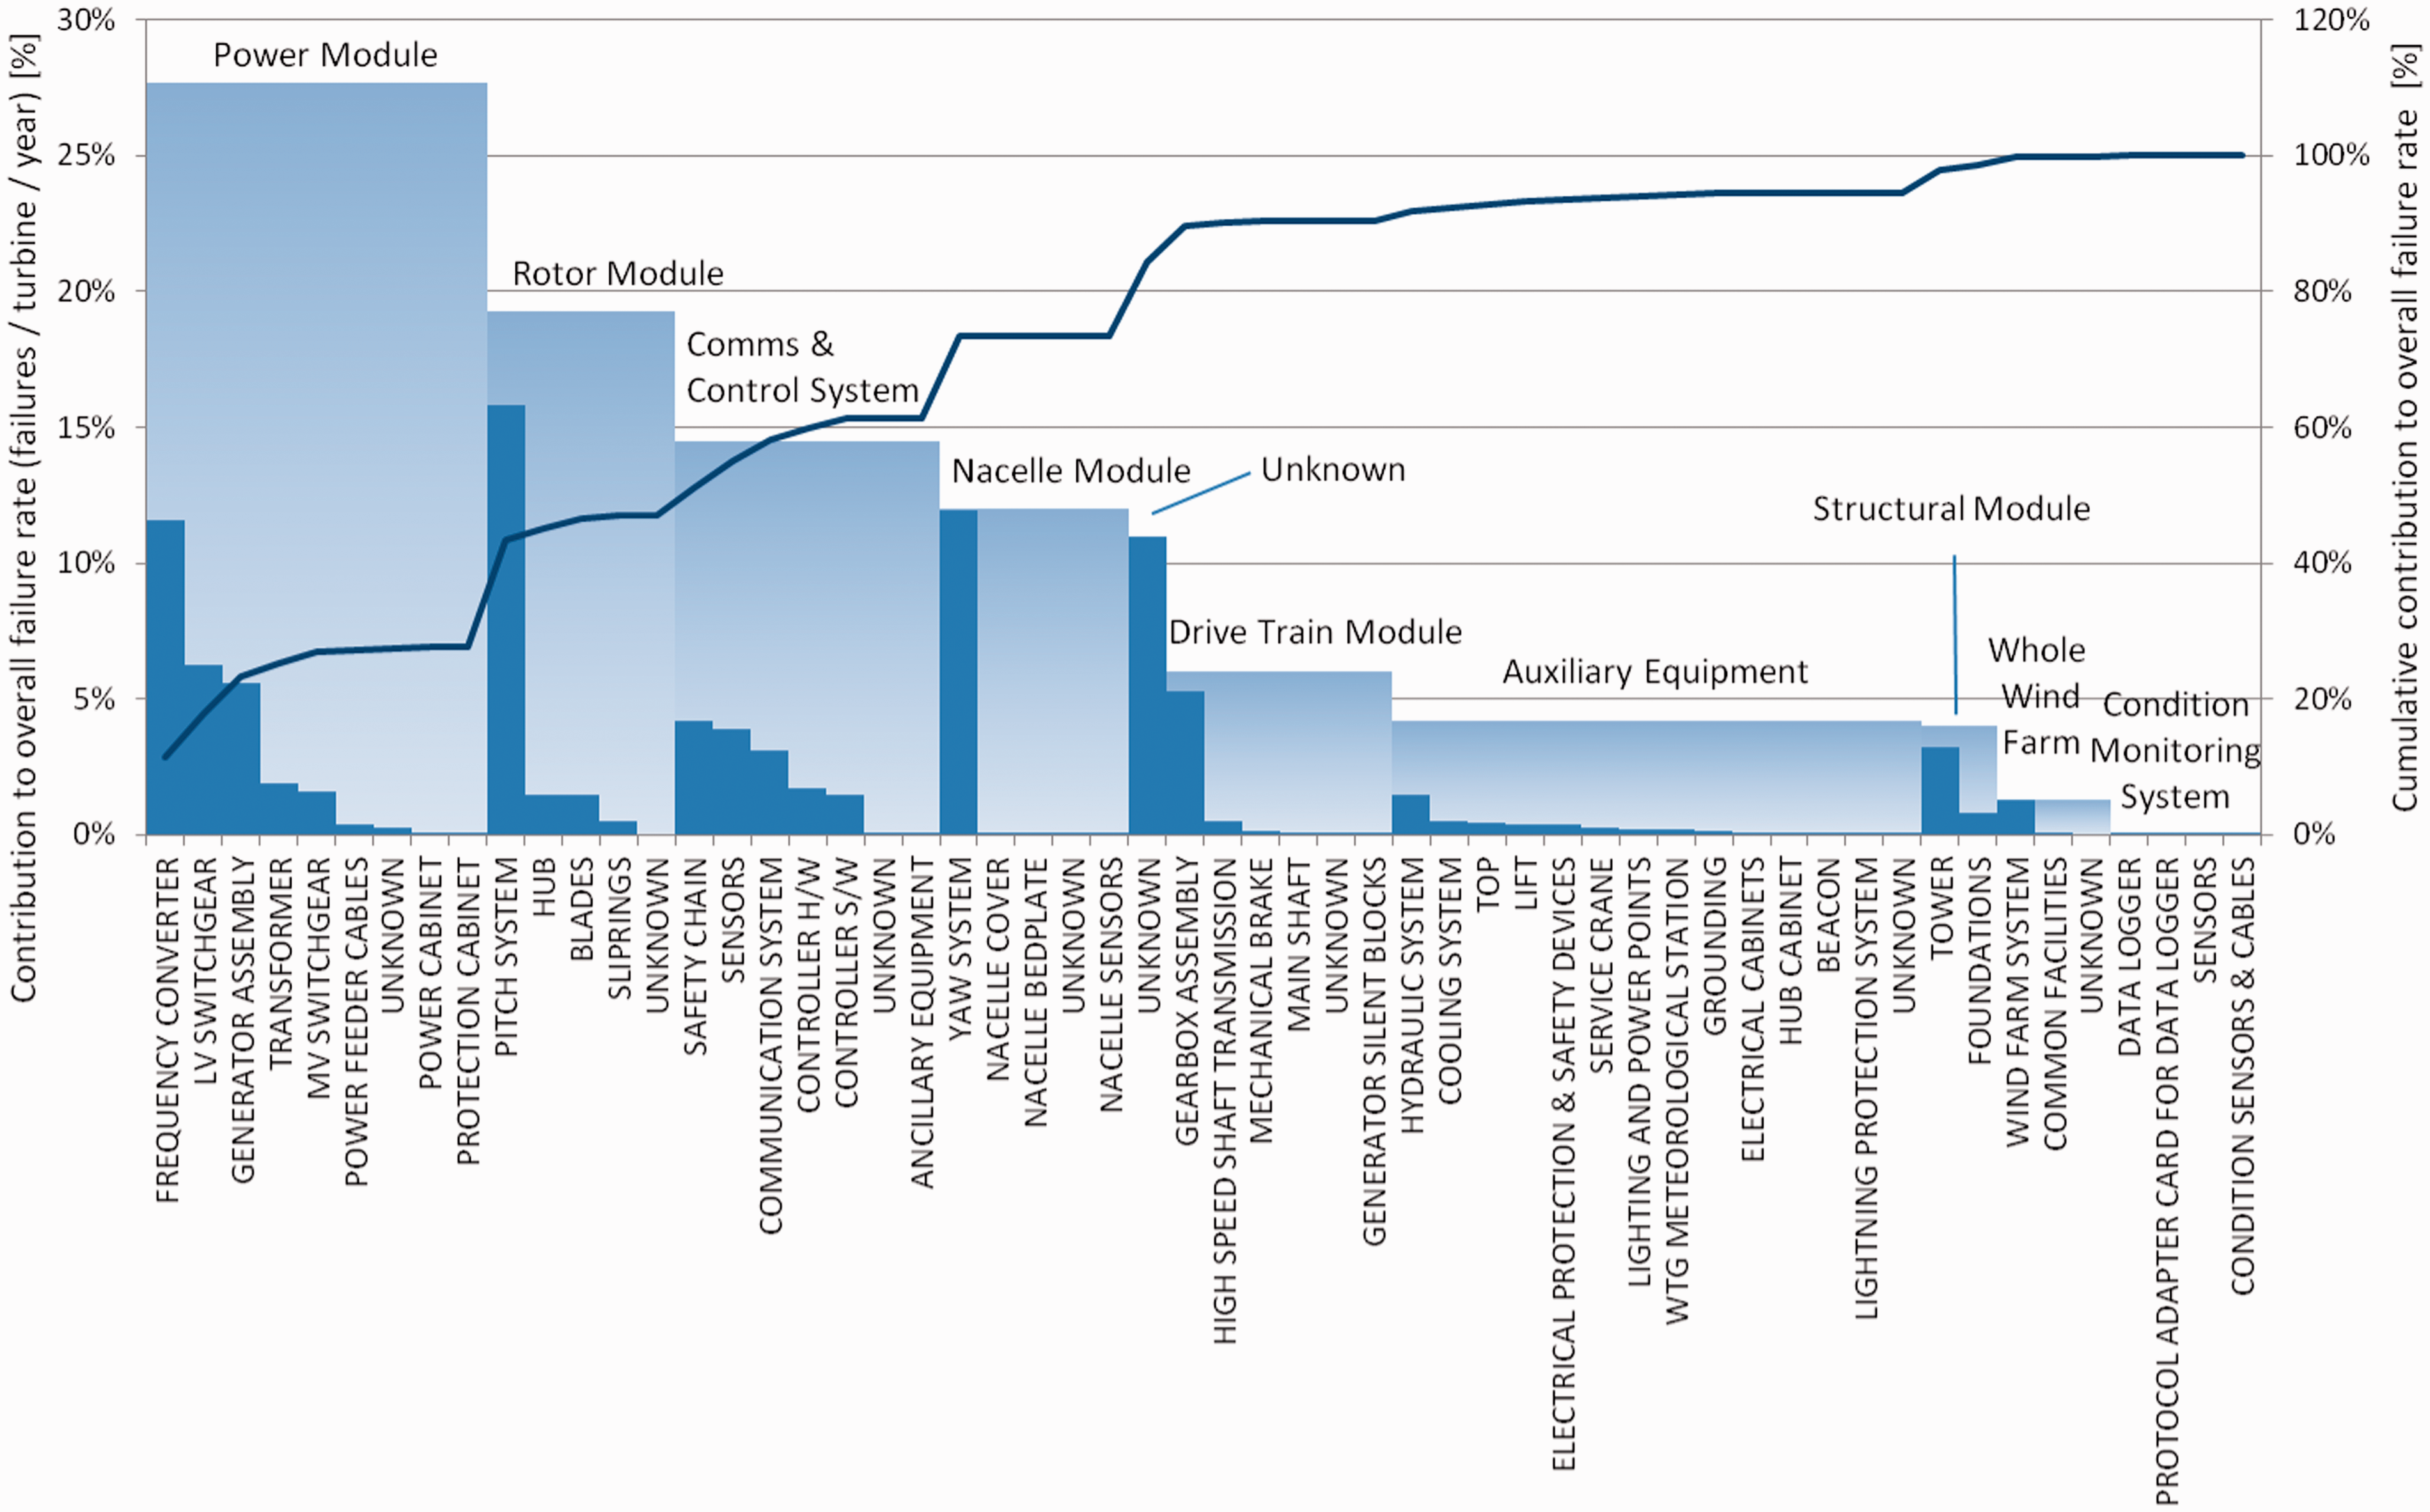
addressed these limitations by considering only turbines that met the following requirements: power rating greater or equal to 850 kW, variable speed, pitch regulated, operating for a minimum of 2 years and from a wind farm that consists of at least 15 turbines. Figures 12 and 13 show the results of the ReliaWind study, which broke the turbine into a detailed taxonomy of sub-systems and sub-assemblies to identify critical areas of interest from >4000 onshore wind turbine years of data. It should be noted that, unlike the data shown in Figure 11, for reasons of confidentiality the published ReliaWind results do not show the actual failure rate and downtime, only the percentage distribution. In spite of the diverse technologies and power ratings, the ReliaWind findings are broadly comparable with the WMEP, LWK and the Swedish surveys and the same failure rate trend emerges. However, the downtime trend shows much greater emphasis on the rotor and power modules, because it is believed these newer variable speed WTs have not yet experienced major gearbox, generator or blade failures to date in service.
52
Distribution of normalised failure rate by sub-system and sub-assembly for WTs of multiple manufacturers from the ReliaWind survey.
49
Distribution of normalised downtime by sub-system and sub-assembly for WTs of multiple manufacturers from the ReliaWind survey.
49
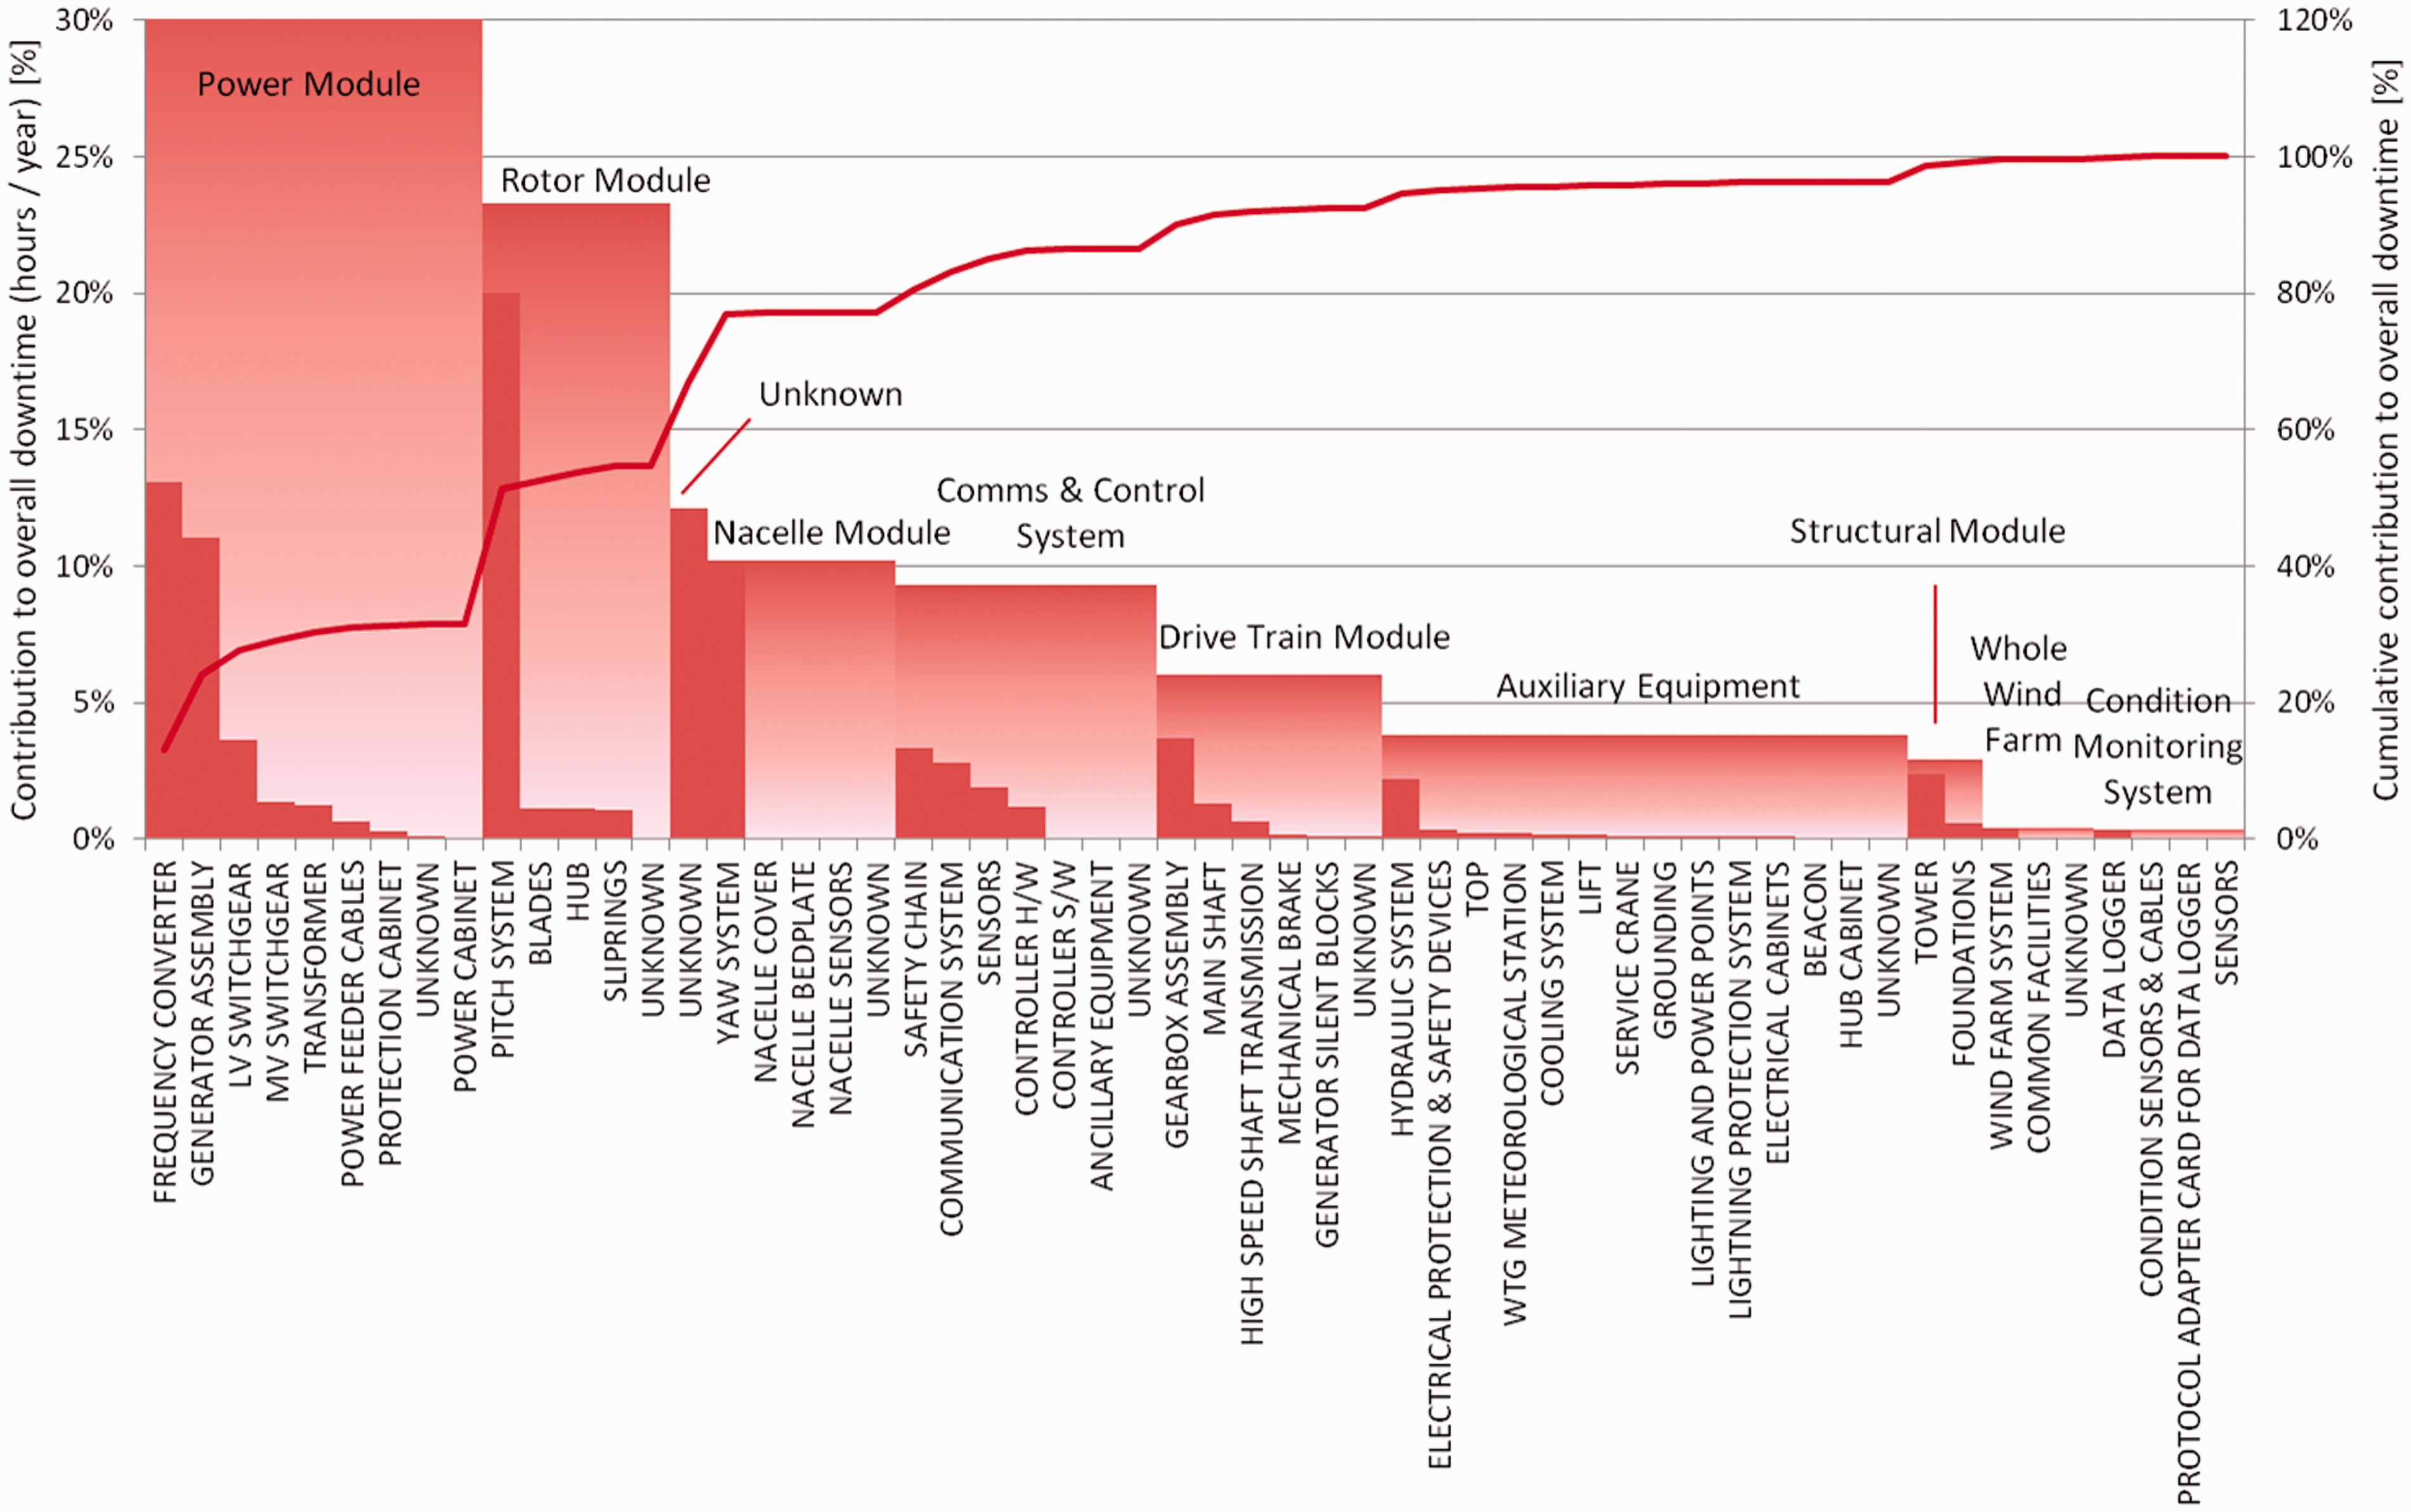
Faulstich et al. 53 showed that 75% of onshore WT failures are responsible for only about 5% of the downtime, whereas the remaining 25% of failures cause 95% of downtime. Downtime onshore is dominated by a small number of large fault types, mainly associated with gearboxes, generators and blades. These require complex and costly repair procedures. The 75% of faults causing 5% of the downtime are mostly associated with electrical faults, which, in the majority of cases, are relatively quick and easy to corrected via remote or local resets. It is worth noting that as WTs move offshore, limited accessibility, longer delays for favourable weather windows, travel and maintenance execution times will all be adversely impacted. Local resets will be associated with high costs due to difficult of accessing the turbines, which will be likely to significantly increase the downtime contribution from these sub-assemblies. According to McMillan and Ault, 33 compared to onshore, the offshore downtime increase is due to two main factors: the lead time for a suitable jack-up crane vessel, cranes and other associated equipment (needed for generator, gearbox and blade), assumed to be 10 days, and the logistics time from the upload point to the wind farm, considered to be one day. For the major WT component outages, typical offshore downtime values have then been quantified as 41 days for the gearbox, 32 days for the generator, 41 days for the blade and 2 days for the electronic sub-systems replacements. The authors also emphasised that excessive wind speed conditions may further delay the maintenance actions, over and above these levels.
Crabtree
54
carried out a reliability analysis of 3 years of available data from the Egmond aan Zee offshore wind farm in the Netherlands. This wind farm features 36 Vestas V90-3MW WTs that are situated 10–18 km offshore and in 17–23 m water depth in the North Sea. Operational reports gave the number of stops resulting from 13 sub-assemblies. The results are summarised in Figure 14.
Stop rate and downtime data from Egmond aan Zee wind farm over 3 years.
54
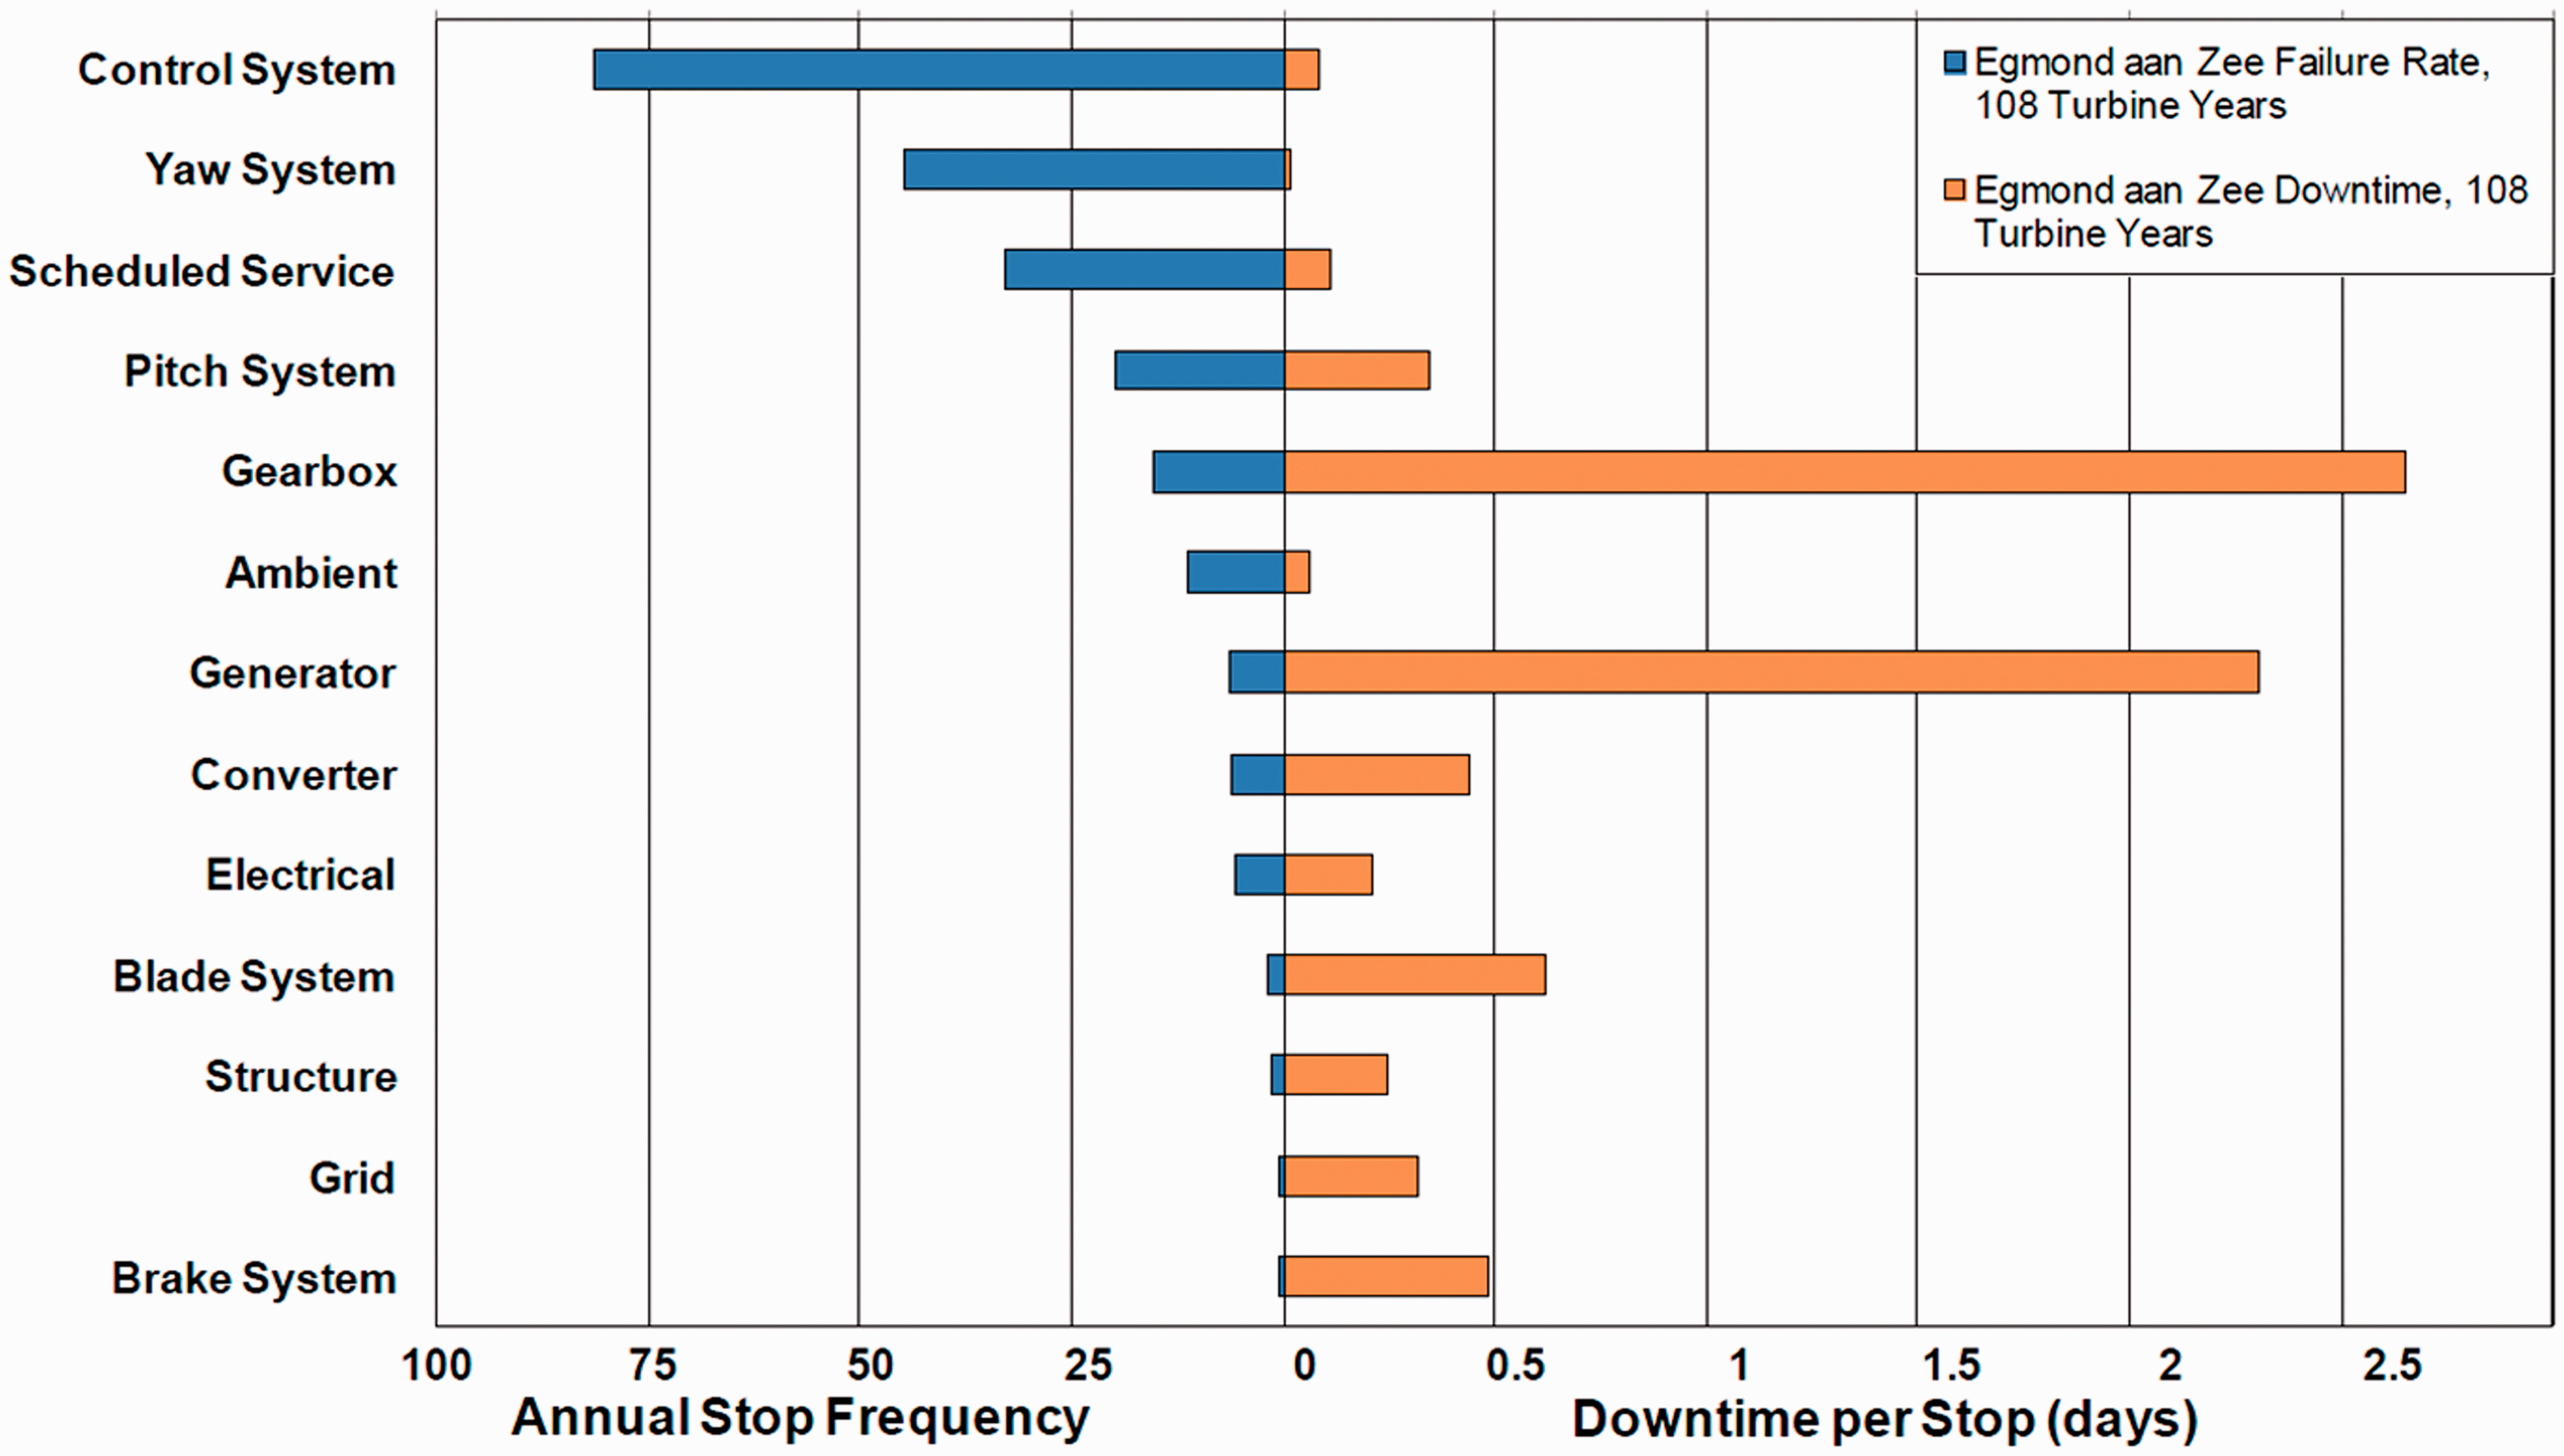
A direct comparison between the onshore data in Figure 11 and offshore data in Figure 14 cannot be made as stops and failures are different concepts. However, it can be seen that the overall distribution is similar, with the sub-assemblies that suffer from the higher stop and failure rates not necessarily resulting in the longest periods of downtime. Analysis of the data shown in Figure 14 reveals that the control system dominates and causes 36% of the stops in the offshore environment, but it results in only 9.5% of the total downtime. Conversely, the gearbox and generator respectively contribute only 6.7% and 2.8% to the total stops, but account for 55% and 15% respectively of the downtime.
The adoption of appropriate design and operational strategies, choice of the most effective turbine architectures, installation of effective CMSs and the adoption of optimised O&M strategies, are all essential elements of the development work needed to reduce the cost of energy from offshore wind farms to competitive levels. Emphasis should be placed on avoiding large (expected as well as unexpected) maintenance events that require the deployment of expensive and specialized equipment. Improving the intrinsic reliability of WT assets will make a major contribution towards achieving the cost reduction targets. This will be only possible through the development of standard methodologies for reliability data collection and analysis, and through close collaboration between manufacturers, operators and research organisations.
Condition monitoring
The need to successfully detect incipient faults before catastrophic failures occur in order to increase WT availability and reduce the cost of energy, has resulted in the development of a large number of CMSs by a range of suppliers. Modern WTs are equipped with SCADA-based and CMS-based systems for the online active remote monitoring and control of their components. This information can be used to predict, detect and diagnose faults as they emerge.
The online monitoring and fault detection are relatively new concepts in the wind industry. In recent years, efforts have been made to develop efficient and cost-effective condition monitoring techniques and signal processing methods for WTs. Several reviews have been published in the literature, including,42,55–62 discussing the main condition monitoring techniques, the signal processing methods proposed for fault detection and diagnosis and their applications in wind power. The studies also provide a comprehensive explanation of the new emerging techniques currently being researched. Condition monitoring technologies from other applications that can be adapted for use in WTs have been identified as vibration analysis, oil analysis, temperature measurements, strain measurements, thermography, acoustic emissions, and electrical signals. Amongst these, vibration, temperature and oil monitoring techniques are currently the most widely used in WT applications, due to their established successes in other applications.
Some of the more recently emerging condition monitoring techniques described in the research literature42,62 include ultrasonic testing which is potentially value adding for detecting early blade or tower defects, shaft torque and torsional vibration measurements for main shaft and gearbox condition monitoring, and shock pulse methods as an online approach to detecting bearing faults. To date, little work has been done in the area of prognosis models. Much of the research in this area is generic and being conducted by the aerospace community for civil and military aviation. Some specific research will be required to apply the principles of prognosis to the wind power industry. 55
The goal of this section is to give an overview of the current state of the art, the main benefits, current challenges and limitations of commercial available WT SCADA-based and CMS-based systems.
SCADA systems record low frequency (typically 10-min interval) data logging of the signals from a range of instrumentation (anemometers, thermocouples, vibration transducers, oil debris detectors, etc.), which the system uses to monitor the health and supervise the operation of the WT. It is a valuable low-cost monitoring system, integrating cheap, high-volume instrumentation, information and communication technology. Chen et al. 63 surveyed the SCADA systems currently available in the wind industry. The survey contains information gathered over several years (from 2011 to 2014) through interaction with SCADA monitoring system and turbine manufacturers and includes information obtained from various product brochures, technical documents and personal interaction with sales and technical personnel. It shows that most of the commercially available SCADA systems are able to analyse real-time data with WT performance analysis techniques varying from tailored statistical methods to the use of artificial intelligence. One of the principal benefits of SCADA systems is that they provide an operating history of individual WTs and entire wind farms. The data recorded includes, alarms, detailed fault logs and environmental and operating conditions leading up to fault occurrences. SCADA systems are not effective in detecting incipient turbine faults and providing operators with sufficient warning for preventative action to be undertaken. The main challenges are the considerable amount of analysis that is required for the online interpretation of the large volume of data generated, and the low data rate which does not permit the in-depth analysis that is generally needed for accurate diagnosis using existing condition monitoring methodologies. Potentially, SCADA alarms can help a turbine operator to understand the health of a WT and its key components, but for large wind farms these alarms are too frequent for any meaningful online analysis to be undertaken using existing techniques.
As more and larger wind farms are being developed, the amount data collected by SCADA systems is also increasing exponentially and is becoming difficult to manage with conventional data processing methods. Therefore, the development of advanced data fusion/mining techniques and reliable physics of failure based theoretical modelling is required, in order to improve the ability of SCADA systems to detect the onset of WT failures early and accurately. Making better use of SCADA data is currently an active area of research. Several workers have recently suggested and demonstrated new approaches for rigorous analysis of the information collected by SCADA systems, to provide long-term fault detection, diagnosis and prognosis for the main WT sub-assemblies. These include the gearbox, the converter and the pitch control system. Examples are early fault identification techniques based on artificial neural network, 64 calculation of damage accumulation and risk of failure using physics of failure approach 65 and fault prognosis procedure using a priori knowledge-based adaptive neuro-fuzzy inference system. 66 New signal algorithms have been developed to analyse SCADA alarms and to detect WT component faults for the pitch and converter systems 67 and for the gearboxes,68,69 although these techniques still require some further testing and tuning. In order to overcome the difficulties associated with the handling of extremely large and complex SCADA datasets using traditional relational databases, Viharos et al. 70 proposed a Business Intelligence reporting prototype system for wind farm analytics which exploits the advantages of the emerging ‘Big Data’ tools. The paper shows how detailed operation data from a large number of wind farms can be collected and stored for future use. Validation and implementation of this type of techniques will provide operators with sufficient time to make more informed decisions concerning maintenance interventions on their machines.
In the late 1990s, the installation of WT CMSs started to be requested by some insurance companies in Europe, 71 following a large number of claims resulting from catastrophic gearbox failures. The drive train is one of the highest cost and most trouble prone WT sub-systems. German insurers introduced this requirement as a cost deterrent, in order to encourage an improvement in its operating life.
Today, a number of certified CMSs are available to the wind industry. The survey of commercially available WT CMSs conducted by Durham University and the UK SUPERGEN Wind Energy Technologies Consortium, 72 provides an up to date review of the current state of the art of available systems. The document contains information gathered over several years (between 2008 and 2014) through interaction with monitoring system and turbine manufacturers and includes information obtained from various product brochures, technical documents and personal interaction with sales and technical personnel. According to the survey, the majority of CMSs are based on high-frequency vibration monitoring of the drive train, with special focus on main bearing, gears and bearings, although some are used in combination with oil particle counters and fibre-optic strain gauges to enhance their monitoring capabilities. No commercial CMS is offered for the electrical and power electronic components and the yaw and pitch systems, beyond what is monitored by the SCADA system. This is a gap that needs to be addressed as the reliability of WT electrical systems is being increasingly recognised as a growing concern, 49 as the mechanical systems become more reliable. This is particularly the case for offshore installations, where deterioration in electrical components may be accelerated in the harsh environment due to enhanced rates of corrosion and erosion.
Practical experience with CMSs in wind farms to date shows that it is problematic to achieve reliable and cost effective applications. 33 The use of condition monitoring techniques has been an integral part of asset management in other industries for decades. In recent years, the technology has been increasingly adopted by the wind sector. Generic techniques are well understood, but it is their adaptation for application on unmanned and remote WT power plants that is proving challenging. 73 There is still insufficient recognition amongst WT maintenance staff of the benefits that CMSs are able to provide. 62 The principal differences that distinguish WT operation from operation of other types of equipment are variable operating speed and the stochastic characteristics of the aerodynamic loads on the structure. 61 The non-stationary signals make it difficult to apply traditional frequency domain signal processing techniques in the development of effective algorithms for early fault detection and diagnosis.59,62 The majority of commercially available WT CMSs rely on the experience of operators to successfully detect faults, by noting changes in spectra at different specific speeds and loads. 74
The complexity and volume of information produced by CMSs also presents a challenge for operators for daily maintenance purposes. It is now common place for modern large onshore and offshore WTs (>1.5 MW) to be equipped with some form of CMS. 62 However, frequent false alarms and the costly specialist knowledge required for manual interpretation of the complex monitoring signals have discouraged WT operators from widespread adoption of these systems. Moreover, with the growth in numbers of WTs installed, especially offshore, the manual examination and comparison of the condition monitoring data will become increasingly impractical, unless simplified monitoring techniques can be developed and implemented. These will also potentially benefit from incorporating advanced data fusion and mining techniques, already successfully used in various sectors, such as manufacturing, 75 management 76 and health care. 77
The principal aspects of condition monitoring technology that need to be improved to encourage increased engagement by wind farm operators are the accuracy and reliability of diagnostic decisions, including level of severity evaluation, and the development of reliable and accurate prognostic tools. In order to work effectively in the challenging offshore environment, it is evident that an increased degree of automation to deliver actionable maintenance recommendations is mandatory for cost effective and fit-for-purpose CMSs. The challenge is to achieve earlier detection, diagnosis and prognosis of faults with the necessary levels of accuracy and automation needed to reduce manpower and access costs on large-scale offshore wind farm developments. Recent experimental research, such as Wiggelinkhuizen et al., 58 Hameed et al., 60 Crabtree, 74 Djurović et al., 78 Zappalá et al., 79 Zaggout et al. 80 and Vilchis-Rodriguez et al., 81 has been focused on the development of advanced new techniques for incorporation into existing WT CMSs, to move towards this goal. The work by Zhang et al. 82 is an example of a data mining approach to establish models for predicting vibration excitement which has been validated by data from a damaged gearbox tested by the US Department of Energy National Renewable Energy Laboratory (NREL).
Finally, the majority of CMSs currently operate independently from the SCADA systems and therefore at present these CMS systems do not have direct and immediate access to the valuable information on operational parameters monitored and stored on the SCADA system. It is expected that ultimately, integrated autonomous CMSs and SCADA systems incorporated into WT controllers will be developed, for optimised cost and condition monitoring effectiveness. 52
Conclusions
An analysis of large UK offshore and onshore wind farm capacity factor data has been reported in this paper. The United Kingdom is the global leader in installed offshore wind farm capacity. The data used in the study covers more than 7000 turbine years of operation. It shows that:
Offshore annual and monthly capacity factors for the whole UK portfolio are higher than onshore capacity factors. This is thought to be due to the favourable characteristics of offshore wind resource. The second generation UK Round 2 wind farms have benefitted from operating experience gained at the earlier Round 1 sites, allowing higher capacity factors to be achieved at the more recently installed farms. Overall, UK offshore farms have achieved an average monthly capacity factor of 34.5% compared to 25.6% onshore, during full operation. In isolation, Round 2 farms achieved a higher average monthly capacity factor of 38.3%. Peak monthly offshore capacity factors have risen to as high as 75.8% for Round 2 farms compared to 64.1% for UK large onshore farms. This paper shows that onshore wind farms see a decrease (by year of operation) in average annual capacity factor of 0.75% per year; however, there is clear indication that a part of this decrease is the result of the changing portfolio of wind farms. The newer farms generally demonstrate a higher capacity factor and this skews the earlier data.
A breakdown of the cost of energy generation from wind farms has highlighted the importance of reducing O&M costs from current levels. The challenges that must be overcome and the research that is currently underway to help to achieve this have been reviewed. Improved data handling and analysis techniques, integration of condition monitoring and SCADA systems and improved cost/benefit analysis from adopting condition based maintenance strategies are all identified as being important steps towards achieving this goal and have been discussed in the paper. Finally, the need for more open sharing of operating data across the wind industry and research community to accelerate the development process has been highlighted.
Footnotes
Funding
The authors disclosed receipt of the following financial support for the research, authorship, and/or publication of this article:
This work was funded in part by the UK EPSRC SUPERGEN Wind Hub, EP/L014106/1, and the SUPERGEN Wind Energy Technologies programme, EP/H018662/1.
Declaration of conflicting interests
The authors declared no potential conflicts of interest with respect to the research, authorship, and/or publication of this article.