
Abstract
The aim was to compare the prevalence of vibration related symptoms and signs in two groups of vibration exposed male workers: 36 vibration exposed patients and 33 truck mechanics. All participants answered a questionnaire, passed a structured interview about work and medical history and several neurophysiological tests. The prevalence of vibration white fingers (VWF) and neurosensory symptoms was significantly higher among the exposed patients than among the truck mechanics. One neurosensory examination method identified 46% of the exposed patients with numbness and tingling, three methods up to 85%. In the total material logistic regression showed that age and increased cold sensitivity were significant predictors of both neurosensory disturbances and vibration white fingers. Muscle cramps in arms and hands, pain in hands and age were significant predictors of reduced grip strength. The differences between the two groups were more pronounced for category variables than for continuous variables.
Keywords
Introduction
Long-term exposure to vibrating tools my cause the hand arm vibration syndrome (HAVS), which consists of two disease manifestations. The vascular component is named vibration white fingers (VWF; Mb Raynaud). The neurosensory component is characterized by numbness and tingling in hands and fingers, reduced grip strength in hands and finger muscles and impaired manual dexterity. 1 The neurosensory symptoms usually appear earlier than the vascular symptoms, cause more discomfort to the patient and has a worse prognosis. In severe cases, they can bother the patient around the clock and interfere with the patient’s sleep. The vascular symptoms on the other hand, mainly disturb the patient in cold environments. In general, the risk of developing HAVS increases with the intensity and duration of the vibration exposure. 2 However, the individual susceptibility to these two conditions varies considerably.
In an annex to ISO 5349-13 a risk model for Raynaud’s phenomenon is presented but comparable models for neurosensory disturbances, carpal tunnel syndrome and musculoskeletal injuries are lacking. Workers who are exposed to hand arm vibration (HAV) have an increased risk of vascular and neurological symptoms compared to non-vibration exposed groups. The crude risk increase is in the order of 4–5 times. 4 In a systematic review and meta-analysis the pooled risk estimate varied between 2.5 and 5 for both Raynaud’s phenomenon and neurosensory injuries when contrasting high versus low exposure in the same groups of vibration-exposed workers, which indicates a dose-response pattern. Meta-regression indicated a risk increase of Raynaud’s phenomenon by a log Odds rate of 0.09% for each exposure increase of 1 m/s2. The corresponding factor for neurosensory injuries was 0.08%. As an example, a daily exposure level of 10 m/s2 gives a 10% prevalence of Raynaud’s phenomenon after 6 years compared to 2 years for neurosensory disturbances, which is a factor of 3.4
A dose-response relationship has been noted between the cumulative lifetime vibration dose and the development of vibration white fingers, sensorineural symptoms and musculoskeletal symptoms of upper limbs and neck. The risk for neurosensory symptoms was particularly related to hand-arm vibration exposure and impulse vibration. 5
Recently, Gerhardsson et al. 6 studied vibration exposed workers from a loader assembly plant in Sweden using impact wrenches and anvils. The estimated median vibration A(8) exposure was 2.2 m/s2 for the right hand and 1.8 m/s2 for the left hand. These values are clearly below the current action limit in Sweden which is 2.5 m/s2. The prevalence of VWF and neurosensory findings was 30% and 70%, respectively among the male workers. These figures by far exceeds the estimated prevalences that can be calculated from the ISO 5349-1 standard.
Aims
The aim was to study the prevalence of vibration white fingers, neurosensory disturbances, and musculoskeletal symptoms in two groups of vibration exposed workers, using different tools and with different vibration exposure times.
Furthermore, to determine predictors that affected the prevalence of vibration white fingers, neurosensory disturbances, handgrip strength and the notification of a work injury.
Materials and Methods
Study population
Two groups were recruited. One group consisted of vibration exposed patients, referred to the department of Occupational and Environmental Medicine in Gothenburg for an investigation of vibration related symptoms and signs. This group consisted of 36 males with a mean-age of 50 ± 13 years and a mean exposure time of 21 ± 13 years. The inclusion criteria were vibration exposure ≥ 5 years, exclusion criteria were diabetes mellitus, frostbites and neurological disorders.
The exposed patients had a mixed exposure to several vibrating and hand-held tools, e.g., concrete breakers, sanders, grinders, disc cutters, drills, screw drivers and impact wrenches of different weights and sizes. Several occupations were represented, e.g., construction industry, road maintenance, heavy engineering, and motor vehicle manufacturing and repair. The exposed patients estimated that their exposure time to vibrating tools was about 1.5–3 h per day.
The other group consisted of a 33 active truck mechanics at two truck assembly plants situated in a city not far from Gothenburg. Their mean-age was 38 ± 12 years and the mean exposure time 16 ± 12 years. They had an exposure to mainly impact wrenches, up to approximately 15 min per day. The inclusion criteria were vibration exposure ≥5 years, exclusion criteria were diabetes mellitus, frostbites and neurological disorders.
The workers were contacted by mail or telephone and were asked if they were willing to participate in the study. Before the start of the investigation, all workers signed a written consent. The study was approved by the ethical committee at the University of Gothenburg, approval number 144-08.
The study comprised a questionnaire (work and medical history, use of tobacco and alcohol, exposure to vibrating tools, symptoms related to vibration exposure [VWF, neurosensory symptoms; yes-no answers]), a medical examination and several quantitative sensory tests. 7 The participants were asked to avoid vibration exposure during the day of the measurement and to refrain from the use of tobacco and coffee at least 3 h before the investigation.
Measurements of vibration exposure
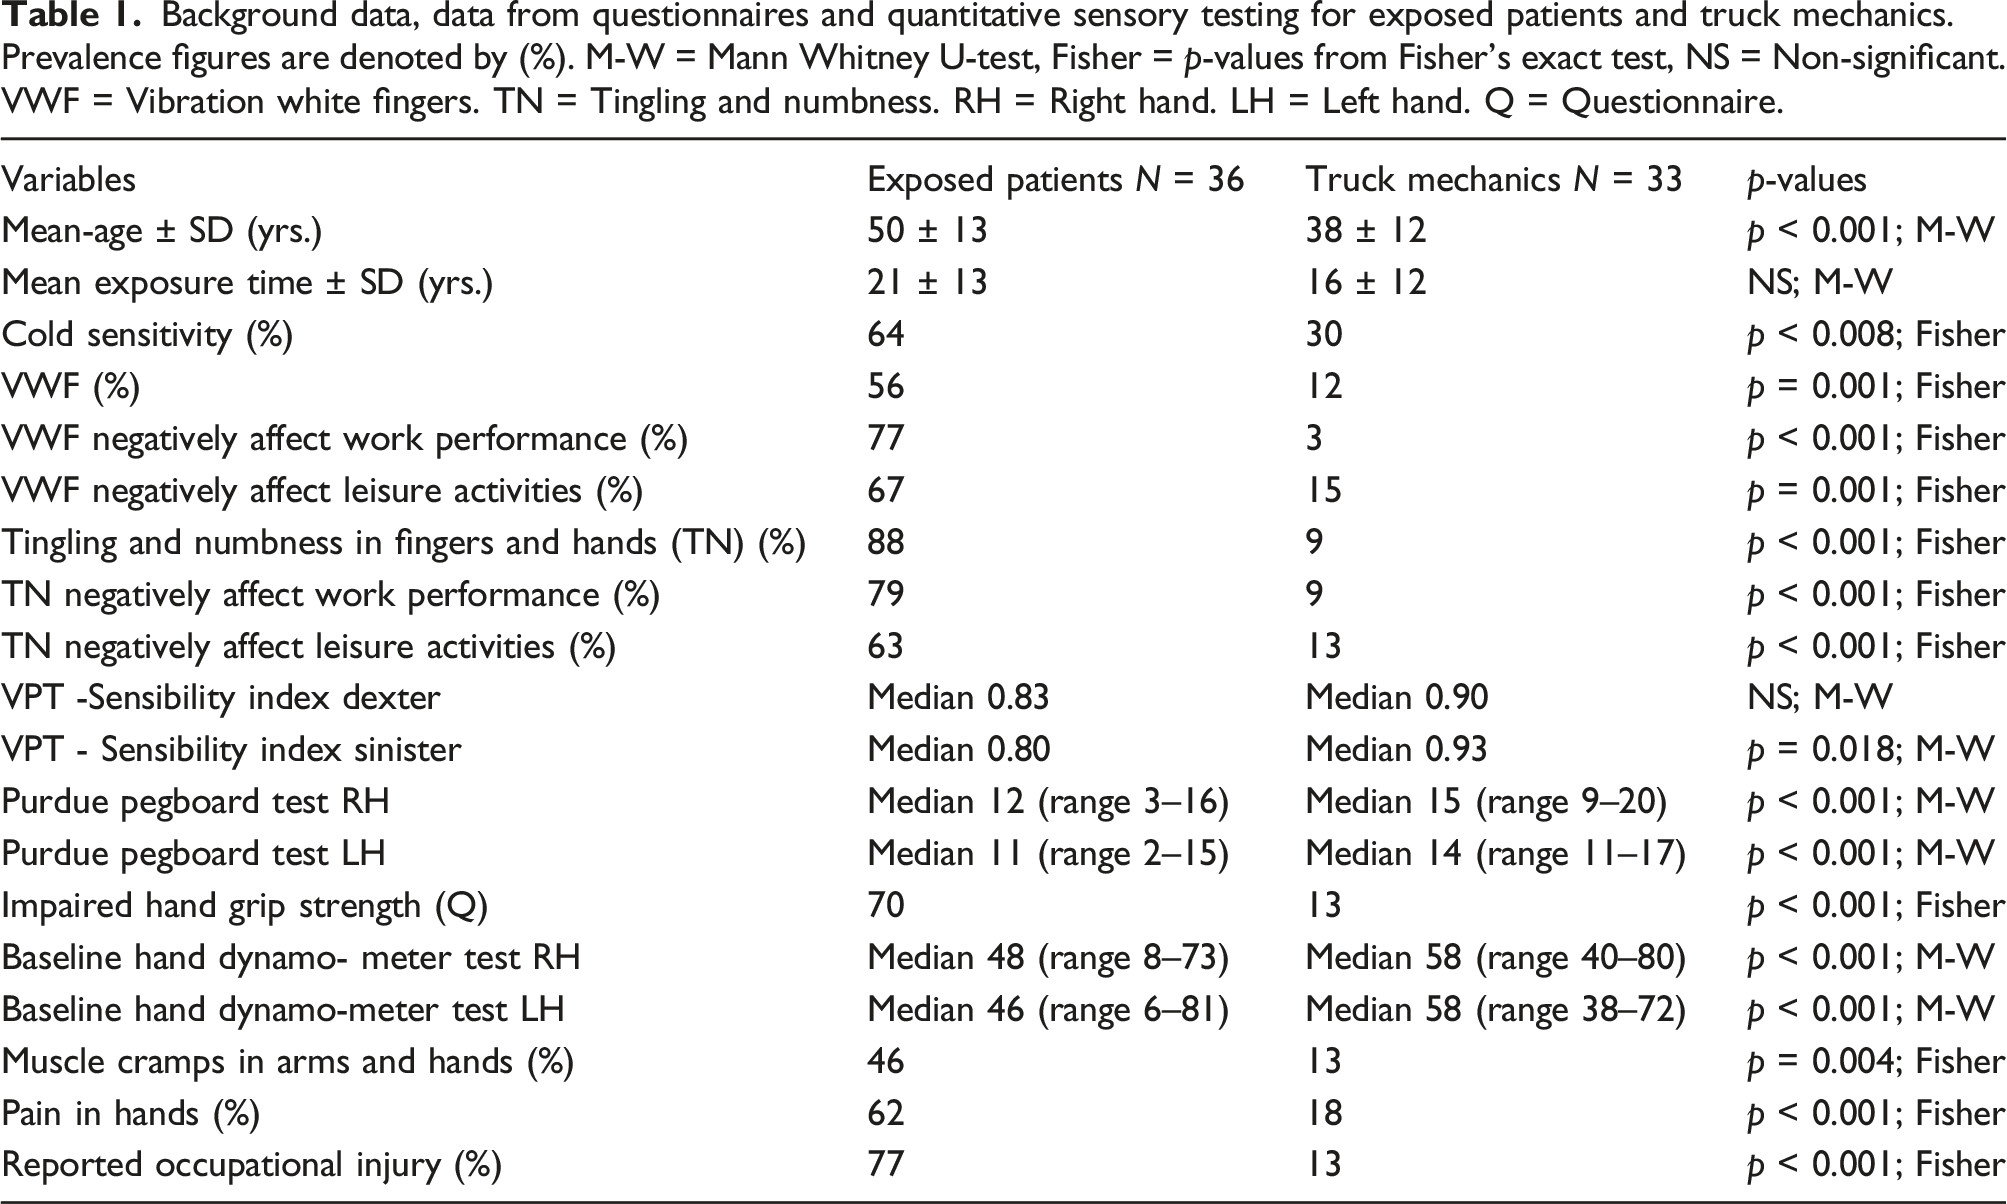
Background data, data from questionnaires and quantitative sensory testing for exposed patients and truck mechanics. Prevalence figures are denoted by (%). M-W = Mann Whitney U-test, Fisher = p-values from Fisher’s exact test, NS = Non-significant. VWF = Vibration white fingers. TN = Tingling and numbness. RH = Right hand. LH = Left hand. Q = Questionnaire.
Medical examinations
A medical examination was performed by an experienced physician. The neurosensory tests included Semmes-Weinstein’s monofilament test (5 filament kit), handgrip strength (Baseline hydraulic hand dynamometer), the Purdue Pegboard test and the determination of vibration perception thresholds (VPT). The testing procedure was as follows: review of questionnaire, 2-PD, monofilament tests, handgrip strength, the determination of vibration perception thresholds and the Purdue Pegboard test.
Vibrotactile measurements
Sinusoidal vibrations were delivered to the pulps of dig 2 in both hands by the ascending-descending method of limits. The subject’s response was received by the VibroSense Meter® system (Vibrosense Dynamics, Malmö, Sweden). The testing included sinusoidal frequencies at seven frequencies (8 Hz, 16 Hz, 32 Hz, 64 Hz, 128 Hz, 256 Hz, and 512 Hz), all transmitted to the finger through a vibration probe with a diameter of 4 mm. The finger temperature had to be at least + 28° before the test started and the contact force between the probe and the finger was 1 N. To make the testing more comfortable for the subject, the wrist and the forearm of the participant was supported. The magnitude of the vibration was increased until the patient could feel the vibration in the finger. When the participant pressed the response button, the vibration magnitude decreased until the subject released the response button. Then the vibration amplitude started to rise again. The rate of change of the vibration amplitude was 3 dB/s and for each frequency there were six reversals. The starting point was 8 Hz, thereafter, the testing automatically continued to the next frequency until the endpoint 512 Hz was reached. After a short break the testing of the other index finger started.
All results were age-corrected8,9 using VPT-determinations from a large normal population of different age groups supplied by the manufacturer of the device. The normal values in different age-groups were compared with the test results from the vibration exposed workers in similar age groups.
All participants used ear protective devices to exclude the noise from indoor and outdoor sources. A sensibility index (SI) was calculated by dividing the area under the curve from the patient with the corresponding area for the reference population, which was supplied by the manufacturer of the instrument. An SI-index < 0.8 was interpreted as an abnormal response. In exposed patients with sensorineural symptoms in fingers, vibration perception threshold determinations (VPTs) have shown sensitivities greater than 80% and specificities around 90%, with areas under the receiver operating characteristic curves around 0.9. 10 An excellent reliability has been observed in VPT-determinations in patients with diabetic neuropathy, ICC >0.94. 11
Handgrip force
A Baseline® Hydraulic Hand Dynamometer (Fabrication Enterprises Incorporated, New York, NY, USA) in position number 2 (width of the handle, 5 cm) was used to estimate the handgrip force. The mean of three measurements was used as the handgrip strength in the right and left hand, respectively.
Purdue Pegboard
The Purdue Pegboard test board (model 32020) from the Lafayette Instrument Company has two parallel rows with 25 holes into which cylindrical metal pegs should be placed, one by one, by the participants. After a brief practice, the dominant and non-dominant hand were tested separately three times each during a test period of 30 s. Thereafter, the mean score was calculated and compared with values from a reference population supplied by the manufacturer. The reliability is high. A three-trial administration test showed a high test-retest reliability ranging from 0.81 to 0.89 after a retest interval of 1 week. 12
Semmes Weinstein’s monofilament test
The test was performed with a 5-filament kit on dig 2 and 5 on the right and left hand respectively. The normal reference limit for the monofilament test is ≤ 3.61 (0.4g).
Statistics
Normal probability plots and Levene’s test were used to check the normality of the input variables. As most of the variables showed a skewed distribution, non-parametric statistics was used for the statistical calculations.
Differences between independent variables were evaluated with the Mann-Whitney U-test. For the comparison of variables based on a nominal or ordinal scale, the Chi-square test for independence was used. Associations between the studied variables was performed by calculating the Spearman rank correlation coefficient. p-values < 0.05 were regarded as statistically significant.
Logistic regression (Binary Logistic) was used to assess how well a set of predictor variables explained the categorical dependent variables neurosensory disturbances, vibration white fingers, handgrip strength and the notification of a work injury. The data was obtained from the answers in the questionnaire and from test results. We wanted to describe the relative importance of each independent variable and summarize the accuracy of the classification of cases based on these models.
All calculations were performed with the IBM SPSS Statistics for Windows, Version 28.0. 13
Results
Vascular symptoms
Almost two thirds of the exposed patients reported vascular symptoms such as increased sensitivity to cold and more than half were bothered by white finger attacks. These symptoms were quite severe as 70-80% of the exposed patients reported that the VWF negatively affected work performance as well as leisure activities. As can be seen in Table 1, these symptoms were considerably milder among the car mechanics.
Neurosensory symptoms
Almost 90% of the exposed patients suffered from tingling and numbness in fingers and hands and between 60 and 80% of these workers reported that the neurosensory symptoms disturbed both work performance and leisure activities. The mean latency time from the start of exposure to the development of neurosensory symptoms in the hands and fingers was approximately 10 years among the exposed patients. The neurosensory symptoms were not as prominent among the car mechanics (Table 1).
Quantitative sensory testing
In agreement with the reported lower prevalence of vascular and neurosensory symptoms, the truck mechanics performed better during the quantitative sensory testing. They showed a significantly better vibrosensory perception threshold in the left index finger compared to the exposed patients, while no difference was noted for the right-hand comparison (Table 1).
Semmes Weinstein’s monofilament test showed a better performance among the truck mechanics in dig 2 sinister and dig 5 dexter compared to the exposed patients (p ≤ 0.003). When relating symptoms such as numbness and tingling in fingers to the VPT determinations in the total material, the sensitivity of the test was 40% (right hand), 55% (left hand), and the specificity 74% (right hand) and 90% in the left hand. For monofilament tests the corresponding sensitivity was 33% (right and left hand), and the specificity 90% (right hand) and 87%, respectively in the left hand.
Manual dexterity was checked by the Purdue Pegboard test, which showed a better performance (p < 0.001) among the truck mechanics as compared with the exposed patients in both right and left hand (Table 1). Similarly, a stronger handgrip strength (p < 0.001) was observed among the truck mechanics compared to the exposed patients (Table 1). Thirteen percent of the truck mechanics reported reduced hand strength in the questionnaire. All truck mechanics, however, showed normal hand strength when tested with the Baseline hand dynamometer.
A large part of the exposed patients (N = 26) reported numbness and tingling in fingers and hands. About 46% of them had a deviating outcome for one of the neurosensory tests that were used in the study. Two positive tests encompassed 65% of the subjects and with three positive tests about 85% of the subjects were identified.
Among the exposed patients, the highest sensitivity was noted for the determination of vibration perception thresholds (42% – 56%), followed in order by monofilament tests (35%), Baseline hydraulic hand dynamometer (19%–23%) and Purdue Pegboard (4%–8 %). The specificity was high for the determination of vibration perception thresholds, Baseline hydraulic hand dynamometer and Purdue Pegboard (100%) and 33% for monofilament. Among the exposed patients 70% reported reduced hand strength in the questionnaire. The Baseline hydraulic hand dynamometer testing showed deviating results for 23% in the right hand and 19% in the left hand.
Among the truck mechanics, the sensitivity was 0% for Purdue Pegboard and Baseline hydraulic hand dynamometer, 25% for monofilament and 25% – 50% for VPT. The specificity was high for monofilament, Purdue Pegboard and Baseline hydraulic hand dynamometer (93% – 100%) and somewhat lower for VPT (71% – 89%).
Few of the truck mechanics reported symptoms such as numbness and tingling. Among 28 workers without these symptoms, 16 individuals (57%) showed normal results on all neurosensory tests and 10 workers showed three normal and one deviant tests.
Musculoskeletal symptoms
Pain in fingers and hands and muscle cramps in arms and hands was approximately three and a half times more common among the exposed patients compared to the truck mechanics. The reporting of an occupational injury followed the same pattern (Table 1)
Correlation coefficients
Nonparametric correlation coefficients showed that age and vibration exposure time were rather strongly associated in the total material (r s = 070; p < 0.001). As expected, the handgrip strength was negatively related to age (rs = −0.57 right hand; −0.54 left hand; p < 0.001). Age was also negatively associated with the outcome of the Purdue Pegboard test (rs = −0.58 right hand; rs = −0.60 left hand; p < 0.001).
Logistic regression
Direct logistic regression was used to assess the impact of a set of predictor variables on the dependent variable neurosensory symptoms (numbness and tingling in fingers and hands). The model contained two independent variables (age, increased cold sensitivity). The full model containing all predictors was statistically significant, χ2 (3, N = 64) = 28,074, p < 0.001, and explained between 35.5% (Cox & Snell R Square) and 47.5% (Nagelkerke R Square) of the variance in neurosensory symptoms. This indicates that the model was able to distinguish between subjects who reported versus did not report neurosensory symptoms. The full model correctly classified 79.7% of the cases. The two independent variables all made a unique statistically significant contribution to the model. The strongest predictor of neurosensory symptoms was age followed by increased cold sensitivity.
A second model analysed which predictors that affected the prevalence of vibration white fingers. Two independent variables were included in the final model, age and increased cold sensitivity. The full model was statistically significant ꭓ2 (3, N = 52) = 15.227, p = 0.002) and explained between 25.4% and 35.8% of the variance of the prevalence of vibration white fingers. The full model explained 76.9% of cases. The strongest predictor was cold sensitivity followed by age.
A logistic regression analysis was also performed to elucidate which predictors that affected the grip strength in hands. The model contained three independent variables (age, pain in hands and fingers, cramps in arms and hands). The full model containing all predictors was statistically significant, ꭓ2 (3, N = 64) = 41.71, p < 0.001). The full model explained between 47.9% and 64.0% of the variance in hand grip strength, and correctly classified 84.8% of cases. Only these three predictors made a unique statistically significant contribution to the handgrip strength. The strongest predictor was cramps in arms and hands followed in order by age and pain in arms and hands.
Another model analysed which predictors that influenced a notification of a work injury. This model was based on two independent variables, age, and symptoms such as numbness and tingling in arms and hands. The complete model was statistically significant ꭓ2 (2, N = 58) = 35.21, p < 0.001), explained between 45.5% and 61.1% of the variance in the notification of a work injury and correctly classified 86.2% of cases. The strongest predictor was the prevalence of numbness and tingling in arms and hands followed by age.
Discussion
Increased cold sensitivity was quite frequent among both exposed patients and truck mechanics. The prevalence of vibration white fingers, however, and neurosensory findings were high among the exposed patients and low to moderate among the truck mechanics.
As mentioned above the prevalence of vibration white fingers (Mb Raynaud) and neurosensory findings can vary considerably from about 10 to 15%14,15 and up to almost 100%.16–20 Usually, the prevalence is increasing with increased exposure time.
The A(8) value is not a good predictor of the risk of developing vibration related symptoms when the worker is exposed to transient and high frequency vibrations. 6 Neither is it an accurate measure of the total vibration exposure as it is based on the ISO-standard 5349-1, which only covers frequencies up to 1250 Hz. Values above 1250 Hz are named ultravibrations and can reach a level of 7–10 kHz for an impact wrench.
In 1918, Hamilton et al. 21 investigated stone cutters using air hammers and found several workers with vibration white fingers. Almost 60 years later, Taylor et al. 17 studied 30 remaining stone cutters from this area and found a high prevalence of both VWF (60%–80%) and neurosensory finings (50%–75%). A decade later, Bovenzi et al. 18 reported a 30% prevalence of VWF and a 40% prevalence for neurosensory symptoms among stone cutters. Usually, the tool grip will influence the vibration transmission from the tool to the hand. Stone cutters/chippers and stone drillers showed a 36% prevalence of VWF in another study by the same author 19 with a mean latency period of 10 years before the development of VWF. The authors found a significant relationship between the vibration exposure level and the severity of VWF.
This is approximately the same length of the latency period as noted in exposed patients in our study. Due to small numbers, however, it was not possible to calculate the corresponding latency times among the truck mechanics
Considerably higher prevalences of VWF (79%) and neurosensory disturbances (65.3%) have been reported among Hungarian foundry workers using chipping hammers and grinders. 20
In a Finnish study, 16 workers using pneumatic hammers were studied. The left hand that held the chisel was more heavily exposed to vibrations than the right hand holding the barrel of the hammer. Of the studied 16 workers, 14 developed vibration white fingers. 16 In another Finnish study of foundry workers doing pedestal grinding, all workers developed VWF after a mean latency time of 10.3 months. The main cause was a transition from the old corundum wheels to the new zirconium-corundum wheels. 22
The prevalence of neurosensory symptoms was higher than the prevalence of vascular symptoms among the exposed patients in our study. The prevalence for Raynaud’s phenomenon is comparable with figures from the aircraft industry, 23 where riveters using riveting hammers and bucking bars for more than 10 years showed a prevalence of approximately 50% for VWF. They were all exposed to transient and high frequency vibrations. Similar prevalence figures have been reported from studies in wheel loader assembly plant workers using impact wrenches and anvils. 6 The high figures for VWF and neurosensory disturbances may be due to impact and shock wave accelerations distorting the tissues in the hand. The repetitive impulse character of the vibration may not give the tissues in fingers and hands enough time to recover. Equal or even higher prevalence figures (50%–100%) have been reported among stone workers using pneumatic hammers, and among foundry workers doing pedestal grinding with grinding wheels made by zirconium corundum. 22 Mason et al. 24 observed that upper extremity disability is very largely related to sensorineural symptoms compared to vascular symptoms.
The prevalence figures for VWF and neurosensory findings among the truck mechanics on the other hand are comparable with results reported in studies of truck mechanics 14 and gold miners. 15 In a study of 806 truck mechanics, Barregard et al. 14 found an average weighted acceleration level of 3.5 m/s2 and a mean daily exposure to nut-runners of 14 min corresponding to an A (8)-value of 0.6 m/s2. The mean exposure time was 12 years. The prevalence of white fingers was around 15% and the prevalence of neurosensory findings was about 20% in the entire study base of truck mechanics. After 20 years of exposure, the prevalence of vibration white fingers was about 25% and the prevalence of neurosensory findings around 40%. The hand-arm vibration syndrome (HAVS) in South African gold miners using rock drills with vibration magnitudes exceeding 24–31 m/s2, was studied by Nyantumbu et al. 15 These tools produce high levels of both low frequency and high frequency vibrations. The prevalence of HAVS among the miners was 15% compared to 5% among the referents. Both groups had an average exposure time of approximately 15 years.
Despite the report of increased prevalence of neurosensory findings in the questionnaire among the exposed patients, this group as well as the truck mechanics showed relatively normal median values during the determination of the vibration perception thresholds (normal sensibility index is ≥ 0.80; Table 1). These tests in the right and left index fingers, reflect the function in the Aβ-nerves. Another test of the function in the Aβ-nerves is the Semmes Weinstein’s monofilament test, which determines the response to pressure and touch. The results differed significantly between exposed patients and truck mechanics in dig 2 sinister and dig 5 dexter (Fisher’s exact test ≤ 0.009). A more in-depth analysis of the monofilament tests showed that the proportion of normal test results in dig 2 and 5 bilaterally among the truck mechanics was ranging between 91 and 100%. Among the exposed patients, the corresponding range was between 62 and 82%.
The truck mechanics performed significantly better on the Purdue pegboard test and on the Baseline hand dynamometer test compared to the exposed patients. In the total material, logistic regression showed that age and increased cold sensitivity were significant predictors of both neurosensory disturbances (strongest predictor age) and vibration white fingers (strongest predictor increased cold sensitivity). This indicates that the models can distinguish between subjects who reported versus did not report neurosensory symptoms or vibration white fingers.
Direct logistic regression was performed to study the impact of three variables on the reduced grip strength (cramps in hands and fingers, age, pain in hands and fingers). The full model containing all predictors in that order was statistically significant in the total material, indicating that the model was able to distinguish between workers who reported or not reported a reduced grip strength. In a meta-analysis based on 28 studies for both sexes, grip strength increased from age 6 until about age 20, was fairly unchanged between age 20 and 40, after which it gradually declined after the age of 40. 25 A 2-year study of 134 consecutive subjects at a hospital occupational medicine clinic in the US, showed as in our study, a negative relationship between pain in hands and grip strength. 26
About two thirds of the exposed patients reported reduced handgrip strength in the questionnaire. This discrepancy was verified by the Baseline hand dynamometer test, showing a significant difference between the two groups (p < 0.001; Table 1). When comparing the individual answers in the questionnaire with the outcome of the Baseline hand dynamometer test, 21% (right hand) and 17% (left hand) performed below the limit value of the test. A similar tendency was seen among the truck mechanics where 13% reported reduced hand strength in the questionnaire, while all subjects showed a normal result in the Baseline hand dynamometer testing. Several factors can influence this outcome. Light symptoms may not be detected during the neurosensory testing. Too wide or too narrow reference intervals may also have an impact on the outcome. Decreased handgrip strength is a well-known symptom among vibration-exposed patients. For most workers this is a slow ongoing process over many years.
In serious cases it may be relevant with a notification of a work injury. For these cases, numbness and tingling in arms and hands and age were significant predictors.
The number of false positives were low among the exposed patients and among the truck mechanics. For most neurosensory tests the number of false positives were within a range of 0 – 3 subjects. The number of false negatives were in the same range for truck mechanics but considerably higher among the exposed patients.
Workers with HAVS often complain about pain in hands and fingers. Almost two thirds of the exposed patients reported pain in hands in comparison with 18% among the truck mechanics (Table 1). In a 22-years study of workers that continued to work with vibrating tools, both numbness and pain in hand and fingers tended to aggravate. 27
Manual dexterity is measured by the Purdue Pegboard test where the truck mechanics performed significantly better in both right and left hand (p < 0.001), compared with the exposed patients. The difference between the median values was 3 pins in both right and left hand. This quantitative test for diagnosing the hand-arm vibration syndrome has been reviewed by Mahbub et al. 28 For the three papers that dealt with the Purdue Pegboard test, the sensitivity ranged between 45 and 85%, and the specificity between 78 and 95%, respectively. Hand functional difficulties are quite common among subjects with HAVS, e.g., problems in buttoning a shirt, picking up coins, opening a jar lid, writing with a pen, and turning the pages of a book or a newspaper. Prevalence figures around 42% have been reported by Cederlund et al. 29 and up to 60%–80% by Sakakibara et al. 30 Reduced manual dexterity has also been observed in vibration exposed asymptomatic workers. 31
Most of the exposed patients reported symptoms with tingling and numbness in hands and fingers. The opposite pattern was observed among the truck mechanics where few reported this kind of problem. Antonson et al. 32 compared four examination methods among workers with the hand arm vibration syndrome. The detection rate for 2-PD was 35%, for monofilament 54%, for tuning fork 17% and for Rolltemp 66%. If only one of these methods were included in the screening process, on average about 47% of the workers would have been detected. Two methods increased the figure up to 71%, three methods up to 88% and with four methods 100% was obtained. In our study comparable results were obtained. One examination method identified 46% of the exposed patients, two methods about 65% and three methods around 85%. Among the truck mechanics most workers had no problems with numbness and tingling. Almost 60% of these workers showed normal neurosensory test results and if including subjects with three normal and one pathologic test nearly 90% of these workers were identified.
Nonparametric correlation coefficients showed a strong correlation between age and exposure time in the total material (rs = 0.65; p < 0.001). This is probably the reason why exposure time was not included as a predictor in the logistic model. As expected, the results from the handgrip strength test as well as the Purdue Pegboard test were negatively related to age.
New measurement systems have shown promising results, e.g., the wavelet analysis, which has been useful for analysing physiological systems. 33 One advantage over classical sign analysis is the possibility to detect and analyse nonstationarity in signals. The technique was introduced in the early 1900s by Alfred Haar but has developed significantly since then and has become one of the most efficient tools for signal and image processing.
Conclusions
The exposed patients reported significantly more symptoms and signs of the hand-arm vibration syndrome than the truck mechanics.
In the total material, logistic regression showed that age and increased cold sensitivity were significant predictors of both neurosensory disturbances (strongest predictor age) and vibration white fingers (strongest predictor increased cold sensitivity).
In our study, cramps in arms and hands, age and pain in hands and age, in that order, were significant predictors of reduced grip strength.
The differences between the two groups seem to be larger for category variables (no vs yes) compared to continuous variables such as VPT, Baseline hand dynamometer and Purdue Pegboard. This shows the importance of combining data from questionnaires with data from clinical examinations to get a more accurate assessment of the subject’s vibration-related symptoms.
The clinical examination had a high sensitivity for detecting symptoms. The specificity was also high for identifying healthy workers. The few false positives in the clinical examination can be attributed to too wide normal reference values of to early detection of an incipient disorder.
Footnotes
Acknowledgments
Valuable help with the clinical test procedures and investigations from Linda Ahlstrom, MSc, Christina Ahlstrand, Biomedical scientist and Helena Eriksson, MD is gratefully acknowledged.
Authors contributions
LG wrote the manuscript, contributed to the design of the study and to the outcome measurements, performed the statistical analyses and the interpretation of the data. MH contributed to the design of the study and to the outcome measurements, participated in the interpretation of the data and contributed to the preparation of the manuscript.
Declaration of conflicting interests
The author(s) declared no potential conflicts of interest with respect to the research, authorship, and/or publication of this article.
Funding
The author(s) received no financial support for the research, authorship, and/or publication of this article.
Statements of human rights
The study was approved by the ethical committee at the University of Gothenburg. It has been performed in accordance with the ethical standards as laid down in the 1964 Declaration of Helsinki and its later amendments or comparable ethical standards.
Approval
All authors have read and approved the final manuscript.
Informed consent
Informed consent was obtained from all individual participants included in the study.
Data availability statement
The dataset generated during and/or analyzed during the current study are available from the corresponding author upon reasonable request from ![]()