
Abstract
Background
Gait variability is increased in people with bilateral vestibulopathy (BVP). Since dedicated gait analysis can be resource-intensive, concurrent assessment with another vestibular function test, dynamic visual acuity (DVA), is worth consideration.
Objective
To assess comparability of results from a combined gait and DVA assessment with results from a previous dedicated gait analysis.
Methods
15 participants (4 women) with BVP were analysed. The DVA test assessed visual acuity during stance and during treadmill walking at 2, 4 and 6 km/h. An 8-camera motion capture system measured spatiotemporal gait parameters (step length, step time, step width and double support time; means and coefficients of variation [CoV]). The walking speed effect was assessed by mixed-effects models, and results were visually compared to previous results.
Results
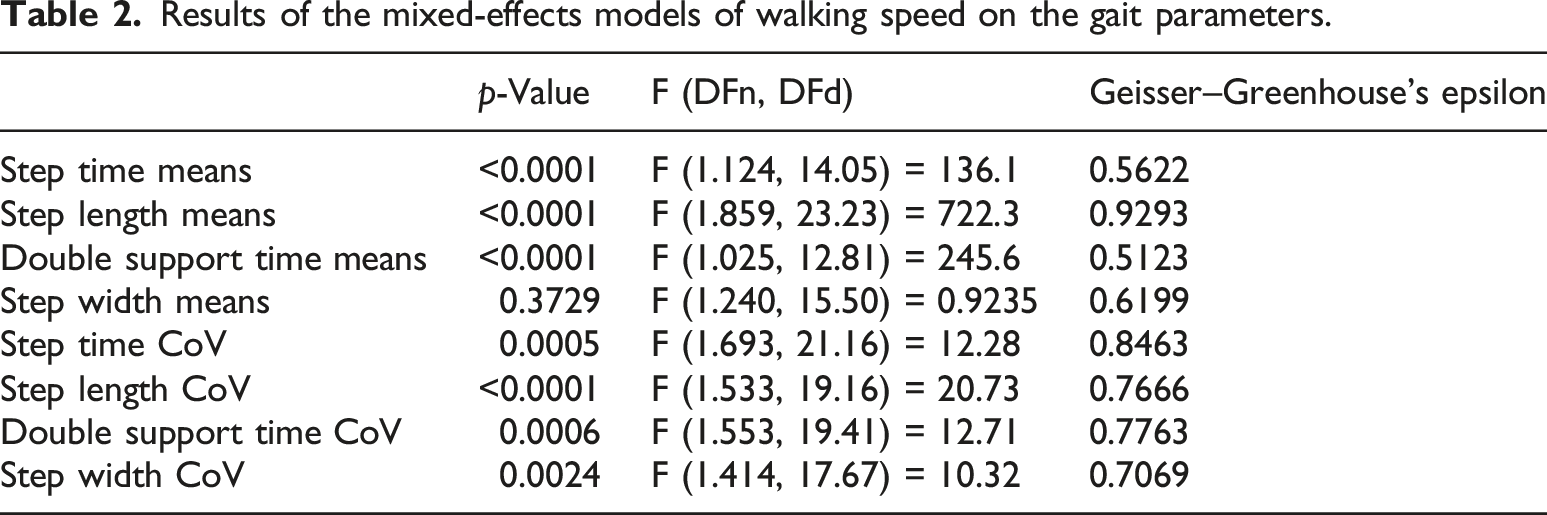
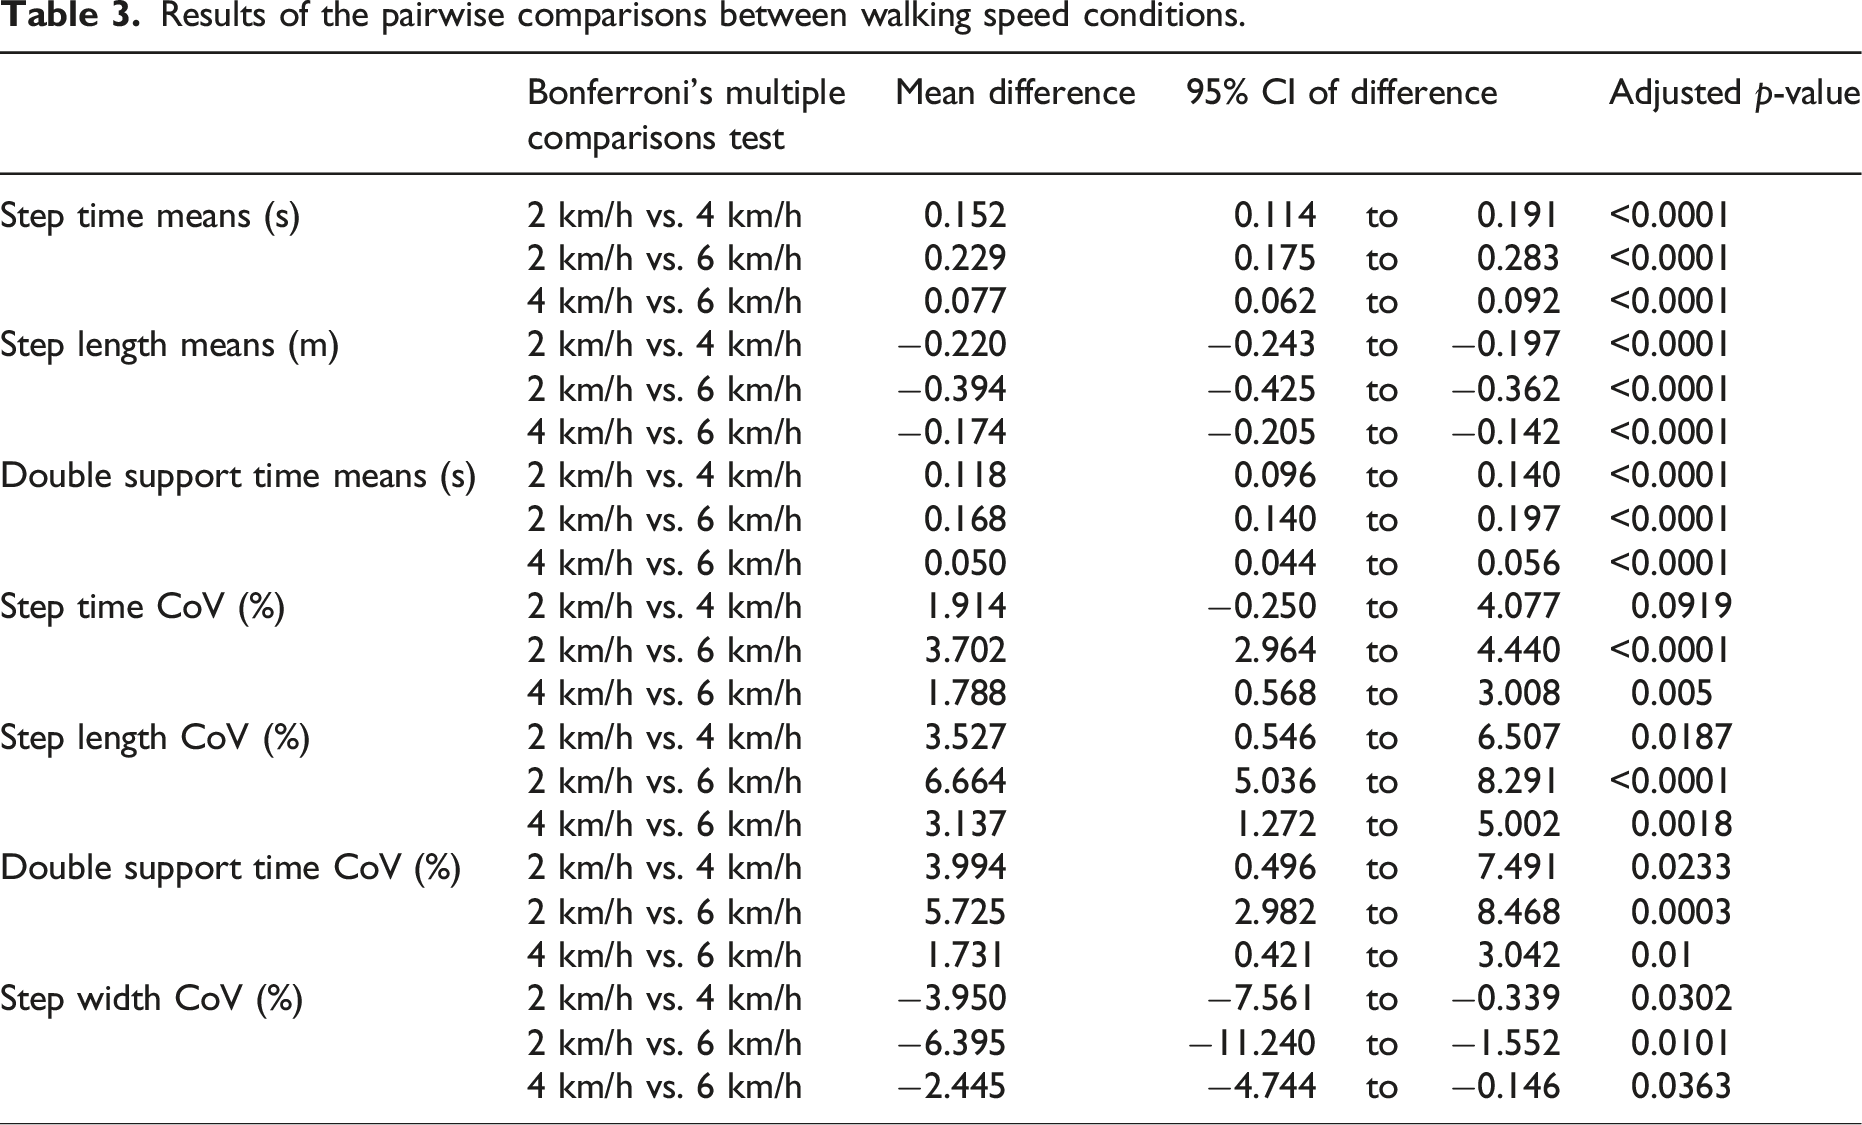
Walking speed affected the means of step length, step time and double support time (p < .0001) but not step width (p = .373) and significantly affected the CoV of all parameters (p < .01). These values, as well as speed-related changes, were comparable between contexts.
Conclusions
Concurrent DVA and gait assessment seems promising as an assessment method in people with BVP. Test-retest reliability, clinically feasible motion capture solutions and sensitivity to change following interventions should be further investigated.
Introduction
Bilateral vestibulopathy (BVP), categorized by significant bilateral impairment or absence of vestibular function,1,2 leads to various physical, cognitive and emotional complaints, often contributing to a diminished quality of life. 3 Among these complaints, reduced balance performance,4,5 an increased risk of falls,6–9 and increased variability of spatiotemporal gait parameters8,10,11 can severely affect patients’ mobility. Clinical tests of vestibular function do not correspond well to increased risk of falls8,12 or to spatiotemporal gait variability parameters in people with BVP, 10 indicating that tests of gait and balance are an important addition to vestibular function testing. However, gait analysis can be costly, time consuming and require specific expertise and equipment. Integration of gait analysis with other tests used to evaluate people with BVP may help address some of these issues.
One test of vestibular function in BVP that may be well suited to a combination with gait analysis is dynamic visual acuity (DVA) testing.13–16 DVA refers to the extent to which the visual system can maintain clear and detailed visual perception of objects during head movements 17 and can be tested by comparing visual acuity during a static condition (i.e., no/little head movement) to visual acuity during a dynamic condition such as walking (i.e., with head movement). This is commonly conducted in research settings in people with BVP over multiple different walking speeds (e.g., 2, 4 and 6 km/h) on a treadmill, meaning that potential walking speed effects on gait parameters of interest can also be investigated by a combined testing approach. However, due to differences in task duration (and thereby number of steps measured) and requirements (e.g., concurrent walking and DVA assessment may function as a cognitive dual-task and could lead to deteriorations in gait18,19), it is currently unclear if mean and variability values of spatiotemporal gait parameters assessed during DVA testing will closely replicate previous values found in more dedicated gait analysis setups and protocols. In our previous study, we found that step length, step time and double support time variability could distinguish between the healthy participants and participants with BVP, and between people with BVP with different locomotor capacities. 10
In a previous study, people with bilateral vestibulopathy completed a dynamic visual acuity test on a treadmill. 12 While not analysed or reported in the previous publication, motion capture data was recorded during most of these trials. In this study, we analysed the spatiotemporal gait parameters of these participants during the different speeds of the DVA test. In order to assess if combined gait and DVA analysis could have potential as an efficient assessment method for people with BVP, we aimed to determine (1) if we could replicate the statistically significant effects of walking speed on the spatiotemporal parameters and their variability found previously 10 and (2) if the means and variability of the parameters determined in this way were similar to those reported in a dedicated gait analysis protocol 10 in a different cohort of people with BVP.
Methods
Participants
The data recorded during the DVA testing analysed in this study were collected previously as part of a study approved by the Ethics Committee of the University of Antwerp/Antwerp University Hospital (B300201629697). All participants gave written informed consent at the time of study inclusion. All participants included in the previous study met the diagnostic criteria of bilateral vestibulopathy as proposed by the Barany Society1,2: (1) a horizontal angular vestibulo-ocular reflex (VOR) gain <0.6, as measured by the video Head Impulse Test (vHIT) and/or (2) a reduced caloric response (i.e., sum of bithermal, 30 and 44°C, maximum peak slow-phase velocity on each side <6°/s) and/or (3) a reduced horizontal angular VOR gain ≤0.1 upon sinusoidal stimulation on a rotatory chair. The DVA results were analysed and discussed in a previous publication. 12 From the convenience sample of 27 BVP patients included in the previous study, 12 ten had missing marker data or large gaps in marker data and could not be processed. Two did not have motion capture recordings. This left viable motion capture data of 15 participants (11 men and 4 women). These 15 participants had mean (SD) age of 54.5(10.5) years, height of 172.6(9.5)cm, and weight of 75.4(17.3)kg. Given the secondary nature of the analysis, no formal sample size calculation was performed a priori.
Number of steps analysed for each participant at each walking speed.
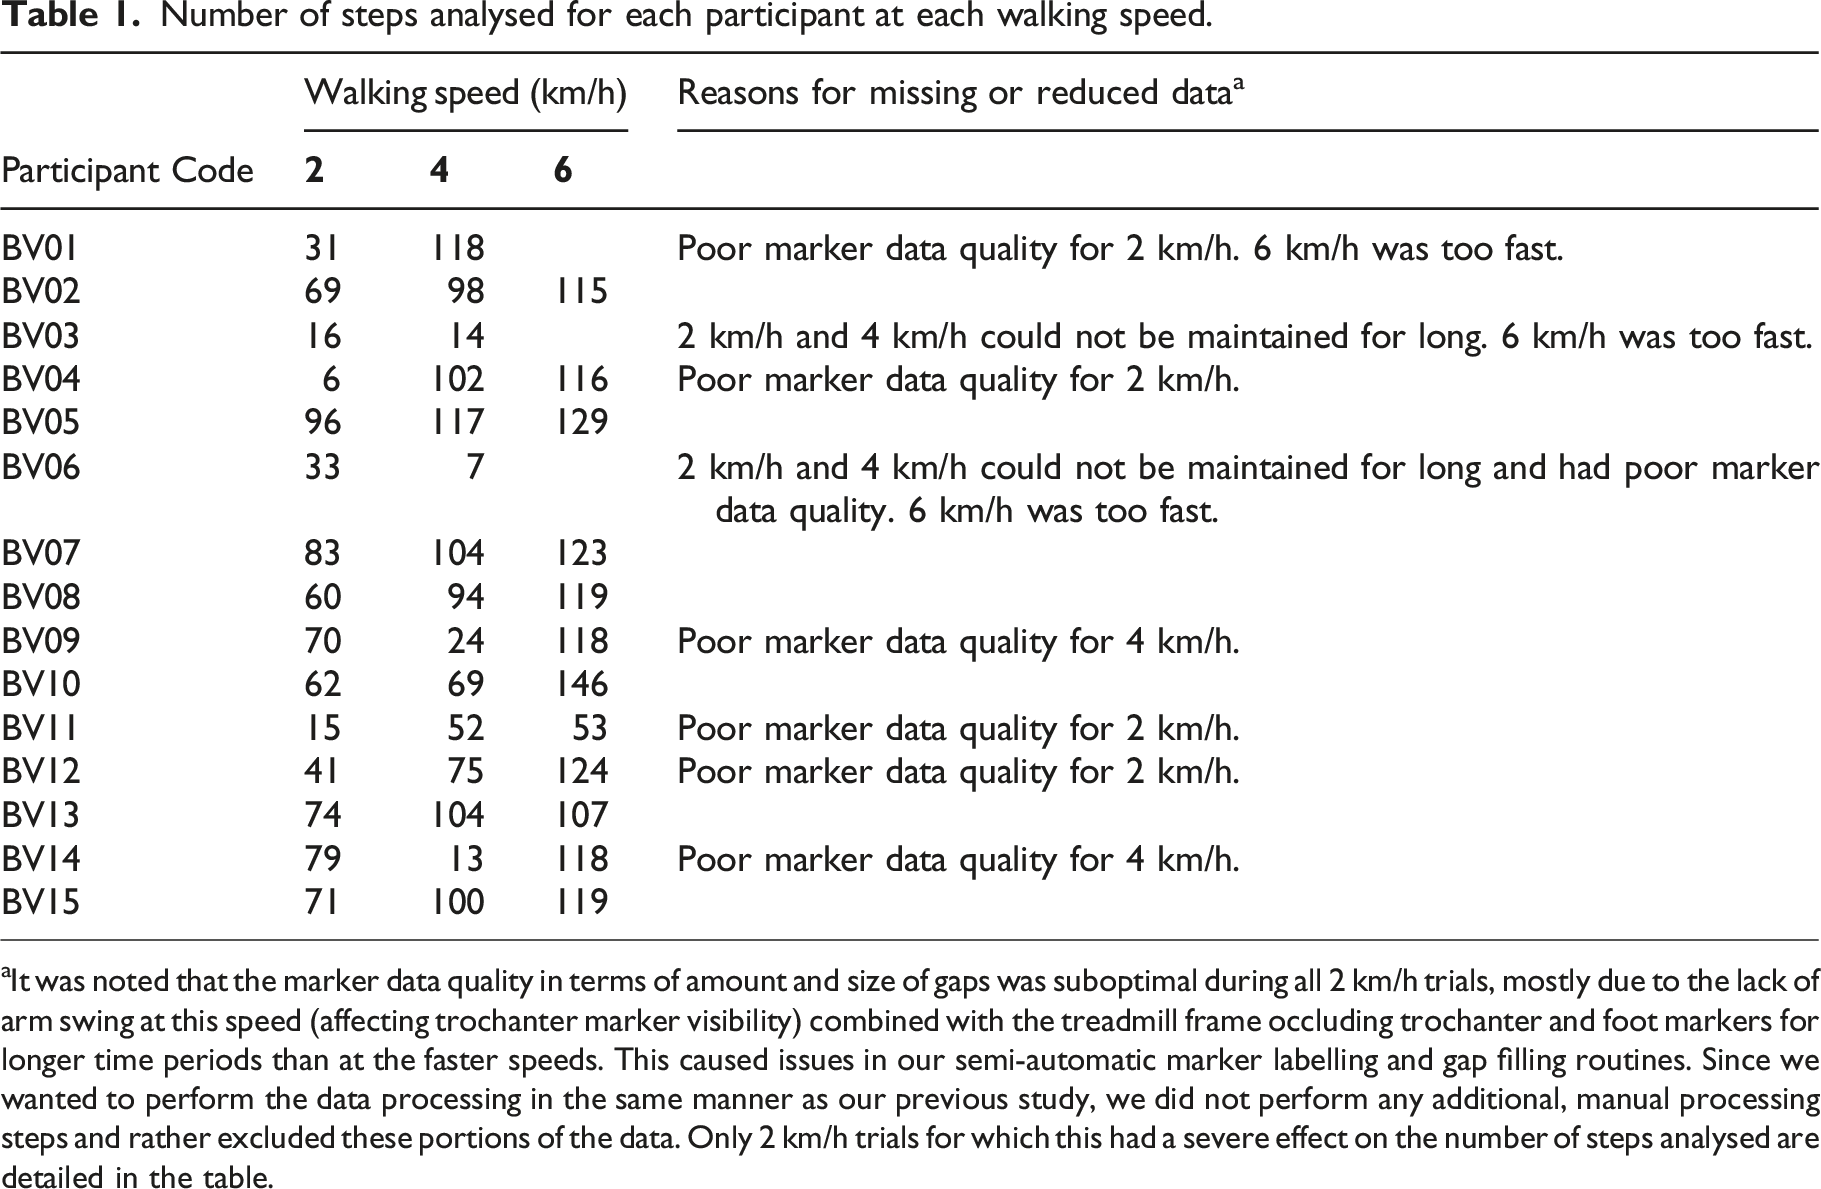
aIt was noted that the marker data quality in terms of amount and size of gaps was suboptimal during all 2 km/h trials, mostly due to the lack of arm swing at this speed (affecting trochanter marker visibility) combined with the treadmill frame occluding trochanter and foot markers for longer time periods than at the faster speeds. This caused issues in our semi-automatic marker labelling and gap filling routines. Since we wanted to perform the data processing in the same manner as our previous study, we did not perform any additional, manual processing steps and rather excluded these portions of the data. Only 2 km/h trials for which this had a severe effect on the number of steps analysed are detailed in the table.
Dynamic visual acuity testing
The DVA test was prepared as described in Verbecque et al. 22 Full technical details of the DVA assessment and setup can also found in Herssens et al. 12 Here, we detail only the parts of the assessment relevant for the gait assessment. Revised 2000 Series EDTRS charts with Sloan letters (CDHKNORSVZ) were used with rows of five randomly chosen letters. LogMAR scale and notation were used. Each participant read the optotypes aloud to determine the visual acuity and started reading at the 0.4 logMAR line. Whenever the participant was unable to read all optotypes correctly, they were instructed to read the line above (0.5 logMAR), which was repeated until all optotypes on the same line were read correctly. Otherwise, the participant had to read lines with decreasing optotype size until >2 optotypes were missed on a single line. The assessment began with determining static visual acuity while participants stood still on the treadmill keeping their head still. Following this, DVA was assessed while walking on the treadmill at 2, 4 and 6 km/h. The speed conditions were non-randomized, and the participants were allowed a familiarization period of 1 minute for each walking speed. As a result of the nature of the DVA assessment, there was not a standardized number of minutes or steps walking. The test procedure was stopped if the participant or researcher felt that they could not complete the walking speed trial safely. The participants wore a safety harness attached to an overhead frame to avoid falls while standing and walking on the treadmill. Participants were strongly encouraged not to use the treadmill handrails and if handrail use was deemed to be too much by the researcher, indicating that the participant could not walk safely without support, then the testing was stopped for that walking speed.
Data processing
An 8-camera motion capture system (Vicon T10, 100 Hz., Vicon Motion Systems Ltd., Oxford, UK) was used to track reflective markers placed on anatomical landmarks of the participants’ body, corresponding to the left and right hallux, lateral malleolus, major trochanter, the sacrum and C7. The motion capture data was processed in as similar a manner as possible to our previous dedicated gait analysis, 10 the major difference being a lack of force plate in the treadmill. Specifically, marker data were filtered using a low-pass second-order Butterworth filter (zero-phase) with a 12 Hz cut-off frequency. Heel strike and toe off were determined using the method of Zeni et al. 23 The spatiotemporal gait parameters of interest were step length (anteroposterior distance between the hallux markers at foot touchdown), step time (time from touchdown of one foot to touchdown of the next foot), step width (mediolateral distance between the hallux markers at foot touchdown) and double support time (time spent with both feet on the ground). Means and coefficients of variation (CoV) were determined for each speed for each participant.
Statistics
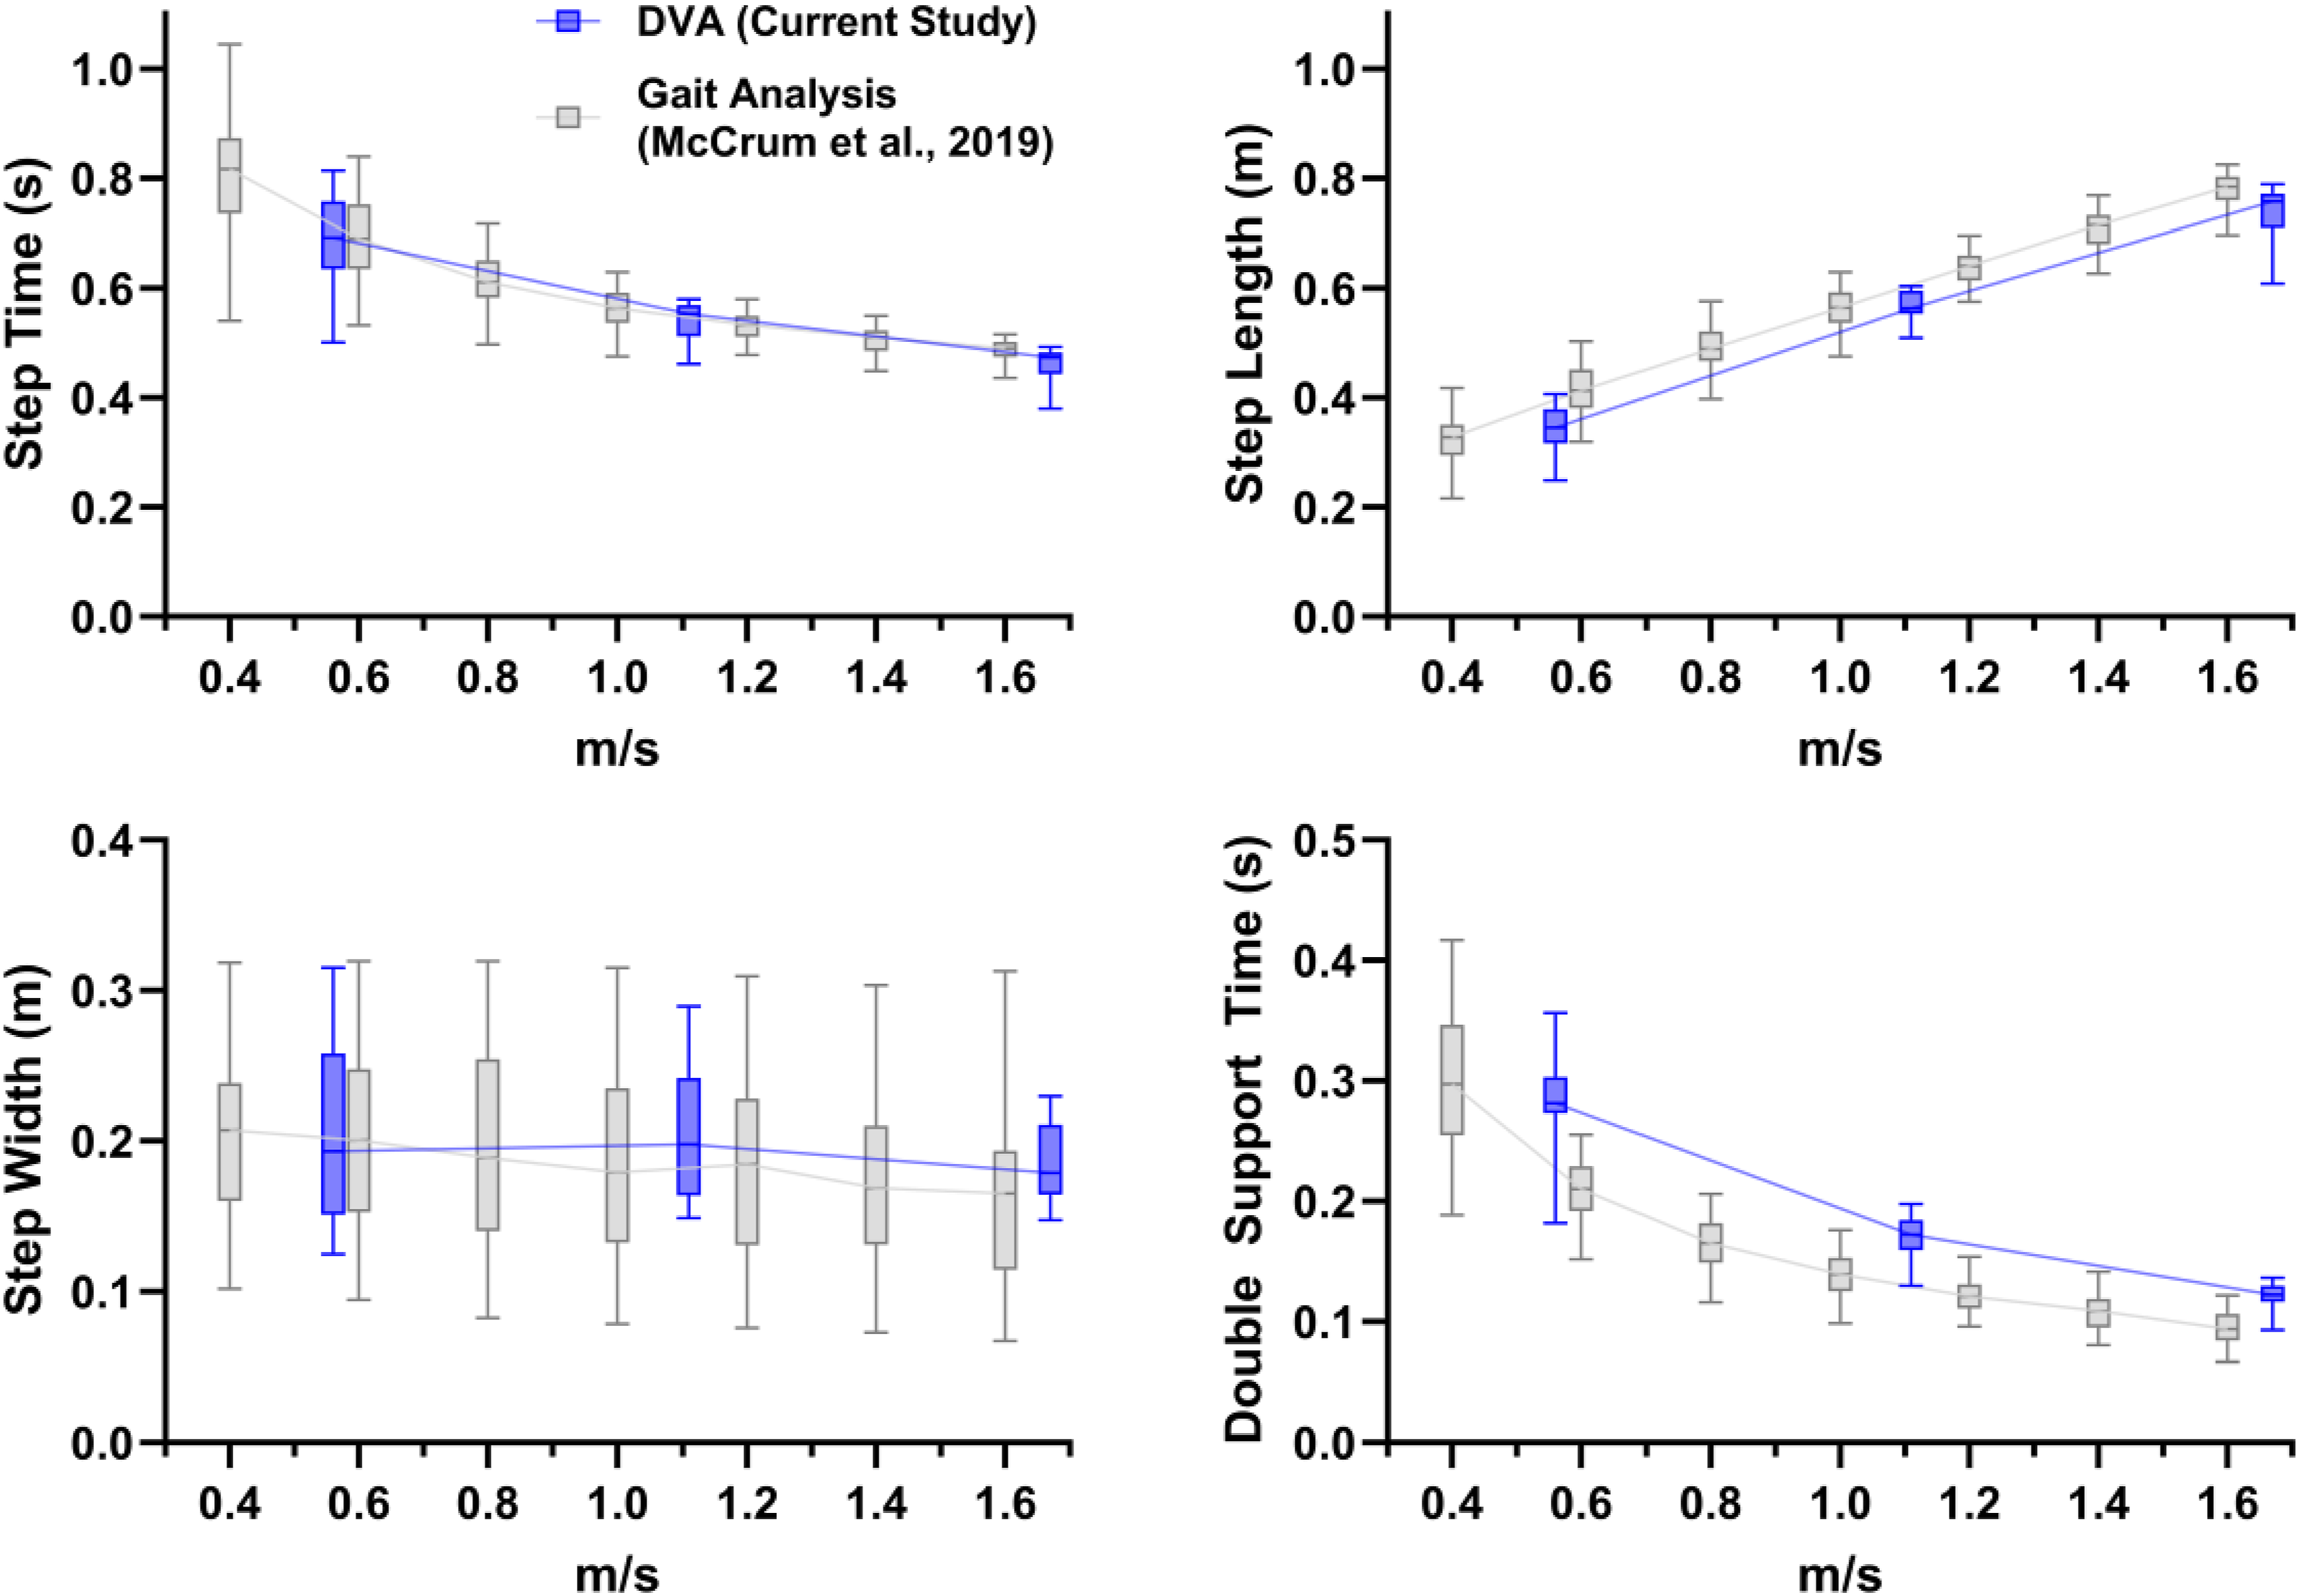
To assess the effect of walking speed on the gait parameters, mixed-effects analyses with walking speed as a repeated measures factor with Geisser-Greenhouse sphericity correction were conducted, with Bonferroni-corrected pairwise comparisons (p values of the pairwise comparisons are displayed in their corrected form). The threshold for statistical significance was set at p = .05. Analyses were conducted using GraphPad Prism version 10.1.1 for Windows (GraphPad Software, Boston, Massachusetts USA, https://www.graphpad.com). Results were also compared visually with those of our previous study
10
by overlaying the results on the same figure (see Figures 1 and 2). Note that direct statistical comparison of the current and previous study was not done since the walking speeds used differed. Boxplots (median, interquartile range and 5th to 95th percentiles) of the mean values of the spatiotemporal gait variables for the current data collected during the DVA assessment (dark blue; 2 km/h, 4 km/h and 6 km/h [0.56 m/s, 1.11 m/s and 1.67 m/s, respectively]) and for data collected during a dedicated gait analysis from our previous study (light grey
10
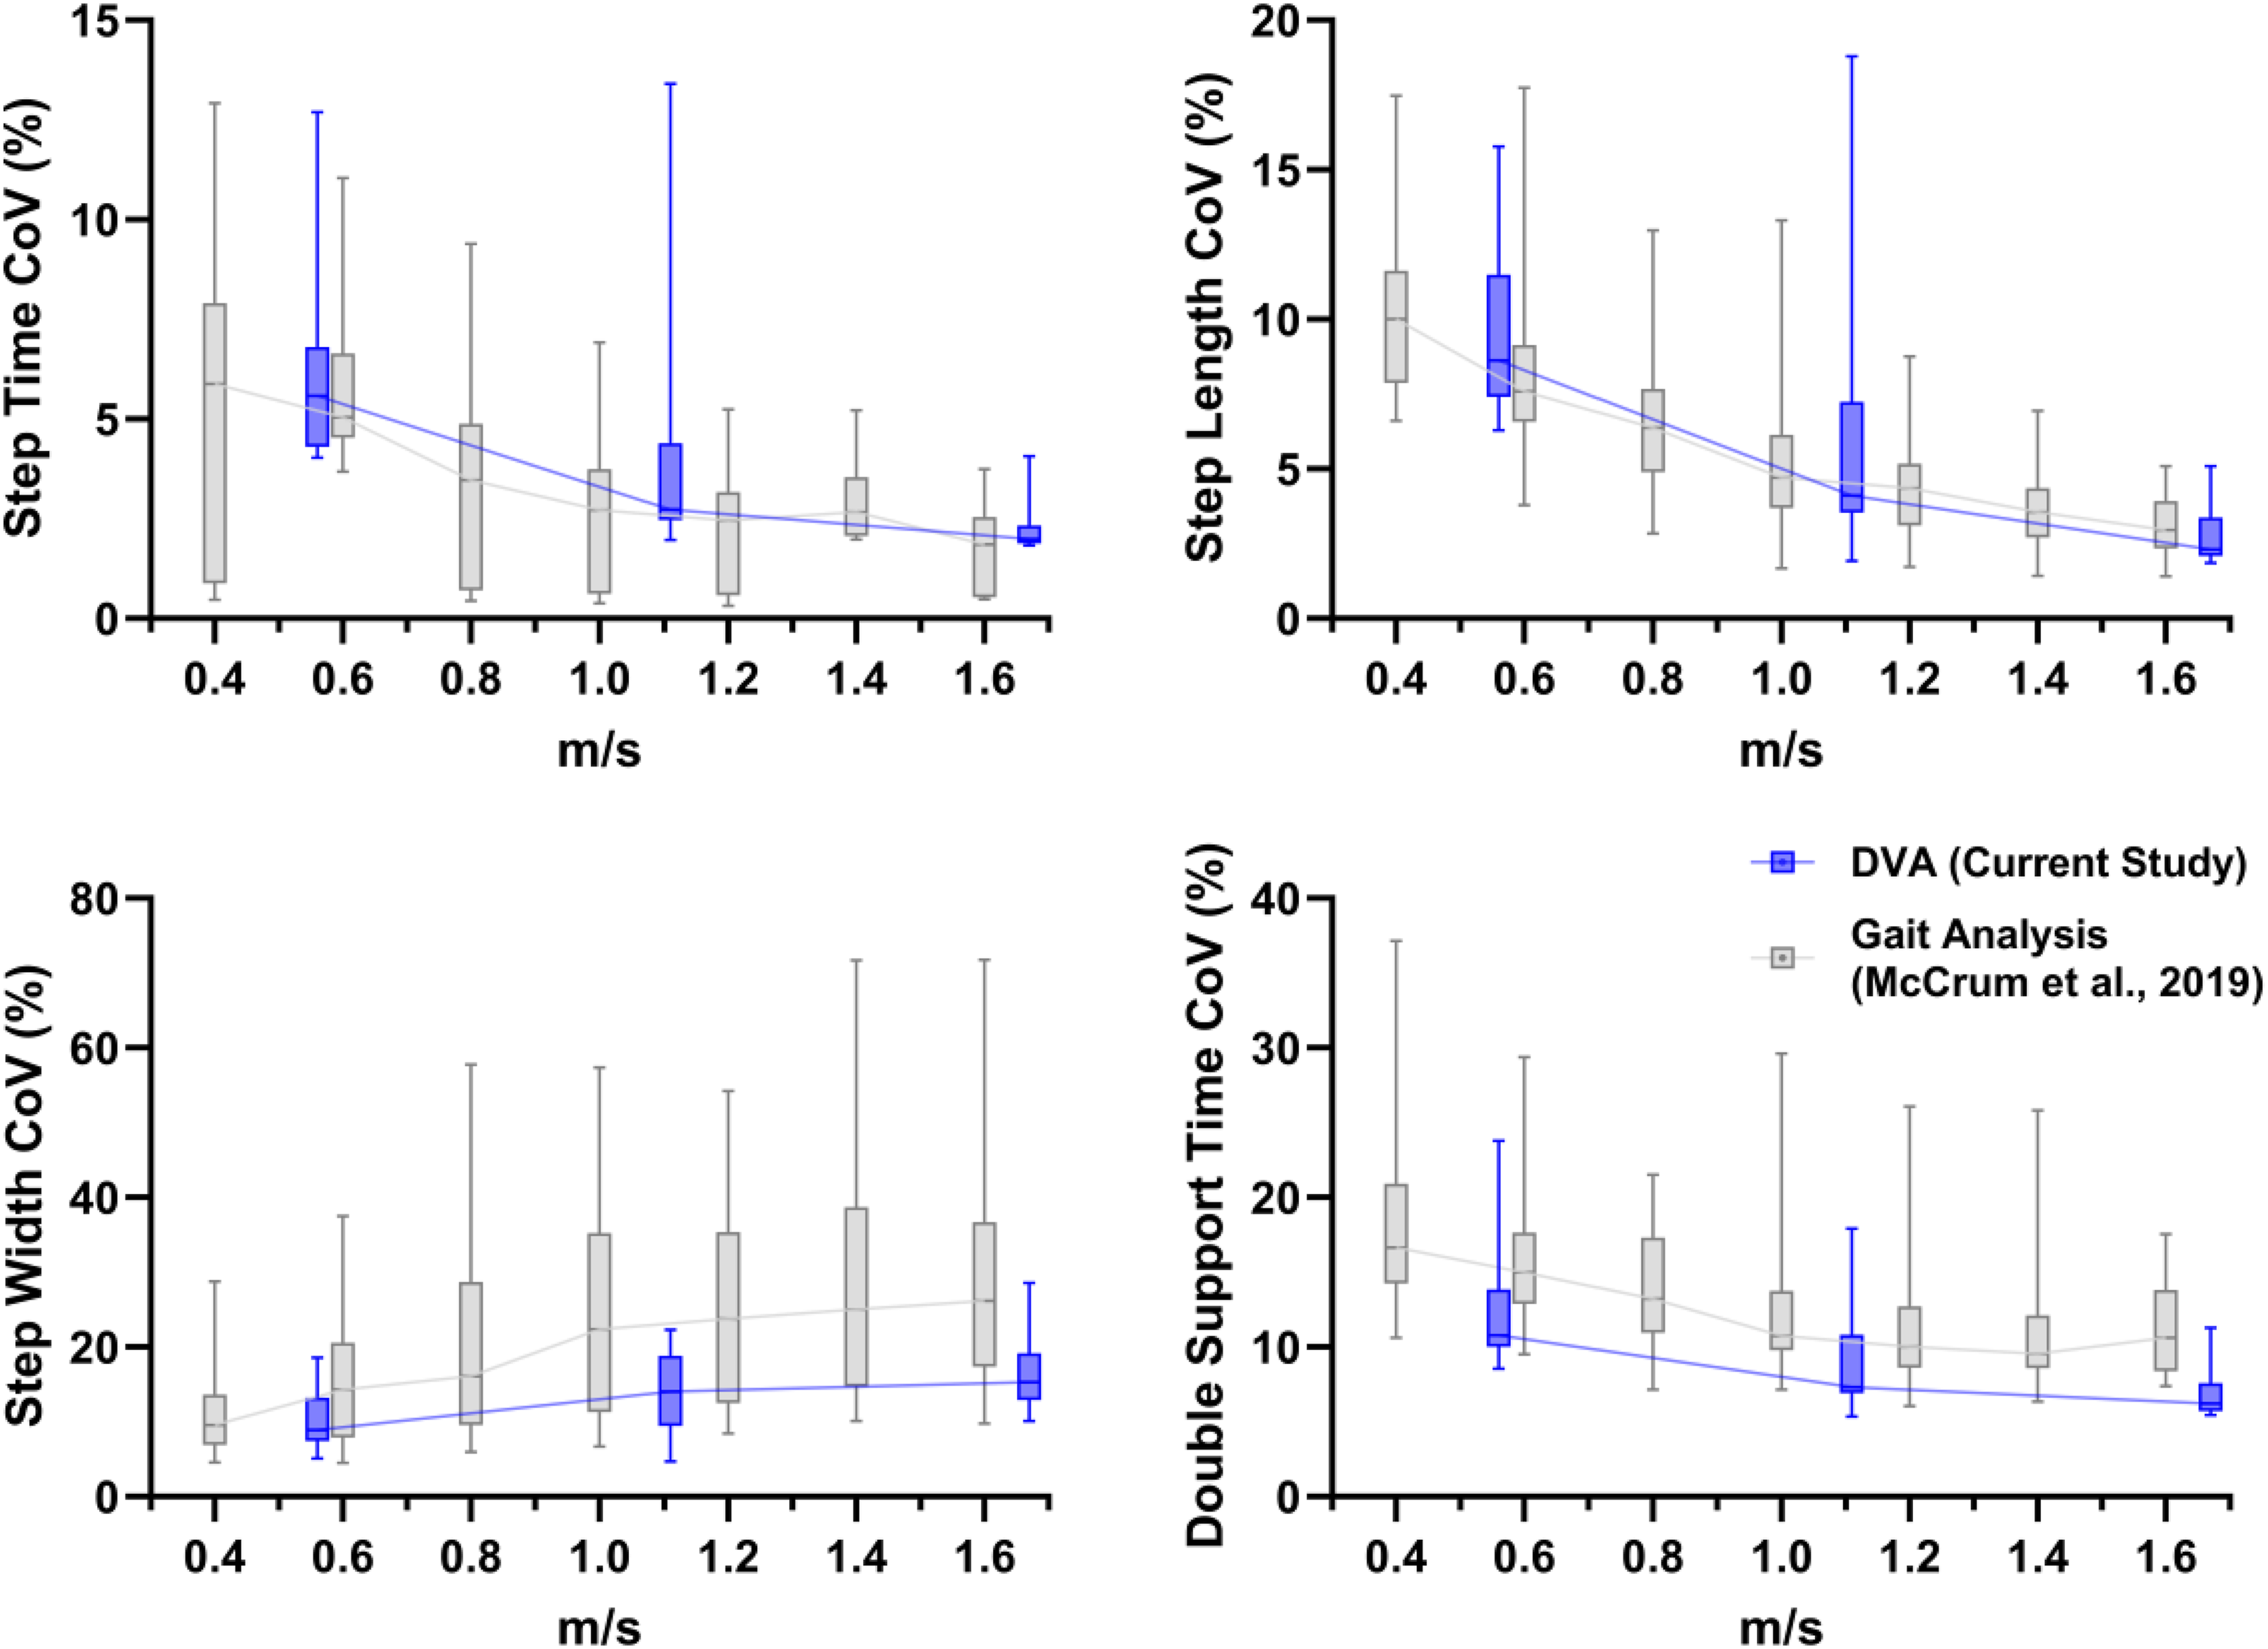
). Boxplots (median, interquartile range and 5th to 95th percentiles) of the coefficient of variation values of the spatiotemporal gait variables for the current data collected during the DVA assessment (dark blue; 2 km/h, 4 km/h and 6 km/h [0.56 m/s, 1.11 m/s and 1.67 m/s, respectively]) and for data collected during a dedicated gait analysis from our previous study (light grey
10
).
Results
Results of the mixed-effects models of walking speed on the gait parameters.
Results of the pairwise comparisons between walking speed conditions.
The results of the current analysis are presented in Figure 1 (mean values) and Figure 2 (CoV values). The current values (blue boxplots) have been overlaid on the results of our previous study, 10 shown in grey. These show very similar mean and CoV values, as well as trends with increasing walking speed.
Discussion
With this analysis, we aimed to determine (1) if we could replicate the statistically significant effects of walking speed on the spatiotemporal parameters and their variability found previously 10 and (2) if the means and variability of the parameters determined in this way were similar to those reported in a dedicated gait analysis protocol 10 in a different cohort of people with BVP. Regarding the first aim, in broad alignment with the previous study, we found significant effects of walking speed for all parameters except for step width mean values (which while statistically significant in the previous study, did not show large or clear differences across the walking speeds, as shown in Figure 1). Regarding the second aim, the outcomes appeared to be largely comparable in terms of mean and CoV values, as well as the walking speed relationships. Potential minor exceptions to this could be the double support time mean values and the step width CoV values.
Concerning the few parameters that appeared to slightly differ in Figures 1 and 2, the double support time mean values may be related to two differences in the experimental contexts. The lack of a force plate and therefore the reliance on the markers to determine foot touch down and toe-off reduce the temporal accuracy and consequently the accuracy of the double support time values. A few frames difference at 100 Hz of the motion capture system would correspond to the approximate range of differences of between about 0.03 and 0.08 seconds. Another possibility is that the DVA assessment had a similar effect on participants as is often seen in cognitive dual tasks, namely, an increase in double support time,24,25 though this is usually related to a decrease in walking speed. As our results across multiple walking speeds show, the slightly higher double support time in the current DVA-derived data was not due to walking speed differences.
While a significant effect of increasing walking speed on step width variability was found in the current analysis, Figure 2 shows that the effect may not be as strong in the current DVA-derived analysis compared to the previous analysis in McCrum et al. 10 This may be related to the difference in treadmill width. The CAREN, as used in the previous study, includes a dual belt treadmill 1 metre in belt width, whereas the DVA in the current analysis was conducted on a more typical treadmill with 60 cm belt width. While it did not seem to affect the mean step width (Figure 1), the reduced treadmill width may have constrained the possibility for participants to vary their step width during the trials.
The current study provides a conceptual replication 26 of earlier findings, indicating the potential for concurrent DVA and gait analysis in people with BVP. However, it should be kept in mind that the replication is at group level and is not synonymous with repeatability or reliability at the individual level. Before considering gait analysis during the DVA assessment in clinical settings, investigation of the test-retest reliability would be advisable. A healthy reference dataset would also allow further investigation into the diagnostic potential of this approach. The differences found between people with BVP and healthy participants in our previous study 10 were based on the dedicated gait analysis with motion capture on the CAREN system and it is possible that the healthy participants would also show slightly different results when assessed on a regular treadmill while performing a DVA assessment. Sensitivity to change as a result of interventions in BVP is also something not yet extensively investigated in either setup and would be important for clinicians when using such a combined approach. Clinical feasibility of combined DVA and gait assessment would be further increased by using more clinically feasible and affordable methods (e.g., wearable sensors or markerless motion capture systems) to assess gait parameters rather than camera-based 3D motion capture systems. While these are gradually being used more to assess physical activity in BVP,9,27 their accuracy and reliability for assessing gait parameters compared to 3D motion capture has not been assessed in people with BVP. In other populations, this has been extensively researched28–30 and two important considerations have emerged: achieving accurate detection of gait events (i.e., heel strike and toe-off) is critical but challenging31,32; and while assessment of temporal parameters (e.g., step time) can be accurate,28,33 assessment of spatial parameters (i.e., step length) is challenging. 33 Whatever system is used in the future, optimal setup and data quality checks should be put in place.
Statements and declarations
Footnotes
CRediT contributions
A.H.: Conceptualization, data curation, project administration, supervision and writing—review and editing.
C.M.: Conceptualization, data curation, formal analysis, funding acquisition, investigation, project administration, supervision, visualization, writing—original draft and writing—review and editing.
I.V.: Investigation, validation and writing—review and editing.
K.M.: Resources, supervision and writing—review and editing.
M.K.: Investigation, validation and writing—review and editing.
M.Z.: Data curation, formal analysis, investigation and writing—review and editing.
N.H.: Conceptualization, data curation, investigation, project administration and writing—review and editing.
P.W.: Methodology, resources, software and writing—review and editing.
R.v.d.B.: Supervision and writing—review and editing.
Declaration of conflicting interests
The author(s) declared no potential conflicts of interest with respect to the research, authorship, and/or publication of this article.
Funding
The author(s) disclosed receipt of the following financial support for the research, authorship, and/or publication of this article: C. McCrum was supported by a Young European Research Universities (YERUN) Research Mobility Award.