
Abstract
In later older adulthood, individuals report increased depressive symptoms, whereas gender differences in depressive symptoms narrow. We evaluated whether terminal decline (i.e., accelerated worsening in proximity to death) explained these patterns. We examined the longitudinal trajectories of depressive symptoms in 2,411 participants (baseline age: 29–95 years) from the Interplay of Genes and Environments Across Multiple Studies consortium representing three countries (Sweden, Denmark, and Australia). Joint modeling revealed that individuals reporting larger annual increases in depressive symptoms after age 70 were at increased risk of death. Piecewise linear multilevel models with random changepoints revealed accelerated increases in depressive symptoms approximately 4 years before death. Co-twin control analyses with 98 twin pairs found that the deceased twin had significantly larger accelerations in depressive symptoms compared with the surviving twin. Men experienced more severe mortality-related increases compared with women. Terminal decline partially explains the increase in depressive symptoms in later older adulthood.
Well-established changes to depressive symptoms occur over the life course, with decreases in mean depressive symptoms occurring from middle age into older adulthood and an uptick in symptoms beginning after the age of 70 (Best et al., 2021; Sinkewicz et al., 2022; Sutin et al., 2013). Explanations for the rise in depressive symptoms after age 70 have included normative age-related social processes (e.g., shifting social roles) and disease-related processes (e.g., functional impairments, cerebrovascular disease; Fiske et al., 2009). The question we pose is whether the rise in depressive symptoms reflects a phenomenon called “terminal decline” (Gerstorf & Ram, 2013) in which accelerated worsening occurs in proximity to death. Terminal decline has been observed in many domains, including cognitive ability (Karr et al., 2018), positive and negative affect (Vogel et al., 2013), and well-being (Gerstorf et al., 2010). Although depression has been studied less compared with these other health domains, there is also evidence pointing to modest increases in depressive symptoms in the years preceding death (Sutin et al., 2013). Understanding whether increases in depressive symptoms are related to future mortality and when the putative acceleration of change occurs can be useful to clinicians treating depression.
Differences in depressive symptoms are characteristically found between genders. At most ages, women tend to report more depressive symptoms than men (Salk et al., 2017). However, there is some evidence that increases in depressive symptoms after age 70 are greater in men compared with in women, resulting in a narrowing of gender differences in the oldest old (Forlani et al., 2014). Previous work has also suggested that the environmental contributions to depressive symptoms at later ages may be greater in men compared with in women, suggesting that men may be more vulnerable to mortality-related increases in depressive symptoms (Petkus et al., 2017). It is unknown whether there are differences between women and men in terminal increases in depressive symptoms and whether such increases explain the narrowing of gender differences in depressive symptoms in older adulthood.
Here, we conducted a longitudinal study with existing data from the Interplay of Genes and Environments Across Multiple Studies (IGEMS; N. L. Pedersen et al., 2013, 2019) consortium in which we utilized different variations of longitudinal models to examine our primary research question of whether increases in depressive symptoms in mid-to-late older adulthood represent a terminal drop in mood. We first utilized joint modeling of longitudinal depressive-symptom data across chronological age and time-to-event mortality data to test whether trajectories of depressive symptoms across later life were predictive of mortality. We then utilized a novel random changepoint model to examine when mortality-related increases in depressive symptoms might occur relative to death. Our primary hypothesis was that we would observe increases in depressive symptoms beginning in middle older age and that individuals experiencing larger increases in depressive symptoms would be at higher risk of death, indicating terminal increases in depressive symptoms. We also leveraged the genetically informed design of our sample to examine whether terminal increases in depressive symptoms are confounded by genetic or familial environmental factors by comparing trajectories of depressive symptoms in the years preceding the death of one twin compared with their co-twin who died later. This co-twin control design strengthens causal inferences by adjusting for unmeasured familial and additive genetic influences on depressive symptoms (McGue et al., 2010). We hypothesized that the magnitude of increases in depressive symptoms in the years leading up to death would be larger for the deceased twins compared with the co-twins who died later. Our secondary hypothesis was that the magnitude of terminal increases in depressive symptoms would be greater in men compared with in women and thus result in the narrowing of gender differences in depressive symptoms that occur in the oldest old.
Research Transparency Statement
General disclosures
Study disclosures
All analysis scripts are publicly available (https://osf.io/zrwyd).
The STAR team has not independently confirmed the computational reproducibility of the results because they do not have access to the data.
Method
Participants
Participants included 2,411 community-dwelling individuals from five studies participating in the IGEMS consortium and representing three countries (Sweden, Denmark, and Australia). To be included in these analyses, participants needed at least three longitudinal assessments of depressive symptoms. Furthermore, for those participants who were deceased, there needed to be at least one observation within 3 years of death. The sample was comprised of 1,491 deceased participants and 920 who were alive at the end of the study participation. For the co-twin control analyses, we identified 98 complete twin pairs (N = 196 individuals) who were discordant on mortality status and in which one twin survived at least 4 years longer than their co-twin. We chose the 4-year limit on the basis of previous research suggesting a terminal decline in happiness that occurs approximately 4 years before death (Gerstorf et al., 2010). For a flowchart of study participation, see Figure 1. A brief description of each IGEMS consortium study is provided below, and comparisons of participant descriptive statistics by study are presented in Table S1 in the Supplemental Material available online. All procedures were reviewed and approved by the institutional review board at each respective institution.
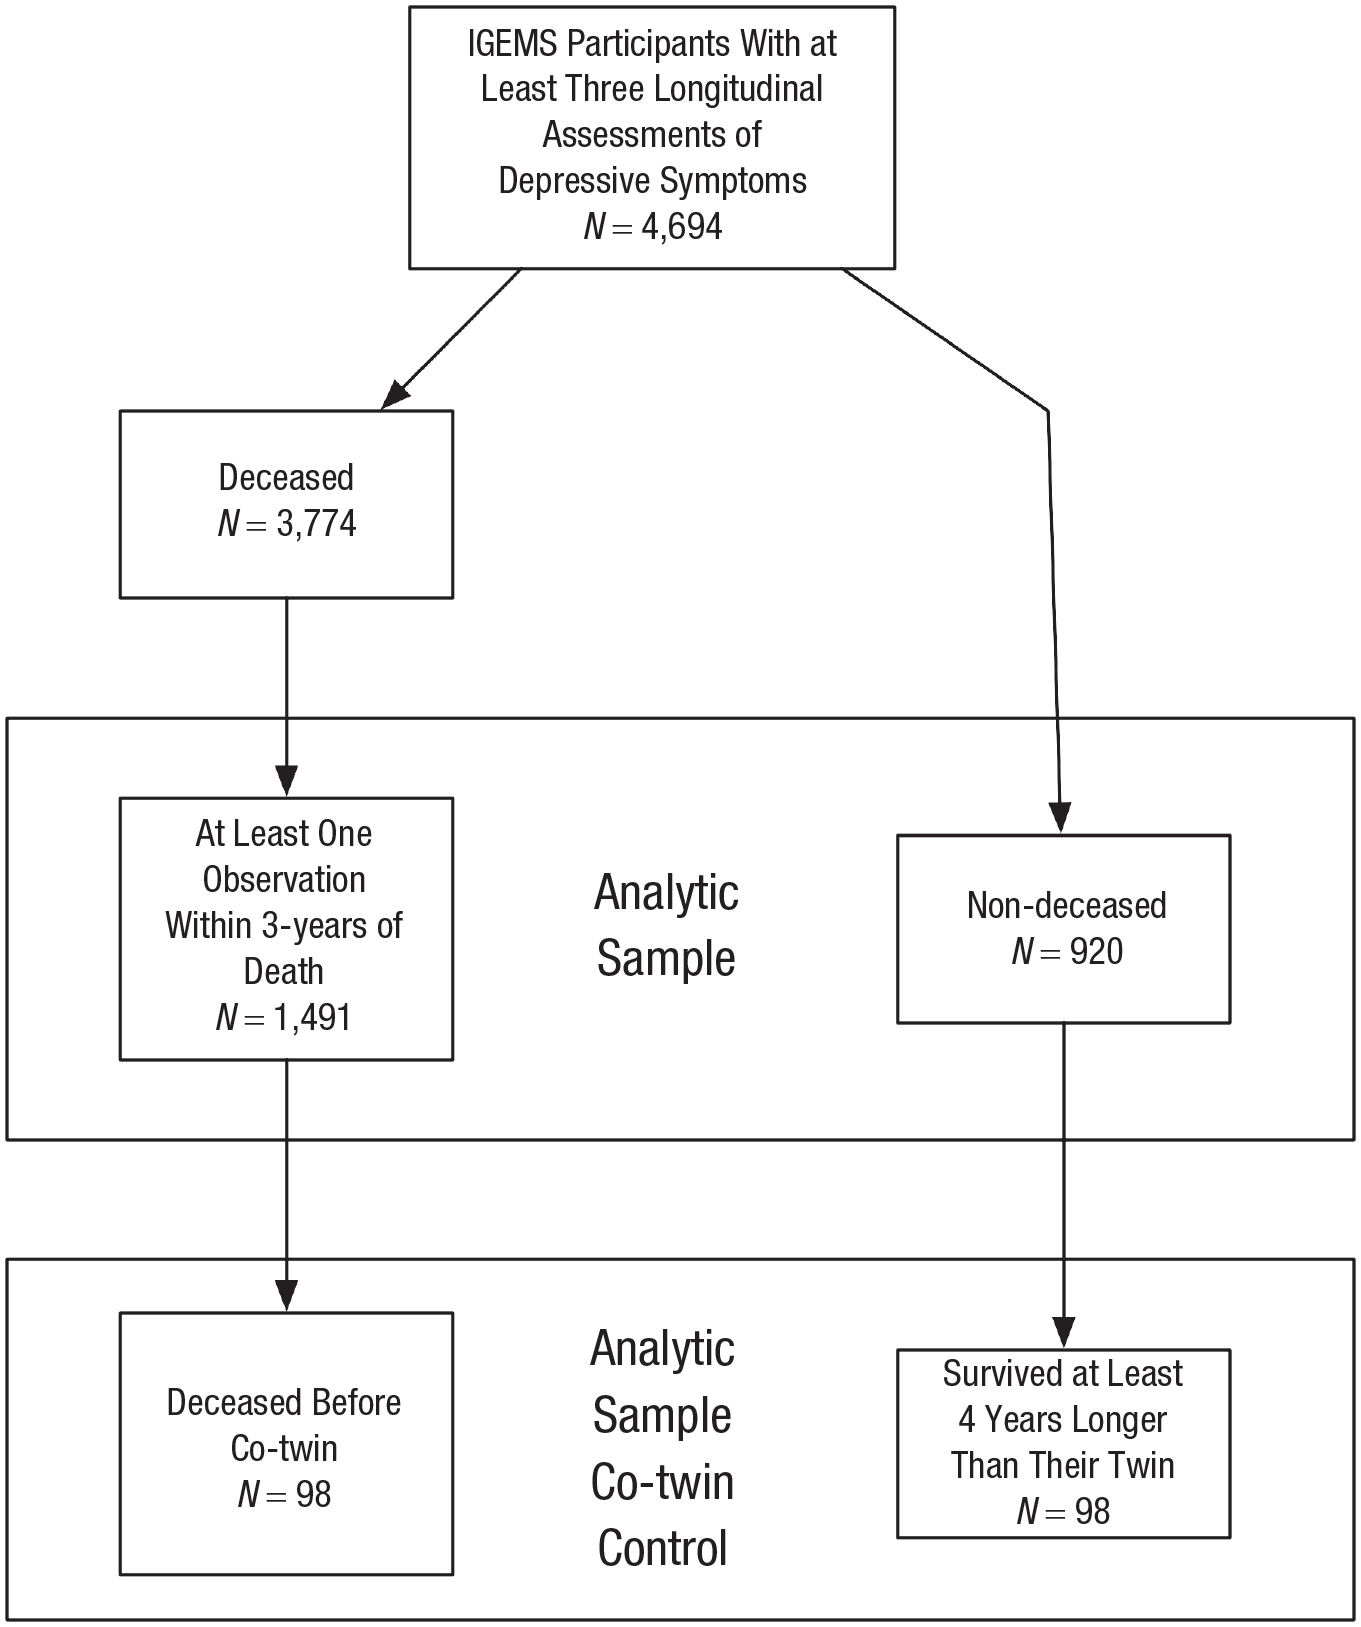
Flowchart of study participation. IGEMS = Interplay of Genes and Environments Across Multiple Studies.
The three Swedish studies were drawn from the Swedish Twin Register (STR; Lichtenstein et al., 2006), a population-based register of twins born in Sweden since 1886. The Swedish Adoption/Twin Study of Aging (SATSA; N. L. Pedersen et al., 1991) is a longitudinal study that began in 1984. Participants in the SATSA completed as many as 17 follow-up assessments in approximately 3-year intervals. The Origins of Variance in the Oldest-Old: Octogenarian Twins (OCTO-Twin; McClearn et al., 1997) study began in 1991 and included same-sex twin pairs from the STR over the age of 80 at the study baseline. Participants completed as many as five assessments in 3-year intervals. The Longitudinal Study of Gender Differences in Health Behavior and Health Among Elderly (Gold et al., 2002) is a longitudinal study of opposite-sex twin pairs born between 1916 and 1925. Participants completed a baseline assessment in 1995 and as many as five additional assessments until 2005. The Danish participants were from the Longitudinal Study of Aging Danish Twins (LSADT; Christensen et al., 1999). Twins from the LSADT were ascertained from the Danish Twin Registry (D. A. Pedersen et al., 2019) and included same-sex twin pairs aged 70 years or older. The LSADT was initiated in 1995 with the enrollment of additional twins in 1997, 1999, and 2001 and follow-ups every 3 years with as many as six assessments in total. Australian participants were from the Older Australian Twins Study (OATS; Sachdev et al., 2009). The OATS began in 2006 and included twins aged 65 and older from the Australian Twin Registry who were newly recruited for the OATS. Participants in the OATS completed three assessments of depressive symptoms.
Measures
Depressive symptoms
Three measures of depressive symptoms were used in these studies. Twins in the Swedish studies were administered the Center for Epidemiologic Studies–Depression (CES-D) scale (Radloff, 1977). The CES-D score is a sum of 20 items, each answered from 0 to 3 to indicate the frequency of experiencing a symptom during the past week. Twins in the Danish studies were administered a modified version of the Cambridge Mental Disorders of the Elderly Examination (CAMDEX; Roth et al., 1986). The CAMDEX consists of 16 items assessing the frequency of depressive symptoms and has acceptable reliability and validity. Australian twins were administered the 15-item Geriatric Depression Scale (GDS-15; Yesavage et al., 1982).
Depressive-symptom harmonization
To create a common depressive-symptom metric, the CESD, CAMDEX, and GDS-15 were administered with a separate data-harmonization sample. Item response theory methods, described by Gatz et al. (2015), were applied to compare items from the scales and create a conversion table between the scales. The co-calibrated score was expressed in CAMDEX units (range = 16–46). For these analyses, the harmonized depressive-symptom scores were standardized on a T-score metric based on the entire data in the IGEMS longitudinal sample as reference (M = 22.4, SD = 4.84).
All-cause mortality
All-cause death was used as an outcome. For the Swedish studies, death and date of death were determined by record linkage to the National Population Register through 2017. For the LSADT, all-cause death was determined by linkage to the Danish Civil Registration System (C. B. Pedersen et al., 2006), which registers the date of death or emigration of all Danish persons with linkage through January 1, 2023. For the OATS, all-cause death was ascertained by linkage to the Centre for Health Record Linkage through 2015.
Age and gender
Information on birth year and gender for twins from the LSADT were originally retrieved from church records and later verified in the Danish Civil Registration System (C. B. Pedersen et al., 2006; D. A. Pedersen et al., 2019). For the SATSA and OCTO-Twin, birth year and gender were obtained from parish birth records (for twins born before 1925) and birth records at Statistics Sweden (for twins born after 1926). These data were requested and are maintained by the Swedish Twin Registry database (Lichtenstein et al., 2002). Birthday and gender were ascertained in the OATS via self-report.
Statistical analysis
A detailed examination of the distribution of data and the correlation structure of all variables was completed. We jointly modeled the longitudinal depressive data and time-to-event mortality data following the steps described in published tutorials (Cekic et al., 2021). Here we provide a basic overview of the approach we utilized (for a more detailed description of the analyses, see the Methods section in the Supplemental Material). The joint model addresses the first research question by estimating the association between each study participant’s trajectory of depressive symptoms and the risk of dying. The joint model consists of two submodels: a longitudinal multilevel regression estimating the average population trajectories of depressive symptoms over chronological age (fixed effects) and individual-specific deviations from the population average trajectory (random effects), and a Cox-proportional hazard regression with time to death (or right censoring) as an outcome. We first sought to identify the functional form of depressive symptoms that best fit the longitudinal data across chronological age by comparing the model fit of nine multilevel regression models. These multilevel models included progressively more complex specifications of the fixed effect (for the specifications of the nine models that were constructed, see Table S2). All multilevel models were adjusted for the level of depressive symptoms (0 = no, 1 = yes) by the participant’s country of origin (Denmark or Australia), with Sweden as the reference country. After identifying the best fitting functional form of the fixed effects, we specified another model that aligned the fixed and random effects. The aligned model estimates an analogous random effect for every fixed age effect.
The second submodel in the joint model was a nonparametric baseline Cox-proportional hazard regression. The event in this model was whether the individual was deceased (0 = nondeceased, 1 = deceased), and time was the age of death (for deceased) or last assessment (for nondeceased). The age at first assessment was included in the model as the starting age because participants were enrolled in each study at different ages. The country of origin was also included in each model as a covariate.
The joint model was constructed after identifying the optimal growth parameters in the longitudinal multilevel regression and fitting the time-to-event Cox-proportional hazard regression. The joint model utilizes parameters that are shared between the longitudinal and time-to-event models. These shared parameters quantify the associations between the estimated longitudinal depressive-symptom trajectories and the risk of death. We first ran a “current value” joint model. This model estimates the association between the level of depressive symptoms at a specific time point and subsequent mortality risk. The second joint model we constructed was the “current value plus slope” model. The final joint model we estimated included the “shared random effects” model. In this model, the random-effect estimates from the longitudinal multilevel model are utilized as linear predictors of the risk of death in the Cox-proportional hazard regression time-to-event submodel. The deviance information criterion was used to compare the overall fit of each joint model. All joint models were run with the R package JMbayes (Rizopoulos, 2016).
After determining the joint model’s best fitting association structure, we examined whether mortality-related factors drove the putative observed associations. To test this, we excluded observations occurring within 3 years of death and reconstructed the best fitting longitudinal mixed-effects model of depressive symptoms and the joint model.
Next, to examine the trajectories of depressive symptoms in the years leading up to death and identify when mortality-related increases in symptoms might occur relative to the time of death, we constructed a piecewise linear multilevel model with a random changepoint (Capuano & Wagner, 2023). In this model, we utilized a backward time scale with time representing the number of years until death (range = −30.2 to < 0) or the last assessment at each depressive-symptom measurement (range = −27.63 to 0). We centered the backward time scale on 1 year before death (for deceased participants) or the last depressive-symptom assessment (for nondeceased participants). This multilevel model included the following fixed and random effects of the four growth parameters: the final level of depressive symptoms at death or last assessment, linear change in depressive symptoms leading up to the time of death/last assessment, a changepoint that signifies the timepoint at which the significant change in the slope occurs, and the linear change before this changepoint. The fixed effects in the model represent the average of each growth parameter, whereas random effects capture interindividual variability and interindividual deviations from the average. All four growth parameters were regressed on mortality status (0 = nondeceased, 1 = deceased) and gender (0 = male, 1 = female) to estimate the effect of mortality status and gender on the pre-changepoint slope, post-changepoint slope, the location of the changepoint, and level of depressive symptoms at time zero. All models included country of origin as a covariate to adjust for country-level confounders.
Co-twin control methods were undertaken to examine whether genetic and shared familial factors confounded these associations. Discordant twin pairs are matched by design for age, the additive effects of genotype, and shared early life and environmental influences. Monozygotic (MZ) twin pairs are fully controlled for genotype because MZ twins are genetically identical. Dizygotic (DZ) twins share, on average, half of their genomes. Thus, additive genetic effects are only partially matched in DZ twins. Furthermore, same-sex twin pairs are also matched by gender. Therefore, the co-twin control method allows inferences about whether depressive symptoms increase in advance of death, regardless of these familial influences. In the co-twin control analyses, we constructed another piecewise linear multilevel model with a random changepoint. This model estimated the four growth parameters within the sample of 98 complete twin pairs discordant for death in which the co-twin survived at least 4 years longer than the deceased twin. In this model, we utilized a backward time scale, where time represents the number of years until the death of the deceased twin. Any assessments completed by the nondeceased twin that occurred after the death of the deceased twin were excluded from these analyses. We regressed each of the growth parameters on mortality status to compare trajectories of depressive symptoms in these discordant twin pairs.
To test the secondary hypothesis, we examined whether the magnitude of mortality-related changes in depressive symptoms and the location of the changepoint were different for men and women. We constructed another piecewise linear multilevel model with a random changepoint with the same growth parameters and covariates as described in the previous model. In this model, we included a gender-by-mortality interaction term to examine differences between men and women in mortality-related increases in depressive symptoms. We followed this up by constructing a piecewise linear multilevel model with random changepoints stratified by mortality status to examine this interaction further. In this stratified model, we compared the effect of gender on the four growth parameters to assess whether the magnitude of mortality-related increases in depressive symptoms differed for men and women. All linear multilevel models with random changepoints were run with the nlive package (Capuano & Wagner, 2023) in R.
Several sensitivity analyses were conducted to test the robustness of our findings. First, there were significant age differences between deceased participants and those who were alive at the end of the study period. To test whether these age and gender differences were driving our results we ran a series of sensitivity analyses excluding any participant who was younger than age 65 at the initial depressive-symptom assessment and excluding participants who died after the age of 85. We then repeated the piecewise linear multilevel models with random changepoints with this subsample to examine the robustness of our findings. Next, it was impossible to account for the nonindependence of the data by nesting individuals within twin pairs in the joint models and in the piecewise linear multilevel models with random changepoints. Failing to account for the violation of this assumption would likely result in biased standard error estimates. To test the potential impact of violating this assumption, we ran a sensitivity analysis in which the piecewise linear multilevel models with random changepoints were run with a randomly selected individual within each twin pair. Third, although we included country of origin as a covariate in all models, there may be further study-level confounding factors that were unaccounted for. Therefore, we ran a set of sensitivity analyses in which we adjusted for the study of origin instead of the country of origin by including the study as a covariate in all models. Last, we ran a supplemental analysis within the co-twin control analyses to examine the impact of omitting observations with the nondeceased co-twin that took place after the death of their twin. The purpose of this sensitivity analysis was to see whether there was an uptick in symptoms in the nondeceased co-twin immediately after the death of their twin.
Results
Participant characteristics
Participants were on average just under 70 years old at the initial assessment of depressive symptoms (M = 68.98 years, SD = 13.51, range = 29.10–95.00) and completed approximately five assessments (M = 5.22, SD = 3.27) over approximately 11 years of follow-up (M = 10.90 years, SD = 8.22). Table 1 provides sample descriptive statistics and comparisons between participants based on mortality status. Compared with participants who were alive at the end of the study period, deceased participants were older at both the initial and last assessment of depressive symptoms, were more likely to be male, had approximately 6 years shorter follow-up, and completed approximately one less assessment of depressive symptoms.
Sample Descriptive Statistics and Comparisons Between Participants Based on Mortality Status
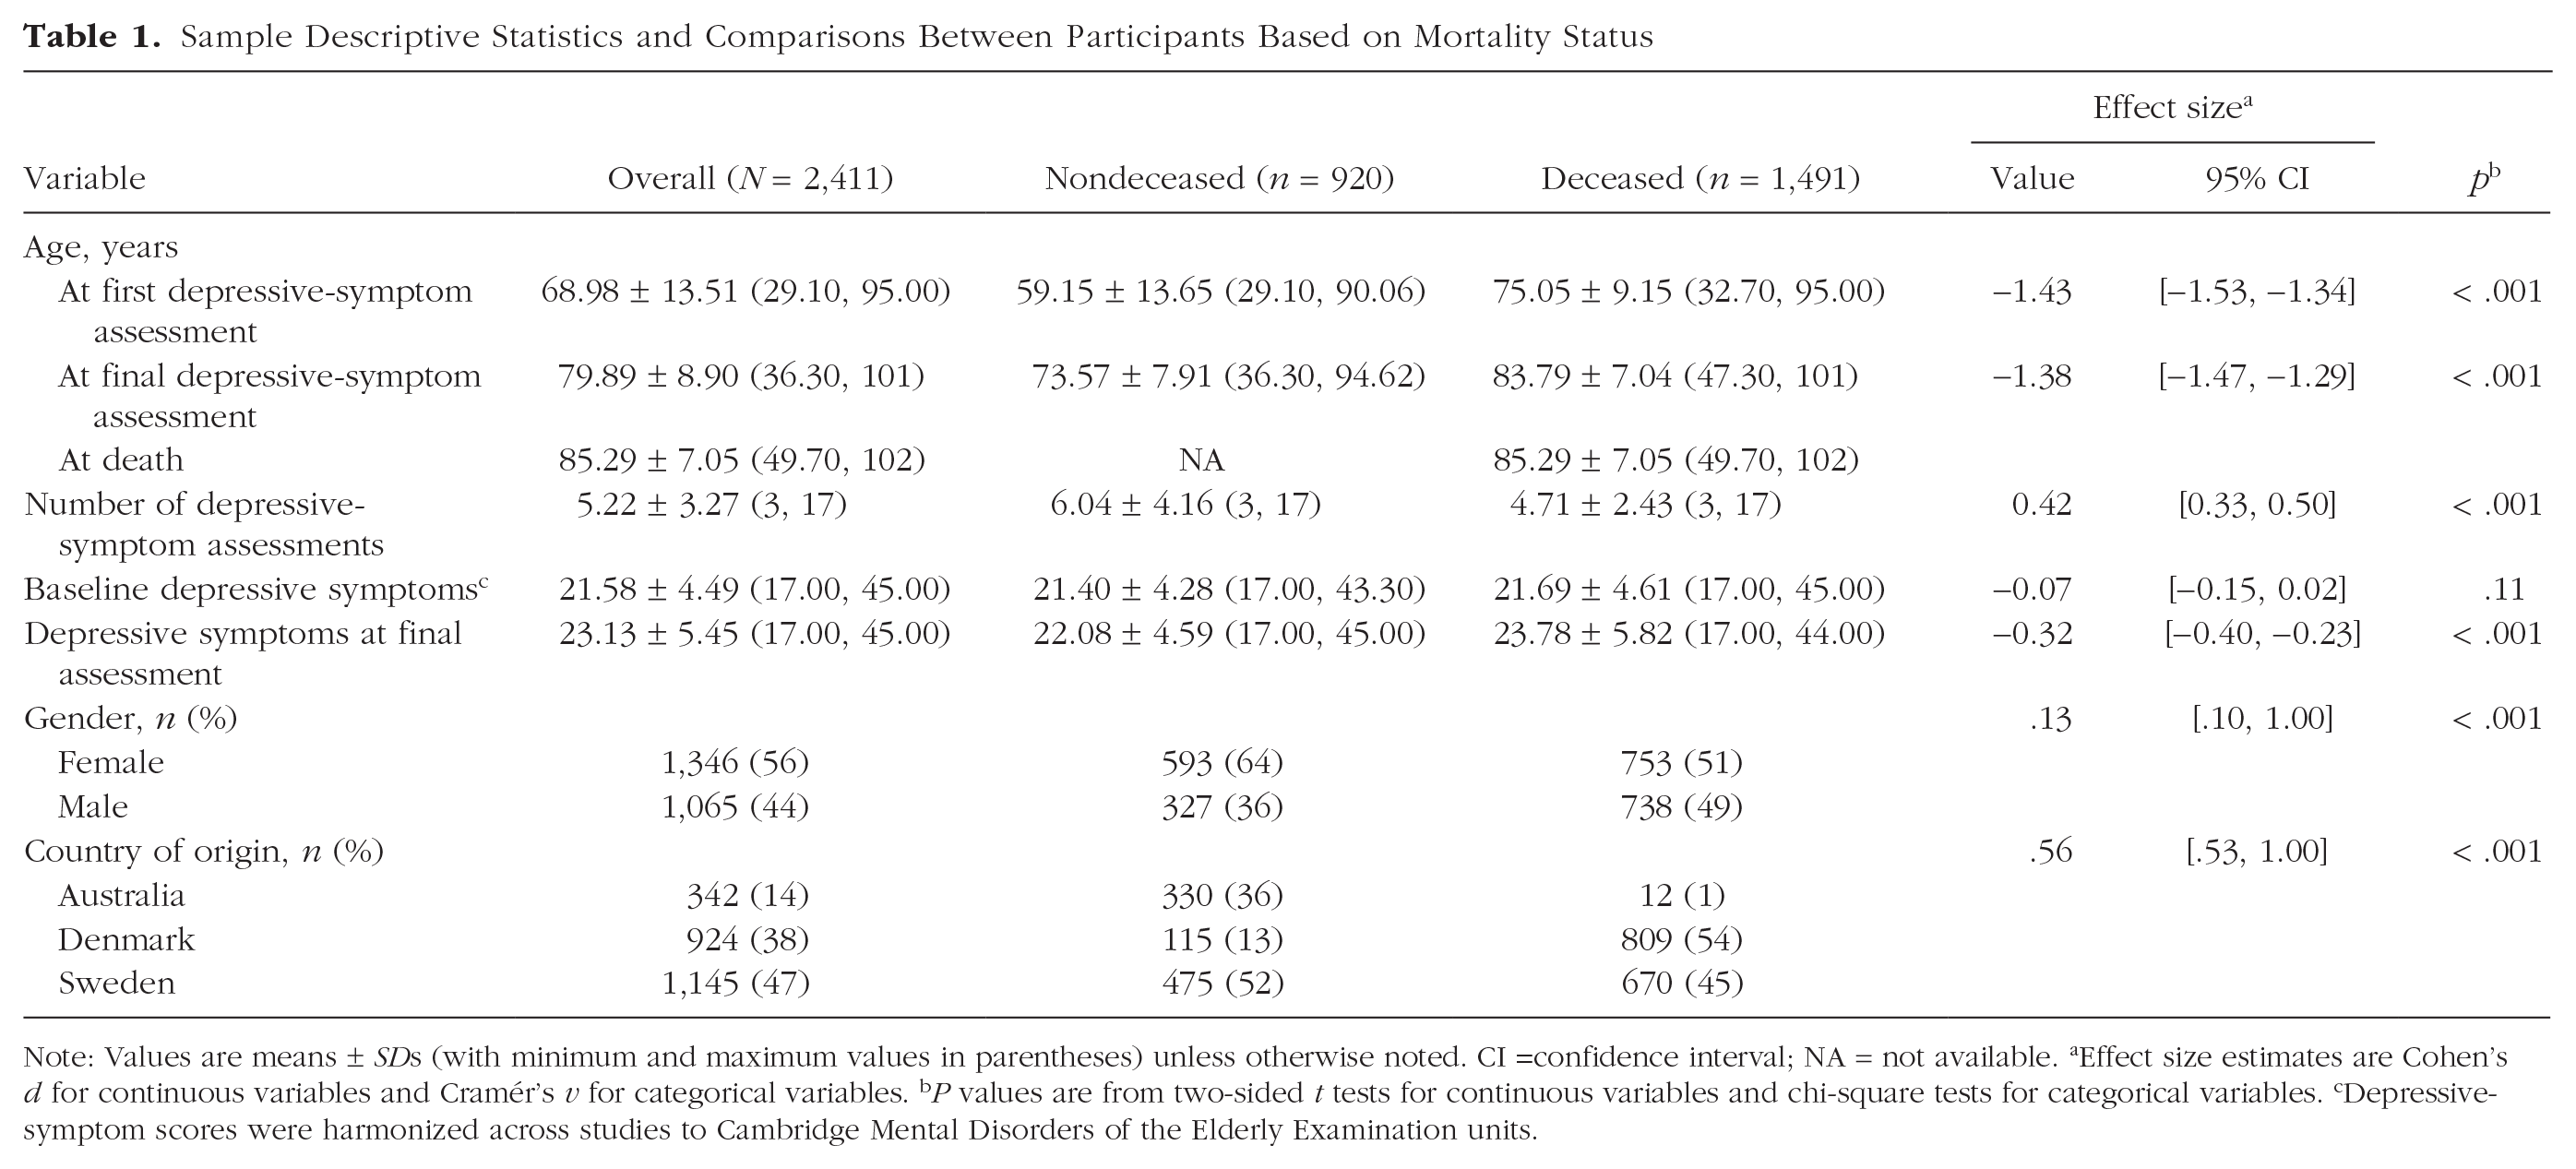
Note: Values are means ± SDs (with minimum and maximum values in parentheses) unless otherwise noted. CI =confidence interval; NA = not available. aEffect size estimates are Cohen’s d for continuous variables and Cramér’s v for categorical variables. bP values are from two-sided t tests for continuous variables and chi-square tests for categorical variables. cDepressive-symptom scores were harmonized across studies to Cambridge Mental Disorders of the Elderly Examination units.
Joint modeling of depressive-symptom trajectories and risk of death
The best fitting multilevel regression submodel (for model comparisons, see Table S3) was a piecewise linear spline model centered at age 70. This model estimated linear changes occurring before age 70 (pre-age-70 slope), and a second slope parameter estimated linear changes occurring after age 70 (post-age-70 slope). The best fitting model included aligned fixed and random effects. The best fitting joint model was the shared random-effects model (see Supplemental Table S4). Parameter estimates from the shared random-effects joint model are provided in Table 2. As expected, on average, individuals exhibited significantly larger annual increases in depressive symptoms after the age of 70 compared with before the age of 70. The mean trajectory of depressive symptoms (with 99% confidence intervals, or CIs) is presented in Figure 2a. Figure 2b illustrates the significant interindividual variability in the level of depressive symptoms and annual change before and after age 70. The gray lines depict every individual’s estimated trajectory of depressive symptoms, whereas the black lines illustrate the trajectories of 75 randomly selected deceased and nondeceased individuals.
Estimates of the Shared Random-Effects Joint Model to Examine Trajectories of Depressive Symptoms (T-Score Standardized) Over Age for All Observations and Excluding the 1,651 Observations That Occurred Within 3 Years of Death (N = 2,411)
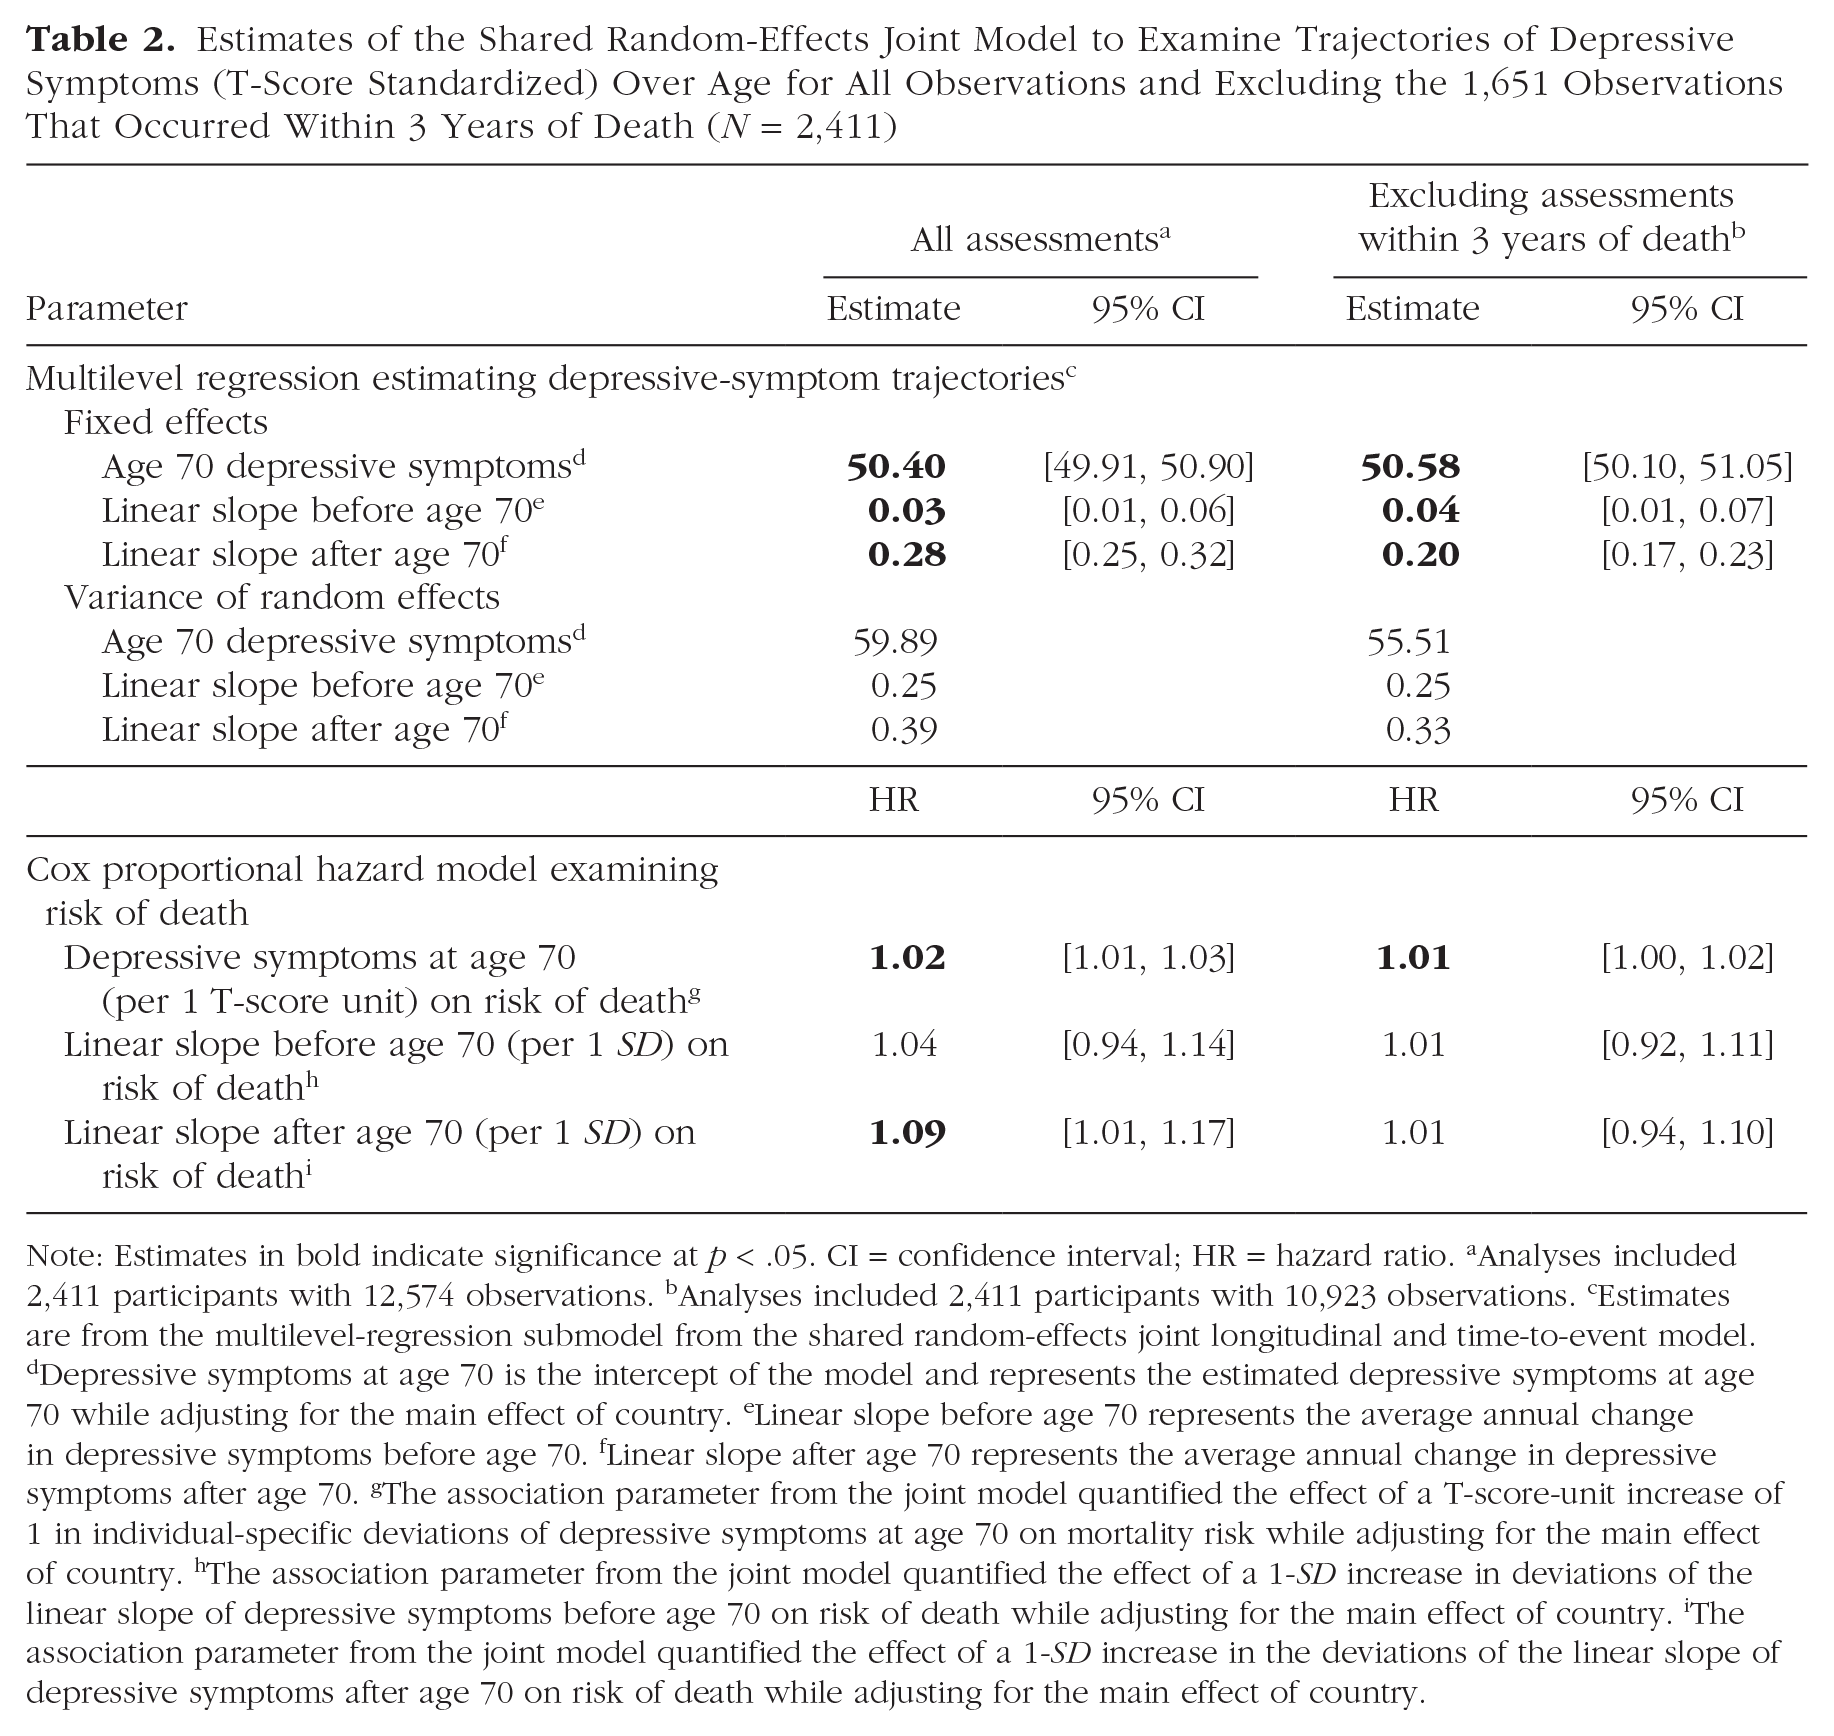
Note: Estimates in bold indicate significance at p < .05. CI = confidence interval; HR = hazard ratio. aAnalyses included 2,411 participants with 12,574 observations. bAnalyses included 2,411 participants with 10,923 observations. cEstimates are from the multilevel-regression submodel from the shared random-effects joint longitudinal and time-to-event model. dDepressive symptoms at age 70 is the intercept of the model and represents the estimated depressive symptoms at age 70 while adjusting for the main effect of country. eLinear slope before age 70 represents the average annual change in depressive symptoms before age 70. fLinear slope after age 70 represents the average annual change in depressive symptoms after age 70. gThe association parameter from the joint model quantified the effect of a T-score-unit increase of 1 in individual-specific deviations of depressive symptoms at age 70 on mortality risk while adjusting for the main effect of country. hThe association parameter from the joint model quantified the effect of a 1-SD increase in deviations of the linear slope of depressive symptoms before age 70 on risk of death while adjusting for the main effect of country. iThe association parameter from the joint model quantified the effect of a 1-SD increase in the deviations of the linear slope of depressive symptoms after age 70 on risk of death while adjusting for the main effect of country.
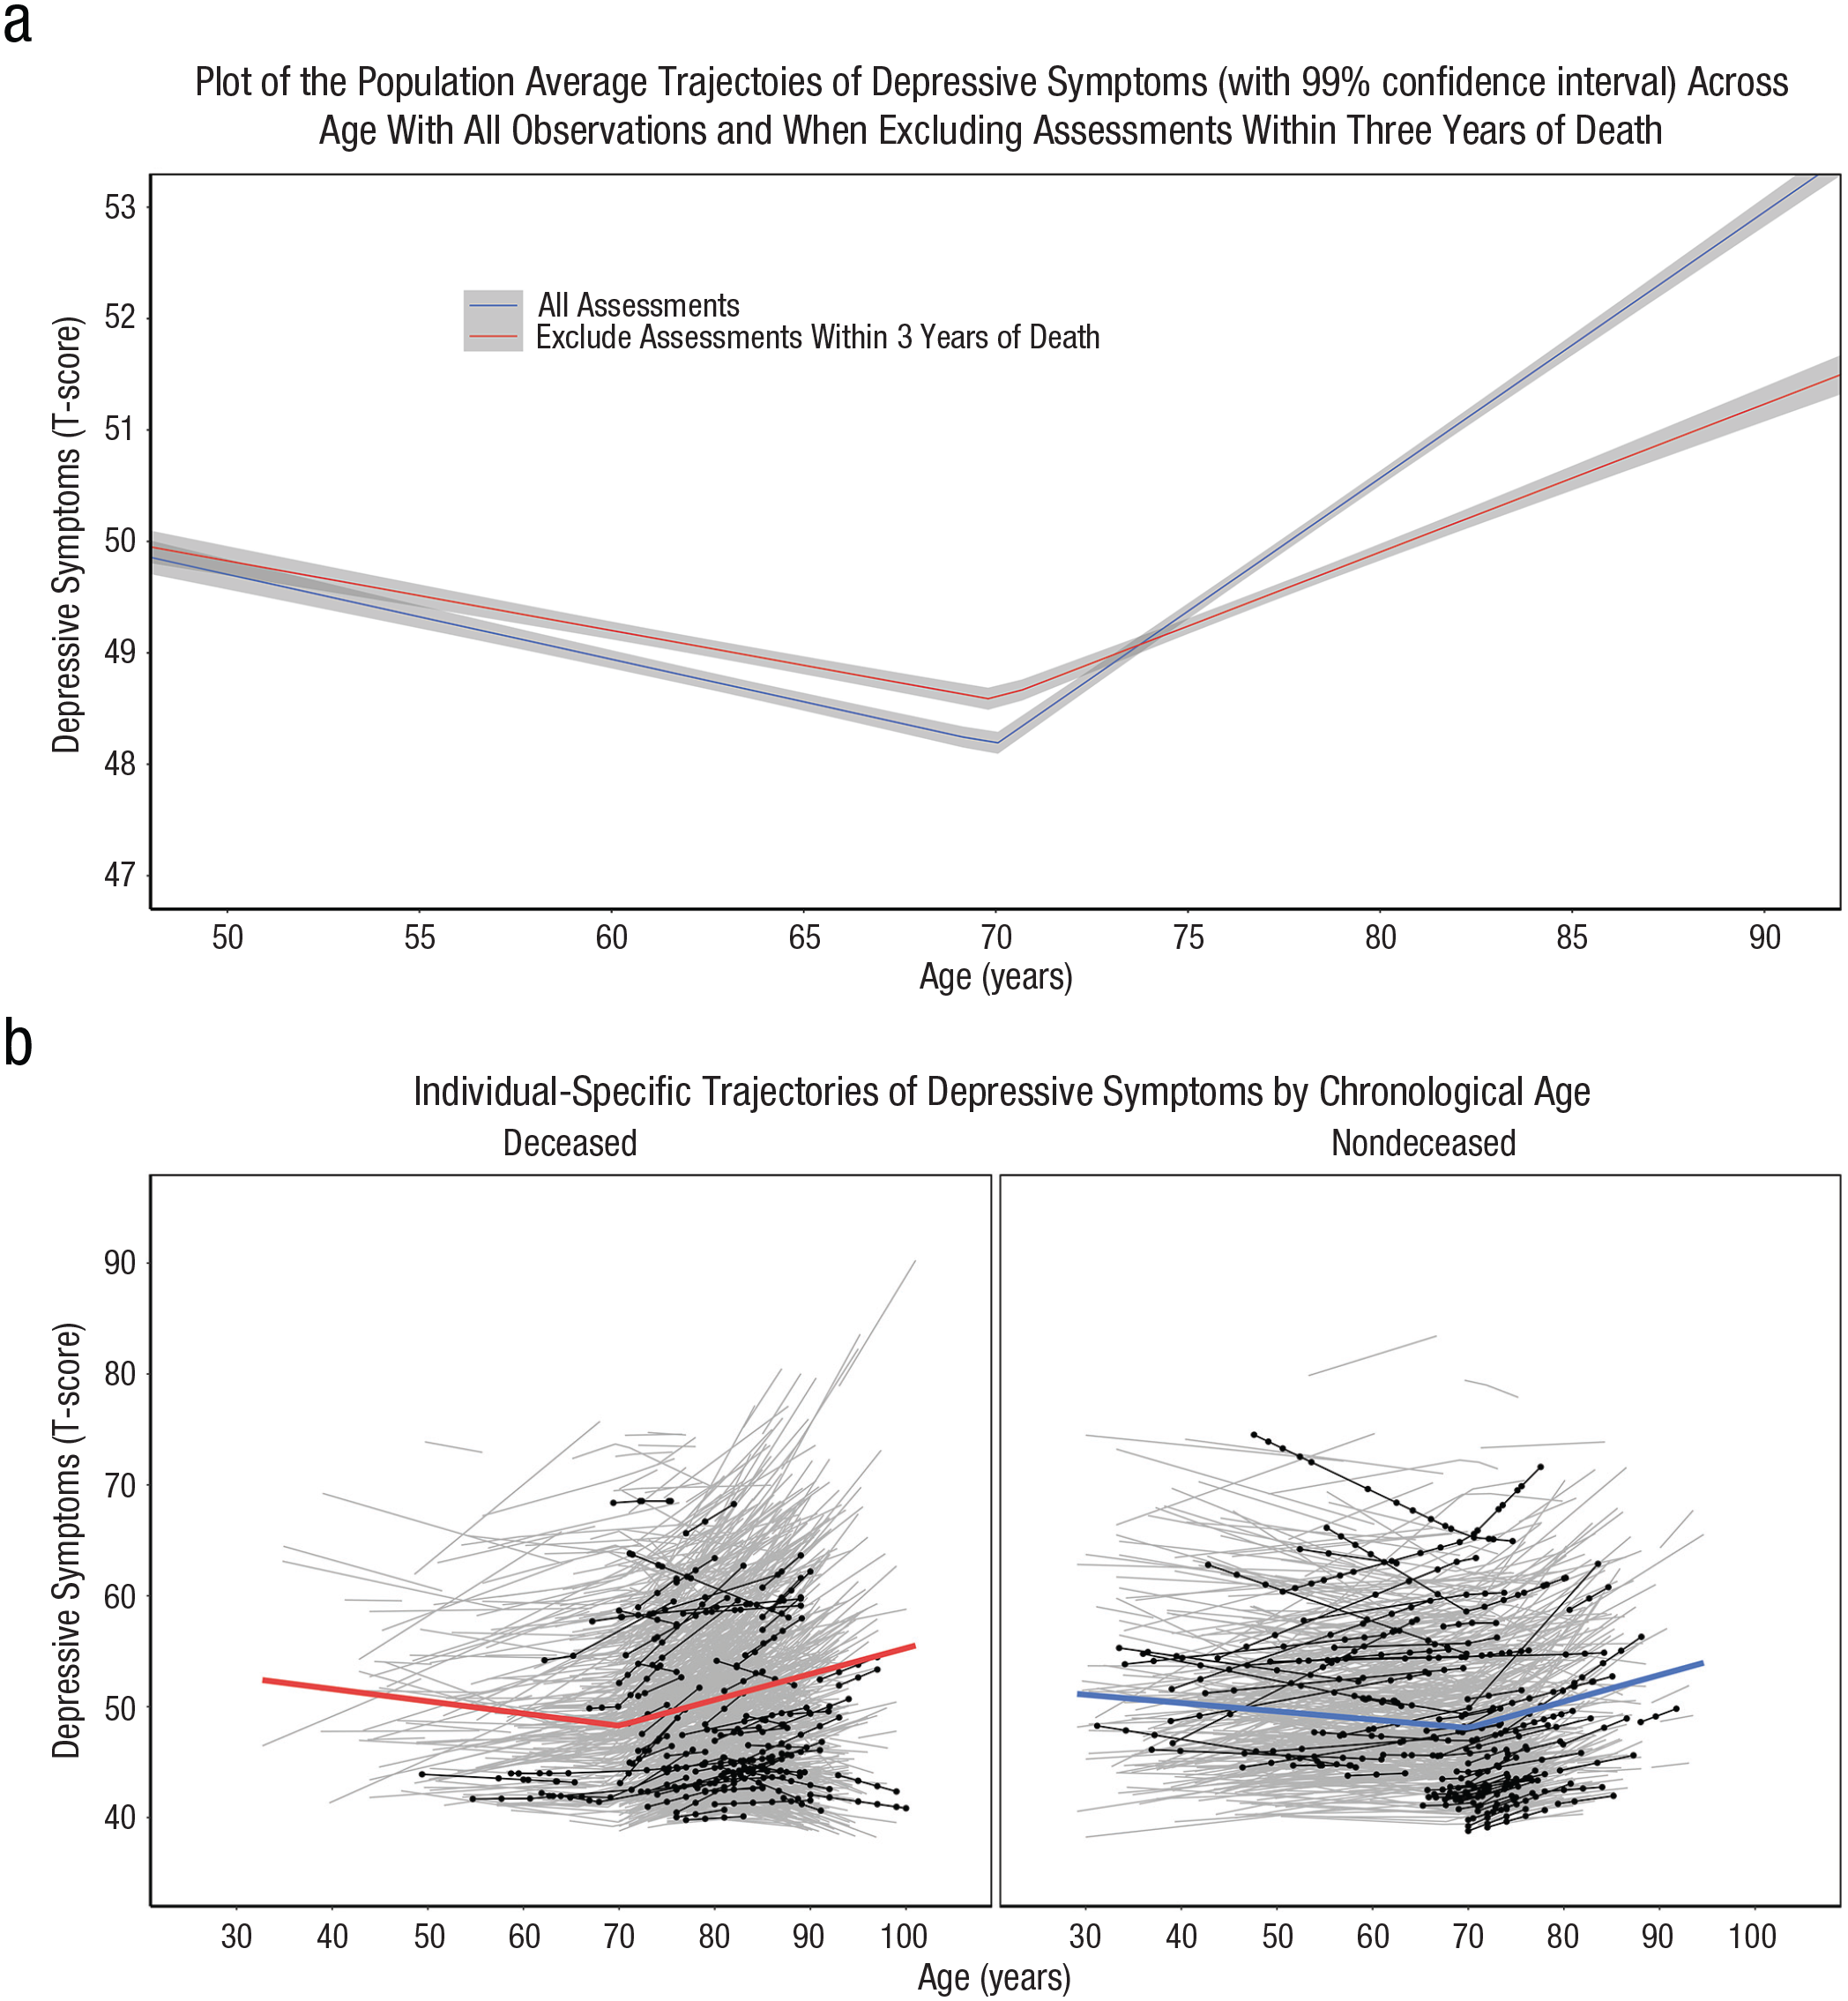
Estimated trajectories of depressive symptoms over age. Plots show (a) the average estimated trajectory of depressive symptoms (with a 99% confidence interval) over age when including all assessments (12,574 assessments) and after excluding the 1,651 assessments that occurred within 4 years of death (N = 2,411), as estimated by the multilevel model examining trajectories of depressive symptoms; and (b) the average estimated trajectory of depressive symptoms by mortality status with each individual’s estimated trajectory (gray lines) and 75 randomly selected individuals (black lines and points), highlighting the significant variability in the trajectories of depressive symptoms across age.
The shared random-effect parameter estimates link the longitudinal and time-to-event models. Individuals with higher depressive symptoms (per 1 T-score-unit increase) at age 70 had a 1.02 times increased risk of dying, 95% confidence interval (CI) = [1.01, 1.03]. Individuals with larger annual increases in depressive symptoms after age 70 were also at a significantly increased risk of dying. A 1-SD increase in the post-age-70 slope was associated with a 1.09 times increased risk of dying, 95% CI = [1.01, 1.17]. The Kaplan-Meier curve presented in Figure 3 shows the probability of survival from ages 70 to 90 for individuals above and below the median of the post-age-70 depressive-symptom slope. Individuals below the median post-age-70 depressive-symptom slope had a median survival time of 86.0 years, 95% CI = [85.0, 86.5]. Individuals with larger increases in depressive symptoms after age 70 had a median survival time of about 1.6 fewer years, Mdn = 87.6 years, 95% CI = [87.0, 88.0], relative to individuals below the median post-age-70 depressive-symptom slope. The linear slope before age 70 was not significantly associated with the risk of death—hazard ratio (HR) per 1-SD increase in pre-age-70 slope = 1.04, 95% CI = [0.94, 1.14].
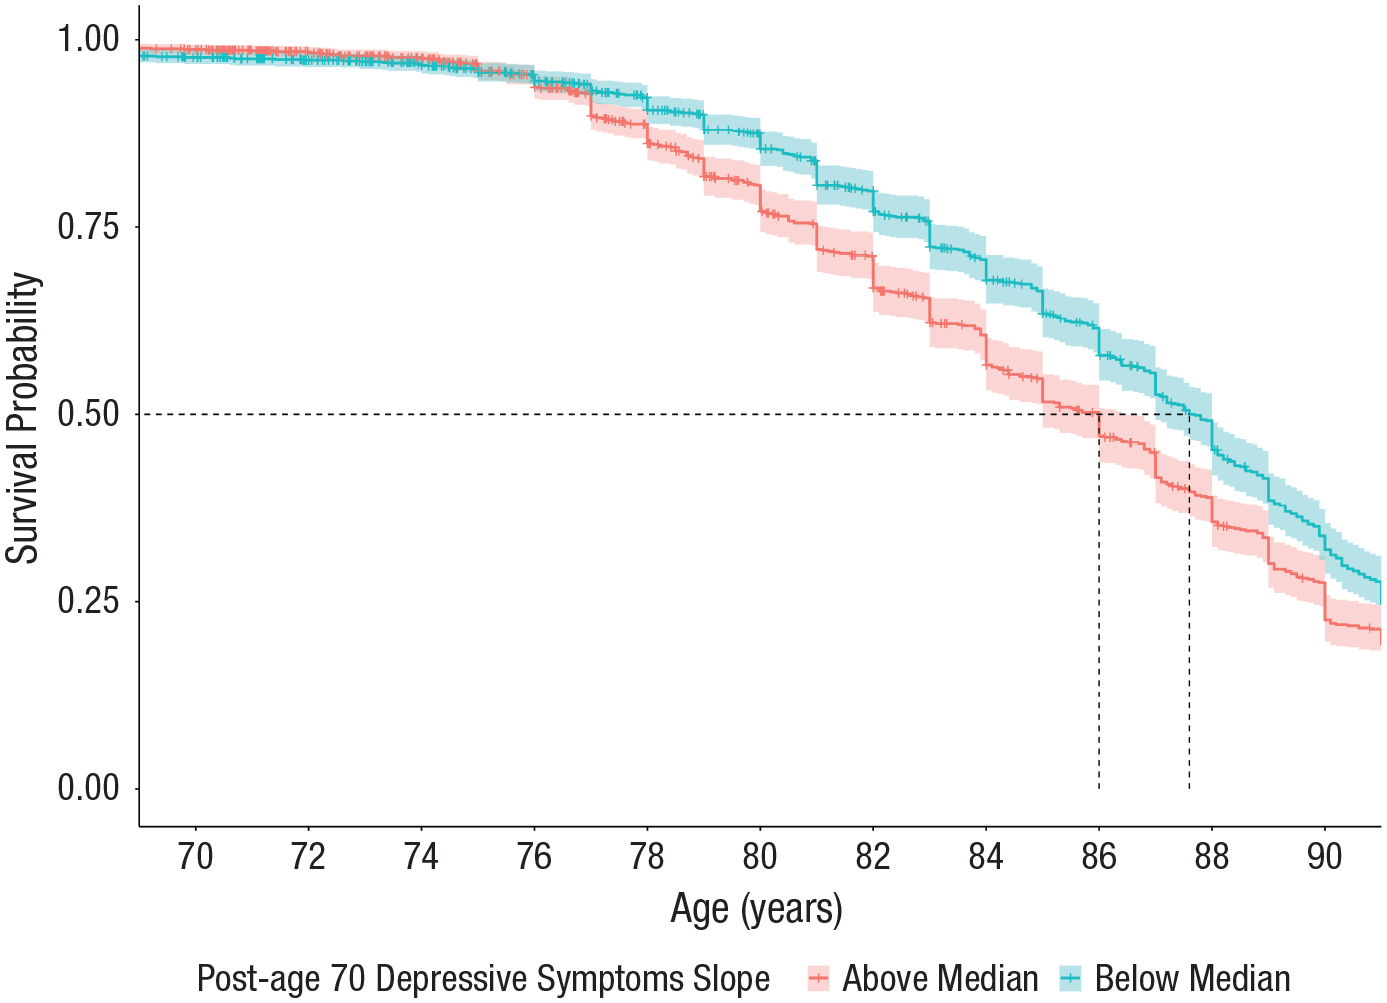
Probability of survival (with a 95% confidence interval) across ages 70 to 90 by the magnitude of annual increases in depressive symptoms after age 70 (based on a median split). Dashed lines denote the median survival age for both groups.
After excluding assessments that occurred within 3 years of death, the average linear change after age 70 was attenuated by nearly 30% (see Table 2). This attenuation is illustrated in Figure 2a. Furthermore, after excluding the assessments that took place within 3 years of death, the adverse association between more substantial annual increases in depressive symptoms after age 70 on death was attenuated and no longer statistically significant—HR per 1-SD increase in post-age-70 slope = 1.01, 95% CI = [0.94, 1.10]. The attenuation of these associations after excluding observations within 3 years of death suggests a role of mortality-related factors largely driving the increases in depressive symptoms observed in later older adulthood.
Piecewise linear multilevel model with random changepoints
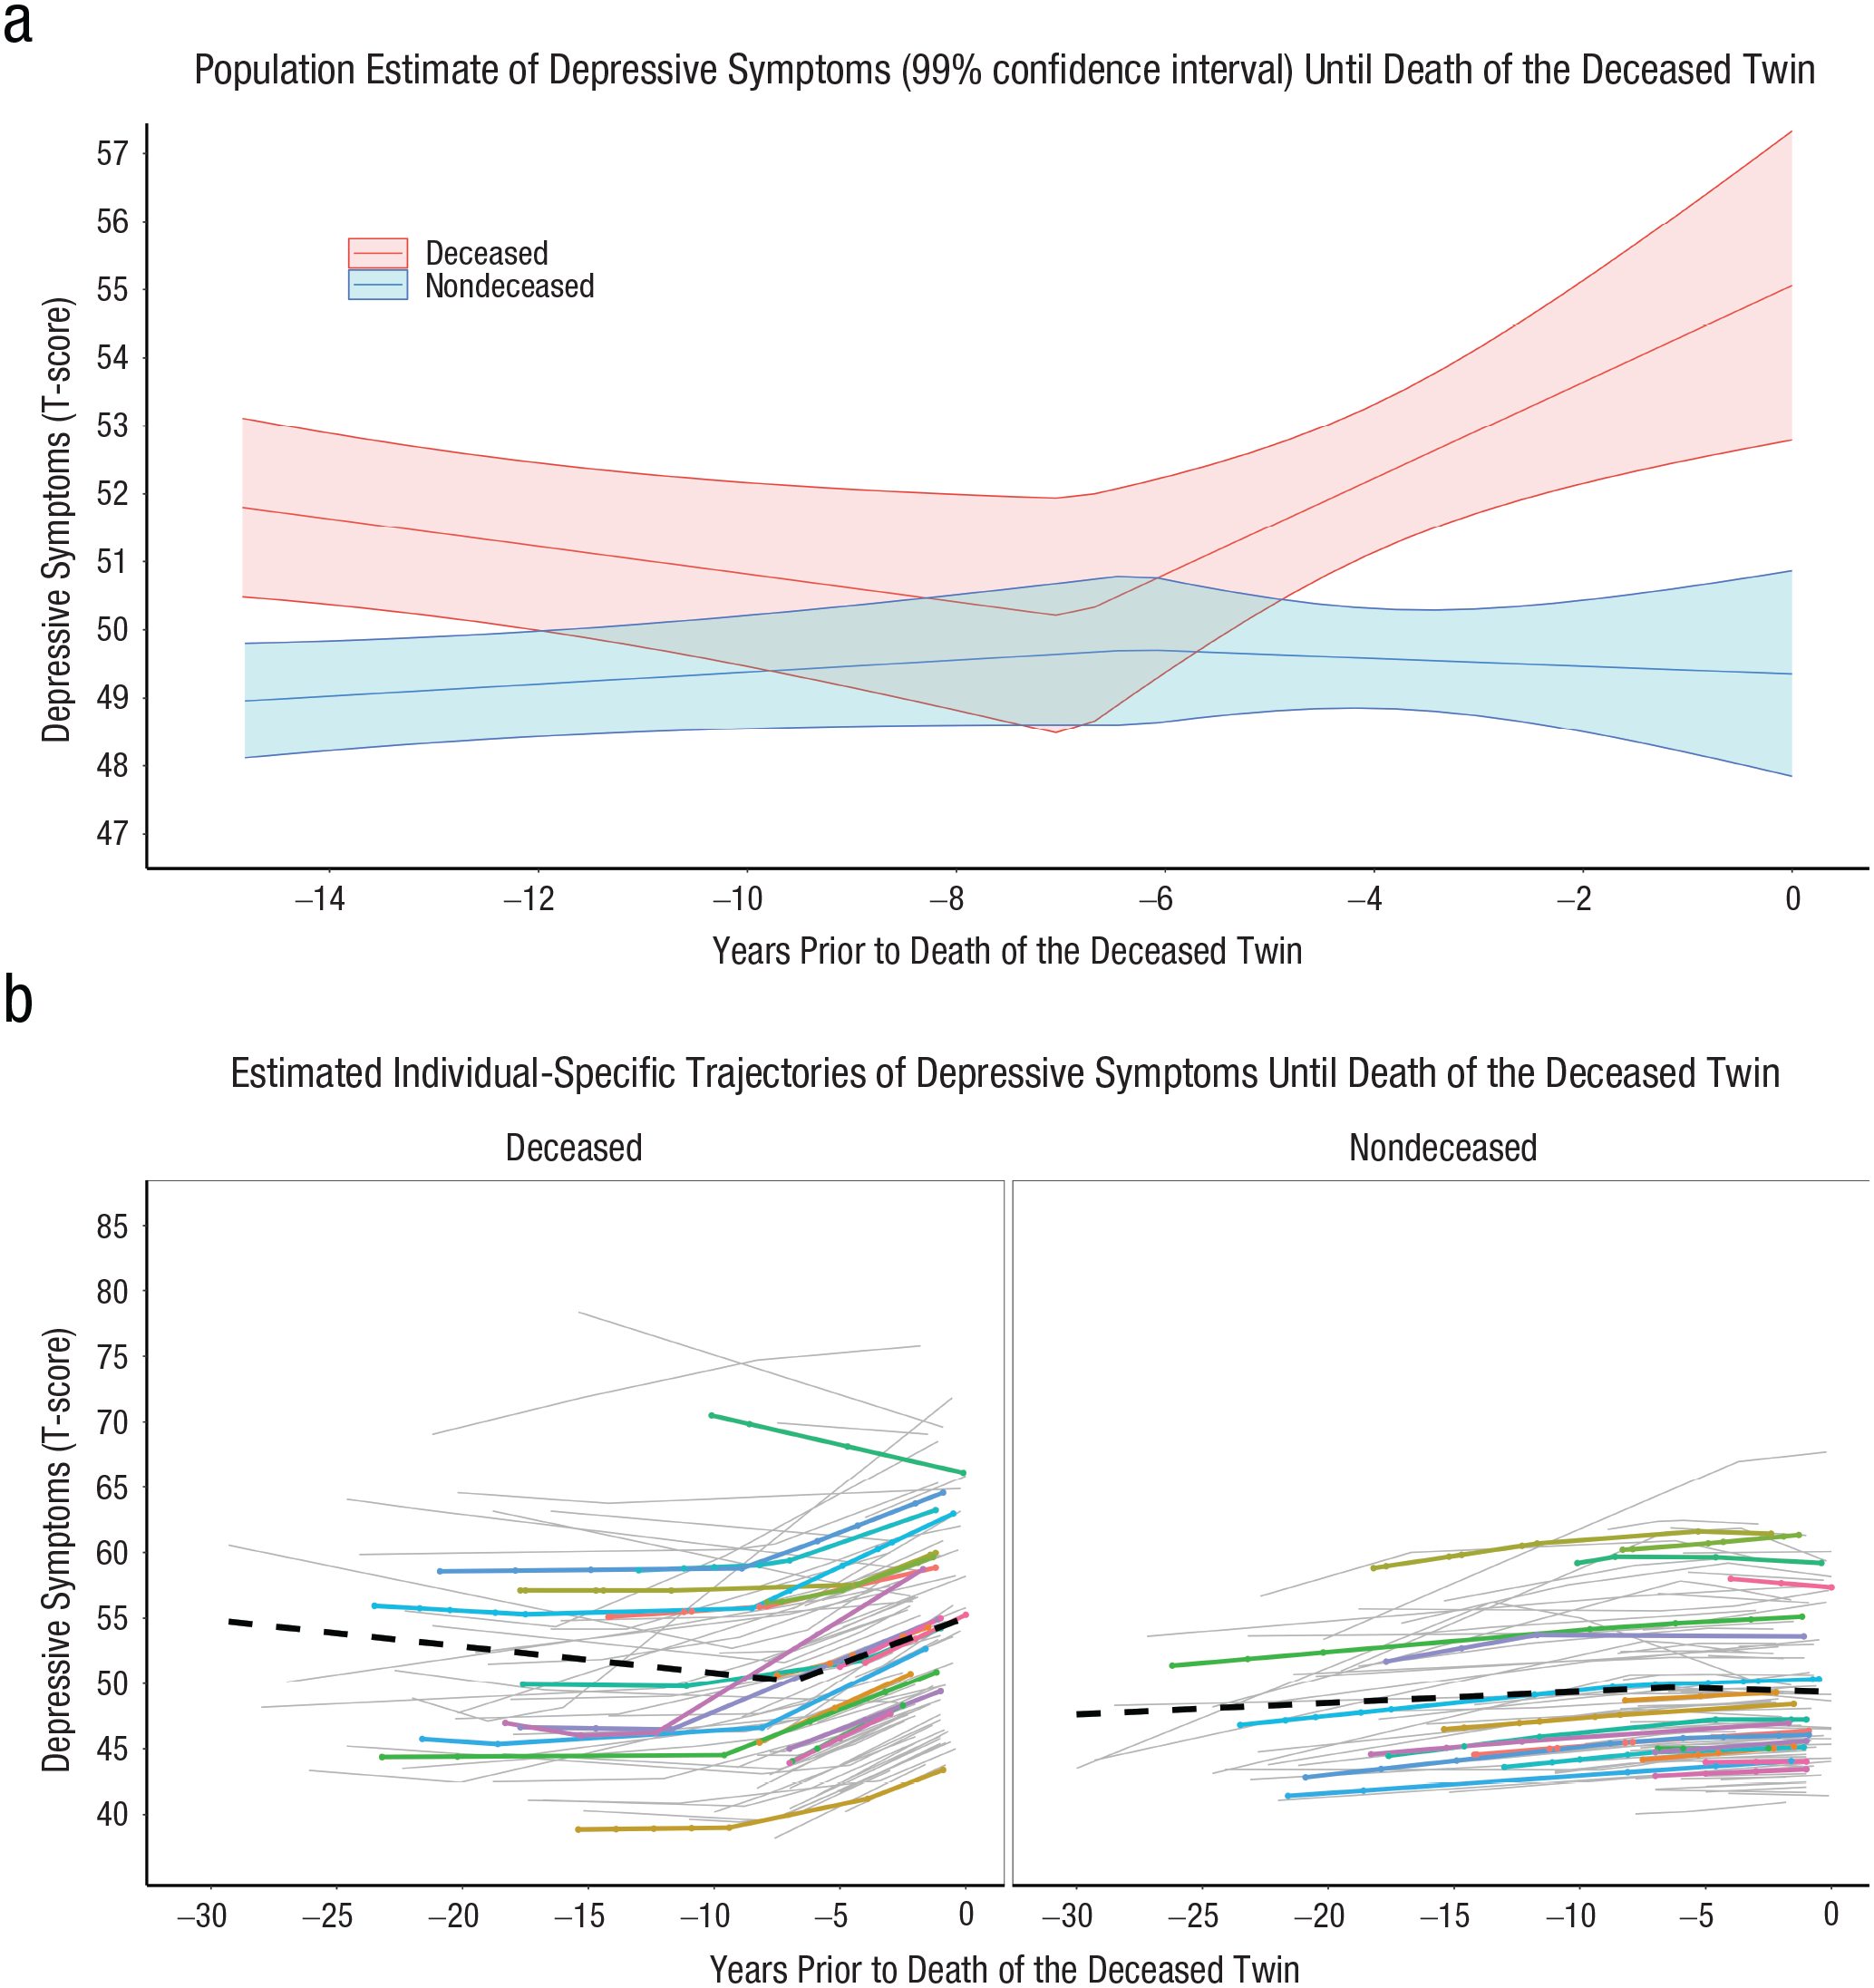
The piecewise linear multilevel model with random changepoints was fit next to quantify the magnitude and onset of the mortality-related increases in depressive symptoms (see Table 3). Figure S1 in the Supplemental Material presents the distribution of depressive-symptom assessments by integer years preceding death (for deceased participants) or last assessment (for nondeceased participants). Deceased participants had significantly higher estimated depressive symptoms by just under 4 T-score units, β = 3.68, 95% CI = [2.74, 4.62], p < .001, at 1 year before death compared with the level of depressive symptoms at 1 year before the final assessment of nondeceased participants. On average, the changepoint occurred approximately 7.42 years, β = −7.42, 95% CI = [−8.49, −6.36], p < .001, before the last assessment for nondeceased participants and 4.3 years for deceased participants. There was significant interindividual variability in the timing of the changepoint, as indicated by the significant variance of the random-effect estimates—changepoint variance = 11.58, 95% CI = [8.62, 14.54]. For nondeceased participants, the slope before the changepoint, β = 0.129, 95% CI = [0.06, 0.20], p < .001, was of similar magnitude as the slope after the changepoint, β = 0.08, 95% CI = [−0.05, 0.20], p = .118. Deceased participants compared with nondeceased participants experienced significantly larger annual increases in depressive symptoms after the changepoint, β = 1.11, 95% CI = [0.90, 1.32], p < .001, in the years leading up to death (deceased) and the final assessment (nondeceased), respectively, consistent with the first hypothesis. Figure 4a depicts the average estimated trajectory of depressive symptoms (with 99% CIs) leading up to death for deceased participants and the final assessment for nondeceased participants. Figure 4b illustrates the significant interindividual variability in the location of the changepoint and magnitude of the pre- and post-changepoint slopes. The gray lines in Figure 4b depict all participants’ estimated trajectories of depressive symptoms, whereas the black lines and data points highlight 75 randomly selected deceased and nondeceased individuals. Last, the distributions of the individual-specific estimates of depressive symptoms 1 year before death or the last symptom assessment, the pre-changepoint slope, the post-changepoint slope, and the location of the changepoint are presented in Figure S2.
Results of the Piecewise Linear Multilevel Model With Random Changepoints Examining Trajectories of Depressive Symptoms in the Years Before Death or Last Assessment (N = 2,411)
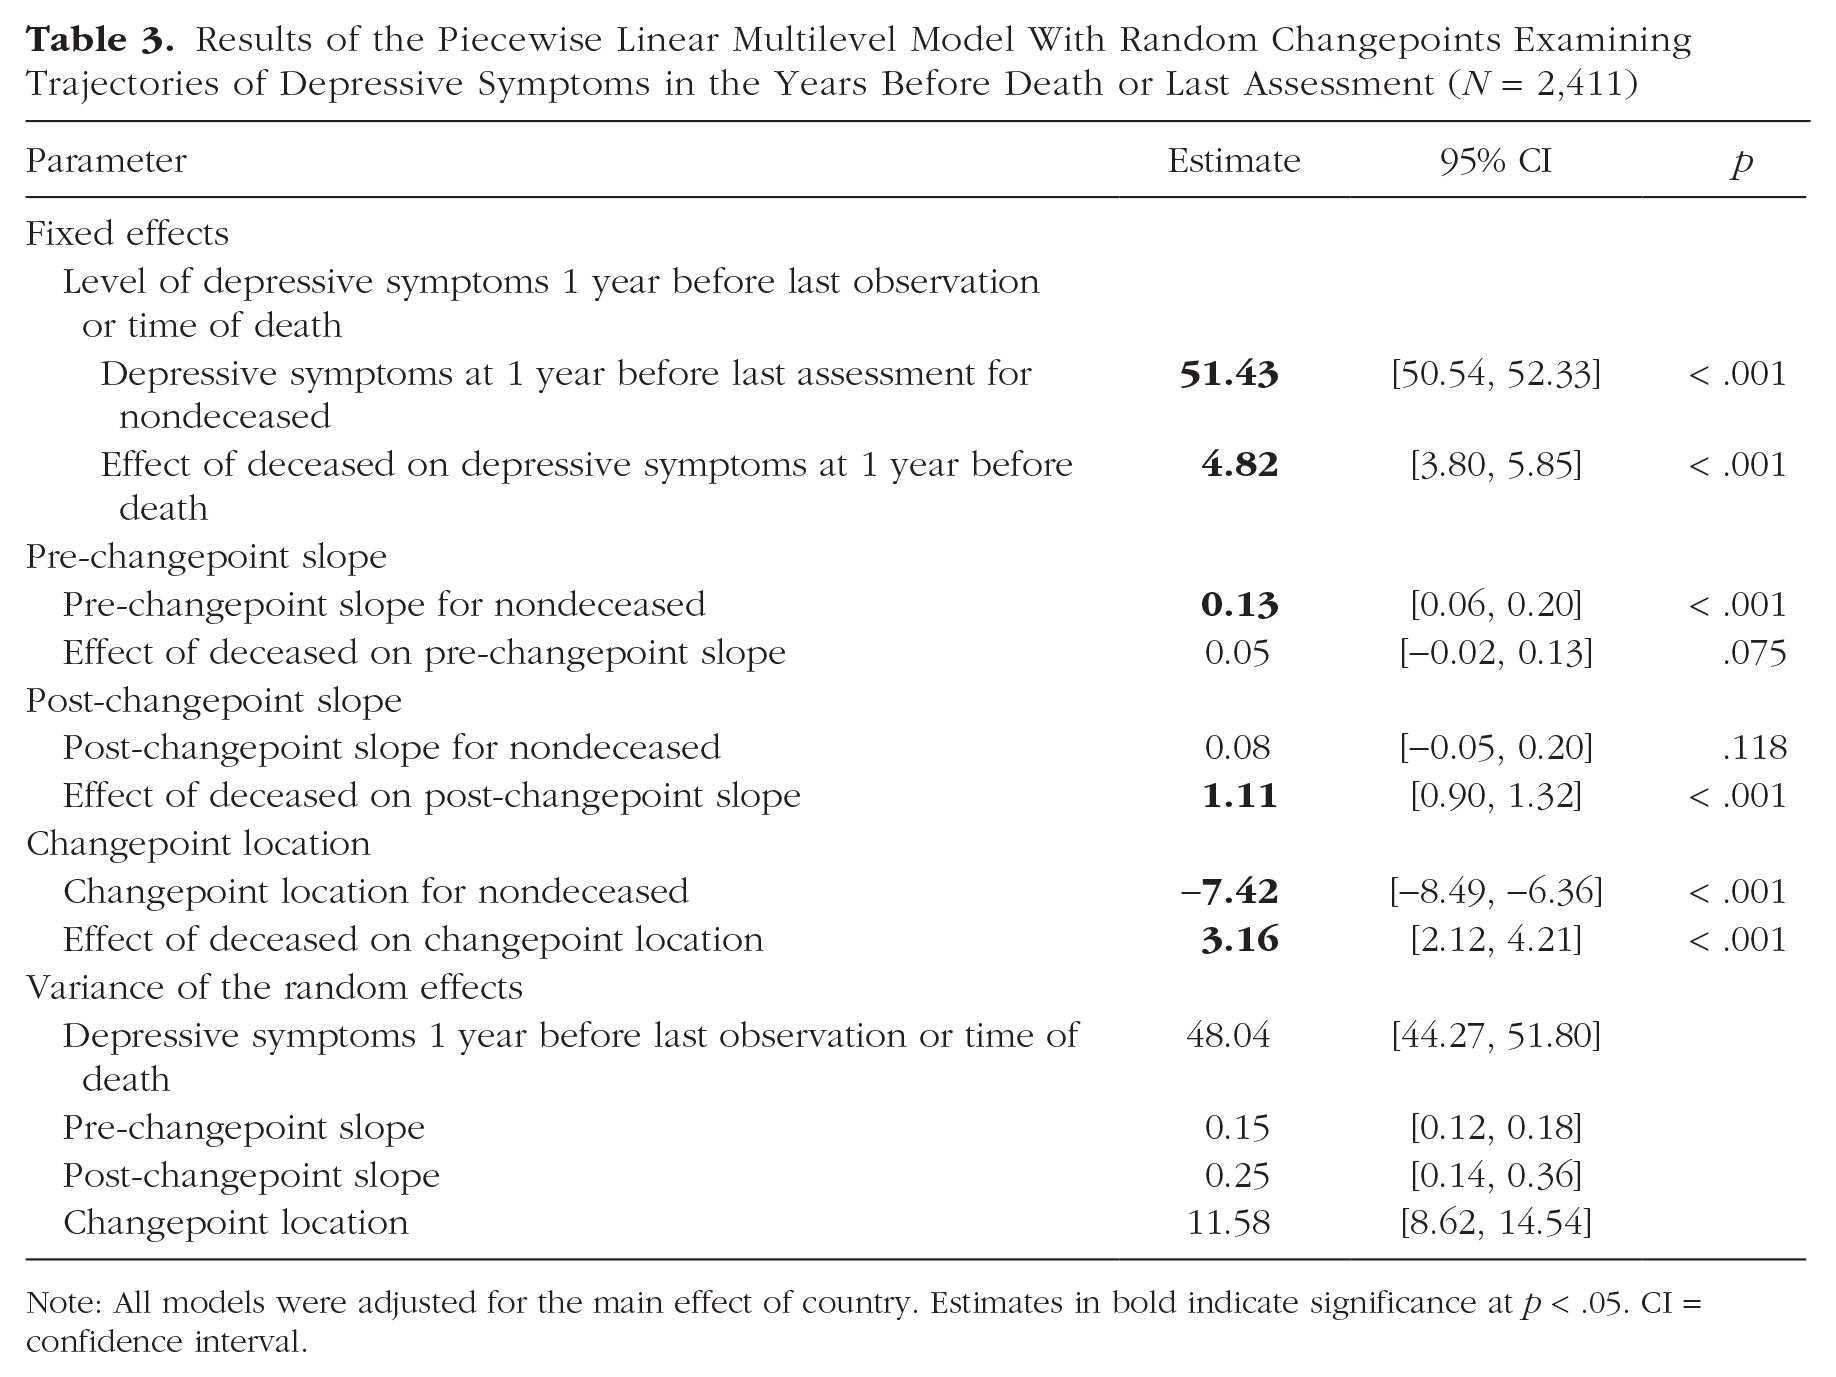
Note: All models were adjusted for the main effect of country. Estimates in bold indicate significance at p < .05. CI = confidence interval.
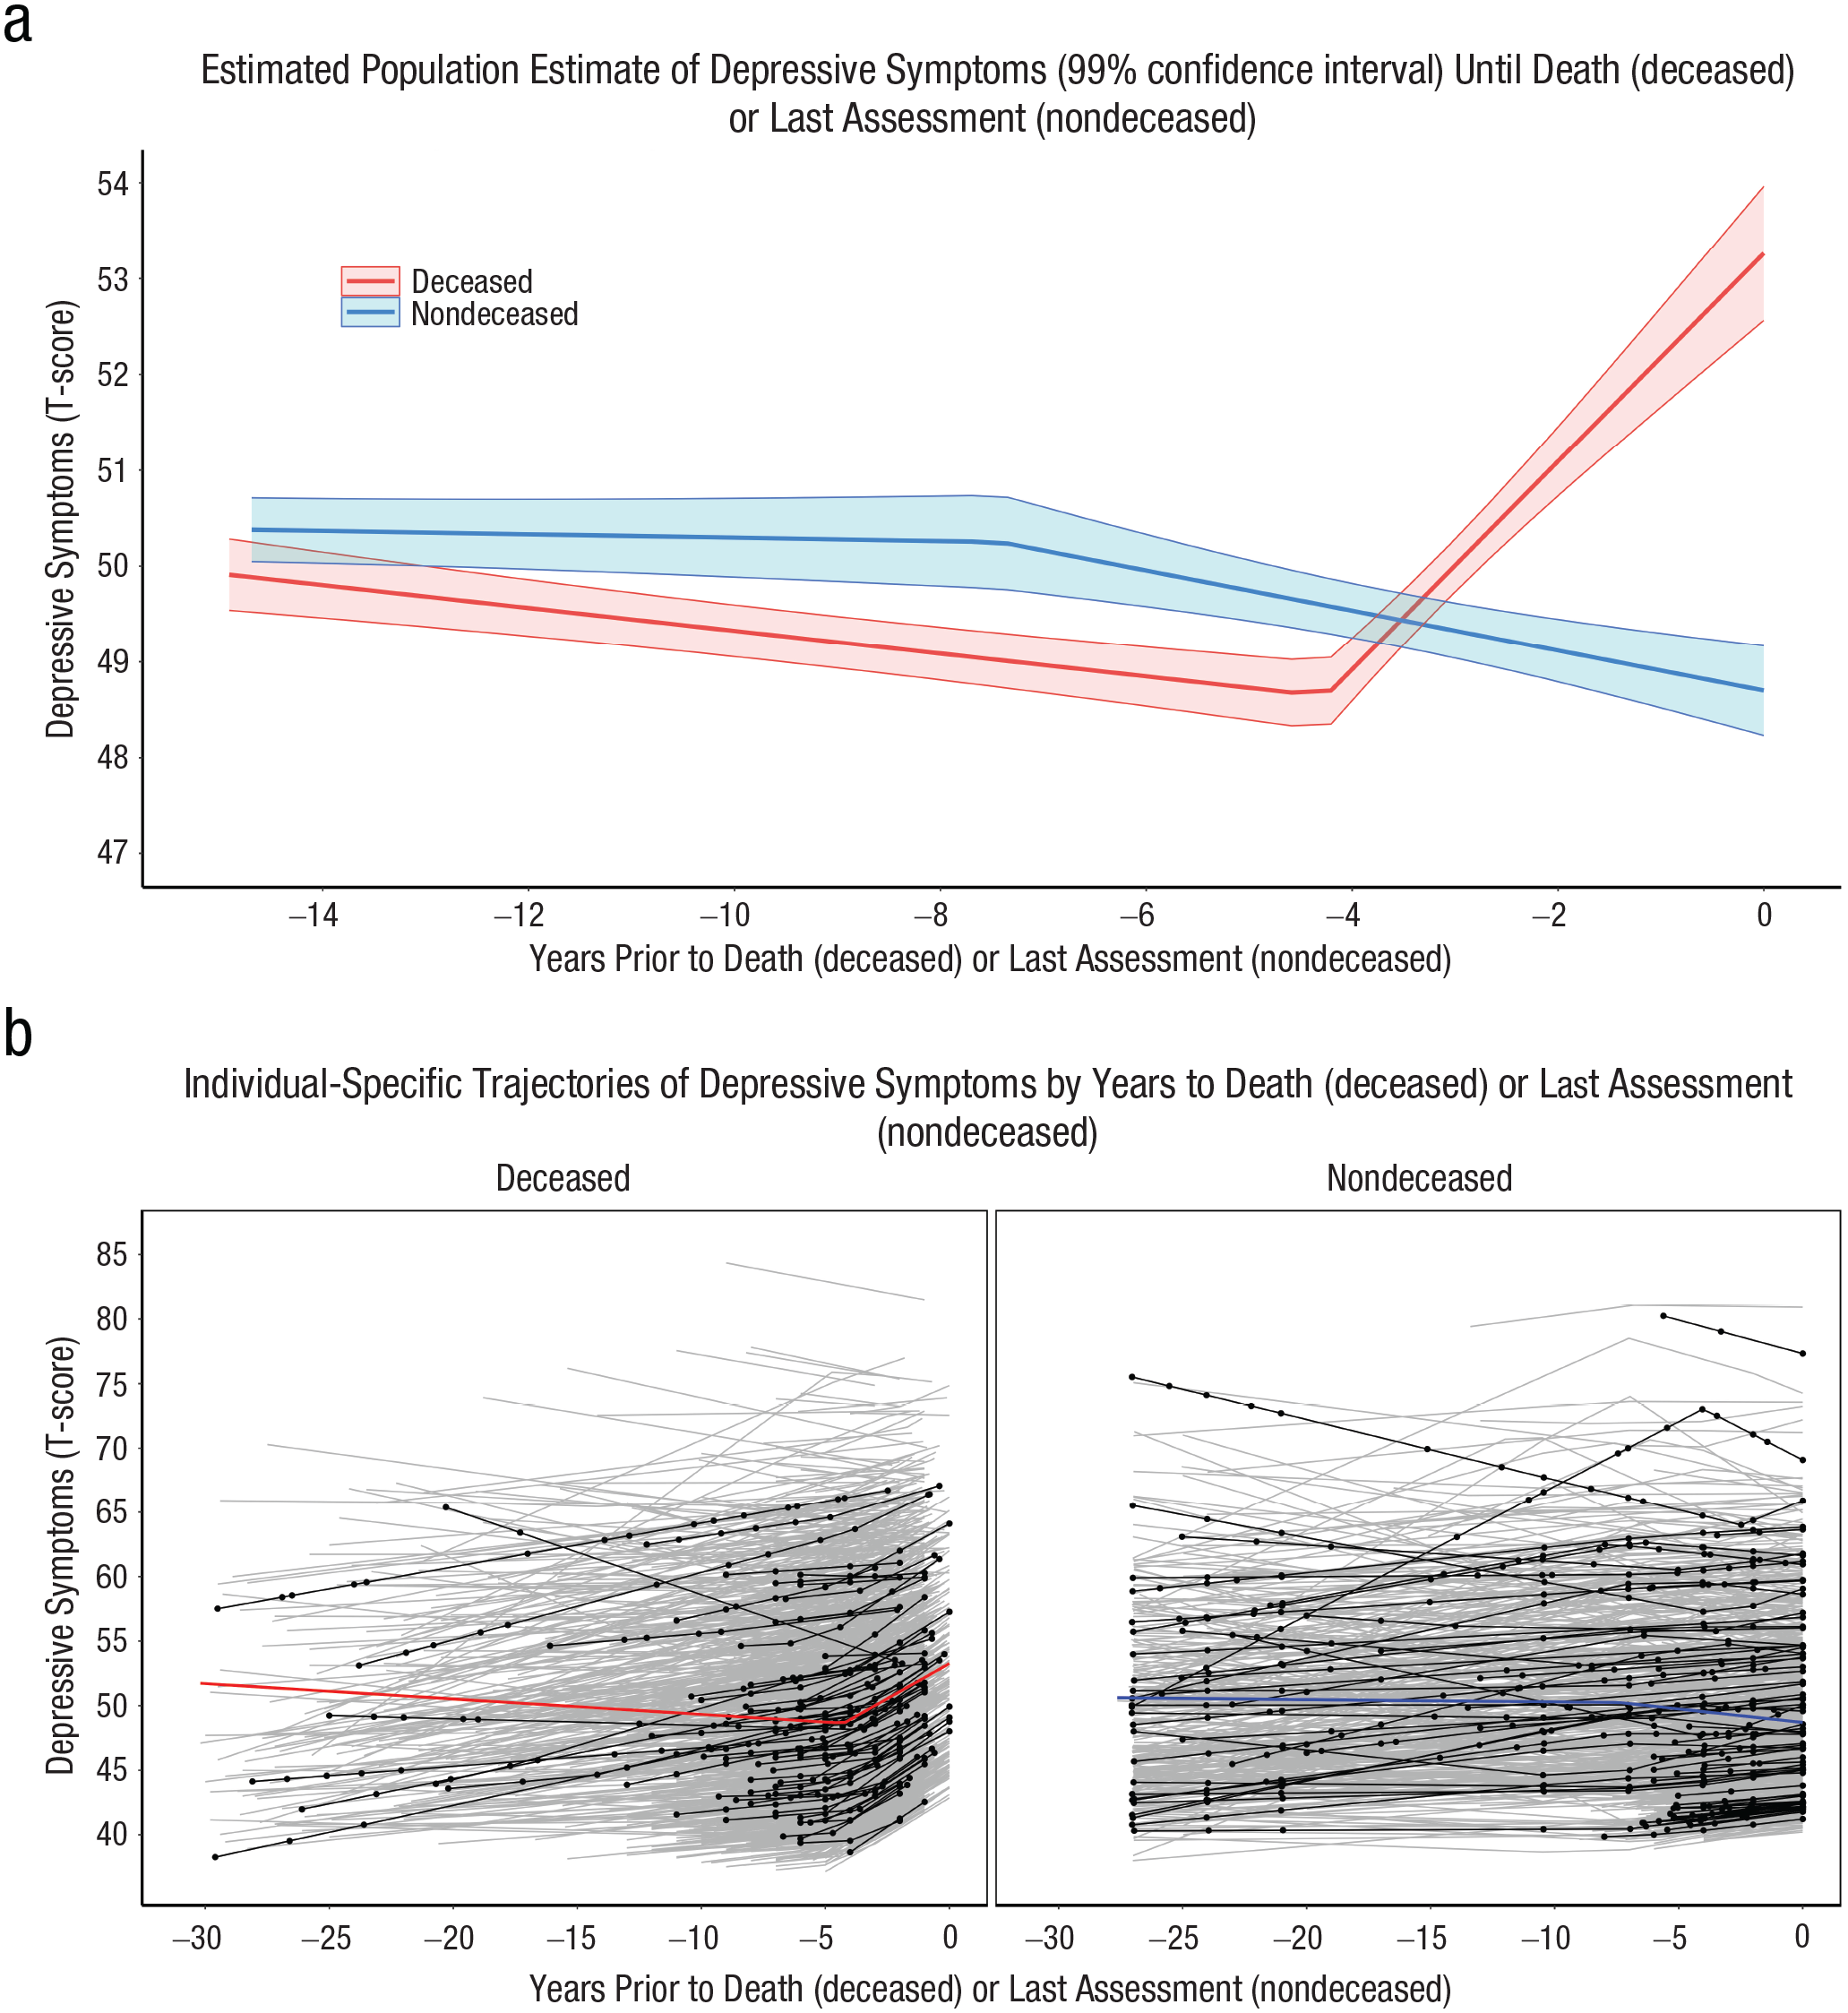
Estimated trajectories of depressive symptoms leading up to death or last assessment. The plots show (a) the average estimated trajectories of depressive symptoms leading up to death or final assessment derived from the piecewise linear multilevel model with random changepoints (N = 2,411) and (b) the average estimated trajectory of depressive symptoms by mortality status. All individuals’ estimated trajectories (gray lines) and the estimated trajectories of 75 randomly selected individuals (black lines and points) are presented to highlight the interindividual variability in depressive symptoms across age.
Co-twin control analysis
Of the 98 discordant twin pairs included in these analyses, 32 were monozygotic, 60 were same-sex dizygotic, and six were opposite-sex dizygotic twins. The results of the piecewise linear multilevel model with random changepoints, comparing twins discordant for mortality on the onset of and mortality-related increases in depressive symptoms, are presented in Table 4. The deceased twin had just over 5 T-score units greater estimated depressive symptoms at the time of their death compared with their co-twin, who survived at least 4 years longer, β = 5.46, 95% CI = [2.80, 8.12], p < .001. The deceased twin also had significantly greater annual increases in depressive symptoms after the estimated changepoint compared with the twin who survived, β = 0.84, 95% CI = [0.43, 1.26], p < .001. Figure 5a depicts the average estimated depressive symptoms for both deceased and nondeceased twins up until the deceased twin’s death, whereas Figure 5b presents a graph of all individual trajectories to highlight the interindividual variability in trajectories. Last, Figure S3 presents a graph of all discordant twin pairs comparing the trajectories of deceased and nondeceased twins.
Results of the Co-Twin Control Piecewise Linear Multilevel Model With Random Changepoints Comparing the Trajectories of Twin Pairs Discordant on Survival Time (N = 196)
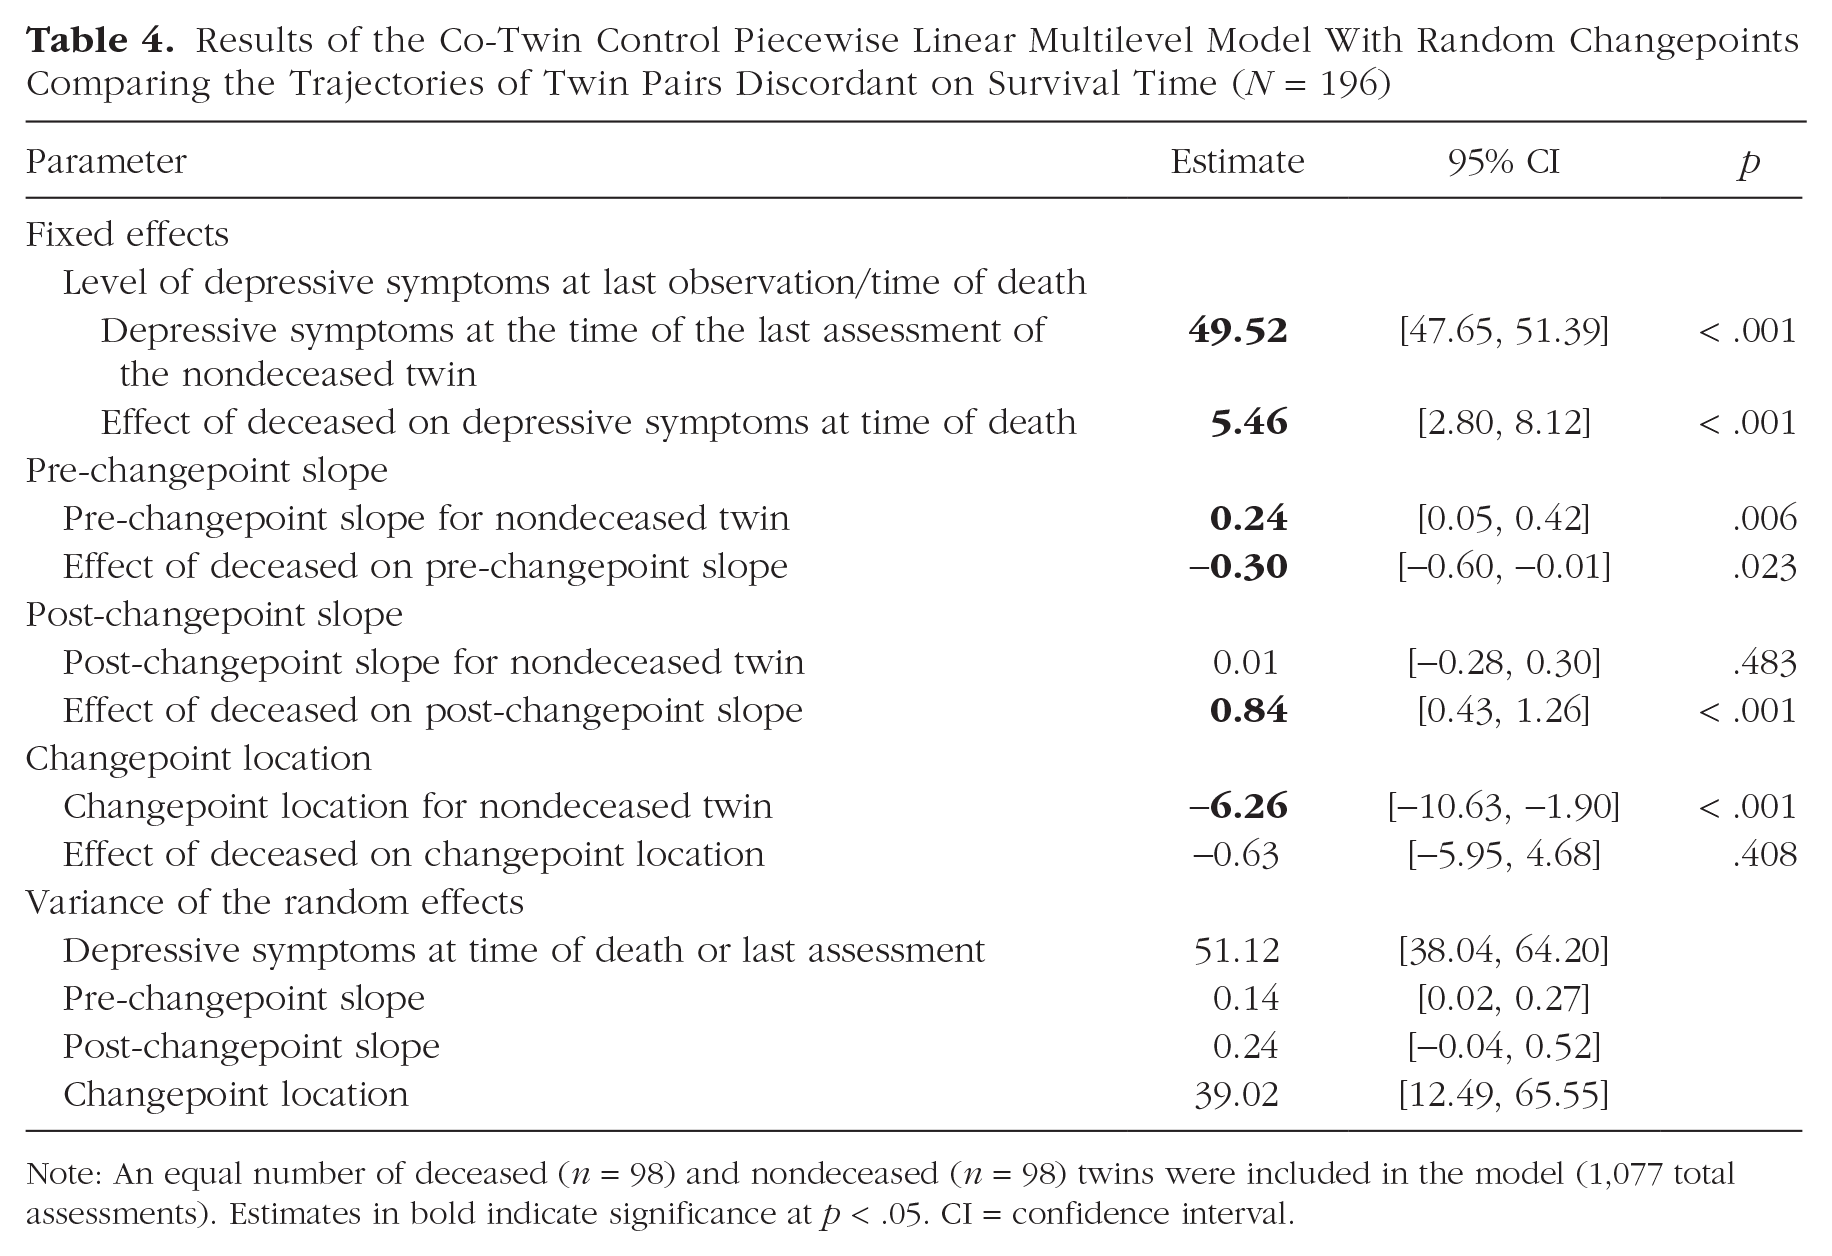
Note: An equal number of deceased (n = 98) and nondeceased (n = 98) twins were included in the model (1,077 total assessments). Estimates in bold indicate significance at p < .05. CI = confidence interval.
Estimated depressive symptom trajectories from the co-twin control analyses. The plots show (a) the average estimated trajectories of depressive symptoms (with 99% confidence intervals) from the co-twin control piecewise linear multilevel model with random changepoints comparing depressive symptom trajectories of twin pairs discordant on survival time and (b) the individual-specific trajectories derived from this model (gray lines) with 20 randomly selected pairs highlighted to illustrate the significant interindividual differences in trajectories.
Gender differences in terminal increases in depressive symptoms
We next examined whether there were significant gender differences in the magnitude of mortality-related increases in depressive symptoms (see Table 5). The effect of gender on each growth parameter stratified by mortality status is presented in Table 5. The analyses were stratified by mortality status to compare the magnitude of the post-changepoint slope for deceased and nondeceased participants. The logic of these stratified analyses is that if the post-changepoint slope reflects terminal-related increases in depressive symptoms, deceased individuals should have a higher post-changepoint slope, whereas the post-changepoint slope of nondeceased individuals should be of relatively smaller and of similar magnitude to their pre-changepoint slope. Deceased males had significantly larger annual increases in depressive symptoms after the changepoint compared with deceased females, β = 0.54, 95% CI = [1.10, .02], p = .029, in support of the second hypothesis. The gender-by-mortality interaction on the post-changepoint slope was not statistically significant (p = .061). Deceased men were not different from deceased women in the estimated level of depressive symptoms 1 year prior to death, β = 0.69, 95% CI = [−0.76, 2.14], p = .175. For nondeceased participants, the only significant gender difference was in the magnitude of symptoms at the last assessment, β = 1.21, 95% CI = [0.23, 2.19], p = .008. Nondeceased women had just more than a 1-T-score-unit greater level of depressive symptoms than nondeceased men at the final assessment. For nondeceased participants, the location of the changepoint or magnitude of change before and after the changepoint did not significantly differ by gender.
Results of the Piecewise Linear Multilevel Model With Random Changepoints Stratified by Mortality Status Examining Trajectories of Depressive Symptoms in the Years Before Death or Final Assessment
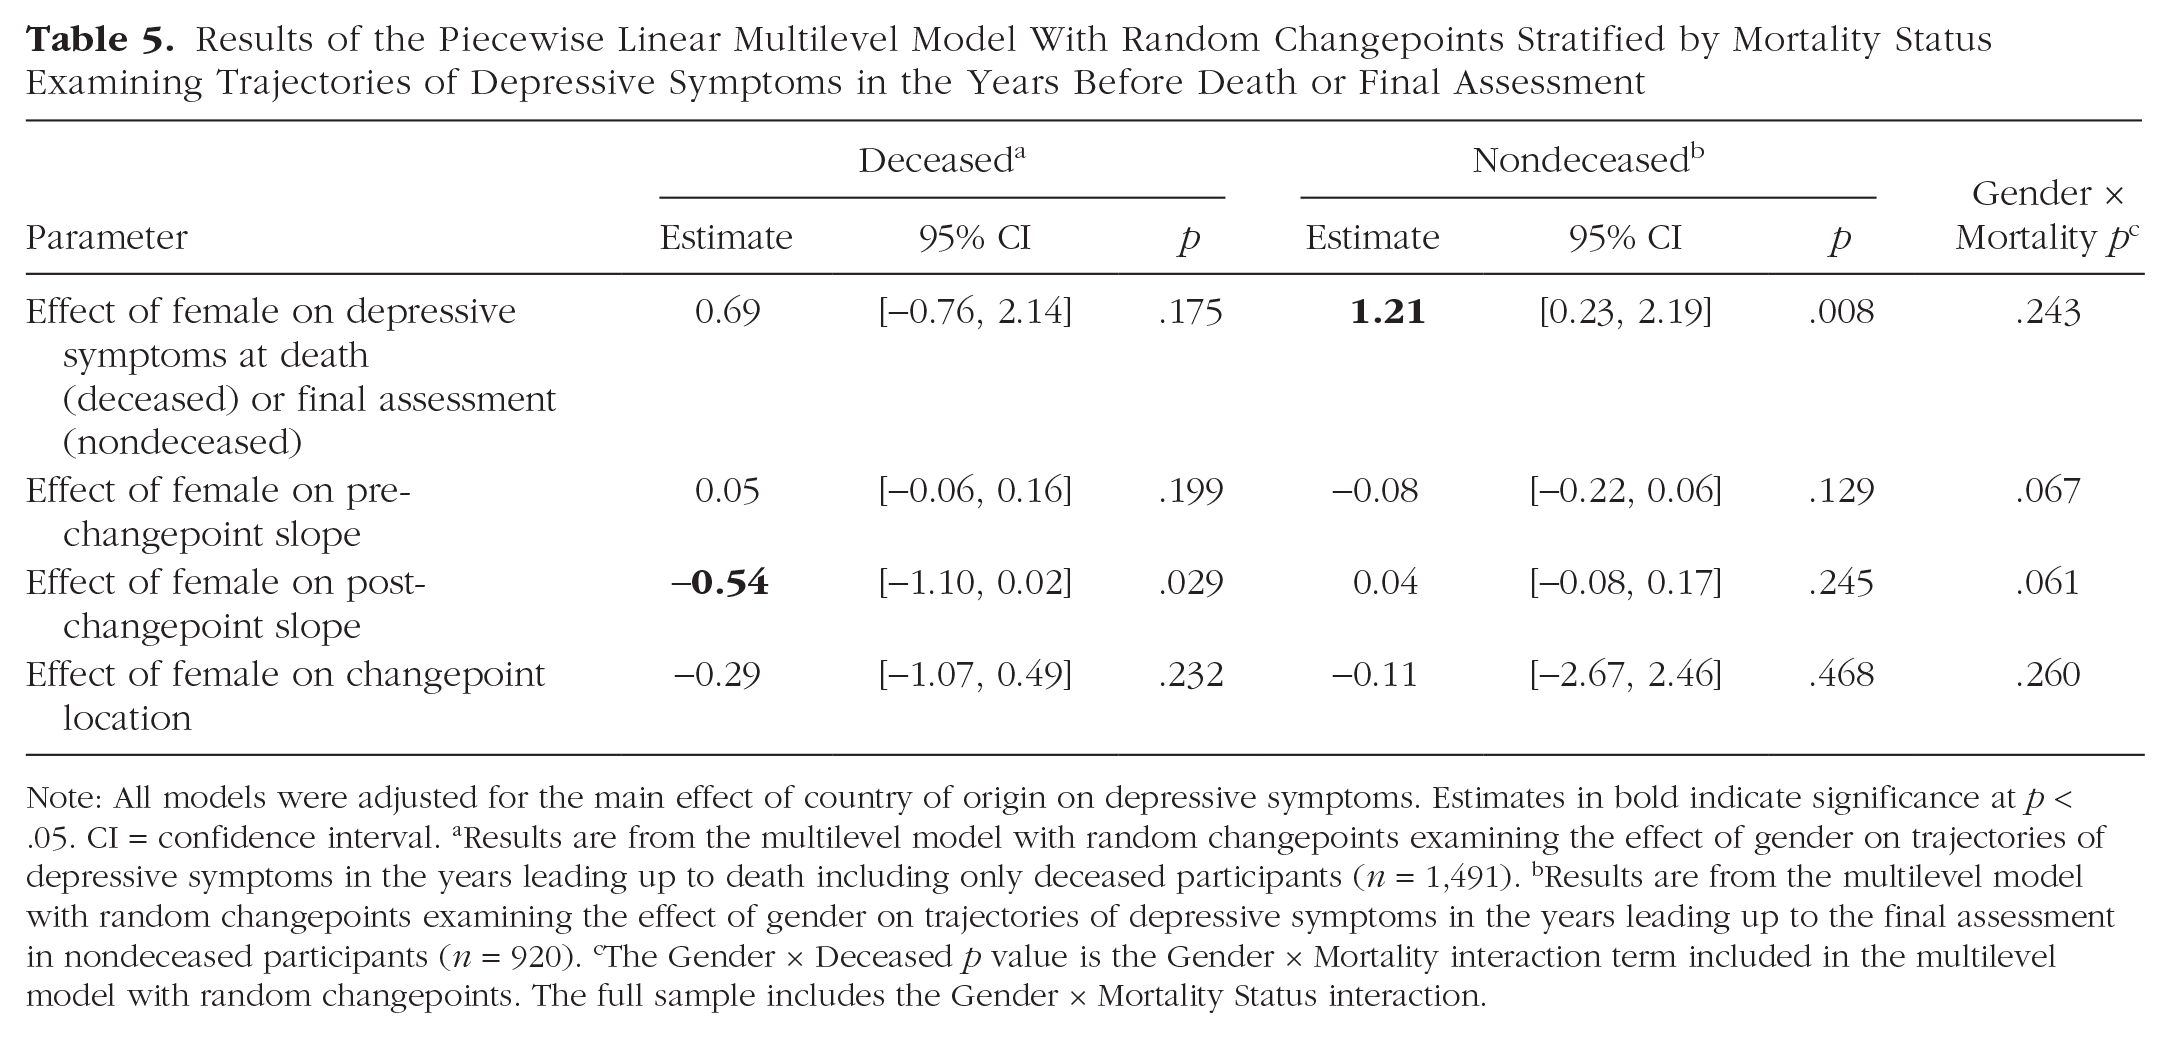
Note: All models were adjusted for the main effect of country of origin on depressive symptoms. Estimates in bold indicate significance at p < .05. CI = confidence interval. aResults are from the multilevel model with random changepoints examining the effect of gender on trajectories of depressive symptoms in the years leading up to death including only deceased participants (n = 1,491). bResults are from the multilevel model with random changepoints examining the effect of gender on trajectories of depressive symptoms in the years leading up to the final assessment in nondeceased participants (n = 920). cThe Gender × Deceased p value is the Gender × Mortality interaction term included in the multilevel model with random changepoints. The full sample includes the Gender × Mortality Status interaction.
Sensitivity analysis
Because of the significant differences in age and gender for the deceased compared with nondeceased participants, we ran a sensitivity analysis using a subsample of participants with deceased and nondeceased better matched for age. We selected only participants older than 65 and only deceased participants whose age at death was less than 85. This approach included a subsample of 1,043 in which the deceased participants (n = 564) were 2.96 years older than the nondeceased participants (n = 479) at their last assessment (for sample descriptive statistics of this restricted subsample, see Table S5). Results from the shared random-effects joint model were consistent with the main analyses because we found that individuals with larger annual increases in depressive symptoms were at increased risk of dying, HR = 1.14, 95% CI = [0.99, 1.32], with similar magnitude as the main analyses (for parameter estimates from the joint model, see Table S6). The results of the piecewise multilevel model with random changepoints with this subsample were also mostly consistent with the main analyses (see Table S7). Although the Gender × Deceased interaction term on the post-changepoint slope was significant, suggesting gender differences in the magnitude of post-changepoint slope of deceased participants, the effect of gender on the magnitude of the post-changepoint slope was not statistically significant in deceased or nondeceased participants (see Table S8).
Next, the sensitivity analyses in which the piecewise linear multilevel models with random changepoints restricting the sample to one randomly selected twin within each pair were constructed to rule out bias in the standard error estimation driving the significant findings. These sensitivity analyses are presented in Tables S9 through S11 and suggest that, with the exception of the analyses examining gender differences in the magnitude of terminal increases in depressive symptoms, the bias in the standard errors did not drive the main results because the parameter estimates and p values were largely consistent when examining these associations within randomly selected individuals within each twin pair. The analyses examining gender differences in the mortality-related increases in depressive symptoms were not fully robust to these sensitivity analyses.
Although all our main analyses included country as a covariate in the models to adjust for country-level confounders, we ran a sensitivity analysis with the study of origin included as a covariate instead of country to adjust for possible study differences. The main results were mostly consistent when we adjusted for the study of origin rather than the country of origin (see Tables S12–S14). Some analyses examining gender differences were not robust when adjusting for study rather than country. Mainly, deceased females were estimated to have significantly more depressive symptoms 1 year before death compared with deceased males, and the post-changepoint slope for deceased females was not different from the slope for deceased males. The location of the changepoint was not significantly different for deceased males and females in these sensitivity analyses.
Last, within the co-twin control analyses, when we did not omit the observations from the nondeceased co-twins that occurred after the death of their twin there was no significant uptick in symptoms after the death of their twin (see Table S15). A negative changepoint estimate demonstrates this for the nondeceased twin, which is not suggestive of a significant uptick in symptoms after the death of their co-twin.
Discussion
Results from a multinational consortium, in which participants completed as many as 17 assessments of depressive symptoms, support the hypothesis that increases in depressive symptoms occurring in mid-to-later older adulthood partially reflect mortality-related factors. The best fitting longitudinal functional form of depressive symptoms across chronological age consisted of decreases in mean-level symptoms from midlife to early older adulthood until age 70, followed by accelerated increases in symptoms after age 70. This pattern has been well established cross-sectionally (Best et al., 2021; Newmann, 1989), and we add support to this pattern longitudinally (Sinkewicz et al., 2022; Sutin et al., 2013).
Our main conclusion is that the increase in depressive symptoms observed after age 70 is a partial manifestation of terminal drop (Gerstorf et al., 2010). The concept of terminal drop, when applied to depressive symptoms, posits that mortality-related factors are a key driver of the increases in symptoms in later life. In the joint model, individuals with larger annual increases in depressive symptoms after age 70 were at a significantly higher risk of dying, consistent with this hypothesis. The median survival age of individuals with larger increases in depressive symptoms after age 70 was approximately 1.6 years less compared with individuals reporting less pronounced increases in depressive symptoms after age 70. After excluding those observations that occurred within 3 years of death, the results were changed in two ways that support the terminal-drop hypothesis. First, the magnitude of the annual rate of change after age 70 was attenuated by nearly 30% after excluding assessments occurring within 3 years of death. This attenuation suggests that mortality-related factors were partially driving increases in depressive symptoms after age 70. Second, after excluding observations that occurred within 3 years of death, the effect of linear changes after age 70 was attenuated by nearly 15% and was no longer significantly associated with an increased risk of death. This attenuation suggests that the association between the greater magnitude of change after age 70 and risk of death was primarily driven by those observations occurring in the years immediately preceding death. Likewise, Sutin et al. (2013) reported a significant increase in depressive symptoms approaching death; however, impending death did not fully explain these increases in depressive symptoms.
The current study goes further in making a novel application of a multilevel random changepoint model to estimate the timing of terminal increases in depressive symptoms while quantifying rates of change before and after the changepoint. Using this data-driven approach, we found an acceleration in the increases of depressive symptoms beginning approximately 5 years before death. The analyses with the twin pairs discordant for mortality provide further support for terminal increases in depressive symptoms in the years preceding death. These co-twin control analyses rigorously adjusted for unmeasured shared familial influences and additive genetic influences on depressive symptoms. The current study is the first, to our knowledge, to utilize twin methodologies to test for mortality-related increases in depressive symptoms. Our findings on depressive symptoms are consistent with those of other longitudinal studies examining mortality-related decreases in happiness and personality traits (Gerstorf et al., 2016; Vogel et al., 2013). Gerstorf and Ram (2013), in particular, used a similar random changepoint modeling approach to longitudinal happiness data, reporting significant mortality-related declines in happiness beginning approximately 4 years before death.
Regarding our second research question, we found that men and women differed in terms of the magnitude and onset of mortality-related increases in depressive symptoms. Men experienced more substantial increases in depressive symptoms in the years preceding death compared with women. At the same time, the onset of mortality-related increases was just over 1 year earlier for women compared with men. For deceased participants, there were no gender differences in terms of depressive symptoms at the time of death. These findings support the interpretation that gender differences in the mortality-related increases in depressive symptoms may, at least in part, explain the narrowing of gender differences in depressive symptoms that are observed in the later portion of older adulthood.
The random changepoint modeling also revealed significant interindividual variability in the timing of the changepoint and magnitude of mortality-related increases in depressive symptoms. This significant variability illustrates that some individuals enter the terminal phase earlier than the average 4 years before death, whereas some enter later. The variability has important clinical ramifications because it suggests that there are factors that could be targeted for interventions to delay the onset and magnitude of mortality-related increases in depressive symptoms. These interindividual differences were also noted by Gerstorf and Ram (2013) in their analyses of terminal decline and life satisfaction.
If mortality-related factors contribute to increased depressive symptoms, we can consider some of the processes that may be implicated. These include increased physical illness, functional impairment, sensorimotor decrements, compromised cognitive abilities; loss of social roles and decreased social support, financial strain; resultant reduction in positively reinforcing activities; and assaults on an individual’s sense of control and agency. These same processes have been described as risk factors for depression in older adults (Blazer et al., 1991; Fiske et al., 2009; Mirowsky & Ross, 1992). We note that all these decline processes also accelerate toward the end of life, although to different degrees in different persons. Gatz (1998) suggested that later life depression might be conceptualized as a depletion of “affective reserve.” In this sense, depressive symptoms toward the end of life may represent a sort of summation of the person’s affect about their life situation.
We also offer that the gender differences that we observed may suggest that men’s emotional functioning is more vulnerable than that of women to these mortality-related factors. Men also tend to experience more frequent, severe, and steeper declines in health at older ages (Zajacova et al., 2017). Furthermore, men in palliative care tend to report significantly higher psychological distress compared with women (Hayes et al., 2012). The increased functional impairment and need to be dependent on others that are common in the last years of life may have a stronger negative impact on depressive symptoms in men compared with women (Hayes et al., 2012). These may limit the ability to participate in positively reinforcing activities, with some work suggesting that a reduction in leisure activities may be more strongly associated with depressive symptoms in men compared with women (Breslin et al., 2006). Although the effect size of the gender differences on the post-changepoint slope was of small magnitude, there are many instances in which a small effect size is clinically relevant. Small effect sizes may accumulate over time, which may meet clinical relevance with advancing time (Funder & Ozer, 2019). The cumulative effect of gender on the post-changepoint slope resulted in nonsignificant differences between men and women in depressive symptoms 1 year before death. We argue that this narrowing of gender differences that are observed over the entirety of the life span represents a clinically relevant effect. Lastly, previous work suggests that nonshared environmental factors may account for a larger proportion of variability in depressive symptoms in later life (Petkus et al., 2017), supporting the possibility that environmental changes associated with declining health and functional impairment may have a more negative impact on men than on women.
There are important study limitations. First, limited ethnic/racial diversity may limit the generalizability of the findings. IGEMS studies predominantly include participants of European ethnicity, although there is considerable diversity in education, occupation, and wealth, reflecting the situation in the respective countries when participants were growing up. Second, results may have been influenced by differences in the measurement and assessment schedules among the IGEMS studies. We addressed these challenges through the harmonization of measures and the use of T-scores. We also included country as a covariate in the models to further adjust for possible country-level confounders. Third, antidepressant use may affect the trajectories of depressive symptoms preceding death. Future research needs to examine the association between antidepressant use and terminal drop in depressive symptoms. Likewise, we did not examine whether the proposed mortality-related factors were actually driving the observed findings. Future research needs to examine the extent to which mortality-related factors explain our findings. Fourth, it was not possible to create a comparison sample of nondeceased participants that were identical to deceased participants in terms of age and gender because the deceased participants tended to be older and more likely to be female. Therefore, it cannot be ruled out that the differences in trajectories between deceased and nondeceased participants resulted from true age differences. We addressed this limitation with our sensitivity analyses and co-twin control analyses that were largely consistent with the main findings. The sensitivity analyses examining gender differences in the changepoint models were not fully robust and consistent with the main findings. Future studies need to replicate the gender-difference results with larger samples. Last, because of a limited number of discordant twin pairs with the requisite data, the co-twin control analyses included both monozygotic and dizygotic pairs and a small number of opposite-sex dizygotic pairs such that the design did not fully control for genotype and gender.
In conclusion, the findings presented in this study support the assertion that increases in depressive symptoms observed in later older adulthood are partially explained by mortality-related factors. We found that, on average, individuals experienced acceleration in depressive symptoms just over 4 years before death (the changepoint location for nondeceased of −7.42 plus the effect of deceased on the changepoint location of 3.16 equals −4.26 years), and this acceleration was of larger magnitude in men than in women.
Supplemental Material
sj-pdf-1-pss-10.1177_09567976251351022 – Supplemental material for Terminal Increases in Depressive Symptoms in a Multinational Twin Consortium
Supplemental material, sj-pdf-1-pss-10.1177_09567976251351022 for Terminal Increases in Depressive Symptoms in a Multinational Twin Consortium by Andrew J. Petkus, Chandra A. Reynolds, Vibeke S. Catts, Kaare Christensen, Deborah Finkel, Marianne Nygaard, Perminder S. Sachdev, Nancy L. Pedersen and Margaret Gatz in Psychological Science
Footnotes
Acknowledgements
We thank all participants for their time and generosity in contributing to this research.
Transparency
Action Editor: D. A. Briley
Editor: Siminie Vazire
Author Contributions
References
Supplementary Material
Please find the following supplemental material available below.
For Open Access articles published under a Creative Commons License, all supplemental material carries the same license as the article it is associated with.
For non-Open Access articles published, all supplemental material carries a non-exclusive license, and permission requests for re-use of supplemental material or any part of supplemental material shall be sent directly to the copyright owner as specified in the copyright notice associated with the article.