
Abstract
Independent of overall achievement, girls’ intraindividual academic strength is typically reading, whereas boys’ strength is typically mathematics or science. Sex differences in intraindividual strengths are associated with educational and occupational sex disparities in science, technology, engineering, and mathematics (STEM) fields. Paradoxically, these sex differences are larger in more gender-equal countries, but the stability of this paradox is debated. We assessed the stability of the gender-equality paradox in intraindividual strengths, and its relation to wealth, by analyzing the academic achievement of nearly 2.5 million adolescents across 85 countries and regions in five waves (from 2006 to 2018) of the Programme for International Student Assessment (PISA). Girls’ intraindividual strength in reading and boys’ strength in mathematics and science were stable across countries and waves. Boys’ advantage in science as an intraindividual strength was larger in more gender-equal countries, whereas girls’ advantage in reading was larger in wealthier countries. The results have implications for reducing sex disparities in STEM fields.
In developed countries, more women than men are enrolled in higher education (Stoet & Geary, 2020), but they remain underrepresented in science, technology, engineering, and mathematics (STEM) fields. The underrepresentation is mainly in inorganic fields (e.g., physics, computer science) and, paradoxically, is larger in countries that have invested the most in gender equality (Stoet & Geary, 2018).
The gender-equality paradox is not restricted to STEM representation. Falk and Hermle (2018) found that sex differences in six economic preferences (e.g., risk taking, altruism, trust) were larger in more gender-equal countries. The same pattern has emerged for personality (Schmitt et al., 2008), subjective well-being (Guo et al., 2022), adolescents’ occupational aspirations (Stoet & Geary, 2022), and chess participation (Vishkin, 2022), among others. Some have proposed that the gender-equality paradox is “illusory” (Marsh et al., 2021), but recent research suggests that sex differences generally remain stable or increase with higher levels of gender equality (Herlitz et al., 2024).
The reasons for this paradox are debated, and they range from innate sex differences (Su et al., 2009) to subtle gender stereotypes (Breda et al., 2020) to the definition of gender equality (Richardson et al., 2020). Although they are based on different theoretical frameworks, several social-constructivist theories—for example, social role theory (Wood & Eagly, 2002) and the gender stratification hypothesis (Else-Quest et al., 2010)—posit that sex differences are largely shaped by social factors, such as internalized gender roles. If this is correct, sex differences should diminish as opportunities become more equal between women and men (Else-Quest et al., 2010; Wood & Eagly, 2002). The finding that many sex differences are larger in countries with more gender equality suggests that social factors are not a sufficient explanation (Geary, 2021). If this is true, social policies aiming to change these factors by employing social-constructivist theories (Parejo & Radulović, 2023) are not likely to be as effective as anticipated, and a broader perspective should be considered. Therefore, the gender-equality paradox has theoretical and practical implications.
We focus on an understudied aspect of the gender-equality paradox in STEM—namely, intraindividual academic strengths. These refer to each student’s comparative advantage independent of overall academic achievement. For example, a student who scores poorly in all academic areas but better in reading than in mathematics or science has an intraindividual strength in reading. Girls are more likely to have intraindividual strengths in reading, whereas boys are more likely to have intraindividual strengths in mathematics or science (Dekhtyar et al., 2018). Stoet and Geary (2018) found that girls’ intraindividual strength in reading is universal (i.e., found in all countries), and boys’ intraindividual strength in mathematics or science is nearly universal. Additionally, these sex differences appear to be larger in countries with more gender equality (Stoet & Geary, 2018). However, some have questioned the replicability of these findings and have called for a cross-temporal analysis (Richardson et al., 2020).
According to Eccles’s (1983) expectancy-value theory, intraindividual strengths contribute to long-term educational and occupational choices in more gender-equal and wealthy countries. As national gender equality and wealth increase, individuals are better able to pursue educational and occupational paths for nonfinancial reasons, including intraindividual strengths (Stoet & Geary, 2018). Thus, when conditions are favorable, adolescents with better mathematics and science skills than verbal competencies should be more likely to enter STEM fields, whereas adolescents with relatively better verbal than mathematics and science competencies should be more likely to enter the humanities and social sciences (Bernstein et al., 2019). Indeed, findings from the Study of Mathematically Precocious Youth (Webb et al., 2002), as well as large-scale studies in the United States and Sweden (Dekhtyar et al., 2018; Humphreys et al., 1993), are in line with this prediction. This is not to say that intraindividual strengths are the only factor influencing educational and occupational sex disparities in STEM, as personal interests, economic considerations, work–life balance, and gender stereotypes are also relevant (Lubinski et al., 2023; Breda et al., 2020). Nevertheless, intraindividual strengths are an important and still understudied factor.
Using the academic competencies of nearly 2.5 million adolescents across 85 countries and economic regions, we provide the largest analysis of sex differences in intraindividual academic strengths available to date and test the stability of the gender-equality paradox for these strengths. Data are from five waves (2006–2018) of the Programme for International Student Assessment (PISA) in mathematics, reading comprehension, and science literacy. We began with an assessment of sex differences in overall scores across countries and waves. Sex differences in reading consistently favor girls, whereas sex differences in mathematics and science are generally small and favor girls in some contexts but boys in others. At the same time, sex differences in intraindividual strengths are stable, and their assessment provides a more nuanced understanding of academic-achievement patterns than does a sole focus on absolute levels (Balducci, 2023). Accordingly, we focused on sex differences in intraindividual strengths across time, and as related to indices of gender equality and wealth.
Social-constructivist theories predict that sex differences will decrease as more educational, political, and other opportunities are provided for women. However, a paradox has emerged: in many gender-equal, wealthy societies, sex differences are instead larger. This is particularly relevant for understanding why women are still underrepresented in science, technology, engineering, and mathematics (STEM) fields, even, and especially so, in more gender-equal countries. One of the main contributing factors is sex differences in intraindividual academic strengths, favoring girls in reading and boys in mathematics and science. Across 2.5 million adolescents, 85 nations, and 15 years—five waves of the Programme for International Student Assessment (PISA)—we confirm these sex differences and find that the gap for reading and science is larger in gender-equal, wealthy nations. Our results have significant theoretical and practical implications for understanding the underrepresentation of women in STEM fields.Statement of Relevance
Method
The study reported in this article was not formally preregistered. Data, along with code books, can be accessed at https://www.oecd.org/en/about/programmes/pisa.html. Requests for data-analysis scripts can be forwarded to the lead author at marco.m.balducci@utu.fi. The research meets the ethical guidelines and legal requirements of the authors’ universities and the countries in which they are based.
Study design and sample
The stability of the gender-equality paradox in intraindividual strengths was assessed using data from five PISA waves—that is, 2006, 2009, 2012, 2015, and 2018. Previous waves were not considered because the Global Gender Gap Index from the World Economic Forum was not available before 2006 (see below). The number of participating countries and regions differed between PISA assessments and ranged from 57 in 2006 to 77 in 2018. To avoid double-counting, we excluded regions for which we had data for the country as a whole: Perm (Russia) in PISA 2012; several Spanish regions, as well as Massachusetts and North Carolina (United States), in PISA 2015; and Moscow and Tatarstan (Russia) in PISA 2018.
The final sample included 2,470,874 adolescents from 75 countries as well as 10 municipalities and regions for which whole-country data were not available. These included Indian Himachal Pradesh and Tamil Nadu; Miranda–Venezuela (PISA 2009); Buenos Aires (PISA 2015); and Hong Kong, Macao, and Chinese Taipei (in all five PISA waves). China unofficially participated in PISA from 2009 on, but initially only with Shanghai and then with three more provinces (Beijing, Jiangsu, and Guangdong) in 2015 and 2018. All Chinese provinces were combined by PISA. We also merged the Indian Himachal Pradesh and Tamil Nadu regions in PISA 2009 (see Table S1 in the Supplemental Material available online).
Of note, throughout the article, we refer to sex differences rather than gender differences. This choice is influenced by the structure of the PISA survey, in which respondents were presented with a binary option, either male or female. This categorization would have not allowed a comprehensive analysis of self-reported gender differences in intraindividual strengths, as gender is multidimensional and extends beyond a binary classification.
Measures
PISA
PISA is an international educational assessment administered every 3 years by the Organisation for Economic Co-operation and Development (OECD). The assessment includes 15- and 16-year-olds (range: 15 years, 3 months to 16 years, 2 months) and indexes how well students can apply their knowledge in mathematics, reading comprehension, and science literacy.
The PISA involves a two-stage sampling strategy. For each participating country, the PISA consortium systematically selects a representative sample of schools while considering regional diversity. Then, within each school, students are chosen with equal probability to ensure a comprehensive representation of the target population. Answering all PISA items would require over 6 hr; thus, students are randomly assigned one of the several subquestionnaires for a 2-hr assessment. The subquestionnaire covers all three academic areas and includes items on other individual and family dimensions (e.g., family wealth; see below).
PISA’s main aim is to draw inferences about the target population within each country rather than assess individual performance (OECD, 2009). To achieve unbiased estimates at the country level, student competencies in mathematics, reading comprehension, and science literacy are drawn from a set of plausible values. Plausible values (PVs) are random values generated from the posterior distribution of real test scores that likely have the same latent distribution of the measured academic skills. Using the Rasch model, plausible values are scaled so that the mean for the OECD countries is 500 points with a standard deviation of 100 points. In 2006, PISA did not collect data for reading comprehension in the United States. Similarly, PVs were not available for Vietnam in the PISA 2018 sample. Kosovo was also removed from PISA 2015 and 2018, because data were available only on a regional level.
Note that some changes occurred in the PISA assessment across the five waves included here. For 2006, 2009, and 2012, a set of five plausible values was used to measure student academic performance. This increased to 10 plausible values for 2015 and 2018. In 2015, the traditional PISA paper-based assessment was replaced by a computer-based assessment in most participating countries. The latter does not allow students to return to a question once it has been answered or skipped. Last, reading comprehension in 2018 was measured with a novel two-stage adaptive testing methodology. Students were first evaluated with a core set of questions; then they were assigned a test with comparatively harder or easier questions.
Gender equality
The Global Gender Gap Index (GGGI) has been published by the World Economic Forum since 2006. Using 14 key indicators, it evaluates countries’ achievement and development toward gender equality across four domains, namely economic participation and opportunity, educational attainment, health and survival, and political empowerment. Each indicator ranges from 0 to 1, with 1 implying either perfect parity between men and women or men falling behind. The GGGI includes over 140 countries to date and provides the most comprehensive assessment of gender equality for a robust cross-national comparison (World Economic Forum, 2023).
The GGGI was explicitly developed to assess country-level gaps in women’s and men’s participation in the four noted domains and to inform public policy directed at closing these gaps (Hausmann et al., 2006). However, it has been criticized for not directly measuring the most academically important gender-equality subdomains (e.g., the proportion of women in research; Else-Quest et al., 2010) and for discounting difficulties faced by boys and men (e.g., Stoet & Geary, 2019). Some have also argued that the GGGI oversimplifies gender equality and that more domain-specific indices should be preferred (e.g., earned income, share of executive positions; Else-Quest & Grabe, 2012). Although using subfacets of the GGGI or domain-specific indicators could be useful in some contexts, overall GGGI scores better capture attitudes toward gender equality and opportunities that could influence men’s and women’s freedom of choice on a national level. Stoet and Geary’s (2019) effort to highlight boys’ and men’s disadvantages is also relevant at times, but their index does not include the economic and political gaps that are main components of the GGGI. Last, domain-specific indicators or other measures are likely to be available only for a small number of countries. For these reasons, we concluded that the GGGI better represents overall national levels of gender equality than do individual subfacets, domain-specific indicators, or alternative measures; it also has significantly broader country coverage.
In the PISA country samples, the GGGI scores ranged from 0.583 for Turkey in 2006 to 0.881 for Iceland in 2015; GGGI scores are highly stable across waves (r ≥ .85). For analyses on gender equality, we omitted countries without GGGI scores or whose assessment was based only on regional or municipality samples. For the latter, national GGGI values (when available) may not reflect gender equality in the assessed regions. As a result, our final GGGI samples ranged from 49 countries in PISA 2006 to 71 countries in PISA 2018 (see Table S2 in the Supplemental Material).
Wealth
Stoet and Geary (2018) argued that the gender-equality paradox in STEM fields arises in part because many women in developing nations appear to enter these fields for economic reasons. Thus, we considered the contribution of wealth on the gender-equality paradox in addition to the GGGI. PISA does not include a direct measure of economic prosperity at the country level. However, data on family wealth are provided and indirectly imputed from responses to a set of questions included in the student questionnaire. Students are asked whether they have a room of their own, an Internet connection, and one or more items from a specified list. Answers to these questions are then translated into an index (WEALTH) reflecting household possessions.
We used this index to derive a measure of economic prosperity at the country level. To do so, we first calculated, for each country, the weighted mean of the index (using the student weights) to generate a new variable named “country wealth.” Then we standardized the new variable (M = 0, SD = 1) across countries on a wave-by-wave basis. Note that for Albania in PISA 2015, we had no data on family wealth, and the country was thus omitted from the associated analysis in this wave.
Our wealth measure provides a more direct assessment of the resources available to students at the country level than do broader, more traditional indices, such as gross domestic product (GDP). The PISA wealth index also predicts adolescents’ occupational interests, including STEM, across and within nations (Stoet & Geary, 2022). In any case, our wealth measure substantially correlates (r ≥ .80) with GDP per capita based on purchasing-power parity (constant 2017 international dollars) from the World Economic Forum.
Analyses
Computing intraindividual strengths
As mentioned, PISA provides individual-level scores in mathematics, reading comprehension, and science literacy as PVs. We used these PVs to compute each participant’s relative overall performance and then determined their best, second-best, and lowest academic scores (i.e., intraindividual strengths). Of note, intraindividual strengths differ from “ability tilt” (see, e.g., Wai et al., 2018). Intraindividual strengths compare participants’ mathematics, reading, and science scores with their overall performance, whereas ability tilt compares two subjects with one another, such as mathematics versus verbal skills. To compute the intraindividual strength scores, we followed the same procedure as in Stoet and Geary (2018). The analysis was conducted individually for each PV before averaging the results (OECD, 2009):
1. Data were standardized by country and PISA wave so that each academic subject within a country had a mean of 0 and a standard deviation of 1. The new standardized scores for each participant were named zMath, zReading, and zScience.
2. We computed, for each participant, the standardized mean performance across subjects and called this zGeneral.
3. Then we estimated individual intraindividual strengths as the difference between zGeneral and the academic z scores. For instance, intraindividual math strength equals zMath – zGeneral. The same procedure was carried out for zReading and zScience.
4. In the end, we calculated the average intraindividual performance in mathematics, reading, and science for both boys and girls by country and PISA wave. Intraindividual scores for boys and girls were then subtracted from one another to obtain the sex differences in intraindividual strength at the country level.
● To illustrate the steps, consider the first PVs for one Italian student from the 2018 PISA wave. The student had PVs of 710, 665, and 542 in mathematics, reading, and science, respectively. These scores were standardized across all students from Italy, yielding zMath = 2.39, zReading = 1.96, and zScience = 0.76. Then, for the same student, we computed the mean performance by averaging his PVs to obtain a score of 639. This mean performance was also standardized within the country and resulted in zGeneral = 1.83. Next, for the student’s standardized academic subject z scores, we subtracted his zGeneral and again standardized, within Italy, the resulting differences. We obtained the following intraindividual strengths for the first PVs: math = 1.46, reading = 0.35, and science = −3.33. This means that the gap between the students’ zMath score, for instance, and the student’s zGeneral was 0.56 (2.39 – 1.83). A gap of this size was 1.46 SDs above the mean for Italian students.
In our example, the student had particularly high PVs, especially in mathematics and reading, and a zGeneral that deviated nearly two SDs from the national mean. Also, this individual’s zScience score was above the national mean, but the gap between zScience and zGeneral was large (> 3 SDs below the mean gap). In other words, this student’s zScience was substantively below expectations, as indicated by his zGeneral, relative to other Italian students.
Analytical strategy
The analytical strategy included four components. All analyses were carried out using the statistical software STATA 17 and an alpha criterion of .05. We also closely followed the PISA recommendations for data analyses with complex survey data (OECD, 2009):
We started by testing for sex differences in mean academic scores. Sex differences were computed by running a series of linear regression models using the command repest provided by PISA. This command considers the clustering of PISA data (with students nested into schools), using balanced repeated replication (BRR) weights. In other words, we accounted for sampling error to obtain unbiased standard errors. The aim was to contrast the patterns of sex differences in mean academic scores and intraindividual strengths, thereby emphasizing the significance of the latter in the analysis of sex disparities in STEM fields.
Then, sex differences in intraindividual strengths were independently assessed for every PISA wave. This approach allowed us to use all available data in each wave, including countries that only participated in one or a few waves (countries that would otherwise be excluded). Using the procedure described above, we computed the mean intraindividual scores in mathematics, reading, and science for both boys and girls at the country level and derived the related sex differences by subtracting boys’ from girls’ scores.
Third, we assessed whether the gender-equality paradox in intraindividual strengths was consistent across PISA waves and explored whether this was linked to the wealth measure. We used both Spearman’s ρ correlation (rs) and ordinary least squares (OLS). For OLS, we used regression models employing a bootstrap method with 1,000 iterations of the type:

where
4. In the fourth component, we assessed temporal changes in the relation between the GGGI, wealth, and sex differences in intraindividual strengths (Fors Connolly et al., 2020). For this analysis we used only countries included in all five PISA waves and linear regression models with country as a fixed effect to identify changes over time. Here, we subtracted the zReading scores for boys from the scores for girls to compute the relative sex differences in reading as an intraindividual strength at the country level. Scores were then multiplied by −1 so that higher values indicate an advantage for girls. We did the same for mathematics and science literacy, where higher scores indicate instead a relative advantage for boys. Note that these scores represent the magnitude of girls’ and boys’ advantages in reading, mathematics, and science as intraindividual strengths, whereas those in the second component focus on sex differences in the raw intraindividual strength scores (not the gap between these scores for girls and boys).
In the third and fourth components, GGGI and wealth were the main predictors and were first assessed separately and then in the same model. All variables were standardized to make regression coefficients interpretable.
Results
Sex differences in mathematics, reading comprehension, and science literacy
We first tested for sex differences in mean mathematics, reading, and science scores at both the wave and country level. Wave-by-wave sex differences in mean (across countries) mathematics, reading, and science scores are shown in Figure 1; positive values indicate an advantage for boys, and negative ones indicate an advantage for girls.
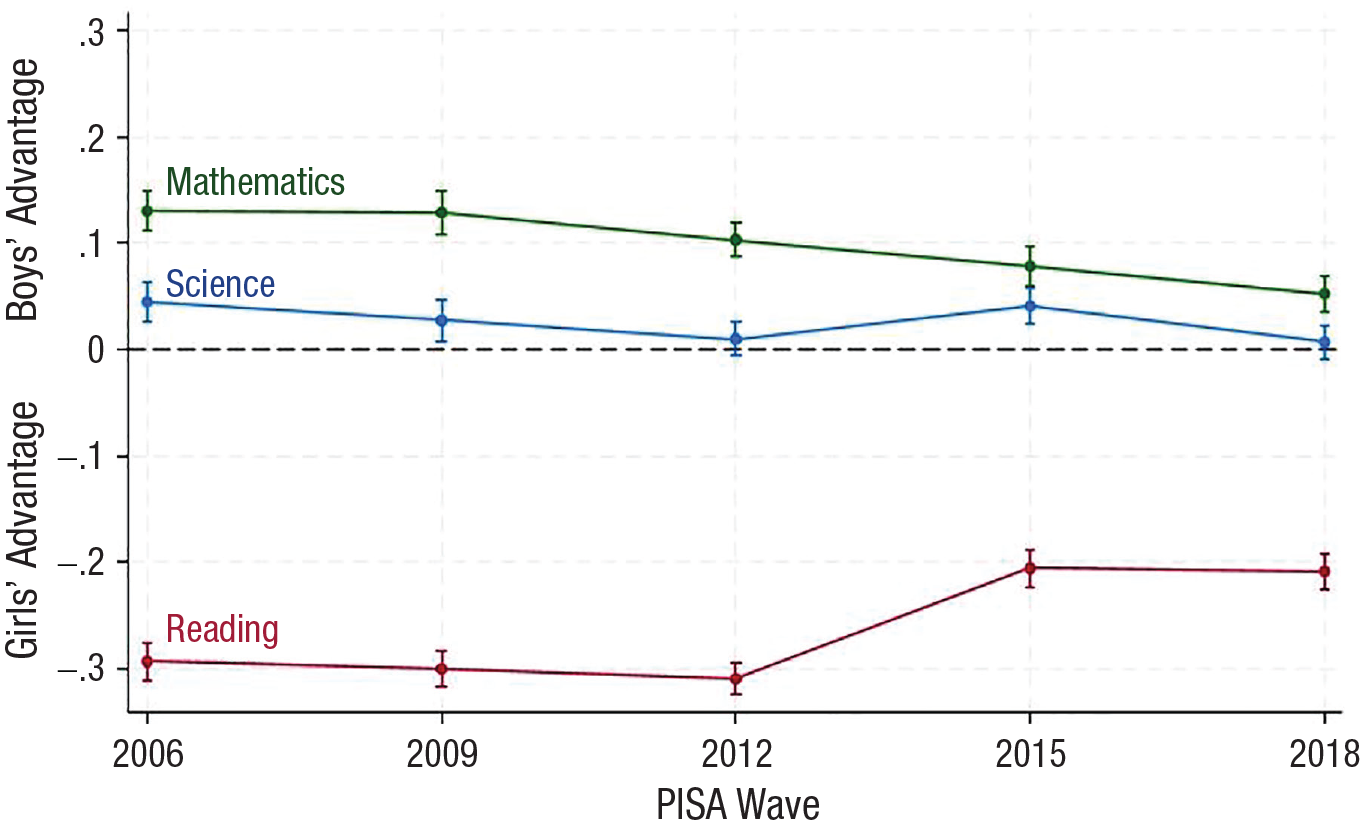
Standardized mean sex differences (± SEM) in mathematics (green), reading comprehension (red), and science literacy (blue) across PISA waves. Positive values indicate an advantage for boys, and negative values an advantage for girls. PISA = Programme for International Student Assessment.
Boys, on average, scored slightly but consistently higher than girls in mathematics across all five waves, although the advantage was lower in more recent assessments. Coefficients ranged from 0.05 SDs in PISA 2018 (95% confidence interval, or CI = [0.04, 0.07], p < .001, n = 77) to 0.13 SDs in PISA 2006 (95% CI = [0.11, 0.15], p < .001, n = 56). However, we found substantial variation across countries. For instance, in PISA 2006, girls had an advantage in one country (Qatar) and boys an advantage in 34 (60.7%), but sex differences were not statistically significant in 21 countries (37.5%). In PISA 2018, girls had an advantage in 13 (16.9%) countries, whereas boys outperformed girls in 31 countries (40.3%); 33 countries (42.9%) showed no differences.
Conversely, in all five PISA waves, girls outperformed boys in reading (overall, across countries). There was a slight decrease in the sex gap in the last two waves, although coefficients were stable over time, ranging from −0.21 SDs in PISA 2018 (95% CI = [−0.23, −0.19], p < .001, n = 77) to −0.31 SDs in PISA 2012 (95% CI = [−0.32, −0.30], p < .001, n = 64). Girls’ advantage in reading was significant for every country and wave. The smallest sex difference was for Peru in 2015 at −0.01 SDs (95% CI = [−0.17, −0.00], p = .045), whereas the largest was for Jordan in 2012 at −0.81 SDs (95% CI = [−0.95, −0.68], p < .001). Note that the narrowing of the sex gap in reading comprehension in the 2015 and 2018 waves could reflect differences in the country sample between waves or the above-described changes in the PISA reading assessments, or both.
Like mathematics, boys had an advantage in science in all five waves (overall, across countries), but this was not significant for PISA 2012 or 2018. Again, we observed substantial variation across countries. For PISA 2006, boys had an advantage in science literacy in eight countries (14.3%), and girls an advantage in 12 countries (21.4%), and there was no difference in 36 countries (64.3%). Similarly, in PISA 2009 boys had an advantage in 12 countries (16.4%), girls had an advantage in 26 countries (35.6%), and there were no differences in 35 countries (48%). Last, the results were more balanced in PISA 2015, with 24 (34.8%), 20 (29%), and 25 (36.2%) countries showing an advantage for boys, an advantage for girls, and no significant differences, respectively. Note that the pattern of sex differences in mean science scores and those in science as an intraindividual strength often diverge. Although boys and girls might not differ much in their average mathematics and science scores, boys are more likely than girls to have mathematics or science as an intraindividual strength (see below).
Sex differences in intraindividual academic strengths
For each country and wave, we computed the sex differences in mathematics, reading, and science as an intraindividual strength and replicated previous findings (Stoet & Geary, 2013, 2018).
The pattern, with reading as an intraindividual strength for girls and both mathematics and science as an intraindividual strength for boys was stable across countries and waves. Relative to their overall academic performance, girls scored higher in reading than in mathematics or science, whereas boys displayed the opposite pattern. With no exceptions, we found that sex differences in mathematics as an intraindividual strength favor boys across waves and countries. The largest sex differences were found in Montenegro in PISA 2009, where boys had a 1 SD relative advantage, and the smallest were found in the Philippines (0.11 SD) in PISA 2018.
Reading as an intraindividual strength favored girls in each country and wave. The smallest gap emerged in Austria in PISA 2012 (−0.13 SD), and the largest in Germany, again in PISA 2012 (−1.23 SD).
The sex gap in science as an intraindividual strength consistently favored boys. The only exceptions were found for the United States in PISA 2006 (potentially because of data-collection issues, below), Jordan in PISA 2009 (girls had an advantage, SD = 0.06), and Lebanon in PISA 2015 (girls had an advantage, SD = 0.03). With these exceptions, boys’ advantage across countries and waves ranged from 0.02 SD for Albania in PISA 2012 to 0.68 SD for Norway in PISA 2015.
The sex differences in mean mathematics and science scores and those for mathematics and science as intraindividual strengths often diverged. For PISA 2006, for instance, boys outperformed girls in science in eight out of 56 countries, whereas girls outperformed boys in 12 countries (Fig. 2a). At the same time, science was an intraindividual strength for boys in 55 of 56 countries (the United States was the one exception), as shown in Figure 2b. Also, note that sex differences in overall mathematics, reading, and science scores are consistently much smaller than sex differences computed as intraindividual strengths.
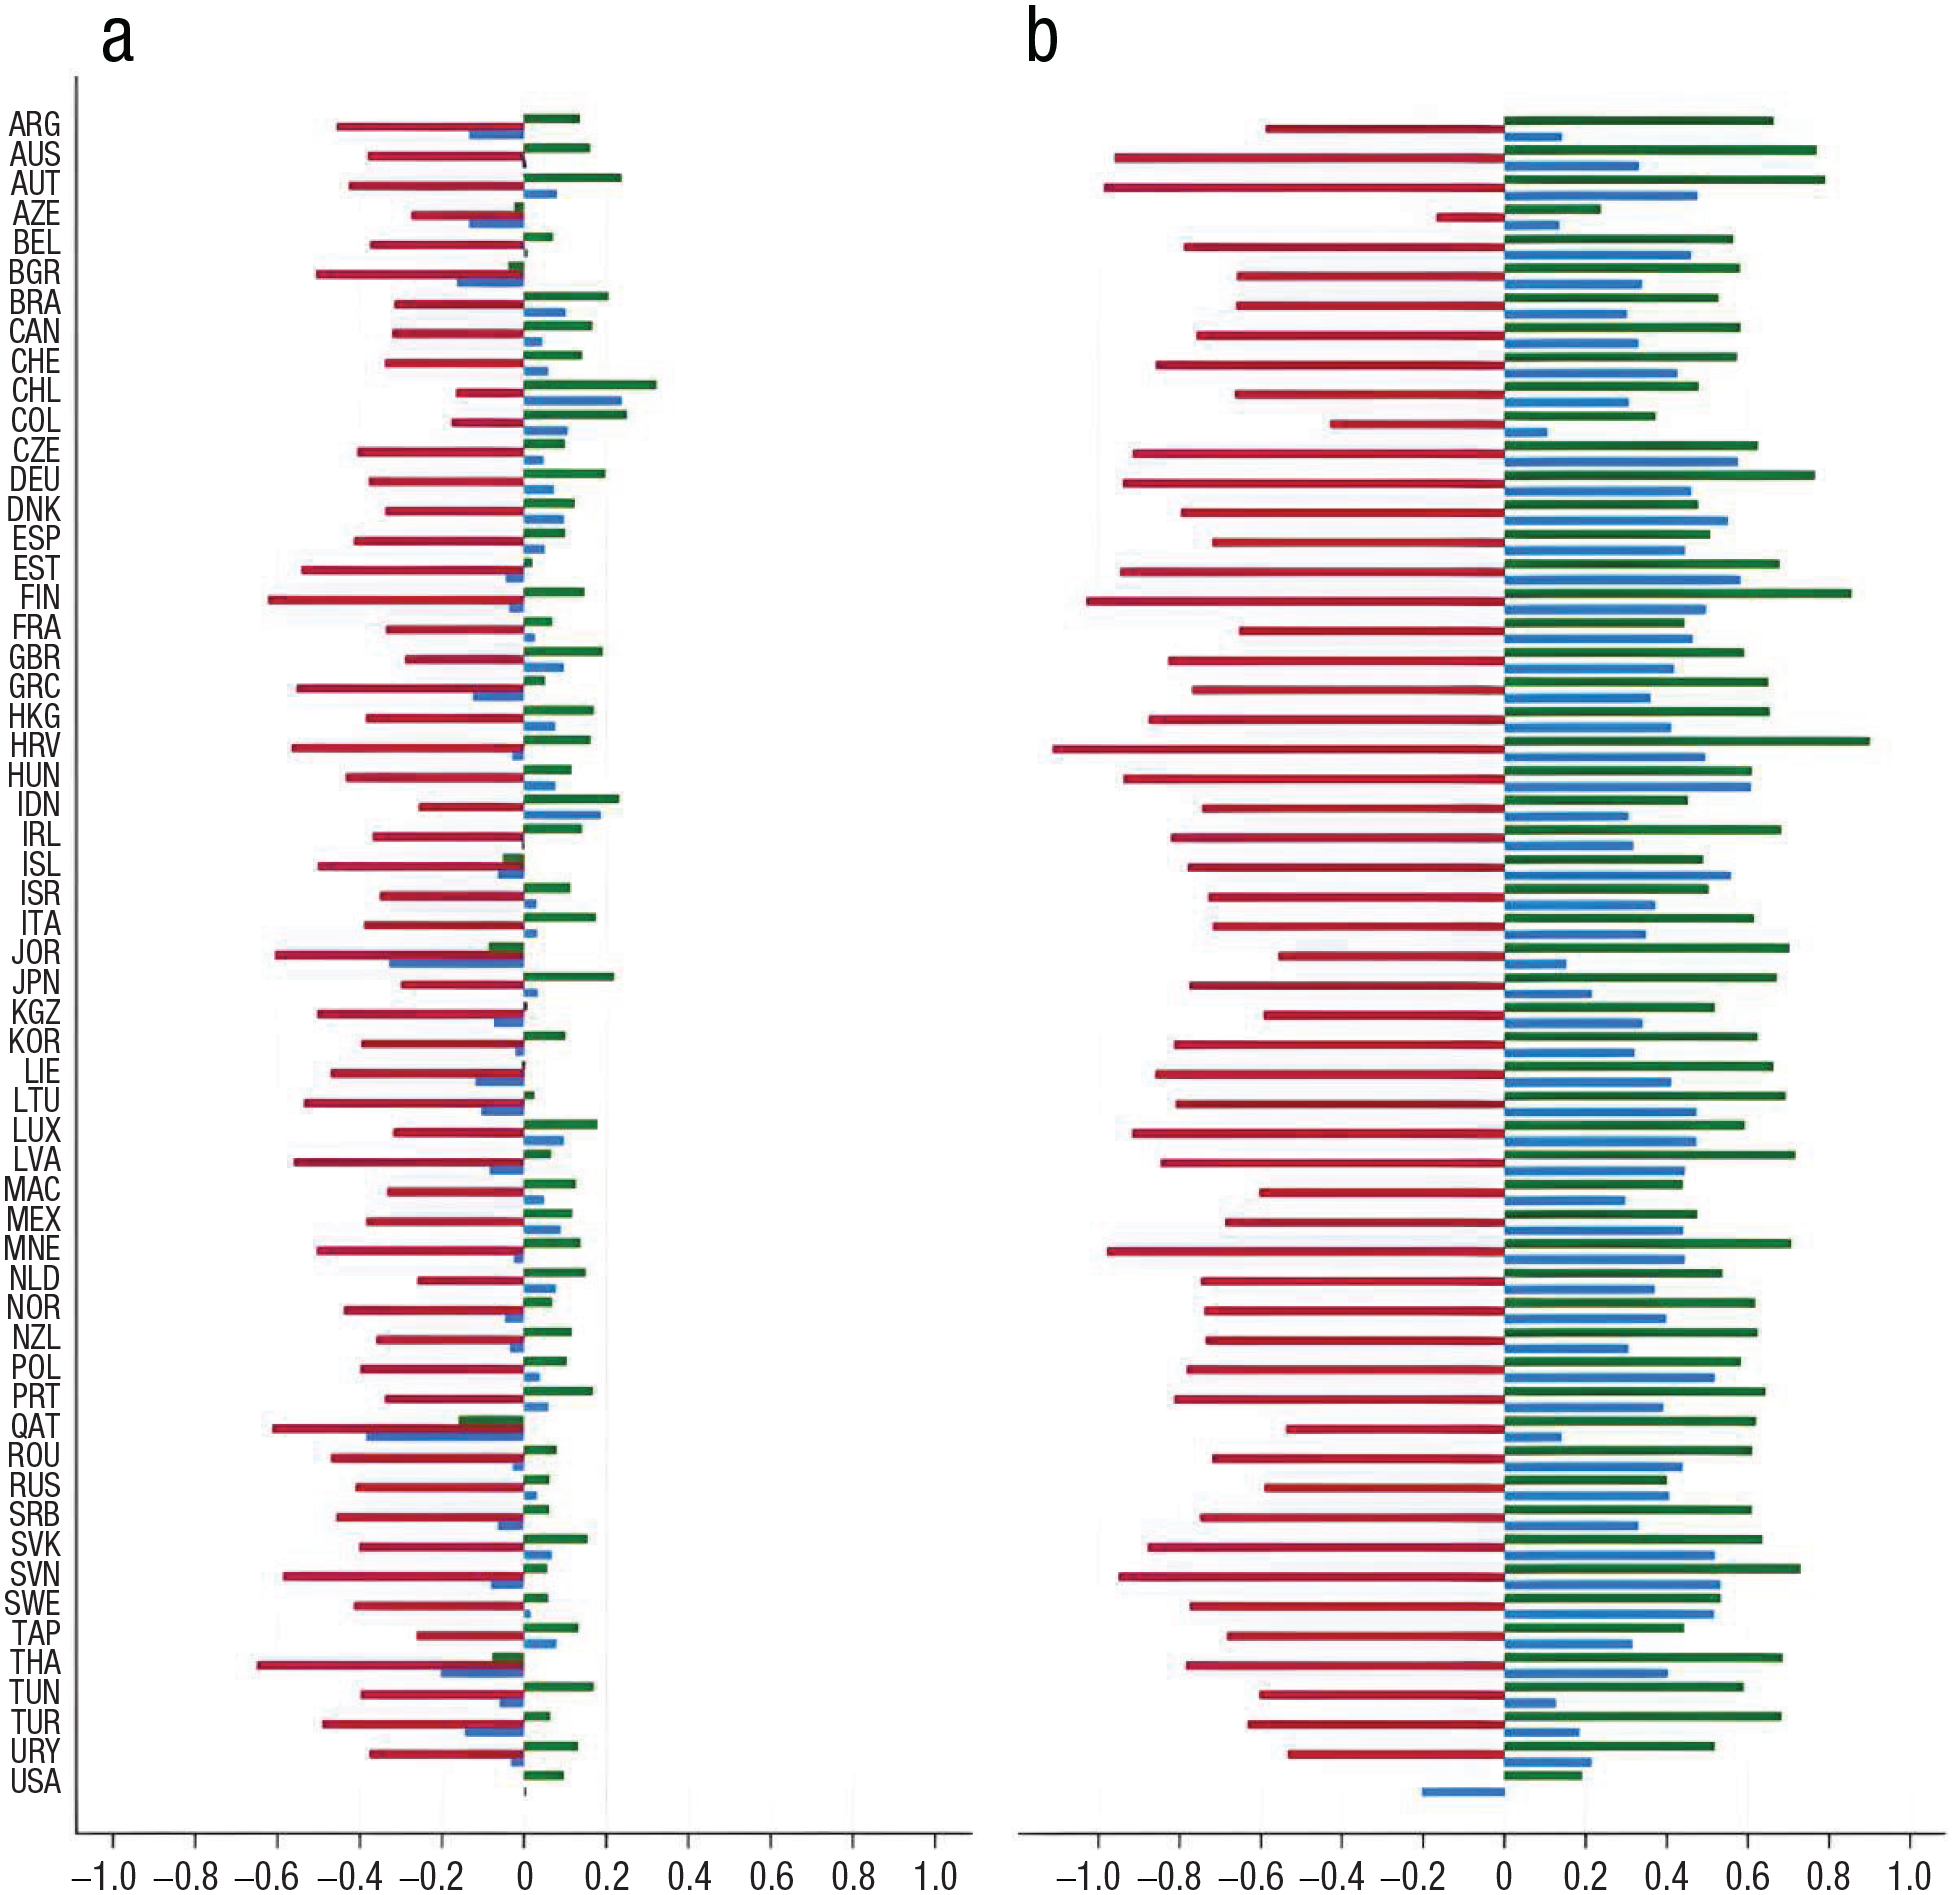
Sex differences in mathematics (green), reading (red), and science (blue) as mean overall scores (a) and as intraindividual strengths (b) in PISA 2006. Both graphs are expressed as SDs; values below 0 indicate an advantage for girls. See the Supplemental Material for country names (Table S1) and other PISA waves (Fig. S1). PISA = Programme for International Student Assessment.
There is another interesting pattern emerging from this first analysis. Across the five PISA waves, the country with the largest sex differences in intraindividual reading and science strengths was also characterized by high levels of gender equality (i.e., high GGGI scores), whereas the country with the smallest sex differences had relatively low GGGI scores. For instance, Iceland boasts the world’s highest GGGI scores and had the largest gaps in science as an intraindividual strength (SDs = 0.44–0.65) in three of the five PISA waves (2009, 2012, and 2018).
In contrast, countries with low GGGI scores showed the smallest gaps in science as an intraindividual strength—Colombia, Azerbaijan, Albania, Romania, and Turkey in PISA 2006, 2009, 2012, 2015, and 2018, respectively (SDs = 0.02–0.11). However, this pattern was not observed for mathematics as an intraindividual strength.
Sex differences and gender equality across waves
Stoet and Geary (2018) showed that sex differences in mathematics as an intraindividual strength do not appear to be related to country-level gender equality. We confirmed this finding with our sample; the relation between GGGI and sex differences in mathematics as an intraindividual strength was not significant for any of the PISA waves (see the Supplemental Material for more details).
Replicating previous research (Stoet & Geary, 2018), the magnitude of girls’ advantage in reading as an intraindividual strength was larger in countries with higher GGGI scores in all five PISA waves; the correlations ranged from rs = .25 for PISA 2018 (95% CI = [.02, .48], p = .04, n = 70) to rs = .45 for PISA 2015 (95% CI = [.27, .62], p < .001, n = 63). The magnitude of boys’ advantage in science as an intraindividual strength was also larger in countries with higher GGGI scores; the correlations ranged from rs = .23 for PISA 2018 (95% CI = [−.02, .49], p =.05, n = 70) to rs = .58 for PISA 2012 (95% CI = [.38, .78], p < .001, n = 57; see Fig. 3).
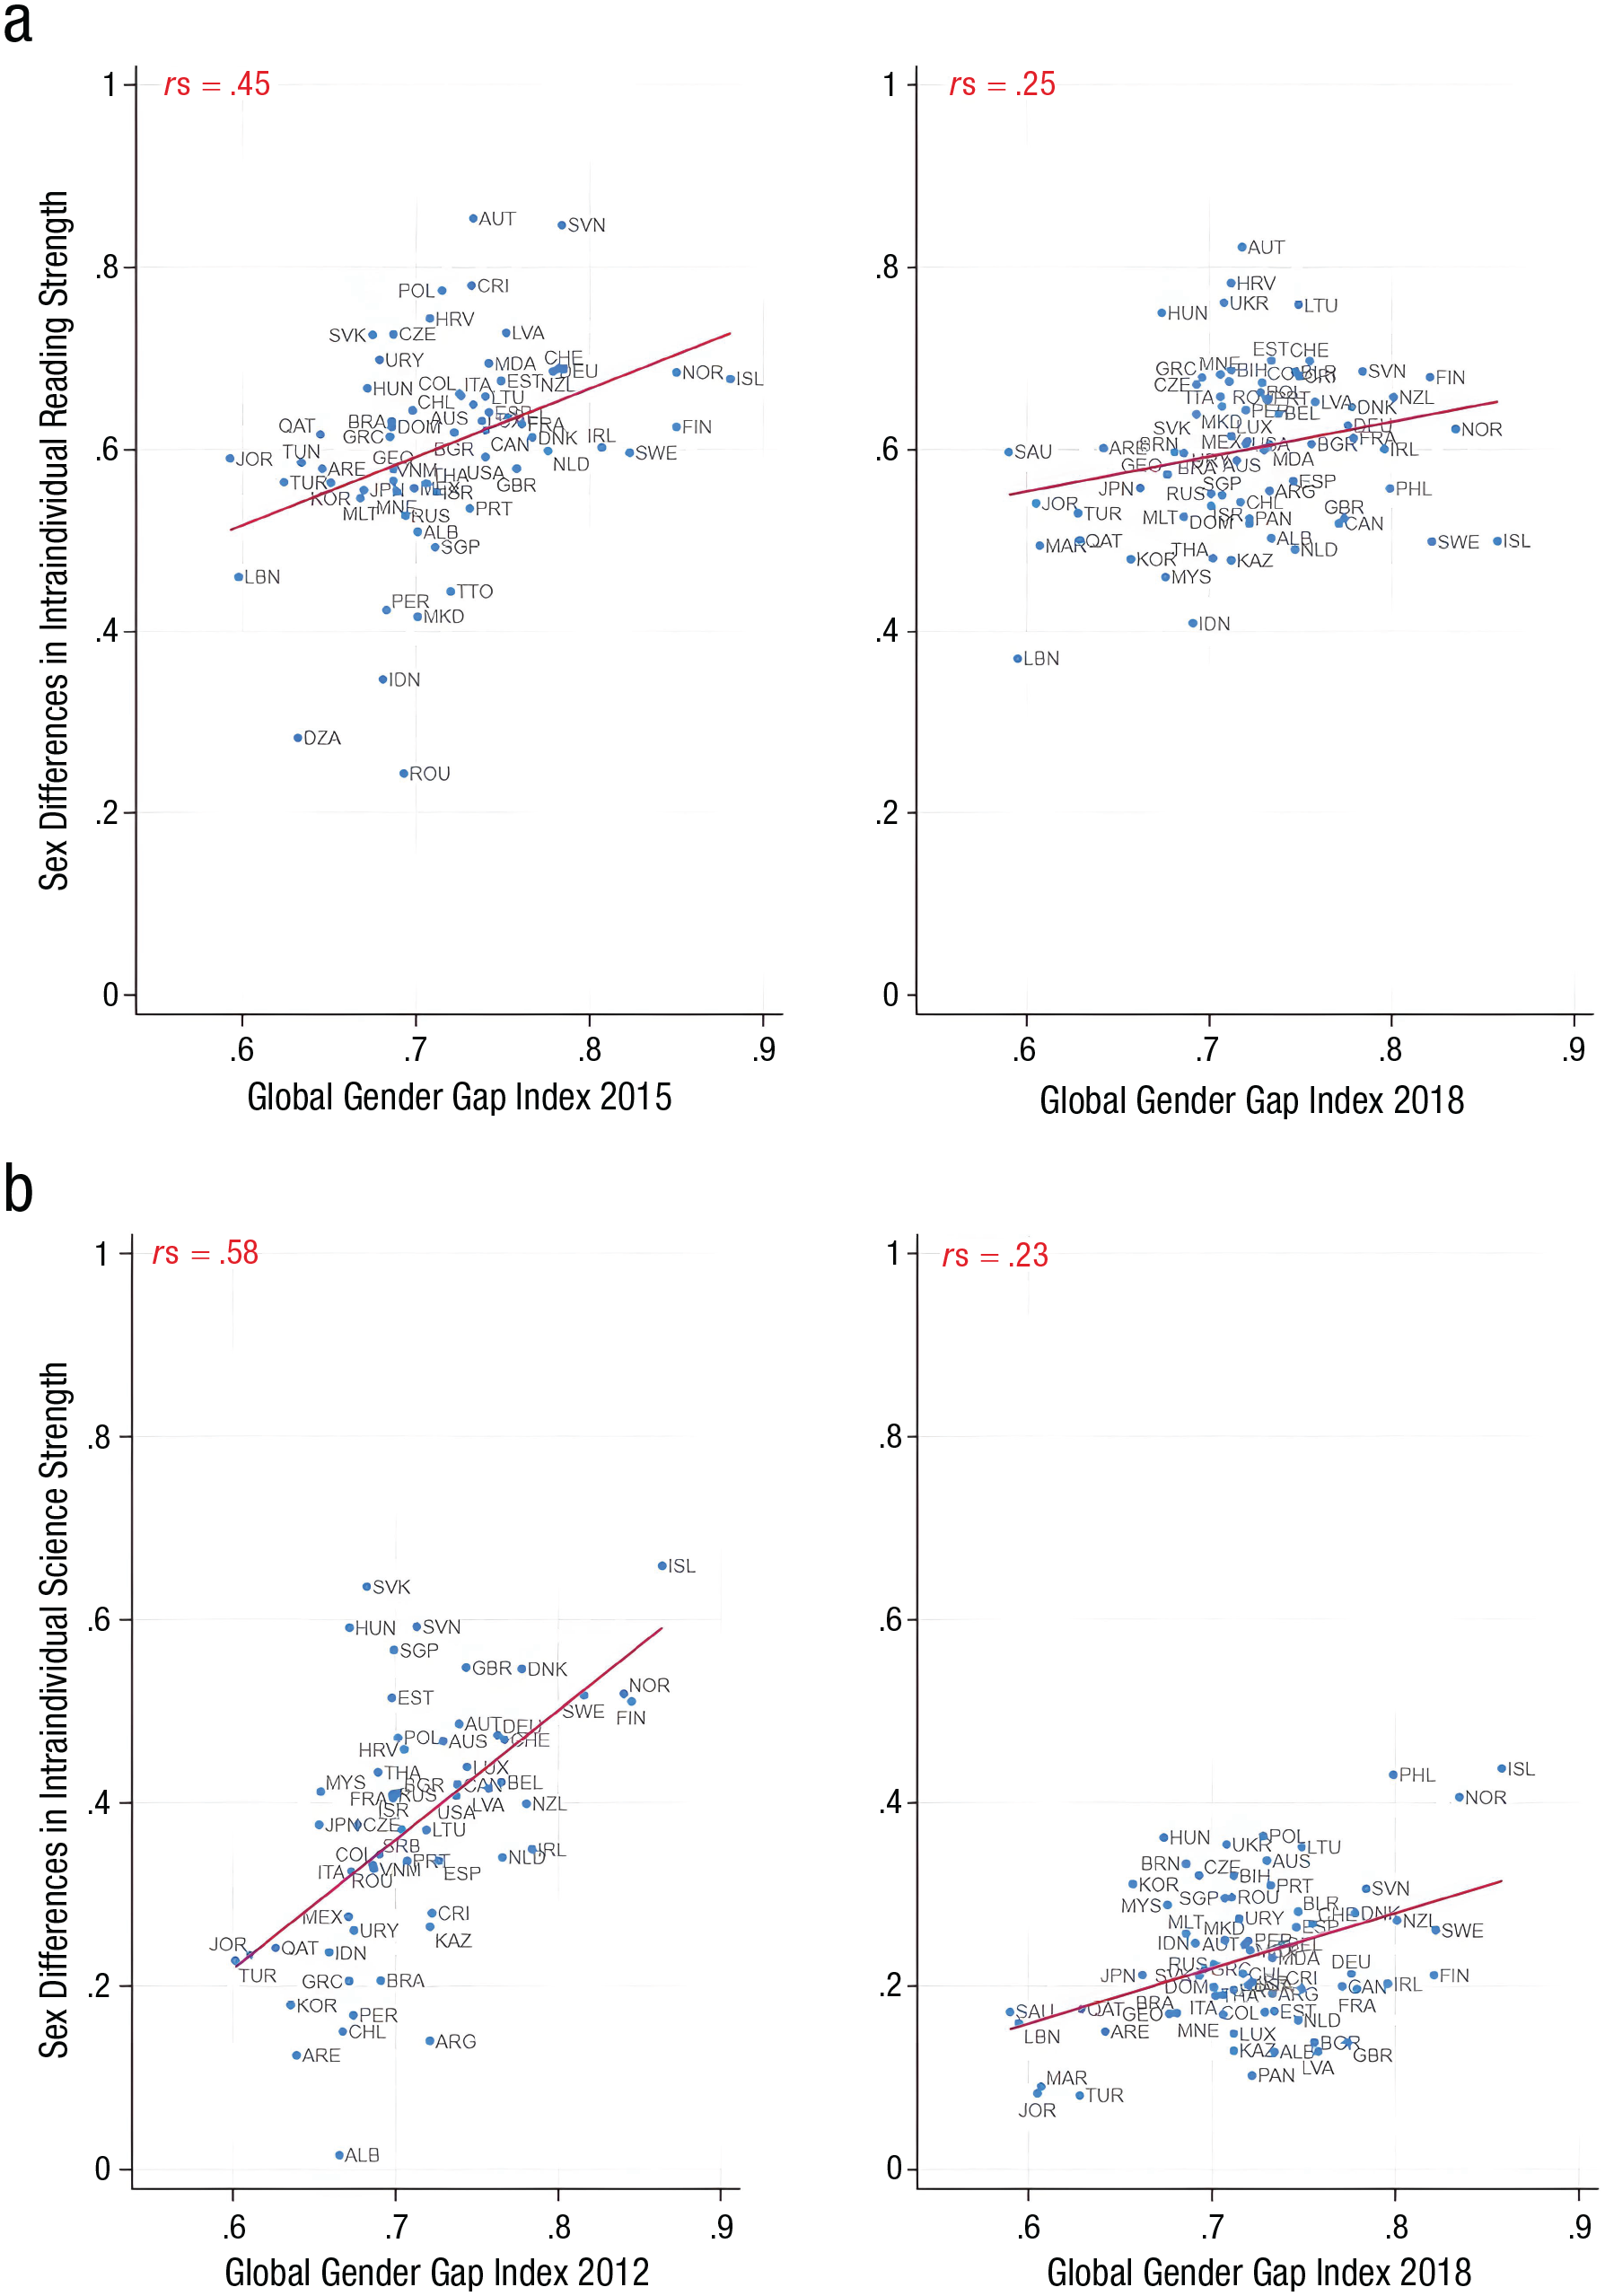
Sex differences in reading (top) and science (bottom) as an intraindividual strength and their relationship with the Global Gender Gap Index (GGGI). Highest and lowest rs across waves are reported for both reading and science. See the Supplemental Material for country names (Table S1) and the complete record of Programme for International Student Assessment (PISA) waves (Fig. S2).
We found similar results for the wealth measure. Overall, there was no relation between wealth and sex differences in mathematics as an intraindividual strength, although the bivariate association was significant in PISA 2009 (rs = .30, 95% CI = [.06, .54], p = .02, n = 64) and a trend in PISA 2018 (rs = .24, 95% CI = [.02, .47], p = .05, n = 71). Conversely, countries that were higher in wealth showed larger gaps between girls and boys in reading and science as intraindividual strengths, but the pattern was less consistent than for the GGGI. For reading, the correlation was not statistically significant in PISA 2018, nor for science in PISA 2015 and PISA 2018. Notably, girls’ advantage in reading as an intraindividual strength was more strongly related to wealth than to GGGI in four PISA waves (the correlations with wealth ranged from rs = .27, 95% CI = [.03, .49], p = .04, n = 62, in PISA 2015 to rs = .58, 95% CI = [.40, .76], p < .001, n = 64, in PISA 2009). Stated differently, wealth seems to be more strongly related to the sex differences in reading as an intraindividual strength, whereas GGGI seems to be more strongly related to the sex differences in science as an intraindividual strength. To check the robustness of this finding, we ran the same analysis using GDP per capita based on purchasing-power parity (constant 2017 international dollars) from the World Economic Forum and found substantially similar results (see Table S3 in the Supplemental Material).
Next, we explored the relation between sex differences in reading and science as intraindividual strengths and country-level GGGI scores and wealth (first separately and then in combination) using OLS models. Our results mirror those reported above. Sex differences in reading as an intraindividual strength (girls > boys) were positively related to country-level gender equality. Coefficients (βs) were stable over time and ranged between 0.35 SD (p < .001, r2 = .10, n = 49) for PISA 2006 and 0.38 SD (p < .001, r2 = .13, n = 63) for PISA 2015 (see Table S4 in the Supplemental Material). Stated differently, a 1-SD increase in GGGI scores was associated with an increase of 0.35 to 0.38 SDs in girls’ advantage over boys for reading as an intraindividual strength. The only exception was PISA 2018, where the association was a trend (0.24 SD, p = .06, r2 = .04, n = 69). However, the 2018 result appears to have been driven by Iceland as an outlier, and excluding this country resulted in a pattern in line with the other PISA waves (0.30 SD, p = .01, r2 = .08, n = 68).
The same results, without exception, were observed for science as an intraindividual strength. A 1-SD increase in GGGI scores was associated with an increase of about half a standard deviation in boys’ advantage over girls for science as an intraindividual strength; βs ranged between 0.40 SD (p < .001, r2 = .15, n = 69, in PISA 2018) and 0.59 SD (p < .001, r2 = .34, n = 64, in PISA 2009). Note that in PISA 2006 there were no reading data for the United States, and the results for science as an intraindividual strength appeared to be a strong outlier in this country. We concluded that there might have been issues related to data collection in 2006 for the United States, and we decided to exclude it from the above analysis. Nevertheless, we ran the regression models with and without the United States (see Table S5 in the Supplemental Material).
Wealth displayed the same pattern and with the same remarkable stability found for reading. A 1-SD increase in wealth was associated with increases in girls’ advantage in reading as an intraindividual strength, with effects (βs) ranging between 0.25 SD (p = .03, r2 = .05, n = 68) for PISA 2018 (excluding Iceland from the sample) and 0.62 SD (p < .001, r2 = .37, n = 64) for PISA 2006. On the other hand, wealth was not related to boys’ advantage in science as an intraindividual strength for PISA 2015 and PISA 2018. In the other three PISA waves, a 1-SD increase in wealth was associated with a relatively larger advantage for boys in science as an intraindividual strength; βs ranged between 0.46 SD (p < .001, r2 = .20, n = 57, in PISA 2012) and 0.50 SD (p < .001, r2 = .24, n = 64, in PISA 2009).
As noted above, GGGI appears to be more strongly related to the sex gap in science as an intraindividual strength, whereas wealth seems to show a stronger relation with the sex gap in reading as an intraindividual strength. The same was observed in the regression models. Overall, across waves, GGGI explained more variation in the sex gap in science as an intraindividual strength; wealth explained more variation in the sex gap in reading as an intraindividual strength. For instance, wealth in PISA 2009 explained 37% of the cross-country variation in the sex differences in reading as an intraindividual strength, whereas GGGI explained only 13% of these differences. On the other hand, GGGI in PISA 2015 explained 25% of the cross-country variation in the sex differences in science as an intraindividual strength, but wealth was not associated with them.
In our full models, we included both GGGI and wealth as predictors. Except for PISA 2009, there were no significant improvements in model fit. However, when predicting girls’ relative advantage for reading as an intraindividual strength, the effect of GGGI was, in general, substantially reduced (or disappeared) when wealth was included (see Table S5 in the Supplemental Material). This pattern provides further evidence that wealth is more strongly linked than GGGI to sex differences in reading as an intraindividual strength.
The fact that GGGI and wealth did not significantly improve our models when considered together suggests that these variables do not show an additive effect but are instead related to one another (see the Discussion section).
Sex differences and gender equality across time
In the last component of our analysis, we restricted the sample to countries that participated in all five PISA waves (N = 44). We first ran the regression models on a wave-by-wave basis with the restricted sample and then a longitudinal OLS, with country as a fixed effect, to test for significant changes over time in the magnitude of the sex gaps in both reading and science as intraindividual strengths.
The within-wave results for the restricted sample substantially replicated the results presented above. There is a gender-equality paradox in reading and science as intraindividual strengths, although wealth was more strongly related than GGGI to girls’ advantage in reading as an intraindividual strength. The only exception was PISA 2018, in which the relation between girls’ advantage in reading and both GGGI and wealth was not statistically significant (see Table S6 and Table S7 in the Supplemental Material).
The coefficients for GGGI and wealth decreased in PISA 2015 and 2018 in both our extended- and restricted-sample wave-by-wave analyses. One potential reason for this result is a secular decline in the relative sex differences in intraindividual strengths. However, the decrease might be incidental. Coincident with changes in testing format, there was a substantial drop in overall performance for science literacy in PISA 2015 and 2018 for both boys and girls (Fig. 4). Also, as noted earlier, girls’ advantage in reading performance narrowed in 2015 and 2018, again possibly because of changes in the assessment.
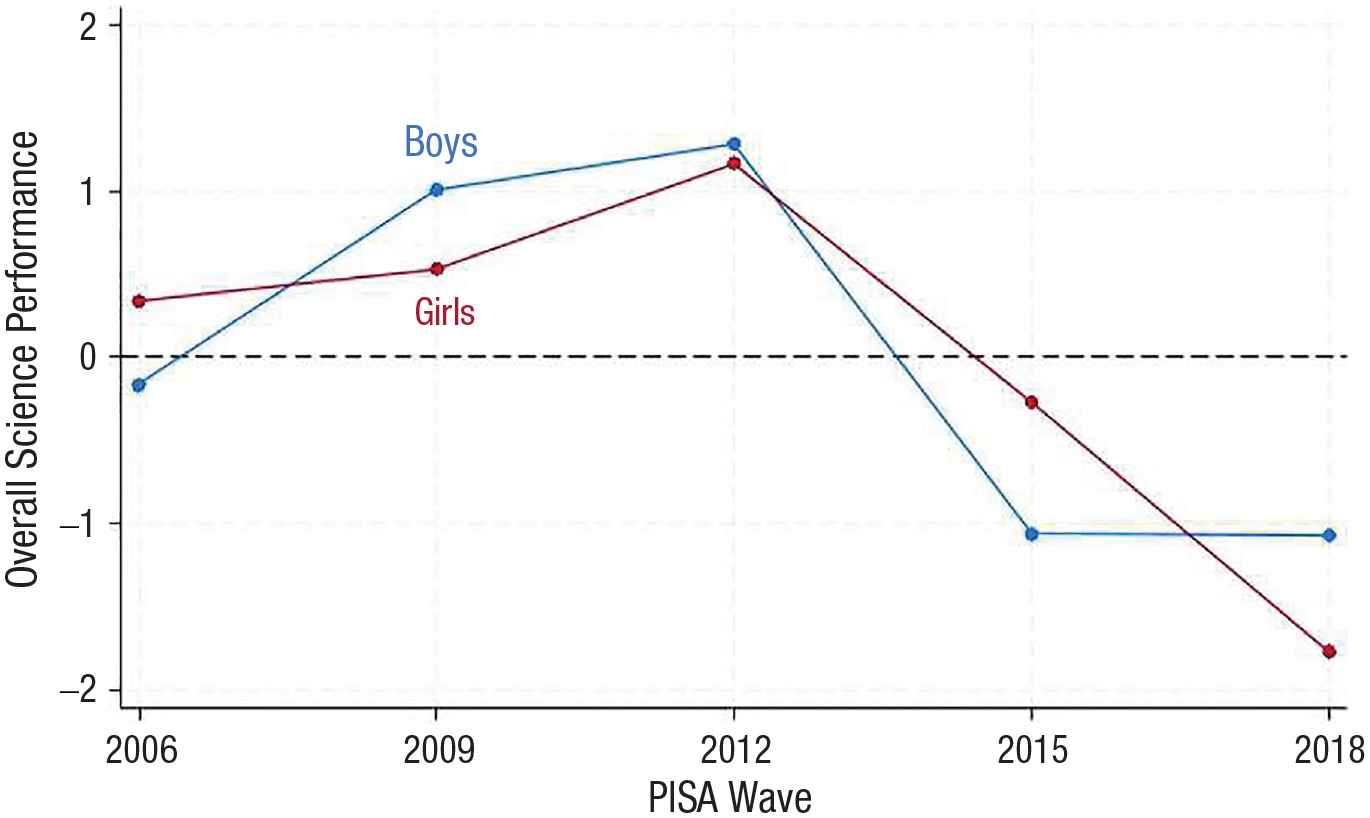
Standardized overall science performance for boys (blue) and girls (red) by PISA wave in the restricted sample. Note that the assessment format changed in 2015. PISA = Programme for International Student Assessment.
Even with the differences for PISA 2015 and 2018, there were no significant cross-wave changes in the relation between either GGGI or wealth in the prediction of sex differences in reading or science as intraindividual strengths (p > .05; see Table S8 in the Supplemental Material). In other words, the relation between GGGI and wealth and the sex differences in academic strengths was stable over time.
Discussion
We assessed sex differences in mathematics, reading, and science as intraindividual strengths across five PISA waves (2006–2018) and for nearly 2.5 million adolescents in 85 countries and regions. Following previous research, we found that girls scored better in reading than in mathematics or science, whereas boys scored better in both mathematics and science than in reading. The results were stable across waves and were universal for mathematics and reading and near-universal for science. Furthermore, sex differences in overall mathematics and science scores oscillated, but mathematics or science as boys’ intraindividual strengths were stable.
Across PISA waves, the sex differences in reading and science as intraindividual strengths increased with an increase in gender equality. The trend was similar (although less evident) for wealth, especially for science. Across waves, there were some fluctuations in the forenamed relations, potentially related to changes in assessment format. Nevertheless, the magnitude of these fluctuations was not significant across time. In contrast, sex differences in mathematics as an intraindividual strength showed no association with either GGGI or wealth, suggesting that such differences persist irrespective of country-level gender equality and economic prosperity.
The finding that sex differences in reading and science as intraindividual strengths increased with an increase in gender equality could be considered a paradox in light of social-constructivist predictions. As gender equality grows, gender roles should become less stereotypical, and any associated sex differences should become smaller—but this was not the case. Rather, our results are in line with recent research indicating that sex differences either widen or remain stable with increases in gender equality (Herlitz et al., 2024), thus providing no support for social-constructivist theories.
At the same time, the secular rise in women’s emancipation in countries with more gender equality did reduce, eliminate, and sometimes reverse sex differences in many areas. For instance, in the early 20th century there were more men than women in medicine and veterinary medicine (Winston, 1935). In more wealthy and gender-equal countries today, parity has been reached in medical-school enrollments (Pelley & Carnes, 2020), and veterinary medicine is dominated by women (Lofstedt, 2003).
Explanations
Some have argued that sex differences in STEM field participation are driven by an increase in stereotypes in countries with more gender equality, associating mathematics with boys and reading with girls (Breda et al., 2020). This explanation has theoretical as well as methodological flaws (Balducci, 2023), but certainly gender stereotypes could be a contributing factor. For instance, Dekhtyar et al.’s (2018) longitudinal study of Swedish adolescents found fewer women than expected, considering their intraindividual strengths, in technical occupations, suggesting that gender stereotypes could play a role. Nevertheless, the explanation is not likely to be substantive, as attitudes toward women’s education are more positive in more gender-equal countries (Stoet & Geary, 2020), and the secular trend is for increased acceptance of gender equality (Donnelly et al., 2016).
Our results highlighting a gender-equality paradox in intraindividual academic strengths could be due to differences in data quality between countries, generating a Simpson’s effect in which within-group differences differ from between-group patterns (Berggren & Bergh, 2023). People in different contexts might interpret questions differently, and thus researchers would not be measuring the same constructs across countries. This is certainly possible for some measures, but unlikely in our study. The PISA utilizes a standardized methodology for data collection to ensure data reliability and to achieve accurate estimates at the country level.
On the basis of expectancy-value theory, we posit that sex differences in intraindividual strengths contribute to educational and occupational sex disparities in STEM fields in countries with more gender equality (Dekhtyar et al., 2018). One explanation is that social mores (e.g., self-expression and individualism) combined with the relatively low economic costs of not pursuing a STEM field in wealthier and more gender-equal countries fully support the expressions of sex differences in factors, including intraindividual strengths, that influence educational and occupational choices.
In this vein, note that GGGI and economic development often co-occur (e.g., GDP, Löfström, 2009), and we found the same pattern across PISA waves (ρ = GGGI, wealth; r = .37–.66). However, plots of the relation between GGGI and wealth revealed there are no countries characterized by low wealth and high GGGI, but the opposite does happen.
Put differently, although wealth and relatively high GGGI scores tend to co-occur in Western democracies, they can be separate factors in other countries. The sex differences in intraindividual academic strengths are smaller in Western democracies than in other countries, suggesting that social mores contribute to the effects we found in the present study. Prior studies proposed that these mores could include social attitudes about girls’ and women’s education or, more generally, any attitude that could potentially increase the extent to which people are free to choose (Stewart-Williams & Halsey, 2021; Stoet & Geary, 2020). Our findings are in line with this prediction. Overall, our effects seem most likely to emerge in wealthy contexts with individualistic and liberal mores.
Implication
Our results provide a direct critique of social-constructivist assumptions (e.g., Else-Quest et al., 2010). There is much nuance in the relation between social mores and wider factors on the expression of sex differences (Geary, 2021). The data available in the PISA do not allow for a full exploration of these nuances, but our findings and others’ (Herlitz et al., 2024) indicate that a blanket convergence of the sexes across all traits will not follow from changes in gender equality.
Limitations and conclusion
The primary limitation is the correlational nature of the data, which precludes causal inferences. One might argue that the GGGI does not fully capture gender equality and that our results and others’ therefore do not provide strong tests of social-constructivist predictions. We agree that there are issues with the GGGI, but we note that it is more aligned with social-constructivist theories than alternative indices (e.g., Stoet & Geary, 2019). Moreover, the consistency of our results suggests that the GGGI is a reliable measure of gender equality; otherwise, we would have observed more variations across PISA waves in its association with sex differences in intraindividual strengths. Another limitation relates to how sex differences in intraindividual strengths are computed. If anything, sex differences in PISA scores are larger using raw instead of imputed scores (Wittmann, 2005), and consequently our results might underestimate sex differences in mean scores and intraindividual strengths.
Our results demonstrate that increasing the share of women in inorganic STEM fields will require more than improving girls’ mathematics or science competencies and overall gender equality. The link between intraindividual strengths and career paths suggests that incorporating this perspective into new policies could encourage more women to enter the STEM pipeline. Programs that include hands-on experiences and mentorship opportunities for talented girls may increase their likelihood of enrolling in a STEM degree program. However, achieving parity between boys and girls could be challenging, because broader factors, like sex differences in intraindividual strengths, play a role in determining sex disparity in STEM fields.
Supplemental Material
sj-docx-1-pss-10.1177_09567976241271330 – Supplemental material for The Gender-Equality Paradox in Intraindividual Academic Strengths: A Cross-Temporal Analysis
Supplemental material, sj-docx-1-pss-10.1177_09567976241271330 for The Gender-Equality Paradox in Intraindividual Academic Strengths: A Cross-Temporal Analysis by Marco Balducci, Marie-Pier Larose, Gijsbert Stoet and David C. Geary in Psychological Science
Footnotes
Transparency
Action Editor: Martie Haselton
Editor: Patricia J. Bauer
Author Contributions
References
Supplementary Material
Please find the following supplemental material available below.
For Open Access articles published under a Creative Commons License, all supplemental material carries the same license as the article it is associated with.
For non-Open Access articles published, all supplemental material carries a non-exclusive license, and permission requests for re-use of supplemental material or any part of supplemental material shall be sent directly to the copyright owner as specified in the copyright notice associated with the article.