
Abstract
Recent evidence has shown that social-media platforms like Twitter (now X) reward politically divisive content, even though most people disapprove of interparty conflict and negativity. We document this discrepancy and provide the first evidence explaining it, using tweets by U.S. Senators and American adults’ responses to them. Studies 1a and 1b examined 6,135 such tweets, finding that dismissing tweets received more Likes and Retweets than tweets that engaged constructively with opponents. In contrast, Studies 2a and 2b (N = 856; 1,968 observations) revealed that the broader public, if anything, prefers politicians’ engaging tweets. Studies 3 (N = 323; 4,571 observations) and 4 (N = 261; 2,610 observations) supported two distinct explanations for this disconnect. First, users who frequently react to politicians’ tweets are an influential yet unrepresentative minority, rewarding dismissing posts because, unlike most people, they prefer them. Second, the silent majority admit that they too would reward dismissing posts more, despite disapproving of them. These findings help explain why popular online content sometimes distorts true public opinion.
Keywords
During Justice Brett Kavanaugh’s confirmation hearings, U.S. Senator Bob Menendez tweeted that Kavanaugh’s “views on #RoevWade are nowhere near the mainstream and don’t belong on the Supreme Court. #WhatsAtStake”
This tweet expressed the Senator’s views while also dismissing his opponents’ outright, implying they are not worth considering. This message may have appealed to Senator Menendez’s followers’ moral values, which drive people to categorically reject people and positions that contravene those values (Skitka et al., 2005).
In the wake of George Floyd’s murder, Senator Dick Durbin tweeted:
We owe it to all of the Black & Brown lives we have lost to brutal acts of racial injustice to take real action to bring about justice & accountability. I hope Sen. McConnell will allow Republicans and Democrats to sit down and try to work together in good faith to reach a bipartisan agreement.
This tweet also expressed its author’s perspective, but contrasted Senator Menendez’s dismissiveness: Senator Durbin aspired to engage constructively with opponents, listening and working together on a path forward. This message may have appealed to Senator Durbin’s followers’ democratic values: For effective democracy, partisans must negotiate mutually agreeable solutions (Heltzel & Laurin, 2020).
One literature suggests that people like Durbin’s democratic approach, preferring political allies who engage positively with shared opponents (Frimer & Skitka, 2018, 2020; Heltzel & Laurin, 2021; Yeomans et al., 2020). A parallel literature finds divisive content like Menendez’s generates more positive feedback online (Rathje et al., 2021; Yu et al., 2023). Scholars have acknowledged that social media does not faithfully reflect population preferences (Rathje et al., 2023; Robertson et al., 2024). But this funhouse-mirror effect—social media’s warping of reality—remains unexplained.
We tested whether tweets like Durbin’s and Menendez’s elicit a funhouse-mirror effect: We predicted that senators’ dismissive posts would receive more Likes and Retweets on Twitter (rebranded X), but that this mischaracterizes majority preferences. We tested three explanations for the distortion, with implications for what the popularity of online content actually means. Though we test these ideas on Twitter specifically, similar funhouse-mirror effects emerge on platforms like Facebook (Rathje et al., 2021) and Reddit (Kumar et al., 2023). Our findings may apply there too; we revisit the question of generalizability later.
People May Prefer Political Leaders’ Tweets That Engage With Shared Opponents
Engaging constructively with opponents entails seeking them out. Multiple articles have found that most people prefer copartisans who seek to understand, rather than avoid, shared opponents’ views (Heltzel & Laurin, 2021; Moore et al., 2023). Engaging also requires being open to hearing opponents’ ideas. Another article found that in naturalistic (but nonpolitical) settings, people respond more positively to peers whose speech conveys receptiveness to opposing views (Yeomans et al., 2020).
Engaging also involves sustained direct interactions and cooperation. And dismissing involves more than avoiding opponents or expressing low receptiveness—it involves actively declaring them unworthy of consideration. Thus, these findings hint, but do not definitively demonstrate, that people may prefer allies to engage (rather than dismiss) shared opponents.
People express similar preferences regarding politicians and social media. Nearly all Americans say politicians should compromise, making laws through bipartisan efforts (Harbridge & Malhotra, 2011; Pew Research Center, 2019b). They also snub uncivil politicians (Feinberg & Frimer, 2023), preferring that they tweet at opponents respectfully (Frimer & Skitka, 2018, 2020). Engaging need not be civil (one can express outrage during good-faith moral debates) and dismissing can be (one can politely argue that opponents’ views are misguided). Nonetheless, this suggests an underlying preference for interparty positivity, even in feedback to politicians’ posts on social media. We therefore hypothesize that most people prefer political leaders’ engaging posts to their dismissing ones.
Statement of Relevance
Social media plays a large role in political discourse. The most popular online content tends to sow political divisions, giving the impression that most people in society generally prefer such content over constructive dialogue. The present work shows this impression is false: Divisive content’s popularity misrepresents actual majority public opinion. We also find two reasons why social media projects this distorted image. First, a minority of people are disproportionately responsible for most political social-media activity, and that minority has uncommon opinions: They tend to be political extremists who genuinely prefer divisive, dismissive content. Second, the mostly silent majority approves more of constructive cross-party engagement, but in their occasional social media use they conform to frequent users’ antagonistic norms. Thus, social media presents a warped view of public opinion, highlighting the need for caution from journalists, researchers, pundits, or anyone else wishing to draw inferences from it.
Twitter Feedback Might Reward Senators Who Dismiss Shared Opponents
Social media may not reflect this widespread preference and instead reward dismissing. People prefer receptive, civil communication and dislike negativity and division (Rathje et al., 2023), but incivility, negativity, and divisiveness attract Likes and Retweets (Brady et al., 2017; Frimer et al., 2022; Yu et al., 2023). Social media’s feedback for interparty negativity supports a second hypothesis: Twitter rewards politicians more for dismissing than engaging.
Together, these hypotheses suggest Twitter feedback distorts population preferences. We posit three explanations that draw on, and promise to theoretically illuminate, the psychologies of politics (Huddy et al., 2023) and norms (McDonald & Crandall, 2015).
Flipped preferences
First, people’s general preference for interparty positivity might not translate to politicians’ social-media posts. People might worry that an allied politician who engages will make real policy concessions (Ryan, 2017); Twitter’s antagonistic norm (Rathje et al., 2021) might make dismissing expected and therefore accepted (Eriksson et al., 2015). This flipped-preferences idea contradicts our hypothesis that people prefer their political leaders’ engaging posts. Evidence for it would point to an important boundary condition for the emerging consensus in political psychology about people’s preference for interparty positivity (e.g., Heltzel & Laurin, 2021).
Active users with unusual preferences
Second, Twitter feedback might distort public opinion because it represents only the opinions of users who actively contribute Likes and Retweets, who may be an unusual minority. Only a quarter of Americans use Twitter (Pew Research Center, 2021), and a quarter of these (~6% of Americans) post four of every five political tweets. This minority is politically extreme and antagonistic (Pew Research Center, 2022a, 2022c). Likewise, a minority of users produce most misinformation (Grinberg et al., 2019). If a similarly disruptive minority provides most feedback to political tweets, this feedback would reflect their greater enthusiasm for interparty negativity.
Support for this idea could help explain social media’s antagonistic norms. It would also build on findings that individuals who are popular (Paluck et al., 2016) or high-status (Henrich & Gil-White, 2001) disproportionately shape perceived norms. Individuals who are merely highly visible, including those willing to be vocal when the majority remains silent, may play similarly outsized roles (see Robertson et al., 2024).
Likes or Retweets ≠ endorsements
Finally, Twitter might distort public opinion if like and retweet counts do not track genuine preferences. To “like” implies approval, and most people endorse their Retweets (Metaxas et al., 2015; Pew Research Center, 2021). However, people may publicly endorse views they privately condemn (e.g., Prentice & Miller, 1996), use Likes to bookmark posts they dislike, or retweet posts ironically.
Moreover, tweets’ exposure can confound like counts (Frimer et al., 2022). Imagine a tweet with 10 views and five likes, and another with 1,000 views and 10 likes. It would be imprudent to assume that the second tweet—liked twice as often, but by only 1% of viewers compared to 50% of viewers—holds twice the appeal. Thus, we would caution observers against assuming that social-media behavior necessarily reflects genuine opinion, or that Likes portend behaviors like votes or purchases.
Contributions and Overview
We hypothesize that politicians’ tweets receive more positive feedback when dismissing opponents than when constructively engaging with them but that this misrepresents majority preferences (Studies 1a and 1b). We further seek to explain this funhouse-mirror effect (Studies 2a, 2b, 3, and 4). Is social media a unique context (Crockett, 2017) that changes people’s preferences? Are the few active users who allocate most Likes and Retweets unusual (Bor & Petersen, 2022)? Do these reactions not reflect approval (Frimer et al., 2022)? Studies 2a, 2b, and 3 were preregistered; 1a, 1b, and 4 were not. We report all data exclusions, manipulations, measures, and sample-size determinations; data, code, and preregistrations are given here.
This research complies with the Tri-Council Policy Statement (TCPS2 2014), the International Conference on Harmonization Good Clinical Practice Guideline (ICH-GCP), and the requirements of the U.S. Department of Health and Human Services as set out in the Federal Policy for the Protection of Human Subjects. The research received approval from a local ethics board (H18-02303).
Studies 1a and 1b
We compared Likes and Retweets on U.S. Senators’ tweets, coded as “engaging” versus “dismissing” using multiple strategies. Analyses were unregistered but identical across studies, with multiple robustness checks.
Method
This study and all subsequent studies were reviewed and approved by an Institutional Review Board.
We focus on social-media posts by American lawmakers because our work builds on literatures that focus primarily on American polarization and political dynamics. In keeping with the majority of prior work on the popularity of divisive content (e.g., Brady et al., 2017; Evans et al., 2023; Frimer et al., 2022; Rathje et al., 2021; Schöne et al., 2021), we used Twitter as a context for testing our ideas. Twitter has a reputation for being political (Mukerjee et al., 2022) and is the most popular platform among elites (Pew Research Center, 2020). These features made it a particularly convenient place to find relevant content to analyze and an important context to study: Its discourse can powerfully shape decisions of voters as well as lawmakers (Brady et al., 2021; Frimer et al., 2022). At the same time, focusing on this particular context means future research may need to empirically test the generalizability of our results—to other platforms in the contemporary era, as well as over time as online culture evolves. The General Discussion considers these questions further.
Coding team
Our primary coding strategy (validated using two strategies described further down) involved a team of research assistants identifying tweets in which the author engaged with or dismissed political opponents. Coders were seven Canadian undergraduate research assistants who were blind to research questions and had basic knowledge of American politics but no ties to parties nor to U.S. Senators. We employed human coders because our constructs of engaging and dismissing require specifically engaging or dismissing one’s political opponents. Only human coders could reliably apply contextual knowledge to determine whether a particular author’s tweet was describing an attitude toward a political opponent or some other target.
Tweets
Senators often post dozens of tweets per week, most of which are neither engaging nor dismissing in nature. To identify enough tweets in these two categories to enable meaningful comparisons, we collected as many as we could. At the time (December 4, 2018, for Study 1a; on May 20, 2021, for Study 1b), Twitter’s limit for automated collection was 3,240 per user (i.e., per Senator). So for each study we began with each sitting U.S. Senator’s most recent tweet and continued until we reached that maximum (or, in a few cases, until we had collected all the Senator’s tweets). We collected text, time stamp, and like and retweet counts for each tweet using the Tweepy API (Study 1a) or rtweet (Kearney, 2019; Study 1b). After excluding retweets (as in Frimer et al., 2022), this left 246,314 tweets for Study 1a and 244,123 for Study 1b. Our team of coders was not large enough to code, by hand, a quarter million tweets, so we took steps to identify a subset that was more feasible for our coders, with the additional goal of maximizing their hit rates for engaging and dismissing tweets, which in turn would maximize the power of our analyses.
We generated dictionaries of words that might be frequently used in engaging tweets (defined as those describing good-faith or bipartisan contact with opponents that the author had had, wanted or intended to have, or believed should happen) or dismissing tweets (defined as those that rejected the author’s opponents or their views outright, or implied that others should do the same—for instance, by condemning the opponents or their views as factually or morally wrong). The full dictionaries are available in the Supplemental Material available online and included words such as listen, understand, disregard, and wrong. We used these dictionaries as filters, retaining only tweets that contained at least one of their words.
This procedure means that the tweets we coded are necessarily different than the tweets we did not: The former contain at least one word from a set of words that the latter do not. This means we cannot meaningfully interpret the prevalence of engaging and dismissing tweets in the coded subsets—indeed, our goal was to maximize those prevalences. However, we did want to interpret differences in like and retweet counts for engaging versus dismissing tweets, which we could not meaningfully do if the filtering procedure distorted the kinds of engaging and dismissing tweets present in the subsets. We therefore tested for differences between tweets that did (vs. did not) pass through this filtering procedure, and in general we found that these were very small (see the Supplemental Material). For instance, tweets we retained compared to those we did not were more likely to be written by Republican senators (d = 0.05) and were less valanced in both directions (d = 0.04 to d = 0.12). Moreover, Studies 1a and 1b used overlapping but different dictionaries (see the Supplemental Material), so the key findings that emerged across data sets are not dependent on any one particular set of key words.
For Study 1a, when this filtering procedure returned 25,989 tweets (still too many to code), we used the sample function in R to select a random subset of 5,000 tweets. For Study 1b, we realized that we could instead further increase our hit rate by using a double filter: Because engaging and dismissing both required referring to opponents, we added a second dictionary that included terms referring to the senator’s broad ideological or partisan opponents (e.g., “Republican” or “GOP” for Democratic authors; “Democrat,” “liberal” for Republican authors). Filtering with both dictionaries at once returned 1,135 tweets for Study 1b, and our team coded them all.
One downside of our approach in Study 1b was that it limited our analysis to tweets in which senators engaged with or dismissed these high-level groups of opponents, not the individuals or smaller groups that Study 1a would have included. However, for the same reason, it ensured that even though the initial corpora for the two studies contained many of the same tweets, their final coded samples overlapped by only 20 tweets. Results below include these overlapping tweets, but the Supplemental Material reports indistinguishable results when we excluded them.
Primary coding
Coders had access to each tweet’s text, time stamp, and the author’s name and party, and could research additional context as necessary. Two coders independently coded each tweet with substantial agreement (Gwet, 2008; Study 1a: 76% agreement, Gwet’s AC1 = .72; Study 1b: 81% agreement, Gwet’s AC1 = .78); the first author resolved disagreements. In Study 1b, coders only identified tweets as engaging or dismissing if this was their central message (as opposed to, for example, tweets that technically called for bipartisanship but were primarily intended to self-promote or blame opponents for impasses).
Figure 1 provides example tweets from the categories dismissing, engaging and neither (i.e., all other tweets). In Study 1a, the team identified 198 and 76 engaging and dismissing tweets; in Study 1b, 53 and 118. This provided 80% power to detect differences between engaging and dismissing—d = 0.38 (Study 1a) and d = 0.47 (Study 1b).
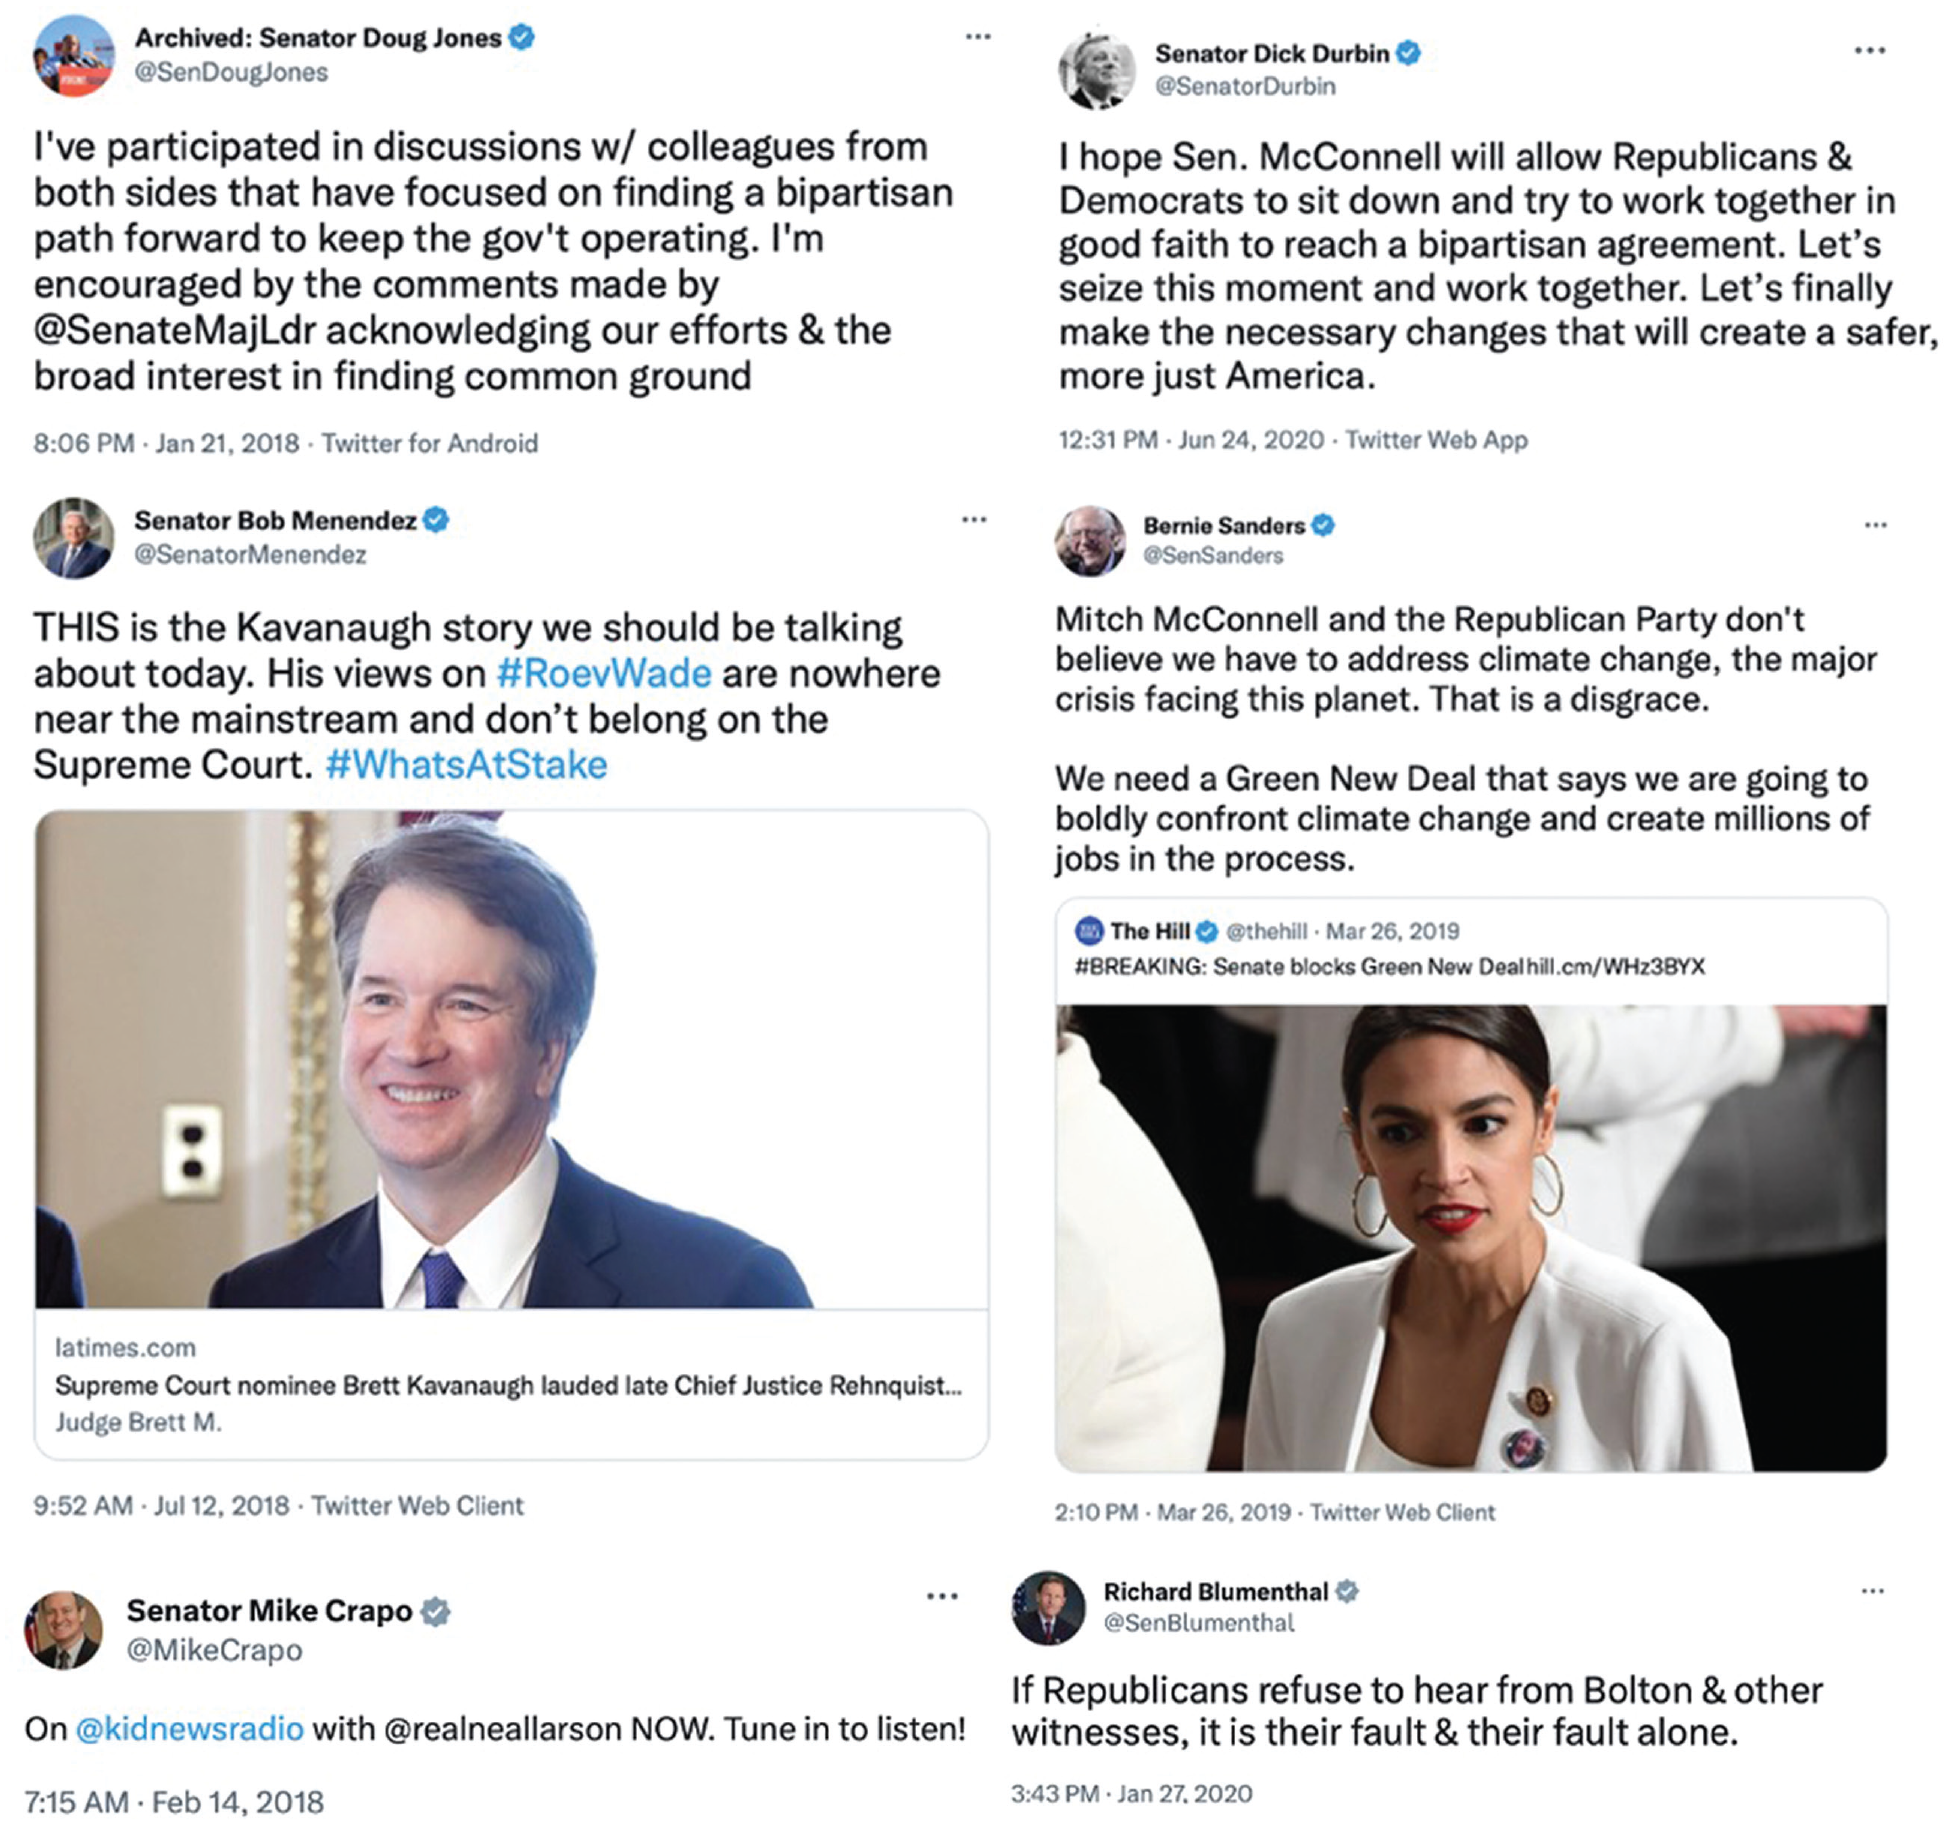
Example tweets from Studies 1a (left) and 1b (right), coded as engaging with opponents and their views (top) or as dismissing opponents and their views (middle), or as neither of these (bottom).
Validation coding
We used two strategies to validate our coding, using tweets from Study 1b. First, an independent sample of 536 participants (age: M = 41.3 years; 49% female, 49% male, 2% nonbinary, agender, or genderqueer) rated the tweets on a scale ranging from −2 (mostly positive engagement with opponents’ views) to +2 (mostly dismissive of opponents’ views). Each participant rated 10 tweets, randomly drawn from Study 1b’s engaging and dismissing tweets; each tweet was rated by an average of 31 raters. In a multilevel model (nesting ratings within participant and tweet), tweets coded as dismissing (M = 1.41, SD = 0.30) were rated more toward the dismissing end of the scale compared to those coded as engaging (M = −1.03, SD = 0.32), b = 2.44, SE = 0.05, t(5291) = 48.97, p < .001. Moreover, this naive sample placed 100% of tweets in the same category as our coders did: Every dismissing tweet had a mean rating above zero, and every engaging tweet had a mean rating below zero. Thus, laypeople perceived the same clear distinction our coders did between the two key categories of tweets.
Second, we drew on an existing algorithm to code each tweet’s level of receptiveness (see Yeomans et al., 2020), which as noted above is an integral component of constructive engagement. This algorithm was trained on text written by authors responding to an opponent’s position statement, and it picks up on structural and stylistic markers of openness to conversations with the opponent. This training environment made the algorithm well suited to Study 1b’s tweets, each of which mentioned its author’s opponents. We analyzed the tweets’ algorithmic scores with a linear model using the neither category (M = −0.24, SD = 0.10) as the dummy-coded reference group; tweets coded as dismissing (M = −0.28, SD = 0.10) were less receptive, b = −0.04, SE = 0.01, t(1132) = 4.37, p < .001, whereas tweets coded as engaging (M = −0.18, SD = 0.10) were more receptive, b = 0.09, SE = 0.02, t(1132) = 5.78, p < .001. Thus, our primary tweet coding aligns in predictable ways with the (lack of) receptiveness senators expressed.
These two validation strategies yielded two continuous variables that supplemented our primary coding of the tweets into categories. This primary coding served for key models testing whether dismissing tweets were liked and retweeted more than engaging tweets. The validation coding served for supplementary models testing whether tweets that the independent sample rated as more dismissing or tweets that the algorithm scored as less receptive (i.e., less engaging) also received more Likes and Retweets.
Covariates
We report analyses both with and without a set of covariates commonly used in related work: senator’s party, ideology (Lewis et al., 2022), follower count, publicly listed gender and race, the tweet’s year, its length in characters, and whether it included media (e.g., a URL). It was especially important to control for the senators’ follower counts: For widely followed users like national politicians, direct followers represent their tweets’ primary exposure, which (as noted above) can inflate like counts.
Results
Do dismissing tweets receive more Likes and Retweets than engaging ones?
Our analyses focused on tweets coded as either dismissing (0) or engaging (1), using category to predict log-transformed Likes and Retweets (see below; in the Supplemental Material we report very similar results using raw counts instead). We included random intercepts for senator; we ran analyses both with and without covariates. With medium to large effect sizes, senators’ tweets received more positive feedback for dismissing than engaging (Fig. 2; Table 1).
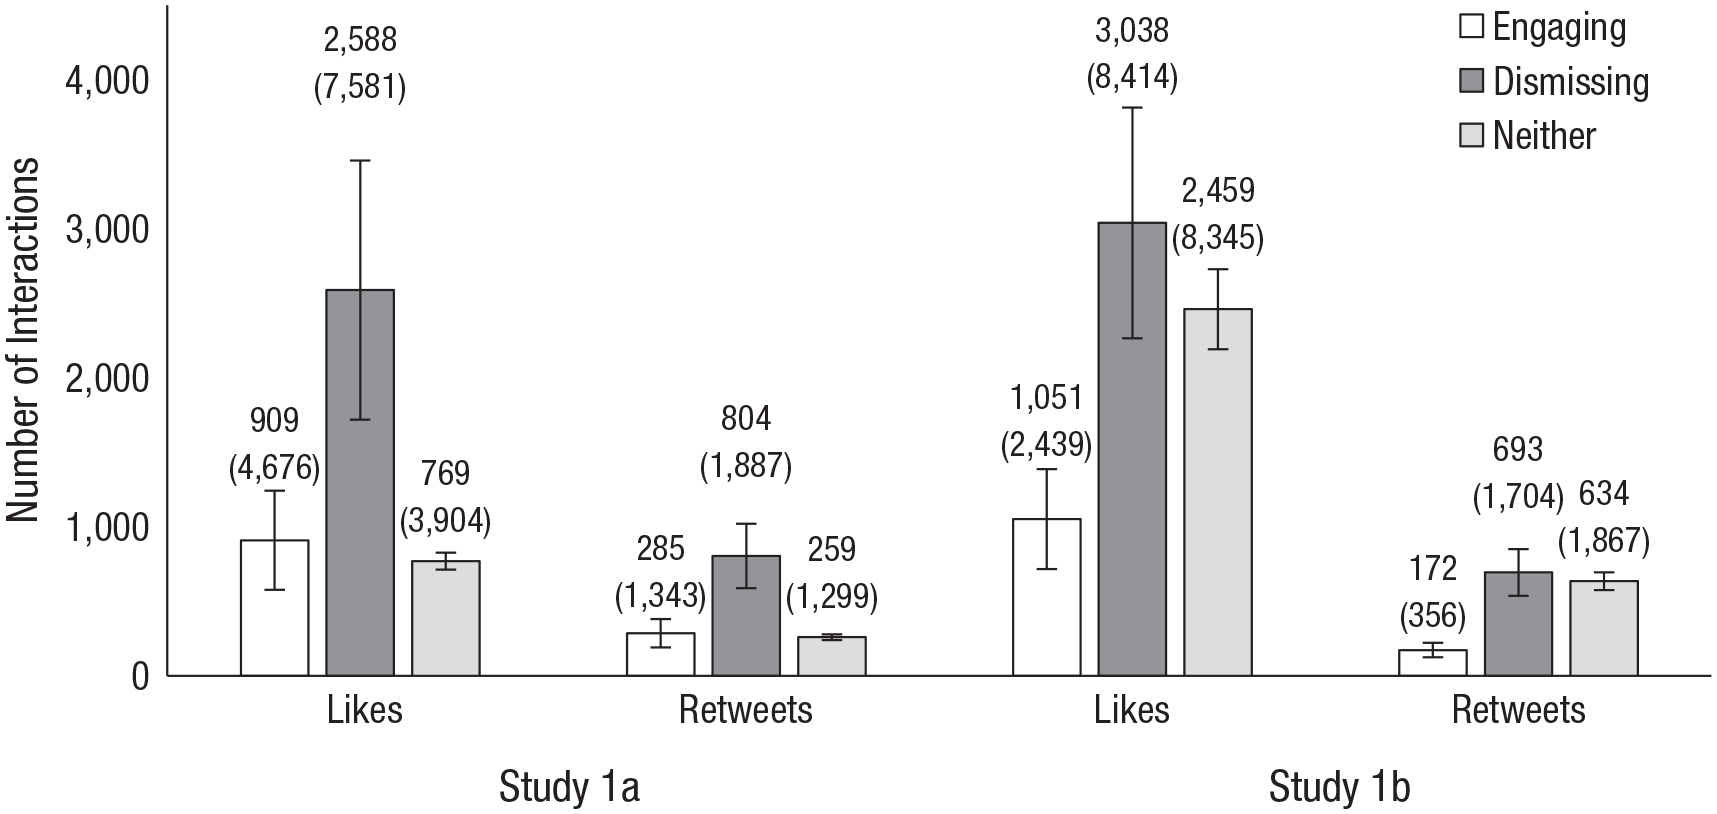
Raw Like and Retweet counts for senators’ engaging, dismissing, or neither tweets. Raw means appear above their respective bars, and standard deviations appear in parentheses below (both are rounded to the nearest whole number). Error bars represent standard errors.
Likes and Retweets Received by Engaging vs. Dismissing Tweets in Studies 1a and 1b
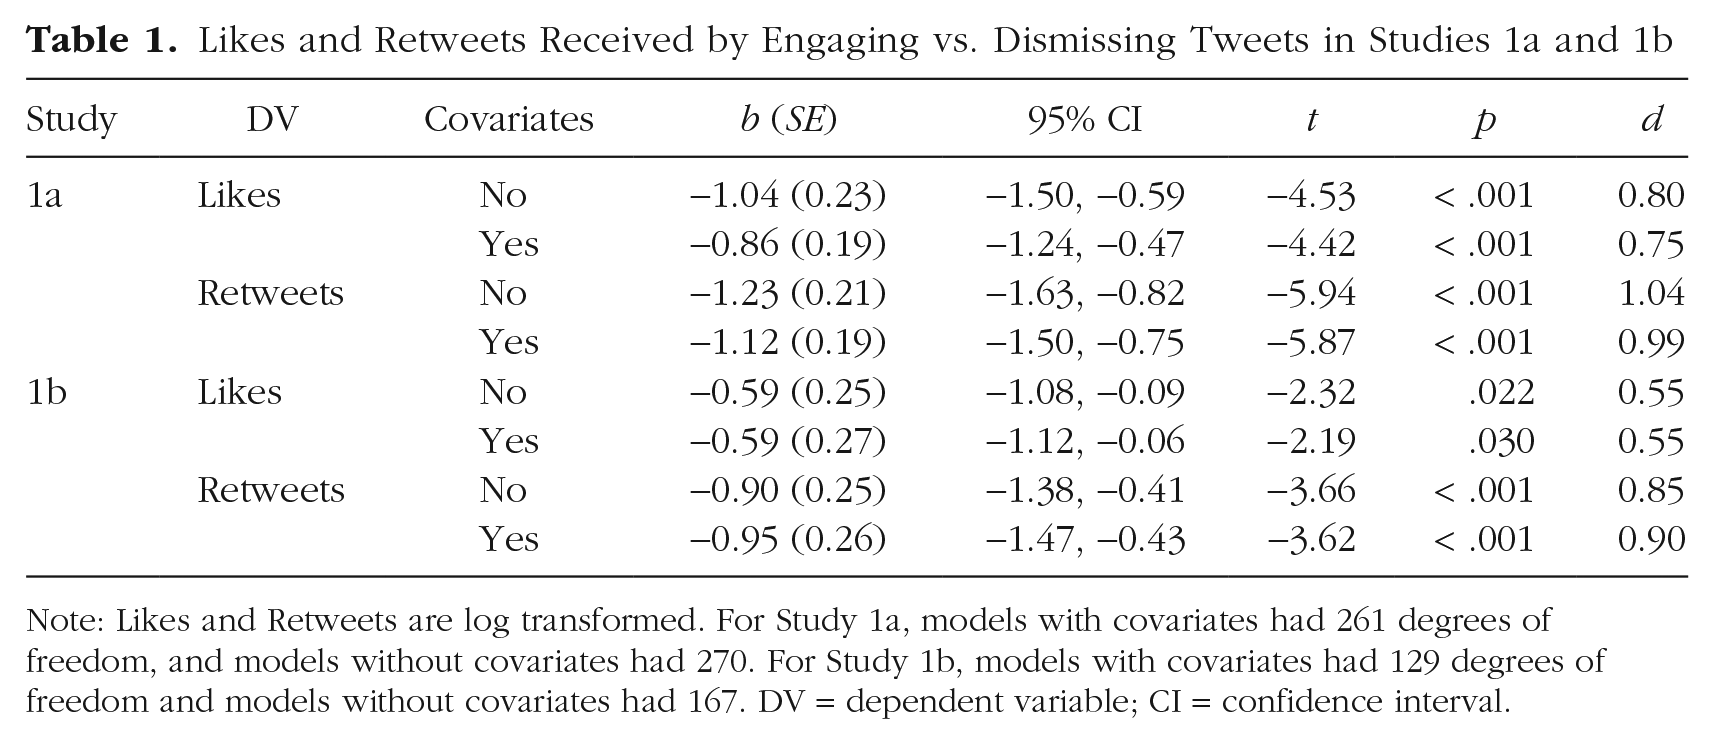
Note: Likes and Retweets are log transformed. For Study 1a, models with covariates had 261 degrees of freedom, and models without covariates had 270. For Study 1b, models with covariates had 129 degrees of freedom and models without covariates had 167. DV = dependent variable; CI = confidence interval.
Robustness checks and additional findings
Since these studies were not preregistered, it was important to ensure that our findings were not artifacts of a particular analysis strategy. Table 1 already shows consistent results over two dependent measures, with and without covariates. (The Supplemental Material reports further consistent effects when we controlled for various features related to, but distinct from, engaging or dismissing characteristics or online popularity, like linguistic markers of civility and moral outrage; none of the markers we tested explained the positivity of dismissing tweets, either.) In further robustness checks, we found the same results when we analyzed raw rather than log-transformed scores and when we replaced our hand-coded engaging versus dismissing labels with the validation data described above (either the tweets’ dismissive ratings according to the independent sample, or their receptiveness ratings according to the algorithmic scorer). More dismissive tweets received significantly more rewards, no matter how we operationalized either variable.
The Supplemental Material also reports statistical models that include neither tweets, which (as Figure 2 makes plain) differed between studies: In Study 1a, they received less positive feedback (similar to engaging tweets), but in Study 1b, they received more (similar to dismissing tweets). We attribute this difference to our tweet-selection procedure: In Study 1b (but not Study 1a), all tweets, including neithers, mentioned senators’ opponents, which tends to generate more Likes and Retweets (Rathje et al., 2021). Tweets that engage constructively with opponents are an exception to this rule.
Discussion
Dismissing tweets’ popularity coincides with emerging evidence that interparty negativity earns social-media rewards, but it seemingly contradicts widespread approval of interparty positivity. Indeed, the exact receptiveness measure that we find predicts fewer Twitter rewards predicted more rewards in other naturalistic settings (Yeomans et al., 2020).
Studies 2a and 2b
Preregistered Studies 2a and 2b tested whether, in contrast with what Twitter rewards, people prefer engaging to dismissing. They also tested whether politicians dismissing, or specifically dismissing on Twitter, flips this general preference.
Method
Americans (approximately half self-identified Democrats and half self-identified Republicans) from Prolific Academic reported how warmly they felt toward both engaging and dismissing communicators who were either senators or ordinary citizens and who communicated either on Twitter or offline. Crowdsourced samples from this platform are not representative: They skew younger and more liberal than the American population (Prolific Team, 2022). However, this type of online sample nonetheless closely approximates nationally representative samples’ responses to political measures (Mullinix et al., 2015). Their preference between engaging and dismissing might thus be different from regular Twitter users’—indeed, this is an idea we test in the next study—but should approximate the general population’s. Participants always saw communications by copartisans, because senators’ Twitter audiences are primarily made up of supporters (Wojcieszak et al., 2022), and because in any case it seemed obvious and intuitive that people would prefer receiving good-faith engagement, rather than dismissal, from their opponents.
Study 2a participants provided two observations, and 2b participants six; in each case we targeted 1,200 total observations (preregistration links noted in the open practices section provide a priori power analyses justifying this sample size). After excluding participants who self-reported low-quality data (n2a = 2; n2b = 1), Study 2a included 657 participants, age: M = 39.9 years, 42% male (1 transgender), 56% female, and 2% nonbinary, agender, gender-fluid, or gender-queer; Study 2b included 199 participants, Mage = 37.7 years, 42% male, 55% female, and 2.5% nonbinary, queer, or agender. In this and subsequent studies, all participants were required to pass a simple, initial English-comprehension check; those who failed were redirected and did not complete the survey.
Procedure
Participants reported their demographics and their ideological orientation and then read about two (Study 2a) or six (Study 2b) communications by copartisans in a mixed 2 (engaging vs. dismissing; within) × 2 (senator vs. citizen; between) × 2 (tweet vs. offline; between) design. Liberals saw tweets by Democratic senators, and conservatives saw tweets by Republican ones: We did this because senators’ Twitter audiences are largely copartisan (Wojcieszak et al., 2022), and we did not want to merely report the obvious finding that participants would prefer opponents who engage constructively.
After each communication, participants reported feelings of warmth toward the copartisan communicator. They then reported their position on the six political issues. Finally, at the end of these and subsequent studies, participants self-reported whether their data was low quality.
Communications
Figures 3 and 4 show example communications; see preregistration for full materials. The communications mentioned six different issues (climate change, efforts to address COVID-19, suppressing violent out-group extremists, tax plans, COVID-19 vaccine distribution priorities, guns); participants never saw two communications on the same issue. Study 2b’s communications were inspired by real tweets from Study 1b’s sample.
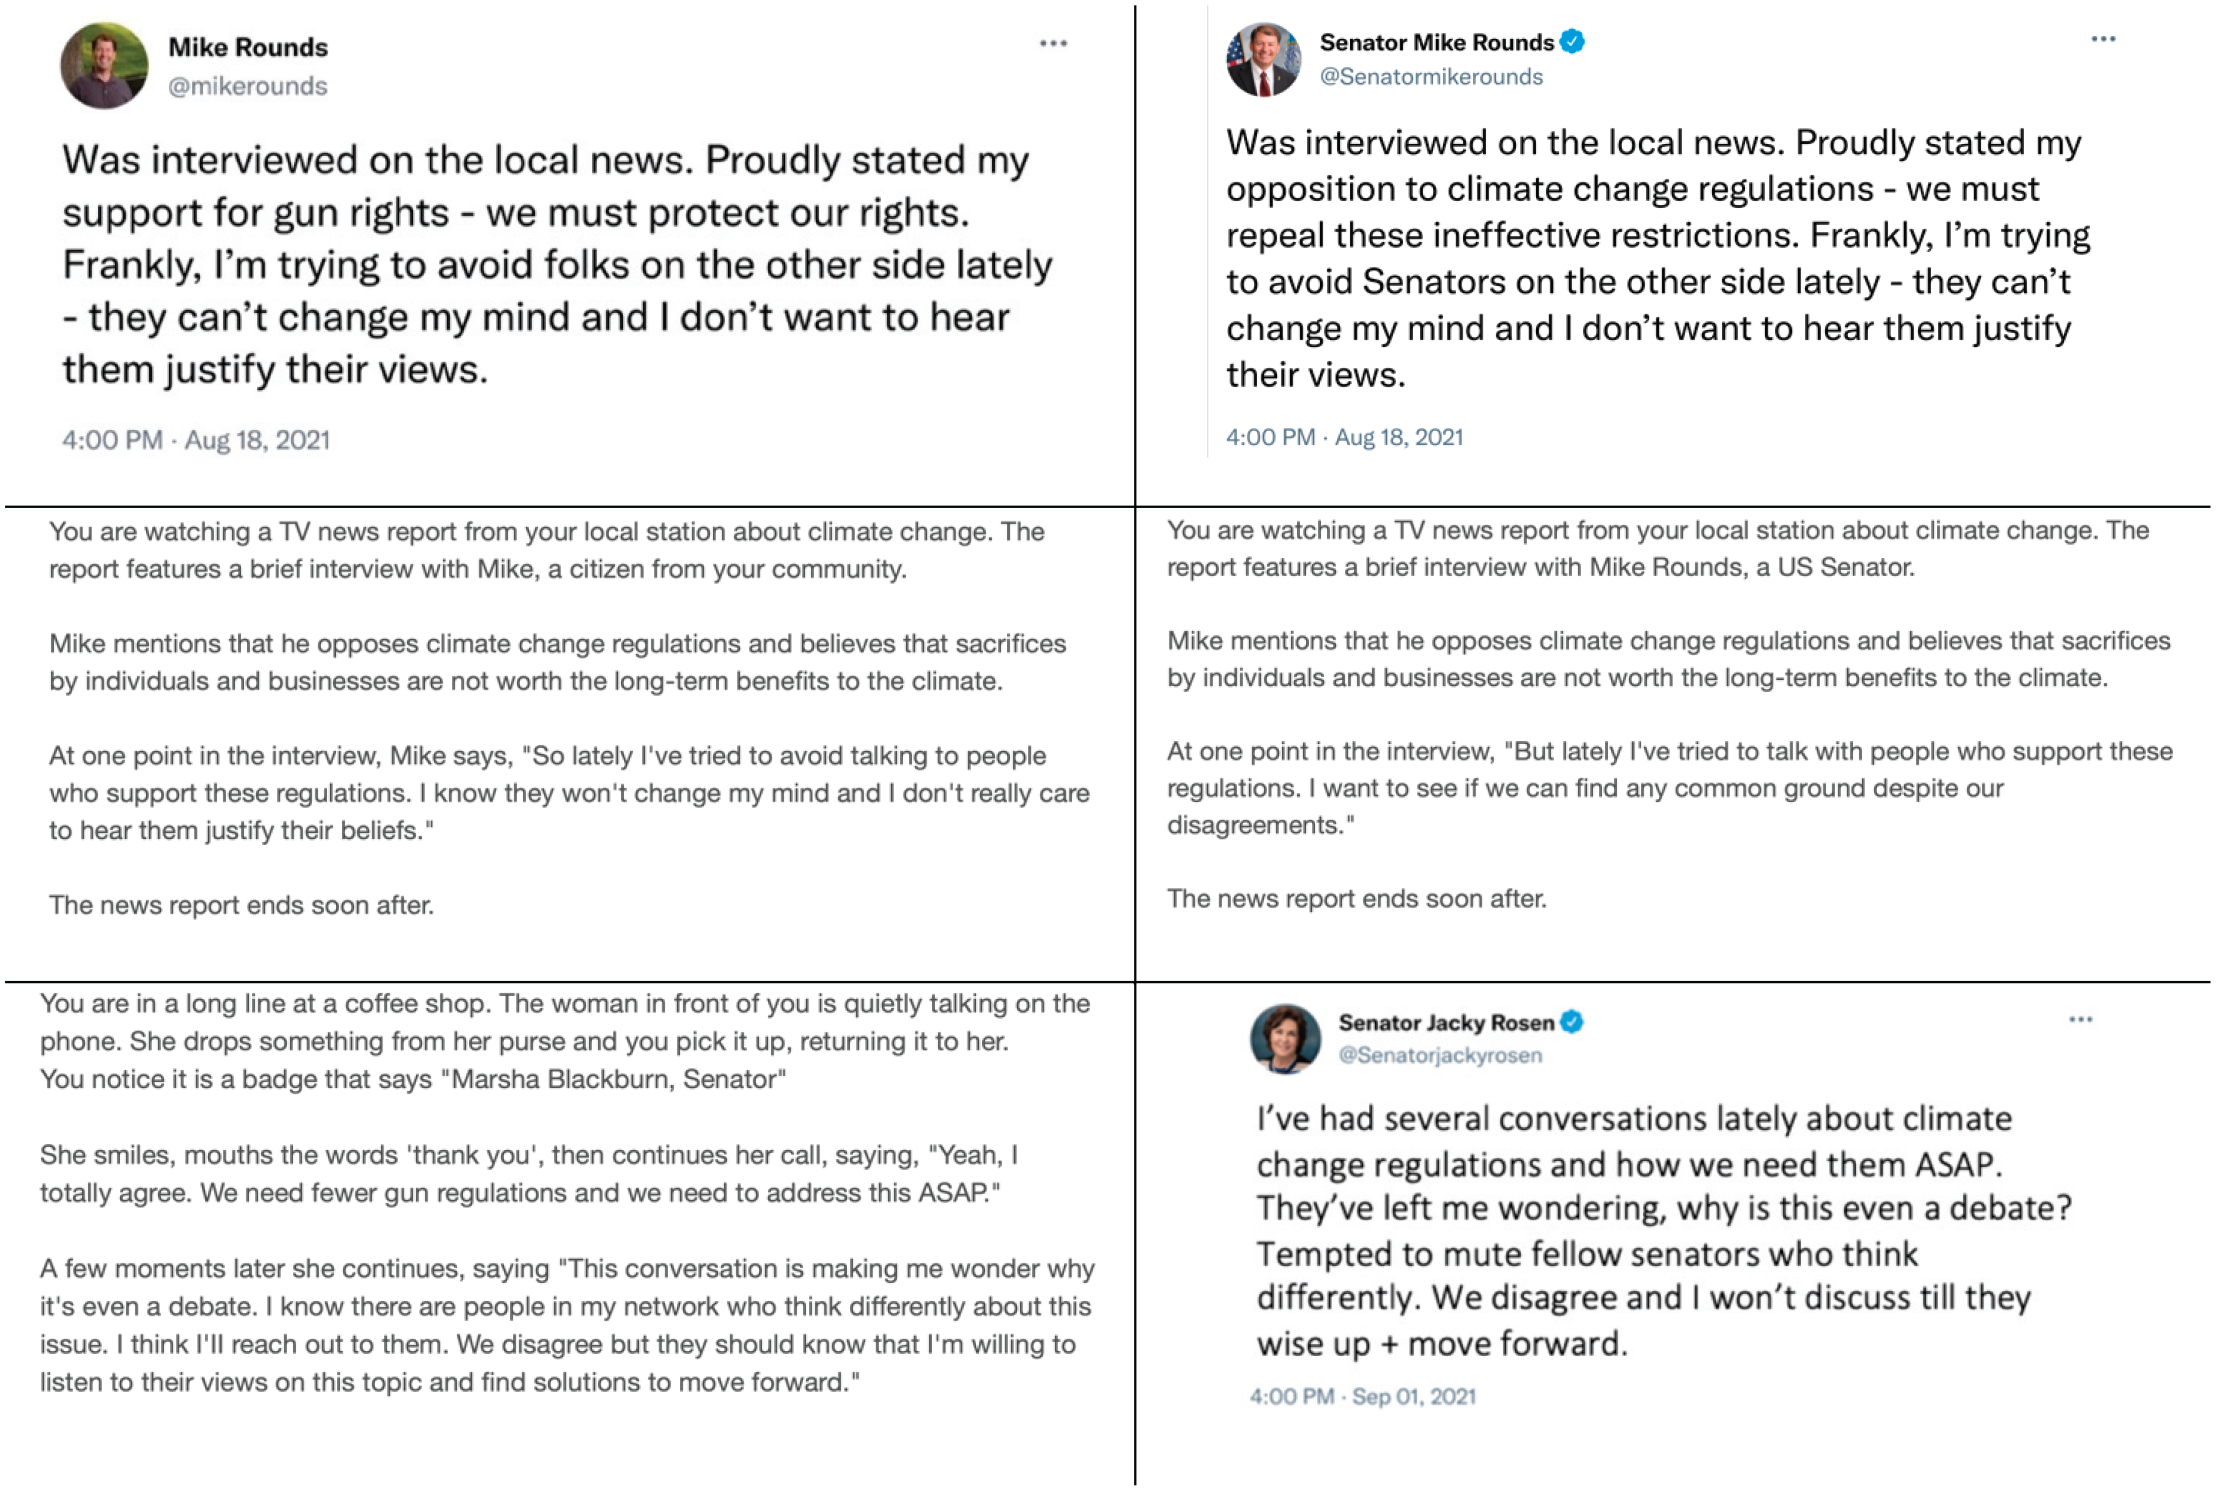
Examples of communications used in Study 2a. All Study 2a communications described either a news interview (see top two rows) or recent interactions (see bottom row). We adapted all communications to all six issues, to tweet and offline formats, and to Republican and Democratic senator and citizen communicators.
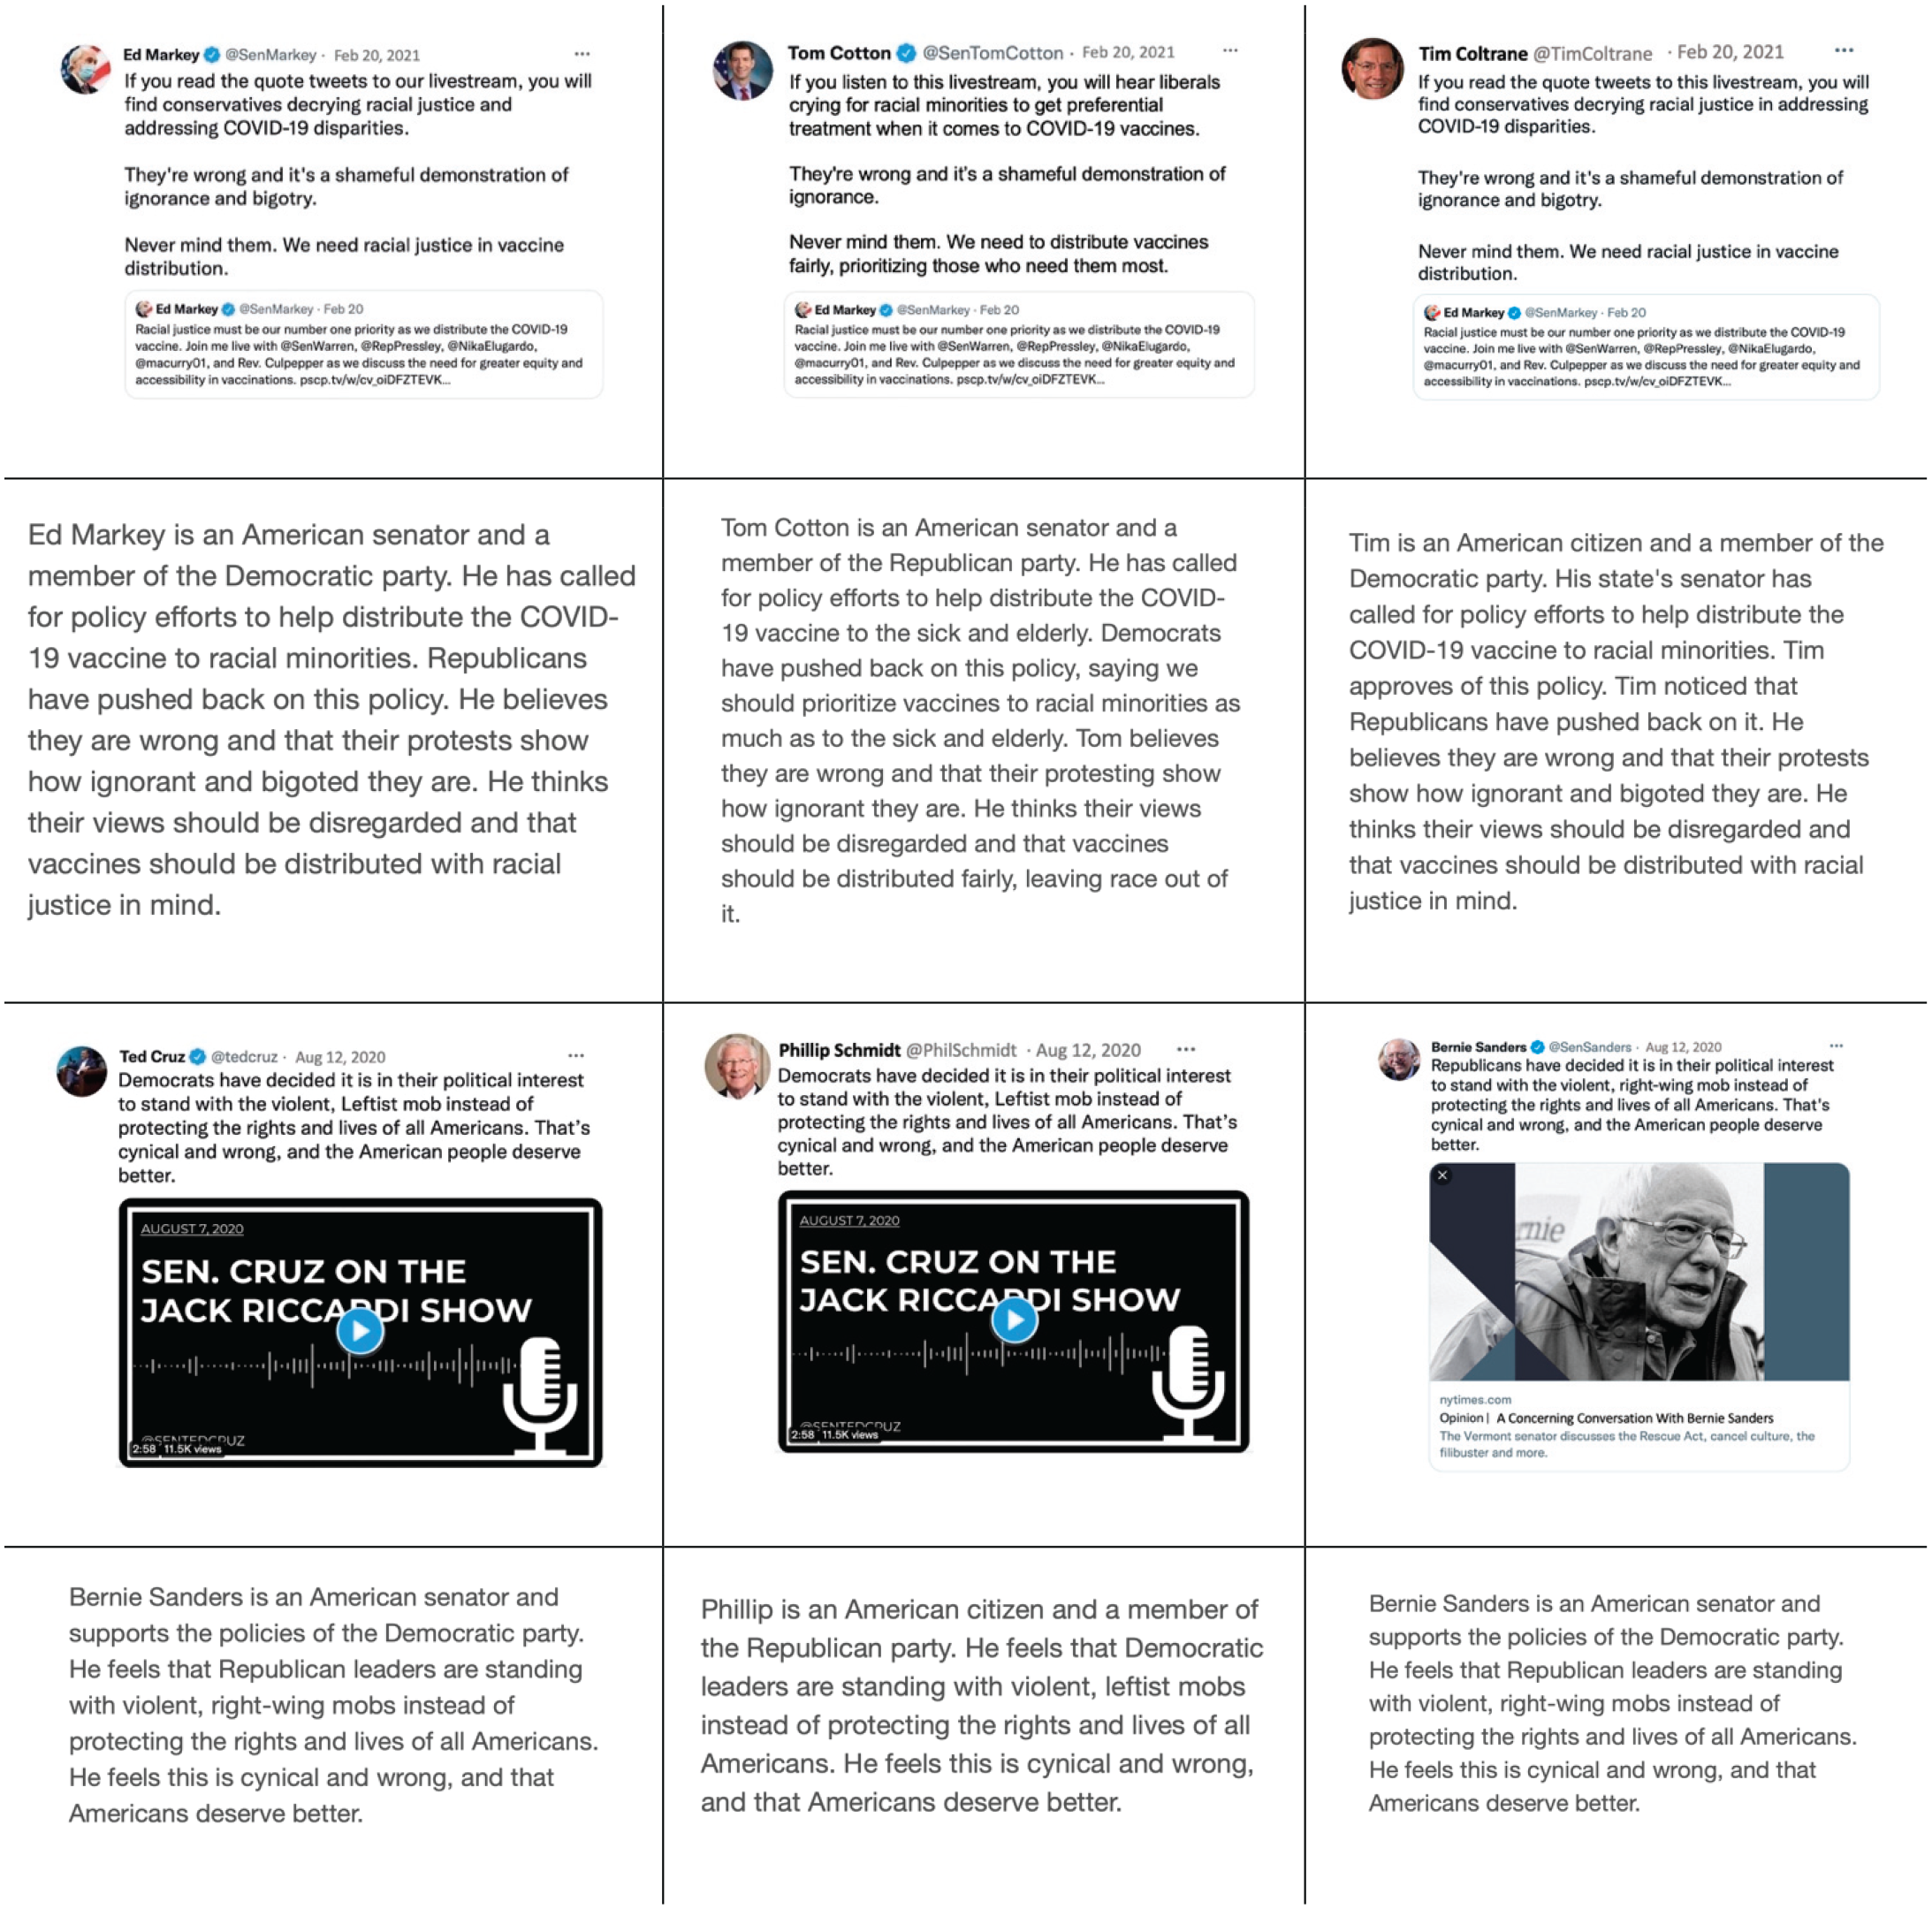
Examples of communications used in Study 2b. Study 2b used six tweets from Study 1b, and the examples above show two of the six; see the preregistration for materials for the other four. We adapted all base tweets to offline formats (see the second and fourth rows) and to Republican and Democratic senator and citizen communicators.
Each communication had parallel Republican-authored and Democrat-authored versions, as well as parallel senator and citizen-communicator versions. Citizen communicators always bore the same first names as one of the senators, and their Twitter profile pictures were plain-clothes pictures of a senator.
Measures
Participants reported their political ideology (1 = very liberal, 6 = very conservative); those who selected 1, 2, or 3 saw communications by Democrats, and those responding with 4, 5, or 6 saw communications by Republicans.
For feelings of warmth, participants used a thermometer ranging from 0 to 100, where 0 represented the most negative, least warm feelings and 100 the most positive, most warm ones.
Participants also indicated whether they endorsed the typically Republican or Democratic position for each of the six issues the communications mentioned. Consistent with our preregistration, we excluded the minority of observations (Study 2a: 287 of 1,314 observations; 2b: 233 of 1,194 observations) in which participants saw a communicator who was a copartisan in broad terms but with whom they disagreed on a specific issue. For example, liberal participants who opposed gun control saw communications by pro-gun-control Democrats, so we excluded those participants’ ratings of those nonallied communicators.
Results
In this and in Study 3, analyses are preregistered unless otherwise specified. Multilevel models (nesting observations within participants) predicted feelings of warmth from communication type, communicator’s role, communication medium, and their interactions. The goal of these studies was to test the flipped-preferences idea, which predicts that participants prefer dismissing more when the communicator is a senator or when the communication medium is Twitter. Our analyses therefore focused on effects indicating moderation of participants’ relative preference for engaging over dismissing (see Fig. 5; Table 2, third column). One such effect was significant, two others were marginal, and the final was null.
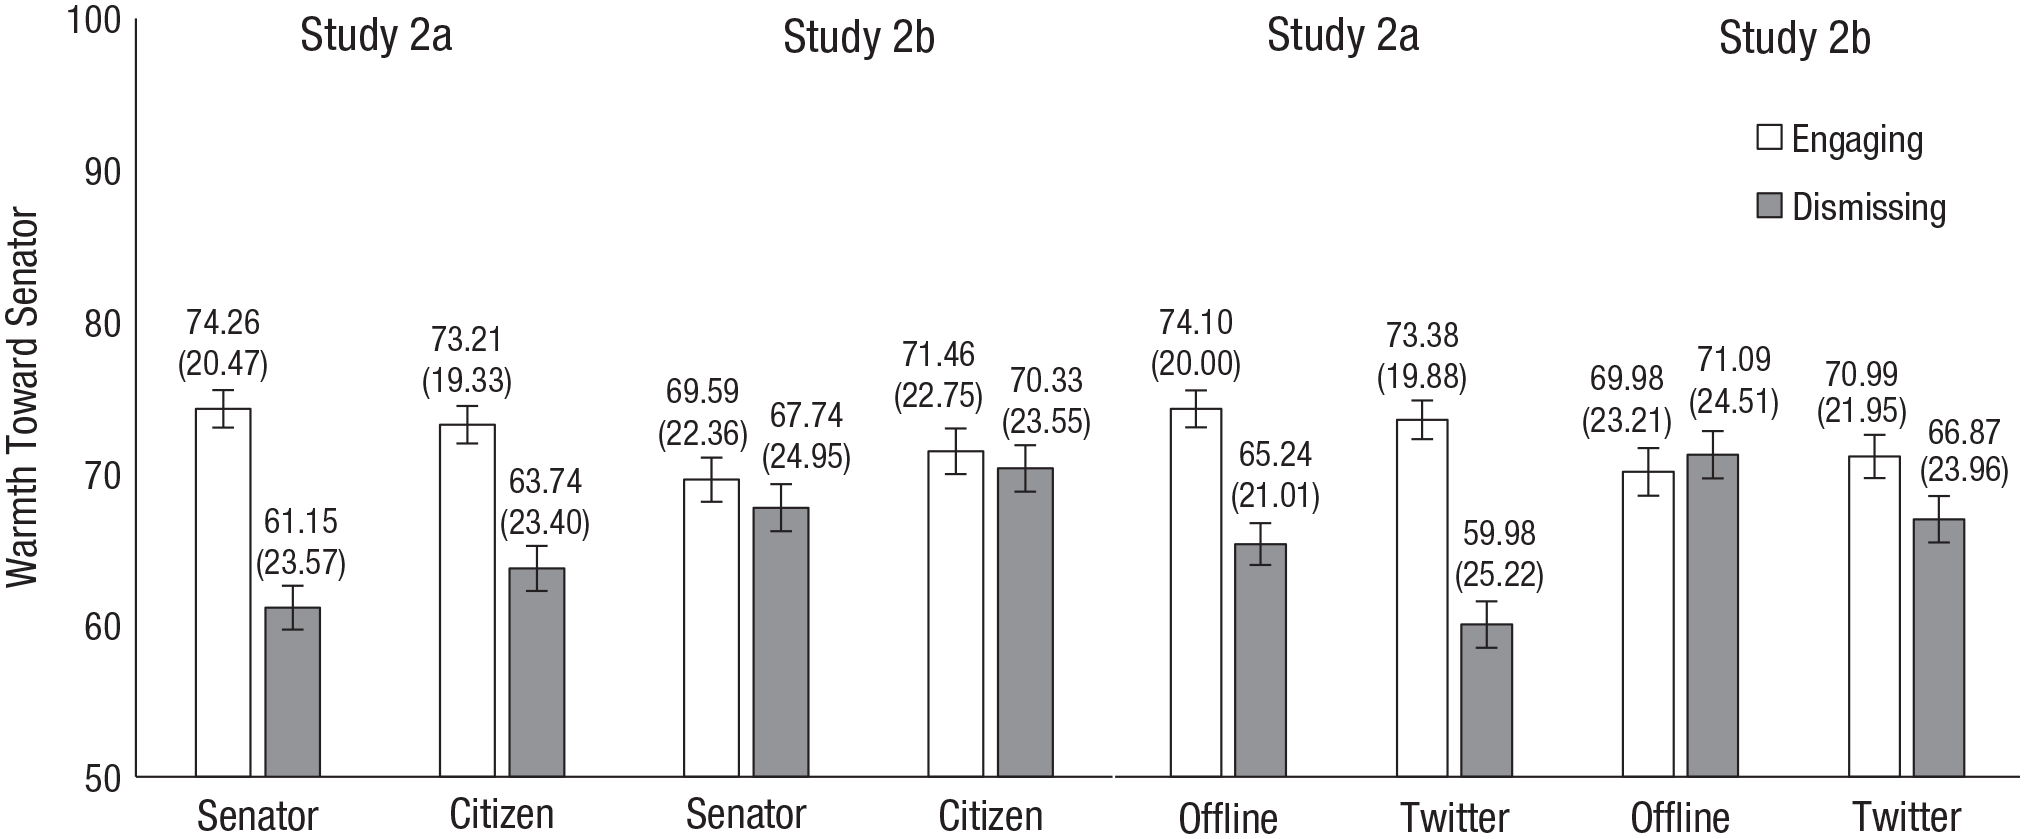
Tweet type by communication medium and communicator role interactions. Means appear above their respective bars, and standard deviations appear in parentheses below. Error bars represent standard errors.
Moderators of the Preference for Engaging Over Dismissing in Studies 2a and 2b
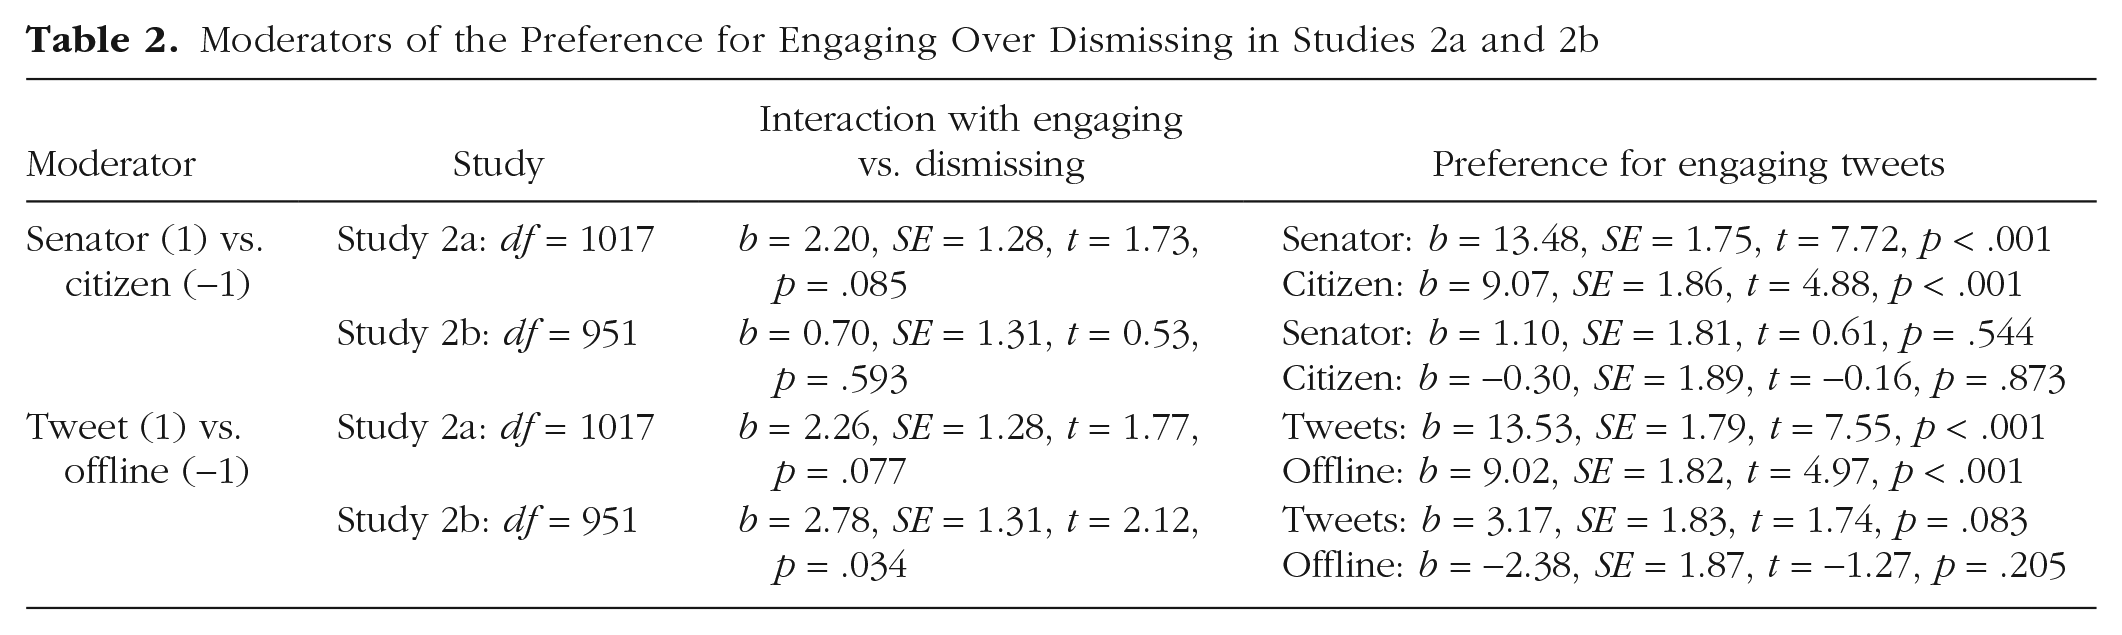
However, as Figure 5 makes plain, the direction of these effects was the opposite of what the flipped-preference idea would predict: If anything, participants showed greater preferences for engaging when the communicator was a senator or when the communication was on Twitter. These studies thus provide no support at all for the flipped-preference explanation. Instead, the simple effects (see Table 2, fourth column) were generally, though not perfectly, consistent with our hypothesized preference for engaging: Participants preferred senators who engaged over those who dismissed (Study 2a only), and preferred authors of engaging tweets over authors of dismissing tweets (significantly in Study 2a, marginally in Study 2b). The contrast between these effects—one showing an inconsistent preference for engaging, and one showing the popularity of senators’ dismissing tweets in Studies 1a and 1b—confirms the funhouse-mirror effect: Likes and Retweets misrepresent broader population preferences.
Discussion
Findings confirmed the funhouse-mirror effect while adding some (inconsistent) support to a growing literature documenting preferences for interparty positivity. Neither senators nor tweets were a special case in which people’s preferences flipped; instead, dismissing tweets’ popularity misrepresents majority preferences.
Study 3
The funhouse-mirror effect could either mean that Twitter represents only the preferences of a minority who provide Likes and Retweets, or that these metrics do not track preferences.
Method
Preregistered Study 3 followed two pilot studies, reported in the Supplemental Material, in which only 7% of crowdsourced participants reported frequently reacting to politicians’ tweets (this approximates population rates; Pew Research Center, 2019a). In these studies, this minority differed from the remaining majority in preferring dismissing to engaging tweets. Study 3 oversampled these unusual frequent reactors to more robustly compare their preferences to the broader majority’s. Like the pilot studies, Study 3 solicited reactions to all Study 1b’s engaging or dismissing tweets for direct comparison with the actual feedback those same tweets received. Participants reported their approval of tweets themselves, their feelings toward their authors (as in Studies 2a and 2b), or their intentions to like or retweet. Making all three reports could introduce demand for consistency and obscure real differences between genuine preferences and online intentions. Thus, each participant reported on only one of these three measures for all tweets they saw.
Participants
Americans from Prolific Academic participated (equal thirds Democrats, Republicans, and Independents/other). Excluding 2 participants who reported low data quality left 323 participants (4,571 observations; age: M = 42.7 years; 52% male, 46% female, 1% nonbinary, 3 with missing data). We initially targeted 240 participants—160 representing the majority who rarely or never react to politicians’ tweets, and 80 of the more unusual participants who frequently do so (for a priori power analyses justifying this sample size, see the preregistration). When we analyzed the data with these sample sizes, we observed the same significant patterns reported here, but realized that they were compromised by a key confound: Some tweets had no ratings by frequent reactors on one or more of our three response measures, meaning that our comparisons between subsamples of participants were also comparisons between slightly different samples of tweets. We therefore amended our preregistration with a new target of two ratings per tweet for each response measure.
Procedure
Participants first reported demographics, including party affiliation (1 = strongly Republican, 6 = strongly Democrat); similar to Studies 2a and 2b, this determined whether they saw tweets by Republican or Democratic senators. They also chose between three options regarding whether they had “ever liked or retweeted something by a U.S. Senator or house representative” (1 = yes, frequently, 2 = yes, once or twice, or 3 = no, never). We screened 2,128 participants, ultimately recruiting 156 frequent reactors (i.e., participants who selected the first of these options); this 7% hit rate replicates what we had observed in the pilot studies as well as in prior literature (Pew Research Center, 2019a). Of the remaining screened participants, the first 167 who selected either of the other two options (ns = 50 and 117, respectively) completed the survey; others were redirected.
Participant saw 10 tweets in random order, always by copartisan senators, and randomly selected from the all tweets coded as engaging or dismissing in Study 1b. Frequent reactors recruited after we amended the preregistration saw 16 rather than 10 tweets, all drawn from those with missing ratings. All participants saw half engaging and half dismissing tweets.
Participants completed only one of the three response measures because we did not want them to feel pressure to use them similarly. Thus, one third of participants reported, for each tweet, their feelings of warmth toward the authoring senator (as in Studies 2a and 2b). A second third reported “To what extent do you approve of this tweet’s message?” (1 = strongly disapprove; 5 = strongly approve). A final third answered two questions: “Would you have given this tweet a ‘like’ at that time it was posted?” (yes/no) and “Would you have retweeted this tweet at that time it was posted?” (yes/no). Prior work suggests that such responses track online behavior (Mosleh et al., 2020); we averaged them into one measure (1 = yes, 0 = no; r = .61).
Participants reported individual differences that we reasoned might account for the unique preferences we anticipated frequent reactors might have: partisan extremity (highlighted in our preregistration), affective polarization, desire for party status, and endorsement of compromise. We report methods and analyses for these variables in the Supplemental Material and summarize our findings in the Results section below.
Results
Do frequent reactors have unique preferences?
We first compared participants’ preferences, collapsing across all three response measures (approval, feelings of warmth, and intentions; each standardized). A single multilevel model (nesting observations within tweet and participant) predicted positive responses from tweet type (0 = dismissing, 1 = engaging), participant group (0 = frequent reactor, 1 = everyone else), and their interaction. The Participant Group × Tweet type interaction was significant, b = 0.24, SE = 0.05, t(4552) = 5.24, p < .001: Across measures, frequent reactors responded more positively to dismissing versus engaging tweets, b = −0.24, SE = 0.03, t(4552) = 7.12, p < .001, but everyone else did not, b = −0.00, SE = 0.04, t(4552) = −0.07, p = .946. Thus, the minority of people who provide most of the feedback to senators’ tweets have unusual preferences. This helps explain the funhouse-mirror effect: The feedback tweets receive can reflect only the apparently unusual preferences of the people who use like and retweet buttons.
Do preferences differ from (intentions to provide) Likes and Retweets?
We next examined whether differences between self-reported preferences (approval, warmth toward senator) track intended Twitter reactions. To do so, we added to the model above a variable for response type (dummy-coded with approval as reference) and its interactions; see Figure 6. Significant three-way interactions—bwarmth = −0.37, SE = 0.13, t(4544) = −2.88, p = .004, bintentions= −0.45, SE = 0.11, t(4544) = −4.15, p < .001)—suggested that the key Participant Group × Tweet type interaction differed depending on how people reported their preferences. That is, frequent reactors’ preferences differ from everyone else’s, but this depends on how preferences are measured.
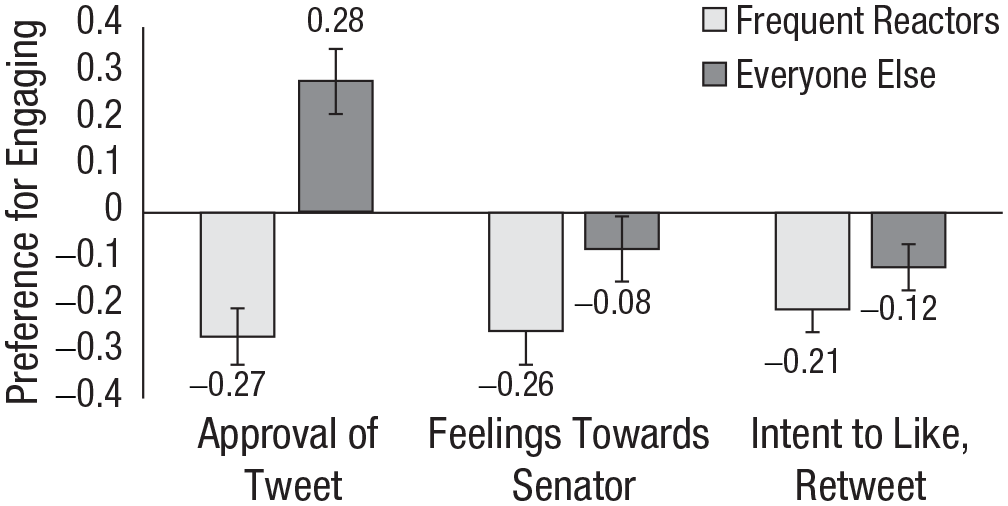
Participants’ preference for engaging over dismissing as a function of reaction frequency and measure. Error bars represent standard errors; means appear above their respective bars.
Simple slopes showed the same consistent preference among frequent reactors (see Table 3, second column): more approval of dismissing tweets, warmer feelings toward their authors, and stronger intentions to like and retweet them, compared to engaging tweets. This minority of individuals truly prefer what they intend to like and retweet—and what Twitter ultimately rewards with Likes and Retweets.
Comparing Preferences for Engaging Over Dismissing in Study 3
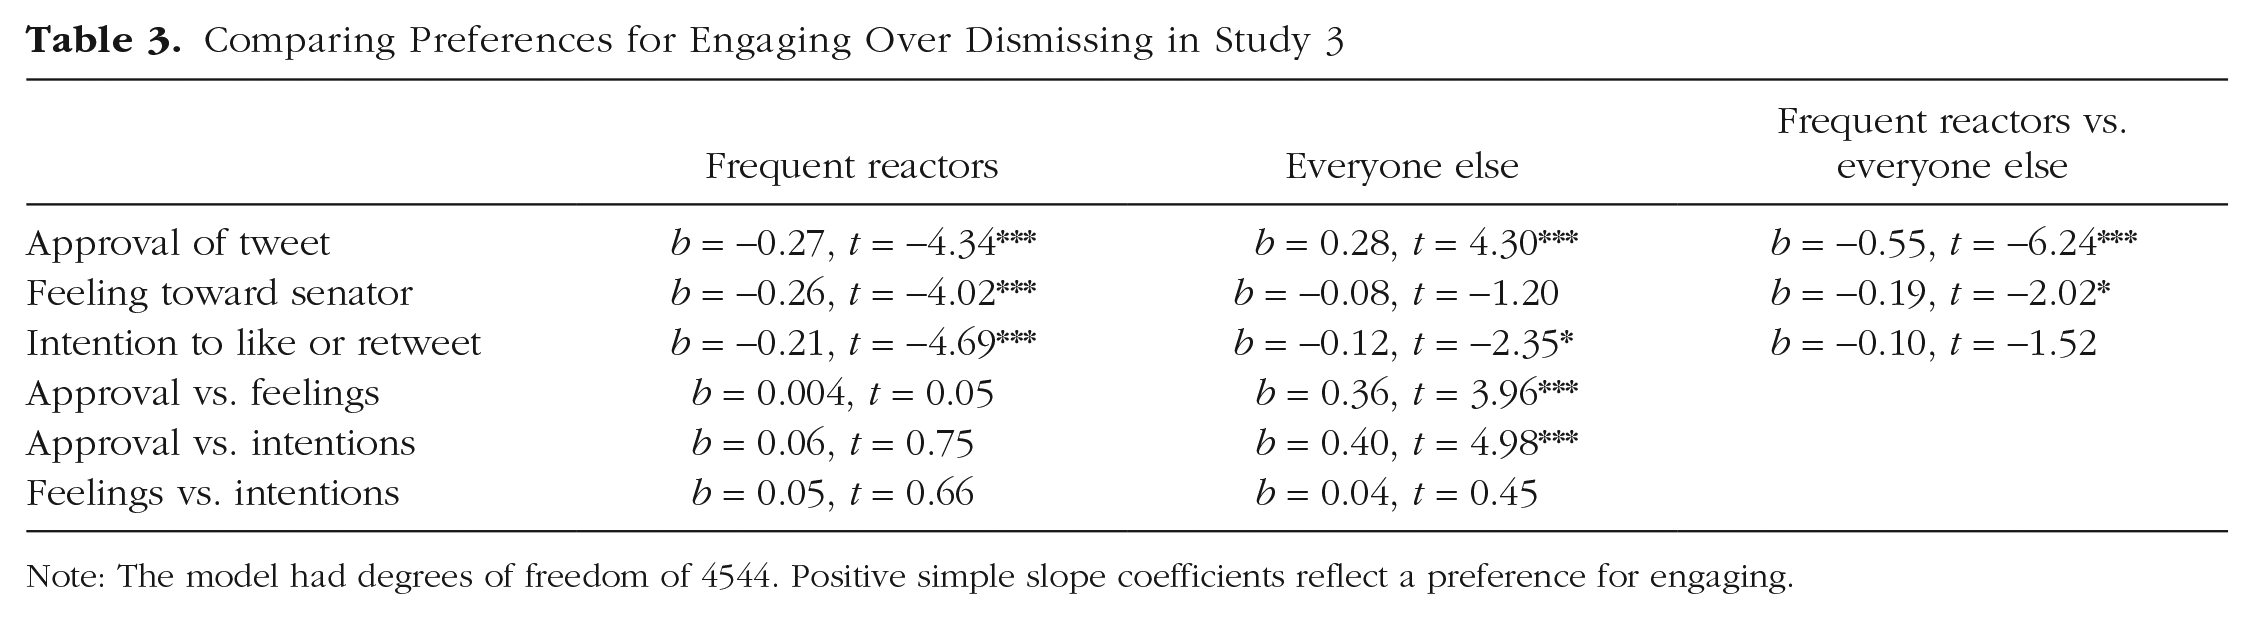
Note: The model had degrees of freedom of 4544. Positive simple slope coefficients reflect a preference for engaging.
Everyone else’s preferences changed across measures (Table 3, third column). Regarding approval and warmth—two direct measures of preferences—they differed from frequent reactors. They approved more of engaging versus dismissing tweets and felt equally warmly toward engaging and dismissing senators themselves. This at least partially aligns with prior findings suggesting that people prefer interparty positivity in general (Frimer & Skitka, 2018, 2020; Heltzel & Laurin, 2021), with our original hypothesis inspired by these prior findings, and with the (inconsistent) trend in Studies 2a and 2b suggesting that people specifically prefer senators’ engaging tweets over their dismissing ones. At any rate, this broader majority clearly did not have a preference for dismissing, unlike the frequent reactors, and unlike the image that Twitter reflects.
Intriguingly, however, the broader majority was indistinguishable from frequent reactors when it came to which tweets they intended to like and retweet. That is, even though they generally disapproved more of dismissing than engaging tweets, they were more inclined to reward them with positive feedback. This further helps explain the funhouse-mirror effect: Most people distribute Likes and Retweets in a way that does not align with their privately reported preferences.
How do frequent reactors differ from everyone else?
We anticipated that frequent reactors would be more politically extreme than everyone else, and that this might relate to their unusual preference for dismissing over engaging. But the groups could also differ in other ways, extraneous to our theorizing. Figure 7 presents the between-group differences for all measures contained in our study (see the Supplemental Material for details on measures not described in the Method section; the top bar is our key finding represented as a difference score, subtracting each participant’s preference for dismissing from their preference for engaging).
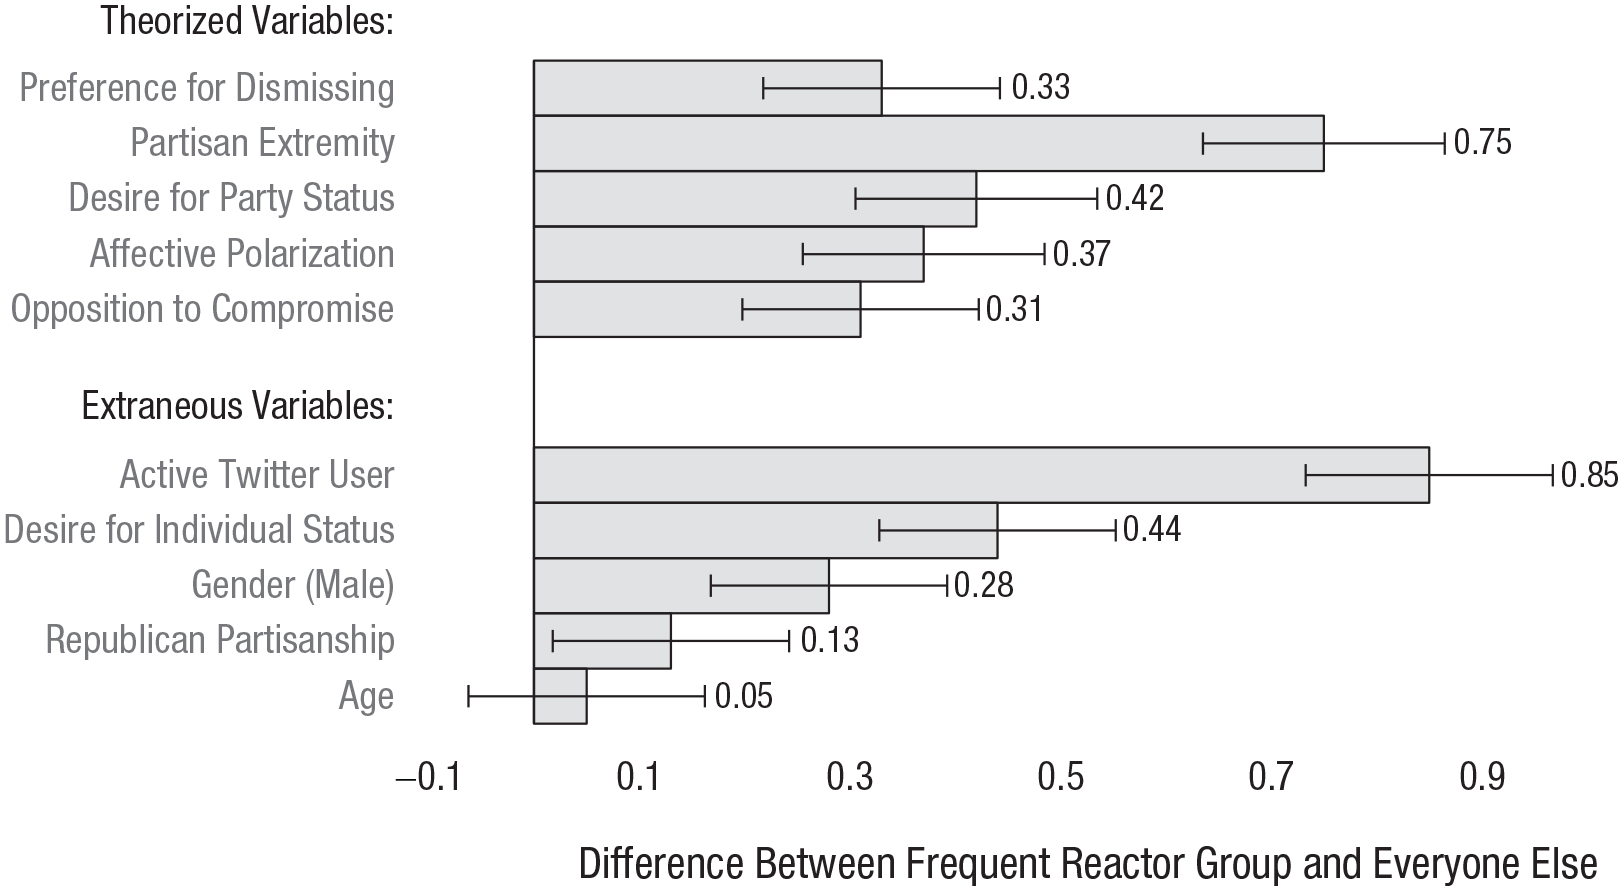
Differences between frequent reactor group and others. Larger values indicate that frequent reactors were higher on this variable than everyone else. Error bars represent standard errors; means appear above their respective bars.
Observing this figure led us to two sets of exploratory analyses that are reported in the Supplemental Material. The first replicated our analyses controlling for the theoretically extraneous differences between frequent reactors and everyone else, finding virtually identical results. The second was a series of mediation analyses exploring which differences between frequent reactors and everyone else might be related to the former’s unusual preferences. These could not offer insight into causality; in no way did they test what caused frequent reactors’ unusual preferences. Given that frequent reactors preferred dismissing over engaging, the aim was simply to test whether this was related to frequent reactors also being, for example, more politically extreme. These analyses found that frequent reactors were indeed especially likely to be political extremists and that the variance these variables shared was distinctly related to preferring dismissing (as opposed to the variance in membership to the frequent-reactor group that did not overlap with political extremism). In serial-mediation models, this was further related to other key attitudes—frequent reactors’ opposition to compromise, their dislike for opponents, and their desire for higher status for their political group—but not to frequent reactors’ theoretically extraneous characteristics.
Discussion
Dismissing tweets’ online popularity tracked the unusual preferences of the minority who frequently react to politicians’ tweets. The remaining majority assigned Likes and Retweets to dismissing tweets despite approving more of engaging tweets; the General Discussion section considers the theoretical implications of this group’s conflicting reports.
Study 4
Study 3 explored frequent users’ distinct characteristics; Study 4 explored characteristics of the tweets that uniquely appealed to them.
Method
Study 4 was not registered; its materials are available at a link provided in the open practices section. A new sample of participants saw 10 real engaging and dismissing tweets; these were drawn in the same fashion as Study 3’s, from those coded as engaging or dismissing in Study 1b. These participants rated each tweet they saw on five attributes. Drawing on previous work on preferences for interparty positivity (Heltzel & Laurin, 2021), these attributes were the degree to which the authors seemed to be each of tolerant, cooperative, rational, willing to legitimize opponents’ views, and willing to change their mind. We used these ratings to answer two questions. First, we asked which tweet attributes differed between dismissing and engaging tweets, expecting that all would. Next, we asked how each of these attributes related to the preferences reported by participants in Study 3. To answer this second question, we merged the data sets from the two studies, treating each tweet’s average rating by Study 4 participants as a characteristic of that tweet. We then tested which of these characteristics predicted frequent reactors’ preferences, which predicted everyone else’s, and how these differed.
Participants
Americans (equal thirds Democrats, Republicans, and Independents) from Prolific Academic participated. Excluding six who reported low-quality data left 261 (age: M = 41.1 years; 47% female, 48% male, 2% nonbinary or agender, 6 missing gender data), each of whom provided 10 observations. Sensitivity analyses indicated we had over 95% power to detect even small effects (d = 0.22).
Procedure
The overall procedure was similar to Study 3’s: Participants rated 10 copartisan tweets, all drawn from those coded as engaging or dismissing in Study 1b. The only difference was that participants did not rate their preferences for the tweets; instead, they rated how much the tweet’s authors seemed “tolerant of people with different opinions,” “cooperative,” “rational, logical,” “able to see the others’ views as reasonable” (which we refer to here as legitimizing opponents’ views), and “open to changing their political views.” For all five attributes they used a 5-point scale (1 = not at all; 5 = very much so). Attributes were generally moderately intercorrelated between .23 (rational and open to changing) and .64 (rational and cooperative); the one exception was that “tolerant” and “cooperative” correlated at .81. For consistency across attributes, we analyzed them all separately. Due to a coding error, a minority of participants saw the last attribute phrased as “unwilling to change their views,” so we reverse-scored these participants’ responses.
Results
Are the five attributes related to engaging versus dismissing?
Based on the work we drew them from (Heltzel & Laurin, 2021), we expected that participants would rate the engaging tweets higher on all five attributes, compared to the dismissing tweets. We tested five multilevel models (nesting ratings within participant and tweet), each predicting one of the five attributes from tweet type (0 = dismissing; 1 = engaging); see Figure 8 and Table 4. As expected, engaging (compared to dismissing) tweets made the senators who posted them seem more tolerant, cooperative, rational, and willing to change their minds, but also gave the appearance of legitimizing opponents’ views more.
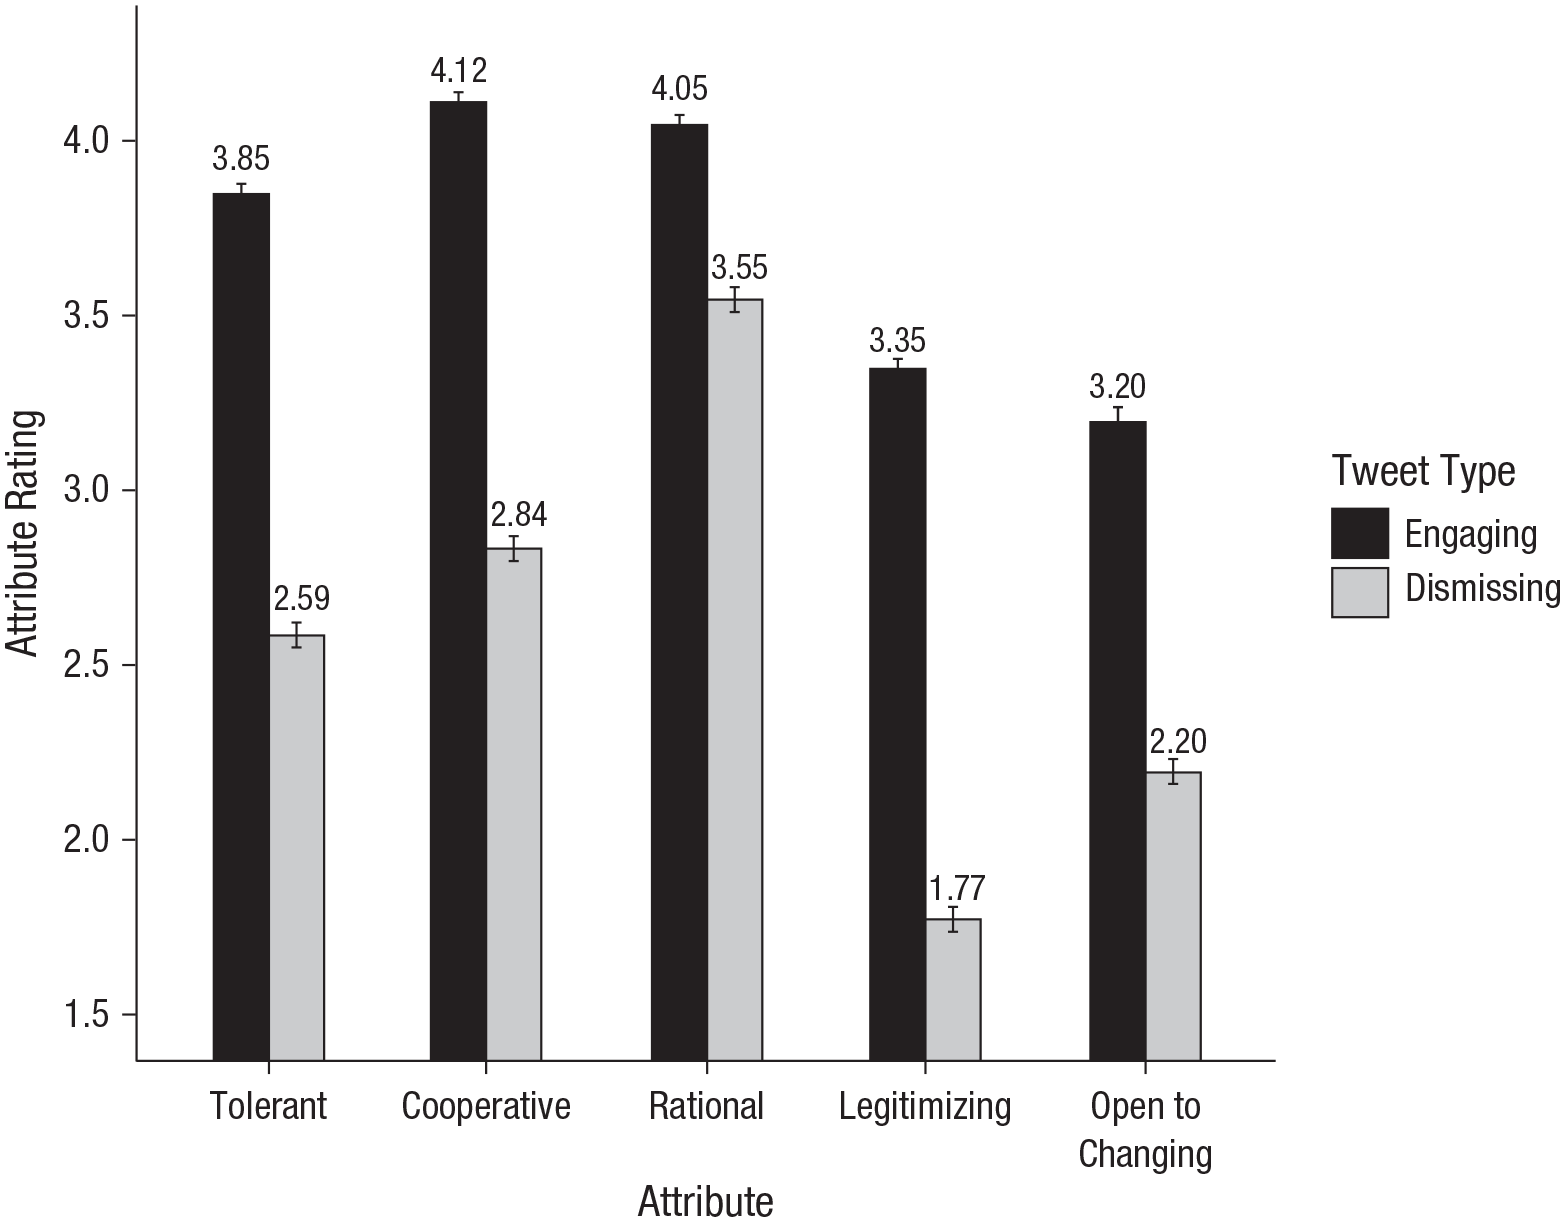
Attribute ratings for engaging and dismissing tweets. Means appear above each bar; error bars reflect standard errors.
Differences in Attribute Ratings for Engaging vs. Dismissing Tweets
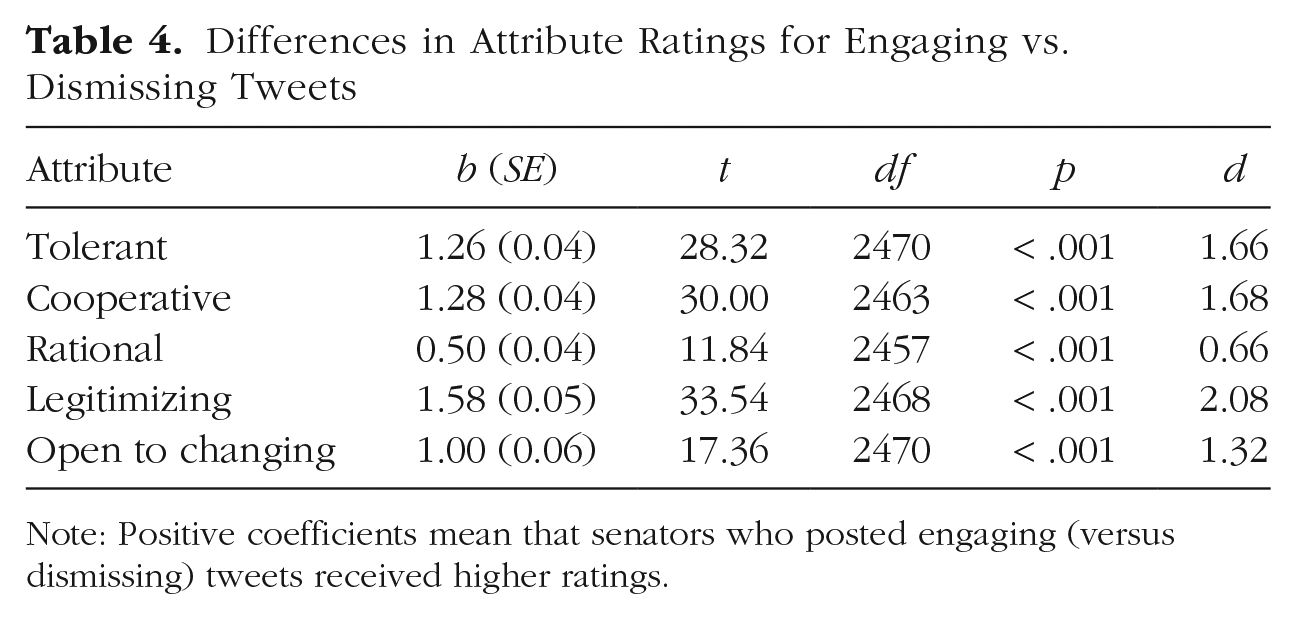
Note: Positive coefficients mean that senators who posted engaging (versus dismissing) tweets received higher ratings.
What appeals to frequent reactors and to everyone else?
To identify which attributes uniquely appealed to frequent reactors, we examined how Study 4 participants’ attribute ratings predicted Study 3 participants’ preferences. Specifically, we computed each tweet’s mean rating on each of the five attributes, across all Study 4 participants. We then merged these mean ratings into the data file for Study 3, which included that study’s participants’ preferences for each tweet. We could then predict these preferences (standardized, and nested within tweet and participant) from participant group (0 = frequent reactors; 1 = everyone else), one of the tweet attributes (mean centered), and their interaction. These models controlled for tweet category to avoid confounding the specific attribute being analyzed with other unmeasured differences between dismissing and engaging tweets. We predicted that at least some Attribute × Participant Group interactions would be significant—that frequent reactors would be different from everyone else in their preferences for at least some kinds of tweet attributes.
All Attribute × Participant Group interactions were significant: Frequent reactors responded differently than everyone else to all attributes. Table 5 reports these interactions separately for each participant group and also presents the simple slopes showing how each attribute predicted preferences.
Trait Perceptions Predicting Responses to Tweets in Study 4
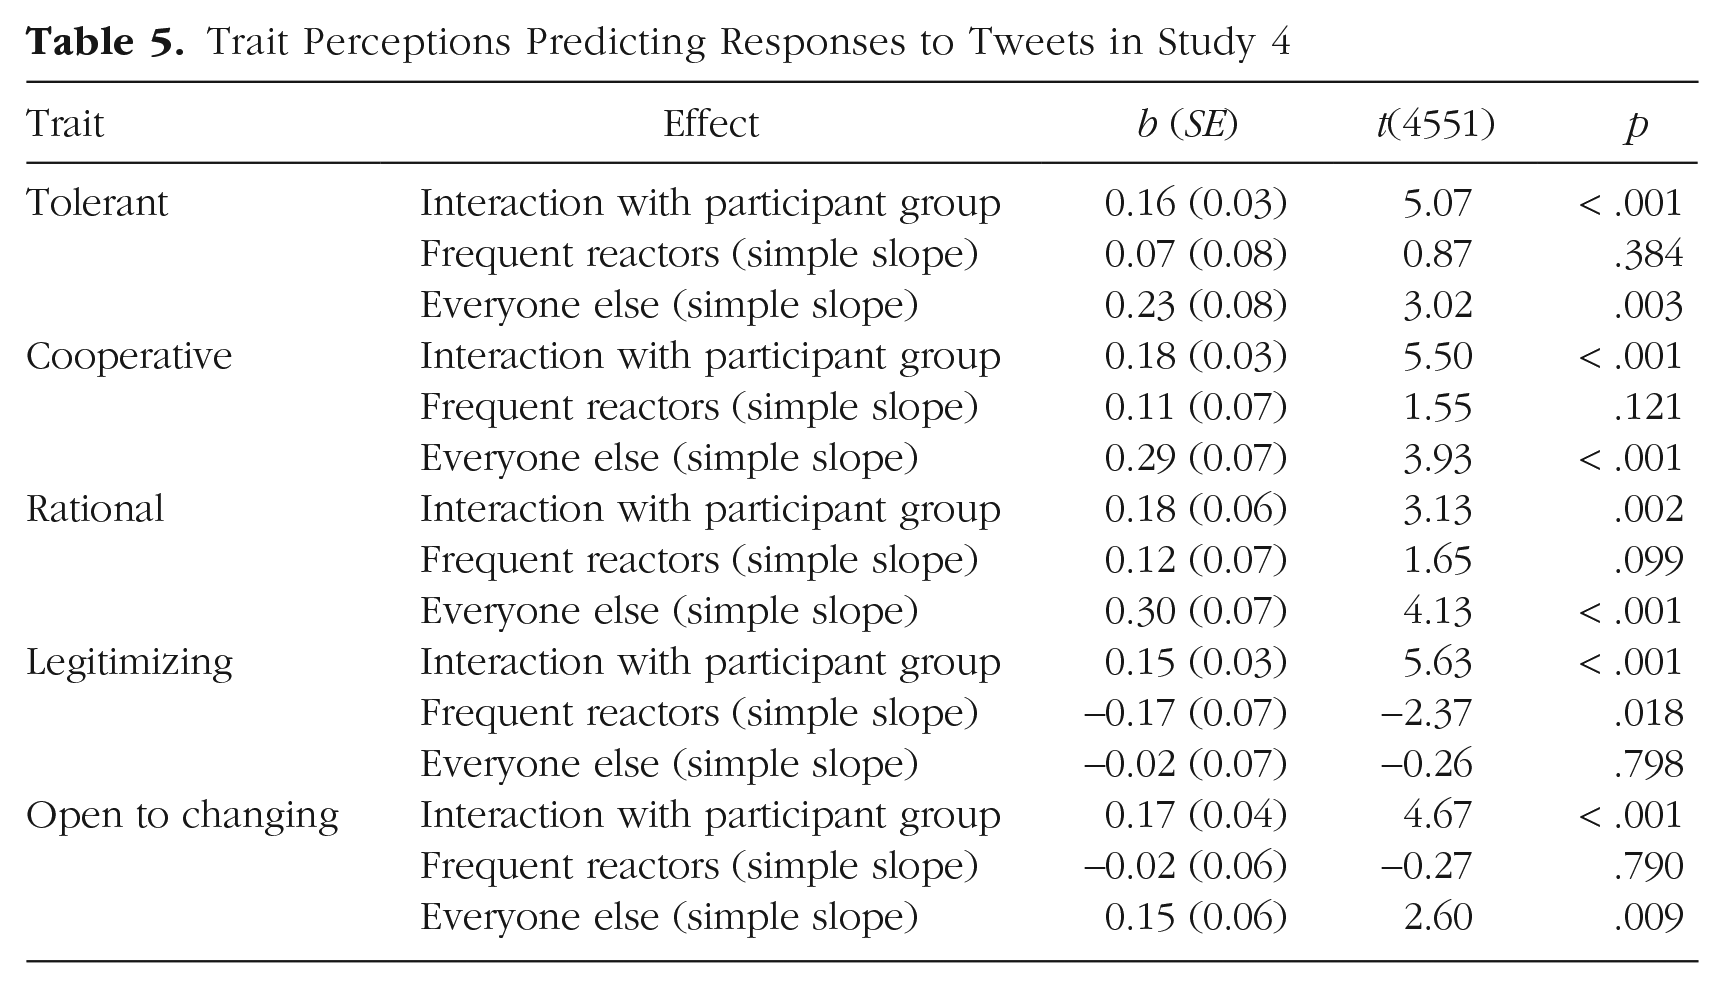
Frequent reactors disliked tweets that legitimized opponents’ views, but their preferences were unrelated to other attributes. Everyone else showed a complementary pattern: They were insensitive to tweets legitimizing opponents’ beliefs but preferred senators who seemed tolerant, cooperative, rational, and (surprisingly, to us) open to changing their mind about politics. These findings add to our understanding of what makes the minority of people who react to politicians’ tweets different from everyone else.
Discussion
Frequent reactors attended more to whether tweets implied the other side might have a point and were unaffected by other attributes that everyone else valued. Thus, these individuals are unique in both their personal characteristics and their preference for delegitimizing opponents.
General Discussion
Recent literature has shown that social media’s rewards misrepresent majority preferences (Rathje et al., 2023). Echoing this, senators’ tweets received more Likes and Retweets for advocating dismissal of opposing political views than for engagement with opposing political views. This distortion has two explanations. First, users who respond to senators’ posts genuinely prefer dismissive tweets. Second, everyone else approves more of engaging tweets, but their occasional Likes and Retweets further amplify dismissing ones.
Theoretical implications
Regarding the first explanation, we offer a psychological profile of people who frequently react to politicians’ tweets, thereby powerfully shaping perceived norms and real-world outcomes. Besides being more likely to be men who desire personal status, they are politically extreme, affectively polarized, and opposed to compromise, and they want status for their party, and they prefer delegitimizing opponents. These traits—characteristic of moral conviction (Finkel et al., 2020; Goodwin, 2018; Schwalbe et al., 2020)—predicted their unusual preference for dismissive content.
Regarding the second explanation, our findings caution against inferring population or even individual approval from social-media rewards. The majority’s online behavior notably contradicted their preferences. This is theoretically consistent with pluralistic ignorance (Prentice & Miller, 1996): Online discourse overrepresents frequent reactors’ divisive opinions, so the silent majority may mistake these widely expressed beliefs as widely held and may then publicly conform to them, perpetuating the misperception (Robertson et al., 2024).
Thus perceived, rather than actual, norms can shape behavior through compliance. Our findings illustrate how highly visible individuals can warp these perceptions. Extremists, perhaps motivated by moral convictions, frequently voice their opinions (Guan et al., 2024), whereas the majority passively consumes online content, so digital platforms amplify zealots’ opinions, distorting norms.
Pressing questions
Social media’s features make it a uniquely negative context (Crockett, 2017), but Studies 3 and 4 highlight person-level characteristics driving this negativity. Which is more fundamental? Do political extremists self-select into politicized contexts like Twitter to connect with and influence political leaders (e.g., Nordbrandt, 2021; Zhuravskaya et al., 2020), bringing their negativity with them? Or does repeated exposure to Twitter’s political discourse make negativity seem acceptable and opponents intolerable (Wilson et al., 2020), radicalizing even moderates into polarized extremists (Bail et al., 2018)?
Either way, based on our findings, we caution against interpreting social-media virality as reflecting popular opinion (e.g., McGregor, 2019). Alerting people to these warped norms might inoculate them from overgeneralizing extremist minorities’ opinions. However, future work may find that people admire extremists and want to follow their lead (Goldenberg et al., 2023).
Generalizability
Contexts besides Twitter may also misrepresent majority preferences for engaging. Online platforms or subcommunities reputed for political discourse (e.g., Facebook, political subreddits; Kim et al., 2021; Sun et al., 2021) likely have similar dynamics (Rathje et al., 2021). Extreme frequent reactors likewise pervade offline political contexts, like town halls (Pew Research Center, 2022a), potentially toxifying discourse there, too (Bor & Petersen, 2022). Majority preferences may be more evident in contexts less attractive to political extremists (e.g., sports events, Instagram, r/RarePuppers; see Mamakos & Finkel, 2023). If our findings rely on extremists being driven by moral concerns, those results may be attenuated in places and times when politics and morals are decoupled (Guan et al., 2024).
Conclusion
Even if Twitter declines or disappears altogether, understanding its contemporary dynamics may help explain patterns across platforms (Rathje et al., 2023) and may be of interest to any architects of social media aiming for spaces that represent more typical and cooperative voices.
Supplemental Material
sj-pdf-1-pss-10.1177_09567976241258149 – Supplemental material for Why Twitter Sometimes Rewards What Most People Disapprove of: The Case of Cross-Party Political Relations
Supplemental material, sj-pdf-1-pss-10.1177_09567976241258149 for Why Twitter Sometimes Rewards What Most People Disapprove of: The Case of Cross-Party Political Relations by Gordon Heltzel and Kristin Laurin in Psychological Science
Footnotes
Transparency
Action Editor: Mark Brandt
Editor: Patricia J. Bauer
Author Contributions
References
Supplementary Material
Please find the following supplemental material available below.
For Open Access articles published under a Creative Commons License, all supplemental material carries the same license as the article it is associated with.
For non-Open Access articles published, all supplemental material carries a non-exclusive license, and permission requests for re-use of supplemental material or any part of supplemental material shall be sent directly to the copyright owner as specified in the copyright notice associated with the article.