
Abstract
Confidence is an adaptive computation when environmental feedback is absent, yet there is little consensus regarding how perceptual confidence is computed in the brain. Difficulty arises because confidence correlates with other factors, such as accuracy, response time (RT), or evidence quality. We investigated whether neural signatures of evidence accumulation during a perceptual choice predict subjective confidence independently of these factors. Using motion stimuli, a central-parietal positive-going electroencephalogram component (CPP) behaves as an accumulating decision variable that predicts evidence quality, RT, accuracy, and confidence (Experiment 1, N = 25 adults). When we psychophysically varied confidence while holding accuracy constant (Experiment 2, N = 25 adults), the CPP still predicted confidence. Statistically controlling for RT, accuracy, and evidence quality (Experiment 3, N = 24 adults), the CPP still explained unique variance in confidence. The results indicate that a predecision neural signature of evidence accumulation, the CPP, encodes subjective perceptual confidence in decision-making independent of task performance.
Keywords
When humans make decisions, they are typically able to introspect about the probability that a choice was correct and provide a subjective judgment of their own confidence in that choice. In the absence of external feedback, confidence judgments are thought to serve an important functional role in adaptive behavior. Insofar as confidence reflects uncertainty in one’s choice, it can help guide future decision policies (Desender et al., 2018; Rollwage et al., 2020; Talluri et al., 2018; van den Berg et al., 2016) or be used to adaptively weight the integration of different information sources into a single choice (Braun et al., 2018; Samaha et al., 2019; Urai et al., 2019). For instance, people may decide to allocate resources to collecting more evidence when they have low confidence in their initial choice (Desender et al., 2018; Kepecs et al., 2008; Yeung & Summerfield, 2012). Moreover, confidence has played an important role in theorizing about conscious perception, with some arguing that perceptual awareness involves a metacognitive component akin to introspection (Brown et al., 2019; Ko & Lau, 2012) and that confidence judgments can sometimes signal the presence of conscious perception better than the ability to make correct perceptual choices (Michel, 2022).
A growth in interest in confidence in recent decades has given rise to many different models of the underlying computations (Aitchison et al., 2015; Fetsch et al., 2014; Fleming & Daw, 2017; Kepecs et al., 2008; Kiani et al., 2014; Kiani & Shadlen, 2009; Maniscalco & Lau, 2016; Meyniel et al., 2015; Peters, 2022; Pleskac & Busemeyer, 2010; Pouget et al., 2016; Sanders et al., 2016). There is currently little consensus on which models best capture human confidence behavior (Rahnev et al., 2022), which has given rise to a wide variety of proposals regarding how confidence is encoded in neural activity. Some have argued that confidence is read out in an approximately Bayesian fashion from population-level representations of uncertainty within sensory areas, which naturally explains the close empirical link between confidence judgments and decision accuracy (Geurts et al., 2022; Khalvati et al., 2021; Meyniel et al., 2015). Yet other studies have approached the question from an evidence-accumulation perspective, highlighting the contributions of decision-related brain dynamics to confidence (Desender, Donner, et al., 2021; Fetsch et al., 2014; Gherman & Philiastides, 2015; Kiani et al., 2014; Kiani & Shadlen, 2009). According to many evidence-accumulation models, confidence can be read out from not only the amount of evidence accumulated for a particular choice but also by the time it took for that much evidence to be acquired, thus linking confidence to accuracy as well as response times (RTs; Fetsch et al., 2014; Kiani et al., 2014; Pleskac & Busemeyer, 2010; Vickers, 1979; Zylberberg et al., 2016). Some evidence-accumulation models have also highlighted the possibility that confidence is not based on the identical evidence that underlies people’s choices, but rather on evidence that continued to accumulate after those choices, illuminating the means by which decision makers may change their minds (Desender, Donner, et al., 2021; Desender, Ridderrinkhof, et al., 2021; Navajas et al., 2016).
One difficulty in pinpointing neural correlates of confidence is that confidence judgments are typically tightly coupled to the accuracy of one’s decision and to the quality of perceptual evidence, so that easier trials or trials where observers acquired better evidence are accompanied by higher levels of confidence. This means that putative signatures of confidence in the brain could potentially reflect task difficulty or signal quality rather than subjective confidence per se (Lau & Passingham, 2006; Peters et al., 2016, 2017; Samaha, 2015). However, recent psychophysical work has uncovered systematic deviations between confidence and accuracy that can be exploited in order to experimentally manipulate confidence separately from task performance (Koizumi et al., 2015; Maniscalco et al., 2016; Samaha & Denison, 2022; Samaha et al., 2016, 2019; Zylberberg et al., 2012). For example, when confidence and accuracy were dissociated, neurons in the superior colliculus that were previously thought to encode confidence in an oculomotor decision were found to primarily track decision difficulty, but not the animal’s confidence behavior (Odegaard et al., 2018).
Here, we studied neural correlates of perceptual confidence in humans across three experiments combining recordings of electroencephalography (EEG) and psychophysical manipulations of confidence, accuracy, reaction time, and the quality of perceptual evidence. We focused on an event-related potential (ERP) component termed the central parietal positivity (CPP), which has previously been found to encode the (unsigned) accumulated evidence for a perceptual decision (Kelly et al., 2021; Kelly & O’Connell, 2013; O’Connell et al., 2012, 2018). In particular, the buildup rate (or slope) of the CPP has previously been found to correlate with evidence strength, reaction time, and accuracy and is thought to reflect an amodal decision signal in that it shows similar dynamics and has the same parietal scalp distribution regardless of the sensory modality or motor-response demands (O’Connell et al., 2012). The CPP has also been shown to correlate with confidence judgments (Gherman & Philiastides, 2015; Herding et al., 2019; Shooshtari et al., 2019), although not yet when confidence is experimentally dissociated from accuracy. Across three different experiments, we found CPP slope, prior to choice initiation, to be a reliable predictor of subjective perceptual confidence, bolstering the notion that humans map the predecision evidence accumulated in a given period of time onto a subjective assessment of confidence. However, they do so in a way that allows confidence to be divorced from the actual accuracy of one’s decision, in violation of some normative Bayesian proposals (Geurts et al., 2022; Meyniel et al., 2015; Sanders et al., 2016).
Statement of Relevance
While making perceptual decisions, people often feel a sense of confidence in their choice. This metacognitive capacity is critical for making adaptive behaviors, such as learning from mistakes or optimizing the allocation of limited cognitive resources. In this research, we investigated how the brain computes confidence by recording electroencephalograms (EEGs) while participants were performing motion-perception tasks and rating confidence. We found a neural signal around 300 ms after viewing the motion stimulus and 250 ms prior to making a decision that indexed participants’ confidence regardless of their decision accuracy, response time (RT), and the evidence quality of the stimulus. Our findings indicate that confidence computation in the brain is more complex than just evaluating whether the decision is right or wrong, how quickly people make decisions, and how good the evidence contained in a given stimulus is.
Open Practices Statement
None of the experiments reported in this article were preregistered. All data and analysis scripts associated with this article are available at the Samaha lab’s OSF repository (https://osf.io/pvahg/).
Method
Participants
Twenty-five participants (12 men; age range 18–30 years) completed Experiment 1; 26 participants (6 men; age range 18–40 years) completed Experiment 2 (1 participant was removed from analyses because of an error—using the wrong response keys in the final blocks of the task). Twenty-five participants (8 men; age range 18–31 years) completed Experiment 3 (1 was excluded because of rating a confidence level of 4 on 96% of trials). We aimed for a sample size of 25 participants per study, on par with similar recent experiments examining EEG signatures of confidence (Gherman & Philiastides, 2015, 2018). After finding positive effects in Experiment 1, we aimed for samples of 25 for Experiments 2 and 3. All participants were recruited from the University of California, Santa Cruz (UCSC) for course credit. They reported normal or corrected-to-normal vision and provided written informed consent. All procedures were approved by the institutional review board at UCSC.
Stimulus and apparatus
In all experiments, stimuli were presented on a black background using an electrically shielded VIEWPixx/EEG monitor (120 Hz refresh rate, resolution 1920 × 1080 pixels) that was ~53 cm wide and was viewed at a distance of ~69.5 cm from a chinrest. Stimulus presentation and behavioral data were controlled by Psychophysics Toolbox (Version 3; Kleiner et al., 2007; Pelli, 1997) running in the MATLAB environment.
In all experiments, the target stimulus consisted of 150 white dots (0.03° each) presented within a 5° aperture centered on fixation. For each stimulus, a percentage of the dots (referred to as the motion-coherence level) was randomly selected on each frame to be displaced by a fixed distance of 0.042° (corresponding to a motion speed of 5°/s) in either the left or right direction on the following frame. The rest of the dots were placed randomly and independently within the circular aperture. A red dot (0.25° of visual angle) on which participants were asked to fixate was superimposed atop the center of the dot stimuli. To prevent tracking of any single dot and encourage responses based on global motion direction, we set each dot to have a lifetime of 66 ms.
In Experiments 1 and 3, motion coherence was chosen from one of the following six levels: 1%, 4.5%, 8%, 12%, 25%, or 40%, with equal probability. In Experiment 2, we created high and low positive evidence (PE) stimuli by setting the coherence to be 50% in the high-PE condition and 25% in the low-PE condition. We then used a one-up, three-down staircase procedure prior to the main task that varied the amount of negative evidence (NE; i.e., a motion signal in the opposite direction from the PE), so that the high- and low-PE trials both approximated 79% accuracy.
Procedure
Experiment 1
Participants were tested individually in a dim, sound-attenuated room. The experimenter explained the instructions to the participant and verified that the participant understood the instructions before proceeding to the practice trials and critical blocks. The participant completed a practice block with 180 trials using an easier set of coherence levels than the critical task (5%, 30%, 40%, or 70%). On each practice trial, a beep sound was heard if participants incorrectly judged the motion direction. No feedback was presented on the critical trials. Participants proceeded to the critical blocks only if they achieved 80% accuracy (or greater) on the 70% coherence practice trials. Participants who failed to reach this standard in the very first practice block performed more practice blocks until they met the criteria. This criterion was set to ensure that participants fully understood the task and could perceive the motion signals.
In critical trials, participants performed a random-dot-motion (RDM) discrimination task (Kelly & O’Connell, 2013; Roitman & Shadlen, 2002) with confidence ratings. Participants were told that they would be presented with a group of moving dots on each trial, with some dots moving toward either the left or right and the rest moving randomly. Participants were instructed to report the global direction of motion, along with their confidence, as quickly and accurately as possible. Each trial began with a red fixation point presented in the center of the screen for a random intertrial interval of between 1,000 and 1,500 ms. The dot-motion stimulus then appeared for 300 ms, with the red dot remaining on the screen until participants pressed a single key to indicate both the direction of the global motion and their confidence rating, using a 4-point scale. We informed participants that “1” denotes a random guess at the motion direction and “4” denotes high confidence in their decision. Participants were instructed to keep the fingers of their left hand (from pinky finger to index finger, respectively) on keys “A,” “S,” “D,” and “F,” which represented left motion with the confidence rating from 4 to 1. They also kept the fingers of their right hand on keys “J,” “K,” “L,” and “;”, representing right motion with confidence from 1 to 4, respectively.
Each participant completed 1,080 trials in total, consisting of 180 trials within each motion-coherence level. The trials were presented in six blocks with 180 trials in each block. Motion direction and coherence level varied pseudorandomly on a trial-by-trial basis.
Experiment 2
Participants first performed 80 trials of practice with 50% and 25% coherence PE stimuli with low-NE coherence levels (10% and 1.5%, respectively). Auditory feedback was given after each error during the practice. If overall performance was below 80% after the first practice block, a second block was administered. Following practice, 200 trials of an adaptive staircase procedure were performed wherein the NE coherence increased by 3% following a correct response and decreased by 3% following three incorrect responses. Two separate staircases were interleaved for the high- and low-PE stimuli in order to find NE thresholds for each PE level with about 79% accuracy. Following the staircase, 1,080 trials of the critical task were run and split into six blocks. NE levels for high- and low-PE stimuli were fixed throughout the critical task, and high- or low-PE stimuli were randomly presented on each trial. Participants provided responses in the same manner as in Experiment 1.
Experiment 3
The procedure was identical to that of Experiment 1 except that participants were instructed to report the motion direction and confidence sequentially. After the stimulus disappeared, participants either pressed the “<” key using the right index finger (to indicate leftward motion) or pressed the “>” key using the right middle finger (to indicate rightward motion). Participants then pressed one of the number keys (1–4) across the top row of the keyboard, using their left hand, in order to indicate their confidence. Participants completed 1,080 trials split into six blocks.
EEG recording and analysis
In all experiments, continuous EEG was acquired from 63 active electrodes (BrainVision actiCHamp, iMotions A/S, Copenhagen, Denmark), with impedance at each central-parietal electrode kept below 20kΩ. Recordings were digitized at 1000 Hz, and FCz was used as the online reference. EEG was processed offline using custom scripts in MATLAB (version R2019b) and using EEGLAB toolbox (Delorme & Makeig, 2004). Data were high-pass filtered at 0.1 Hz and low-pass filtered at 30 Hz using a zero-phase Hamming-windowed sinc FIR filter and then downsampled to 500 Hz. Data were rereferenced offline to the average of all electrodes. Continuous signals were then segmented into epochs centered on stimulus onset using a time window of −2,000 ms to 2,000 ms. Individual trials were rejected if eye-blinks occurred during stimulus presentation or if any scalp channel exceeded ±100 μV at any time during the interval extending from −500 to 500 ms relative to the stimulus onset. On average, 209 trials were rejected for each participant in Experiment 1, 130 trials were rejected for each participant in Experiment 2, and 140 trials were rejected for each participant in Experiment 3. Trials excluded from the EEG data were also not involved in the analysis of behavior. Noisy channels were spherically interpolated, and an independent components analysis (infomax algorithm) was performed to identify and subtract one or two components per subject that reflected eye-blinks or eye movements. Last, a prestimulus baseline of −200 ms to 0 ms was subtracted from each trial.
After inspecting the grand average scalp topographies from Experiment 1 (within the time window of 250 ms to 450 ms poststimulus onset and −510 ms to −130 ms prior to response execution), we chose the following electrodes for all subsequent analyses across all experiments: CPz, CP1, CP2, Pz, P1, and P2. These electrodes captured the maximum CPP amplitude and were chosen on the basis of the grand average waveform, independent of any subsequent comparison between conditions.
Statistical analyses
In all experiments, the CPP buildup rate was defined as the slope of a line fit to each participant’s average CPP waveform. (For example fits, see Fig. S1 in the Supplemental Material.) CPP slope was used as the primary EEG metric (rather than more traditional amplitude measures) because it is more theoretically related to the construct of evidence-accumulation rate. However, slope and amplitude are not independent, as a pure amplitude change in an ERP component could give rise to slope differences, and a pure slope difference is expected to also result in amplitude differences. Thus, we also complement the main slope analysis reported here with cluster-based permutation tests on amplitude at each electrode and time point (reported in Figs. S2, S3, and S4 in the Supplemental Material).
For slope-fitting, we used a 200-ms sliding window, advanced in 10-ms steps between 100 ms to 550 ms relative to the stimulus-aligned CPP waveform and −1,000 ms to −10 ms relative to the response-aligned CPP waveform. We then fitted separate linear models predicting CPP slopes at each time window by motion-coherence level, RT (divided into 5 quantiles), accuracy (correct or incorrect), confidence (high or low, based on a participant-specific mean split), and positive evidence (high or low; Experiment 2 only). For each model, we compared the regression slopes at each time window to zero (one-tailed) and used a nonparametric, cluster-based permutation test to correct for multiple comparisons across time (Maris & Oostenveld, 2007). Specifically, we stored the largest cluster of significant time points across each of the 10,000 permutations of the data; we only considered clusters in the real data that surpassed the 95th percentile of this distribution of cluster sizes expected under the null hypothesis.
In Experiment 3, we also ran a single-trial multiple-regression model (Cohen & Cavanagh, 2011) by fitting a line to single-trial EEG signal between 250 and 500 ms relative to stimulus onset and from −300 to −100 ms relative to the response. We stored the beta coefficients (slopes) for each trial and then fitted a linear model predicting single-trial EEG slopes using confidence, coherence level, accuracy, and RT as the predictors. Single-trial slopes and RTs were both rank-scored in the model to mitigate the effect of potential outliers while still testing for monotonic relationships. Thus, the model had the form Y = INT + b1CONF + b2COH + b3RT + b4ACC, where Y represents rank-scored single-trial EEG buildup rates; INT is the intercept; b1–4 are regression coefficients; and CONF, COH, RT, and ACC are trial vectors of the participant’s confidence, coherence level, rank-scored reaction time, and accuracy on each trial. The resulting t value of each predictor for each participant represents the normalized effect of that predictor on single-trial EEG slopes. These t values were saved for each participant and predictor and tested against zero at the group level using two-tailed, repeated-measures t tests.
Finally, because the predictors in the model described above are all collinear (e.g., coherence is related to RT), we also tested the ability of more specific, residualized regression models to predict single-trial EEG slopes from confidence. Specifically, we tested a series of models in which EEG slopes were first residualized for coherence, or RT, or accuracy (all separate models), and then confidence was used to predict these residuals. This allowed us to further explore the unique contributions of the CPP slope to confidence judgments.
Results
A neural signature of perceptual evidence accumulation
We first sought to identify a neural signature of perceptual evidence accumulation by manipulating the quality of stimulus evidence and testing the CPP for three features observed in prior work (Kelly & O’Connell, 2013; O’Connell et al., 2012). Namely, if the CPP reflects (unsigned) evidence accumulation, its slope (or buildup rate) should increase with the quality of stimulus evidence, should decrease with increasing RTs, and should increase for correct compared to incorrect choices. We then sought to test whether CPP also predicted confidence ratings provided for each decision. To this end, we adopted an RDM task in which a field of moving dots was presented inside a circular aperture, with a fraction of dots moving coherently to the left or right and the rest moving randomly (Fig. 1a). In Experiment 1, we manipulated the strength of sensory evidence by varying motion coherence between 1%, 4.5%, 8%, 12%, 25%, or 40% randomly across trials; higher coherence indicates a stronger motion signal in one direction or the other. After a stimulus presentation (300 ms), participants (N = 25) were asked to simultaneously report the global direction of motion (left or right) and their level of confidence (on a scale ranging from 1–4) as quickly and accurately as possible, using a single key press. As shown in Figure 1b, increasing motion coherence led to higher confidence, F(5, 120) = 91.32, p < .001, η2 = .79; faster RTs, F(5, 120) = 74.45, p < .001, η2 = .67; and higher accuracy, F(5, 120) = 388.16, p < .001, η2 = .94—consistent with evidence-accumulation-model predictions of the RDM task, as described in prior work (Fetsch et al., 2014).
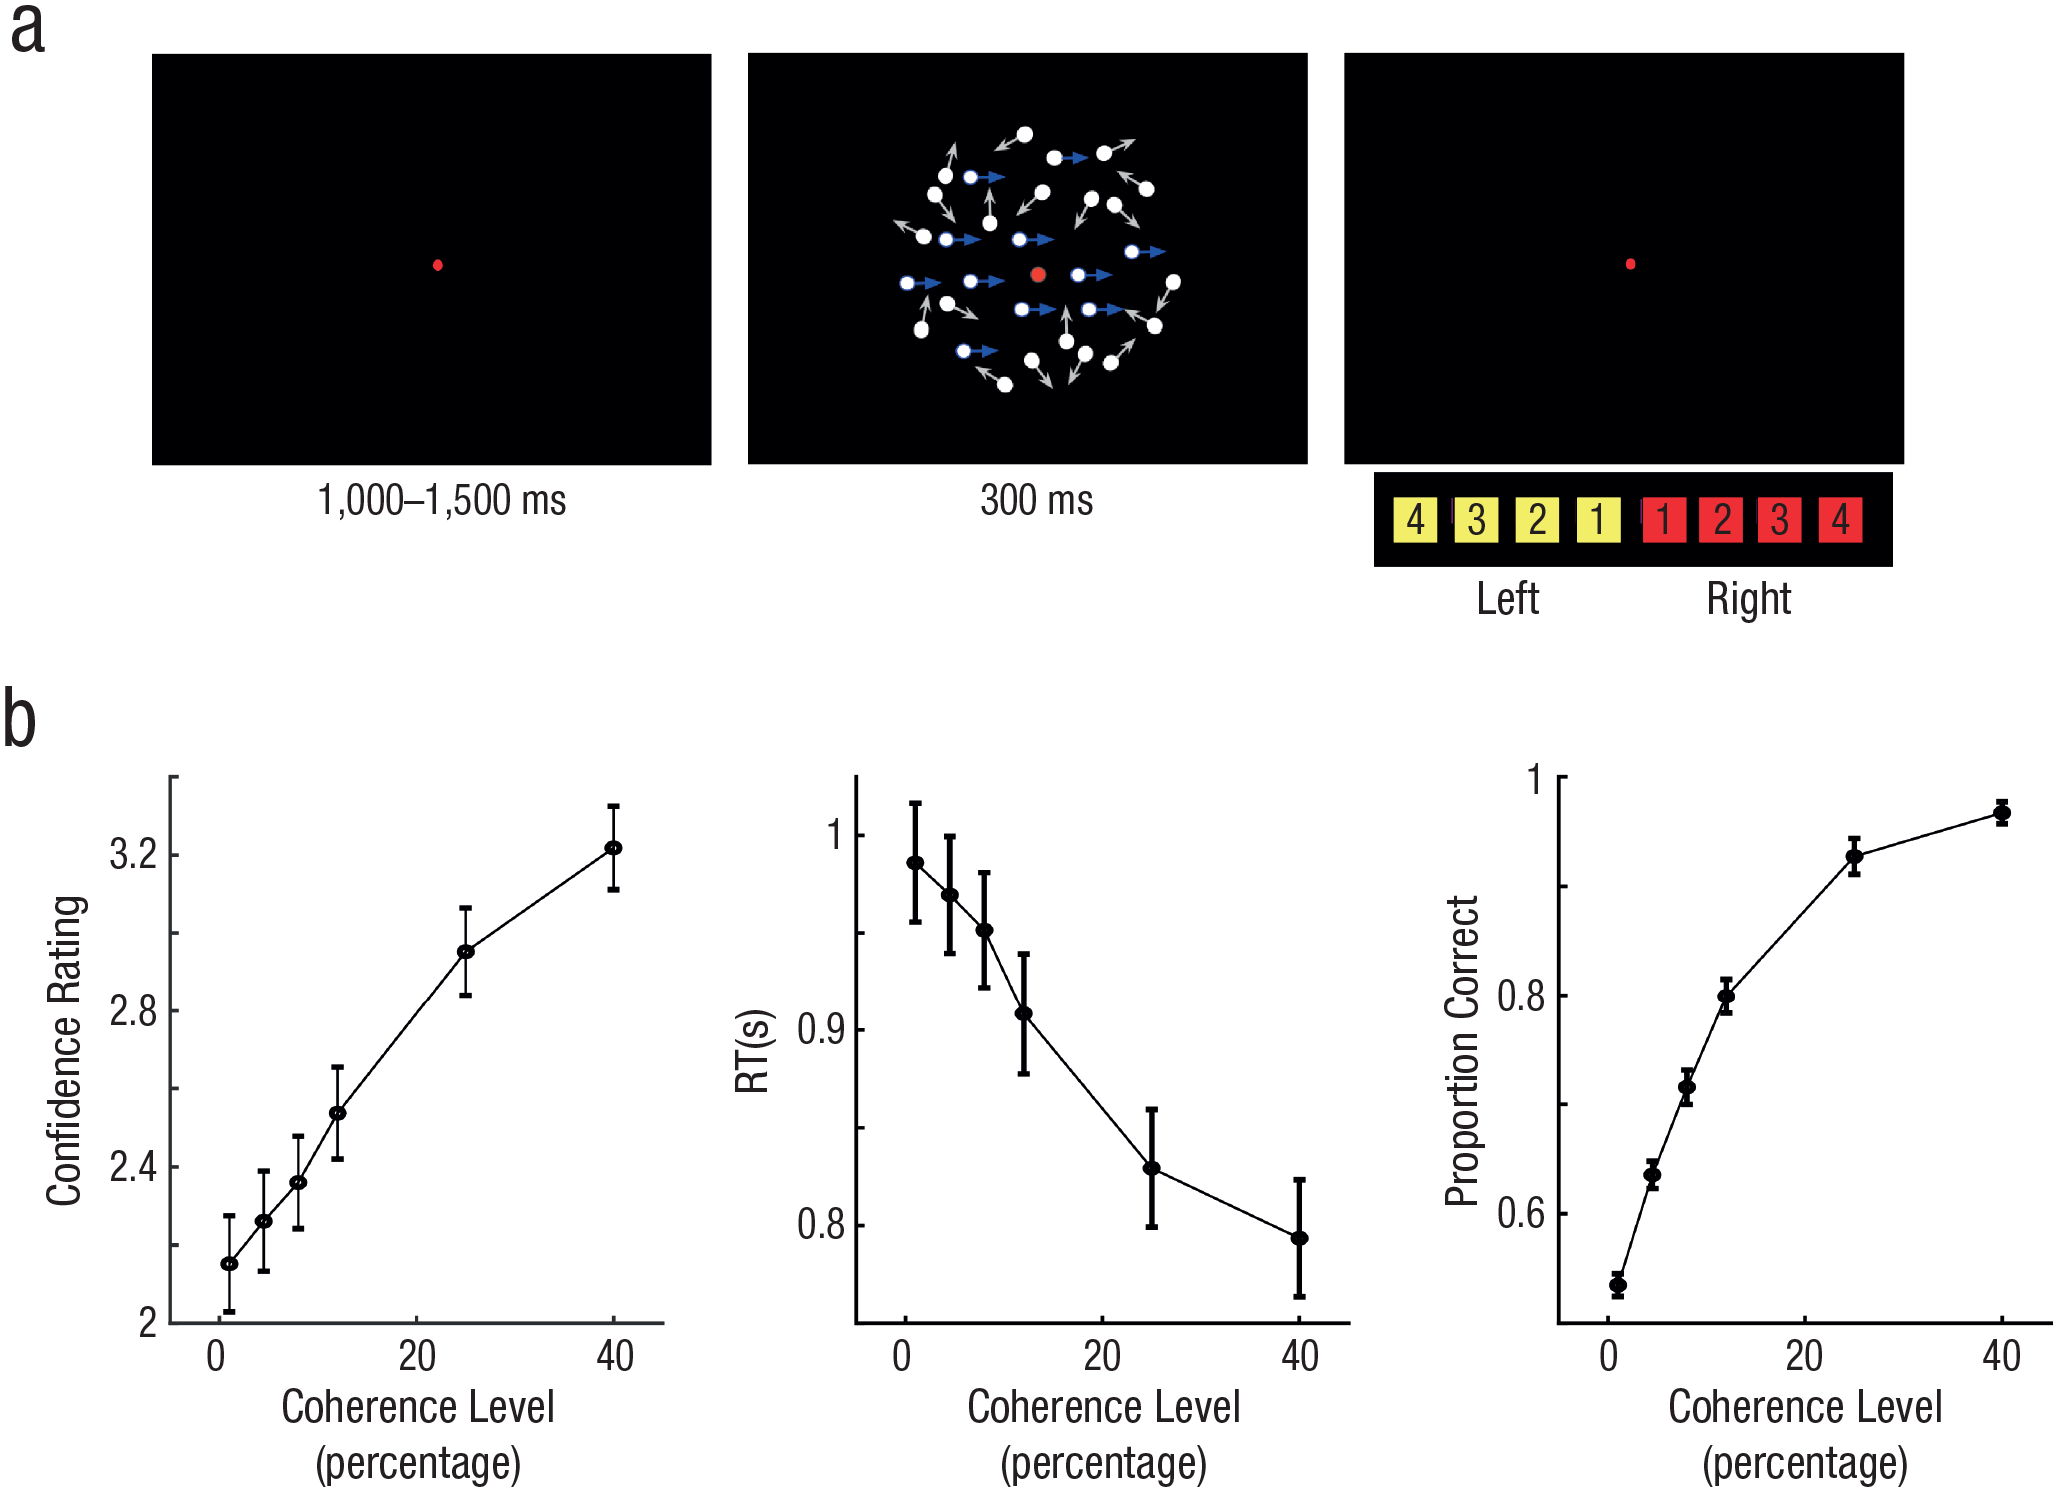
Example trial and behavioral results for Experiment 1 (N = 25). Each trial commenced with a central red fixation dot (a), which was displayed for 1,000 to 1,500 ms. A random-dot-motion stimulus was then presented for 300 ms in either a leftward or rightward direction (motion coherence was sampled randomly on each trial from the following values: 1%, 4.5%, 8%, 12%, 25%, or 40%). Participants simultaneously reported the motion direction (left vs. right) and their confidence in the decision (on a scale from 1−4) with a single button press. In (b), we show how confidence rating (left plot) and proportion correct (right plot) increased with higher coherence level and reaction time (RT; middle plot) decreased. Error bars denote ±1 SEM (across participants). Blue and white arrows in (a) represent example dot-motion trajectories and were not shown in the actual displays.
During decision formation, we observed a positive ERP component over central parietal electrodes whose activity peaked around 500 ms poststimulus (Fig. 2, left) and ramped up prior to the motor response (Fig. 2, right), resembling the CPP (O’Connell et al., 2012; Twomey et al., 2015). If this signal encodes accumulated evidence, then the relevant parameter for capturing the rate of evidence accumulation is the slope of the CPP component. To this end, we fitted a line to each participant’s average CPP waveform, using a 200-ms sliding window. This window advanced in 10-ms steps between 100 ms and 550 ms relative to the stimulus-aligned CPP waveform, and between −1000 ms and −10 ms relative to the response-aligned CPP waveform. We then fitted separate linear models predicting CPP slopes at each time window by motion-coherence level, RT (divided into 5 quantiles), accuracy (correct or incorrect), and confidence (high or low, based on a participant-specific mean split). For each model, we compared the regression slope at each time window to zero (one-tailed) using a nonparametric, cluster-based permutation test to correct for multiple comparisons across time (See the Method section; Maris & Oostenveld, 2007).
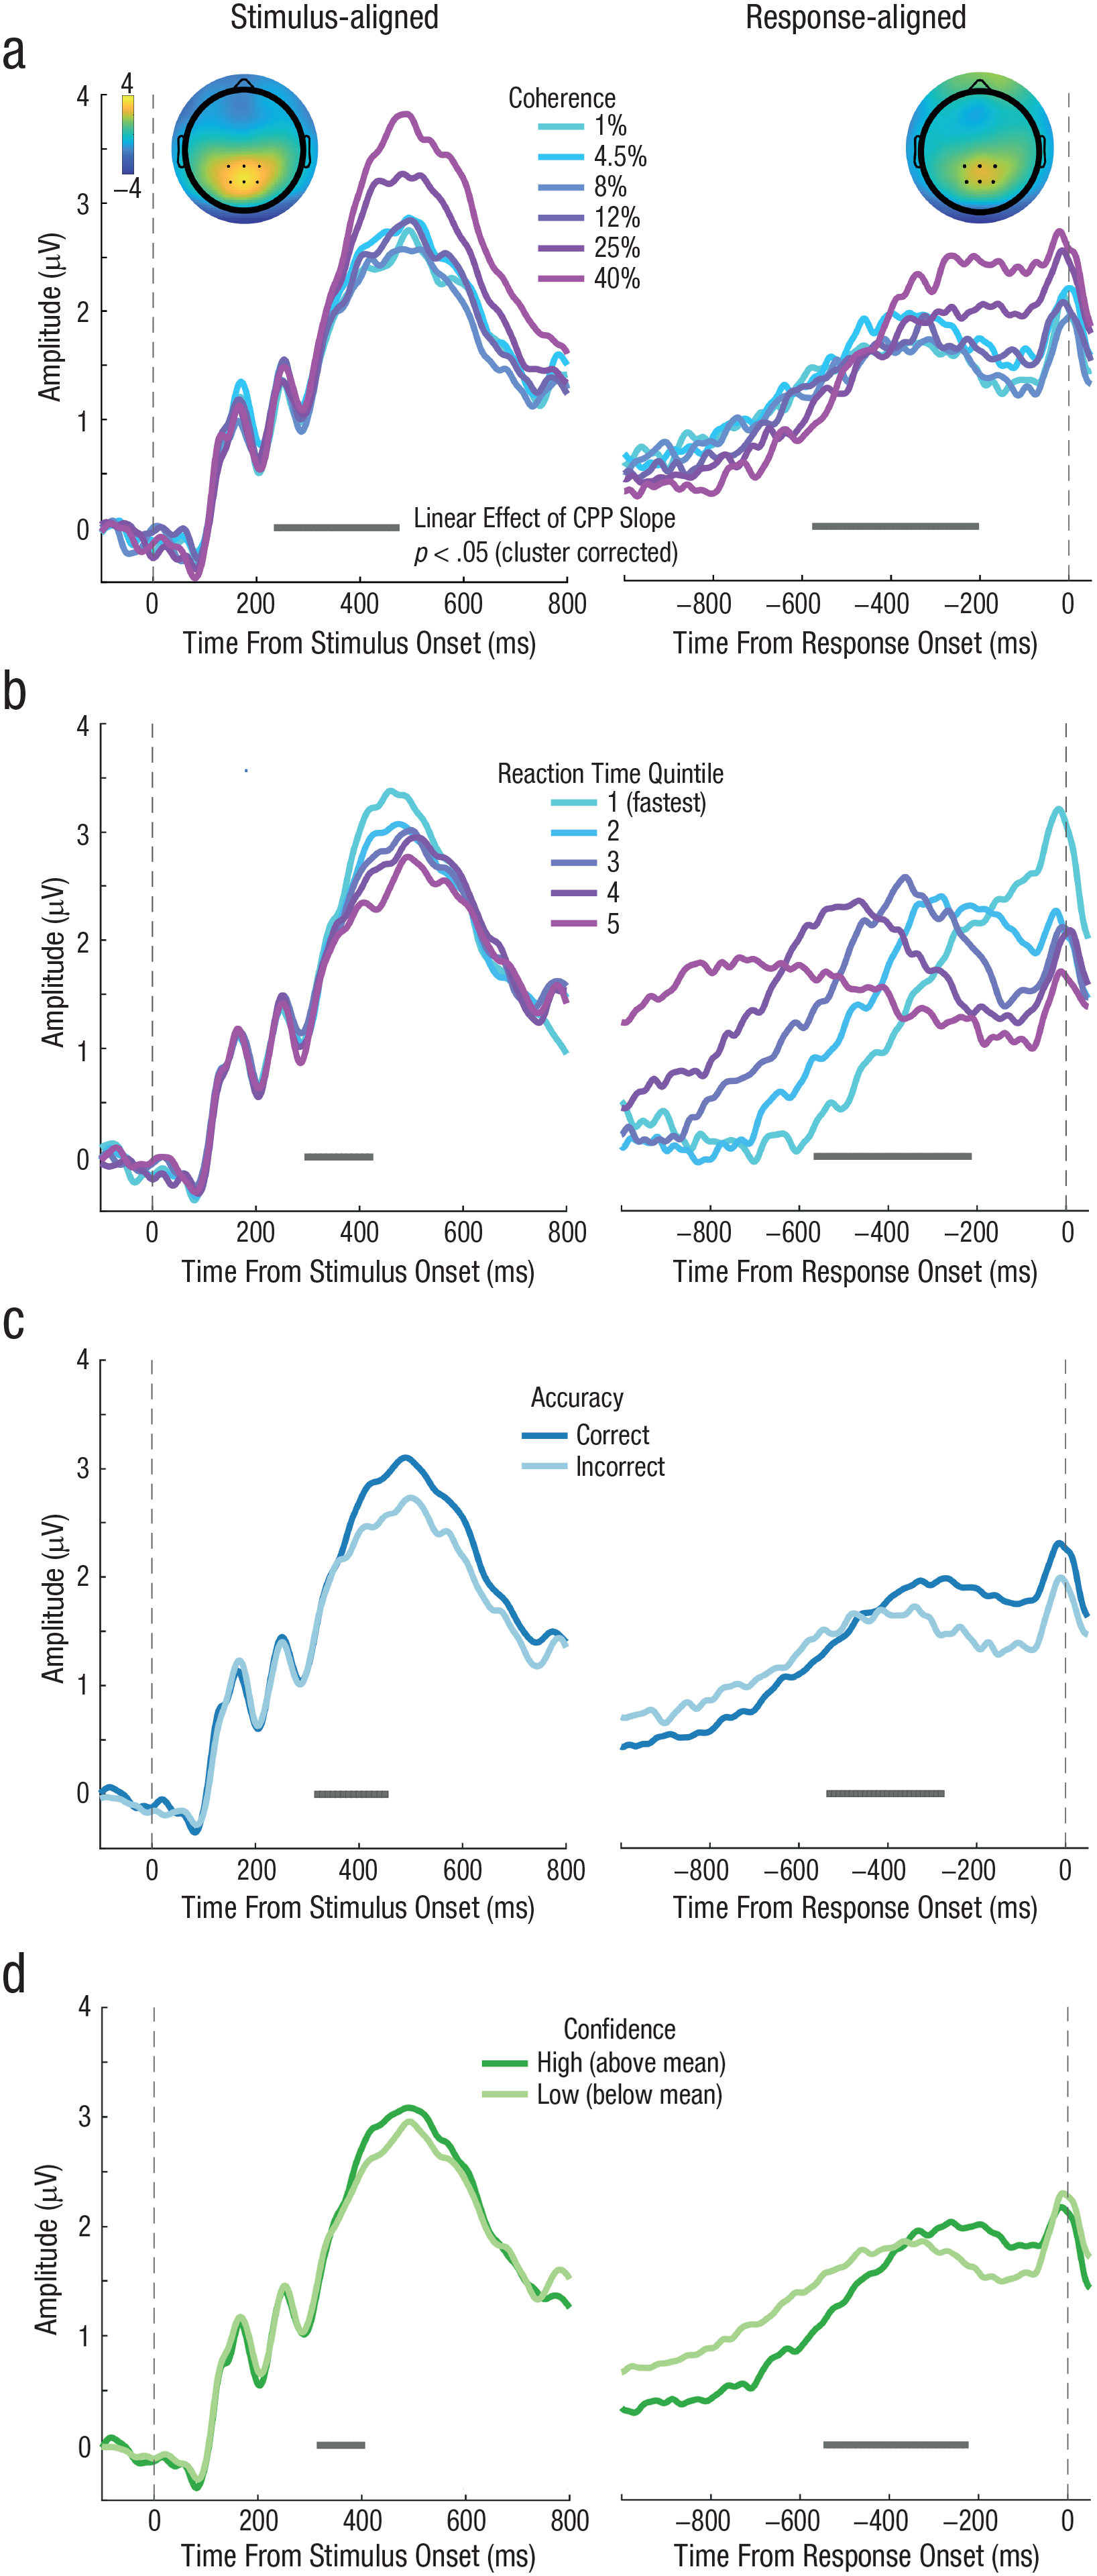
Grand average event-related potential (ERP) time courses aligned to both the target onset (left column) and response execution (right column) for Experiment 1 (N = 25). The vertical dashed lines denote the time of target onset (left column) and the time of response execution (right column). The inset topography (a) of the ERP measured after target onset (left; 250 ms to 450 ms) and prior to response execution (right; −510 ms to −130 ms) shows a positive central-parietal component (the CPP) highlighted by the black dots, which denote electrodes used in all subsequent analysis. Both stimulus-aligned and response-aligned CPP slopes increased as motion-coherence level increased. Both stimulus-aligned and response-aligned CPP (b) exhibited a slope that scaled with response time (RT; five equally sized RT bins). Both stimulus-aligned and response-aligned CPP slopes (c) were higher on correct trials than on incorrect trials. Both stimulus-aligned and response-aligned CPP slopes (d) were steeper on high-confidence trials (i.e., above mean) than on low-confidence trials (i.e., below mean). Gray points below each ERP denote the center of 200-ms time windows in which a linear effect of CPP slope as a function of coherence, RT, accuracy, or confidence reached significance (p < .05) after we corrected for multiple comparisons across time.
As shown in Figure 2a, this analysis showed a significant positive cluster spanning 240 to 470 ms poststimulus and a significant cluster spanning −570 to −210 ms prior to response execution. Steeper CPP slopes were associated with higher coherence levels. As shown in Figure 2b, CPP slopes were significantly negatively correlated with RT bin within a cluster from 300 to 420 ms for the stimulus-aligned CPP and within a cluster from −560 to −220 ms for the response-aligned CPP, indicating that the CPP ramps up more quickly for faster RTs. Figure 2c shows that the CPP buildup rate was also significantly higher for trials in which participants correctly discriminated the direction of motion, compared to incorrect trials, for a cluster spanning 320 to 450 ms poststimulus onset and a cluster spanning −530 to −280 ms prior to response onset. Lastly, Figure 2d confirms the prediction that the CPP slope was also related to confidence judgments. Compared to low-confidence trials, CPP ramped up significantly faster on high-confidence trials during a cluster spanning 320 to 400 ms poststimulus and from −540 to −230 ms prior to the response.
One interpretation of these results is that subjective confidence judgments can be read out from the neural signature of perceptual evidence accumulation prior to the response. However, in Experiment 1, high-confidence trials were also associated with stronger evidence quality and higher accuracy. Thus, the relationship between CPP slope and confidence might be confounded by decision accuracy. We, therefore, sought to tease apart the contributions of task performance and confidence to the CPP buildup rate in Experiment 2.
Isolating neural signals of perceptual confidence from decision accuracy
We aimed to experimentally manipulate subjective confidence independently of task accuracy using the positive evidence bias phenomenon that has been observed repeatedly in human confidence behaviors (Desender et al., 2018; Ko et al., 2022; Koizumi et al., 2015; Maniscalco et al., 2016; Rollwage et al., 2020; Samaha et al., 2016, 2019; Zylberberg et al., 2012), monkey confidence behaviors (Odegaard et al., 2018), and rodent confidence behaviors (Stolyarova et al., 2019). The term positive evidence bias refers to the fact that decision makers tend to overweight the overall magnitude of evidence in favor of a choice when rating confidence, rather than rely on the actual balance of evidence for both choice alternatives. In Experiment 2 (N = 25), we therefore designed the RDM stimulus so that it contained two levels of PE (i.e., motion signal supporting the correct choice) and individually-adjusted levels of NE (motion signal supporting the incorrect choice) so that accuracy was matched across the two conditions. We set the motion coherence for the correct choice direction to be 50% in the high-PE condition and 25% in the low-PE condition. We then found the level of NE for each participant and PE level so that accuracy (% correct) approximated 79% in both conditions; we used a one-up, three-down adaptive staircase prior to the main task (see the Method section; Fig. 3a).
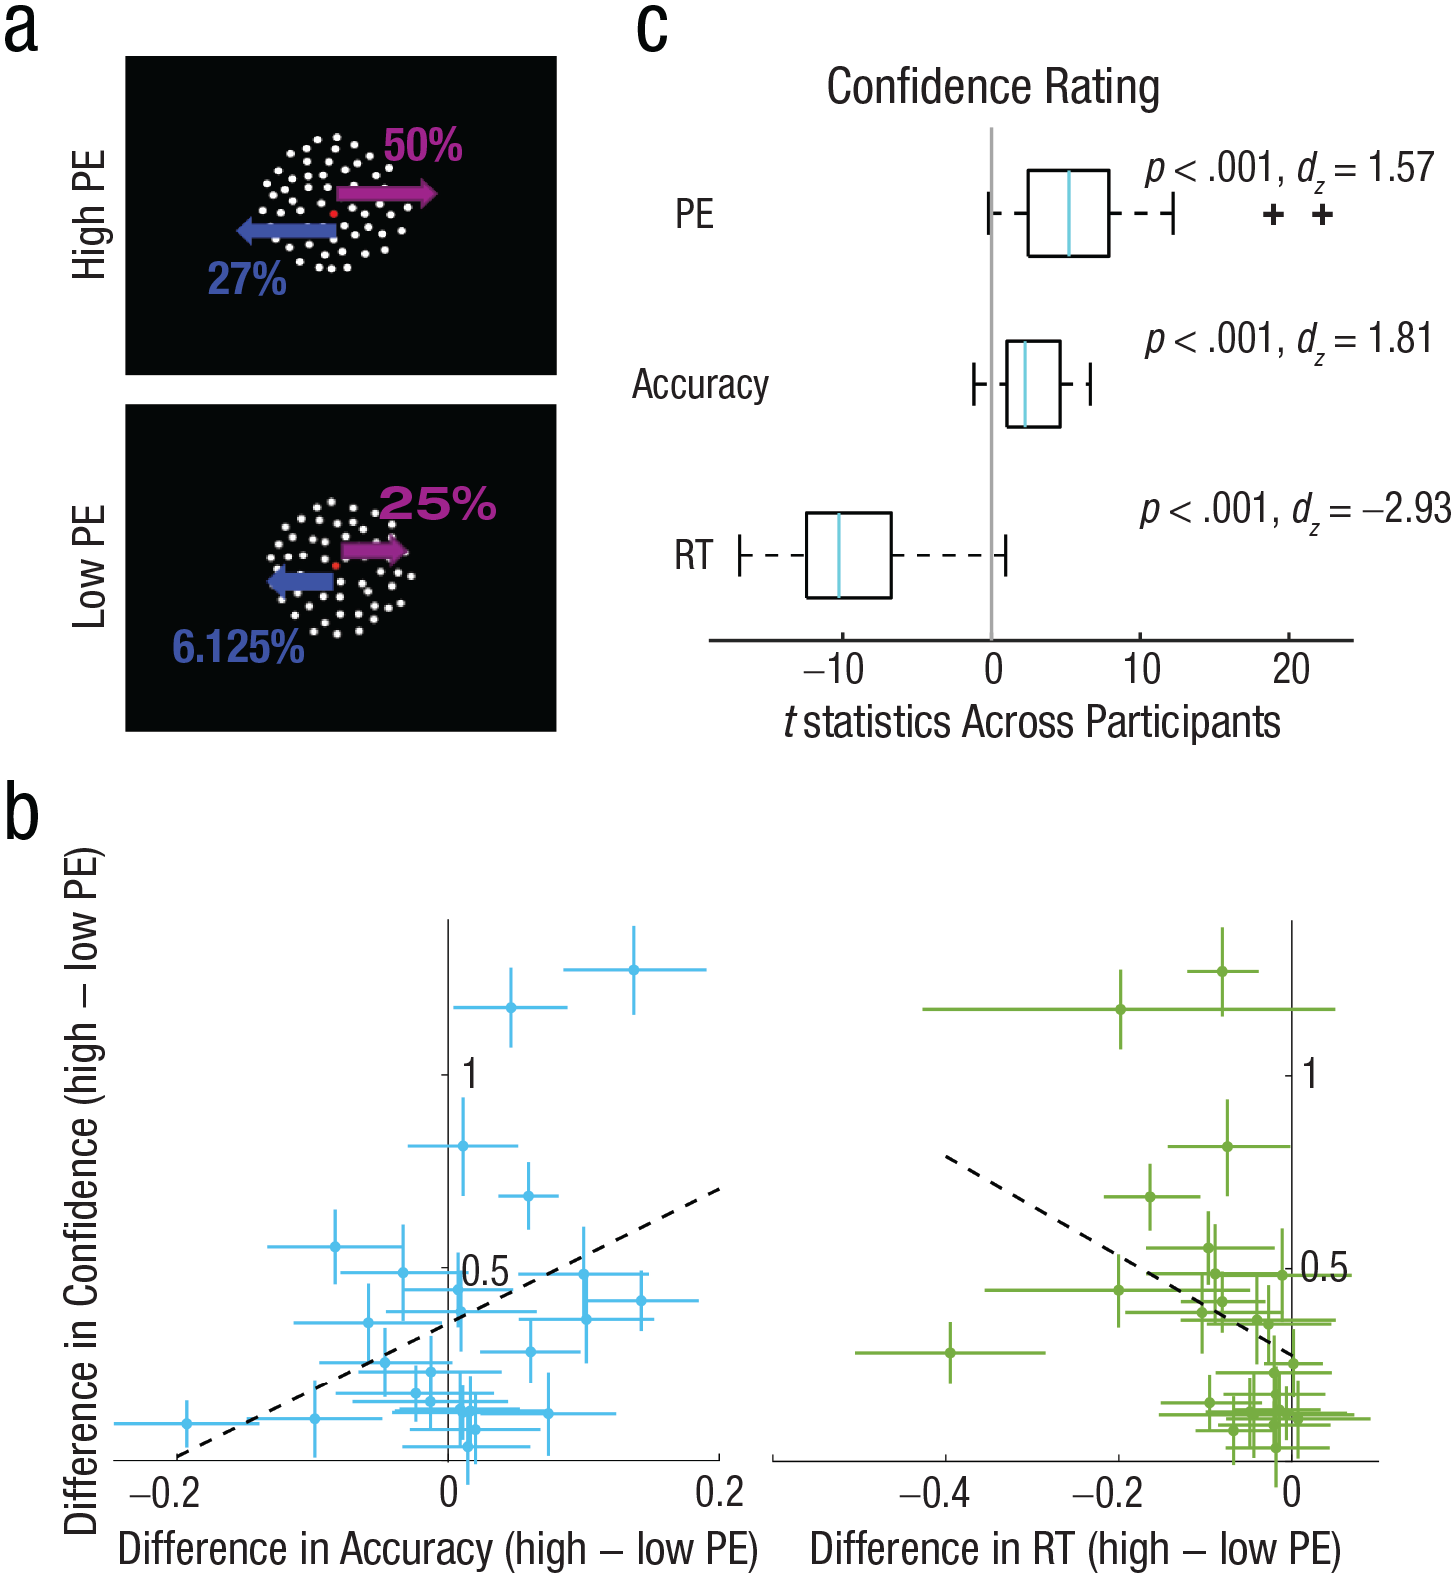
Example of the stimuli and behavioral results for Experiment 2 (N = 25). Following fixation, participants saw a random-dot-motion stimulus (a) for 300 ms which contained either high or low positive evidence (PE). High-PE stimuli always contained a 50% coherent-motion signal moving in the correct direction, whereas low-PE stimuli contained 25% coherent motion moving in the correct direction. Levels of negative evidence (NE, or motion opposing the correct direction) were varied for each participant and PE level separately to achieve ~79% discrimination accuracy (in this example participant, 25% NE was required in the high-PE condition and 6.25% NE was required in the low-PE condition). Participants then reported the motion direction (left vs. right) and their confidence (on a scale ranging from 1–4) in the decision simultaneously with a single button press. The effect of PE on confidence (high − low PE; y-axis) and the effect of PE on the proportion of correct responses (high − low PE; x-axis) is shown on the left plot (b). The same effect for response time (RT) is shown on the right plot. Dots represent individual participants, and error bars are bootstrapped 95% confidence intervals. The dashed lines represent the least-squares fit. The left plot shows that participants were approximately equally accurate for high- and low-PE stimuli, yet all participants showed higher confidence following high- compared to low-PE stimuli, demonstrating a dissociation between confidence and accuracy. Moreover, the PE effect on confidence was not significantly correlated with the PE effect on accuracy across participants (ρ = .27, p = .19). The right plot shows that the majority of the participants were faster for high PE than for low PE, and this difference was correlated negatively with the PE effect on confidence (ρ = −.55, p = .005), suggesting confidence was not dissociated from RT in this experiment. Results of a single-trial multiple-regression analysis of behavior predicting confidence from RT, accuracy, and PE in the same model are shown in (c). Light blue lines represent the median t statistic across participants for each predictor, box plots show the distribution of t statistics across participants for each predictor, and blue lines represent the median across participants for each predictor. The box boundaries represent the 25th and 75th percentiles of the t statistics across participants, and the whiskers represent the minimum and maximum without an outlier. PE, accuracy, and RT all predicted confidence judgments. RT = response time.
We anticipated that, during the main task, accuracy would be approximately equal for high and low PE, but that if the PEB for confidence held for our stimuli, then confidence would be higher in the high-PE condition. Figure 3b shows the difference in accuracy between high and low PE for each observer on the x-axis (with bootstrapped 95% confidence intervals) and the same difference (high − low PE) in confidence on the y-axis. The staircase was successful in controlling accuracy across the two PE conditions at the group level. Low-PE accuracy was on average (± SEM) 77 ± 1.5%, and high-PE accuracy was 78 ± 2.0%. As can be seen in Figure 3b, a few participants were more accurate for high PE, and a few were less accurate, but the majority overlapped zero so that, at the group level, accuracy did not significantly differ across PE levels, t(24) = −0.69, p = .50, dz = −0.20. In contrast, every participant showed numerically higher confidence following high-PE stimuli (mean confidence = 3.0 ± 0.11) compared to low-PE stimuli (mean confidence = 2.6 ± 0.12), with 23 of 25 participants showing a significant (p < .05) elevation in confidence (Fig. 3b; bootstrap test), leading to a large effect at the group level, t(24) = −5.77, p < .001, dz = −1.63. If confidence were merely a more sensitive estimator of task difficulty, then we may expect the PE effect on confidence to predict the PE effect on accuracy across participants, and although there was a small positive correlation, it was not close to statistical significance (ρ = .27, p = .19). This indicates that it is not necessarily the case that an individual who happened to have higher accuracy on high-PE trials also had higher confidence. In fact, inspecting Figure 3b, it is possible to see participants who were significantly less accurate on high-PE trials yet were significantly more confident (upper left quadrant), indicating a dissociation between accuracy and confidence. Although our main goal was to equate accuracy across different confidence levels, which was successful, we also examined whether the PE manipulation led to changes in RT. As shown in Figure 3b, most participants were also faster for high PE (mean RT = 0.97 ± 0.04 s) compared to low PE (mean RT = 1.05 ± 0.05 s), leading to a significant difference, t(24) = 4.32, p < .001, dz = 1.22. Moreover, individual differences in the PE effect on confidence were negatively correlated with the PE effect on RT (ρ = −.55, p = .005). Thus, even when dissociating confidence from accuracy, there is still a close link between confidence and RT, as is occasionally observed using this manipulation (Samaha et al., 2016). To test whether RT differences fully accounted for the PEB on confidence, we fitted a regression model to predict single-trial confidence ratings from RT, accuracy, and PE. The model showed significant effects on confidence of RT, t(24) = −10.35, p < .001, dz = −2.93; accuracy, t(24) = 6.39, p < .001, dz = 1.81; and PE, t(24) = 5.57, p < .001, dz = 1.57. The results indicate that high-PE trials are associated with higher confidence trials while we controlled for RT and accuracy. Therefore, PE made a unique contribution to confidence.
We next turned to the neural data, which was analyzed in the same way and used the same central parietal electrodes as in Experiment 1. We first sought to replicate Experiment 1 and confirm that the CPP behaved as expected for an evidence-accumulation signal. As shown in Figure 4a, the CPP slope was inversely correlated with RT—that is, a longer RT was associated with a shallower CPP spanning a significant cluster from 260 to 400 ms (relative to stimulus onset) and −510 to −100 (relative to response onset). The CCP slope also predicted accuracy; the CPP ramped up faster for correct compared to incorrect trials between 300 and 450 ms poststimulus and between −720 and −680 and from −250 and −200 prior to the response (Fig. 4b). Additionally, the CPP also predicted confidence ratings, with steeper slopes on high- compared to low-confidence trials (mean split) from 360 to 420 ms post-stimulus and −500 to −180 ms preresponse (Fig. 4c). Critically, we observed a similar effect when comparing high-PE and low-PE trials, which were matched for accuracy, but which differed significantly in confidence. In particular, high-PE trials were associated with steeper CPP slopes than low-PE trials in a significant cluster spanning 180 to 220 ms and 300 to 450 ms poststimulus and −490 to −420 ms and −250 to −200 ms preresponse (Fig. 4d). These findings collectively replicate and extend Experiment 1 by showing that confidence is correlated with predecision evidence-accumulation signals even when accuracy is statistically equated.
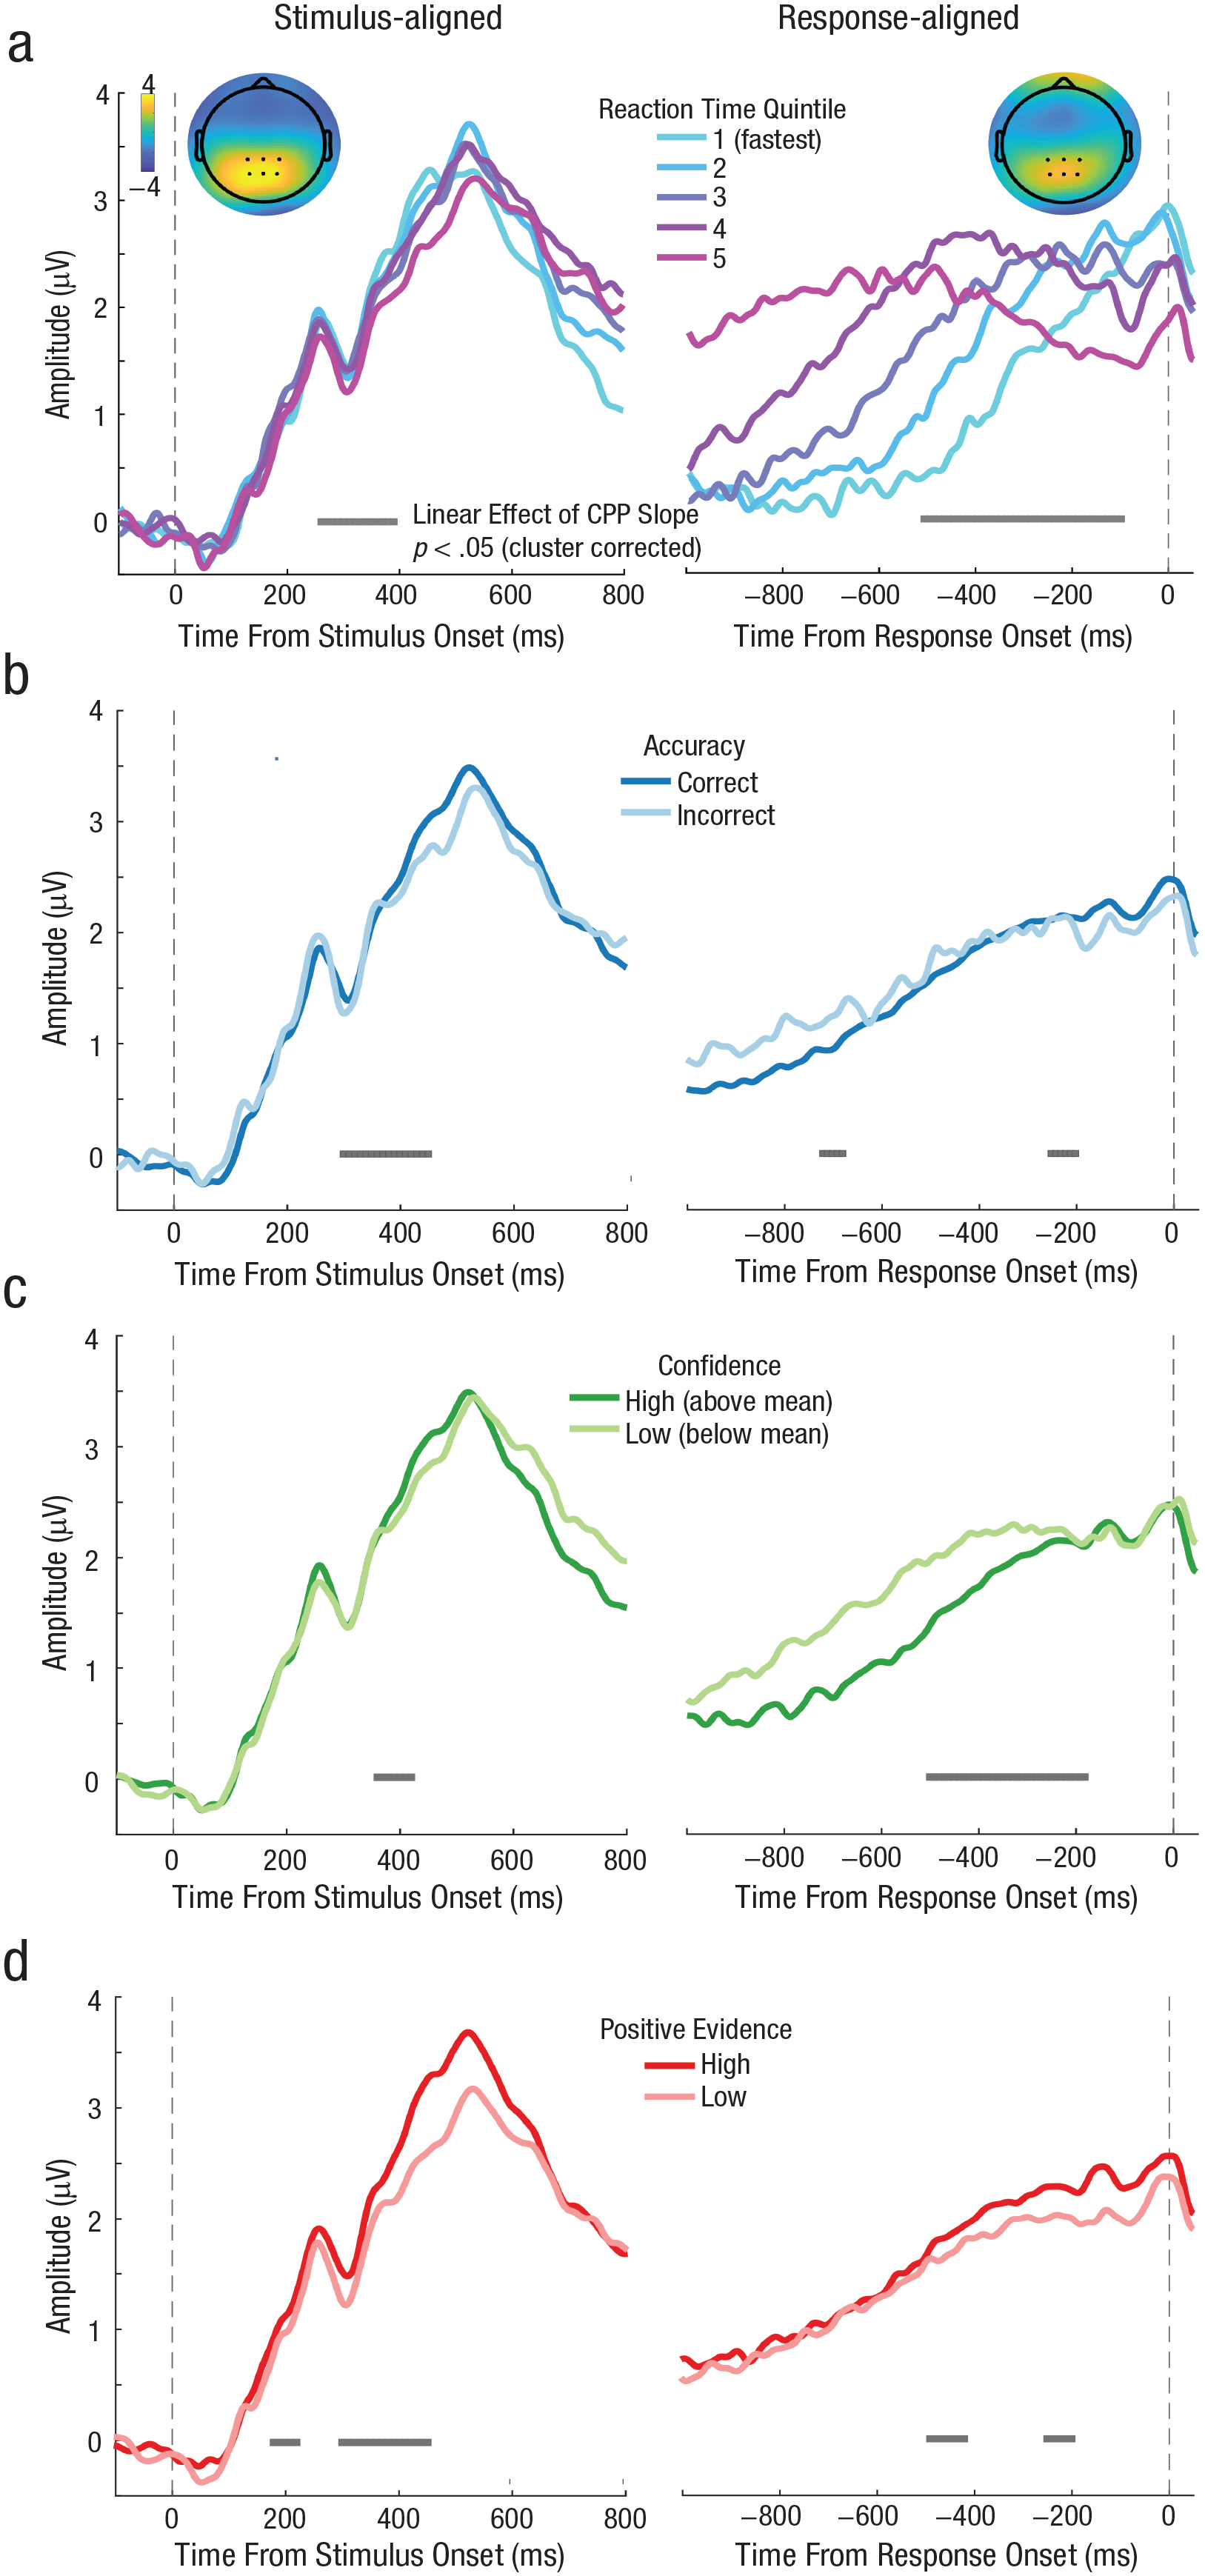
Grand average event-related potential (ERP) time courses aligned to both the target onset (left column) and response execution (right column) for Experiment 2 (N = 25), where the positive evidence bias (PEB) was introduced. Both stimulus-aligned and response-aligned CPP slopes (a) increased with faster RTs (five equally spaced bins). Both stimulus-aligned and response-aligned CPP slopes (b) were higher on correct trials than on incorrect trials. Both stimulus-aligned and response-aligned CPP slopes (c) were steeper on high-confidence trials (above mean) than on low-confidence trials (below mean). Both stimulus-aligned and response-aligned CPP (d) built up faster on high-PE trials than on low-PE trials—two conditions that did not differ in accuracy (see Fig. 3).
Statistical isolation of confidence signals from decision RT
Experiments 1 and 2 leave open the possibility that CPP reflects RT-related signals rather than confidence, because the PE manipulation successfully controlled for accuracy only. In those experiments, however, participants indicated their direction decision and confidence using a single button press (see Fig. 5a). This choice was intentional in order to increase the chances that the decision and the confidence response were based on the same accumulated evidence (i.e., participants could not make their choice and then continue accumulating evidence from memory, for instance, before rating confidence). However, the single-response design means that RTs reflect a compound measure of decision plus confidence time and are difficult to interpret. Indeed, inspecting the response-aligned data from Experiments 1 and 2 (Figs. 2 and 4), evidence accumulation does not seem to always increase monotonically prior to the response but sometimes dips down before increasing again just prior to the button press (perhaps reflecting a sequential direction and then a confidence decision). To investigate whether the CPP predicts confidence while we statistically controlled for RT, we required a cleaner measure of decision RT to which to time-lock our data, and to use in a multiple-regression model.
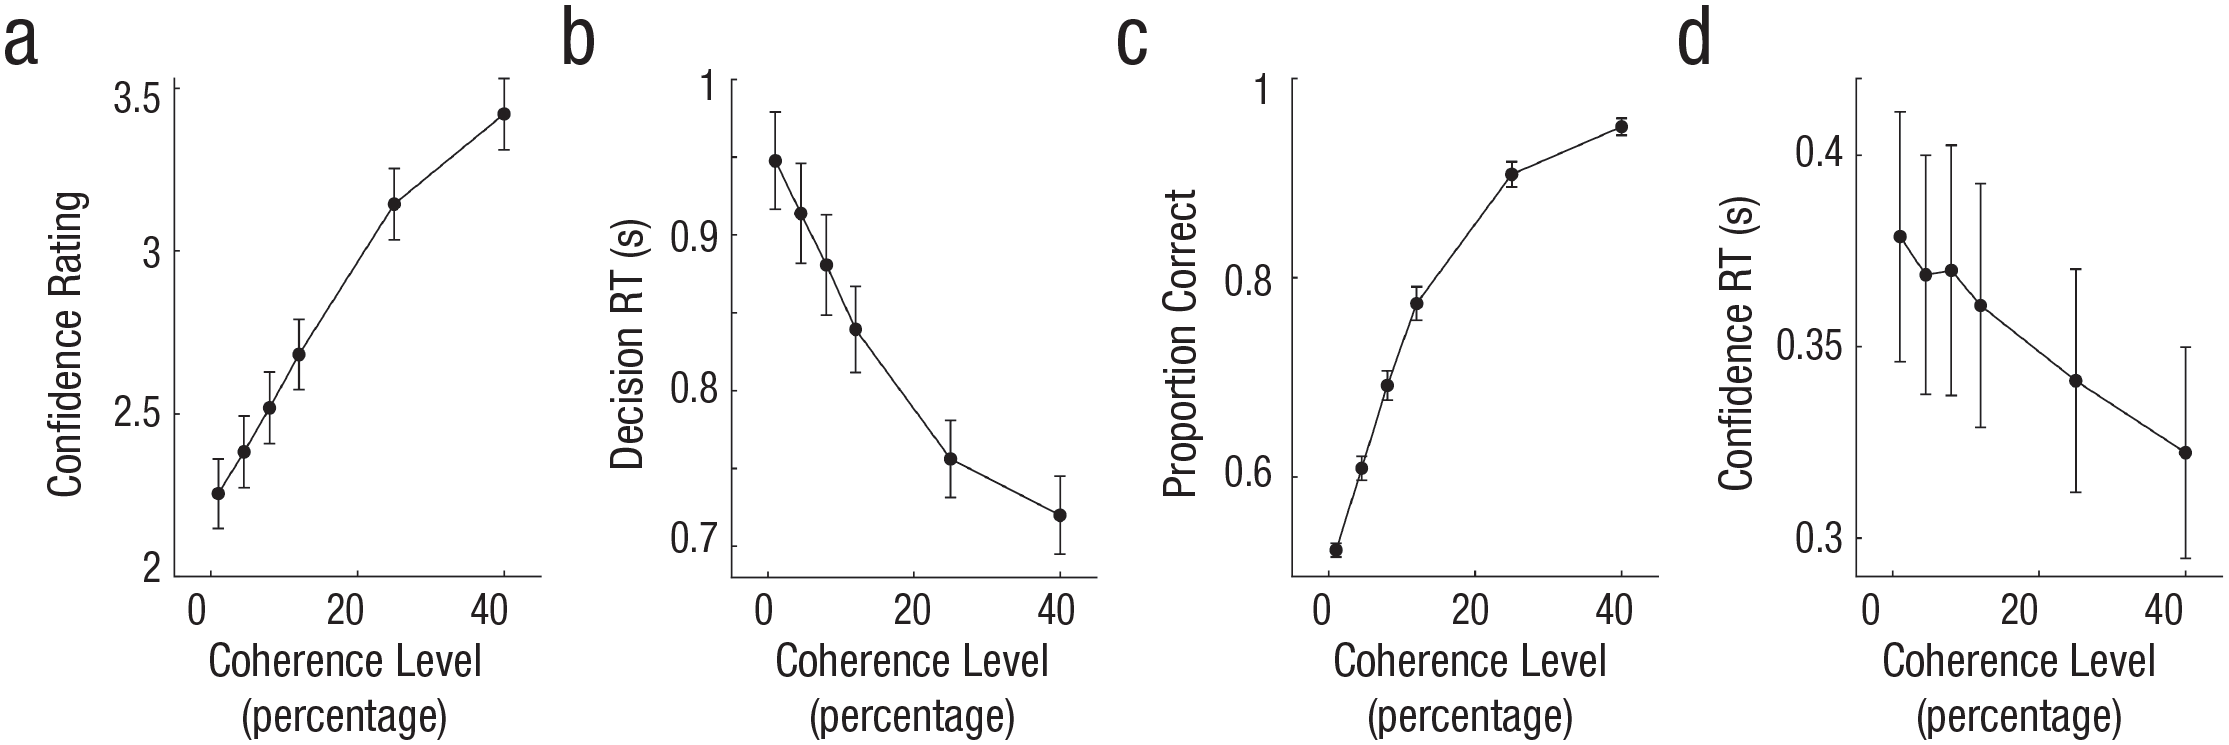
Behavioral results for Experiment 3 (N = 24). Confidence rating (a) and proportion correct (c) increased with higher coherence level. Decision response time (RT; b) and confidence RT (d) were faster at higher coherence levels. Error bars denote ±1 SEM (across participants).
In Experiment 3, participants (N = 24) reported motion direction and confidence sequentially while coherence was manipulated. This gives us a decision RT measure to use in a statistical model factoring out unique variance in confidence explained by CPP slope. First, the behavioral data showed that, as expected, motion coherence had a significant effect on accuracy, F(5, 115) = 409, p < .001, η2 = .95; decision RT, F(5, 115) = 80.85, p < .001, η2 = .78; confidence, F(5, 115) = 66.19, p < .001, η2 = 0.74; and confidence RT, F(5, 115) = 7.37, p < .001, η2 = .24 (see Fig. 5b).
We then conducted the same ERP analysis as in Experiments 1 and 2 to confirm that the CPP predicted behavior in the expected way using a cleaner RT measure. We found that coherence level significantly modulated the buildup rate of the CPP in a cluster spanning 200 to 470 ms poststimulus and −500 to −130 ms prior to response execution (Fig. 6a). Decision RT varied with CPP slope in a cluster from 200 to 440 ms for stimulus-aligned CPP and a cluster from −500 to −150 ms for response-aligned CPP (Fig. 6b). The CPP on correct trials ramped up faster than it did on incorrect trials within a cluster from 280 to 460 ms for stimulus-aligned data and −480 to −160 ms for response-aligned data (Fig. 6c). Last, we also replicated the finding that CPP slope rate was significantly steeper on high- compared to low-confidence trials from 280 to 460 ms poststimulus onset and from −510 to −170 ms preresponse (Fig. 6d). Thus, with a more precise decision RT estimate, we found that prechoice evidence-accumulation signals predict perceptual confidence. Moreover, the CPP more clearly followed a monotonic rise compared to Experiments 1 and 2, as expected of an evidence-accumulation signal.
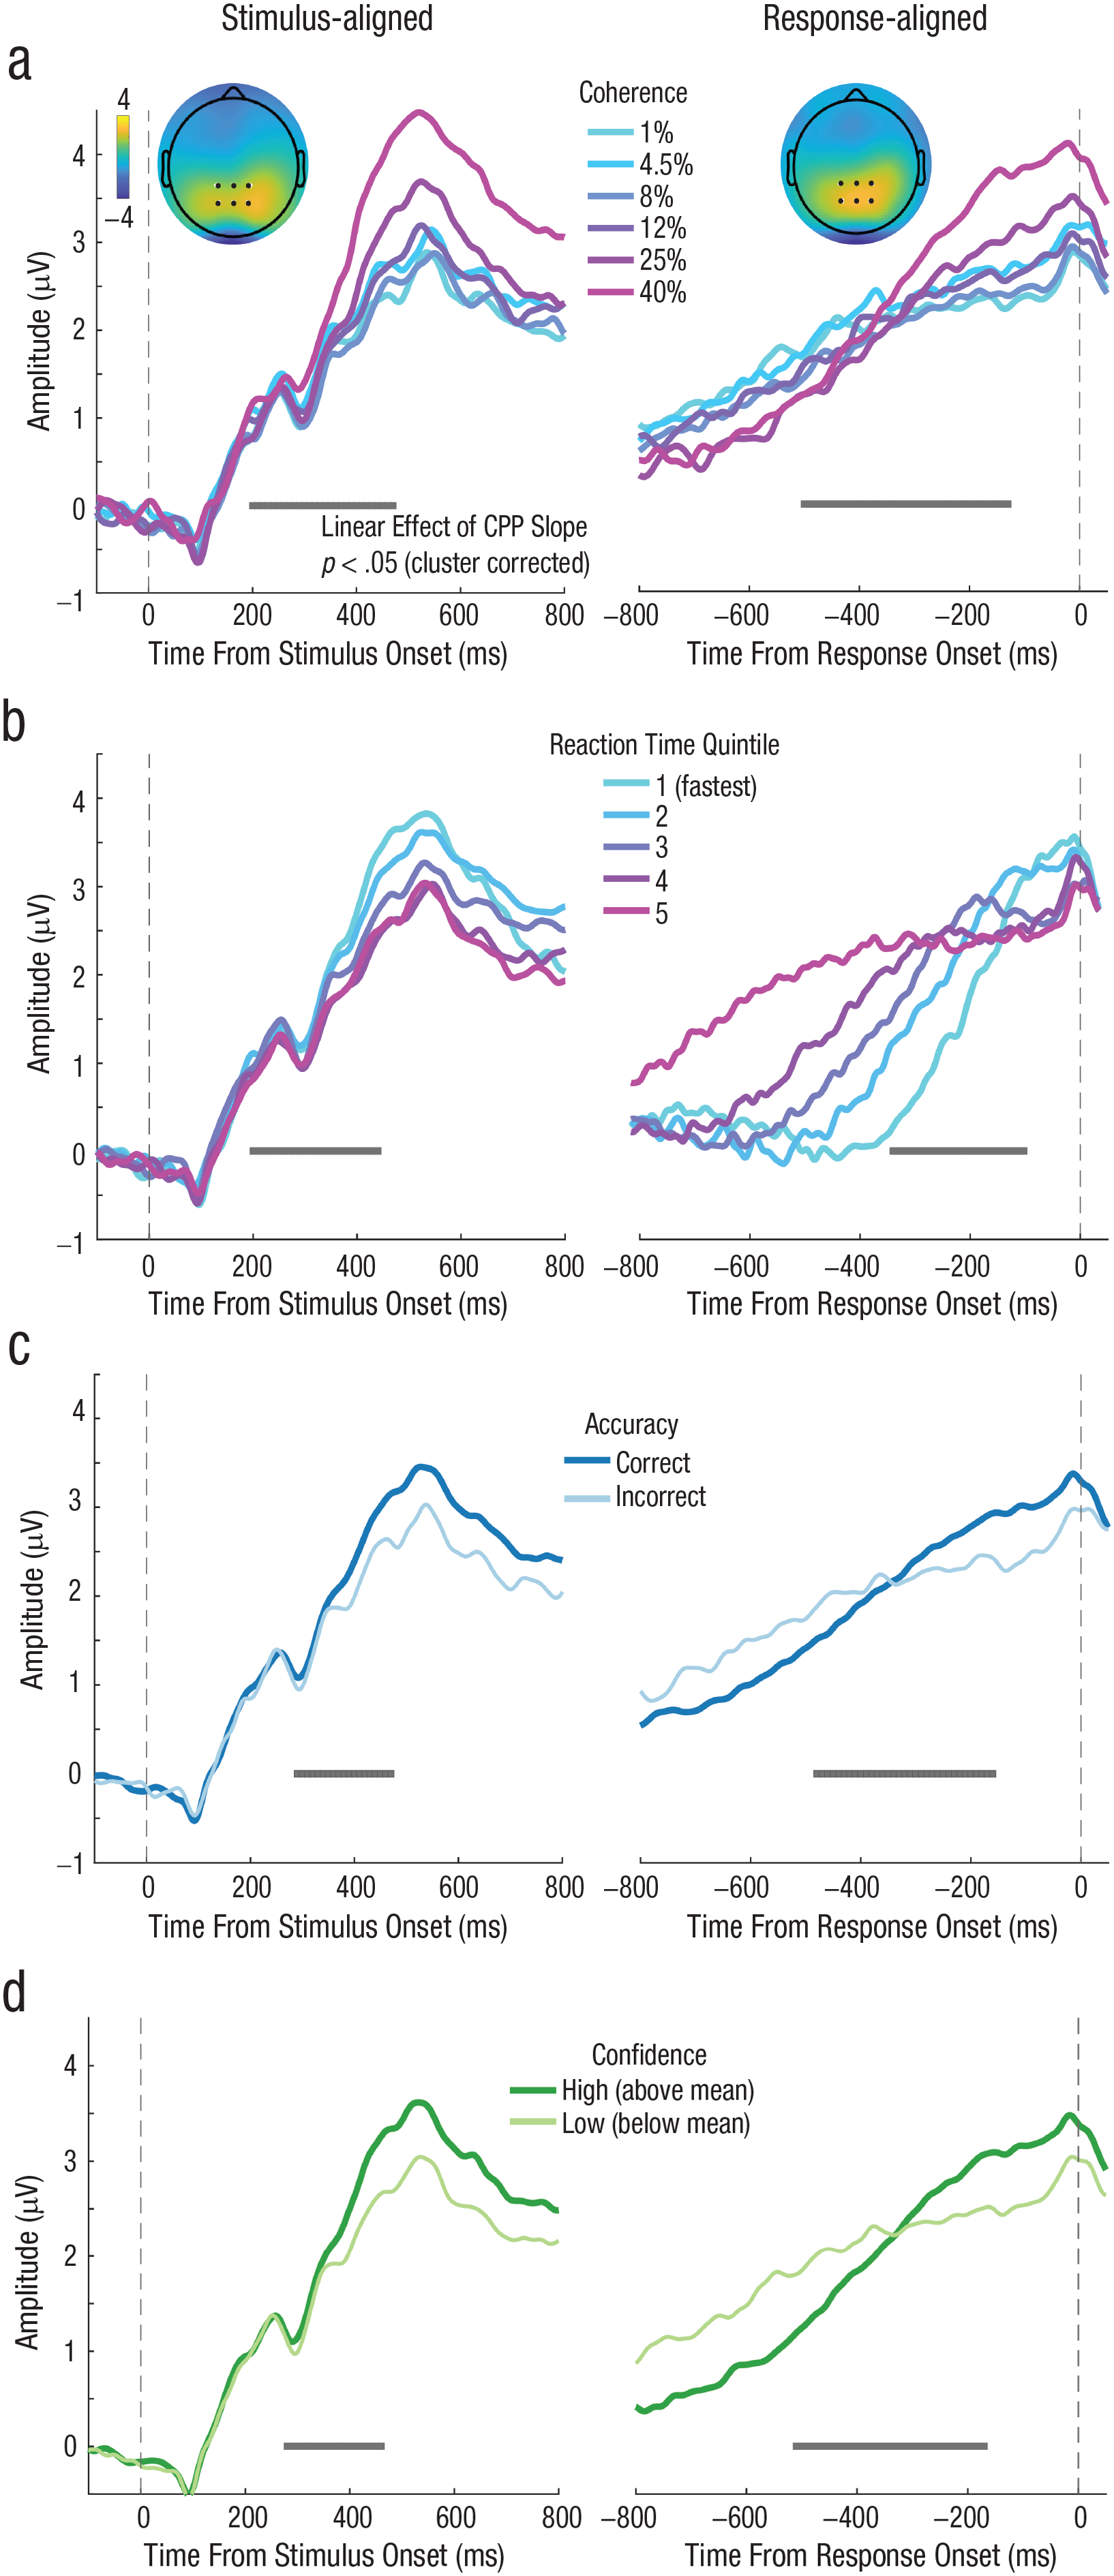
Grand average event-related potential (ERP) time courses aligned to both target onset (left column) and response execution (right column) for Experiment 3 (N = 24), in which choice and confidence responses were made sequentially. The results replicated what we found in Experiment 1 and Experiment 2 showing that slopes of stimulus-aligned and response-aligned central-parietal component both scaled with (a) coherence level, (b) decision response time (RT), (c) accuracy, and (d) confidence.
To attempt to statistically control for the influence of coherence, accuracy, and RT on the relationship between CPP slope and confidence, we turned to a single-trial regression framework for our EEG data (Cohen & Cavanagh, 2011). For each trial, we quantified the CPP slope as a line fitted to the EEG signal between 250 and 500 ms relative to stimulus onset and −300 to −100 ms relative to the response. Then, for each participant, we fitted a general linear model predicting the single-trial CPP slopes using motion coherence, accuracy, RT, and confidence as predictors in the same model. We then extracted the t statistic for each predictor and participant and performed a t test at the group level to assess whether each predictor was reliably different from zero across the sample of participants. By using all predictors in the same model, we can statistically control for the effect of RT, coherence, and accuracy on the CPP slope and identify the unique effect of confidence. However, any null effects should be interpreted cautiously, because the correlation between the predictor variables can lead to an inflation of the predictor variances and underestimation of effect sizes of the regression estimates, making it more difficult to observe a significant effect (i.e., collinearity inflates type-2 errors but not type-1 errors; Lavery et al., 2019).
Using stimulus-aligned single-trial slope estimates, the model showed a significant effect of coherence, t(23) = 7.46, p < .001, dz = 2.15, and a significant effect of confidence, t(23) = 2.15, p = .04, dz = 0.62, on slope. For response-aligned data, coherence level, t(23) = 2.57, p = .02, dz = 0.74; confidence, t(23) = 2.48, p = .02, dz = 0.72; and RT, t(23) = −3.33, p < .01, dz = −0.96, were all significant predictors (see Fig. 7). The results indicate that higher confidence trials are associated with faster buildup of single-trial EEG signals, even when stimulus strength, RT, and discrimination accuracy are jointly modeled. In other words, confidence predicts unique variation in the neural signatures of evidence accumulation, above and beyond that explained by RT, accuracy, and stimulus evidence.
This conclusion is hampered, however, by the fact that the predictors in this model are all correlated (collinear), which may influence how the variance explained is allocated to one predictor, such as confidence. To help overcome this, we ran another set of regression models to predict single-trial residualized EEG slopes from confidence. EEG slopes were first regressed on coherence, RT, or accuracy separately (individual regression models). Then the residuals (the unexplained variance in the EEG slopes after accounting for coherence, RT, or accuracy) were used in subsequent analyses to assess the relationship between these residuals and confidence levels. For stimulus-aligned single-trial EEG slope, the models showed a significant effect of confidence on residualized slopes after accounting for accuracy, t(23) = 4.56, p < .001, dz = 1.32, and RT, t(23) = 4.94, p < .001, dz = 1.43. Confidence had a marginal effect on residuals from coherence, t(23) = 1.94, p = .06, dz = 0.56. The confidence effect was also significant using residuals from accuracy, RT, and coherence together, t(23) = 2.12, p = .045, dz = 0.61. For response-aligned slopes, confidence was a significant predictor after being residualized for coherence, t(23) = 3.48, p < .01, dz = 1.00; accuracy, t(23) = 3.46, p < .01, dz = 1.00; RT, t(23) = 3.50, p < .01, dz = 1.01; and three of them together, t(23) = 2.73, p = .01, dz = 0.79. The results from this residualized regression approach further support the link between confidence and evidence-accumulation signals, independent of evidence strength, RT, and accuracy.
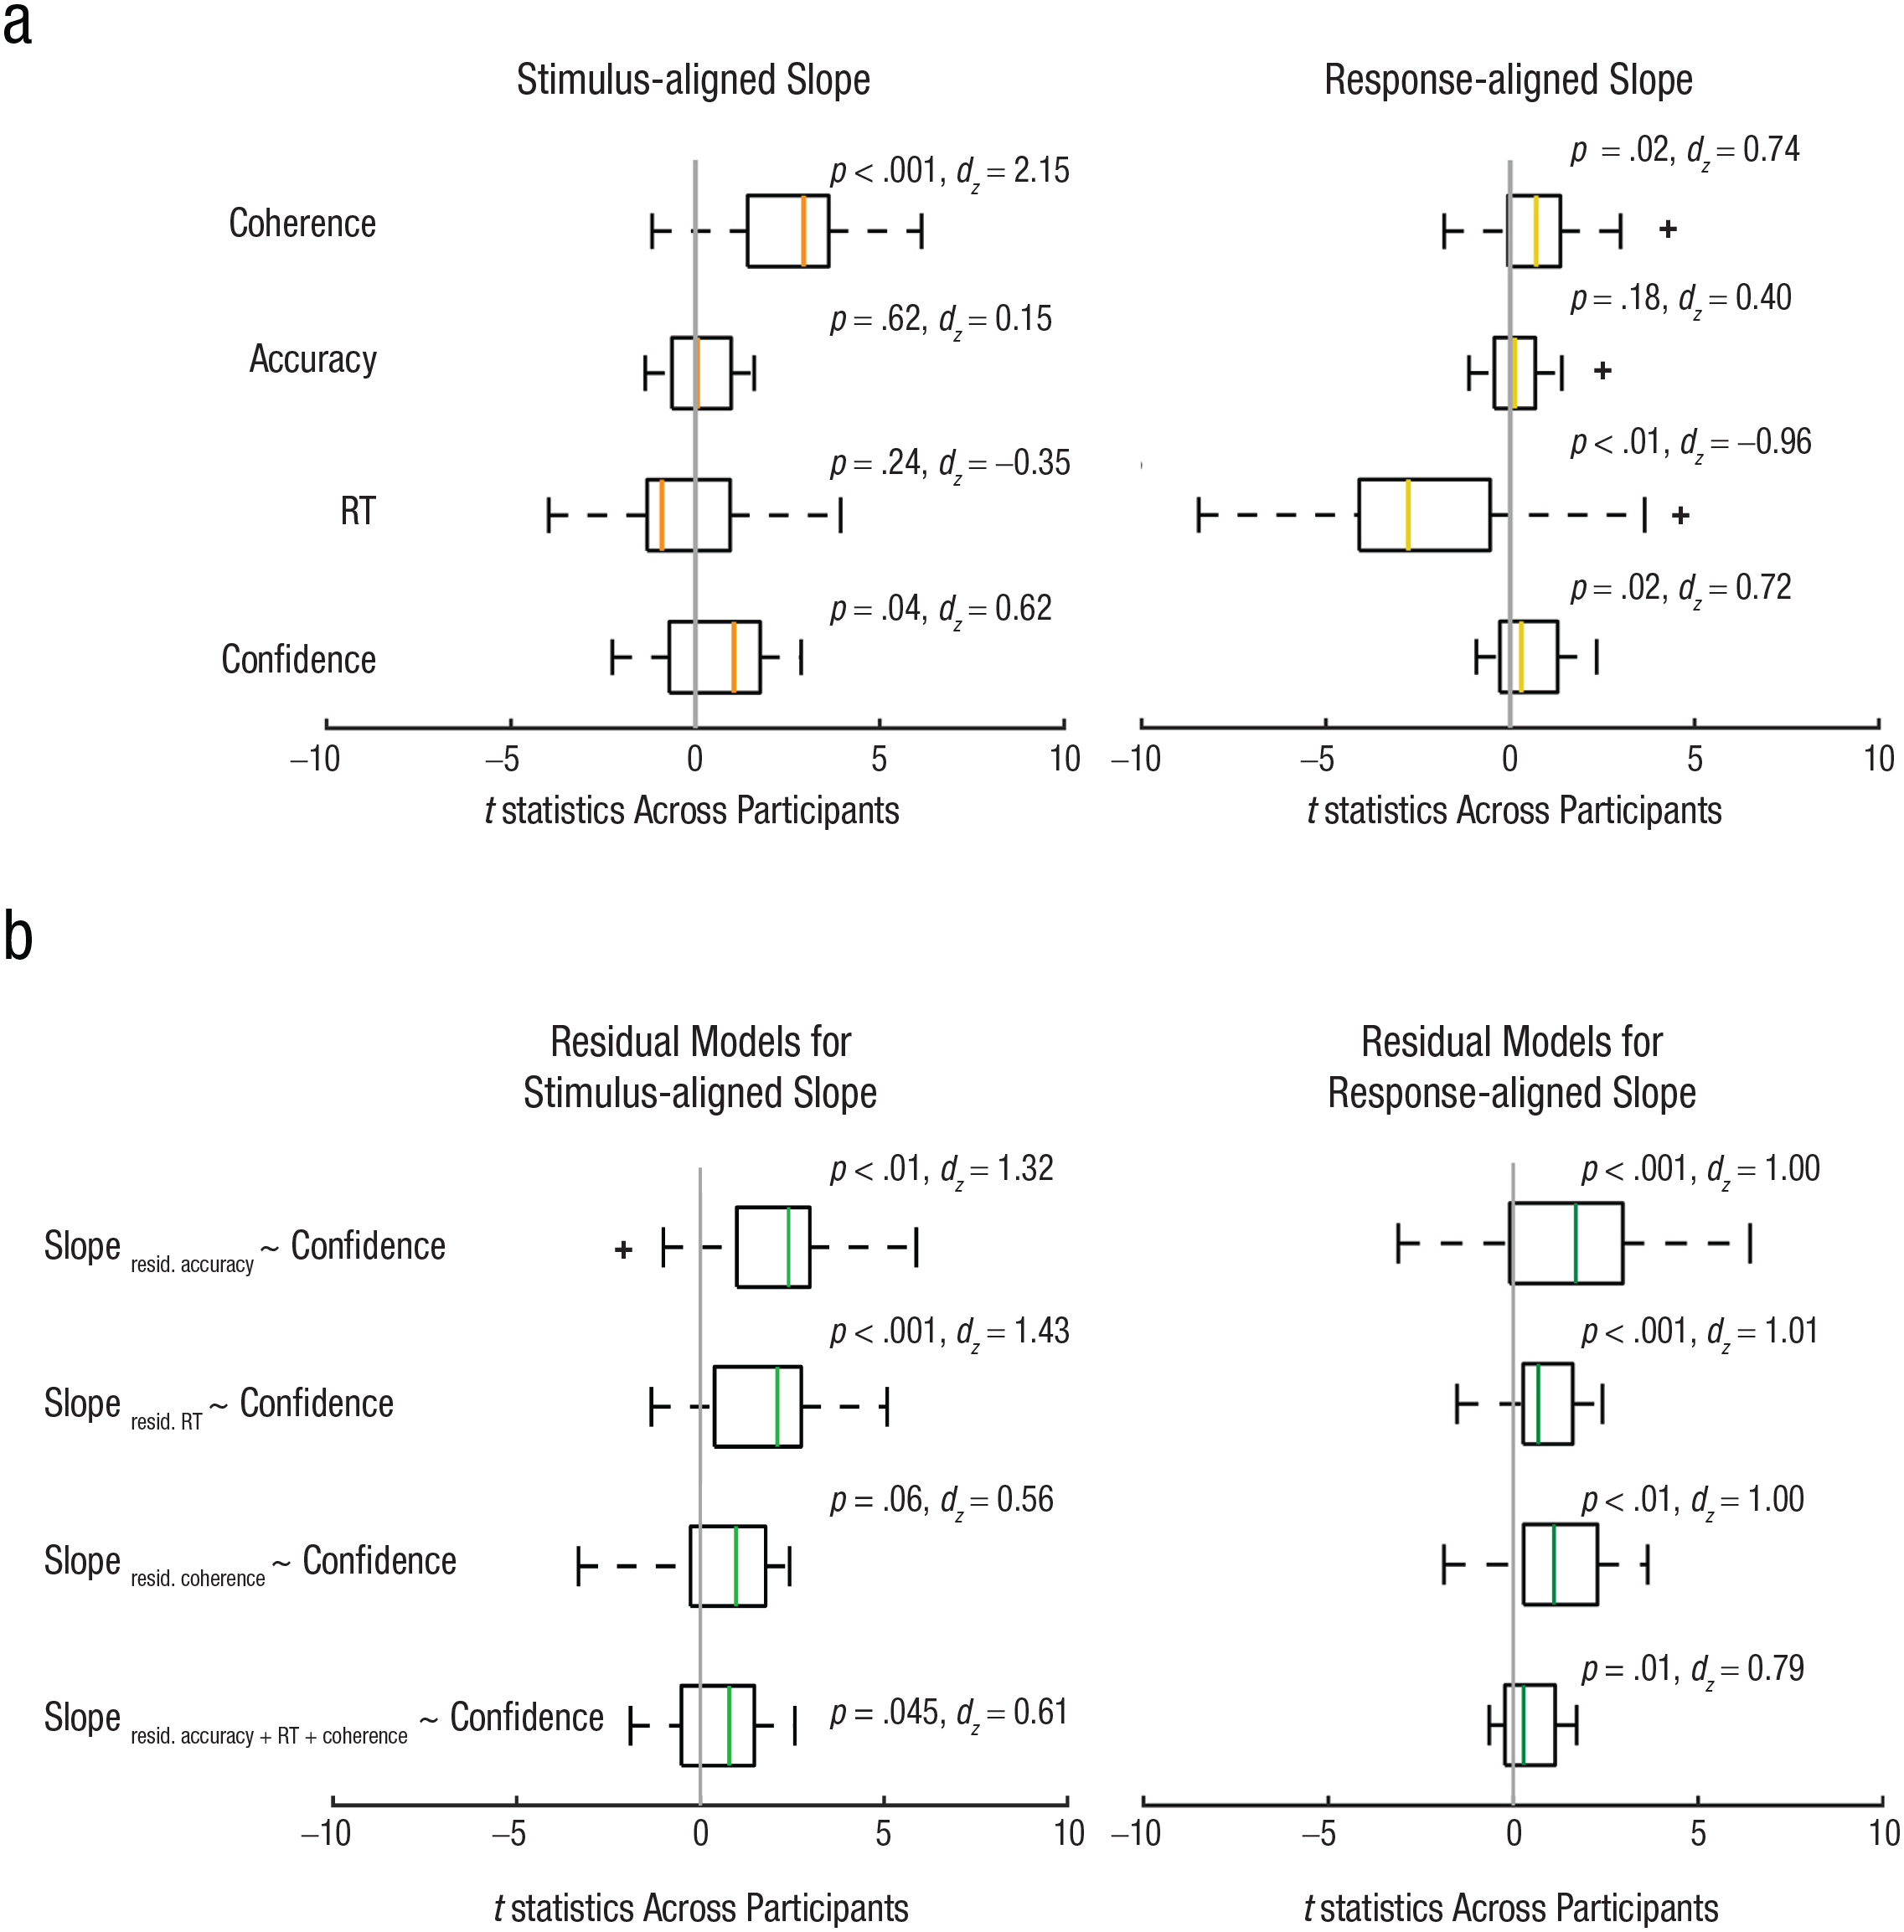
Results of a single-trial multiple-regression analysis of electroencephalography data from Experiment 3 (N = 24). Box plots showing the distribution of t statistics across participants are shown in (a) for each predictor—such as coherence, accuracy, response time (RT), and confidence—from a general linear model predicting the slopes of stimulus-aligned single-trial EEG (within the time window of 250 ms to 500 ms; left plot) and response-aligned single-trial EEG (within the time window of −300 ms to −100 ms; right plot). Orange and tan lines represent the median t statistic across participants for stimulus- and response-aligned analyses, respectively, and for each predictor. The box boundaries represent the 25th and 75th percentiles of the t statistics across participants, and the whiskers represent the maximum and minimum values of the t-statistic without an outlier (outliers are identified with a “+”). Coherence and confidence predicted stimulus-aligned EEG slope, controlling for other predictors in the model, and coherence, RT, and confidence predicted response-aligned EEG slope, controlling for other predictors. Box plots showing the distribution of t statistics across participants are shown in (b) when confidence was used to predict the residuals from regression models in which the slopes of stimulus-aligned single-trial EEG (within the time window of 250 ms to 500 ms; left plot) and response-aligned single-trial EEG (within the time window of −300 ms to −100 ms; right plot) were regressed on coherence, accuracy, RT, and three of them together respectively. Confidence predicted response-aligned EEG slope after being residualized for coherence, RT, and accuracy separately and together.
Discussion
To characterize how confidence arises in perceptual decision making, we tested the hypothesis that confidence reflects the state of accumulated evidence leading up to a perceptual choice. Across three experiments, we demonstrated that neural signatures of evidence accumulation, as reflected in the CPP, predict decision accuracy, RT, evidence strength, and subjective confidence judgments. There is currently little consensus regarding the neural computations underlying confidence judgments, with some models linking confidence to objective evidence quality and thus accuracy (Geurts et al., 2022; Meyniel et al., 2015; Sanders et al., 2016), and other models postulating a mapping from evidence and decision time to confidence (Fetsch et al., 2014; Gherman & Philiastides, 2015; Herding et al., 2019; Kiani et al., 2014; Kiani & Shadlen, 2009; Rausch et al., 2020; Tagliabue et al., 2019; Zylberberg et al., 2016). Our results, however, suggest the picture may be somewhat more complex. First, in Experiment 2, we found that confidence could be dissociated from accuracy and that, under such conditions, the CPP still built up faster when subjective confidence was higher. This indicates that confidence computations are unlikely to be a faithful readout of the same evidence-controlling decision difficulty. Secondly, in Experiment 3, we used a statistical model to show that variation in confidence was related to parietal evidence-accumulation signals even when we controlled for the effect of RT (and accuracy and evidence quality). Thus, RT information alone did not fully explain the link between confidence and the CPP. This raises the question of whether a single mechanism alone can account for choice, RT, and confidence in simple perceptual decisions.
Although our approach was to infer decision dynamics by using a neural proxy for the decision variable (rather than estimating it from behavior), recent modeling work has been able to explain confidence and accuracy dissociations via appeal to a common mechanism. In a series of experiments in humans and nonhuman primates, Zylberberg and colleagues introduced a doubly stochastic RDM stimulus (Zylberberg et al., 2016). In addition to the typical random motion component of the RDM, the authors added differing amounts of random variation in the time-varying motion evidence itself, giving rise to motion stimuli with high and low motion volatility. Behaviorally, increasing volatility led to increased confidence and faster RTs but weaker changes in accuracy (effects on accuracy were significant at the group level, but not for individual observers, unlike the effects on RT and confidence). Evidence-accumulation models of their data suggested that increasing motion volatility increases variability of the within-trial evidence-accumulation process such that the decision variable reaches a choice boundary more rapidly, giving rise to the faster RTs observed in behavior. However, because increasing evidence volatility does not change the mean evidence strength, the decision variable was only slightly more likely to hit the correct boundary. As a consequence, accuracy was not as strongly impacted in individual observers. To explain the increase in confidence associated with higher evidence volatility, the authors fitted a model whereby the mapping from accumulated evidence to confidence was not adjusted appropriately to account for the change in volatility. In other words, observers seemed to apply a fixed mapping between decision time and confidence, one that did not take into account within-trial variability in the accumulation process. This account could serve as a starting point to explain the results from our Experiment 2, where changes in confidence absent changes in accuracy were associated with more rapid evidence-accumulation signals in the brain. Although this is speculative, it is possible that increasing PE and NE may change within-trial evidence-accumulation variability in such a way that a choice boundary is reached sooner and RTs are faster, yet accuracy is only weakly impacted. Decision makers then apply a learned mapping from decision time to confidence that is no longer entirely appropriate, and they, essentially, assume that the faster RT was due to higher-quality evidence. This hypothesis could be tested in future studies combining the PEB with motion-energy analysis and diffusion modeling.
The unified mechanism account, however, appears to be inadequate to fully explain the results of our Experiment 3, in which we found that residual variance explained in CPP slope was related to confidence even when we controlled for RT (and accuracy). This finding suggests that although confidence is obviously related to accuracy and RT, it is still partially separable from both. This may cast doubt on the unified mechanism account and suggest that confidence computations are more complicated than a mapping from accumulated evidence over time onto a subjective estimate of confidence. Moreover, a unified mechanism does not seem to account for the distinction between RT and confidence we observed in the behavioral analysis of Experiment 2, where we found that controlling for RT (and accuracy) in a regression analysis still revealed an influence of positive evidence on confidence judgments (Fig. 3c). One possibility that could still favor a unified mechanism account would be to appeal to “nondecision time”—that is, the proportion of the RT not accounted for by the decision process but related to sensory encoding and motor-execution processes. If there is trial-to-trial variability in the nondecision time (in sensory-encoding latencies, for instance), that would contribute to RT but not to the evidence-accumulation rate (nor confidence) on that trial (Ratcliff & Tuerlinckx, 2002). As a result there will be partial independence between RT and evidence-accumulation rate, so that controlling for RT does not necessarily fully control for decision time. The best approach for modeling nondecision time (e.g., as fixed or variable across trials) remains an issue of debate (Bompas et al., 2023; Weindel et al., 2021). Moreover, whether the PEB results in RT changes or not is still a matter of debate, as some studies do observe the RT effect alongside confidence changes in the PEB (Ko et al., 2022; Koizumi et al., 2015), whereas others do not (Maniscalco et al., 2021; Rollwage et al., 2020; Samaha & Denison, 2022). One seemingly important factor is whether the stimulus itself encourages an accumulation-decision process—that is, RT differences seem more likely to emerge with dynamic stimuli (such as motion), and with evidence that evolves over time, and less so for decisions made on the basis of brief static stimuli (such as gratings).
A second possibility to explain the persistent link between CPP slope and confidence after controlling for RT is that postdecisional factors influence confidence as well. Many recent models propose that evidence continues to accumulate after a decision is made and that confidence is determined by the amount of choice-consistent or choice-inconsistent postdecision evidence (Desender et al., 2019; Desender, Ridderinkhof, et al., 2021; Navajas et al., 2016; Pleskac & Busemeyer, 2010; Yu et al., 2015). Although our results clearly indicate that subjective confidence can be predicted by predecision evidence signals, we cannot rule out the possibility that confidence is also informed by postdecisional dynamics. We did not systematically investigate postdecision signals in our study because a cursory view of the response-locked ERPs indicates that the CPP appears to decline immediately after the response, rather than continue accumulating. This is likely because we used a fixed-duration stimulus of 300 ms in all studies, whereas many experiments looking at postdecision evidence either continue to present evidence after the choice or right up until the choice. There is also some uncertainty regarding the correct baseline procedure to use to analyze postdecision ERPs. If response-locked ERPs are baselined relative to a preresponse window, then any differences leading up to the response (which we observe) will trivially appear in the postdecision window, mimicking postdecision evidence signals (Feuerriegel et al., 2022).
It should be noted that we utilized motion stimuli in our experiments, which leaves open the question of whether our findings will generalize to other types of stimuli and other sensory modalities. Future research could shed light on a long-standing question in metacognition research regarding the domain generality of confidence computations by testing whether the CPP tracks confidence across a variety of task and stimulus modalities. Last, our sample was limited to young adults, but confidence computations may change across the life span or in tandem with clinically relevant factors, all topics that future work could explore by utilizing the close link between the CPP and confidence that we report here. In sum, our data suggest that predecision evidence-accumulation signals alone can predict confidence even when controlling for accuracy, RT, and evidence strength.
Supplemental Material
sj-jpg-1-pss-10.1177_09567976241246561 – Supplemental material for Neural Signatures of Evidence Accumulation Encode Subjective Perceptual Confidence Independent of Performance
Supplemental material, sj-jpg-1-pss-10.1177_09567976241246561 for Neural Signatures of Evidence Accumulation Encode Subjective Perceptual Confidence Independent of Performance by Wei Dou, Lleymi J. Martinez Arango, Olenka Graham Castaneda, Leopoldo Arellano, Emily Mcintyre, Claire Yballa and Jason Samaha in Psychological Science
Supplemental Material
sj-jpg-2-pss-10.1177_09567976241246561 – Supplemental material for Neural Signatures of Evidence Accumulation Encode Subjective Perceptual Confidence Independent of Performance
Supplemental material, sj-jpg-2-pss-10.1177_09567976241246561 for Neural Signatures of Evidence Accumulation Encode Subjective Perceptual Confidence Independent of Performance by Wei Dou, Lleymi J. Martinez Arango, Olenka Graham Castaneda, Leopoldo Arellano, Emily Mcintyre, Claire Yballa and Jason Samaha in Psychological Science
Supplemental Material
sj-jpg-3-pss-10.1177_09567976241246561 – Supplemental material for Neural Signatures of Evidence Accumulation Encode Subjective Perceptual Confidence Independent of Performance
Supplemental material, sj-jpg-3-pss-10.1177_09567976241246561 for Neural Signatures of Evidence Accumulation Encode Subjective Perceptual Confidence Independent of Performance by Wei Dou, Lleymi J. Martinez Arango, Olenka Graham Castaneda, Leopoldo Arellano, Emily Mcintyre, Claire Yballa and Jason Samaha in Psychological Science
Supplemental Material
sj-jpg-4-pss-10.1177_09567976241246561 – Supplemental material for Neural Signatures of Evidence Accumulation Encode Subjective Perceptual Confidence Independent of Performance
Supplemental material, sj-jpg-4-pss-10.1177_09567976241246561 for Neural Signatures of Evidence Accumulation Encode Subjective Perceptual Confidence Independent of Performance by Wei Dou, Lleymi J. Martinez Arango, Olenka Graham Castaneda, Leopoldo Arellano, Emily Mcintyre, Claire Yballa and Jason Samaha in Psychological Science
Supplemental Material
sj-jpg-5-pss-10.1177_09567976241246561 – Supplemental material for Neural Signatures of Evidence Accumulation Encode Subjective Perceptual Confidence Independent of Performance
Supplemental material, sj-jpg-5-pss-10.1177_09567976241246561 for Neural Signatures of Evidence Accumulation Encode Subjective Perceptual Confidence Independent of Performance by Wei Dou, Lleymi J. Martinez Arango, Olenka Graham Castaneda, Leopoldo Arellano, Emily Mcintyre, Claire Yballa and Jason Samaha in Psychological Science
Footnotes
Transparency
Action Editor: Karen Rodrigue
Editor: Patricia J. Bauer
Author Contributions
References
Supplementary Material
Please find the following supplemental material available below.
For Open Access articles published under a Creative Commons License, all supplemental material carries the same license as the article it is associated with.
For non-Open Access articles published, all supplemental material carries a non-exclusive license, and permission requests for re-use of supplemental material or any part of supplemental material shall be sent directly to the copyright owner as specified in the copyright notice associated with the article.