
Abstract
Both homophily and heterophily are observed in humans. Homophily reinforces homogeneous social networks, and heterophily creates new experiences and collaborations. However, at the extremes, high levels of homophily can cultivate prejudice toward out-groups, whereas high levels of heterophily can weaken in-group support. Using data from 24,726 adults (M = 46 years; selected from 10,398 English neighborhoods) and the composition of their social networks based on age, ethnicity, income, and education, we tested the hypothesis that a middle ground between homophily and heterophily could be the most beneficial for individuals. We found that network homophily, mediated by perceived social cohesion, is associated with higher levels of subjective well-being but that there are diminishing returns, because at a certain point increasing network homophily is associated with lower social cohesion and, in turn, lower subjective well-being. Our results suggest that building diverse social networks provides benefits that cannot be attained by homogeneous networks.
Introduction
With diversity increasing worldwide, citizens in developed nations are encountering ever more opportunities to interact with people of different backgrounds and divergent social characteristics. Although intergroup contact is widely recognized to be beneficial for a range of outcomes (Brown & Hewstone, 2005; Pettigrew & Tropp, 2006), controversial views expressed about the consequences of diversity continue to fuel heated debates. Most notably, Putnam (2007) argued that diversity is negatively associated with trust not only toward out-group members, but also toward others in general. Events such as the death of George Floyd and the emergence of an international Black Lives Matter movement have brought to the fore discussions about our ability to live in harmony, and not only with regard to race or ethnicity. Although public health officials insisted that a collective response was required to contain the COVID-19 pandemic, an intergenerational divide emerged with younger generations complaining that they were being asked to compromise their lifestyles in order to save older generations (Gustafsson & McCurdy, 2020). In the 2015 Brexit referendum in the United Kingdom, less educated individuals were more likely to vote to leave the European Union than their more educated counterparts (Goodwin & Heath, 2016).
Some polarization is likely inevitable, as human beings show a preference for interacting with similar others and as homophily powerfully structures our social relationships (McPherson et al., 2001). Humans are thought to have evolved with a preference for homogeneity and stability (Caporael, 1997) as well as for caution in how they approach out-groups (Stephan & Stephan, 2000), and people naturally distinguish in-groups from out-groups as a collective defense against potential threats to survival from unknown others (Bowles, 2009).
At the same time, heterophily (also known as xenophily) is also often observed in humans: We have an impulse to engage in contact with other people, even with members of out-groups (Stürmer et al., 2013). As much as we are ready to react initially with negativity to social diversity, we are also equipped with the potential to seek out and benefit from intergroup experiences (Ramos & Hewstone, 2018). In evolutionary terms, cooperation between different groups with complementary advantages has led to the division of labor and economies of scale (Hooper et al., 2015). Despite a tendency for homophily, people also display a heterophilic nature. Although homophily facilitates societal living and the formation of cohesive social groups, contact with out-groups nonetheless brings an array of other benefits that cannot be acquired from in-group interactions alone. Intergroup contact enables access to new resources and knowledge (Bar-Yosef, 2002) and contributes to specialization and gains from trade and collaboration (Fu et al., 2012).
Homophily, Heterophily, Social Cohesion, and Subjective Well-Being
Research in sociology, epidemiology, and psychology has found a positive link between social connection and health (e.g., Cohen, 2004). Research shows that social relationships are positively associated with happiness (Diener et al., 2009; Diener & Seligman, 2002; Jetten et al., 2014). Indeed, the magnitude of the effect of social relationships on mortality is comparable to that of quitting smoking (Holt-Lunstad et al., 2010), and the influence of relationships is even stronger after controlling for other factors that are associated with adverse health (House et al., 1988). Yet although the benefits of social networks for subjective well-being (SWB) are well documented, it remains unknown how the composition of social networks, in terms of in-group and out-group members, is related to SWB.
Several distinct theoretical positions across the social sciences point to possible advantages and disadvantages of having social relations exclusively with members of the same social group. Notably, Putnam (2000) distinguished between “bridging social capital” (relations that transcend social groups) and “bonding social capital” (relations among members of the same group). Bonding social capital is exclusive, inward-looking, and tends to reinforce exclusive identities and homogeneous groups, as typically found in homophily.
Statement of Relevance
Human beings are thought to prefer interacting with people who have similar key characteristics to themselves (e.g., same ethnicity, age, educational background). Several of our relationships are guided by this principle, including those formed through friendship and marriage. However, in a fast-changing world, with most societies becoming more diverse, such tendencies might create significant challenges for overall social cohesion. Using a large nationally representative survey, we examined whether people’s friendship networks tended to be composed of other people who were similar to themselves in terms of ethnicity, age, income, and educational level. We found that individuals with mixed social networks (e.g., networks that included both people similar to and different from themselves, in ethnic terms) reported higher social cohesion in the neighborhood where they live; this reported higher social cohesion is linked to the same people reporting higher levels of well-being. A tendency to seek interactions with similar others might have been responsible for early humans living in groups and forming societies. However, today a departure from these tendencies might be required, and individuals and societies might extract more positive outcomes when they embrace diversity.
A unique focus on in-groups may bring positive SWB outcomes (e.g., Haslam et al., 2009) but can simultaneously create some challenges that, in the long term, can undermine social cohesion and societal well-being. For example, by creating strong in-group loyalty, homophily may perpetuate divisions between groups and create out-group antagonism, thwarting social cohesion (or, as in our study, perceived social cohesion). Other key tendencies, such as the in-group favoritism that emerges in intergroup contexts (Tajfel & Turner, 1979), may serve to accentuate group distinctions and further sustain group boundaries. Scholars have argued that an exclusive focus on in-groups is incompatible with a globalized world with increasing levels of social diversity (Crisp & Meleady, 2012). On the basis of this reasoning, it should be expected that high levels of homophily may be associated with lower social cohesion. Because of the known association between social cohesion and SWB (Elliot et al., 2014; Kawachi & Kennedy, 1997), lower social cohesion should, in turn, compromise individuals’ SWB.
In contrast to bonding social capital, bridging social capital is inclusive and can generate broader identities and reciprocity, as represented by heterophily. The “weak ties” that link between networks (Granovetter, 1973) are, in fact, extraordinarily strong and significant. Extensive research on intergroup conflict shows that increasing contact with out-groups lowers prejudice toward out-group members and yields multiple beneficial individual and social outcomes (see Brown & Hewstone, 2005). The benefits of intergroup contact are well established (Pettigrew & Tropp, 2006), including positive effects on outcomes related to social cohesion (Ramos et al., 2019). According to this perspective, high levels of heterophily may promote strong social cohesion, resulting in societies capable of bridging social divisions, which in turn contributes to positive outcomes in terms of SWB. However, individuals with exclusively heterophilic networks will miss out on the benefits to SWB provided by in-groups.
Based on the respective advantages of homophily and heterophily, we argue that it is critical to examine two parallel processes. The first process is the direct positive association found in the literature between in-groups and SWB (Haslam et al., 2009): SWB should improve as network homophily increases. The second process considers the parallel association of homophily with social cohesion, which in turn should impact SWB (an indirect effect of network homophily on SWB via social cohesion). Specifically, we hypothesize an inverted U-shaped relationship between network homophily and social cohesion. Both network homophily and heterophily are, in their own way, beneficial to individuals, so an optimal balance should be achieved when individuals extract benefits from networks allowing both bonding and bridging social capital. Homophily is crucial for the formation of groups and, because of this, may positively contribute to social cohesion, but a unique focus on in-groups should cause divisions and obstruct social cohesion. An optimal balance should be achieved when individuals extract benefits from networks of both in-group and out-group members, contributing to social cohesion and in turn improving SWB.
Open Practices Statement
The data used in our study are distributed by the United Kingdom (UK) Data Service (DOI: 10.5255/UKDA-SN-7339-8). These are safeguarded data, requiring an application (www.ukdataservice.ac.uk) for a special license because of the availability of georeferenced data. This georeferenced data was critical for our modeling strategy; other researchers can have access to the data, including the geocoding, by submitting an application to the UK Data Service. Additional analysis, including robustness checks, and the code for our main analysis can be found in the Supplemental Material available online.
Method
The model
We tested two parallel processes. The first is a direct association of network homophily with SWB. The second considers the indirect effect of network homophily on SWB through the mediating role of social cohesion. Figure 1 illustrates our theoretical model, which envisions the direct relationship between homophily and SWB, together with a quadratic function that operates indirectly through the mediating effect of social cohesion. For didactic purposes, in the figure the linear and quadratic effects of homophily are depicted separately. The path c1 indicates the direct linear effect of homophily on SWB. The product a2 * b denotes the indirect quadratic effect of network homophily on SWB through social cohesion. Although we do not have a theoretical reason to expect a nonlinear effect of homophily on SWB, we estimated c2 to account for this possibility. For the same reason, we estimated the product a1 * b, capturing the indirect linear effect of network homophily on SWB via social cohesion. To the best of our knowledge, the model represents the first attempt to investigate the relationship between network composition, social cohesion, and SWB.
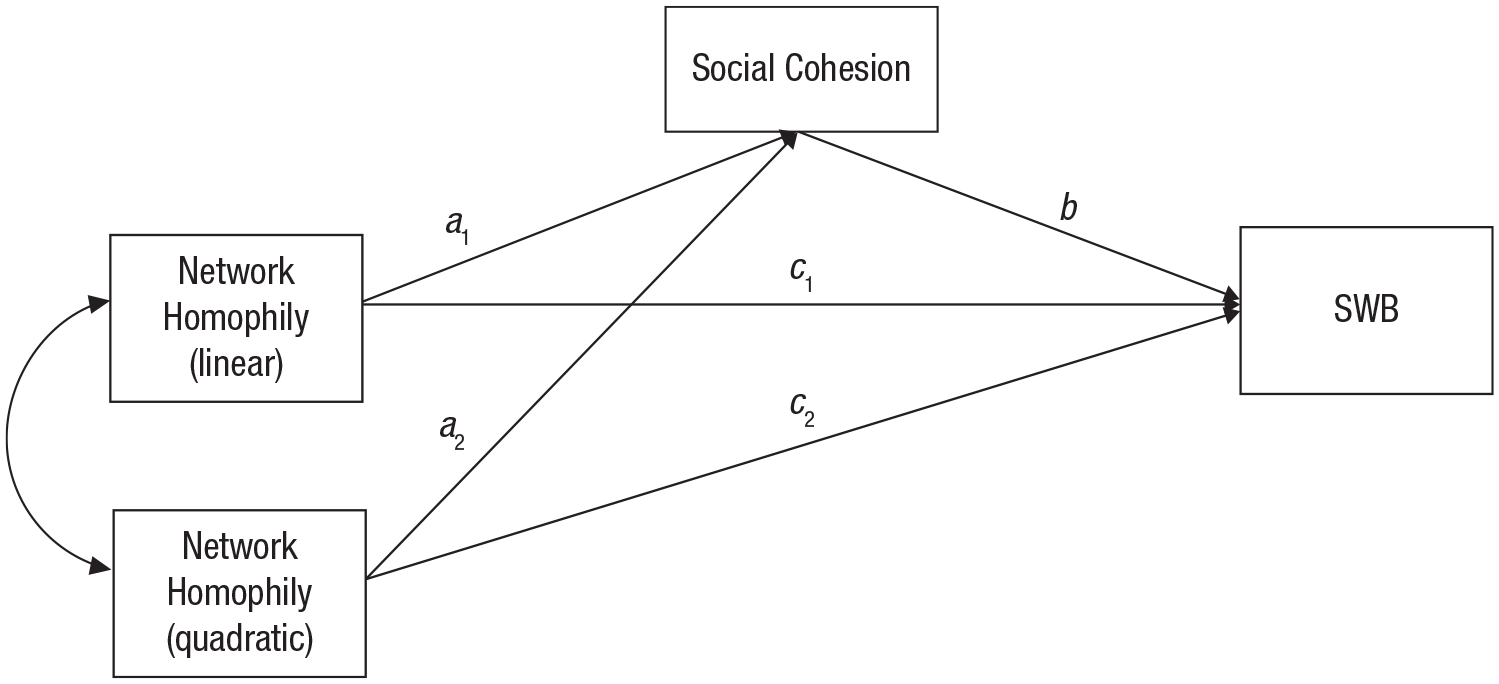
Mediation model testing the nonlinear relationship between network homophily and subjective well-being (SWB), mediated by social cohesion. Note that a2 * b denotes the indirect effect of interest, the quadratic indirect effect of network homophily on subjective well-being (SWB).
Data and measurements
Our study used data taken from Understanding Society: the UK Household Longitudinal Study (UKHLS). The UKHLS, which started in 2009, is a longitudinal survey of approximately 40,000 households drawn from the UK population. It contains high-quality and nationally representative data on demographics, socioeconomic status, health, social life, and subjective attitudes, obtained from face-to-face surveys conducted by trained interviewers. A special-license version of the data, containing geographical identifiers of Lower Layer Super Output Areas (LSOAs; areas or neighborhoods with an average of 1,500 residents) in which respondents lived, is distributed by the data owner upon application, and it is used in this study to link individuals to their neighborhoods. Indicators of our outcome variable, SWB, and other individual-level characteristics were measured in every wave. Although conducted annually, the UKHLS only asked questions concerning network homophily and attitudes toward neighborhood in Waves 3 (2011–2013) and 6 (2014–2016). To use the UKHLS data, we applied for a special license through the UK Data Service (www.ukdataservice.ac.uk). In our application, we explained our objectives and justified why georeferenced data was required for our research. Our research complied with the ethical guidelines and legal requirements of the data source. All respondents gave their consent to take part in the survey, and more information about the communication between UKHLS and participants can be found on the survey’s website (https://www.understandingsociety.ac.uk/documentation/mainstage/consents/). Ethical approval for the UKHLS data collection was granted by the University of Essex ethics committee.
An initial inspection of the data revealed that respondents’ network composition is extremely stable, with no within-person variance. Because longitudinal analysis is inefficient in estimating the effects of time-invariant variables (Plümper & Troeger, 2007), we tested our hypothesis using three different approaches. These included an analysis of Wave 3, a replication using Wave 6, and a pooled ordinary-least-squares (OLS) regression method. The pooled OLS regression method involves pooling data from both Waves 3 and 6, controlling for a time component. The efficacy of the pooled OLS regression method has been demonstrated in cases of little within-subject variance in panel data estimating the effects of these variables (Plümper & Troeger, 2007). In this section, we report all Wave 3 results; Wave 6 and the pooled OLS results are reported in the Supplemental Material as robustness checks (see the Appendix there). Replicating our analysis across waves and methods should provide additional confidence in the results of our hypothesis tests. Our study focused only on survey participants living in England, because of the lack of contextual-level information for the Wales, Scotland, and Northern Ireland subsamples.
We used respondents’ overall life satisfaction and their score on the 12-item General Health Questionnaire (GHQ) as indicators of SWB. Both indicators are commonly used in the literature (see Diener, 2009, for a comprehensive review of studies on SWB). Life satisfaction captures individuals’ subjective assessment of their lives in general, and the GHQ score, as an indicator of current mental-health status, measures individuals’ recent pleasant (and unpleasant) psychological experience. In the UKHLS, respondents are asked their “satisfaction with life overall.” Answers to this question range from 1 (completely dissatisfied) to 7 (completely satisfied). The GHQ score is derived from 12 GHQ questions relating to respondents’ recent psychological experience, such as, “Have you recently lost much sleep over worry?”, “Have you recently been feeling unhappy or depressed?”, and “Have you been able to enjoy your normal day-to-day activities?” (Goldberg & Williams, 1988). The answers to each of these questions are coded on a scale ranging from 0 to 3 with different endpoints for each question (typical endpoints ranged from 0, not at all, to 3, much more than usual). GHQ is then calculated by summing individuals’ answers to all 12-item GHQ questions, resulting in a score between 0 and 36. However, we reversed the original GHQ score so that a higher score indicates a better outcome, consistent with our life satisfaction scale (correlation between life satisfaction and reversed GHQ: r = .46, p < .001).
The data allowed us to study four types of network homophily in terms of race, age, income, and education. In the UKHLS, respondents were asked to report “the proportion of friends of same race/with similar age/income/level of education.” Responses were coded on a 4-point scale ranging from 1, less than half (the lowest homophily), to 4, all the same (the highest homophily). Using this variable, we were able to capture how homophily is manifested in the respondents’ social networks. Moreover, we felt that testing our hypothesis with four different social networks should increase the robustness of our analysis while contributing to the generalizability of our findings across different groups and networks.
We were particularly interested in how perceived social cohesion mediates the association of network homophily with SWB. In the UKHLS, cohesion was measured using Buckner’s (1988) neighborhood cohesion instrument, a variable that combines individuals’ psychological sense of community, attraction to neighborhood, and social interactions within a neighborhood. Our social cohesion variable was derived from the extent to which individuals agreed with the following eight statements, rated on a 5-point scale ranging from 1 (strongly agree) to 5 (strongly disagree): “belong to neighborhood,” “local friends mean a lot,” “advice obtainable locally,” “can borrow things from neighbors,” “willing to improve neighborhood,” “plan to stay in neighborhood,” “am similar to others in neighborhood,” and “talk regularly to neighbors” (Cronbach’s α = .88). Responses to these statements were reverse coded and then averaged to create a score of social cohesion. To ensure good representativeness, the score was only calculated for individuals who responded to all cohesion statements. Higher values represent great social cohesion. Scores on the cohesion instrument range from 1 (the lowest cohesion) to 5 (the highest cohesion). This instrument assesses perceived social cohesion, but for simplicity we refer to social cohesion throughout.
It is important to note that although this social-cohesion measure is specific to the neighborhood, the homophily-network measure captures respondents’ friendship networks irrespective of their geographical location. However, research on social networks has shown that about two thirds of one’s friends are those who are geographically proximate (Liben-Nowell et al., 2005). Because of this, we expect that most of these friends will live in the same neighborhood. There is a smaller proportion of friends who may be geographically distant (e.g., out-group members who may live in different areas), but according to intergroup contact research (e.g., Pettigrew & Tropp, 2006), contact with out-groups contributes to the formation of more positive out-group attitudes. Consequently, we expect that individuals benefiting from these positive correlates of intergroup contact should behave in accordance with these more positive attitudes, contributing positively to intergroup relations and social cohesion in their neighborhoods.
We controlled for a set of individuals’ demographics and characteristics known to be associated with SWB, including age, gender, marital status, highest qualification, ethnicity, job status, household income, homeownership, number of children and total household members, and whether the respondent was born in the United Kingdom. Age was included as a continuous variable and gender as a binary variable (1 for female and 0 for male). Marital status was included as a set of binary variables (married, divorced/separated/widowed; reference group: single), coded 1 if the respondent belonged to the corresponding category. Ethnicity was included as a set of binary variables (Indian, Pakistani, Bangladeshi, Black, and others; reference group: White), coded 1 if the respondent belonged to the corresponding ethnic group and 0 otherwise. Highest qualification was included as a set of binary variables (GCSE, A-level, 1 degree, other degree, and other qualification; reference group: no qualification), coded 1 if the respondent belongs to the corresponding education category and 0 otherwise. Number of children and number of household members were included as continuous variables. Household income was coded as a logarithm. Whether or not the respondent was UK born/retired/employed/had a rented home were included as binary variables, coded 1 if the respondent belonged to the corresponding categories and 0 otherwise. The survey included the option of answering “don’t know,” “refuse to answer,” or “inapplicable” for all the variables above. We coded responses to all three options as missing data.
Using the special-license version of the data set, we were able to link individuals to the LSOAs they were living in. This feature allowed us to control for neighborhood characteristics that could potentially interfere with the relationships between network homophily, social cohesion, and SWB. Because variability in network homophily depends, to a certain extent, on the proximate availability of out-group members, we controlled for ethnicity, age, income, and education diversity at the LSOA level. These four social-diversity measures were calculated using the Herfindahl-Hirschman Index (Hirschman, 1964), a widely used measure of diversity in the literature. The Herfindahl-Hirschman Index measuring ethnic diversity of LSOAs was based on the ethnic population estimates provided in NewETHPOP (Wohland et al., 2012) that were used for estimates in Wave 3 (2011) and Wave 6 (2014). The Herfindahl-Hirschman Index results for age, income, and education diversity of LSOAs were based on 2011 UK census data. For all four social-diversity measures, a higher index value indicates a greater probability of two randomly selected individuals in the neighborhood belonging to a different group. Moreover, deprivation has been shown to affect the SWB and health of individuals (Caspi et al., 2000), so we controlled for deprivation using the English Index of Multiple Deprivation (IMD). IMD is a composite score measuring seven domains—income, employment, education, health, crime, barriers to housing and services, and living environment deprivation. Using the 2010 and 2015 English IMD, we applied linear interpolation to obtain IMD scores for Wave 3 (2011) and Wave 6 (2014).
English participants with contextual-level information available (i.e., ethnic, age, income, education diversity, and IMD) and a complete set of covariates were included in the analysis. Our final Wave 3 sample consisted of 24,726 individual observations living in 10,398 English LSOAs (sample sizes and details of Wave 6 and the pooled sample are reported in the Supplemental Material). The percentage of missing values in the UKHLS for the variables used in our models was extremely low (1.7%).
Analyses
Although we refer to direct and indirect effects, the data used in our study do not allow us to infer causality. We use these terms because they are part of conventional language in mediation analysis, but we do not want to imply causal inferences about the underlying associations. For our analyses, we used structural equation modeling (SEM) to test the association between network homophily and SWB, using social cohesion as a mediator. The structure of our data had two levels: Individual i was living in LSOA j. Note that because the variation in network homophily is nearly zero within each individual, we excluded the time component of the data and therefore only estimated two-level mediation models (i.e., individuals clustered in LSOAs). We estimated LSOA-specific random intercepts in each structural equation to account for unobserved LSOA-level heterogeneities. We fitted the following two-level mediation structural model:
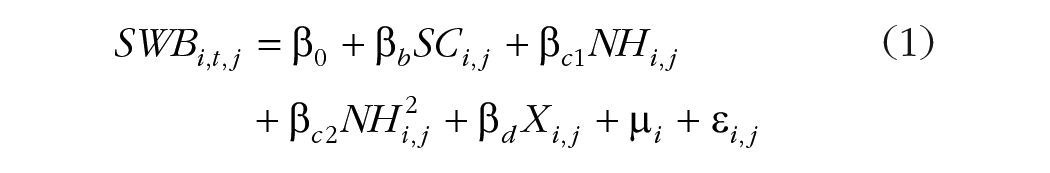

where
Our outcome variable, SWB, was, in turn, life satisfaction or GHQ, reported on a reversed scale so that a higher value indicates better SWB; this is different from the conventional GHQ scale in the literature. We defined four types of network homophily: race, income, age, and level of education. We fitted our first model using one type of network homophily each time. Specifically, we estimated the nonlinear direct effect of network homophily on SWB and the nonlinear indirect effect mediated by social cohesion, controlling for a set of individual demographics and characteristics, as well as contextual-level social diversity and deprivation (in each model we controlled for the type of diversity matching the examined network; e.g., we controlled for age diversity within each LSOA when examining age network homophily). We calculated robust standard errors to account for individuals clustering in LSOAs.
One of the key objectives of this study was to investigate the nonlinear relationship between network homophily, social cohesion, and its further association with SWB. In most empirical work identifying U-shaped (or inverted U-shaped) relationships, researchers usually include a quadratic term in a standard linear regression model and simply rely on the significance of the quadratic term to conclude whether the (inverted) U-shaped relationship exists. However, Lind and Mehlum (2010) argued that this application can be misleading, especially when the true relationship is convex (or concave) but unchanged over relevant data values. To ensure that nonlinearity is an empirically sound assumption, Lind and Mehlum suggested that researchers should examine whether the quadratic term is statistically significant, together with an inspection of the estimated point at which the value of the quadratic function is smallest (for inverted U-shaped curves); the purpose of this step, in our case, is to check whether the value is smallest in the interval [−1, 0]. Alongside this procedure, we should also examine whether the turning point of the inverted U-shaped relationship between network homophily and social cohesion falls within the range of network homophily values.
We were interested in the sign and significance of a2 in Figure 1. A significant and negative coefficient for the quadratic term is the necessary condition for observing an inverted U-shaped relationship, and we conducted a set of U-tests (Lind & Mehlum, 2010) to verify the sufficient condition of a true inverted U-shaped relationship between network homophily and social cohesion. We computed analyses using Mplus 8, and estimates were robust across the two different measures of SWB and the four types of homophily.
We further tested how our results differed across different respondent subgroups (such as White vs. non-White, young vs. older, degree holders vs. others) by repeating the main analysis but using these different subsamples. We also tested for differences in results between less versus more ethnically diverse areas, given that ethnic diversity has been associated with a wide range of positive and negative intergroup outcomes (e.g., Ramos & Hewstone, 2018). Individuals were grouped as White if their reported ethnicity was among White British/English/Scottish/Welsh/Northern Irish/Gypsy or Irish traveler/other White background. Younger individuals were those who are younger than 65 years old. Individuals with a university degree or higher degree were grouped as degree holders. More diverse areas were LSOAs with scores above the cross-national median in our Herfindahl-Hirschman Index measuring ethnic diversity.
Results
Results for the full sample
Tables 1 and 2 present the descriptive statistics and pairwise correlations between our key variables (for descriptive statistics and correlations of Wave 6 and the pooled data, see Tables S1–S4 in the Supplemental Material). Table 3 presents the coefficients and 95% confidence intervals (CIs) obtained from estimating our model, and Table 4 displays the indirect effects of network homophily, mediated by social cohesion, as shown in Figure 1. As a rule of thumb, the significance of the quadratic term indicates an inverted U-shaped relationship when the sign is negative. With respect to the direct effect, there were no statistically significant quadratic coefficients between homophily in race, age, income, and education and SWB. This result was consistent across both the life satisfaction and GHQ indicators.
Descriptive Statistics (UKHLS Wave 3)
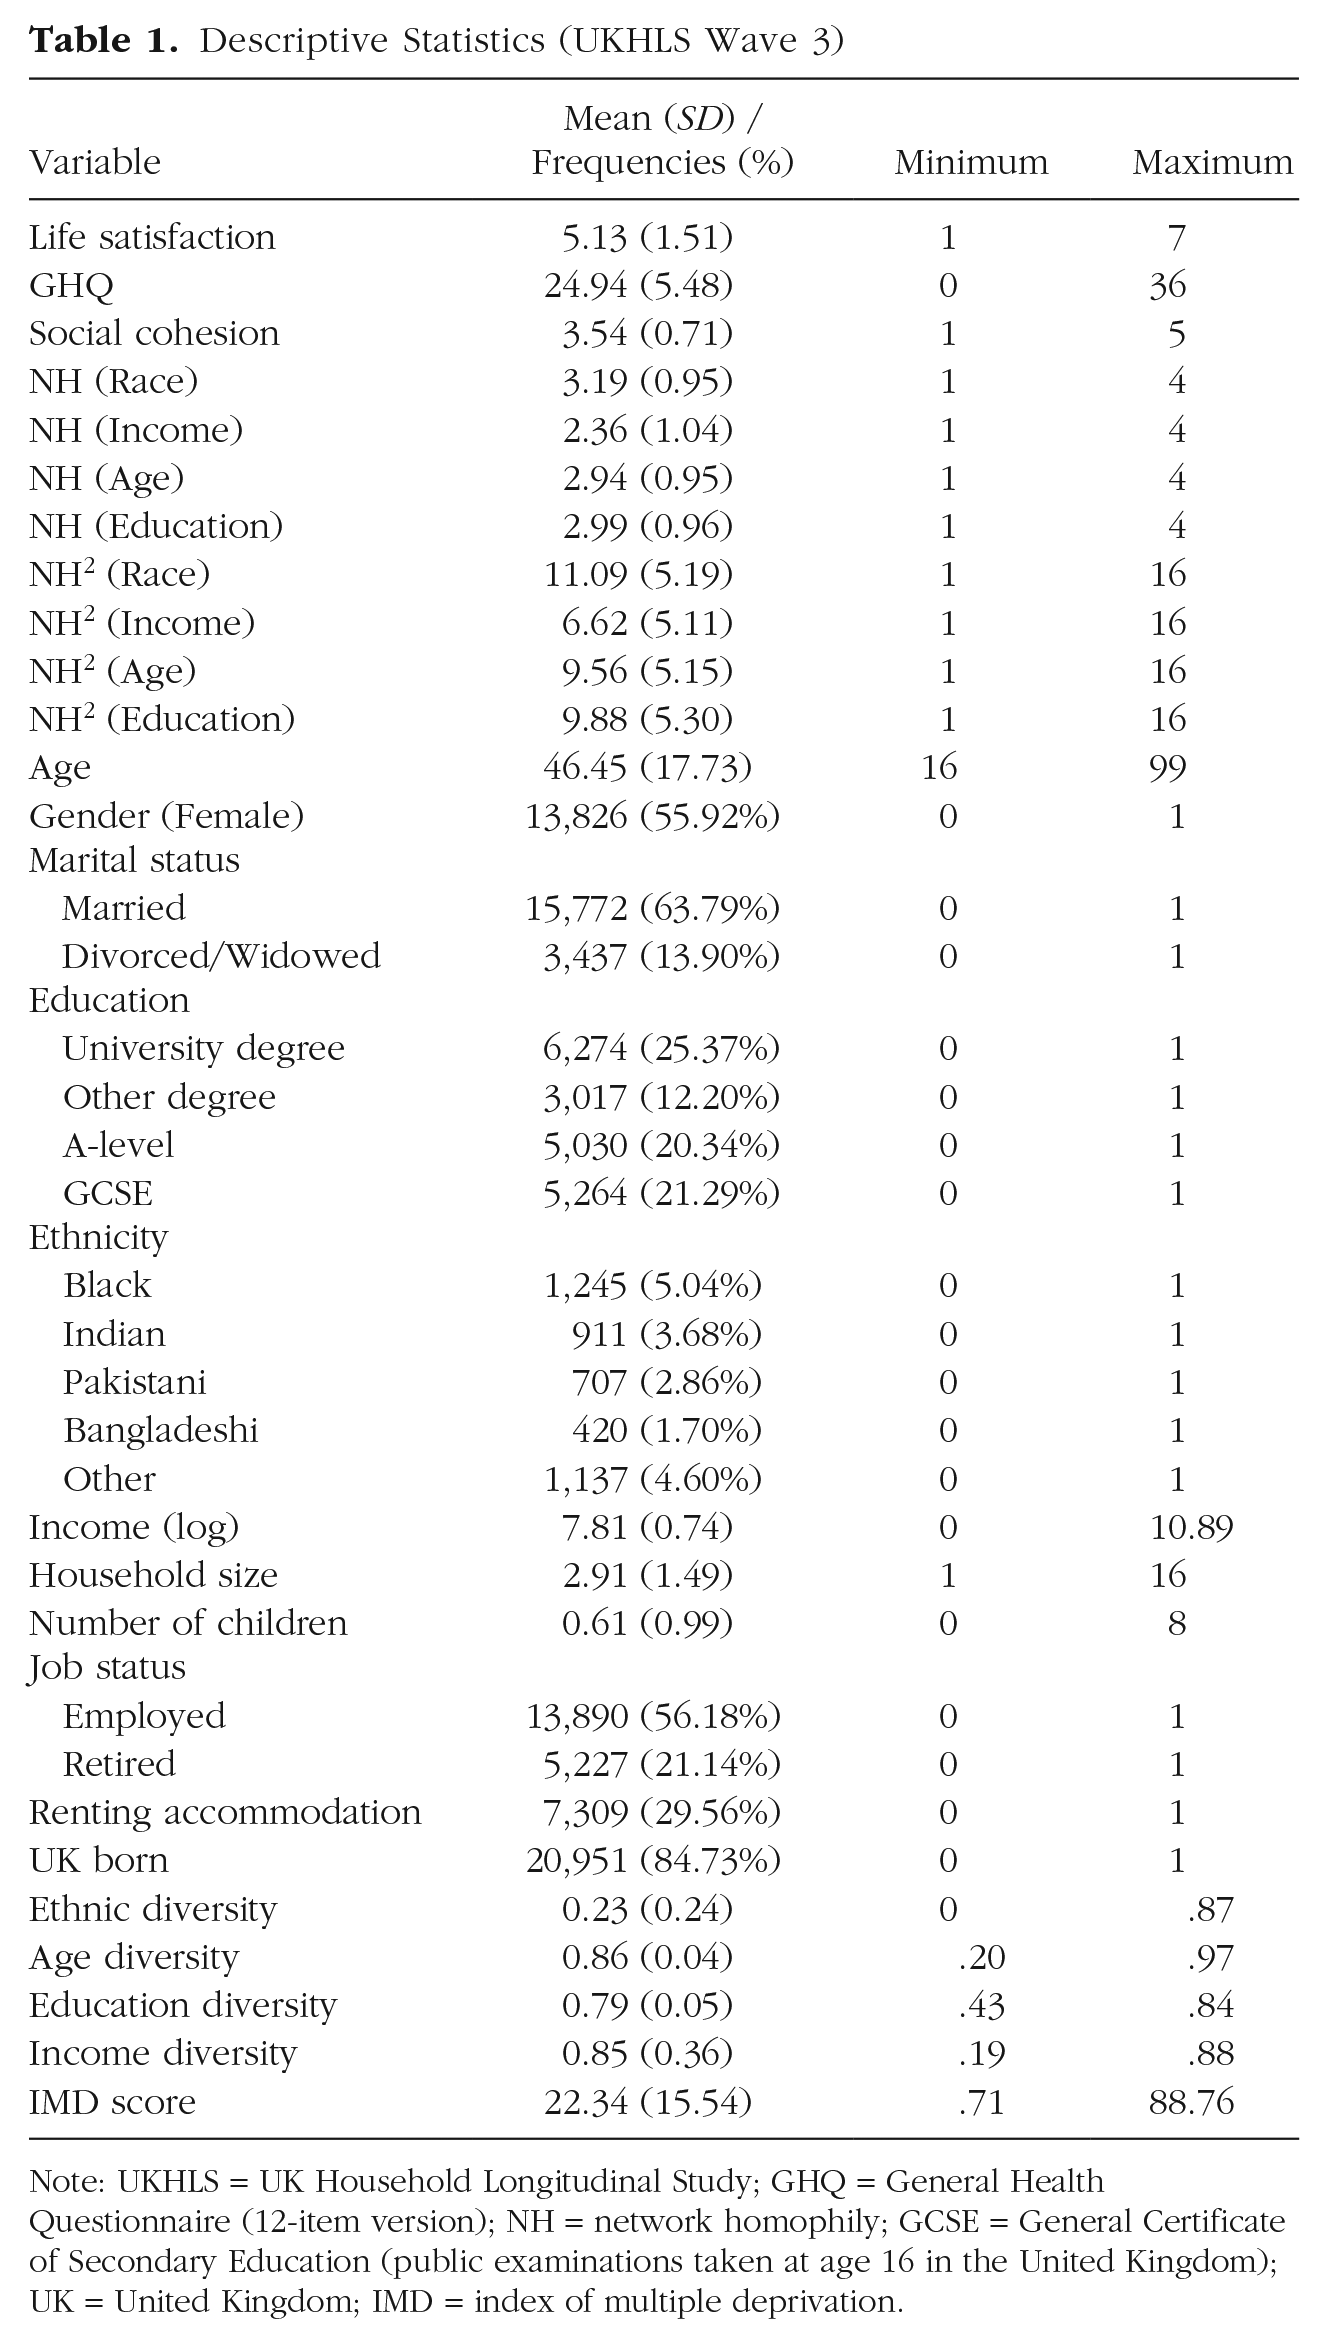
Note: UKHLS = UK Household Longitudinal Study; GHQ = General Health Questionnaire (12-item version); NH = network homophily; GCSE = General Certificate of Secondary Education (public examinations taken at age 16 in the United Kingdom); UK = United Kingdom; IMD = index of multiple deprivation.
Pairwise Correlations
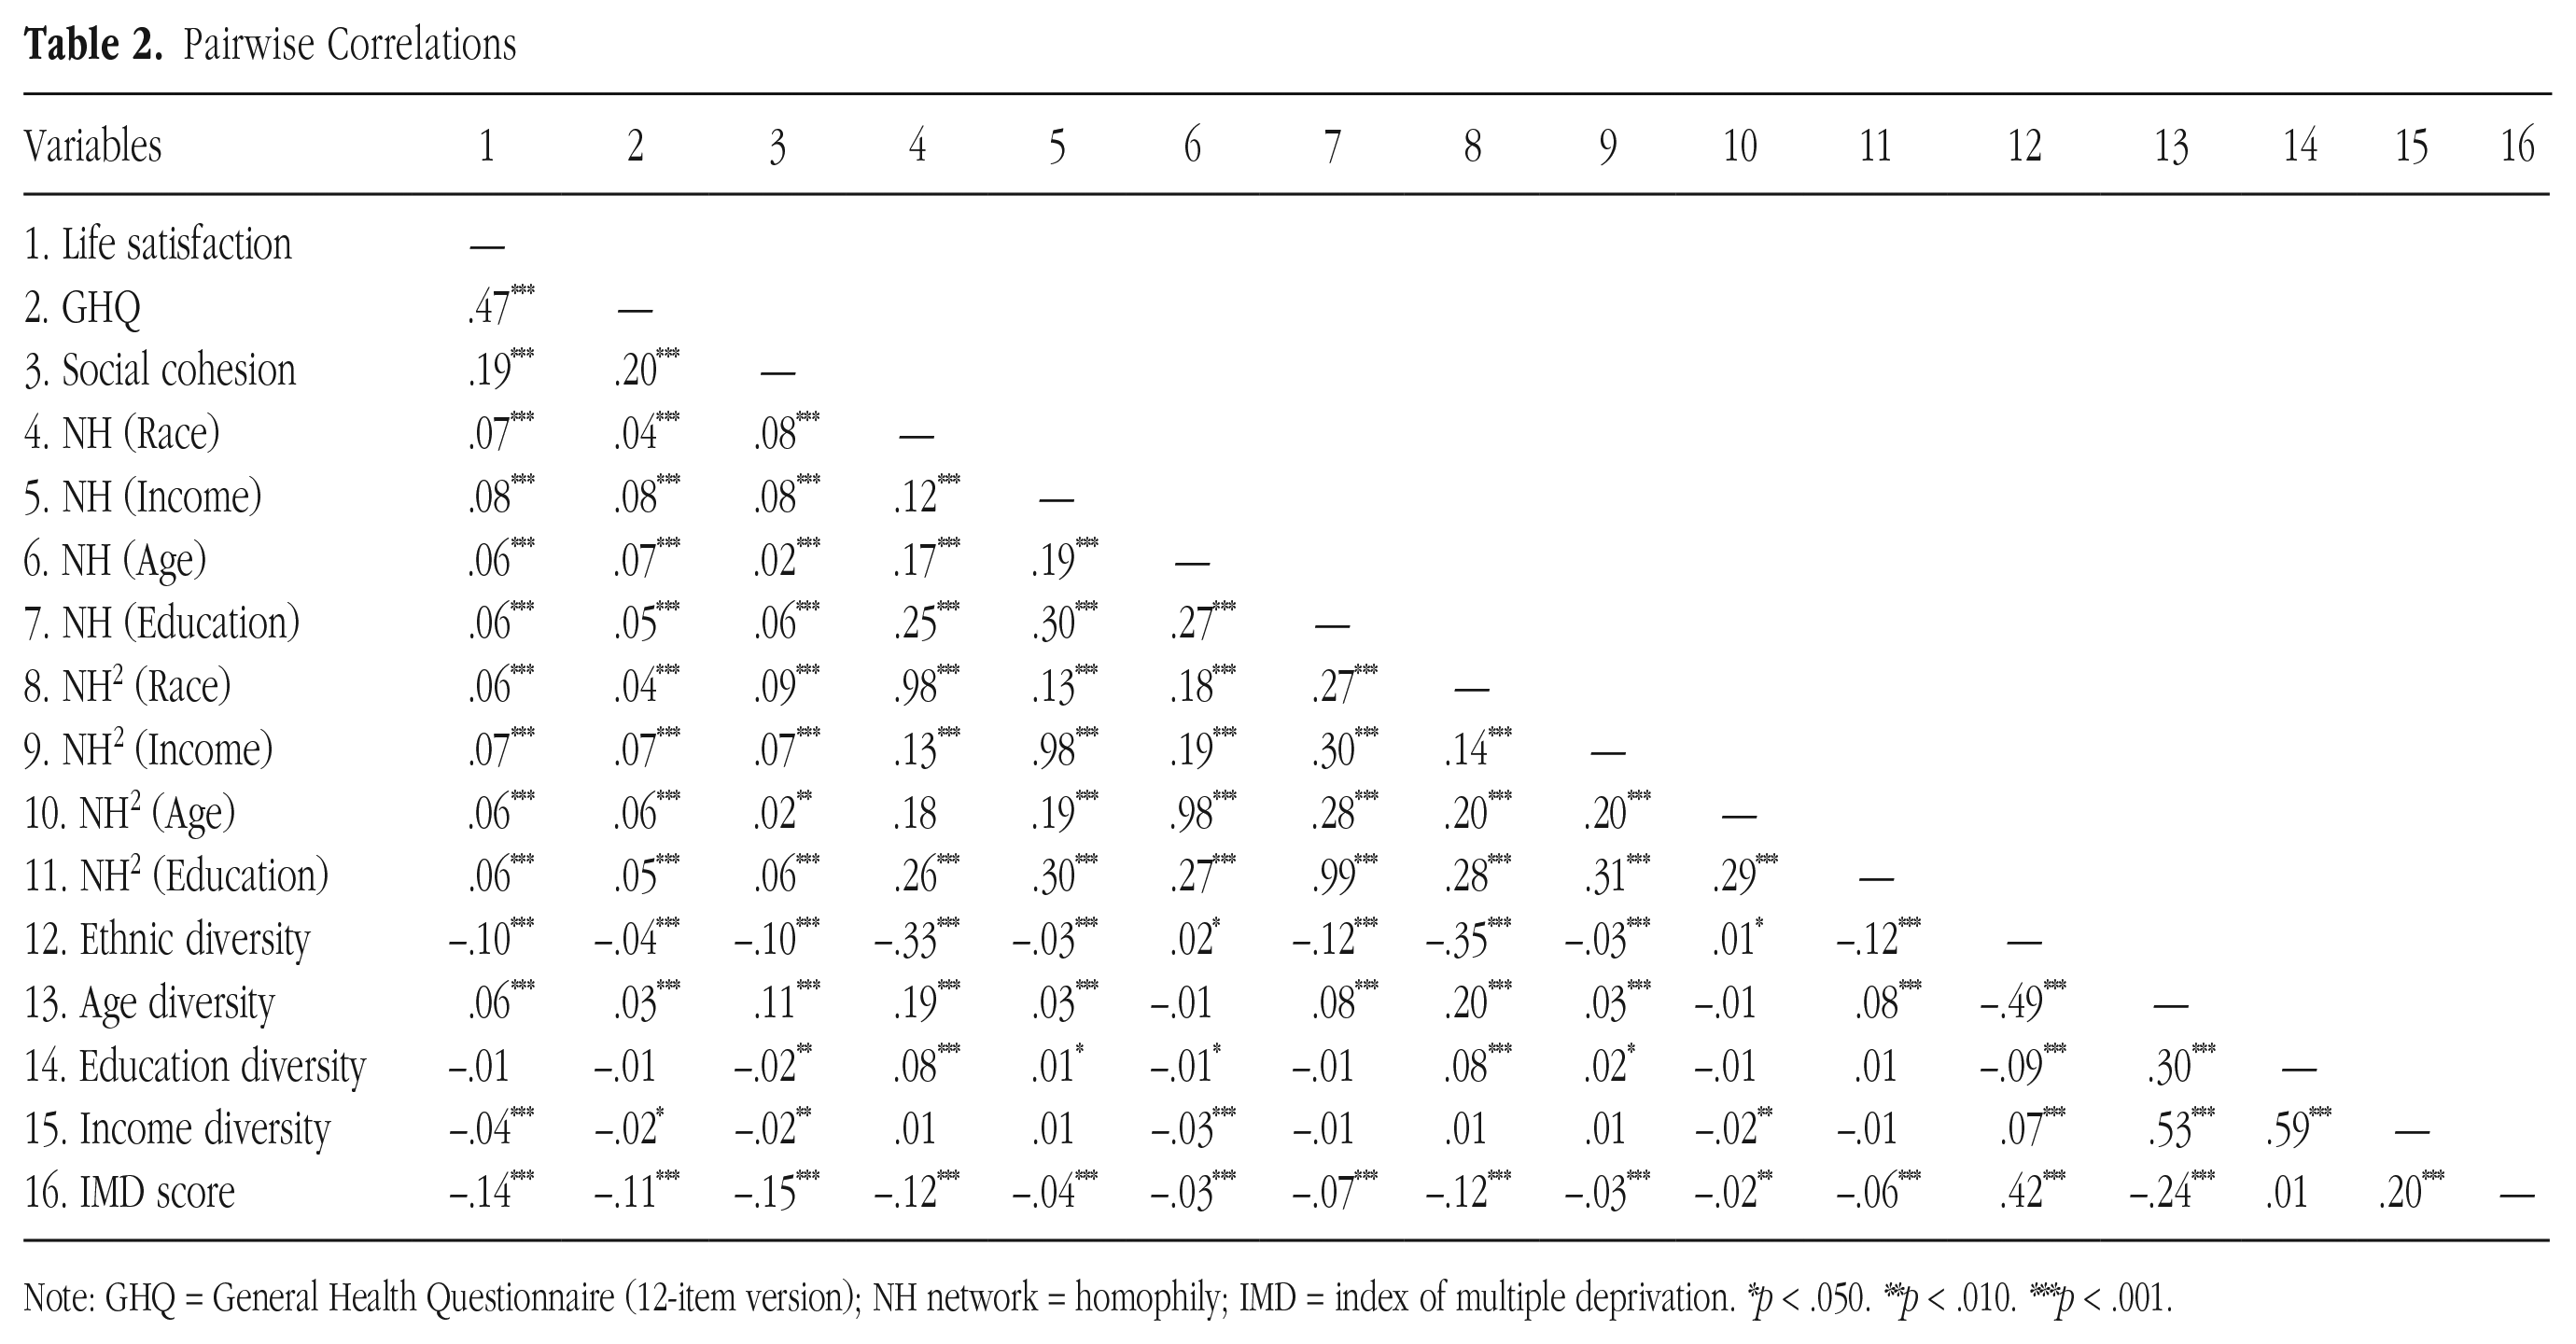
Note: GHQ = General Health Questionnaire (12-item version); NH network = homophily; IMD = index of multiple deprivation. *p < .050. **p < .010. ***p < .001.
The Association Between Network Homophily, Life Satisfaction, and GHQ
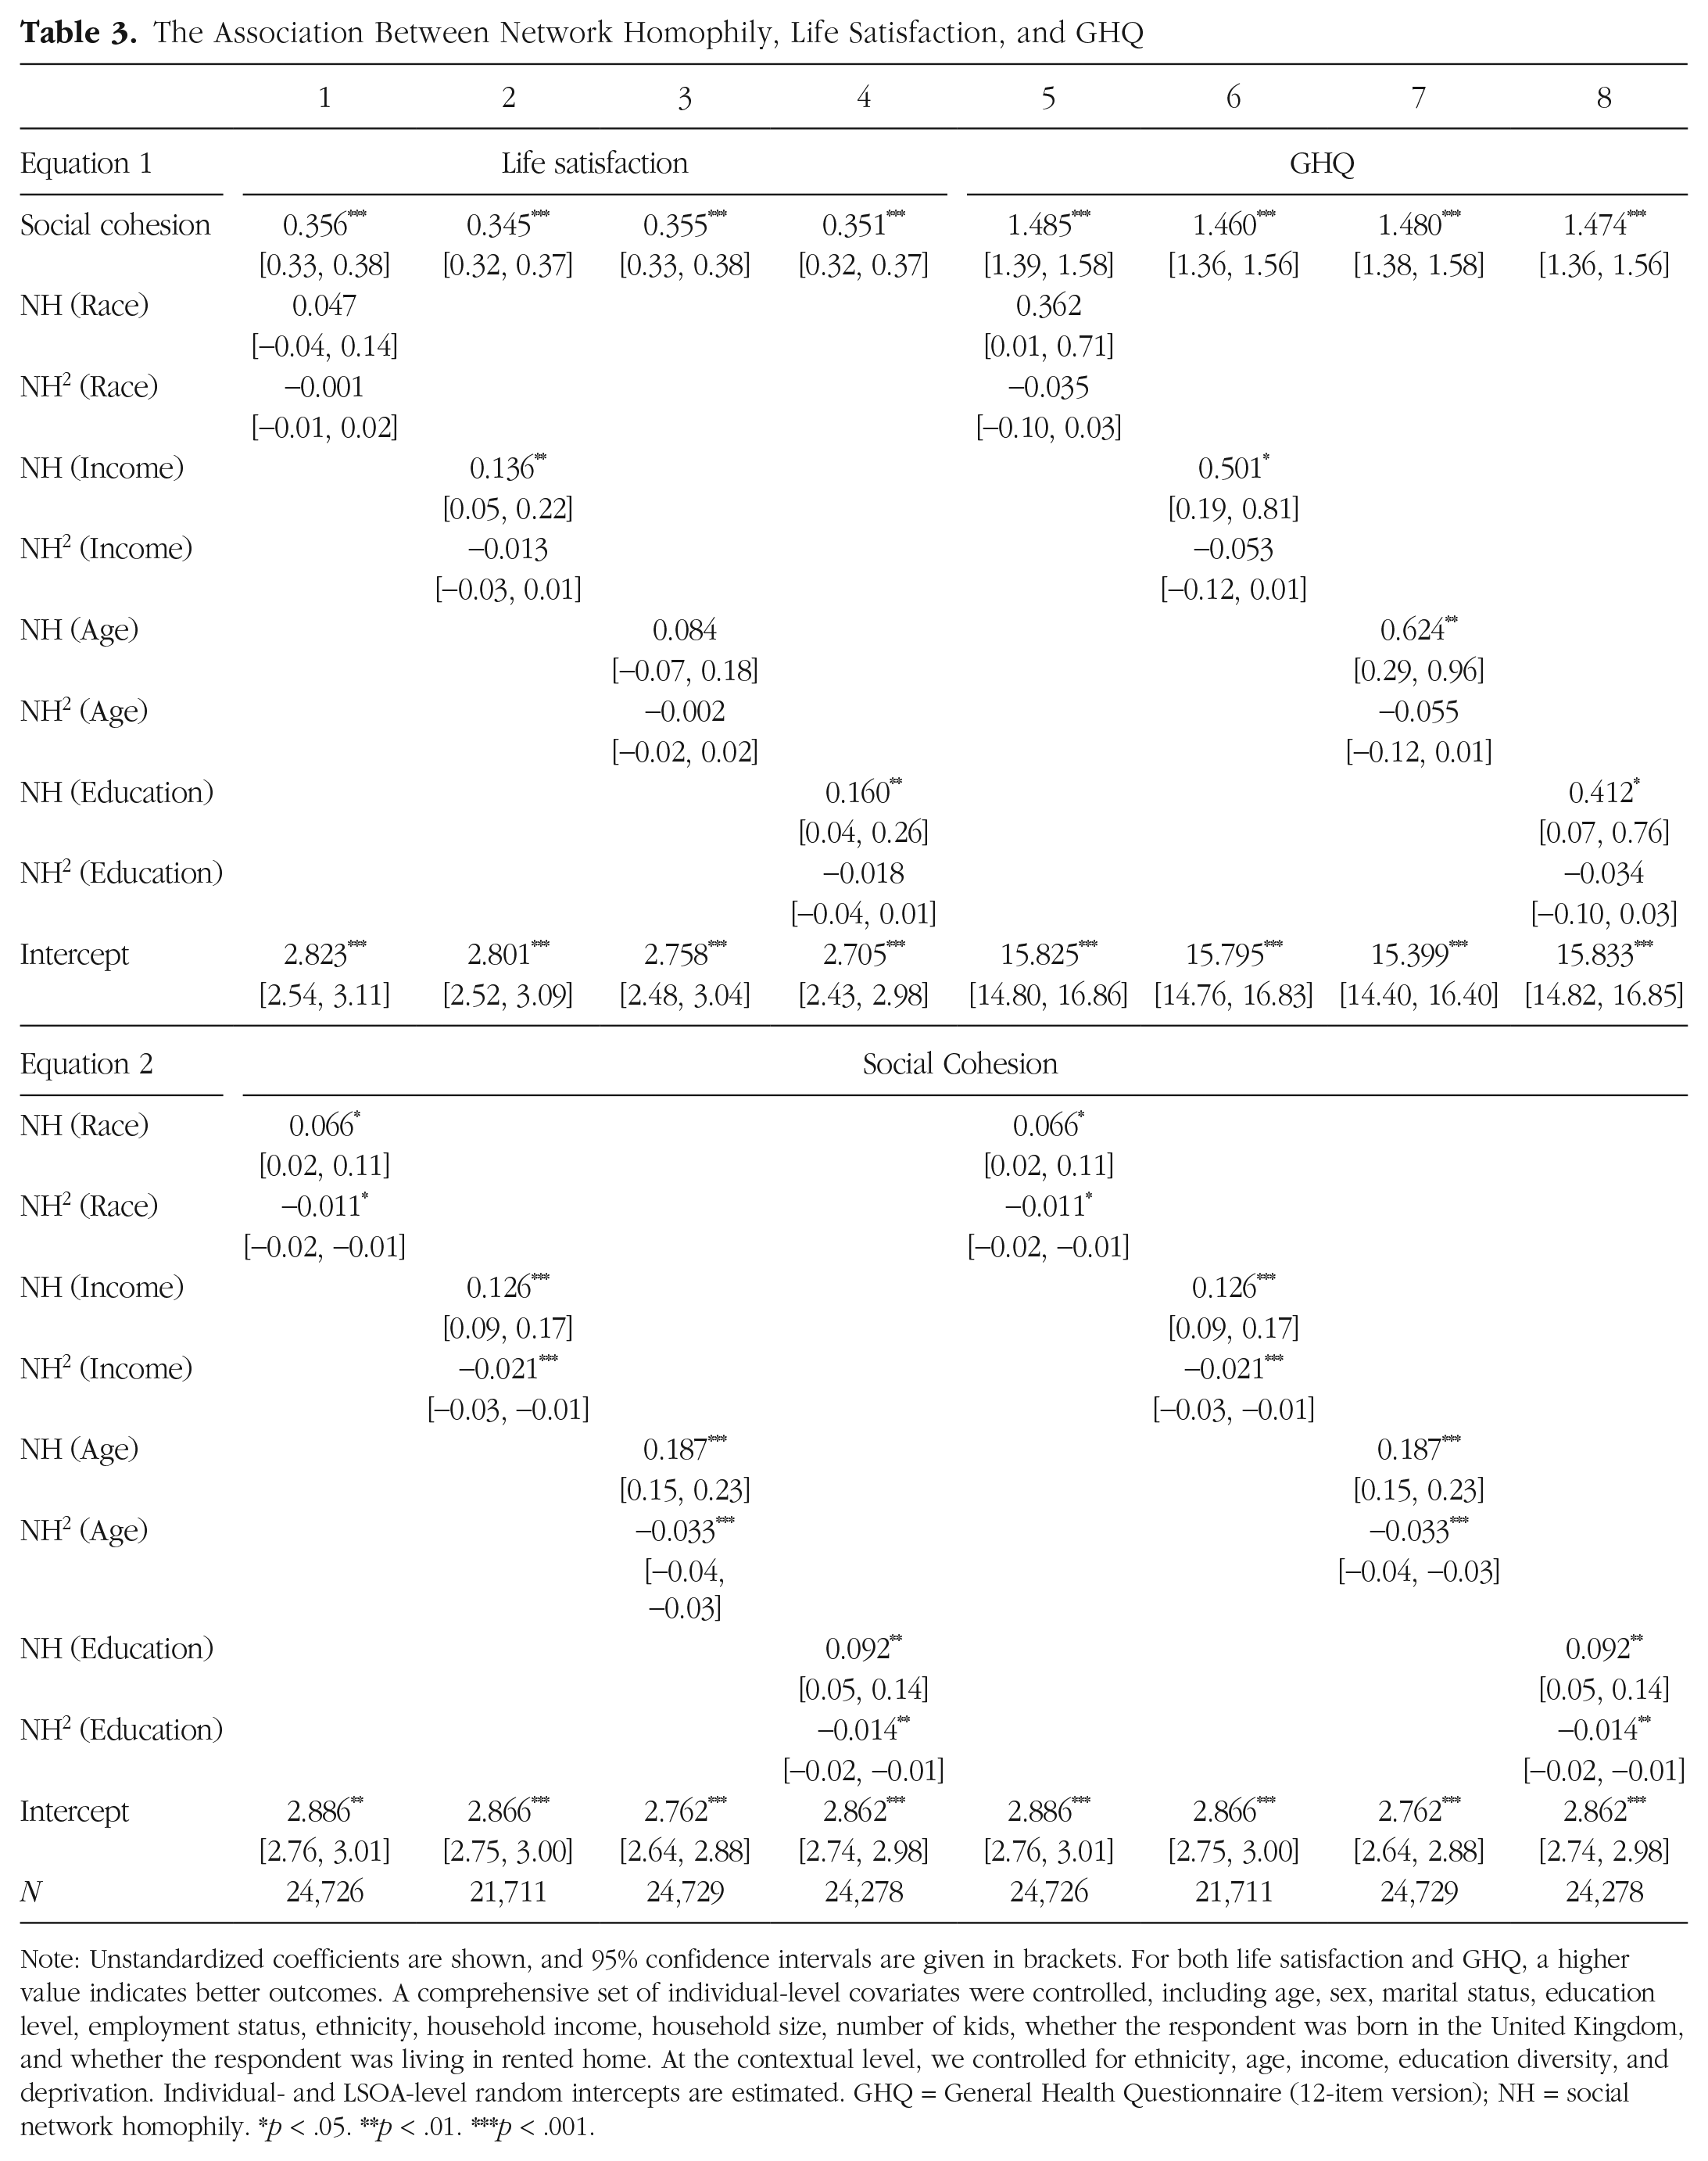
Note: Unstandardized coefficients are shown, and 95% confidence intervals are given in brackets. For both life satisfaction and GHQ, a higher value indicates better outcomes. A comprehensive set of individual-level covariates were controlled, including age, sex, marital status, education level, employment status, ethnicity, household income, household size, number of kids, whether the respondent was born in the United Kingdom, and whether the respondent was living in rented home. At the contextual level, we controlled for ethnicity, age, income, education diversity, and deprivation. Individual- and LSOA-level random intercepts are estimated. GHQ = General Health Questionnaire (12-item version); NH = social network homophily. *p < .05. **p < .01. ***p < .001.
The Indirect Effect of Network Homophily on Life Satisfaction and GHQ via Social Cohesion
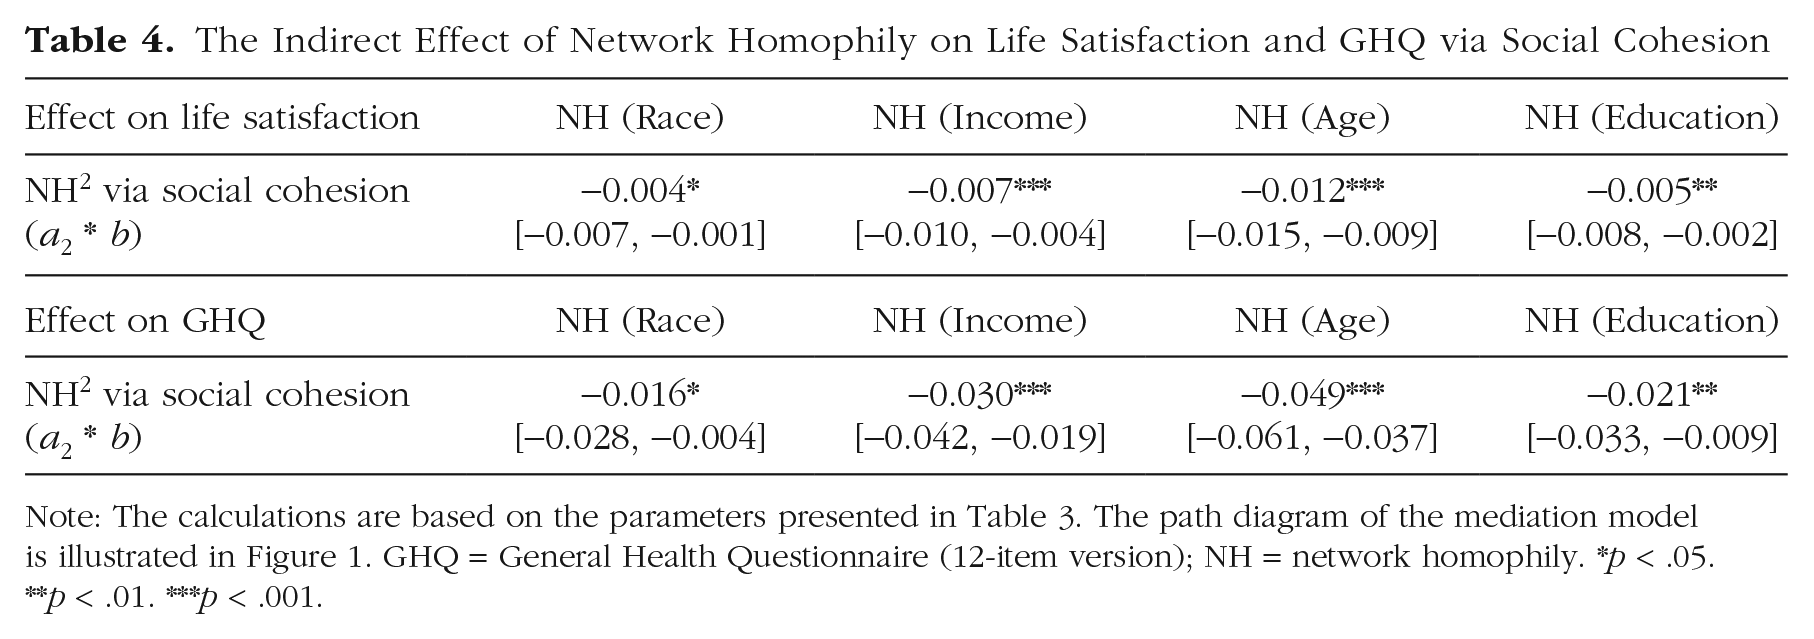
Note: The calculations are based on the parameters presented in Table 3. The path diagram of the mediation model is illustrated in Figure 1. GHQ = General Health Questionnaire (12-item version); NH = network homophily.
p < .05. **p < .01. ***p < .001.
Importantly, there was a statistically significant inverted U-shaped relationship between network homophily and the mediator, social cohesion (see Table 3, Equation 2). Regardless of the type of network homophily, the quadratic term was consistently negative and significant in Equation 2—β = −0.01, p = .027, 95% CI = [−0.02, −0.01] for network homophily in terms of race; β = −0.02, p < .001, 95% CI = [−0.03, −0.01] for network homophily in terms of income; β = −0.03, p < .001, 95% CI = [−0.04, −0.03] for network homophily in terms of age; and β = −0.01, p = .004, 95% CI = [−0.02, −0.01] for network homophily in terms of education. These estimates confirm the necessary condition for U-shaped relationships (Lind & Mehlum, 2010), and further calculations indicated that the turning point of the fitted quadratic function (Fig. 2) falls at the right-hand side of the maximum value of network homophily, yielding the sufficient condition. These results support the predicted inverted U-shaped association between network homophily and social cohesion. To replicate these results across methods, we tested the inverted U-shaped relationship with an additional method. According to Simonsohn (2018), instead of using a quadratic regression coefficient, in some cases it is preferable to estimate two regression lines, one for low and another for high levels of the predictor (i.e., network homophily). We used the R code provided by Simonsohn and performed the recommended analysis, yielding similar results, thus providing further support for an inverted U-shaped relationship (for detailed results of this analysis, see Figs. S1–S12 in the Supplemental Material).
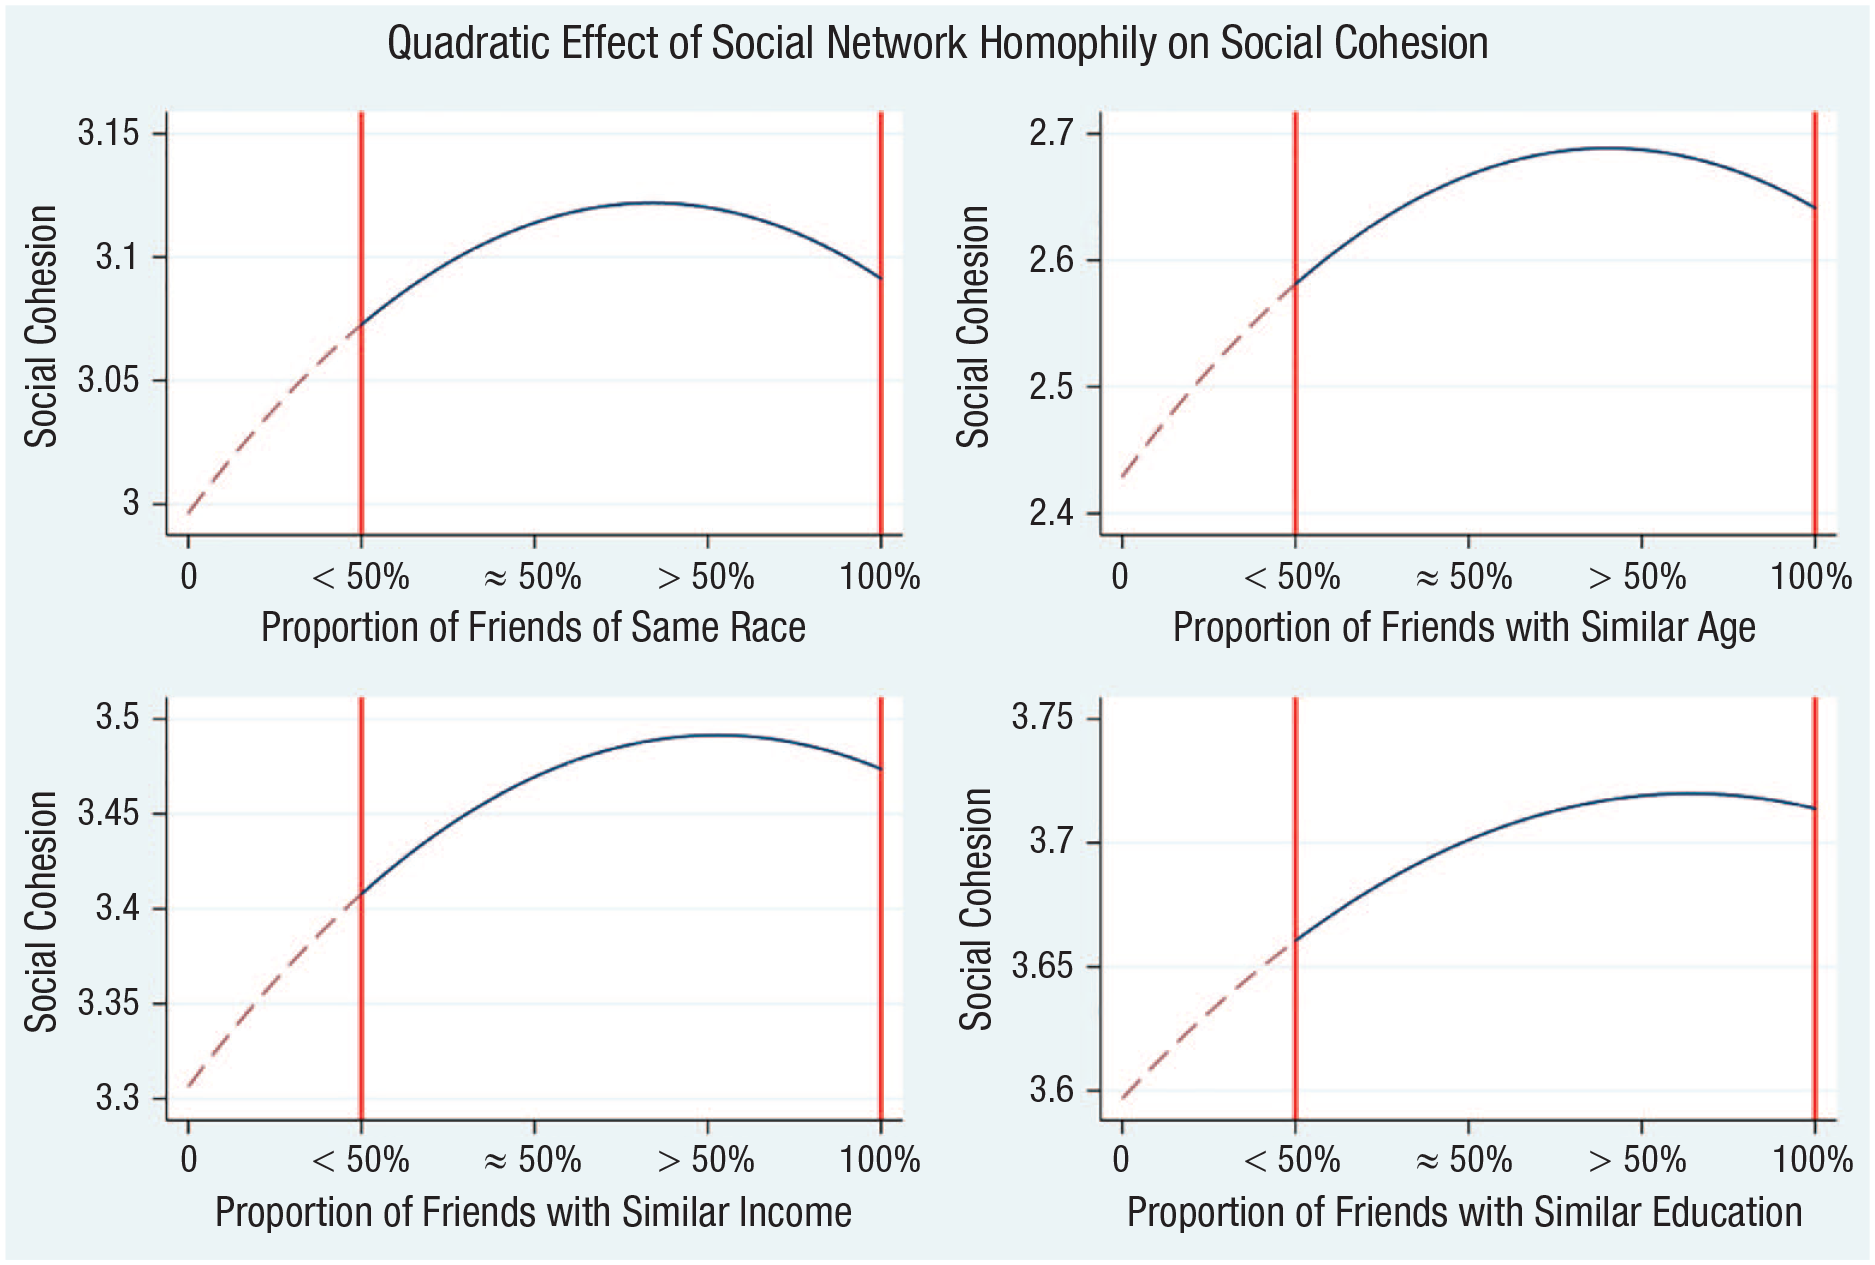
The inverted U-shaped relationship between network homophily and social cohesion. The solid blue line depicts the inverted U-shaped relationship between network homophily and social cohesion based on estimating the first model, and the dashed red curve denotes the fitted values of social cohesion outside the possible values of social cohesion in our data. A higher value indicates a higher level of social cohesion. Network homophily is measured on a 4-point scale. The values between the vertical red lines (included) indicate the possible values of network homophily in our data.
Of importance, our results showed that both linear and quadratic coefficients of network homophily predicting social cohesion are statistically significant. Although the linear effects may appear stronger in Table 3, these results are not comparable because they are unstandardized coefficients. A comparison between coefficients can only be made with the standardized coefficients presented in Table S13 in the Supplemental Material, which show identical linear and quadratic coefficients in terms of their magnitude. However, to further understand the significance of these results, it is important to examine the precise shape of the inverted U-curves. In Figure 2 we can see that it is possible to also fit a linear regression line to that data, starting at the lowest value of in-group friends and its associated value of social cohesion and ending at the highest value of in-group friends and its associated value of social cohesion. Although there is some linearity in the data, our multiple tests show that the curvilinear relationship better describes the data. This is because the curvilinear relationship identifies the increase in social cohesion that is present in the linear relationship while providing additional information regarding what happens at higher levels of homophily. That is, after a certain point around the middle of the scale, levels of social cohesion decrease.
The decrease in levels of social cohesion appears to happen at the midpoint of the homophily measures. When respondents reported having less than half their friends of the same race or of similar income, age, or education, their corresponding social-cohesion scores were at the lowest level; the social-cohesion score increased with an increase in the proportion of same-group friends before reaching the turning point. Social cohesion reached its peak at 3.12 for homophily in race, at 3.48 for income, at 2.78 for age, and at 3.72 for education (see Fig. 2). Note that the social-cohesion measure ranged from 1 to 5 with a mean of 3.5; consequently, the four turning points obtained were roughly aligned with the midpoint of the scale and the mean in our sample. After the turning point, social-cohesion scores started to decrease with an increase in the proportion of same-group friends. This pattern was consistent across all four types of network homophily. As social cohesion was highly positively associated with SWB, network homophily was associated with SWB through its relationship with social cohesion. To be specific, there were nonlinear indirect effects of homophily on SWB via social cohesion. Table 4 shows the indirect-effects analysis with the respective statistically significant indirect effects across the four homophily networks. These results indicate that SWB, measured by both life satisfaction and the GHQ health index, first increases with network homophily and then decreases with further increases in homophily beyond the turning point, as presented in Figure 2. To test the robustness of our findings, we replicated the analyses above with Wave 6 and a pooled OLS regression method that included both waves. All results were consistent with those reported above (see Tables S5–S8 in the Supplemental Material).
Alternative plausible explanations
To examine alternative plausible explanations, we used the SEM framework for model comparison. This framework is a data-driven approach that cannot be used to fully demonstrate causality, but it provides a suggestion of the most plausible causal direction. We relied on the Akaike criterion (AIC) and the Bayesian information criterion (BIC), as these are considered two of the best for the comparison of nonnested multilevel models (Dimova et al., 2011). We tested an initial model positing that the association between SWB and homophily networks is driven by SWB. Note that our homophily-network variable assesses the composition of people’s networks (i.e., the proportion of in-group and out-group friends), and there are no plausible, convincing theoretical reasons to predict that the direction of association is from SWB to network composition, but we nonetheless tested for this possibility. However, it does appear plausible that the association between social cohesion and network homophily is driven by social cohesion (e.g., that higher levels of social cohesion might create more opportunities for both in-group and out-group interactions). To represent this plausible causal ordering, we estimated two other models testing the following mediation sequences (social cohesion → network homophily → SWB, and social cohesion → SWB → network homophily). We estimated each causal explanation across the four examined networks (i.e., race, age, income, education) and the two SWB outcomes (life satisfaction and GHQ). The AIC and BIC values are reported in Tables S9, S10, and S11 in the Supplemental Material. All alternative models (48 in total) revealed worse fit in both AIC and BIC, compared to our main models, lending support to our preferred causal explanation.
Results for the subgroups
We also conducted a set of subgroup analyses to assess whether the results differed depending on the subgroup considered: race (White vs. non-White), age (below vs. above 65 years old), income (above- vs. below-median income), education (degree holders vs. non–degree holders). Additionally, we tested for differences between residents living in more diverse or less diverse areas (i.e., higher or lower than the cross-national median). We found that the inverted U-shaped relationship between ethnic homophily and social cohesion was consistent across all groups (for full results and details, see Table S12 in the online Appendix). In line with our main analysis, we also found a consistent association between social cohesion and our SWB outcomes across all groups.
Effect size of main findings
Given that the use of standardized regression slopes may lead to statistical bias (Greenland et al., 1991), we reported unstandardized coefficients in all our analyses. However, to allow for the interpretation of effect size, we report standardized regression coefficients of our main model in the Supplemental Material (see Table S13). The interpretation of the effect size of a quadratic term is challenging because it is a transformation of the linear coefficient—that is, the linear and quadratic terms are estimated together in the same model. The correlation between the two terms is very strong, and the amount of variance explained in the outcome variable is shared between both. Therefore, the effect of a quadratic term should be lower than other coefficients. Despite these considerations, Table S13 in the Supplemental Material shows an effect size of the quadratic term of network homophily on social cohesion that ranges from −.08 to −.24 (depending on the model). This value is higher than those of key demographic variables such as ethnicity, education, gender, income, and marital and employment status. The second path of the indirect effect (i.e., social cohesion on SWB) showed an effect size between .12 and .19. In our models, this is the second-highest effect size among a wide range of variables strongly linked to SWB. Note that because of the complex nature of SWB, effects on SWB are not particularly strong; to put these numbers into perspective, meta-analytic work examining the effects of social relationships on self-esteem reported an effect size of .08 (Harris & Orth, 2020).
Discussion
The principle of homophily guides all forms of social relationships (McPherson et al., 2001). Humans have a preference for interacting with similar others, and social networks are invariably homophilic to some extent. In contrast, heterophily, the tendency for people to be attracted to those who are different, is also observed in humans. Both homophily and heterophily have positive implications for individuals’ SWB, because homophily should reinforce bonding social capital, whereas heterophily creates new ties across groups, which is typical of bridging social capital. At the extremes, however, negative outcomes can occur because high levels of homophily may deepen divisions across society (e.g., polarization, extreme patriotism or nationalism), and high levels of heterophily can weaken in-group support.
In line with theories and empirical evidence (e.g., Haslam et al., 2009), we hypothesized a direct effect of network homophily on SWB and a parallel effect qualified by an inverted U-shaped relationship between individuals’ network homophily and SWB, one that is mediated by their perceived neighborhood social cohesion. Using data taken from Understanding Society (the UKHLS) containing around 20,000 English respondents from 10,000 neighborhoods (in Wave 3), we analyzed a mediation model using and SEM framework. We found a direct and positive association of network homophily with SWB for three of the four types of networks examined (age, education, and income; homophily based on race was an exception that we discuss below). This finding is consistent with research arguing that in-groups are critical sources of support (Jetten et al., 2014) and the principle that homophily brings a sense of security and stability to people (McPherson et al., 2001). However, a parallel indirect effect showed that network homophily is positively associated with social cohesion, but that at higher levels the association reverses, with homophily being negatively associated with social cohesion. An inspection of the indirect effect (i.e., network homophily on SWB via social cohesion) yields the same negative quadratic effect, providing support for our argument that too much homophily may hinder social cohesion and, in turn, SWB. These findings support the idea that heterogenous social networks are critical for bridging social capital (Putnam, 2000). These networks help break down divisions between groups while serving as a meaningful form of intergroup contact—a key determinant of positive intergroup relations (Pettigrew & Tropp, 2006). Our findings are more generally aligned with the idea that diversity, broadly conceived, can have a positive impact on SWB, because of the increased opportunities for intesrgroup contact (Ramos et al., 2019).
Findings concerning the indirect effect are robust to different models and methodological approaches. These findings are also robust across two different measures of SWB, one tapping a more stable component of well-being (life satisfaction), and one based on present feelings (the GHQ). Despite these differences, we reported comparable results of social cohesion and network homophily for both SWB indicators. Furthermore, we examined four types of network homophily that, despite representing different intergroup relationships (e.g., in terms of power or type of contact) yielded the same results for this indirect effect. Our subgroup analysis also showed similar results across minority and majority groups, suggesting that the processes in our study may be generalizable across different status groups, being tied to human and universal characteristics such as those of homophily and heterophily.
Despite the above-mentioned consistencies, there was a notable exception. In contrast to the consistent indirect effect found across all four types of network homophily, the direct effect of network homophily in terms of race on SWB was different from those of the other three networks (see Table 3). The direct effect was nonsignificant, suggesting that for racial networks, the role of social cohesion as shown by the indirect effect is even more critical, given that there is no compensation from the positive direct effects of homophily on SWB. The explanation for this difference might be related to specific characteristics of these four categories. For example, education and income are generally perceived to be achieved by a certain point in life, and one’s age changes throughout the life course, but race is fixed and ascribed. Further, some scholars argue that within-country racial and ethnic divisions are key determinants of social conflict (Esteban et al., 2012). Indeed, it is argued that race is one of the most important forms of social divide (Smith et al., 2014). Moreover, intergroup contact with people who differ in terms of education, age, and income is common in family relationships, but unless the family in question is mixed race, familial intergroup contact across racial lines is not a possibility. Consequently, homophily based on race may create social barriers that are more difficult to overcome. Perhaps because of all these powerful societal implications of homophily based on race, its negative association with social cohesion has a dominating role and undermines the possibility of a positive direct effect of homophily on SWB. This is consistent with the idea of full mediation. Our results for the other three networks showed significant direct and indirect paths, suggesting that our mediation model is not fully explaining the direct path and that additional mechanisms might be operating at the same time. Yet with homophily based on race the direct path was nonsignificant, suggesting that the associations between homophily and SWB were fully explained by perceived social cohesion.
Our study is not without limitations. First, the study relies mostly on self-reported data, and some of our findings might be explained by other variables. However, friendship is a purely subjective experience, and this limitation cannot be easily overcome in a future study. To address this concern, we controlled for multiple relevant variables, tested the same hypothesis across networks and methodological approaches, and included objective data when possible (e.g., our neighborhood ethnic-diversity measure, which was calculated from census data). Second, our analysis was limited to a cross-sectional approach because the variation in respondents’ proportion of friends across waves was too small and did not allow us to examine change across waves in a panel analysis. Last, the study was based on data from English neighborhoods, and further work in other countries is needed to increase our confidence in generalizing our results to other contexts.
On balance, our results demonstrate some of the benefits of interacting with out-group members. Having heterogeneous rather than homogeneous social networks is associated with the highest levels of social cohesion, which is a key source of SWB, and provides empirical evidence that people from different groups—regardless of age, income, race, and other characteristics—can benefit from living in harmony together. We argue that this balance is optimal because it manifests a human tendency both for contact with people who are like us as well as others who might be different in certain ways. Our findings contradict populist narratives promoting the exclusion of out-groups and suggest a need to rethink the nature of human societies. We should thus aim to make contemporary societies more inclusive so that all individuals have ample opportunities to establish networks that include both in-group and out-group members. For this goal to be achieved, we should aim to construct more inclusive physical spaces that attract people with diverse backgrounds. Our study contributes to a plethora of evidence highlighting the need for more structural measures aimed at reducing segregation, bias, and prejudice (e.g., working to create more diverse schools and more housing options within mixed neighborhoods). Social inequalities should also be reduced so that individuals from different groups can share more common experiences and some groups are not priced out of potentially shared spaces. Finally, we need better political leadership. All too often leaders promote social divisions to gain political advantage, a tactic that fails to realize the true nature and capacity of human beings.
Supplemental Material
sj-docx-1-pss-10.1177_09567976241243370 – Supplemental material for Variety Is the Spice of Life: Diverse Social Networks Are Associated With Social Cohesion and Well-Being
Supplemental material, sj-docx-1-pss-10.1177_09567976241243370 for Variety Is the Spice of Life: Diverse Social Networks Are Associated With Social Cohesion and Well-Being by Miguel R. Ramos, Danying Li, Matthew R. Bennett, Unaysah Mogra, Douglas S. Massey and Miles Hewstone in Psychological Science
Footnotes
Acknowledgements
The authors would like to thank Paul Norman and his NewETHPOP project colleagues for providing invaluable data on projecting ethnic populations in England between 2001 and 2011. UKHLS is an initiative funded by the Economic and Social Research Council and various government departments, with scientific leadership by the Institute for Social and Economic Research. The research data are distributed by the UK Data Service.
Transparency
Action Editor: Lasana Harris
Editor: Patricia J. Bauer
Author Contributions
Notes
References
Supplementary Material
Please find the following supplemental material available below.
For Open Access articles published under a Creative Commons License, all supplemental material carries the same license as the article it is associated with.
For non-Open Access articles published, all supplemental material carries a non-exclusive license, and permission requests for re-use of supplemental material or any part of supplemental material shall be sent directly to the copyright owner as specified in the copyright notice associated with the article.