
Abstract
Executive functioning (EF) has been shown to relate to academic achievement and well-being. Independent bodies of work have aimed to understand what environmental or personal attributes influence EF ability. However, most research has not considered how constellations of risk factors create distinct patterns of influence on EF ability. The current study tested a sample of children aged 9 to 10 years from the United States (N = 10,323, 48.06% female, Mage = 9.9 years, age range = 8.9–11.08 years) using a latent profile analysis (LPA) to detect subgroups that varied in their combinations of various risk factors. Six distinct groups of risk factors for children emerged, which in turn related to different average EF abilities. We found that family socioeconomic measures related to a subgroup having above- or below-average EF ability, but we also found an effect on EF across different risk factors. These results inform our understanding of individual variations in EF ability and highlight the idea that EF interventions should consider risk holistically.
Introduction
The term executive function (EF) encompasses a set of cognitive skills that support goal-directed behaviors; EF has been shown to relate to many important aspects of one’s well-being, such as academic and economic success (e.g., Luo & Waite, 2005; Cortes Pascual et al., 2019). Given the importance of EF on many critical life outcomes, much research has aimed to understand and identify risk factors related to individual differences in EF ability. Previous literature has explored the impact of individual aspects of mental health, physical health, family socioeconomic disadvantage, or different environments on EF ability throughout development and has generally found that having higher levels of the particular risk factor of interest is related to worse EF ability. For example, lower parental education levels and lower family household income, both proxies for family socioeconomic disadvantage, have been associated with lower average EF abilities in childhood (Ardila et al., 2005; Blums et al., 2017; Hackman et al., 2015; Jacobsen et at., 2014; Last et al., 2018; Lawson et al., 2018; Rochette & Bernier, 2014). More internalizing and externalizing mental-health burdens and poorer physical health are also associated with worse average EF abilities in childhood (Gordon & Hinshaw, 2019; Groppe & Elsner, 2015; Halse et al., 2022; Holler et al., 2014; Lambek et al., 2011; Otterman et al., 2019; Reinert et al., 2013; Turnbull et al., 2013; Williams et al., 2017; Wood et al., 2019). Lower quality environments, both in the home (proximal environment) and in the neighborhood, the school, or the broader community (distal environment) are also associated with worse average EF abilities in childhood (Altenburger & Schoppe-Sullivan, 2021; Bagby et al., 2012; Fay-Stammbach et al., 2014; Korucu et al., 2020; Piccolo et al., 2019; Valcan et al., 2018; Vernon-Feagans et al., 2016; Weiland et al., 2013).
Although prior work has explored the association between a single or select set of risk factors on EF ability, in naturalistic settings it is rare to have one risk factor affect a child’s life in isolation of other issues. For instance, research has shown a positive relation between mental and physical health across development (e.g., Biddle & Asare, 2011), a positive relation between mental health and one’s family environment (Dwairy & Menshar, 2006; Eun et al., 2018; Vahedi et al., 2019), and a positive association between family socioeconomic status (SES) and youth mental health (Barnhart et al., 2022).
Previous studies on the joint impact of several risk factors on EF ability typically have taken variable-centered approaches, which may oversimplify the complex interplay between EF ability and these multiple influences. For example, some researchers have found that family functioning, parenting style, and parental stress mediated the relation between SES and EF ability (e.g., Hackman et al., 2015; Ursache et al., 2015; Vrantsidis et al., 2020). Distal environmental risk factors, such as neighborhood chaos, have also been shown to moderate the relation between EF ability and SES (St. John & Tarullo, 2020). This prior research highlights that more accurate variation in EF ability can be captured when several risk factors are assessed together. Tests with person-centered methods could reveal how risk factors interrelate and dynamically function within individuals.
The current study applied a latent-variable approach to test how a combination of risk factors, commonly thought to relate individually to EF ability, might combine to uniquely relate to EF ability in late childhood. Specifically, a latent profile analysis (LPA; Collins & Lanza, 2009; Wang & Hanges, 2011) was applied; LPA assumes that people can be typed with varying degrees of probabilities into categories, or subgroups, that have different configural profiles of personal or environmental attributes (Collins & Lanza, 2009; Howard & Hoffman, 2018).
Given the need for large sample sizes to answer our research question, we leveraged the Adolescent Brain Cognitive Development (ABCD) baseline data set, which is composed of 11,876 individuals between 9 and 11 years of age. We created composite scores from multiple ABCD survey measures that reflect six broad risk factors of interest implicated in the extant literature. Because these six broad risk factors are naturally highly interrelated in the United States, and because we specifically aimed to detangle their relative influence on EF, we derived theory-driven constructs from the surveys, rather than using a data-driven approach that merged across these related factors. The risk factors included in the current study were (a) distal environment risk factors (i.e., school and neighborhood), (b) proximal environment risk factors (i.e., family dynamics), (c) difficulties with internalizing mental-health struggles, (d) difficulties with externalizing mental-health struggles, (e) family socioeconomic disadvantages, and (f) physical-health risk factors. We applied LPA to our composite risk factors and then compared EF ability across the resulting profiles. We also characterized the profiles that emerged from LPA in terms of their child-sample composition to gain a better understanding of who made up the different clusters, as that might aid future interventions on EF ability.
Statement of Relevance
Executive function (EF) refers to a set of cognitive skills that support goal-directed behaviors, and one’s EF ability in childhood can influence important life outcomes, such as health across the life span. In a large sample of children, we examined how different exposures to multiple risk factors are related to EF. We found that socioeconomic status (SES) had a dominant association with EF ability in childhood: Those from lower socioeconomic backgrounds had worse average EF. However, other risk factors, such as mental health and pubertal development, were also related to differences in EF. There was a compounding effect across the accumulation of different risks: Participants with high levels of impact across multiple risk factors had worse EF. Thus, although targeting socioeconomic disparities could have a substantial impact on cognitive development, there are several risk factors to consider when optimizing outcomes. Individualizing interventions to match a child’s unique set of risk factors could be the most influential approach to improving EF in childhood.
We were particularly interested in how the pubertal stage might differ across risk profiles, because previous work has shown that the timing and rate of puberty has consequences for the development of cognitive skills (e.g., Chaku & Hoyt, 2019; Koerselman & Pekkarinen, 2018; Laube & Fuhrmann, 2020). Interestingly, evidence on the relationship between puberty and cognitive abilities is mixed; some research has suggested that there are only weak associations between puberty and cognitive-trait differences and that pubertal development explains little of the variance in psychiatric and behavioral outcomes (e.g., Smith-Woolley et al., 2017). Given the conflicting evidence in the field, it is pertinent to examine how pubertal stages might differ across unique profiles of children, especially in a large, well-characterized developmental sample.
Considering the consistent literature findings linking each of our composite risk factors of interest to EF development, we hypothesized that individuals with either high or low risk scores across all six risk factors (cumulative burden) would have the lowest or highest overall EF ability, respectively. However, most people do not exist at the extreme ends of the risk spectrum. We did not hypothesize how profiles with more moderate levels of burden, or with a burden across only a few factors, would be affected in EF abilities, and learning more about these potential profiles motivated our study. Here, we provide unique insight into possible sources of variation in EF ability for individuals who are not uniformly affected across all risk factors. Ultimately, this work could bring us one step closer to identifying what factor, or combination of risk factors, might be most relevant to target when designing intervention or prevention programs to improve EF ability.
Open Practices Statement
None of the analyses in the current study were preregistered. The data for the current study is from a publicly available data set, so study materials from the ABCD protocol are available on the NIMH Data Archive Data Dictionary. The ABCD data repository grows and changes over time; the ABCD data used in this report came from NIMH Data Archive Digital Object Identifier 1523041. The scripts used to analyze the ABCD data set will be made available upon request.
Method
Participants
The current project leveraged baseline (initial wave) data from the NIH’s ABCD Study from 11,876 children aged 9 to 11 years old. The data were collected across 22 sites (ABCD Data Release 4.0; Volkow et al., 2018). These data were accessed from the National Institutes of Mental Health Data Archive via a Data User Agreement, and comply with the ethical standards of relevant national and institutional committees on human experimentation. Given that the data were from an existing data set, the goal was to include as many participants as possible while still requiring a certain amount of data per participant. Participants were excluded from the sample on the basis of data incompleteness (n = 1,553, Mage = 9.9 years, age range = 8.9–11 years, SD = 0.62 years, 46.23% female), leaving us with a total of 10,323 children (Mage = 9.9 years, age range = 8.9–11.08 years, SD = 0.62 years, 48.06% female; see Table 1 for further sample demographics). See the Measures section for the specific exclusion criteria. Because the data in the current study includes secondary use of a deidentified data set, the Institutional Review Board (IRB) at the University of Texas at Austin determined that review and approval by the organization was not required.
Detailed Breakdown of the Racial Identity of Participants in the Sample by Count and Percentage of Overall Sample
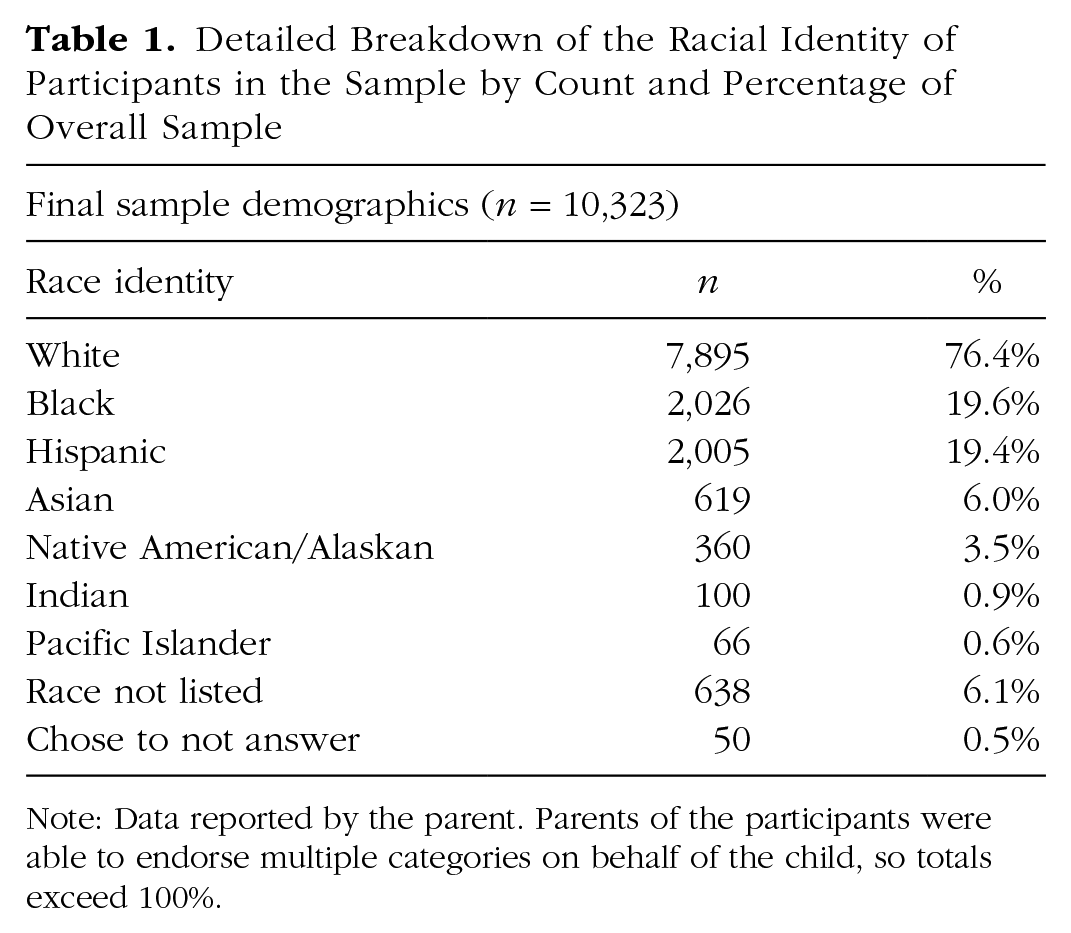
Note: Data reported by the parent. Parents of the participants were able to endorse multiple categories on behalf of the child, so totals exceed 100%.
Measures
Latent profile analysis measures
The ABCD study aimed to characterize precursors to addictive behaviors from preadolescence to young adulthood (Garavan et al., 2018). Consequently, a robust number of survey and demographic measures were collected that tap into multiple different psychological, physiological, and environmental constructs. To first reduce the dimensionality of this rich data, we combined data in a theory-driven manner across independent measures that are conceptually related, in order to create larger summary items or putative risk factors (see Table 2). The selection of the risk factors was driven by two main considerations: (a) The factor must have meaningful theoretical or empirical work related to EF ability, and (b) there must be sufficient data within the ABCD study to speak to a given factor.
Brief Description of Survey Measures (From Child and Parent) and Theoretical Constructs
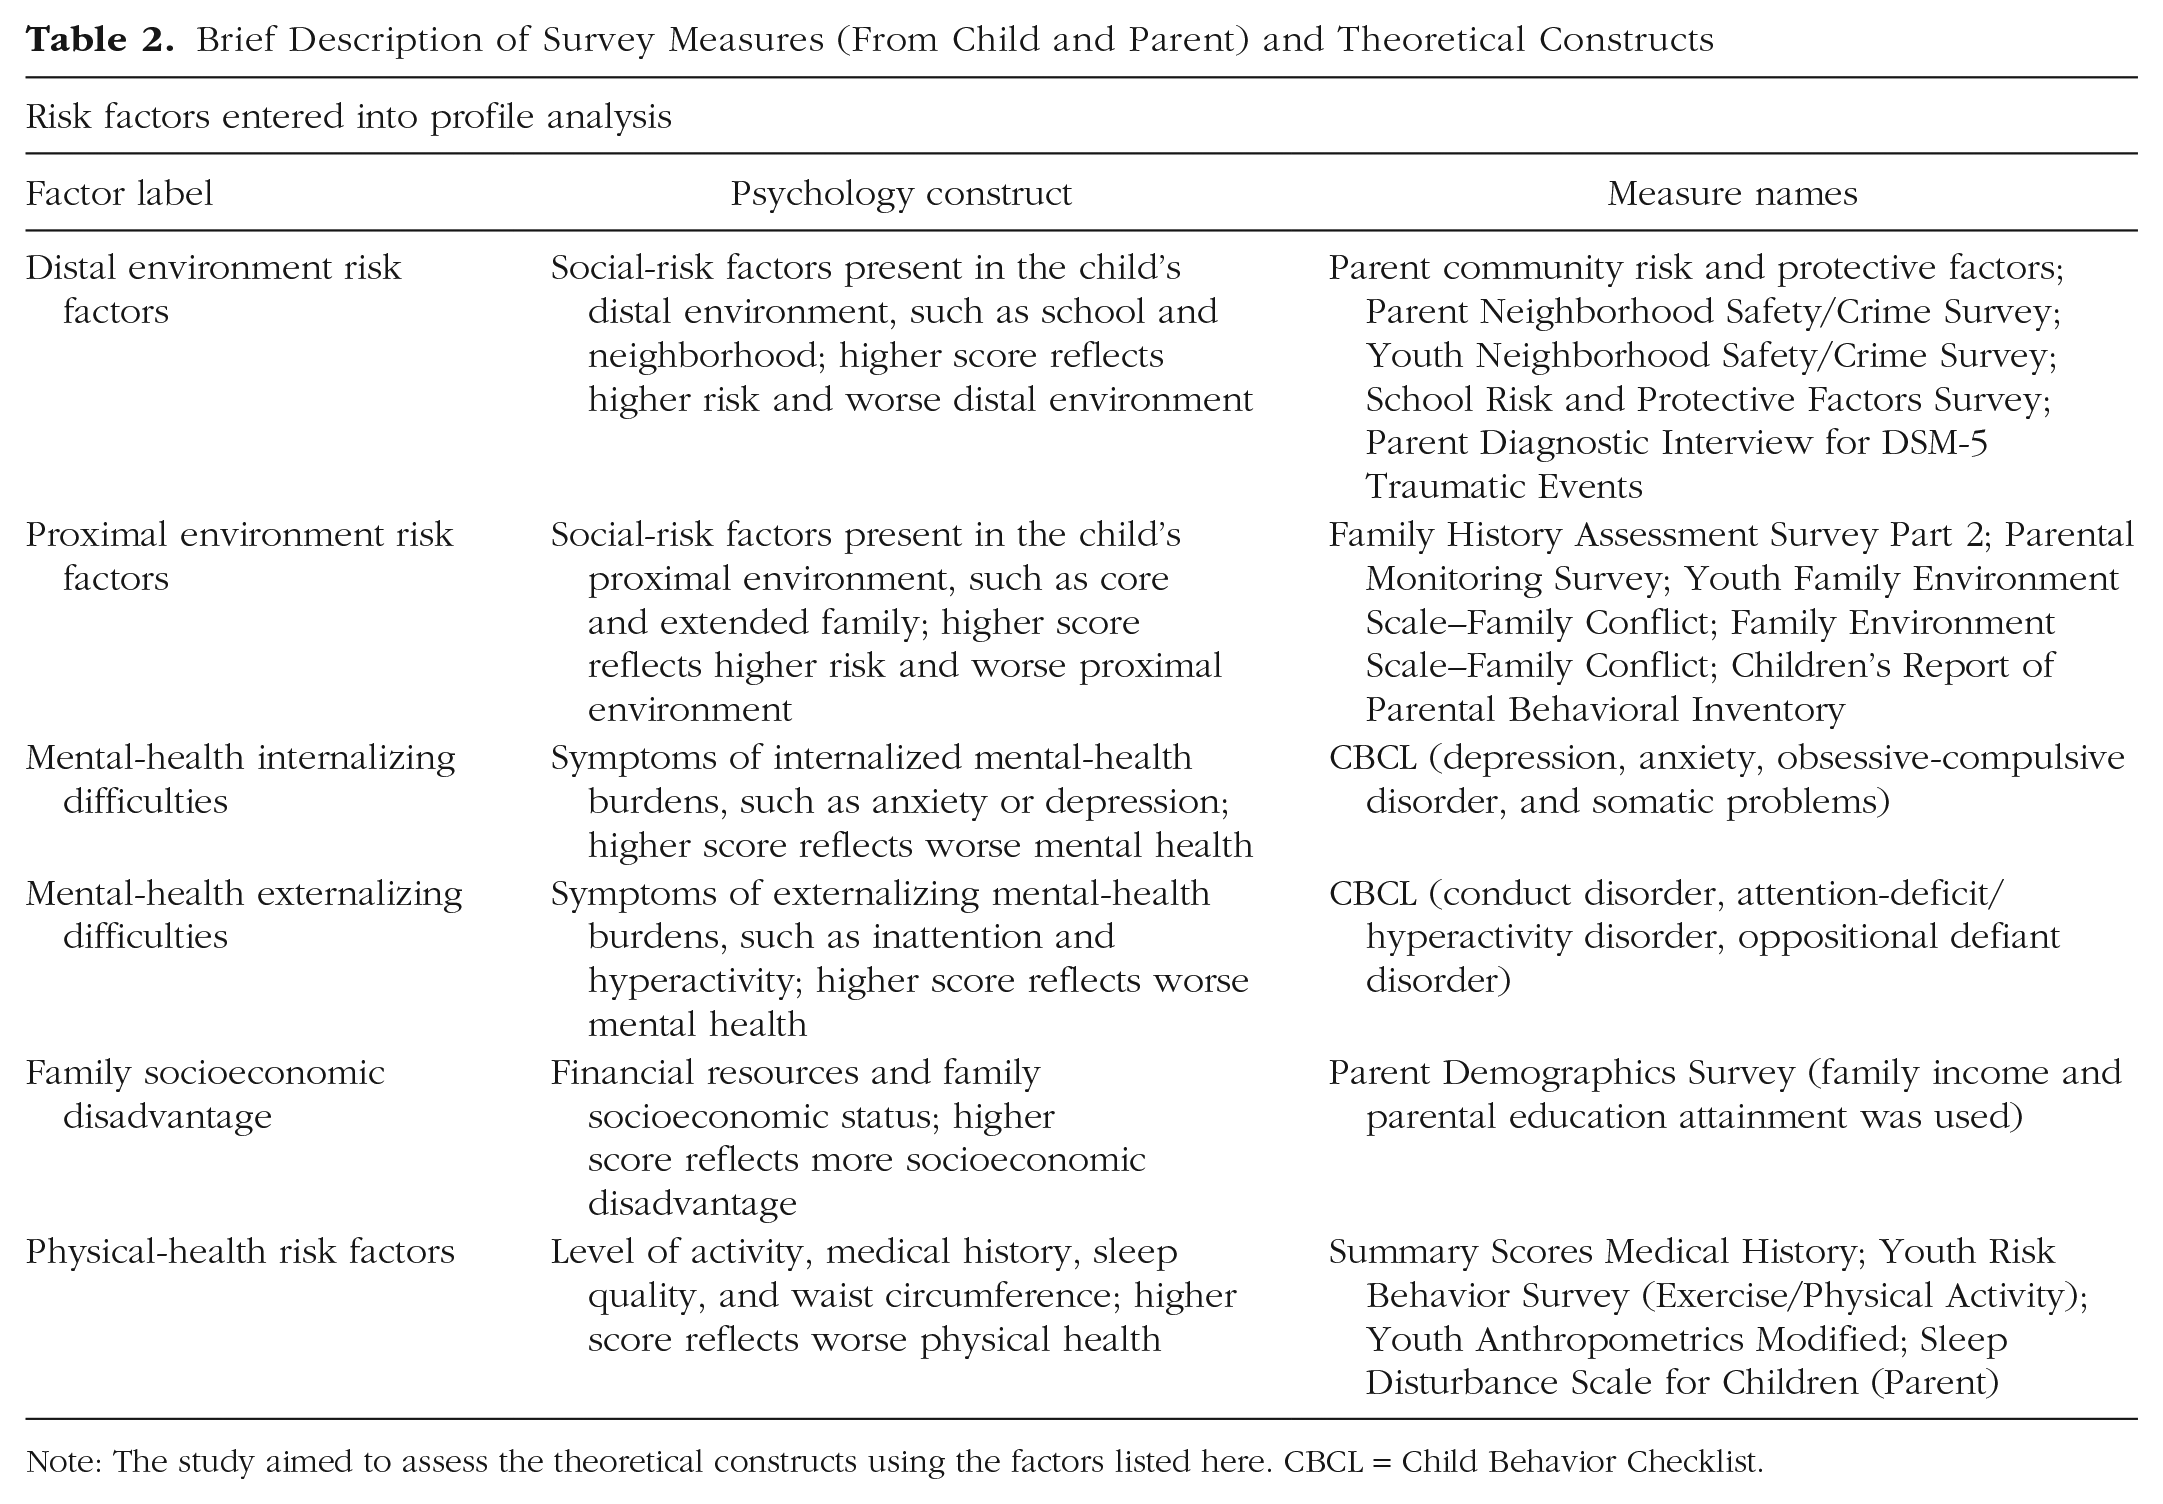
Note: The study aimed to assess the theoretical constructs using the factors listed here. CBCL = Child Behavior Checklist.
All measures within a given factor were individually z-scored and then averaged to create a single summary measure. To be included in the study, participants needed to have at least 50% of the measures within each factor; otherwise, they were entirely excluded from the analysis. For the family-socioeconomic-disadvantage risk factor, we required participants to have both income data and parent-education data. Consequently, every analyzed participant had seven summary measures—six that were used for our latent profile analysis, and one for executive function (see the next section; see Fig. S1 in the Supplemental Material available online for a correlation matrix of all measures utilized in the LPA). Despite strong theoretical support for the risk factors included in the current analyses, Cronbach’s alpha values for each factor ranged from poor to good (see and Limitations and Future Directions and Fig. S1 in the Supplemental Material). All composite measures were created so that higher scores reflected increased risk level for the child.
Executive function
Participants’ EF was assessed using three behavioral measures collected in the baseline year of the ABCD Study. Specifically, we used data from certain measures from the NIH Toolbox (NIH-Cognition Battery; Hodes et al., 2013)—the Flanker Inhibitory Control and Attention (which assesses both attention and inhibitory-control abilities), List Sorting Working Memory (which assesses working memory abilities), and Dimensional Change Card Sort (which measures switching and cognitive-flexibility abilities).
We included all three measures of EF in our analyses as they represent three theoretically different components of EF abilities (Friedman & Miyake, 2017). We used the uncorrected standard score for each of the EF measures, which compares the performance of the participant to those in the NIH Toolbox’s nationally representative normative sample, regardless of age. All EF measures were individually z-scored and then averaged to create one composite measure of EF ability per participant, with a higher score indicating overall better performance. All three EF measures were required in order for a participant to be included in the final sample.
Puberty, age, and sex
A secondary goal of this study was to assess how the resulting risk-factor profiles qualitatively and quantitatively differed from one another in terms of sample features such as age, reported sex, and pubertal stage. Puberty was quantified using the Pubertal Development Scale (PDS; Petersen et al., 1988), which is a widely used self-report measure of physical development. The PDS measure was completed by a subsample of our participants (n = 8,343). Male and female PDS scores were calculated separately, and on the basis to their responses to the PDS items, participants were put into one of five pubertal categories: prepuberty, early puberty, midpuberty, late puberty, and postpuberty. Participant age was calculated using birthdate and date of visit, and participant sex was reported by caregivers.
Statistical approach
Split-replication analysis
We used an LPA approach to assess the combined impact of our putative common risk factors on EF ability. LPA uses the underlying latent structure of the data to identify patterns across multiple indicators, providing person-centered information about patterns of behavior that can be compared across different outcomes (Berlin et al., 2014). The recommended sample size for LPA is around 500 participants (Spurk et al., 2020). Given that we have a meaningfully larger sample size, we split our sample into two pseudorandom groups (Group A, n = 5,161; Group B, n = 5,162) and performed identical procedures on both to establish the replicability of our profile findings. The groups were randomly divided, but we ensured that demographic variables such as age and sex were similar across the two groups.
First, we evaluated the optimal number of profiles for our data. To do this, we tested nine different class models iteratively in R on the first half of our data (Group A). Each model was run with 1,000 random starts and assumed a normal distribution, with means and variances freely estimated within each model (Vermunt & Magidson, 2002). To evaluate which model most appropriately described the underlying structure of our data, we utilized the log likelihood of a sample-size-adjusted Bayesian information criterion (BIC). After selecting the most appropriate model for the first set of data, we ran an LPA on the second set of data (Group B), forcing it to have the same number of profiles. Importantly, the focus of the replication was around whether clustering patterns would be similar across the two samples.
Whole-group analysis and EF comparisons
If the two independent groups yielded similar results, we planned to combine the two groups to create one large data set and rerun the LPA to include all of our participants at once. We then computed the average EF ability for each profile for each group. Using the whole-group LPA results, we performed an analysis of variance (ANOVA) to evaluate whether there were any significant differences in EF ability across the different profiles, using Tukey’s test for post hoc analyses, which also corrected for multiple comparisons. Then we looked at profiles with statistically significant differences in EF ability to qualitatively assess whether input risk factors differed across the profiles (and if so, which ones). To evaluate whether there were significant quantitative differences in each risk factor across the profiles, we conducted an ANOVA and Tukey’s test for post hoc analyses for each risk factor of interest separately. This resulted in a total of six ANOVAs.
Profile characterization
First, we aimed to examine differences in puberty across the resulting LPA profiles. To do this, we performed an ANOVA to calculate the difference in proportion of each pubertal category (n = 8,343). We conducted a separate ANOVA for each pubertal stage (prepuberty, early puberty, and midpuberty), except that we did not test for differences in late puberty or postpuberty across the profiles because so few participants were in those two pubertal categories (late puberty: n = 192; postpuberty: n = 19). If the result of the ANOVA was statistically significant, we conducted Tukey’s test for post hoc analysis to examine which profiles were significantly different from one another.
Furthermore, we wanted to broadly characterize the makeup of the profiles on the basis of age and sex. To assess age differences, we performed an ANOVA, and if the ANOVA was statistically significant we conducted Tukey’s test for post hoc analysis to examine which profiles were significantly different from one another. To assess sex differences within the profiles we performed a one-sample t test separately for each profile, using the proportion of females within each profile to evaluate whether it significantly differed from 48% (the overall percentage of females within the ABCD sample).
Results
LPA approach replicated in two independent samples
To examine whether the LPA clustering result was replicated, we split our large sample into two independent groups (Group A: n = 5,161; Group B: n = 5,162) and performed the same LPA on both. Our findings with Group A indicated that a model with six profiles was the best fit for our data using log-likelihood BIC model estimation (see Fig. S2 in the Supplemental Material). Both Group A and Group B models were constrained to six profiles, and LPA was conducted. Our tests revealed highly similar clustering patterns across the two independent groups (see Fig. S3a in the Supplemental Material).
In addition to evaluating the replication of LPA across the two groups, we computed the average EF score for participants within each profile for each of the two groups to examine whether EF was related to profile assignment in a similar manner. We found that the relation between average EF across each profile was similar from group to group, although ultimately we waited for the whole sample LPA to further examine average EF differences (see Fig. S3b in the Supplemental Material). Given these similarities, the groups were combined into one full sample, and LPA was rerun with the same constraints (N = 10,323). We found consistent clustering patterns similar to those we previously observed in the two subgroups (Fig. 1a). Profile 1 had 1,102 participants, Profile 2 had 2,454 participants, Profile 3 had 1,513 participants, Profile 4 had 1,457 participants, Profile 5 had 2,910 participants, and Profile 6 had 887 participants (see Fig. S4 in the Supplemental Material). Notably, the fewest number of participants were found in Profiles 1 and 6, the profiles on the two extreme ends of the risk spectrum. This likely reflects the idea that fewer people live in the extremes and more people live somewhere in the middle.
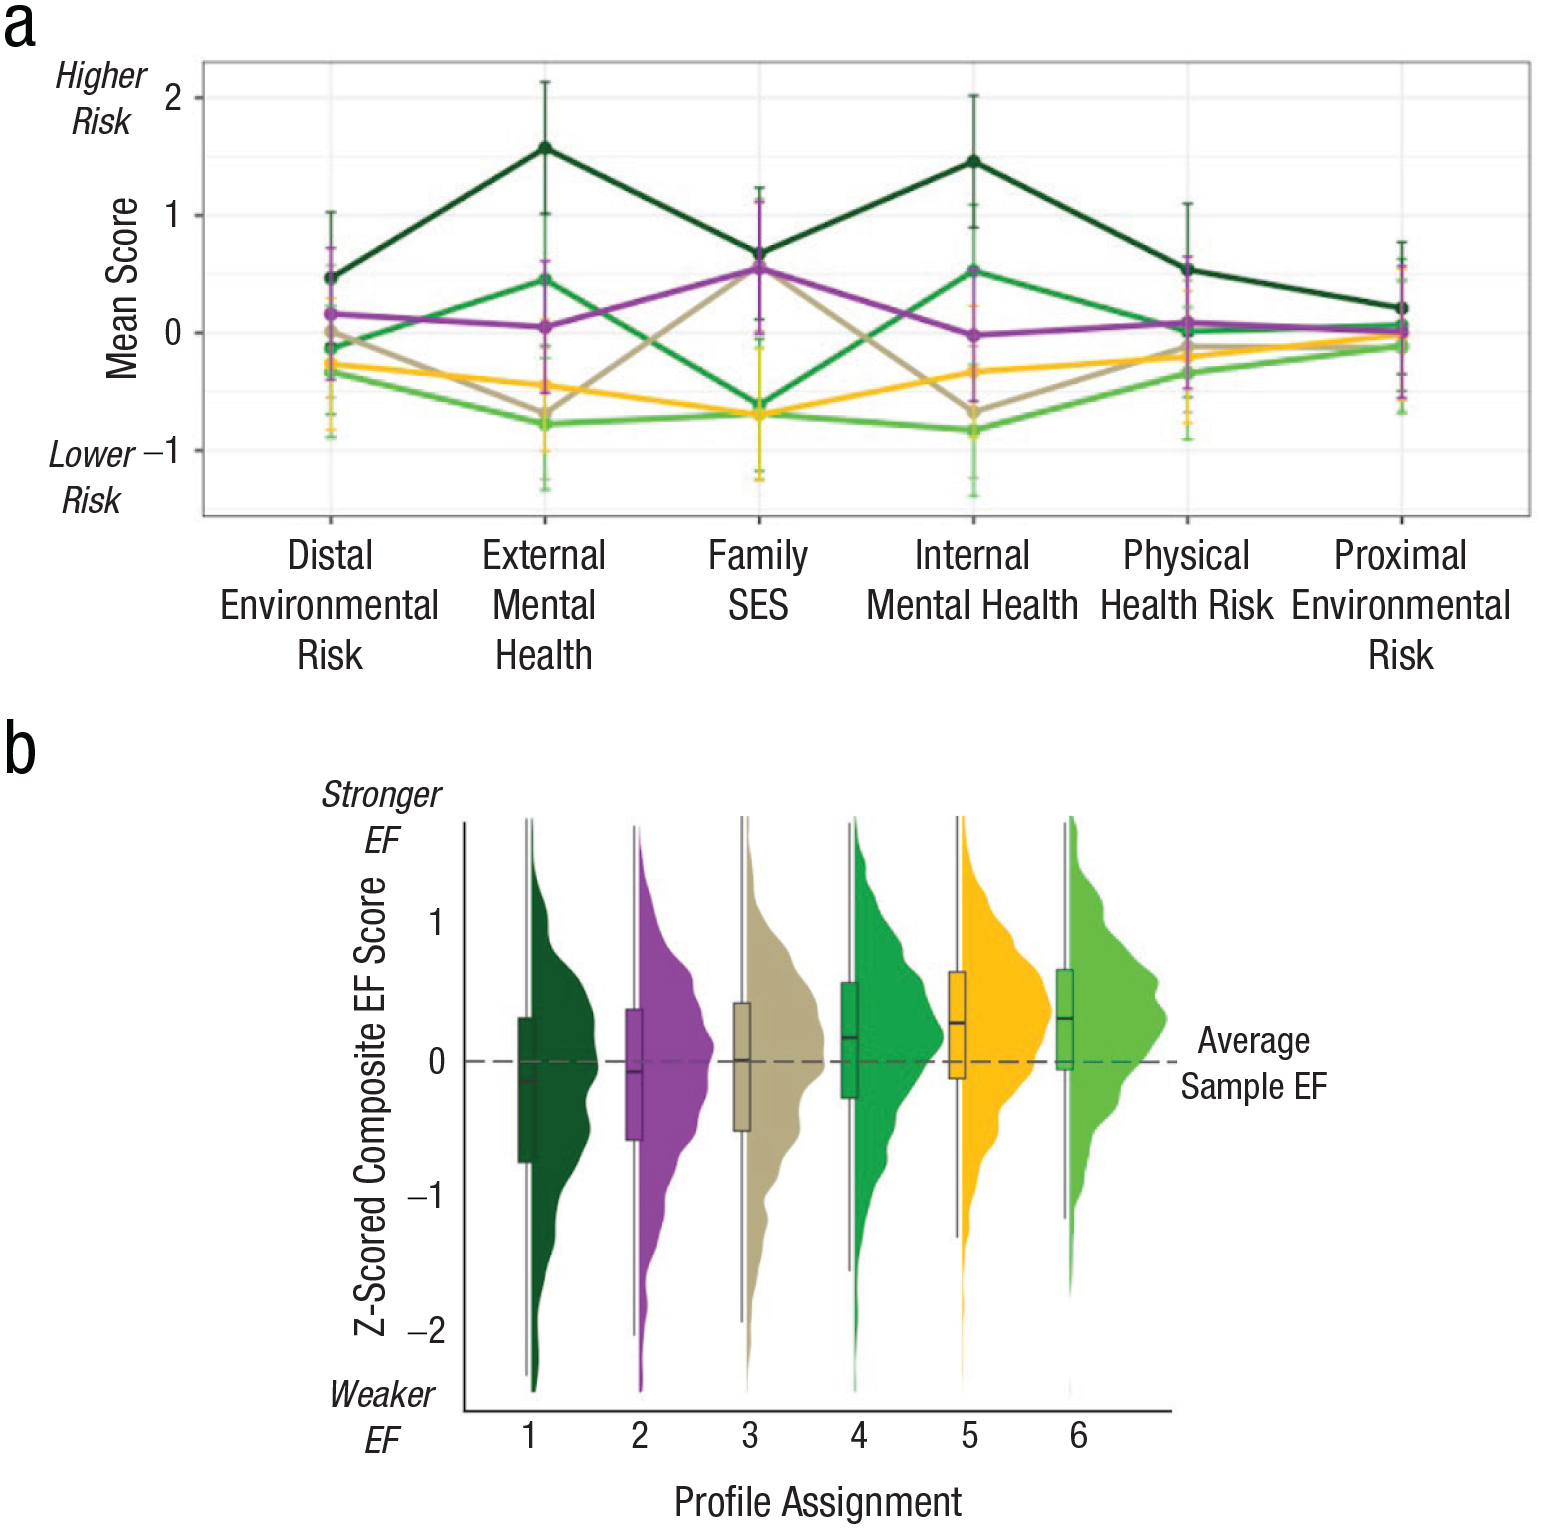
Results of latent profile analysis (LPA) for the total sample. The average z-score values (y-axis) for each input factor (x-axis) per LPA profile (six colored lines) are shown in (a). Higher z-scores represent increased, or worse, risk for a given factor. The average executive-function (EF) ability for all participants within a given profile is shown in (b). Higher z-scores represent better EF ability. Overall, we see that there is a high-risk profile (forest green; Profile 1) and a low-risk profile (neon green; Profile 6), but there are also many profiles with mixed risk levels across various factors, producing significantly different EF results. All profiles were significantly different from one another with the exception of Profiles 5 and 6. SES = socioeconomic status.
As a supplemental exploratory analysis, we tested a principal component analysis (PCA) approach as an alternative to our theory-driven risk factors, and as expected, the PCA clustered different aspects of environmental risk together, forming four risk factors that resulted in seven LPA profiles (see PCA, Fig. S5, Fig. S6, and Table S1, all in the Supplemental Material).
Risk-factor differences across profiles
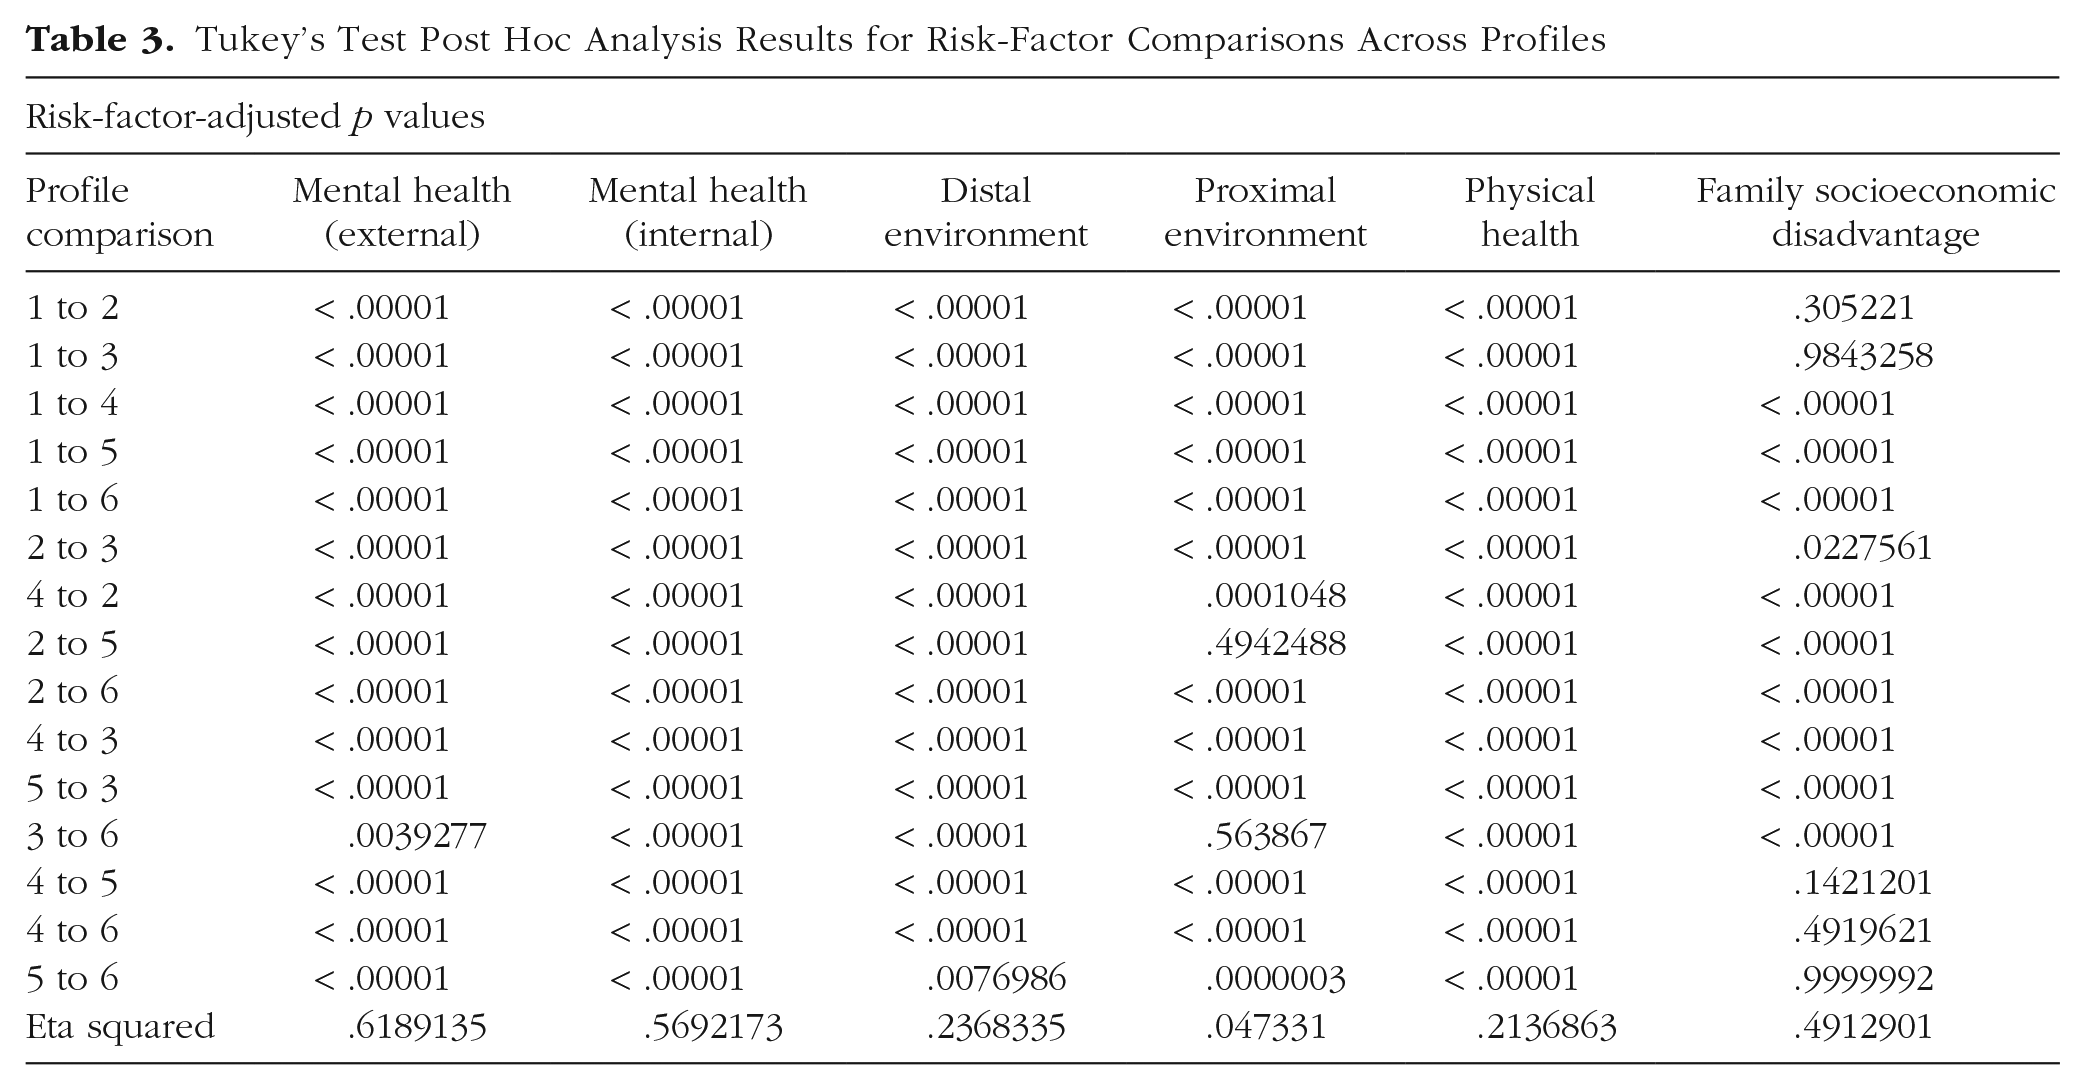
Next, we examined whether there were significant differences in each of the risk factors across all of our profiles. The overall ANOVA for each risk factor was significant—externalizing: F(5, 10317) = 3,351, p < .001, η2 = .6189135; internalizing: F(5, 10317) = 2,726, p < .001, η2 = .5692173; distal environment: F(5, 10317) = 640.3, p < .001, η2 = .2368335; proximal environment: F(5, 10317) = 102.5, p < .001, η2 = .047331; physical health: F(5, 10317) = 560.7, p < .001, η2 = .2136863; family socioeconomic disadvantage: F(5, 10317) = 1,993, p < .001, η2 = .4912901—so post hoc analyses were run to examine which profile comparisons were significant for each risk factor (see Table 3 for post hoc analysis results). All profile comparisons were significantly different for externalizing and internalizing mental-health difficulties, distal environment, and physical health. All profiles were significantly different for the proximal environment, with the exception of Profiles 2 and 5 and Profiles 3 and 6. We saw no quantitative differences in family socioeconomic disadvantage between the profiles with higher risk—that is, 4 and 5 (p = .142120), 5 and 6 (p = .999999), or 4 and 6 (p = .4919621). We saw no quantitative difference in family socioeconomic disadvantage between Profiles 1 and 2 (p = .305221) and Profiles 1 and 3 (p = .9843258). However, there was a significant difference in socioeconomic disadvantage between Profiles 2 and 3 (p = .0227561).
Tukey’s Test Post Hoc Analysis Results for Risk-Factor Comparisons Across Profiles
EF differences across profiles
We next addressed our main research question and quantified the average EF ability of individuals within each profile to assess whether EF ability varied significantly across profiles, using an ANOVA. Results showed that profiles were statistically different from one another, F(5, 10317) = 161.2, p < .0001. The effect size of this analysis, as calculated using eta squared (η2), was .072, indicating a medium-size effect. We then conducted a follow-up Tukey’s test to assess which specific profiles may or may not be statistically different from one another, corrected for multiple comparisons (see Table S2 in the Supplemental Material for p values for all comparisons). Results showed that all profiles significantly varied from one another (ps < .005) with the exception of Profiles 5 and 6 (p = .31; Fig. 1b).
Additive effect of risk factors on EF ability
When considering the clustering patterns that emerged from the whole-group LPA alongside the respective average EF ability of each profile, there were two profiles that represented the extreme ends of risk accumulation, as we predicted. That is, there was one profile with high average risk levels across all input risk factors (Profile 1; forest green in Fig. 1) and one that had low average risk levels across all risk factors (Profile 6; neon green in Fig. 1). The high and low risk profiles represented the lowest and highest average EF ability, respectively, which is also in line with our predictions. This result suggests that there may be an additive effect of risk accumulation on EF ability in late childhood, so that those who are affected by more risk factors are more likely to show difficulties in EF ability.
Family socioeconomic disadvantage is a major predictor of EF ability
We found that family socioeconomic disadvantage created a noticeable qualitative and quantitative split across the LPA profiles. Profiles 1, 2, and 3 had, on average, higher levels of socioeconomic disadvantage, and Profiles 4, 5, and 6 had, on average, lower levels of socioeconomic disadvantage (see Fig. 2 for the income and parental-education-level values that went into the family socioeconomic-disadvantage factor, broken down across the profiles). This split by socioeconomic disadvantage was the difference between profiles of children who had above-average EF (those with less socioeconomic disadvantage) and profiles of children with below-average EF (those with higher socioeconomic disadvantage).
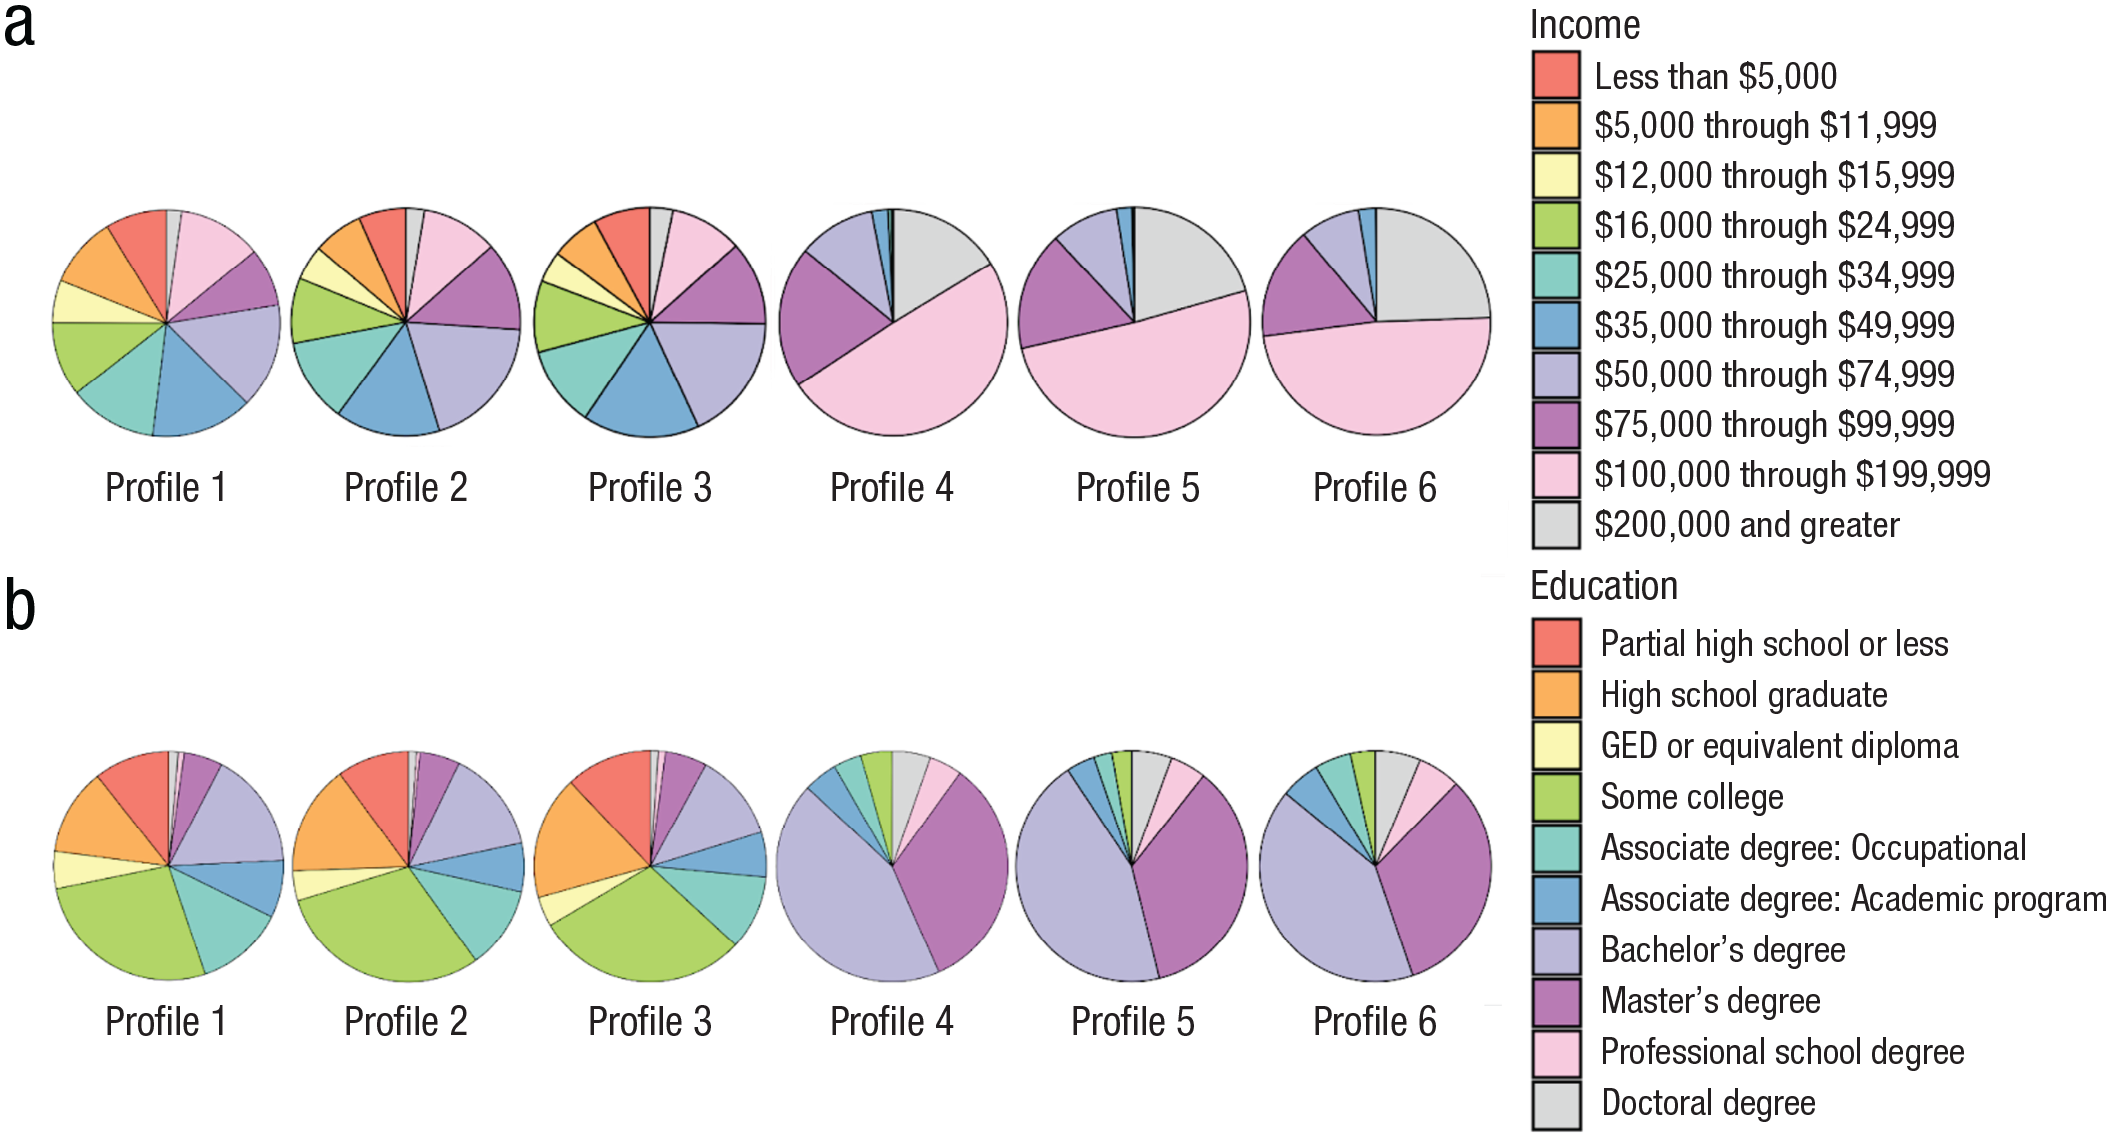
Family annual household income breakdown per profile (a). Parental-education-level breakdowns per profile are shown in (b). Data were taken from the Parent Demographics Survey (specifically, family income and parental educational attainment). Education refers to the education of the parent filling out the survey (88.8% were female caregivers). Income refers to the family’s household income. GED = general equivalency diploma.
Internalizing and externalizing difficulties associated with EF ability
Quantitatively, we saw that both internalizing and externalizing mental-health difficulties were significantly different across all profile comparisons (see Table 3), but they seemed to have an interactive relation to EF within the socioeconomic split noted above, as opposed to the EF outcomes more directly relating to mental-health-risk differences alone. Although Profiles 2 and 3 were found to have similar levels of socioeconomic disadvantage qualitatively, they varied in terms of their average mental-health burden. Profile 2 had higher levels of both internalizing and externalizing mental-health difficulties compared to Profile 3, and correspondingly Profile 2 had significantly worse average EF ability compared to Profile 3 (p = .005). Similarly, Profiles 4, 5 and 6 were found to have similar levels of socioeconomic advantage, but Profile 4 had higher internalizing and externalizing mental-health difficulties compared to Profiles 5 and 6. These differences in mental-health burden were found to correspond to significant differences in average EF ability between Profiles 4 and 5 (p = .00001) and Profiles 4 and 6 (p = .0000003).
Characterizing children within each profile
We found the proportion of children in specific pubertal categories differed across the six LPA profiles: prepuberty profile proportion ANOVA: F(5, 8337) = 13.94, p < .0001, η2 = .008288662; early-puberty proportion ANOVA: F(5, 8337) = 3.893, p = .00159, η2 = .002329524; midpuberty proportion ANOVA: F(5, 8337) = 18.96, p < .0001, η2 = .01124503; Fig. 3a). Following the significant ANOVAs for the three pubertal categories, we ran Tukey’s test for post hoc analyses. We found that the proportion of participants in the prepuberty category was significantly different across profiles: Profiles 1, 2, and 3 (below-average EF) had a lower proportion of participants in the prepubertal category relative to Profiles 5 and 6 (Fig. 3b). By contrast, the proportion of children in midpuberty was significantly higher in Profiles 1, 2, and 3 relative to Profiles 4, 5, and 6 (exception: Profiles 3 and 6 were not significantly different; Fig. 3c). See Table S3 in the Supplemental Material for p values from all post hoc comparisons. Overall, those in profiles with lower levels of EF ability were more often in later stages of puberty than those in profiles with higher levels of EF ability.
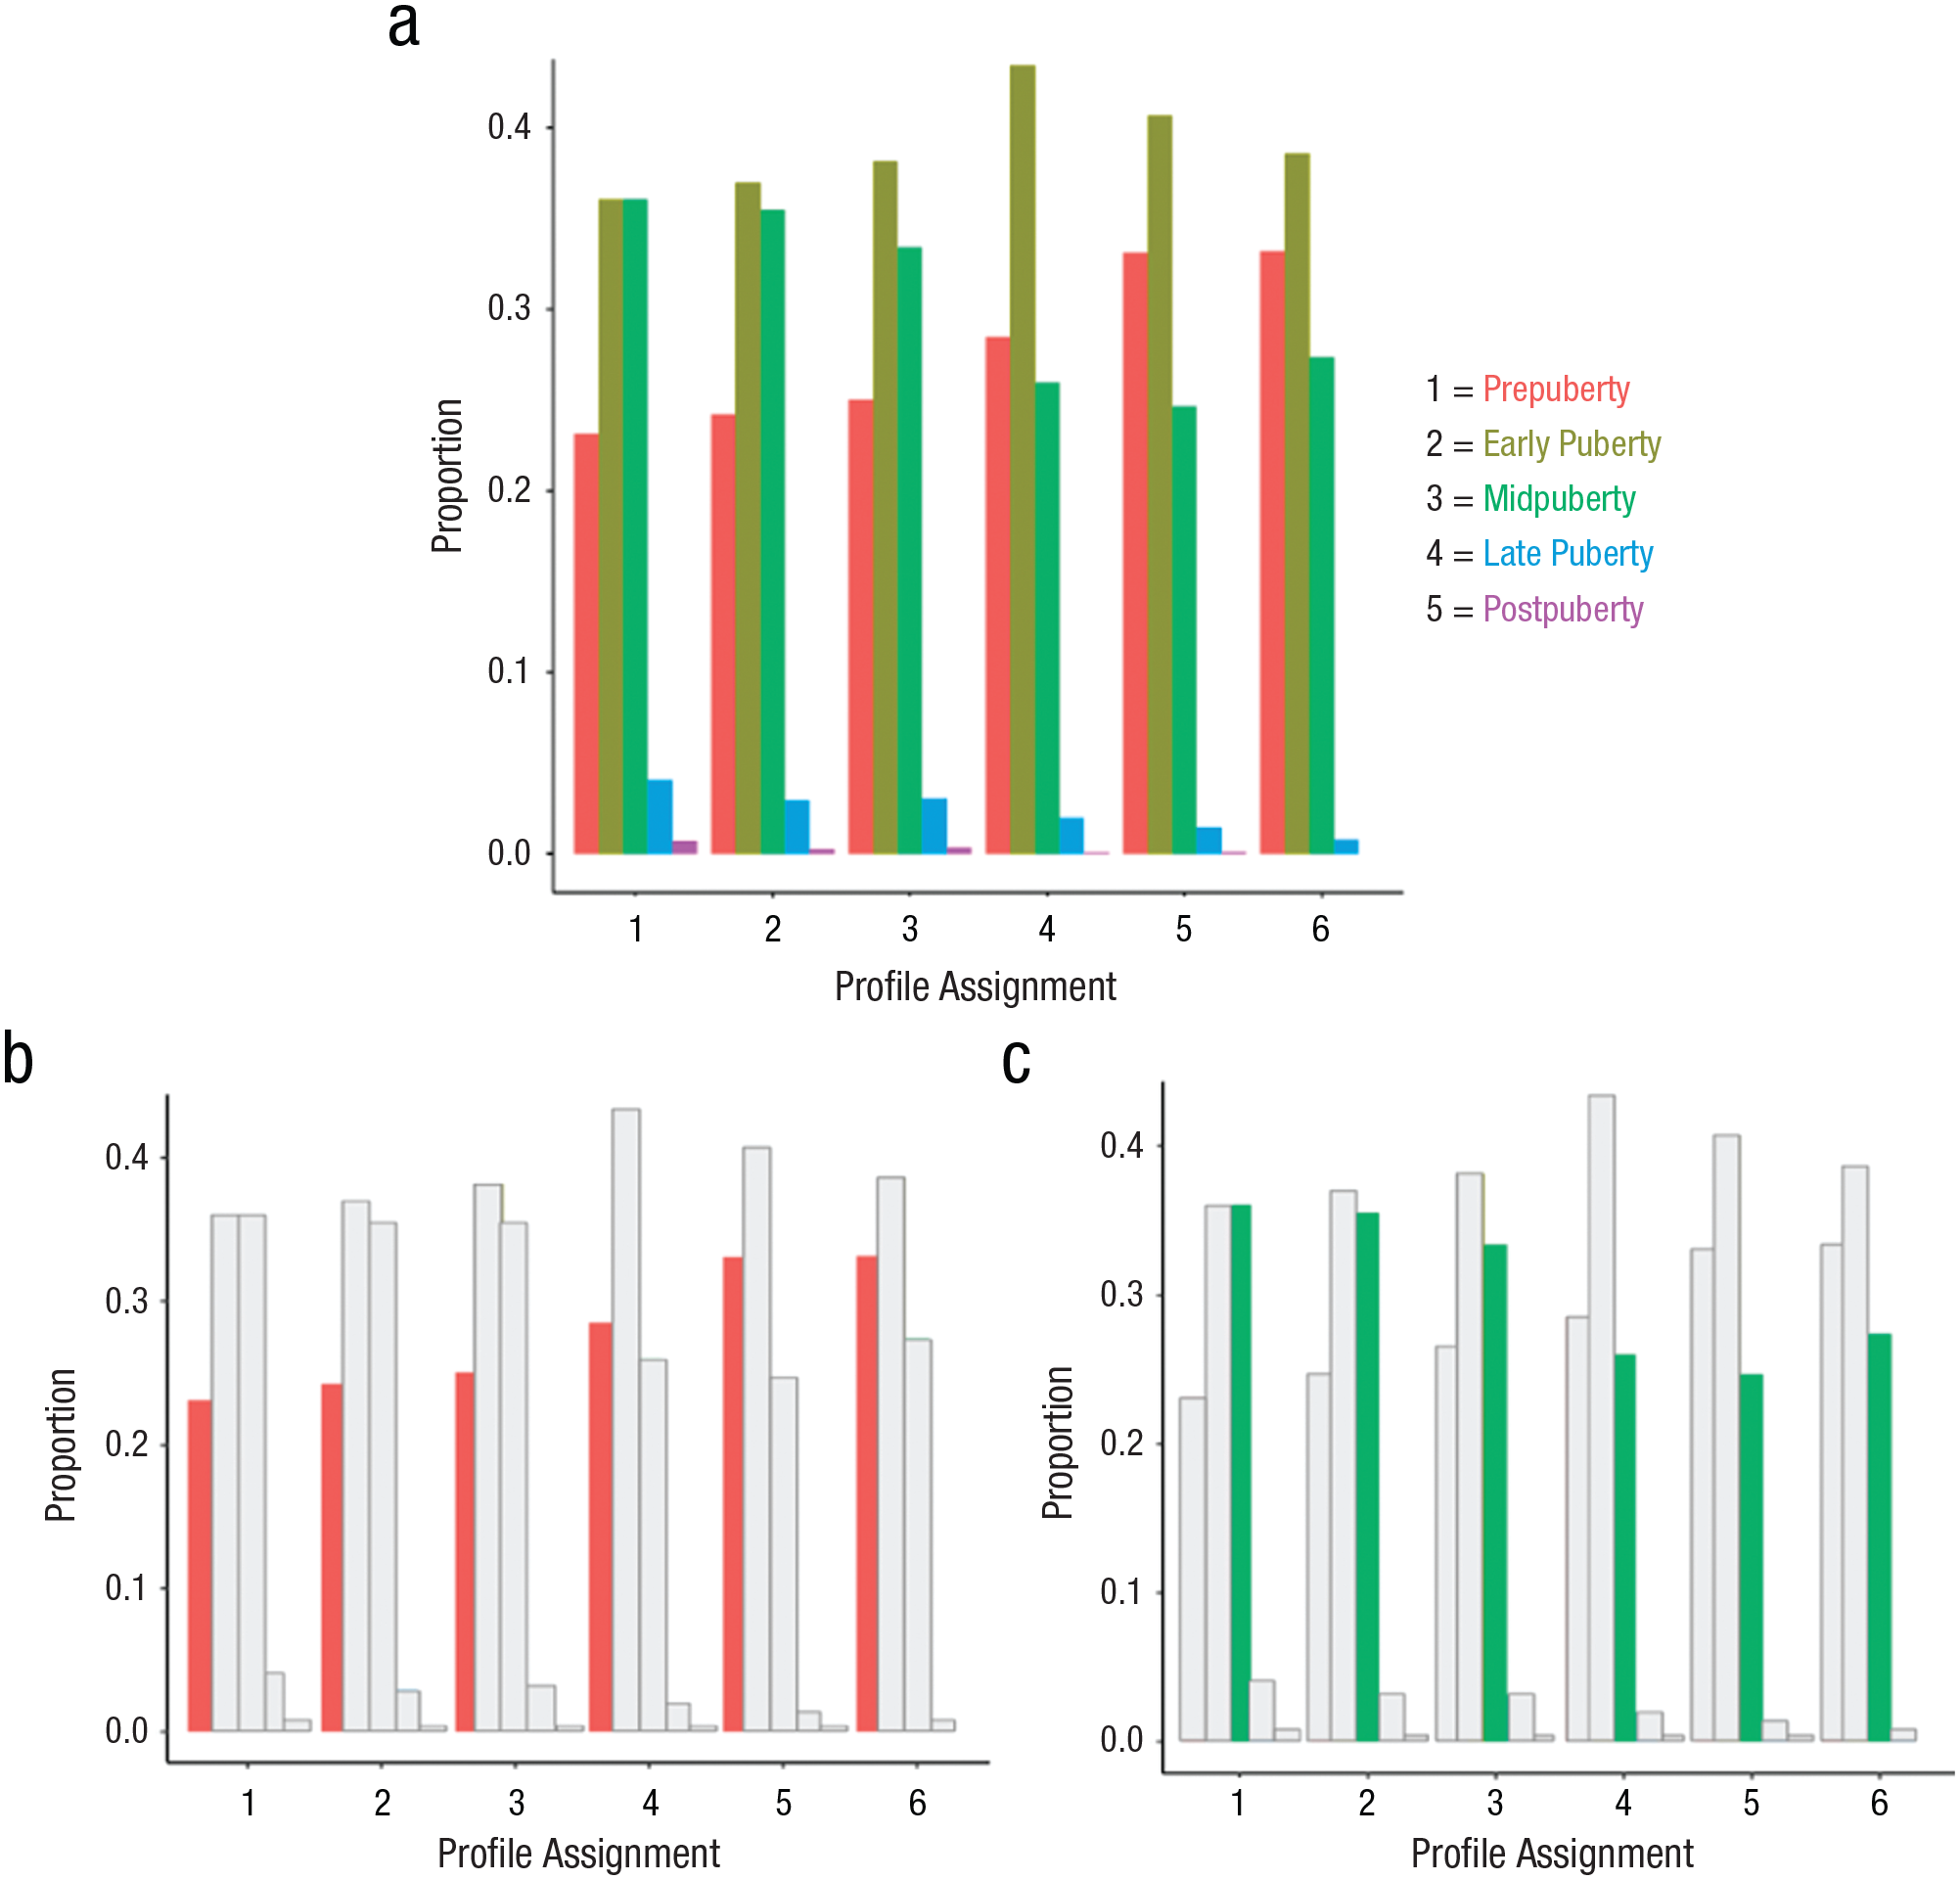
Proportion of all five puberty categories per profile (a). In (b) we show the proportion of prepuberty categories per profile, and in (c) we show the proportion of the midpuberty category per profile. Profiles with a higher proportion of participants in the prepubertal stage had corresponding higher executive function (EF) ability, and profiles with a higher proportion of participants in the midpuberty stage had lower EF ability.
We next examined whether there were differences in participant sex within the profiles. We found that Profiles 1 (p < .001), 2 (p = .002), and 4 (p < .001), the profiles with the highest average mental-health burden, had a significantly lower proportion of females than the total sample, whereas Profile 6 (p = .0017) had a significantly higher proportion of females than the total sample. There were no differences in participant proportion of females relative to the overall sample for Profiles 3 (p = .06) and 5 (p = .09; see Fig. S7 in the Supplemental Material).
We then assessed whether there were differences in participant age across the profiles and found a very small effect, ANOVA: F(5, 644) = 2.291, p < .043, η2 = .001. We then conducted a follow-up Tukey’s test to assess which specific profiles may or may not be statistically different from one another, corrected for multiple comparisons, and found that only Profiles 2 and 6 had a significant age difference: Profile 2 was significantly younger than Profile 6 (p = .025; see Fig. S8 in the Supplemental Material). For additional descriptive information about the profiles (i.e., race or ethnicity and participation site information), see Figures S9 and S10 in the Supplemental Material.
Discussion
The current study examined how various risk factors known to separately affect EF ability combined to create unique patterns of risk in subgroups of a national, normative, developmental data set (ABCD). We tested whether, and then how, these subgroups of the sample differed in average EF ability. Specifically, we applied an LPA to characterize how one’s distal and proximal environment, mental health, family SES, and physical health formed subgroups of risk across individuals. Our results showed that two profiles represented those on either extreme (low and high) of risk accumulation and that these profiles related to highest and lowest average EF ability. This result suggests that there is a cumulative effect of risk across the six risk factors of interest so that being impacted by several risk factors is worse than being impacted by any one given factor. The remaining profiles were more nuanced, helping to explain the “messy middle” of variability in EF ability. One risk factor in particular resulted in a substantial split in average EF across profiles: family socioeconomic disadvantage.
Family socioeconomic disadvantage is a key factor relating to EF ability
Family socioeconomic disadvantage split our six profiles into two groups—three with higher SES disadvantage (predicting below-average EF ability) and three with lower SES disadvantage (predicting above-average EF ability). This finding suggests that SES disadvantage might be a particularly important factor to consider when aiming to improve EF ability in late childhood. Our finding is consistent with previous research showing that EF ability and SES are strongly related across development (Ardila et al., 2005; Blums et al., 2017; Hackman et al., 2015; Last et al., 2018; Lawson et al., 2018; Rochette & Bernier, 2014). Furthermore, there is much work, both on the research and policy levels, that has suggested that interventions in SES are important to support cognitive development (e.g., Duncan & Magnuson, 2012; Engle et al., 2011; Sherr et al., 2017). Direct interventions on SES, such as cash-intervention work, have been shown to be successful (e.g., Fernald et al., 2008; Little et al., 2021; Macours et al., 2012; Troller-Renfree et al., 2022), but politically contentious (Ananat et al., 2022; Corinth et al., 2021).
Another potential route to improving SES in future generations is to increase youth enrollment and completion of college by making higher education more attainable to all (Abel & Deitz, 2019; Hardaway & McLoyd, 2009; Irwin et al., 2022; Page & Scott-Clayton, 2016). Our findings suggest that this approach may be particularly fruitful, because one clear factor that separated profiles with lower SES versus profiles with higher SES was having a parent with at least some college education.
The role of SES is increasingly important to consider as economic disparities increase. In the United States, the top 10% earns on average 17 times more than the bottom 50% of the population, a ratio that is significantly higher than in European countries and in China (Chancel et al., 2022). With the increasing gap between upper- and lower-class income in the United States, it is more pertinent than ever to consider how we can mitigate the relationship between income and child cognitive development (including EF), as supported by our analysis.
Higher mental-health burden relates to meaningful differences in EF ability
Although SES disadvantage was associated with whether participants in each profile had above- or below-average EF ability in late childhood, we also found significant differences in average EF ability within those two SES clusters. When SES disadvantage was equivalent, higher internalizing and externalizing mental-health difficulties related to worse average EF ability, consistent with previous research (Halse et al., 2022; Ivanov et al., 2008; Perner et al., 2002; Rock et al., 2014; Woltering et al., 2016; Yang et al., 2022). Worse mental-health profiles also had a significantly lower proportion of females relative to sample expectations, perhaps reflecting higher mental-health issues in boys relative to girls in childhood (e.g., Cree et al., 2018). This sex ratio would be interesting to assess in profiles of later waves of the ABCD data set, as mental-health issues increase, particularly for females, in mid-to-late adolescence (e.g., Newlove-Delgado et al., 2022). Thus, when SES mobility is not feasible, or SES disadvantage is not present, intervention and prevention programs that target mental health could be effective for improving EF outcomes (see Gudayol-Ferré et al., 2015; Sasser et al., 2017; Tang et al., 2012).
More advanced puberty in late childhood is associated with worse EF ability
When exploring differences in the composition of our six profiles, we found that profiles with higher average EF ability also had a higher proportion of participants in earlier pubertal stages even though median age and age range did not substantively differ across profiles. Previous research has shown that starting puberty earlier than one’s peers, or progressing through puberty too quickly, is related to worse cognitive-development outcomes (Chaku & Hoyt, 2019; Laube & Fuhrmann, 2020) and more mental-health challenges (Graber et al., 2004; Harden & Mendle, 2012; Kaltiala-Heino et al., 2001, 2003; Koerselman & Pekkarinen, 2018; Patton et al., 2004). Additionally, experiencing higher socioeconomic disadvantage in childhood has also been related to earlier onset of puberty (Deardorff et al., 2014; James-Todd et al., 2010; Oelkers et al., 2021; Sun et al., 2017), which may explain why we see a higher proportion of participants in more advanced pubertal stages in profiles with more socioeconomic disadvantage, subsequently displaying an association with worse EF. Uncovering why some start puberty earlier, or progress through puberty faster, and whether these aspects are important to outcomes (i.e., whether the end of puberty represents the end of EF plasticity or growth; Chaku & Hoyt, 2019; but also see Smith-Woolley et al., 2017), is an important area of biological research that could improve cognitive outcomes.
Limitations and future directions
Despite the large sample size and large number of assessments included in this study, there are limitations that should be considered when interpreting the results. Although the risk factors created for the current study had strong theoretical motivation, the internal consistency of the factors were not high, and the distal-environment risk factor and the physical-health risk factor were particularly low. Our data-driven PCA approach (see the Supplemental Material) also split the Distal Environment and Physical Health measures into multiple components. It could be that there was high heterogeneity in terms of how participants responded to different surveys in these types of categories, or it is possible that although surveys appear to be measuring similar constructs (e.g., physical activity and waist circumference; school safety and neighborhood safety), they are in fact not. We were limited to drawing from the surveys available in high density within the ABCD collection; perhaps other surveys of environment and health would reveal greater consistency, or future work could focus on designing surveys that provide higher consistency in theoretically important aspects of child development (i.e., physical health and distal environment).
The current study is cross-sectional, and other researchers could consider how these risk factors influence EF trajectories longitudinally. However, in the extant releases of ABCD data at the time of our study, multiple EF measures were not consistently collected at follow-up visits, which is why we did not test for longitudinal relations of EF ability. Future data releases may make this multimeasure longitudinal analysis possible.
An additional limitation of the work is that this study sample is exclusive to the United States, which has stark income inequality between the upper and lower economic classes (see Chancel et al., 2022). These inequalities likely contributed to our bimodal profile splits on family socioeconomic disadvantage and the strong impact of the socioeconomic factor on EF ability. Future researchers could employ similar methods on a sample from countries with a different SES landscape. Finally, although the ABCD data set is generally more representative than many other developmental samples, our sample was limited to families who had the time and resources to participate in research at a university and to children who had the cognitive ability to participate in a demanding research protocol.
Conclusions
In conclusion, differences in EF ability in late childhood is a multipronged problem that will require considering the child holistically. Although targeting socioeconomic disadvantage should be a top priority, when this is not feasible or necessary there are other important risk factors to consider that relate to EF ability in late childhood, such as mental-health difficulties and pubertal development. Individualizing interventions to match a child’s unique set of risk factors could be most influential for improving EF abilities in childhood.
Supplemental Material
sj-docx-1-pss-10.1177_09567976241235931 – Supplemental material for Distinct Constellations of Common Risk Factors Differentially Relate to Executive-Function Ability in Children
Supplemental material, sj-docx-1-pss-10.1177_09567976241235931 for Distinct Constellations of Common Risk Factors Differentially Relate to Executive-Function Ability in Children by Eliya Ben-Asher, Blaire M. Porter and Jessica A. Church in Psychological Science
Footnotes
Acknowledgements
We would like to thank the Developmental Cognitive Neuroscience Lab and the faculty in the Psychology Department at the University of Texas at Austin for all their feedback and advice during the development of this project. Data used in the preparation of this article were obtained from the ABCD Study (![]() ), held in the NIMH Data Archive (NDA). This is a multisite, longitudinal study designed to recruit more than 10,000 children ages 9 and 10 and follow them over 10 years into early adulthood. ABCD consortium investigators designed and implemented the study and/or provided data but did not participate in the analysis or writing of this report. This manuscript reflects the views of the authors and may not reflect the opinions or views of the NIH or the ABCD consortium investigators.
), held in the NIMH Data Archive (NDA). This is a multisite, longitudinal study designed to recruit more than 10,000 children ages 9 and 10 and follow them over 10 years into early adulthood. ABCD consortium investigators designed and implemented the study and/or provided data but did not participate in the analysis or writing of this report. This manuscript reflects the views of the authors and may not reflect the opinions or views of the NIH or the ABCD consortium investigators.
Transparency
Action Editor: Daniela Schiller
Editor: Patricia J. Bauer
Author Contributions
The first and second authors contributed equally to this work.
References
Supplementary Material
Please find the following supplemental material available below.
For Open Access articles published under a Creative Commons License, all supplemental material carries the same license as the article it is associated with.
For non-Open Access articles published, all supplemental material carries a non-exclusive license, and permission requests for re-use of supplemental material or any part of supplemental material shall be sent directly to the copyright owner as specified in the copyright notice associated with the article.