
Abstract
People often decide whether to invest scarce resources—such as time, money, or energy—to improve their chances of a positive outcome. For example, a doctor might decide whether to utilize scarce medicine to improve a patient’s chances of recovery, or a student might decide whether to study a few additional hours to increase their chances of passing an exam. We conducted 11 studies (N = 5,342 adults) and found evidence that people behave as if they focus on the relative reduction in bad outcomes caused by such improvements. As a consequence, the same improvements (e.g., 10-percentage-point improvements) are valued very differently depending on whether one’s initial chances of success are high or low. This focus on the relative reduction of bad outcomes drives risk preferences that violate normative standards (Studies 1a–1g and 2a), is amplified when decisions become more consequential (Study 2b), and leads even experienced professionals to make suboptimal decisions (Study 3).
Many decisions involve choosing whether or not to invest money, time, or effort to improve the chances of obtaining a positive outcome. Executives determine how much budget to allocate to sales-boosting campaigns, students decide how many hours to spend studying to improve their chances of passing an exam, and intelligence analysts evaluate costly initiatives designed to reduce the likelihood of terrorist attacks. Because money, time, and effort are limited, such improvement decisions are consequential: Investing resources in one improvement often means neglecting others.
Although these improvement decisions are common, little research has investigated how people make them. Of course, a large body of research in psychology and economics has examined how people think about and value risky prospects (e.g., people’s valuation of a 30% chance of a reward; see Mata et al., 2018). In turn, it seems straightforward to assume that valuations of an improvement (e.g., going from a 30% to 40% chance of a reward) are roughly equivalent to the difference in the valuations of two individual prospects (e.g., the difference between the valuation of a 30% chance of a reward and the valuation of a 40% chance; see Wu & Gonzalez, 1996). However, Lewis and Simmons (2020) showed that people often prefer improving their chances of success when those chances are already high. These authors argued that this is because people weigh the expected final outcome in addition to the improvement itself (i.e, a prospective outcome bias).
Statement of Relevance
People commonly encounter probabilistic outcomes in their daily lives. Decisions about one’s finances, health, and occupation all entail accepting and managing risks. Although psychologists have long been interested in how people approach such risks, little research has explored how people think about and value improving the chances that a risk produces a positive outcome. This is puzzling because many risky decisions are improvement decisions (e.g., students deciding whether to expend additional time studying to improve their chances of passing an exam). Our research indicates that people make these improvement decisions by considering how they would feel if they were to obtain a bad outcome (studies used adult participants). This leads to suboptimal lay and expert decision-making in a variety of consequential contexts (e.g., medicine and finance).
This article proposes a new psychology of how people make improvement decisions. The literature on regret informs our expectations (e.g., Bell, 1982; Loomes & Sugden, 1982; Zeelenberg, 1999). Regret arises when people compare a realized outcome to a superior counterfactual alternative that they could have obtained had they acted differently (Bleichrodt & Wakker, 2015; Loomes & Sugden, 1982). Because experiencing regret is aversive, people work to minimize the regret they anticipate feeling for their actions (Zeelenberg, 1999). Although regret is typically studied when people choose between options, regret might also emerge when people consider whether to improve their chances of success. For example, someone might ask, “If I forego studying tonight, will I regret that decision when it turns out I didn’t pass my exam?” The more they anticipate regretting not studying, the more they would value spending the night studying.
An improvement decision should be evaluated on the basis of how much it increases one’s chances of success. However, we believe that people’s anticipation of regret is biased, leading them to diverge from this evaluation. Figure 1 illustrates our proposed logic.
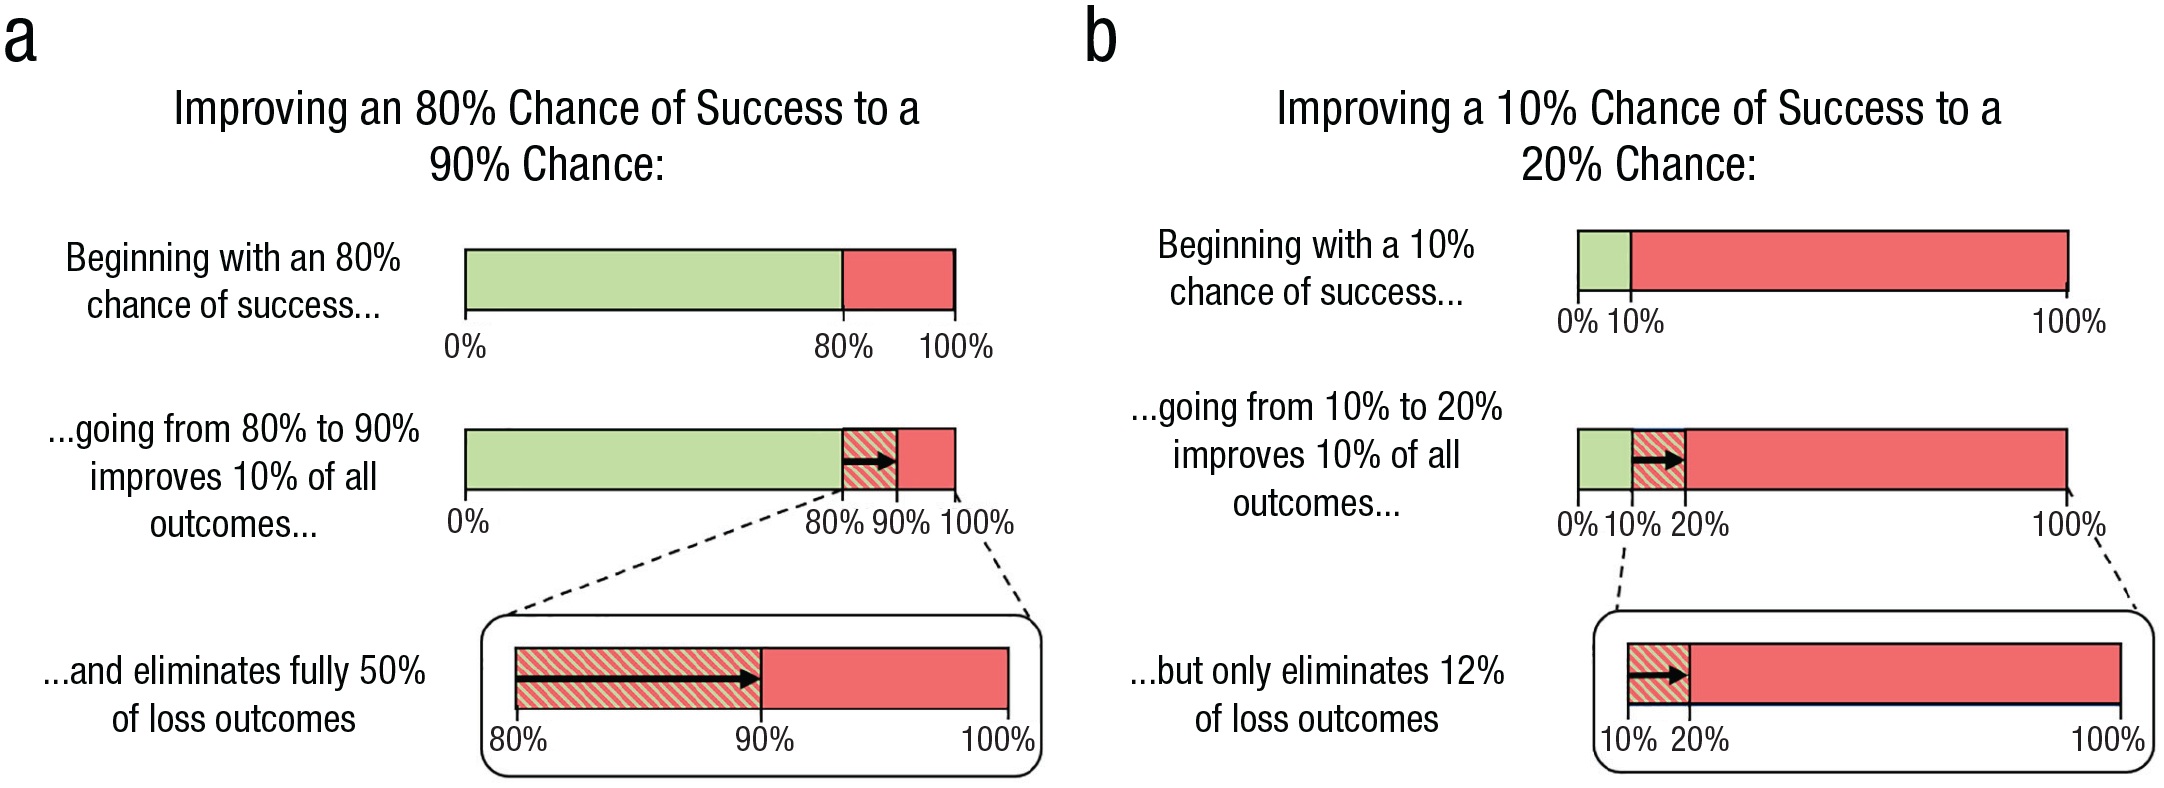
Bad outcomes eliminated by the same improvement with different initial chances of success.
Regret is based on how much one could have done to prevent a bad outcome from occurring (Zeelenberg & Pieters, 2007). So, in cases in which people consider making an improvement to their chances of success, they are assumed to consider the regret they might feel for foregoing an improvement when that improvement would have mattered (i.e., when it prevents a bad outcome). Figures 1a and 1b are schematic representations of two example situations in which a decision maker can improve their chances of a good outcome by 10 percentage points (p.p.): Figure 1a shows how someone can improve their chances of success from 80% to 90%, and Figure 1b shows how someone can improve their chances of success from 10% to 20%. In both cases, the actual improvement is 10 p.p.; therefore, the two improvements should be considered to have equal value if decision makers are considering each improvement’s effect across all outcomes. Here, we build on existing literature and argue that instead of evaluating these improvements in relation to the total set of outcomes (i.e., across all outcomes), people evaluate these improvements purely by the proportion of bad outcomes eliminated. The improvement illustrated in Figure 1a prevents 50% of the bad outcomes; the improvement illustrated in Figure 1b prevents only 12% of the bad outcomes. If people consider how much an improvement matters purely among the set of bad outcomes rather than all outcomes (e.g., Baumeister et al., 2001), they will drastically overestimate regret for situations in which they already have a high chance of success relative to those in which they have a lower initial chance of success. Essentially, we propose that people evaluating improvements attend to the wrong denominator and evaluate improvements only in relation to bad outcomes rather than in relation to all outcomes. This prediction deviates from what existing theories of risky decision making imply (see Table 1).
Implied Predictions of Valuations of Improvements by Relevant Theories
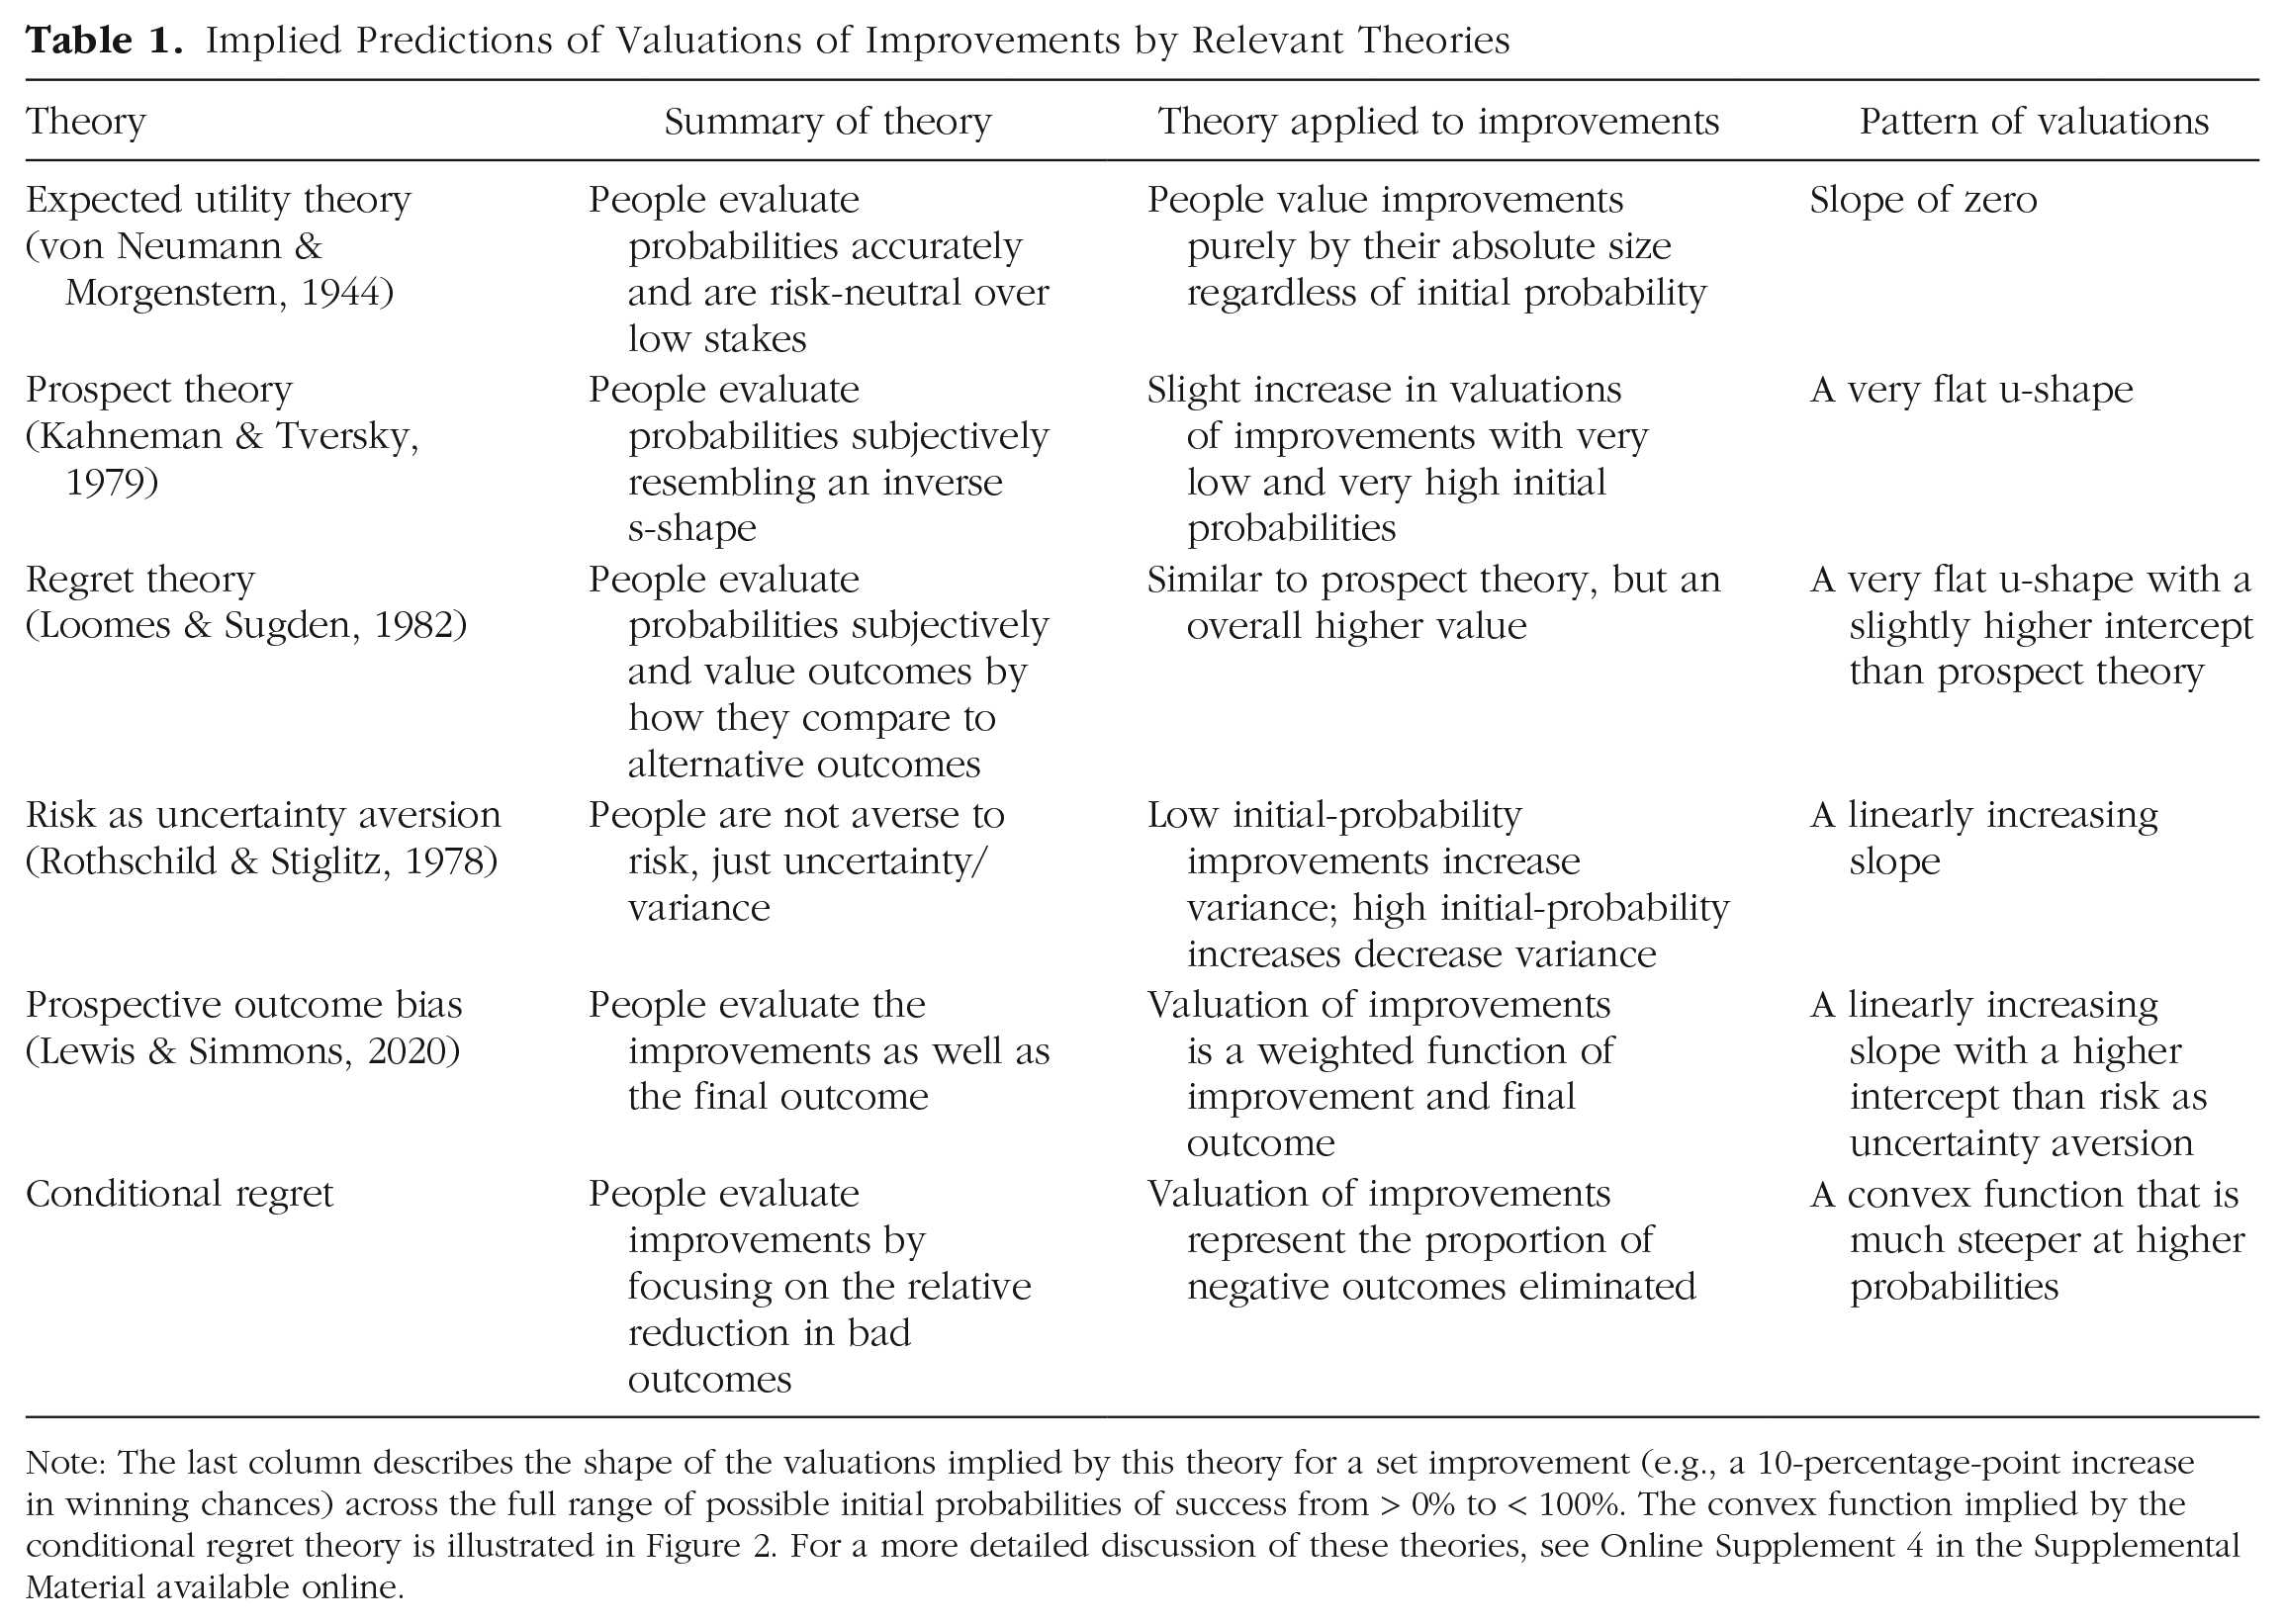
Note: The last column describes the shape of the valuations implied by this theory for a set improvement (e.g., a 10-percentage-point increase in winning chances) across the full range of possible initial probabilities of success from > 0% to < 100%. The convex function implied by the conditional regret theory is illustrated in Figure 2. For a more detailed discussion of these theories, see Online Supplement 4 in the Supplemental Material available online.
If people’s valuations of improvements are indeed biased by considering primarily the relative reduction in bad outcomes (rather than the overall impact), several predictions logically follow. First, the same improvements (e.g., 10-p.p. improvements) will be valued considerably more when they reduce a greater proportion of bad outcomes. Therefore, we hypothesize that a convex pattern of valuations of improvements will emerge across the range of initial probabilities (see Fig. 2). Importantly, this convex pattern—and our suggestion that people focus on the proportion of bad outcomes improvements eliminate—can be empirically distinguished from predictions implied by existing models (see Table 1).
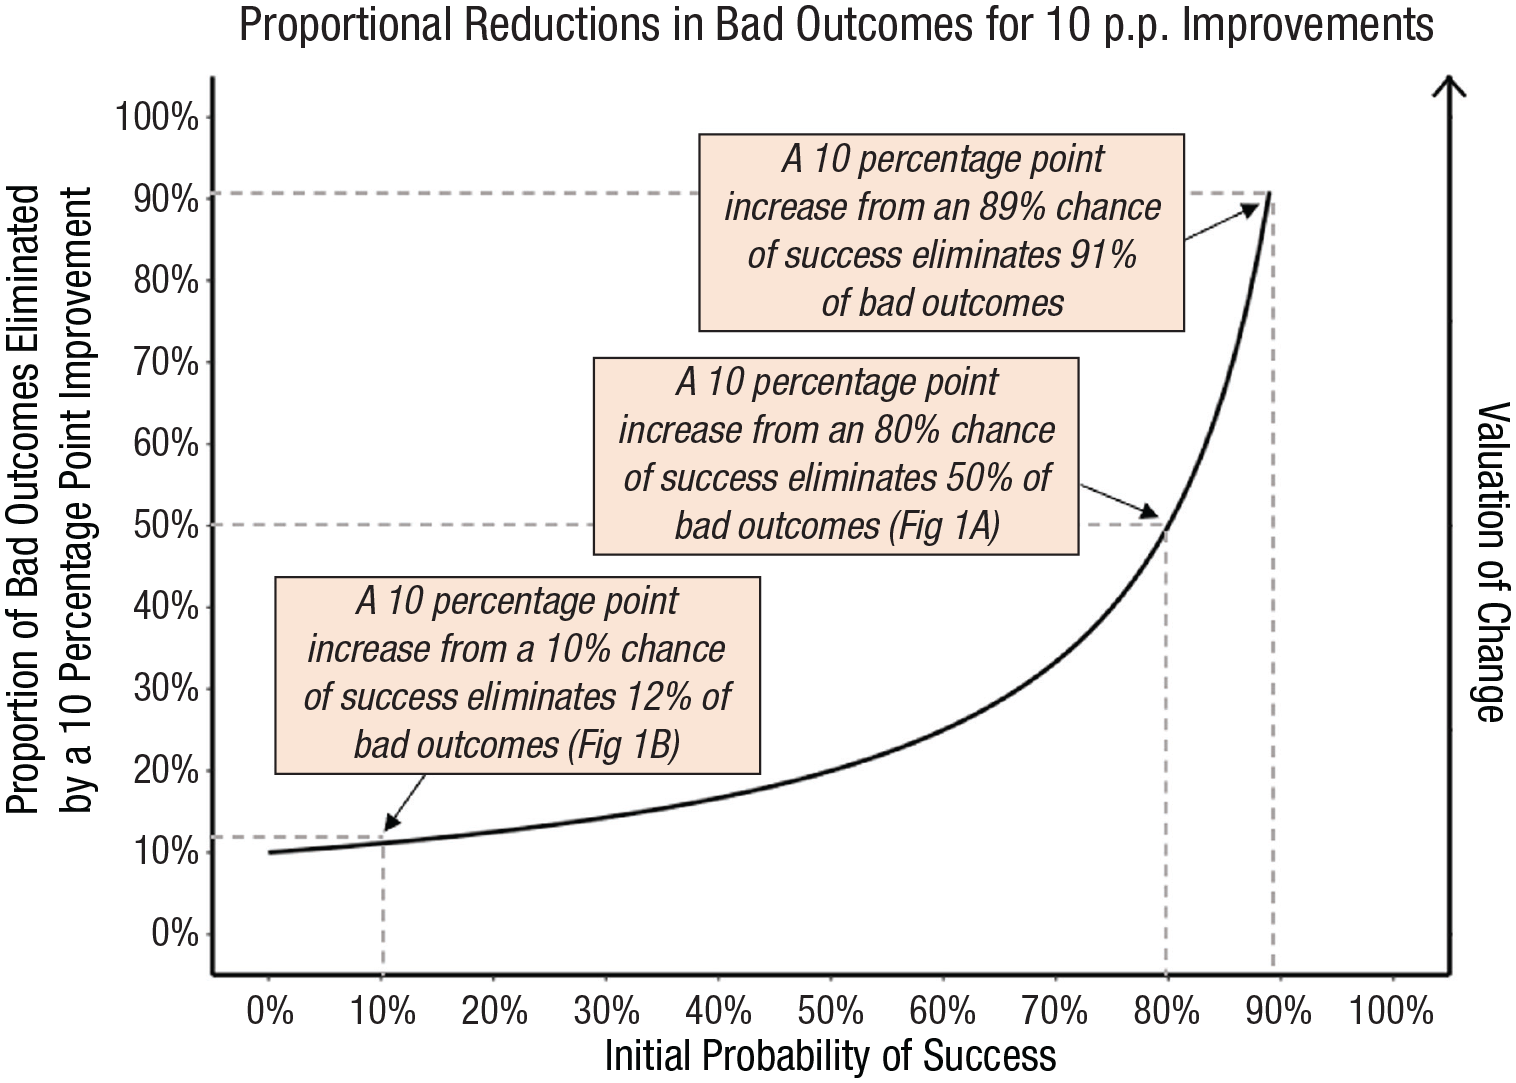
Proportion of bad outcomes eliminated by a 10-percentage-point improvement as the initial probability of success increases.
Second, because we believe these biased valuations emerge from the regret one anticipates experiencing on obtaining a bad outcome, we expect them to behave differently than typical decision biases. Specifically, many decision-making biases arise from people using mental shortcuts or heuristics (i.e., System 1 processing; see Evans & Stanovich, 2013). Consequently, increasing deliberation (Kahneman & Frederick, 2002) or motivation (Petty et al., 1981) typically attenuates or even eliminates these biases, reducing their effect in weightier decisions (e.g., Chaiken, 1980). Regret, on the other hand, is an emotion in which one blames oneself for obtaining an inferior outcome. The more important the outcome, the more self-blame people feel (Zeelenberg & Pieters, 2007). Therefore, interventions that typically reduce decision biases—such as increasing outcomes’ importance—may actually increase the bias we document.
Finally, if people indeed overvalue improvements in situations with higher initial chances of success, it implies that people will invest resources suboptimally, preferring to increase their chance of success slightly in situations in which they were already likely to succeed (e.g., improving a 90% chance of a reward to 95%) rather than more dramatically increasing their chances of success for less likely outcomes (e.g., improving a 10% chance to 20%).
We conducted 11 studies to investigate how people value improvements. We first report a pilot study confirming that participants approach improvements differently than static risks. Studies 1a through 1g tested whether participants’ valuations of improvements followed the hypothesized convex pattern Figure 2 depicts. Studies 2a and 2b explored anticipated regret’s role as the process underlying these valuations. Finally, Study 3 examined how lay and expert decision makers make suboptimal choices when deciding between improvements.
Open Practices Statement
The Supplemental Material available online details additional analyses and exploratory measures. All studies—except the pilot study and Study 1a—were preregistered. All data, materials, preregistrations, and analysis scripts are available on the OSF at https://osf.io/acvrn. Because we did not know the expected effect size ex ante and cared about precision in our estimates, we typically preregistered collecting approximately 100 participants per cell for within-subjects estimates and 400 per cell for between-subjects comparisons.
Pilot Study
First, we report a pilot study testing whether people treat improvements differently than static risky outcomes.
Method
We recruited 227 Americans from Amazon Mechanical Turk (MTurk; Mage = 38.5 years; 45% female, 43% male, 12% did not respond) in exchange for payment. We intentionally used very strict exclusion criteria for this pilot study to ensure that we would not inadvertently interpret participant misunderstanding as a meaningful effect. If inattentive participants misunderstood an improvement from a 20% to 30% chance of winning $10 as “a 30% chance of winning $10,” we would document a positive linear slope that would not actually represent the valuation of improvements but merely reflect participants misunderstanding the question. Specifically, participants had to answer a total of eight questions correctly; in total, 130 participants failed to do so. Analyzing results without these exclusions does not change the pattern of results or their statistical significance.
We used a fully within-subjects design. Each participant completed two sets of trials. In one set, participants completed 12 trials in which they indicated their willingness to pay to enter $10 lotteries (enter condition) as well as an attention-check trial in which they were asked about their willingness to pay to enter a lottery with a 0% chance of winning. In another set, participants completed 11 trials in which they indicated their willingness to pay to change their chances of winning $10 lotteries (change condition) as well as three attention-check trials in which they were asked about their willingness to pay for a 0-p.p. change. The probabilities of these trials were yoked together so that for each change trial there were two enter trials, the first of which asked participants about their willingness to pay to enter a lottery at the initial probability in the change trial and the second of which asked participants about their willingness to pay to enter a lottery at the higher probability that they could improve their chances to in the change trial. For example, in one of the change trials, participants were asked about their willingness to pay to change their chances of winning a $10 lottery from 10% to 20%. In the enter trials, the same participants also indicated their willingness to pay to enter two separate lotteries—one with a 10% chance to win $10 and one with a 20% chance to win $10. If there is nothing special about improvement decisions and they are treated the same as static risks, then we would expect participants’ valuations of changing their chances from 10% to 20% to be roughly equivalent to the difference in their valuations of entering lotteries with 10% and 20% chances of winning. This and the following studies received approval from the University of California, Berkeley Committee for Protection of Human Subjects.
Results
Figure 3 makes clear how improvements are treated very differently than (mathematically equivalent) static risky prospects. The flat green line reveals that participants’ implied valuation of each improvement was roughly similar across all initial probabilities. That is, the gap between participants’ valuations of two individual risks did not change across the full spectrum of initial probabilities. However, the convex pattern of the purple line in Figure 3 suggests that valuations of improvements appear to follow our model’s predictions such that valuations increase more and more as the initial probability of winning goes up. Next, we turn to studies designed to test for this convex pattern more thoroughly.
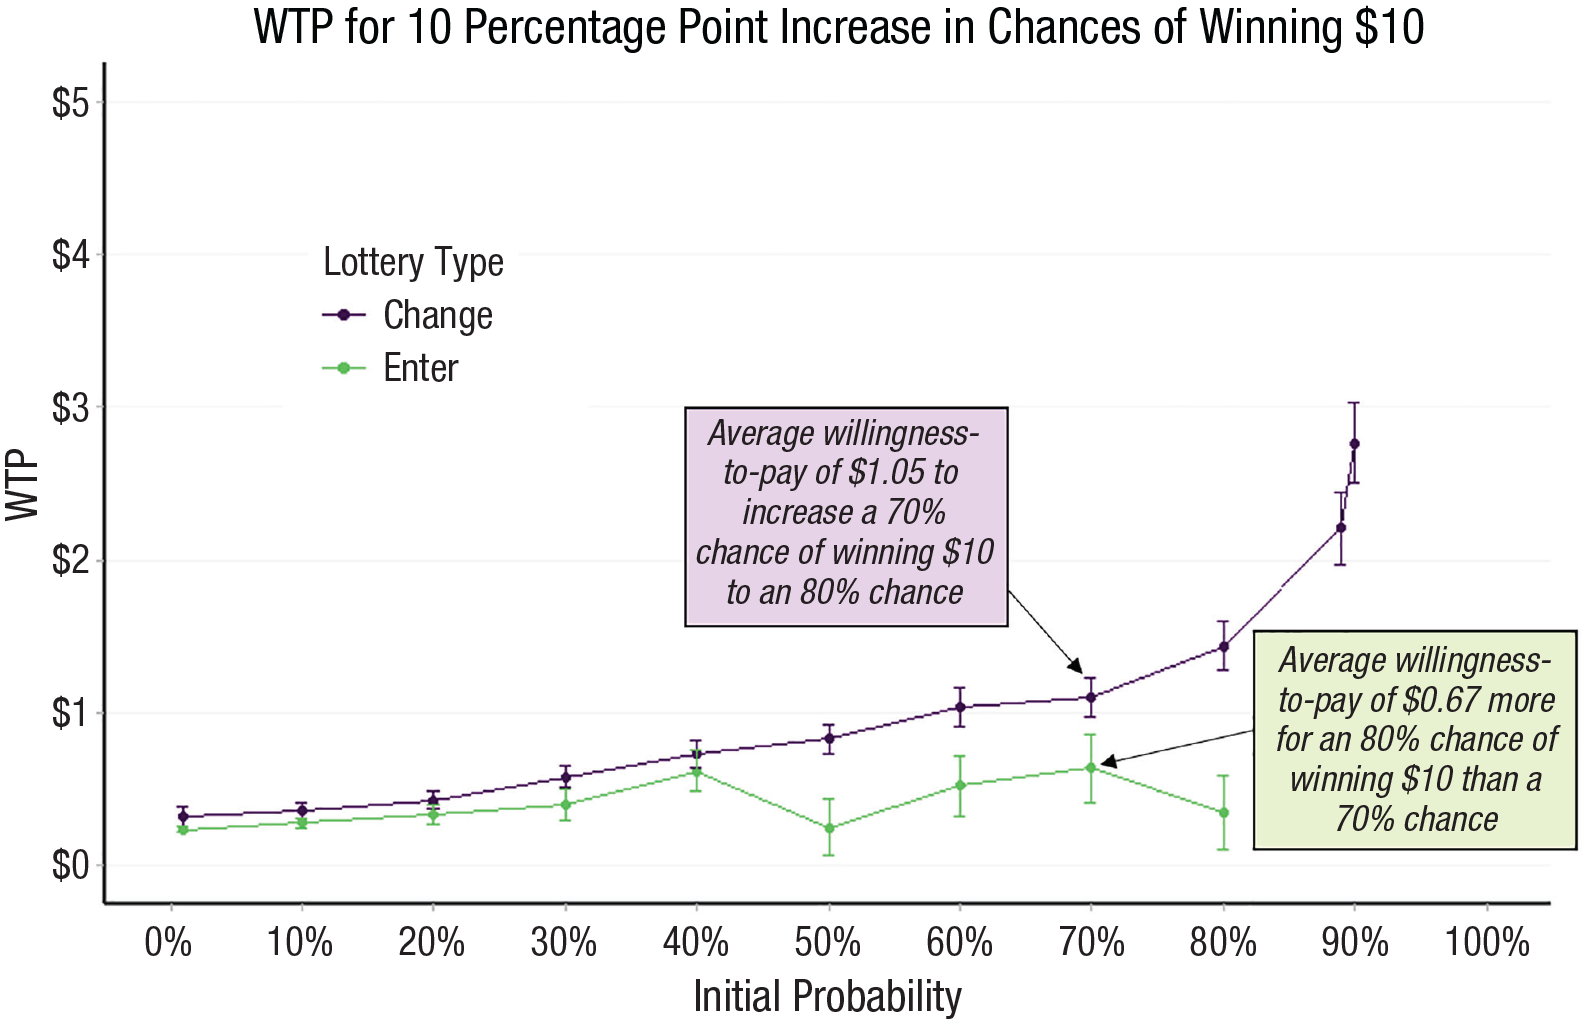
Mean WTP for 10-percentage-point increase in chances of winning $10. The graph illustrates participants’ mean WTP for explicit (purple line) and implied (green line) improvements in the pilot study. Error bars are ±1 SEs. WTP = willingness to pay.
Studies 1a Through 1g
Studies 1a through 1g all involved participants indicating their valuations of improvements, using a variety of stimuli, methods, and measures. We predicted that regardless of the elicitation method, number of trials, or probabilities sampled, a convex pattern of improvement valuations would emerge.
Method
In total, we conducted seven different studies—Studies 1a through 1g. Participants in Studies 1a through 1c, 1e, and 1g were Americans recruited on MTurk (using the Cloud Research-approved sample). Participants in Studies 1d and 1f were undergraduate students at the University of California, Berkeley. All studies consisted of a series of trials in which participants indicated their valuation of an improvement (e.g., “How much are you willing to pay to change a 50% chance of winning $10 to a 60% chance of winning $10?”). Between studies, we varied different features of the design (see Table 2). Depending on the study, participants completed between 16 and 43 trials. In each trial, participants had an initial probability of winning $5 or $10 (the specific amount varied across studies). Participants indicated how much they were willing to pay (or, in Study 1g, how many captchas they were willing to solve) to increase their chance of winning by 10 p.p. Some studies asked about a limited set of initial probabilities (e.g., initial probabilities from 10% to 90% in 10-p.p. increments), whereas others were more expansive (asking about 32 improvements, with many nonround initial probabilities). Outcomes of some studies were hypothetical, whereas others were fully incentive-compatible (via the Becker-DeGroot-Marschak procedure; Becker et al., 1964). Unlike the other studies, Study 1c also measured valuations of 5-p.p. increases. Results for these trials are reported in the Supplemental Material available online; these trials followed a similar convex pattern as the 10-p.p. increases. Participant demographic information for each of these studies is in the Supplemental Material, along with information on Supplemental Study 2. Supplemental Study 2 replicated the design of Studies 1a through 1g but with a much larger winning outcome (gaining $1,000) and a bad outcome which was a loss (losing $5). The results were similar to the results from Studies 1a through 1g.
Design and Features of Studies 1a Through 1g
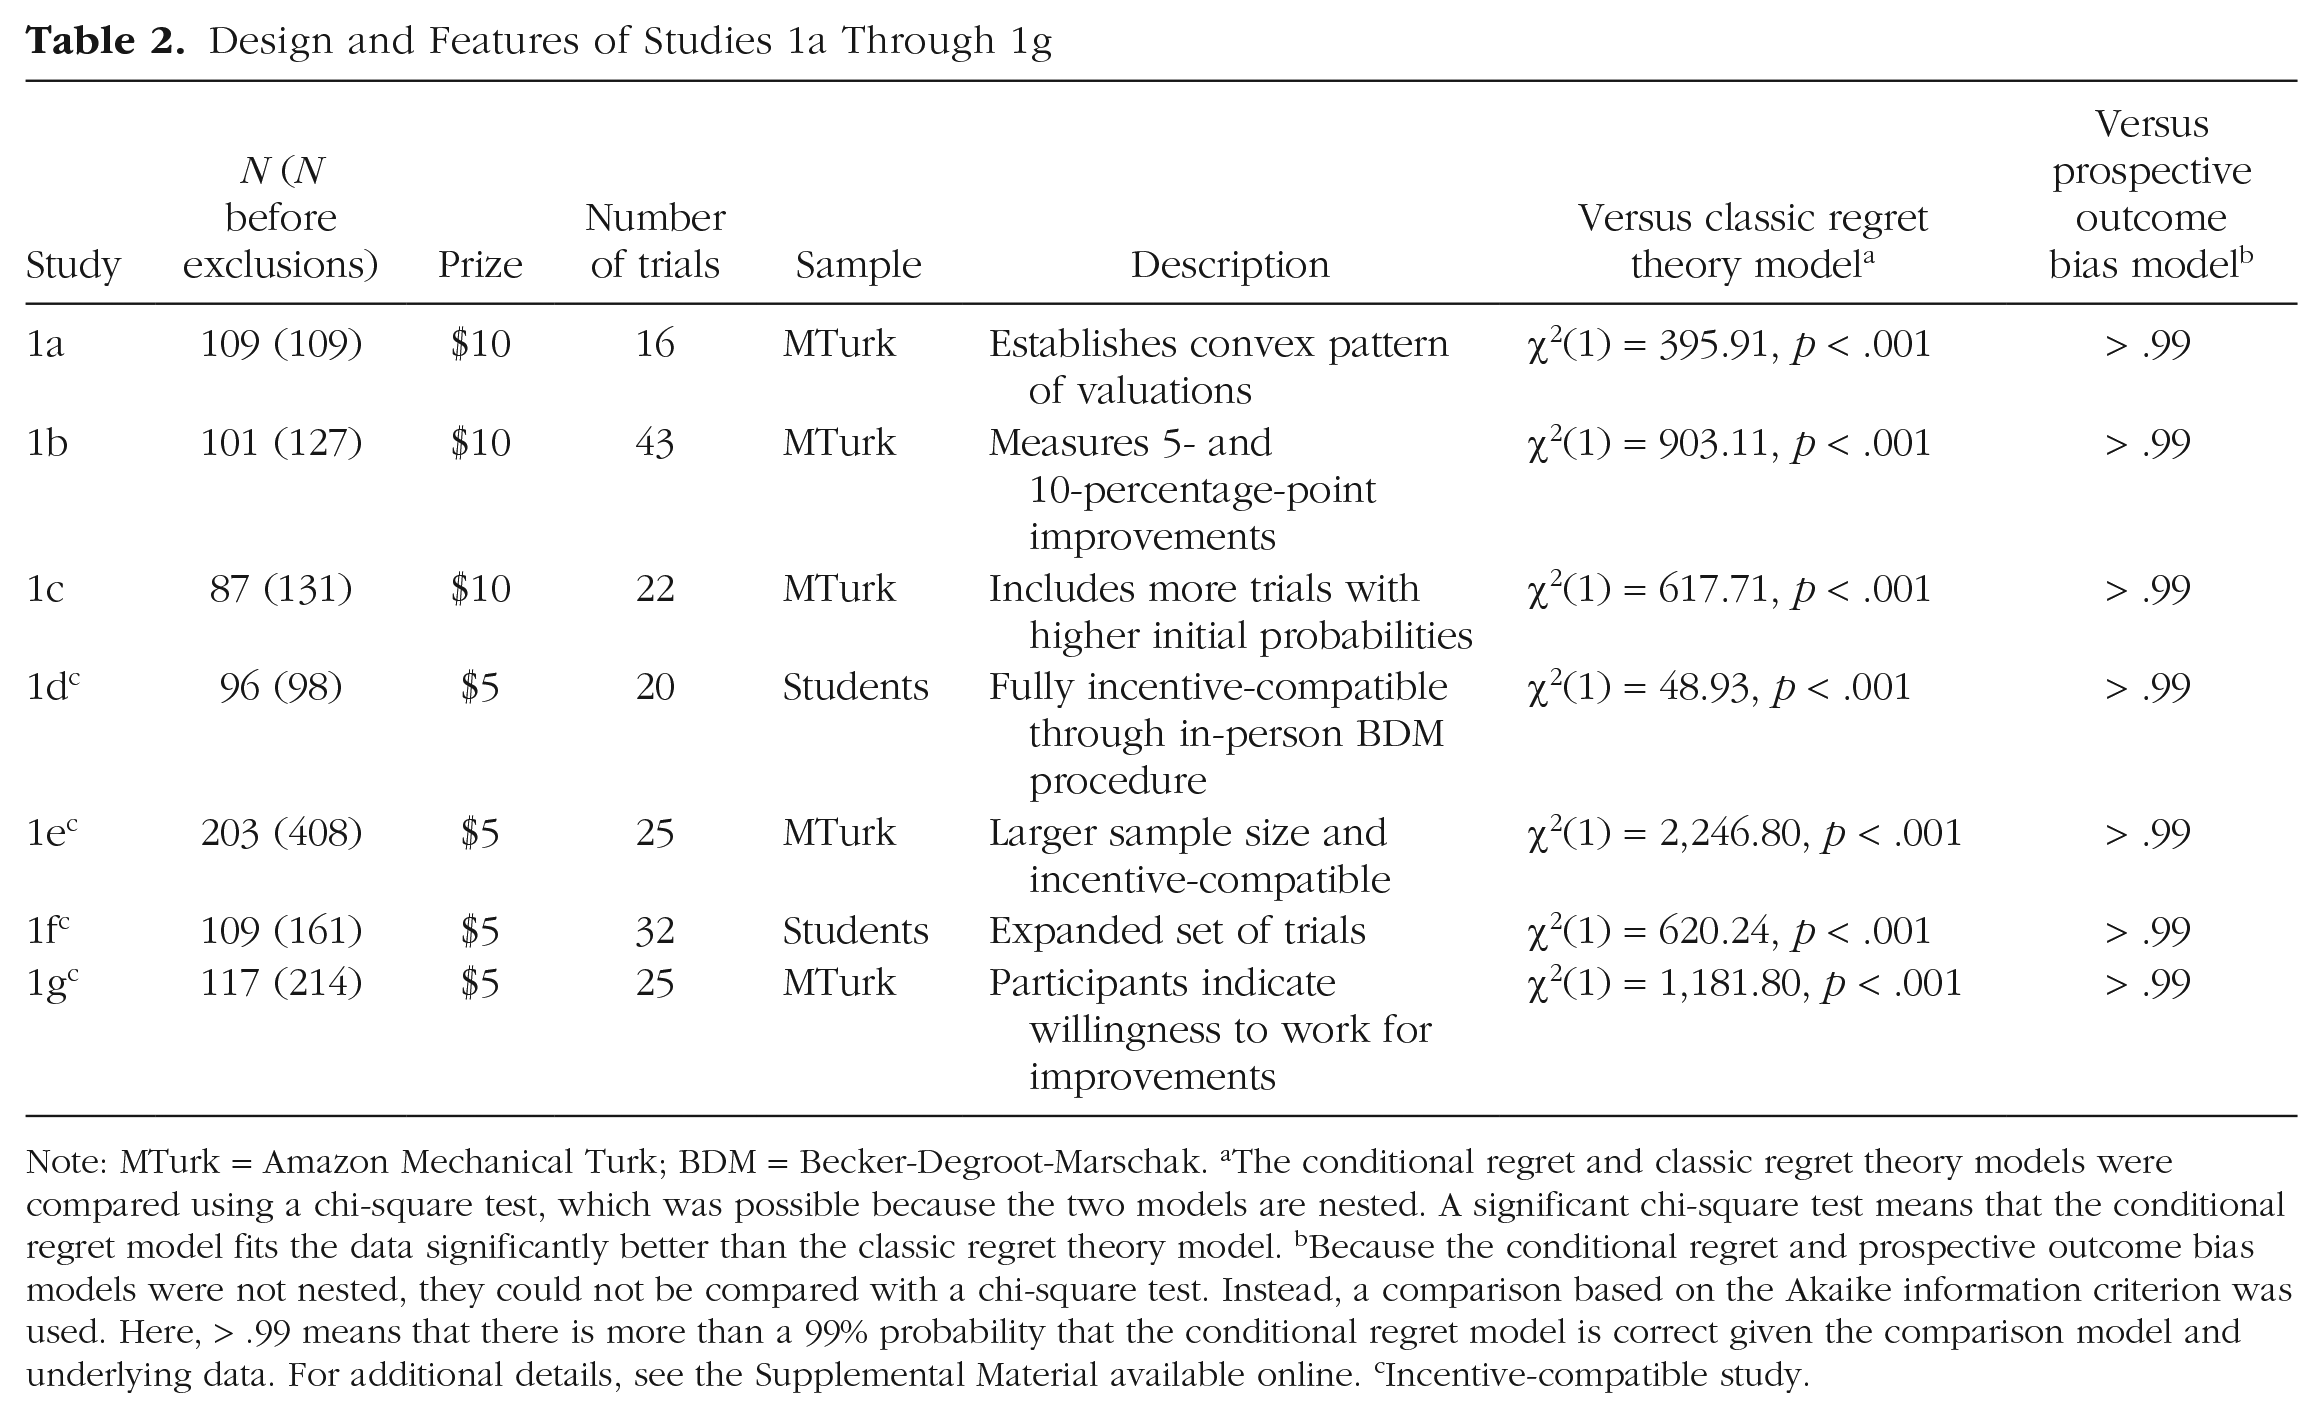
Note: MTurk = Amazon Mechanical Turk; BDM = Becker-Degroot-Marschak. aThe conditional regret and classic regret theory models were compared using a chi-square test, which was possible because the two models are nested. A significant chi-square test means that the conditional regret model fits the data significantly better than the classic regret theory model. bBecause the conditional regret and prospective outcome bias models were not nested, they could not be compared with a chi-square test. Instead, a comparison based on the Akaike information criterion was used. Here, > .99 means that there is more than a 99% probability that the conditional regret model is correct given the comparison model and underlying data. For additional details, see the Supplemental Material available online. cIncentive-compatible study.
We were concerned that participants might misunderstand the study instructions and give their valuation of the final lottery after the improvement was applied rather than the improvement itself. To prevent this misunderstanding, we used extremely strict (preregistered) exclusion criteria. All participants completed two attention-check trials in which the improvement gave no benefit (i.e., it was 0 p.p.). Participants who failed this check were excluded. Each study also included comprehension questions that asked participants to display an understanding of the consequences of their choices; participants who answered these questions incorrectly were also excluded. Analyses including all respondents—which are consistent with what we report in the main text—can be found in the Supplemental Material.
Results
Figure 4 presents participants’ mean willingness to pay for 10-p.p. improvements. The initial probability of winning each lottery is plotted along the x-axis. For example, the values at 60% represent participants’ mean willingness to pay to increase their chances of winning $10 from 60% to 70%. As hypothesized, when changes in chances begin to reduce the proportion of bad outcomes more dramatically, participants’ valuations of such chances rapidly increase. To test our hypothesis more formally, we compared a model that contained a predictor for the relative reduction in bad outcomes (which we call the “conditional regret model”) against models that follow from alternative theories (see Table 1). Specifically, we used mixed-effects linear regressions with random intercepts by participant and regressed willingness to pay onto the absolute size of the improvement. The conditional regret model added an additional predictor for the relative reduction in bad outcomes from the change, the prospective outcome bias model instead added an additional predictor for the final chances of winning after the change, and the model for regret theory and other alternate models had no additional predictors. In each study (i.e., Studies 1a–1g), the conditional regret model best fit the data (see Table 2). Of course, these model comparisons tell us only which model was best in predicting the valuations of the improvement decisions we studied. We are not arguing that prospect theory, or any of the other candidate theories, are inappropriate for predicting risky decision-making outside of improvement decisions. Full information on robustness checks—as well as additional model comparisons—can be found in the Supplemental Material.
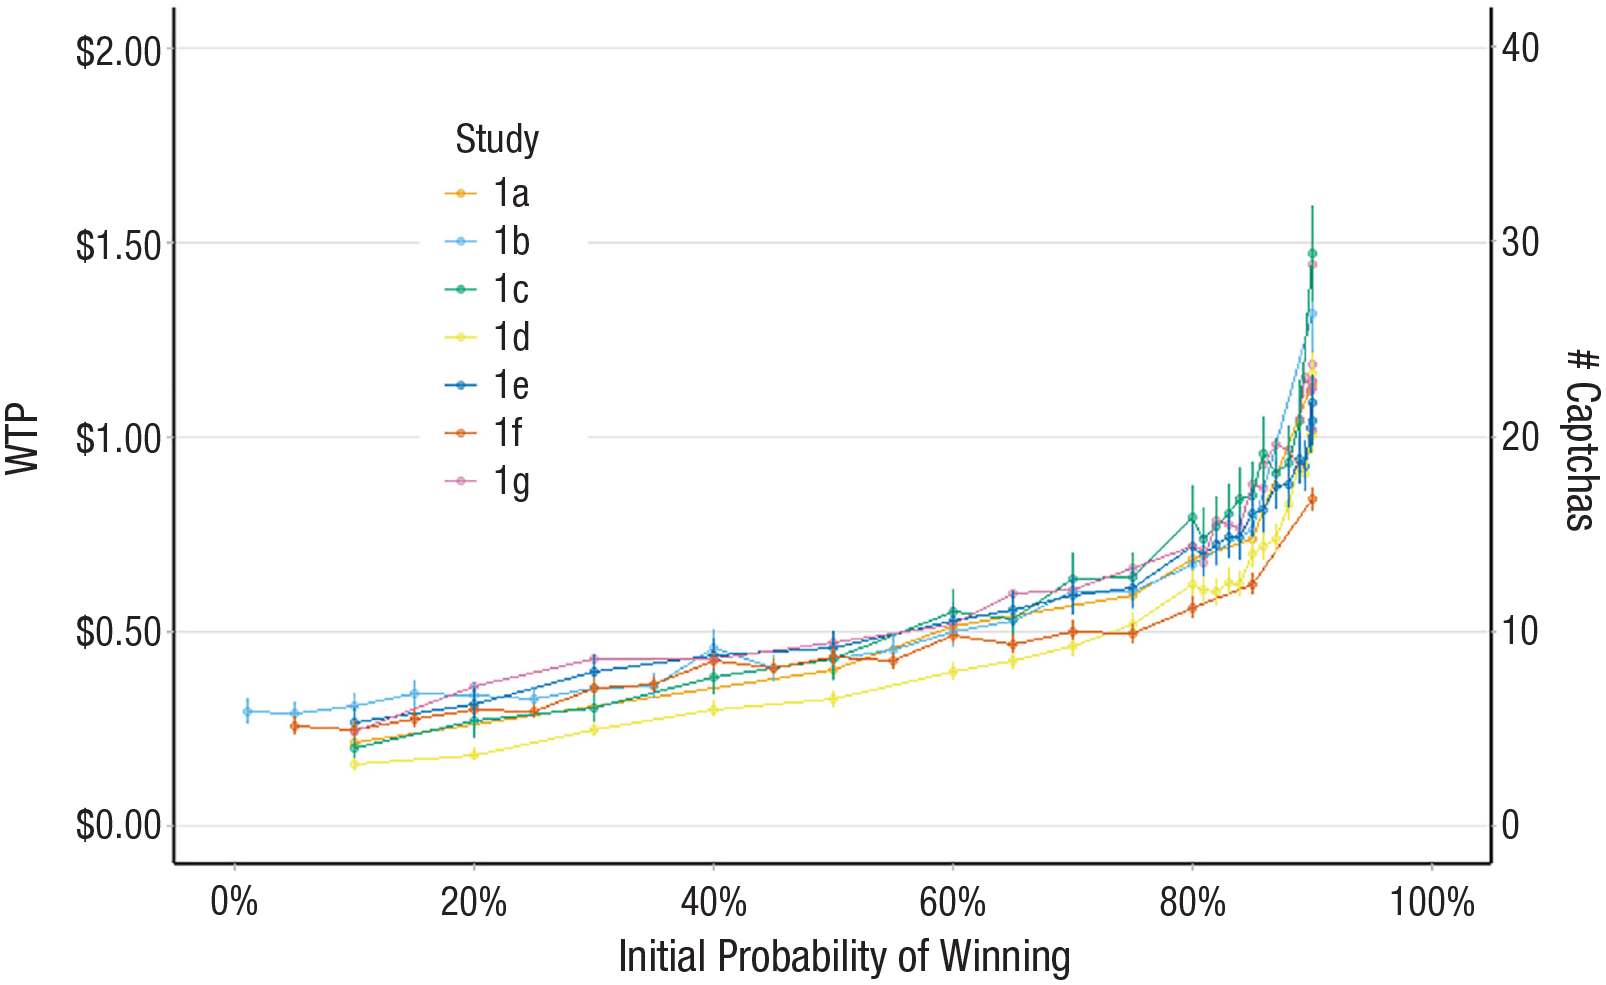
Mean WTP for a 10-percentage-point improvement in chances of winning. The graph illustrates participants’ mean WTP for a 10-percentage-point improvement by initial probability (Studies 1a–1f) and participants’ mean willingness to work (i.e., solve captchas) for a 10-percentage-point improvement by initial probability (Study 1g). Error bars are ±1 SEs. WTP = willingness to pay.
Moreover, the convex pattern depicted in Figure 4 is particularly notable when one considers that Studies 1a through 1g all used a fully within-subjects design. Specifically, many participants displayed very different valuations of the same (10-p.p.) improvements. For example, in Study 1d, all trials improved participants’ chances of winning $5 by 10 p.p. (i.e., an expected value of $0.50). However, participants demonstrated risk-averse behavior below initial probabilities of 60% (e.g., participants were willing to pay an average of $0.24; SE = $0.04 to change a 10% chance of winning $5 to a 20% chance) and risk-seeking behavior above initial probabilities of 60% (e.g., those same participants were willing to pay an average of $0.71; SE = $0.06 to change an 80% chance of winning $5 to a 90% chance). In other words, the same participants—within the same context and using the same measures—displayed both an affinity for and an aversion to identical risky improvements. Although scholars have questioned the notion that risk attitudes are a stable individual difference on the basis of work showing different risk attitudes within individuals across domains (e.g., a risky investor who is unwilling to go bungee jumping; Blais & Weber, 2006; but see also Frey et al., 2017), to our knowledge this is the first study showing the exact same individuals demonstrating both risk-seeking and risk-averse behavior within the exact same decision context (for a possible exception, however, see Frederick et al., 2018). Of course, this does not mean there are no individual differences in risk attitudes in general nor in our studies (for an analysis of individual heterogeneity, see the additional analysis of Study 1e in the Supplemental Material), it does, however, conflict with the notion that risk preferences are based only on individual differences (e.g., Cohen & Einav, 2007) or solely the result of an interaction between the decision context and individual differences (Frey et al., 2017; L’Haridon & Viedier, 2019).
If, as we hypothesize, people naturally focus on bad outcomes and anticipate how much regret they would feel if they decided to forgo an improvement, they should exhibit a convex pattern of valuations of improvements. Studies 1a through 1g used an array of methods and measures and found that people indeed follow this predicted convex pattern. However, we did not directly test the hypothesized conditional regret-based process that creates this pattern. Studies 2a and 2b were used as tests of this underlying mechanism.
Study 2a
Study 2a’s framing manipulation tested our theory’s assumption that people naturally focus on the relative proportion of bad outcomes eliminated by an improvement.
Method
We recruited 2,421 Americans from Prolific (Mage = 33.0 years; 49% female, 49% male, 2% did not respond) in exchange for payment. We excluded 91 participants from the analyses for failing a preregistered attention check. Participants were randomly assigned to one of six between-subjects conditions in a 2 (initial probability: 20% or 80%) × 3 (frame: neutral, proportional increase, proportional decrease) full-factorial design. In the 20% (80%) initial-probability condition, participants read that they had a 20% (80%) chance of winning $10 and that they had the opportunity to increase their chances of winning by 10 p.p. (for a stylized depiction of the instructions, see Fig. 5). In all conditions, participants used a $0 to $3 slider to indicate their willingness to pay to increase their winning chances.
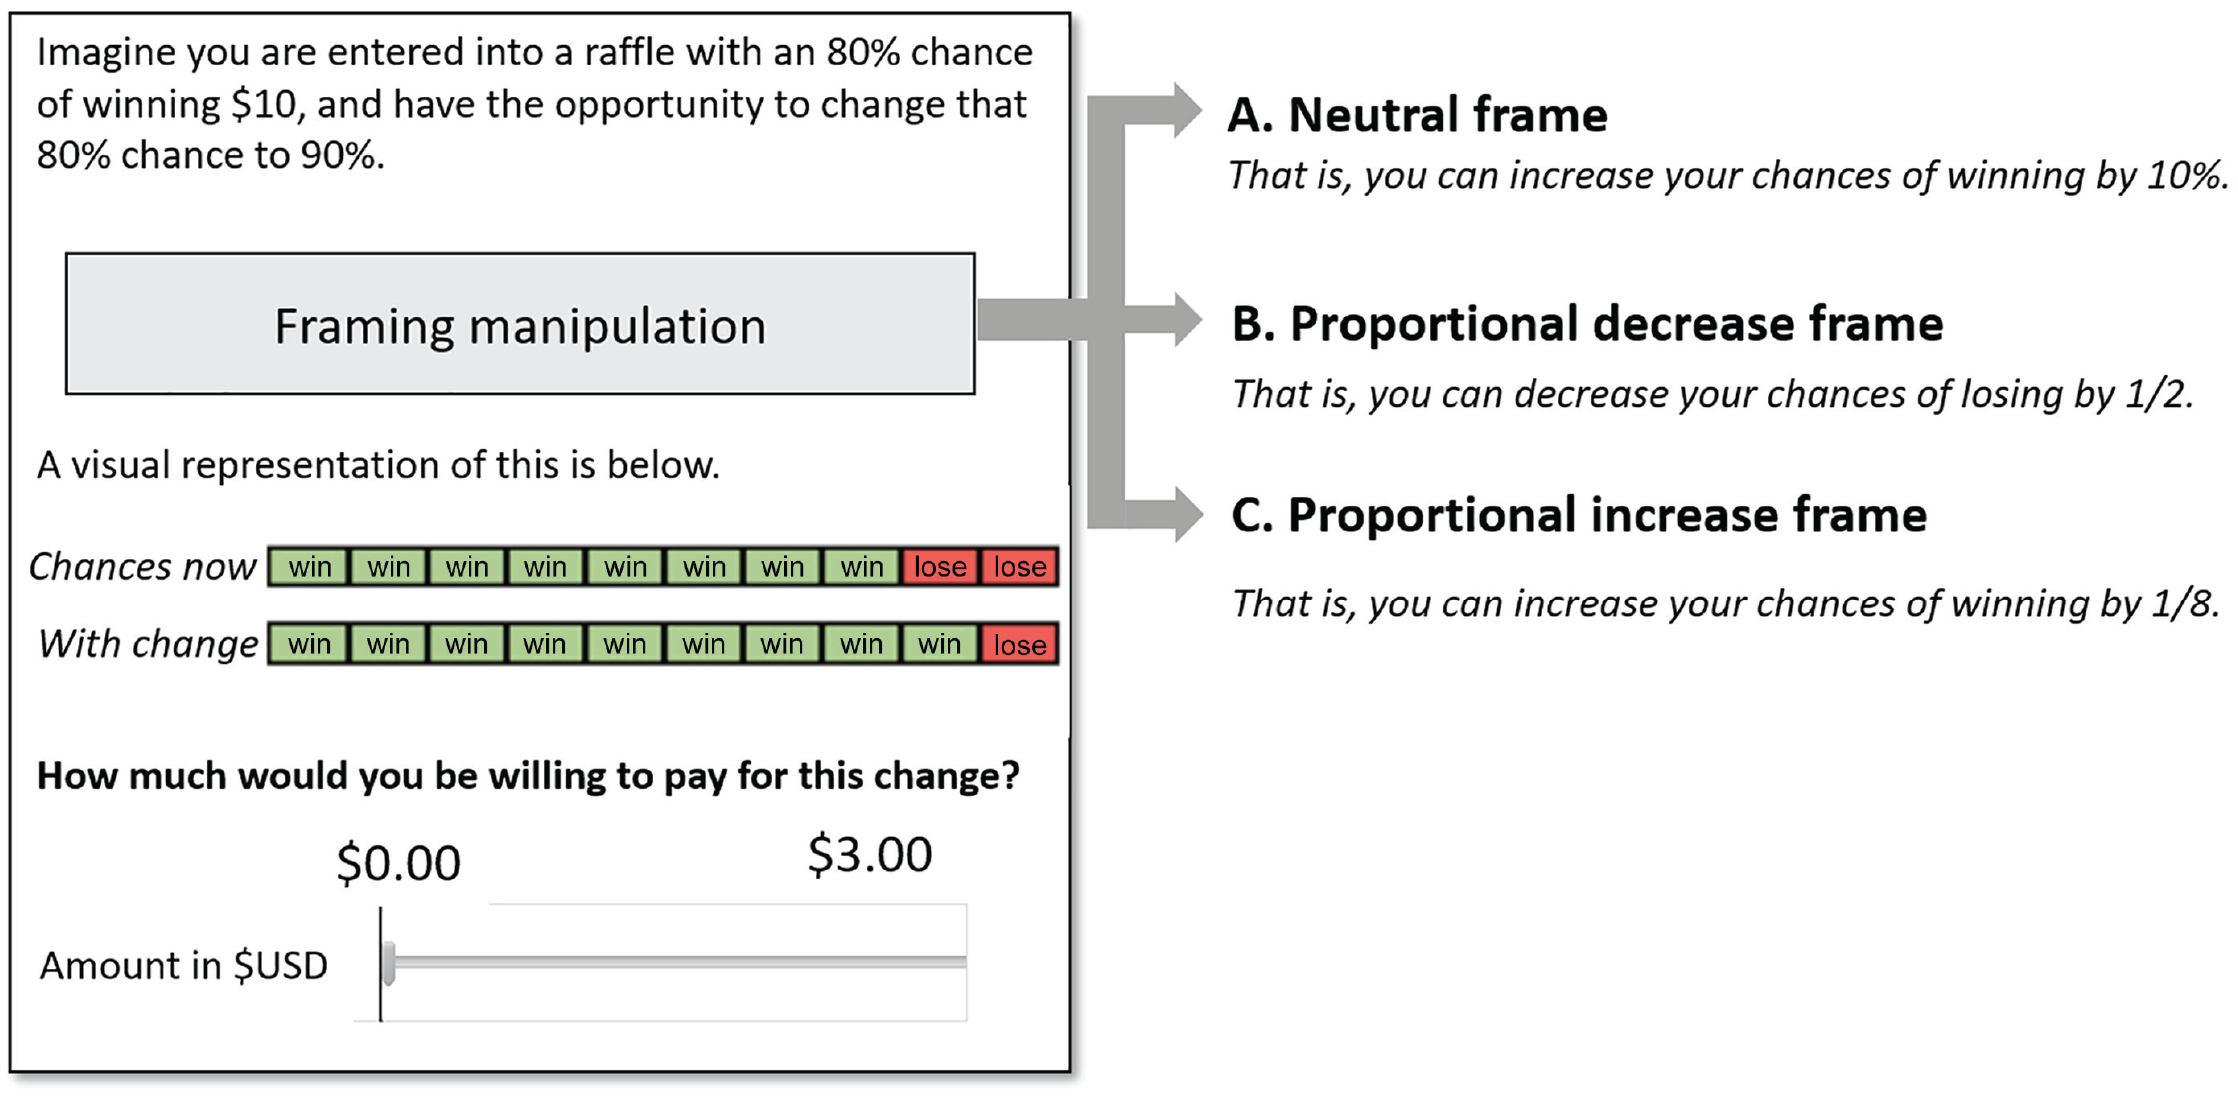
Information presented by condition: Study 2a.
The frame manipulation varied how the improvement was presented to participants. In the neutral condition participants were presented with the improvement depicted solely in terms of percentage points. If people naturally focus on bad outcomes when considering improvements, a framing manipulation that draws attention to bad outcomes should minimally affect valuations of improvements relative to this neutral frame. To test this, in the proportional-decrease condition, participants read that a 10-p.p. improvement would decrease their chances of losing by 1/2 (in the 80% condition) or 1/8 (in the 20% condition). In contrast, a framing manipulation that draws attention to good outcomes should attenuate—or even reverse—the bias we have documented thus far. Thus, in the proportional-increase condition, participants read that a 10-p.p. improvement would increase their chances of winning by 1/8 (in the 80% condition) or 1/2 (in the 20% condition).
Results
We submitted participants’ willingness to pay to a 2 (initial probability: 20% or 80%) × 3 (frame: neutral, proportional increase, proportional decrease) analysis of variance (ANOVA). This revealed a main effect of initial probability, F(1, 2324) = 20.05, p < .001,
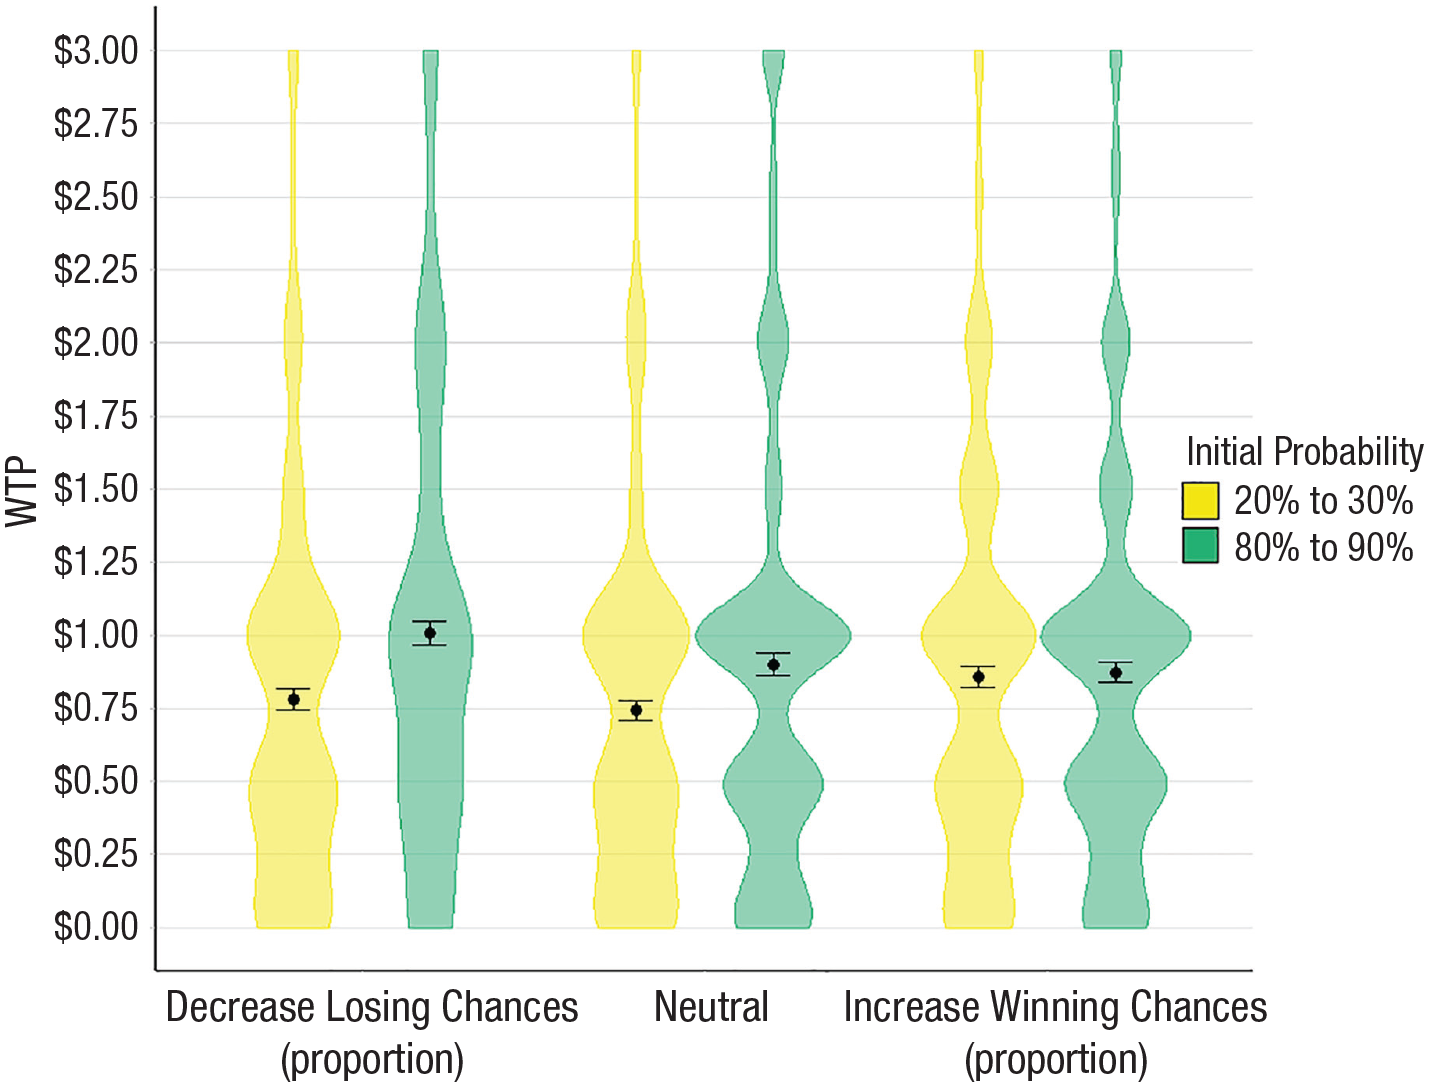
Mean WTP to improve chances by 10 percentage points. Points show participants’ mean WTP to change their chances of winning a given lottery by 10 percentage points in Study 2a. The violin plot outlines illustrate the estimated probability density (i.e., the width at each point reflects the proportion of the data there). Error bars are ±1 SEs. WTP = willingness to pay.
In the neutral condition, participants were willing to pay more to change an 80% chance of winning $10 to a 90% chance (M = $0.90, SD = $0.75) than to change a 20% chance of winning $10 to a 30% chance (M = $0.74, SD = $0.66), t(804) = 3.17, p = .002, d = 0.22, 95% confidence interval (CI) = [0.08, 0.36]. This pattern also appeared in the proportional-decrease condition. When improvements were framed in terms of the relative reduction in losing outcomes, participants valued changing the 80% chance to a 90% chance (M = $1.01, SD = $0.79) more than they valued changing the 20% chance to a 30% chance (M = $0.78, SD = $0.69), t(762) = 4.15, p < .001, d = 0.30, 95% CI = [0.16, 0.44]. Crucially, there was no significant interaction between the neutral and proportional-decrease conditions, F(1, 1566) = 0.80, p = .371,
However, as the rightmost bars in Figure 6 reveal, the proportional-increase condition produced a different pattern of results. In this condition, there was no difference in valuations between the 20% (M = $0.86, SD = $0.69) and 80% (M = $0.87, SD = $0.67) initial-probability gambles, t(748) = 0.28, p = .780, d = 0.02, 95% CI = [−0.12, 0.16]. This attenuation was confirmed by a significant interaction between the neutral and proportional-increase conditions, F(1, 1562) = 4.21, p = .040,
In sum, although a manipulation that prompted participants to consider the relative reduction in bad outcomes did not significantly alter the effect of the initial probability on valuations of improvements, a parallel manipulation that instead prompted participants to consider good outcomes eliminated this effect. This pattern is consistent with people naturally evaluating improvements by focusing on the relative reduction in bad outcomes.
Study 2b
Study 2b served as another test of process. Regret is an emotion people experience when they believe their outcomes would have been better had they acted differently. Thus, decisions that are more important or more consequential typically result in greater regret. If regret underlies the bias in improvement decisions we document, making a decision’s outcomes more impactful should amplify these effects—a prediction unique to a regret-based phenomenon. Alternatively, if the biases we document are due to System 1 processing, making outcomes more impactful should instead attenuate the effect through increased motivation and/or deliberation (e.g., Chaiken, 1980).
Method
We recruited 1,607 Americans from MTurk (Mage = 38.2, 52% female, 47% male, 1% nonbinary). We excluded 19 participants who failed a preregistered attention check. All participants were randomly assigned to one of four between-subjects conditions in a 2 (initial probability: 60% or 10%) × 2 (consequences: mild or severe) full-factorial design.
Participants began by reading that they had the opportunity to purchase a pill that would reduce their risk of getting a seasonal cold (a negative potential outcome unlike the previous studies). Our first manipulation varied participants’ initial probability of catching the cold. In the 60% (10%) initial-probability condition, participants read that they had a 60% (10%) chance of catching the cold and that if they purchased and consumed the pill they would instead have a 50% (1%) chance of getting the cold.
A second manipulation varied the consequences of catching the cold. The cold’s symptoms were described to participants as being either mild (and lasting 1 week) or severe (and lasting 3 weeks). After reading about the cold, the likelihood of catching it, and the pill (for a stylized depiction of the instructions, see Fig. 7), participants provided their willingness to pay for the pill. Willingness to pay was elicited on a slider scale ranging from $0 to $100. Participants also completed a series of exploratory measures that asked how much regret they would anticipate experiencing if they did not purchase the pill and did catch the cold. We discuss these measures in complete detail in the Supplemental Material.
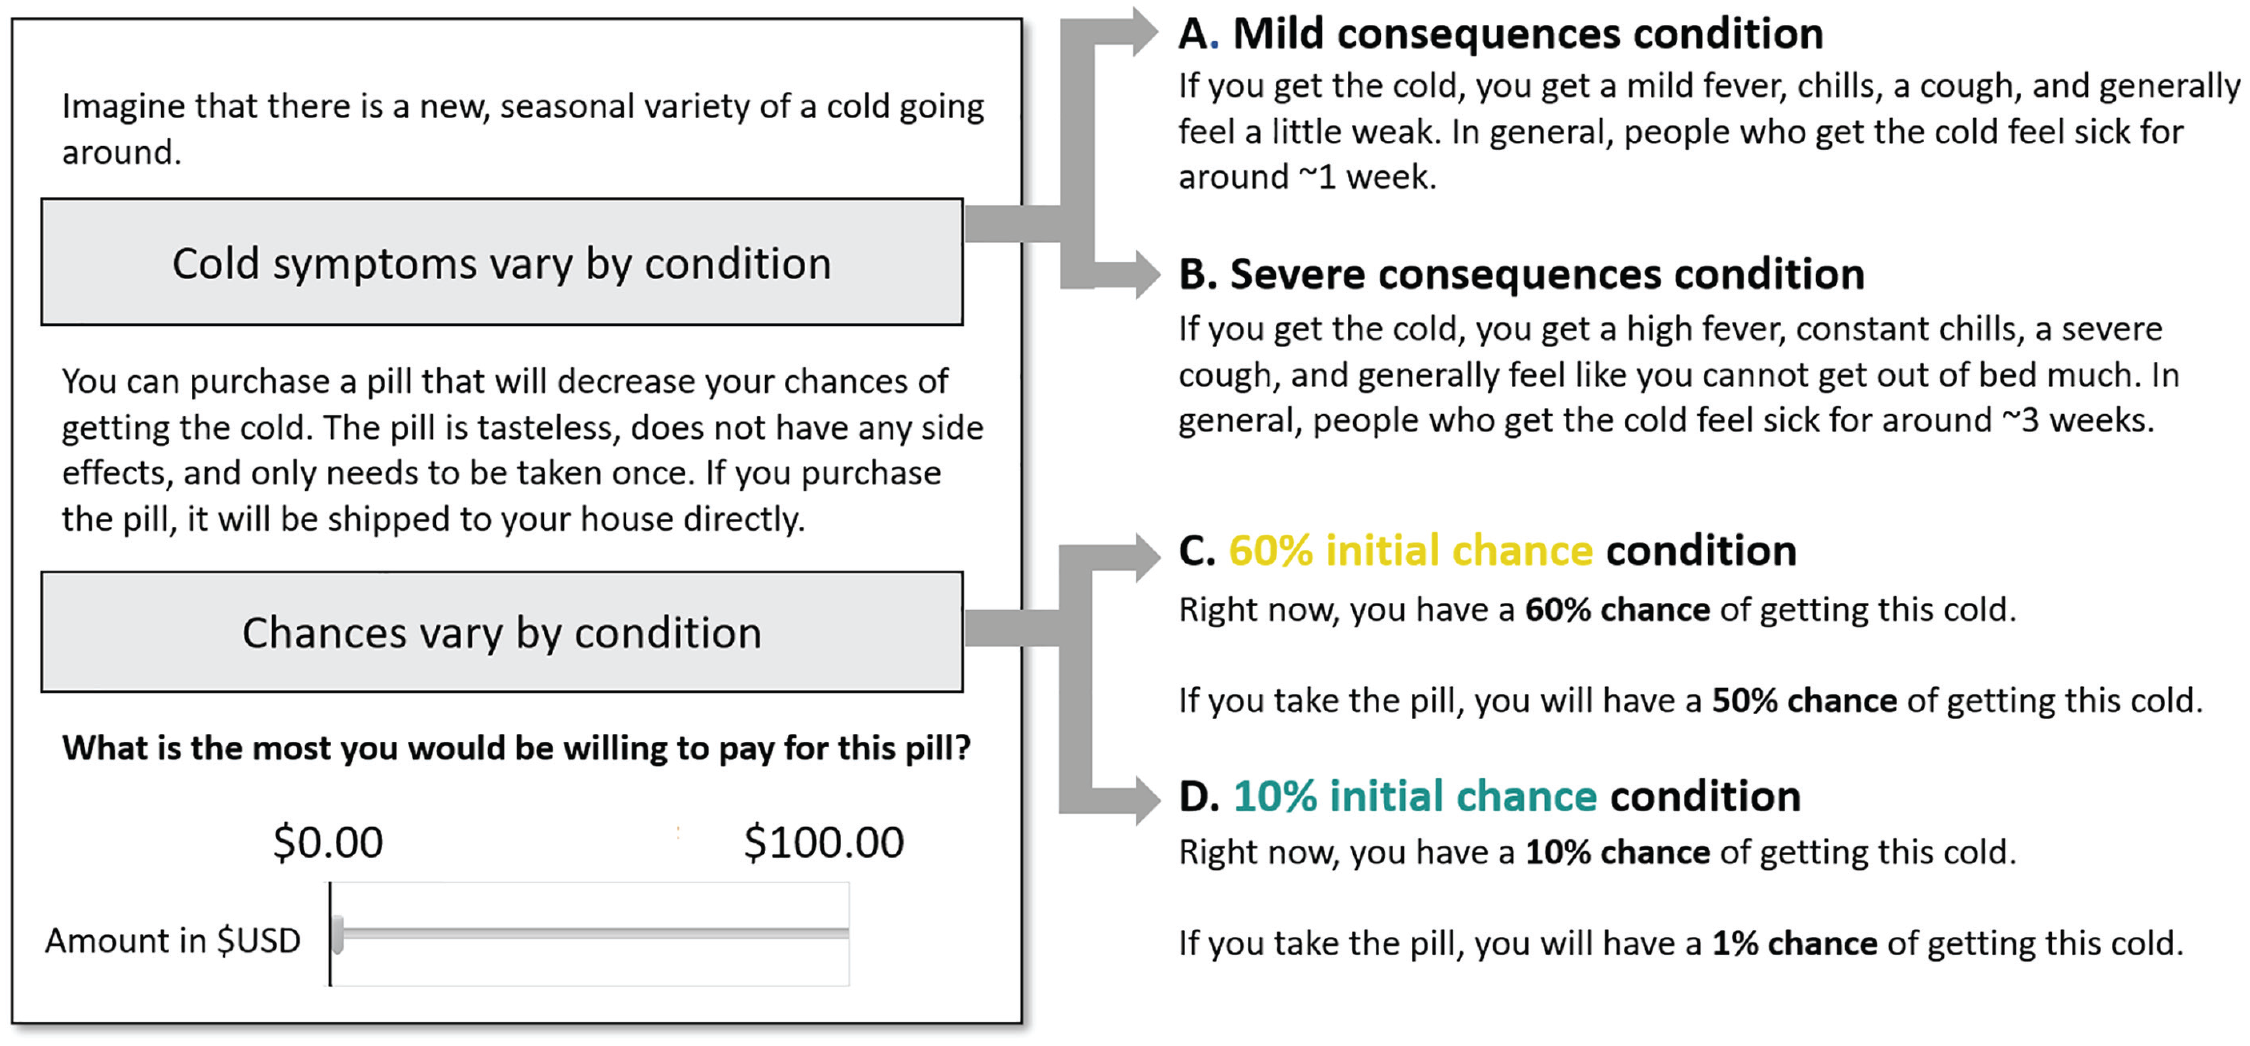
Information presented by condition: Study 2b.
Results
We submitted participants’ willingness to pay for the pill to a 2 (initial probability: 60% chance or 10% chance) × 2 (consequences: severe or mild) ANOVA. This revealed an expected main effect of consequences, F(1, 1584) = 57.51, p < .001,
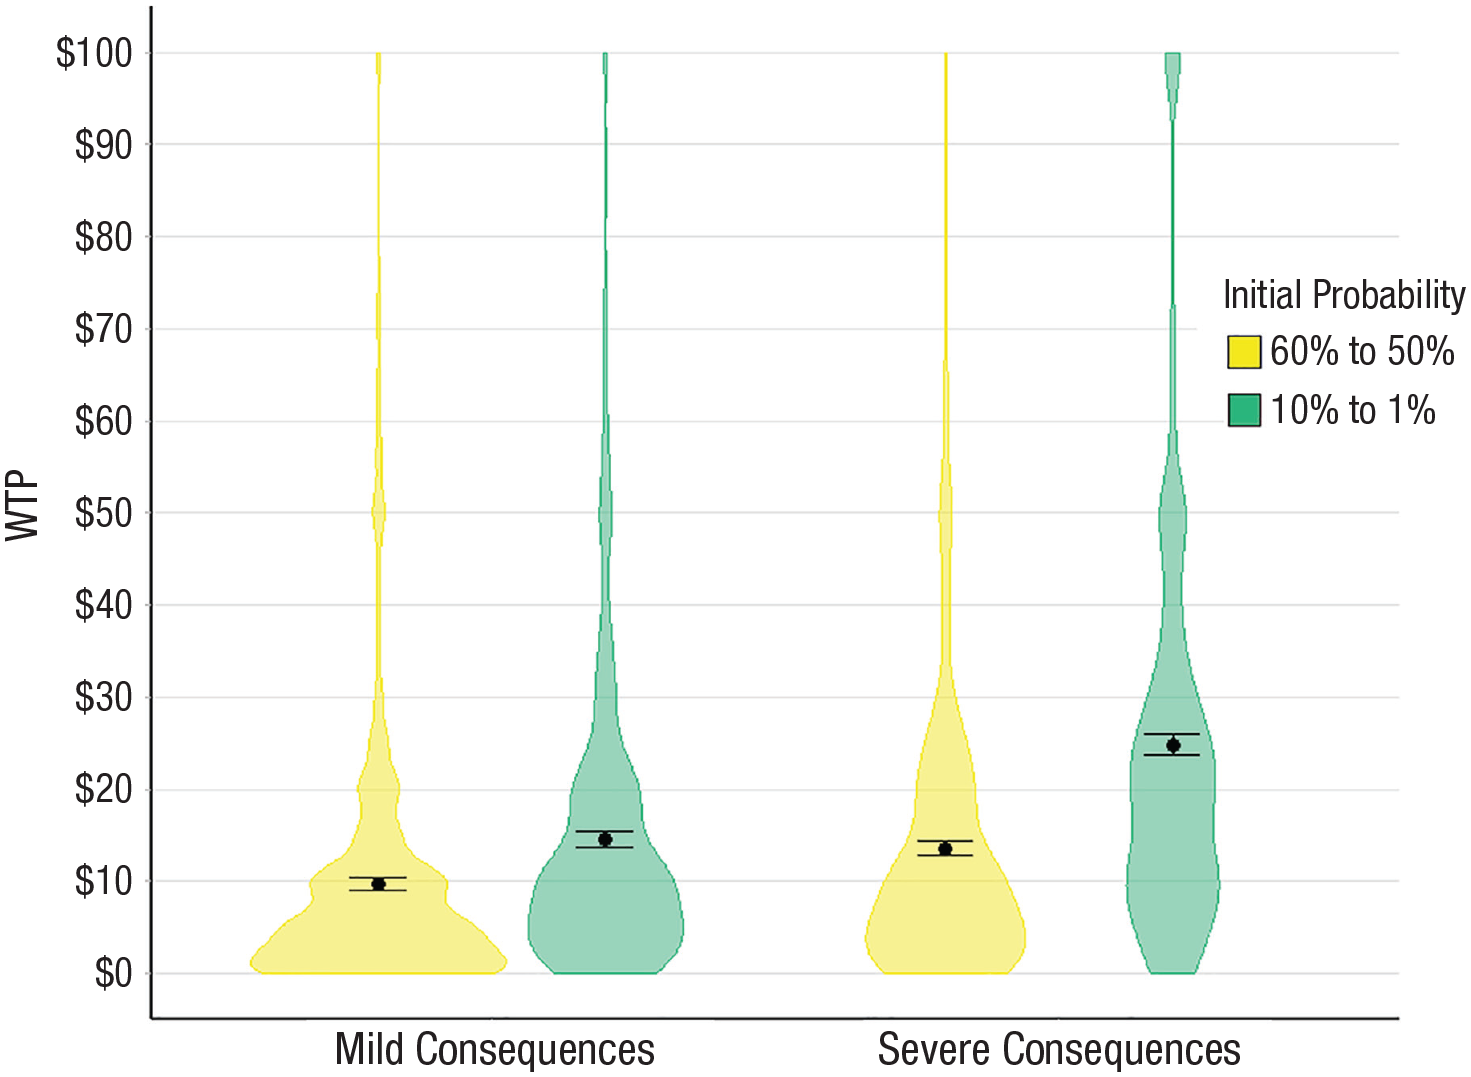
Mean WTP for a pill to reduce chances of catching a cold. Points show mean WTP for a pill that would decrease participants’ chances of catching a cold in Study 2b. The violin plot outlines illustrate the estimated probability density (i.e., the width at each point reflects the proportion of the data there). Error bars are ±1 SEs. WTP = willingness to pay.
Study 2b found that increasing the severity of a bad outcome increased the extent to which participants were sensitive to the relative reduction in bad outcomes. In addition, exploratory analyses—detailed in the Supplemental Material—highlight how Study 2b’s measures of anticipated regret followed a similar interaction pattern as the willingness-to-pay measures in Figure 8. Taken together, these patterns are consistent with our suggestion that participants value improvements by considering the extent to which they would regret realizing a bad outcome.
In sum, Studies 1a through 2b found that people value improvements more when they are tethered to higher probabilities than lower probabilities. This fact implies that people may choose objectively inferior improvements over better alternatives. In Study 3 we tested for these potential effects on choice.
Study 3
The convex function of valuations implies that decision makers may prefer smaller improvements to high initial-probability outcomes over more substantial improvements to low initial-probability outcomes. Study 3 tested for such suboptimal choices. In addition, Study 3 examined how experts and nonexperts choose between improvements inside and outside their domain of expertise. Typically, expertise is thought to improve decision-making (Kahneman & Klein, 2009); experts are assumed to be more motivated and deliberative than laypeople (Ericsson et al., 1993). However, because the bias we document is unlike typical System 1 biases, it is possible that the additional experience of experts may not alleviate this bias. Expertise could even exacerbate it, if, for example, experts view decisions in their domain as more consequential and thus feel the regret underlying this bias more acutely, paralleling Study 2b.
Method
Study 3 consisted of three waves. In each wave, we recruited a separate sample of participants. We recruited 198 medical professionals (e.g., nurses/doctors; Mage = 40.8 years; 78% female, 21% male, 1% nonbinary), 198 gig workers (e.g., Uber/DoorDash drivers; Mage = 33.6 years; 42% female, 55% male, 3% nonbinary), and 301 lay participants (Mage = 35.1 years; 47% female, 50% male, 3% nonbinary). The medical professionals and gig workers were recruited by Qualtrics panels, and the lay participants were Americans recruited through Prolific, all in exchange for payment. We excluded 192 participants who failed preregistered comprehension checks (113 medical professionals, 30 gig workers, and 49 lay participants). Across all three waves of data collection, all participants made choices in seven different domains (see Table 3); in each domain, participants completed four choice trials. The order in which participants saw the domains was randomized, and within each domain, the order of the four trials was randomized. This feature of the design allowed us to directly compare experts’ and nonexperts’ choices in a given domain.
Domains and Choice Scenarios Presented to Participants in Study 3
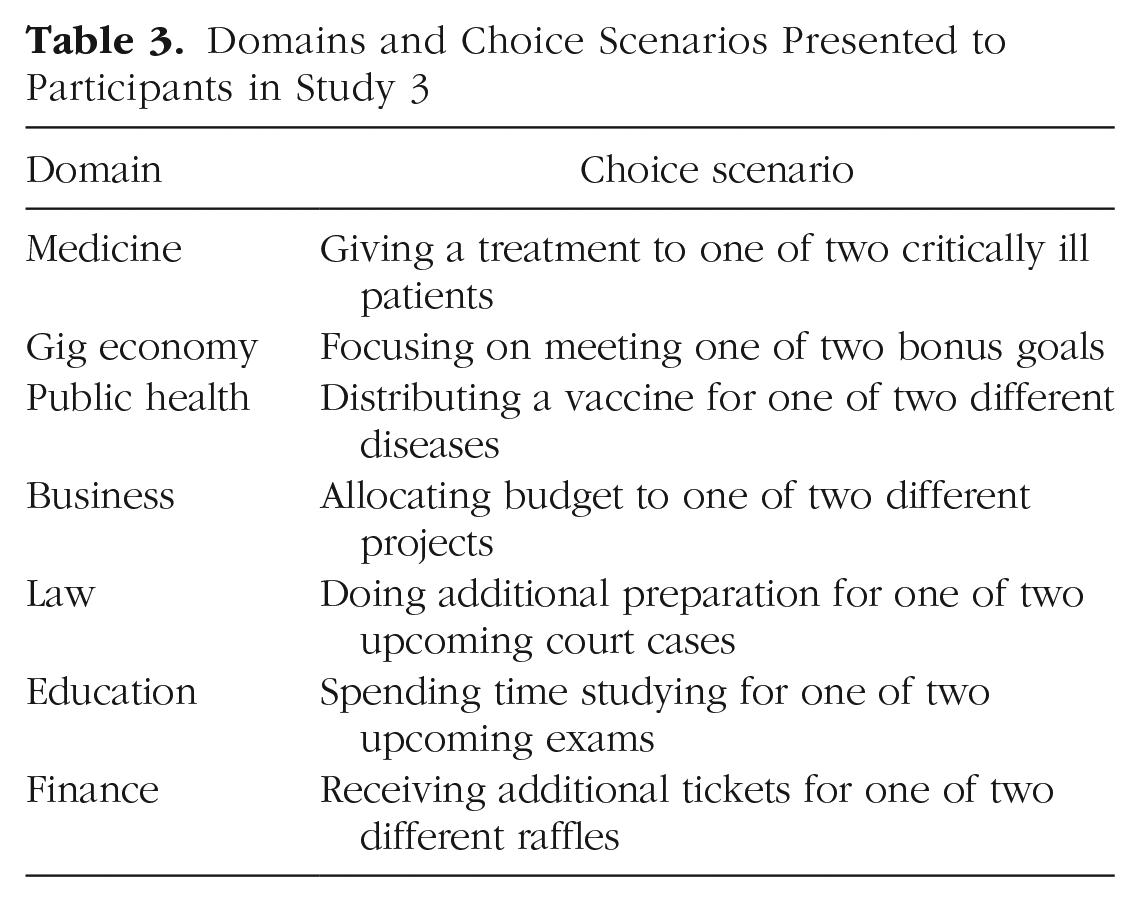
Each trial presented participants with two options. Both options had some initial probability of success, and participants had to choose which option to improve. Within each domain, there was one control trial and three different experimental trials. Figure 9 gives a stylized depiction of the information shown to participants in each condition.
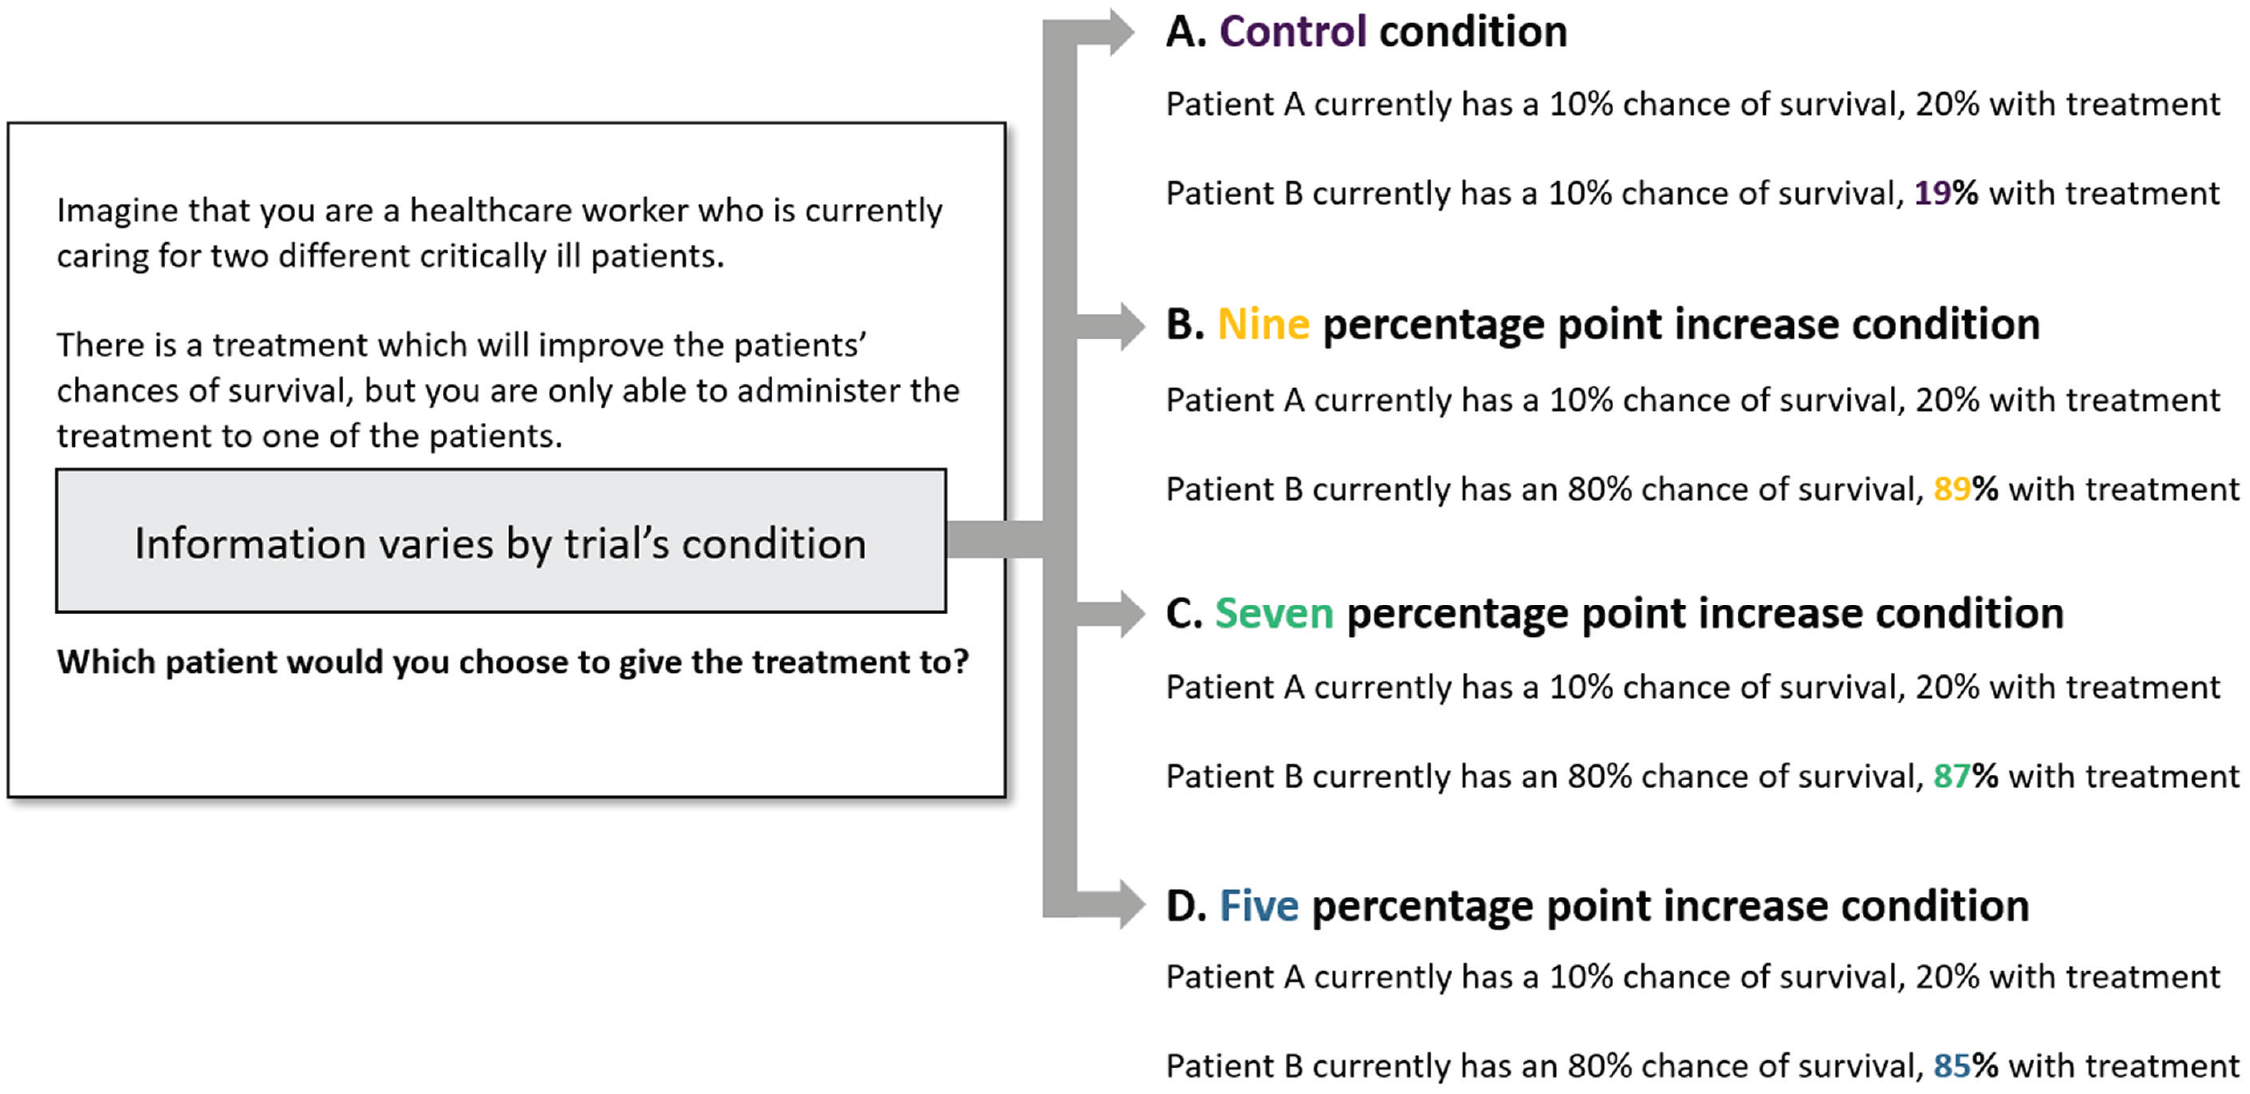
Information presented by condition: Study 3.
In the control trials, one option always corresponded with a higher absolute and relative improvement. For example, a control trial in the medical domain presented participants with two patients, both of whom initially had a 10% chance of survival. Participants had to select which patient they would prioritize treating. If they selected the first patient, that patient’s chances of survival would improve from 10% to 20%; if they selected the second patient, that patient’s chances of survival would improve from 10% to 19% (see Fig. 9, Branch A; the order in which options were listed was counterbalanced between participants). In this way, all of the control trials presented participants with a clearly superior improvement—going from 10% to 20% is both a larger absolute increase in chances than the alternative (10 vs. 9 p.p.) and leads to a larger relative reduction in bad outcomes (11% vs. 10% eliminated). Thus, the control trials served as a benchmark. We expected the vast majority of participants to prefer the superior improvement to the inferior alternative.
The experimental trials had a slightly different structure. Just as with the control trials, participants saw two options and had to choose which option to improve. However, unlike the control trials, one option in the experimental trials always corresponded with a larger absolute increase in chances, whereas the other option led to a larger relative reduction in bad outcomes (see Fig. 9, Branch B). This design allowed us to test whether participants’ sensitivity to the relative reduction in bad outcomes might lead to suboptimal choices. If medical decisions are made with an eye toward maximizing the number of lives saved, improving a patient’s chances of survival from 10% to 20% is—all else equal—a more optimal decision than improving a patient’s chances of survival from 80% to 89% (a 10- vs. 9-p.p. improvement). However, we expected that many participants in these experimental trials would choose the smaller improvements—for example, 80% to 89%—which correspond with a greater relative reduction in bad outcomes (11% vs. 45% eliminated).
There were three types of experimental trials. The three types of trials varied whether the smaller improvement was 9, 7, or 5 p.p. (see Fig. 9, Branches B–D). This feature allowed us to test whether participants would prefer improvements that led to larger relative reductions in bad outcomes even when these improvements were vastly inferior.
At the end of the survey, all participants completed two comprehension-check questions asking them to correctly identify the consequences of their choices, as well as several professional and demographic questions (for complete details, see the Supplemental Material).
Results
Results for all participants across the entire range of domains and trials are shown in Figure 10. For the control trials, there was a clear (and unsurprising) pattern; participants overwhelmingly preferred the superior improvements. That is, only approximately 5% of participants preferred the smaller improvements to the larger ones (see purple bars in Fig. 10). However, in the experimental trials, participants frequently made suboptimal choices: 56% of participants chose the smaller improvement in the 9-p.p. trials (see yellow bars in Fig. 10). To more formally test this, we conducted a linear mixed-effects model predicting choice of the smaller improvement from the trial (either the control or the 9-p.p. experimental trial) with random intercepts by participant. This model revealed that participants were significantly more likely to choose the lower absolute-value option in the 9-p.p. condition relative to the control condition, β = 0.52, t(6,564) = 60.00, p < .001, d = 1.35, 95% CI = [1.30, 1.40], an effect that remained robust with alternate specifications (see the Supplemental Material).
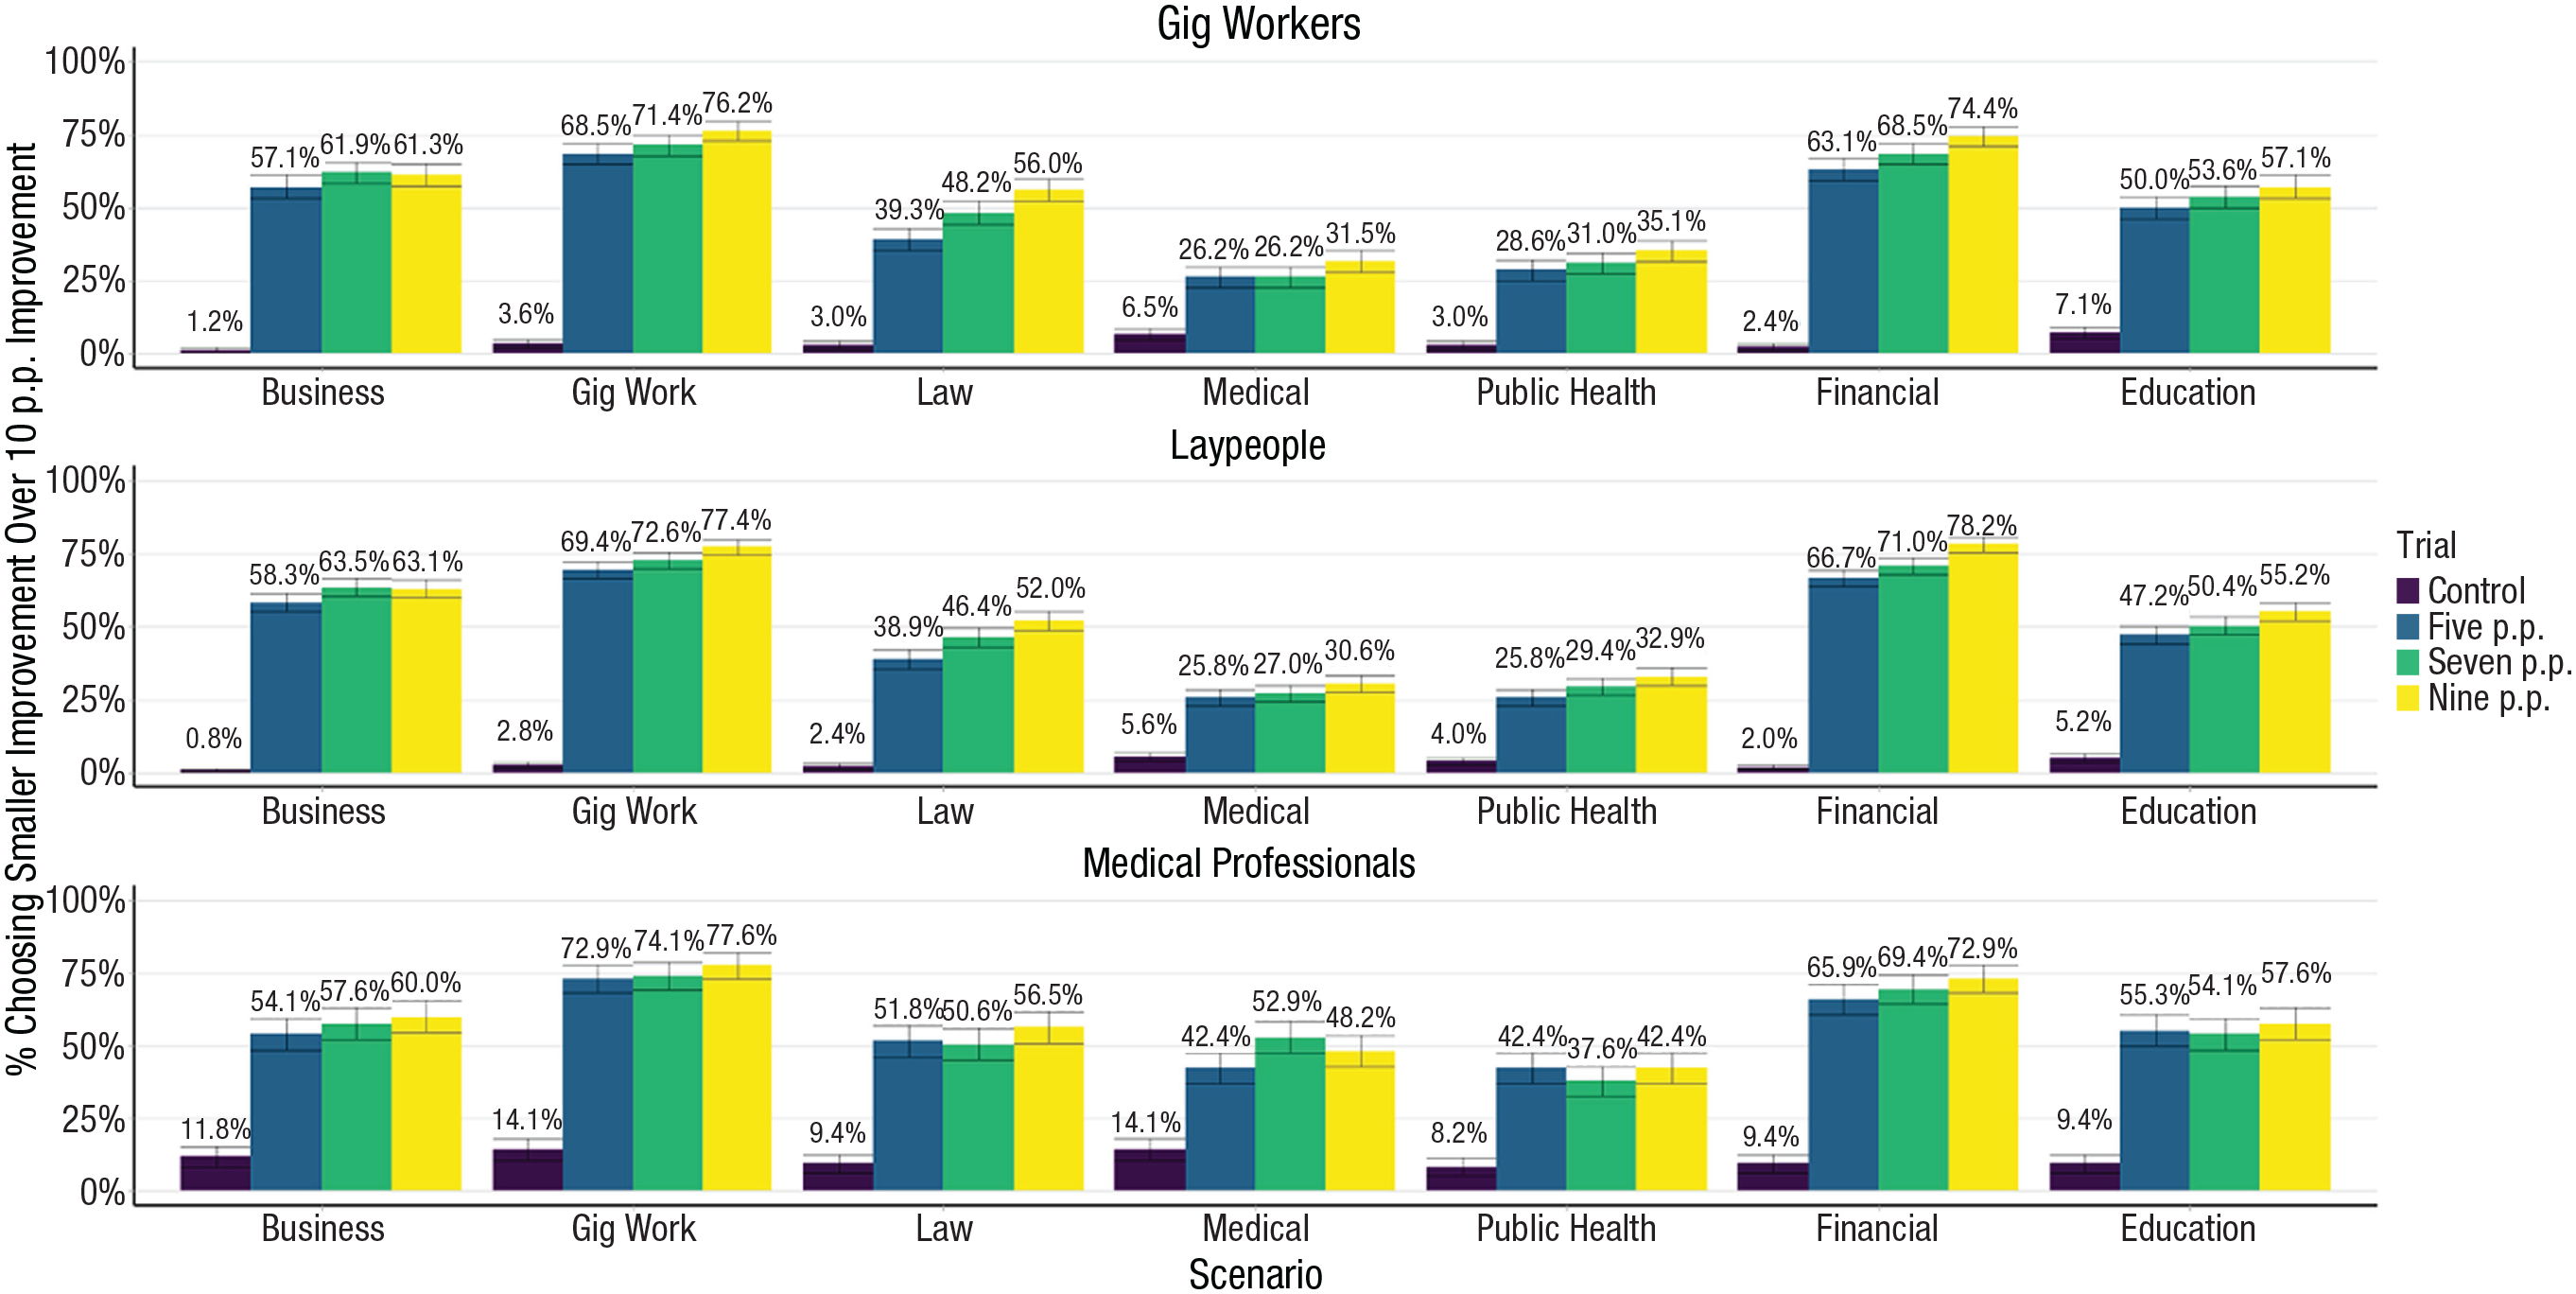
Choice of the smaller improvement option in Study 3 by sample, scenario, and trial condition. Error bars represent standard errors of proportions. p.p. = percentage point(s).
The green and yellow bars in Figure 10 showcase how participants made suboptimal choices across the 5-, 7-, and 9-p.p. trials at a (roughly) similar frequency. In the 7-p.p. trials, 52% of participants chose the suboptimal improvement, whereas in the 5-p.p. trials, 49% chose the suboptimal improvement. In other words, approximately half the time, participants preferred improvements that were twice as small but led to a greater relative reduction in bad outcomes. For example, 45% of medical professionals chose a treatment that would improve a patient’s chances of survival by 5 p.p. over a treatment that would improve a patient’s chances of survival by 10 p.p. The fact that so many professionals were willing to choose an option that was only half as impactful as the alternative is a testament to how aversive anticipated regret can be.
We next explored the effects of expertise on improvement decisions. Here, we conducted two analyses. The first compared gig workers’ choices within the gig work trials against lay participants’ and medical professionals’ choices within those same trials (see Fig. 11a), and the second compared medical professionals’ choices within the medical trials against lay participants’ and gig workers’ choices within those trials (see Fig. 11b).
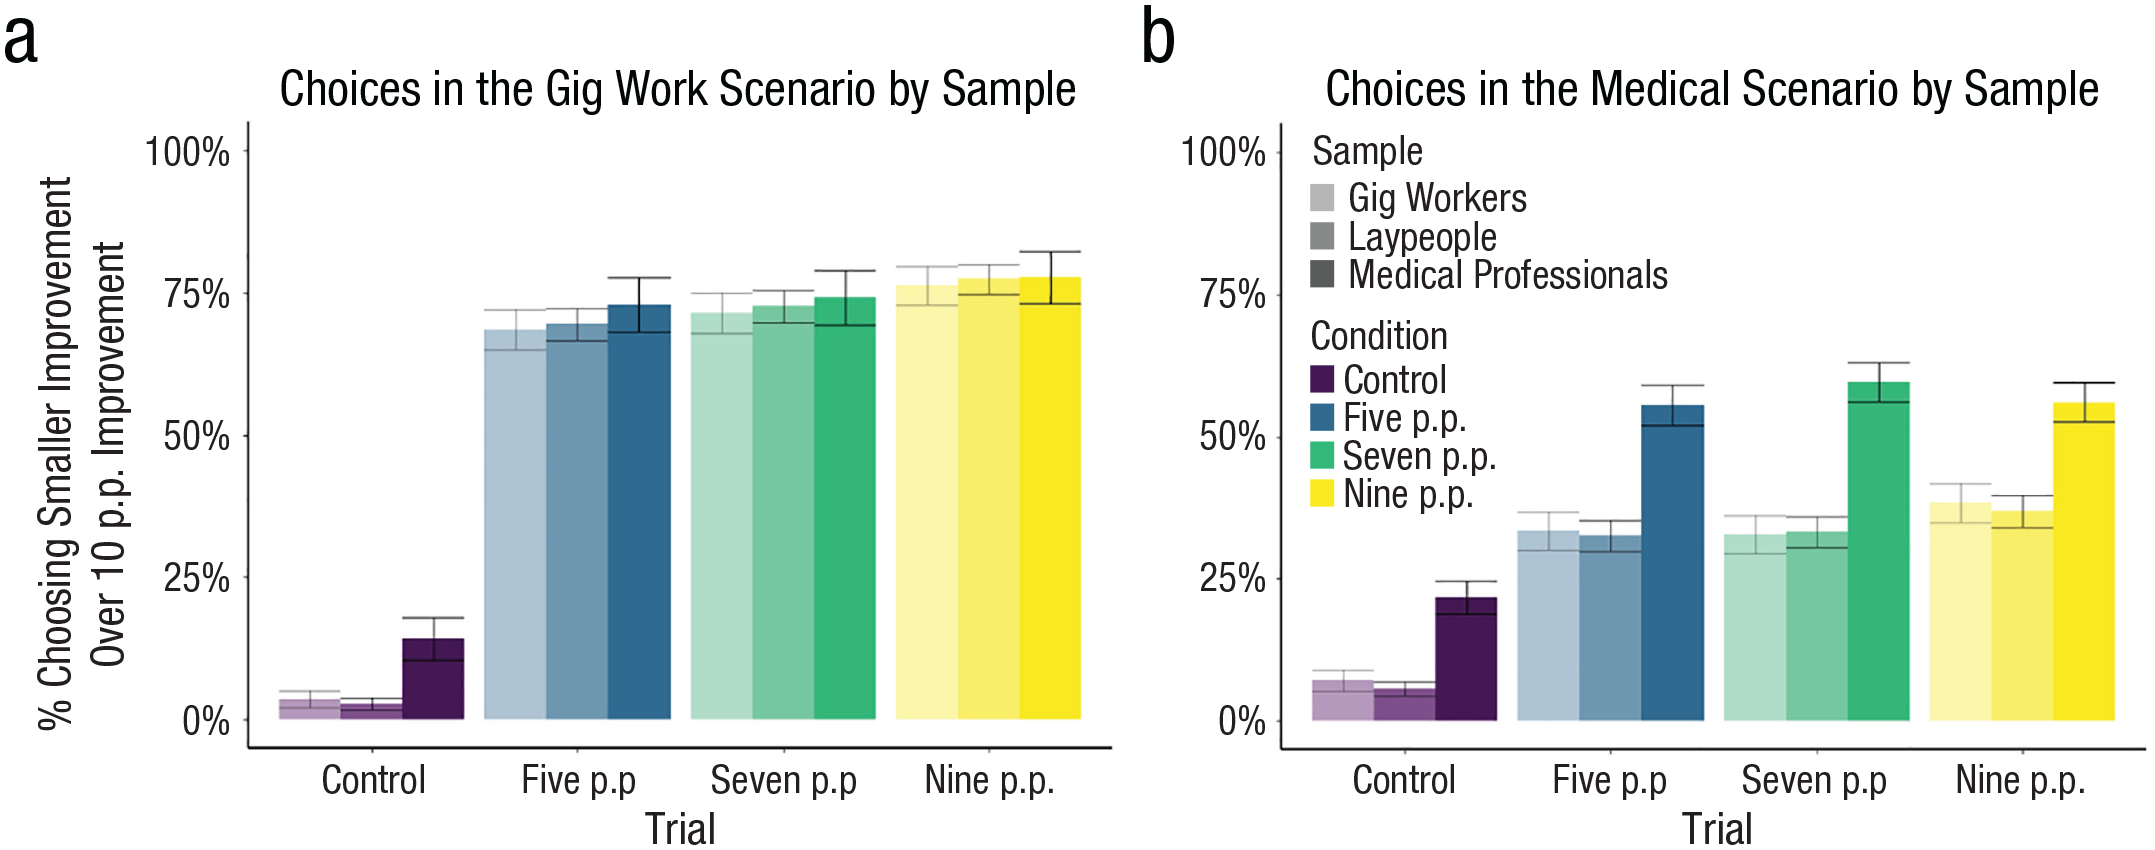
Choice of the smaller improvement in gig and medical domains by sample. The graphs illustrate choices of the suboptimal option giving the smaller improvement in the gig domain for all three samples (a) and in the medical domain for all three samples (b). Error bars represent standard errors of proportions. p.p. = percentage point(s).
For gig workers, we found no evidence that expertise led to better or worse decision-making (i.e., 76% of gig workers chose the smaller improvement in the 9-p.p. condition compared with 78% for medical professionals and 77% for lay participants), β = −0.01, t(503) = 0.316, p = .752, d = 0.03, 95% CI = [−0.16, 0.21]. However, in the medical sample, we actually found that medical professionals were more likely to make suboptimal choices (48% choosing a smaller improvement in the 9-p.p. condition vs. 32% for gig workers and 31% for lay participants), β = 0.17, t(503) = 3.09, p = .002, d = 0.37, 95% CI = [0.13, 0.60], an effect that held even with a variety of robustness checks (see the Supplemental Material).
This increase might have occurred for a variety of reasons. Experts might see decisions within their field as being highly important and thus be more likely to anticipate feeling regret when making such decisions (as implied by Study 2b). Moreover, the experience of regret is purely dichotomous; once outcomes are realized, experts either experience regret or do not. Experts—with months, years, or a lifetime of making decisions in a specific domain—might be most quick to recall situations in which their initial chances of success were high, they did not improve those chances, and they subsequently realized a bad outcome and blamed themselves for it. This biased recall might lead improvements attached to initially high probabilities to be particularly attractive. Our data suggest that expertise alone may not be sufficient to attenuate the biased valuation of improvements, independent of each of these interpretations of our results.
General Discussion
Many decisions require people to consider investing scarce resources to improve the likelihood of a good outcome. However, little prior research has examined how these improvement decisions are made. Here we demonstrated that people appear to make these decisions by focusing on the relative reduction in bad outcomes. Participants’ valuations of improvements followed a convex pattern, consistent with our theorizing. This pattern appeared with a range of probabilities and payoffs, with investments of effort or money, and in both hypothetical and incentive-compatible settings. Our final study found that participants’ sensitivity to the relative reduction in bad outcomes led to suboptimal choices in high-stakes domains. Further, Supplemental Study 3 in the Supplemental Material tested an intervention that reduces these suboptimal choices by moving the focus in decisions from individual outcomes to average expected outcomes.
Moreover, we found that the phenomenology of these improvement decisions could be characterized by the (biased) anticipation of regret. Mathematical models of regret—which, critically, do not assume that people primarily focus on bad outcomes—are commonly used to predict behavior and explain various decision-making anomalies (e.g., Loomes & Sugden, 1982). The Online Supplement 3 section in the Supplemental Material sketches out how these models can be updated to better capture how decision makers value improvements, and the Online Supplement 5 section discusses how our logic may operate when people choose which of multiple prospects to enter.
Of course, the methodology we used may not perfectly resemble improvement decisions that people naturalistically face. For example, people typically do not know their precise chances of passing an exam or exactly how much studying increases those chances. However, the empirical benefit of using precise probabilities is that researchers can know the exact information decision makers might use in their judgments and thus do not have to infer, for example, what probability a “decent chance” represents for individual participants. That said, to directly test how this bias might function with less explicit probabilities, we conducted Supplemental Study 4. This study’s design mimicked Study 3 but utilized naturalistic language (e.g., “unlikely” replaced “20%” and “very likely” replaced “80%”). We replicated the pattern of suboptimal choices in Study 3. A strength of the present research lies in our broad sampling of participants (e.g., college students, gig workers, medical professionals). Of course, these samples are not perfectly representative of the population as a whole. Moreover, all participants were adults living in the United States fluent in English. We believe that the experience of regret is similar enough across cultures and contexts that we would expect generally similar behavior, although the specifics of how this effect shows itself may vary between cultures, and this is ultimately an empirical question. For example, some research has suggested that U.S. samples experience more intense intrapersonal regret (self-related) whereas Taiwanese samples experience more intense interpersonal regret (other-related; Breugelmans et al., 2014), which could lead to more bias when decisions involve others in Taiwanese samples.
Our studies tested cases with two possible outcomes. How might people anticipate regret when more than two outcomes are possible? For example, how would a Formula One driver consider taking a risk—like delaying a crucial pit stop—to increase their chances of earning a top-three finish? Although this question is nontrivial to test, we can speculate about how regret might operate here. First, research has found that people often simplify information to make it easier to process (Fisher & Keil, 2018; Kahneman & Tversky, 1979; Smith & Medin, 1981). So, people may dichotomize continuous outcomes, although how they do this might depend on the individual and situation. In the above example, many drivers might reframe an action as either increasing their chances of winning or not winning. However, for a middling driver, earning a top-three finish might feel like winning; for an elite driver, perhaps only coming in first might suffice. Second, when people evaluate multiple outcomes at once (e.g., the chance of winning, of a top-three finish, or of not finishing altogether), we suggest that people will predominantly focus on avoiding the worst outcome (see Baumeister et al., 2001; Ito et al., 1998). Therefore, a driver might be expected to focus more on the relative improvement in their chances of finishing the race at all more than the relative improvement in their chances of getting fourth place.
Finally, there are interesting similarities between the behavior documented herein and conceptually different behaviors found in the literature. The convex pattern we found—in which valuations increased as initial probabilities increased—might also be found in other phenomena involving probabilities or proportions. For example, the goal-gradient effect (Heath et al., 1999; Hull, 1932; Kivetz et al., 2006) explains how people and animals increase their effort the closer they get to a goal. Theories of curiosity (e.g., Loewenstein, 1994) posit that curiosity increases as closeness to complete information increases. In each of these cases, improvements or progress may be judged relative to some naturally occurring reference point, whether that reference point be the total elimination of bad outcomes, goal achievement, or complete information (see Loewenstein, 1994). As people progress towards a reference point, the same amount of progress eliminates a larger proportion of the remaining distance. Thus, later-stage progress will feel more valuable and motivating. This would result in a convex pattern across a range of situations with naturally occurring reference points and could perhaps explain a variety of phenomena in psychology.
Supplemental Material
sj-docx-1-pss-10.1177_09567976241232891 – Supplemental material for Biases in Improvement Decisions: People Focus on the Relative Reduction in Bad Outcomes
Supplemental material, sj-docx-1-pss-10.1177_09567976241232891 for Biases in Improvement Decisions: People Focus on the Relative Reduction in Bad Outcomes by William H. Ryan, Stephen M. Baum and Ellen R. K. Evers in Psychological Science
Footnotes
Acknowledgements
We thank Leif Nelson, Clayton Critcher, Don Moore, Stefano DellaVigna, Cameron Anderson, Drew Jacoby-Senghor, Yoel Inbar, and Stephanie Permut for their thoughtful feedback on this project. We also thank the undergraduate research assistants at the Judgment and Decision-Making Laboratory at the University of California, Berkeley, for their help with data collection.
Transparency
Action Editor: Mark Brandt
Editor: Patricia J. Bauer
Author Contributions
W. H. Ryan and S. Baum contributed equally to the design and administration of all studies and the analysis of all data and are both first authors, and E. R. K. Evers supervised the project. All authors wrote the manuscript and approved the final version for submission.
References
Supplementary Material
Please find the following supplemental material available below.
For Open Access articles published under a Creative Commons License, all supplemental material carries the same license as the article it is associated with.
For non-Open Access articles published, all supplemental material carries a non-exclusive license, and permission requests for re-use of supplemental material or any part of supplemental material shall be sent directly to the copyright owner as specified in the copyright notice associated with the article.