
Abstract
We examined how 5- to 8-year-olds (N = 51; Mage = 83 months; 27 female, 24 male; 69% White, 12% Black/African American, 8% Asian/Asian American, 6% Hispanic, 6% not reported) and adults (N = 18; Mage = 20.13 years; 11 female, 7 male) accepted or rejected different distributions of resources between themselves and others. We used a reach-tracking method to track finger movement in 3D space over time. This allowed us to dissociate two inhibitory processes. One involved pausing motor responses to detect conflict between observed information and how participants thought resources should be divided; the other involved resolving the conflict between the response and the alternative. Reasoning about disadvantageous inequities involved more of the first system, and this was stable across development. Reasoning about advantageous inequities involved more of the second system and showed more of a developmental progression. Generally, reach tracking offers an on-line measure of inhibitory control for the study of cognition.
How children endorse the ways resources are distributed indicates a sophisticated understanding of fairness (e.g., Damon, 1975; Shaw & Olson, 2012). Toddlers display clear preferences for equality when they distribute resources, and they expect others to do the same (e.g., Geraci et al., 2022; Geraci & Surian, 2011; Schmidt & Sommerville, 2011; Sloane et al., 2012). By the age of 4, children start to articulate dividing resources equally as a social norm of fairness, and they generate equal distributions among third-party others (e.g., Smith et al., 2013). They also integrate collaboration, merit, and the value of resources into their distributions (e.g., Baumard et al., 2012; Blake & Rand, 2010; Chernyak & Sobel, 2016; Kanngiesser & Warneken, 2012).
When deciding whether to accept or reject distributions of resources between themselves and another person, children in the United States accept fair distributions of resources, reject disadvantageous inequities, and begin to reject advantageous inequities between the ages of 4 and 8 (e.g., Blake & McAuliffe, 2011). Although the development of such prosocial behaviors is culturally specific (e.g., Blake et al., 2015; Rochat et al., 2009), an open question involves the mechanisms that underlie children’s decisions.
Research with adults suggests that decisions to reject resources in dictator and ultimatum games can reflect the inhibitory control processes necessary to balance individuals’ judgments of what is fair with their desire to gain resources (e.g., Camerer, 2003). Several studies have suggested that measures such as reaction time reflect the decision conflict and control processes necessary to resolve that conflict in social decision-making (e.g., Bear & Rand, 2016; Evans et al., 2015; see also Amir et al., in press). In a developmental investigation, Chajes et al. (2022) found that younger children (4- to 6-year-olds) were slower to make fair offers than offers that were advantageous to themselves in a modified dictator game. However, this was not the case for older children (7- to 9-year-olds). Children’s inhibitory control, as measured by an offline parental questionnaire, marginally related to this reaction time in the younger sample.
These studies highlight the challenge of studying the role of inhibitory control in children’s social decision-making. Researchers often correlate measures of inhibition with measures of social cognition to show relations between them (e.g., Aguilar-Pardo et al., 2013; Smith et al., 2013; Steinbeis & Over, 2017). Such studies do not measure children’s inhibitory control as they are making decisions; rather, they measure the relation between children’s general inhibitory capacities and their judgments. Other studies use more on-line measures while participants are making a judgment. For example, Cowell et al. (2019) showed that 4- to 8-year-olds had different event-related-potential responses to evaluating whether a distribution of resources was fair or unfair, suggesting that children process fair and unfair distributions differently. The differences in those neural signals correlated with children’s decisions on separate prosocial behavior measures. More recent work by Amir et al. (in press) reanalyzed reaction-time data collected from the Blake et al. (2015) sample on the inequity game. Using drift diffusion modeling, they found that the evaluative processing of the information—specifically, preferences for equity over inequity—was what drove individual differences in the decision to accept or reject unequal distributions across cultures.
Our study builds on on-line measures of inhibitory control by considering children’s performance on an inequity game as their manual decisions were recorded in 3D space over time. Previous studies have used such reach trajectory tracking as a means of studying the development of inhibitory control processes while children and adults engage in decision-making tasks (see Song & Nakayama, 2008). Erb et al. (2016, 2017, 2018) documented that two dependent measures collected from reach tracking corresponded to distinct cognitive processes involved in the inhibitory control necessary to process a stimulus and generate a response (see Table 1).
Glossary of Variables used in Reach-Tracking Studies
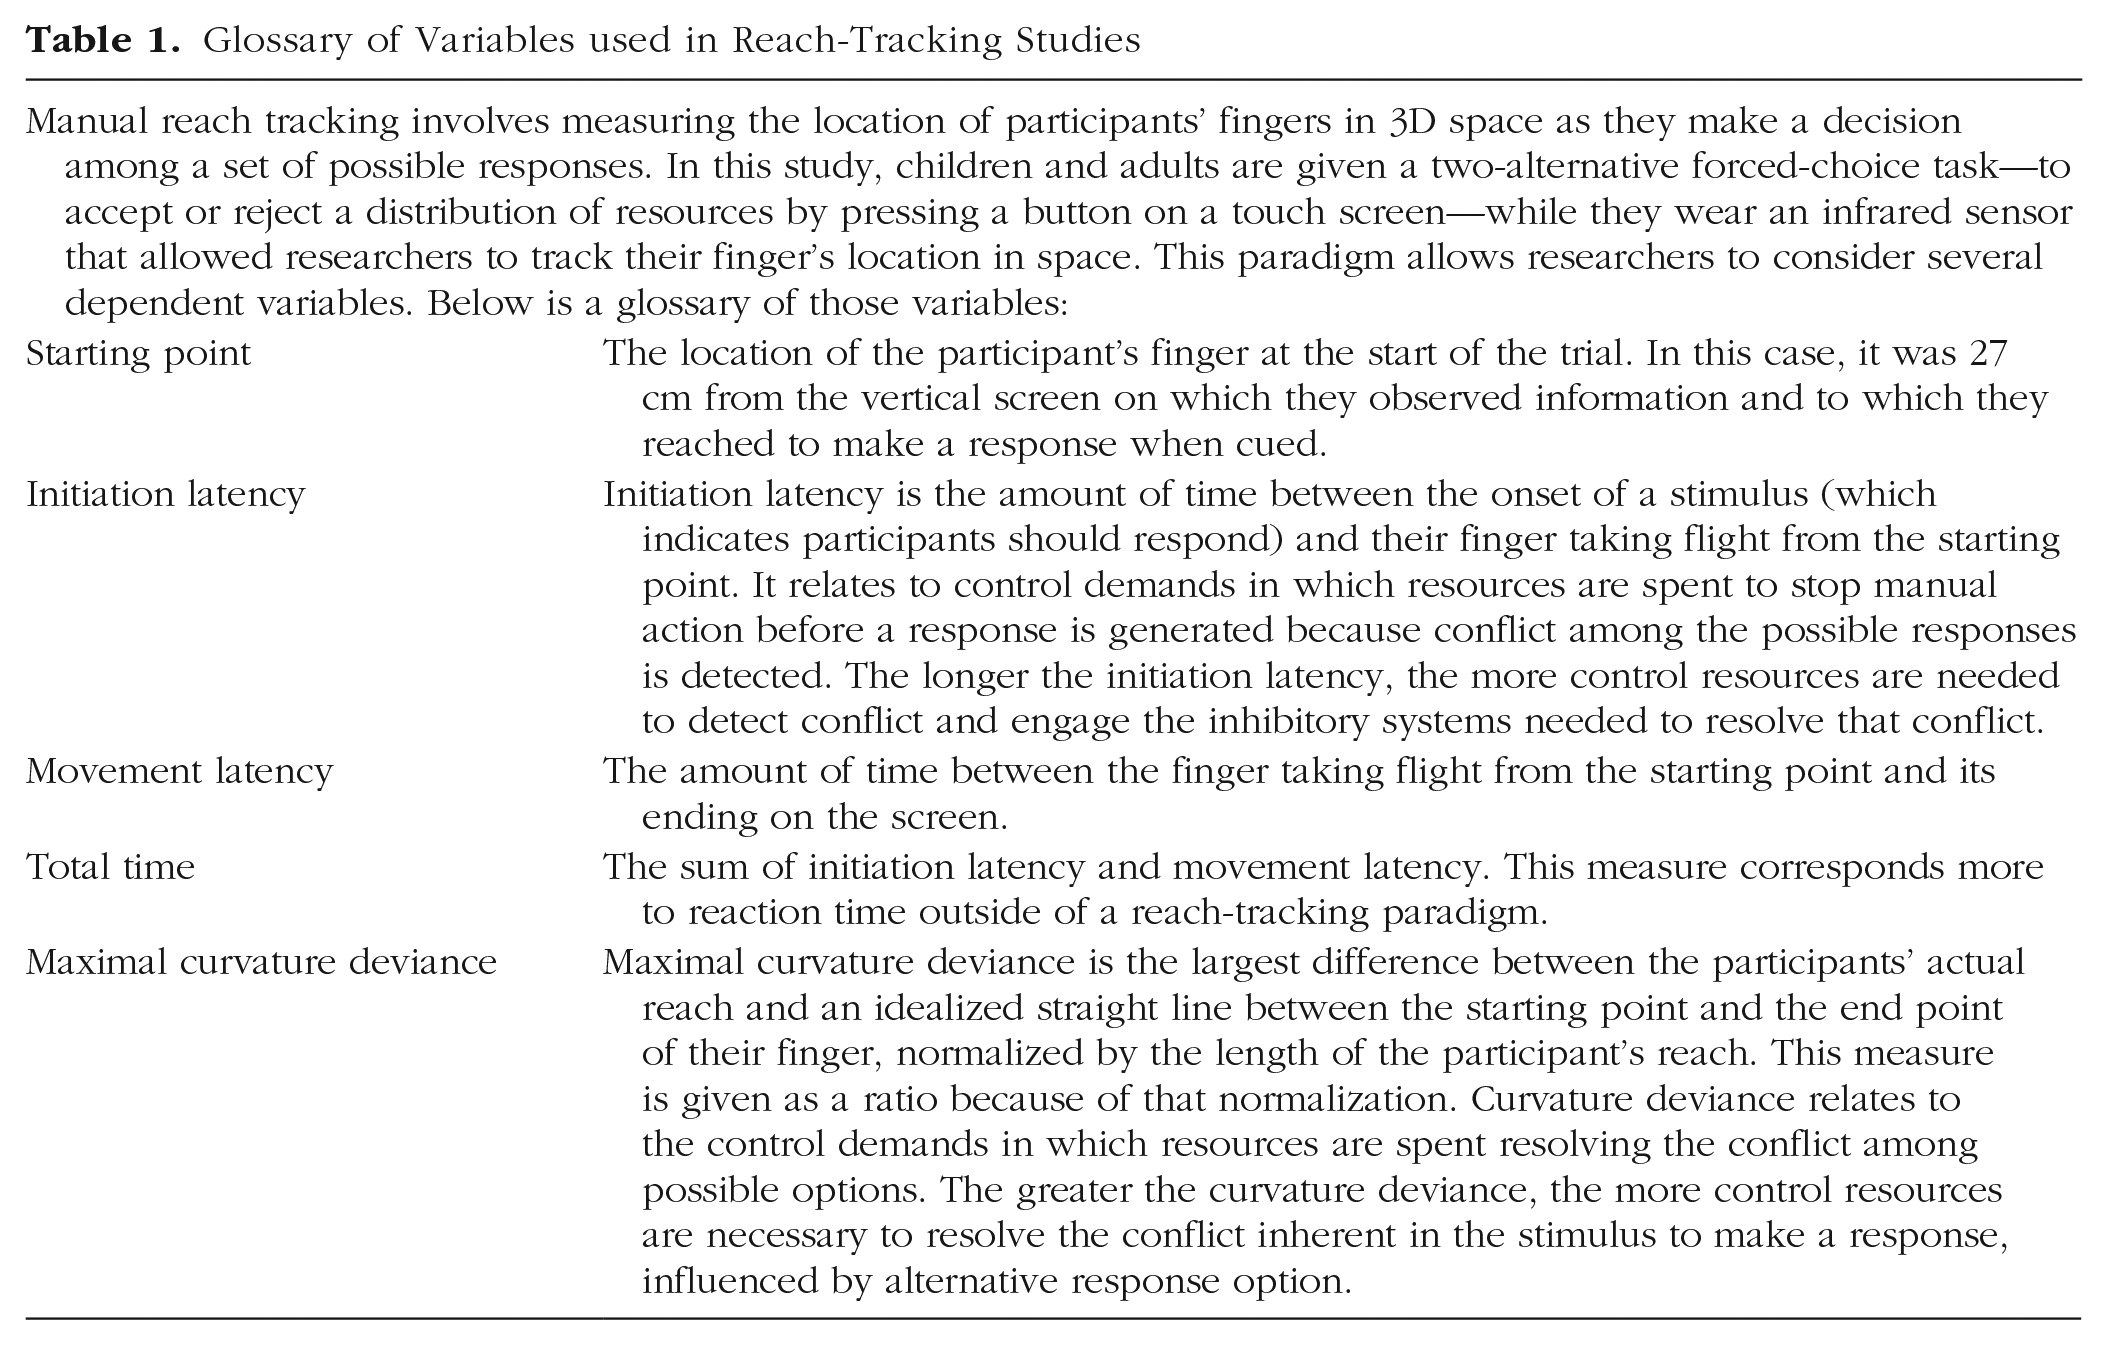
Initiation latency, the amount of time between the onset of the stimulus that signaled children to respond (on the basis of a predetermined set of instructions) and their finger moving to generate that response, corresponded to a response-threshold-adjustment process. This process temporarily impedes a motor response when conflict between the stimulus and response process is detected. Maximal curvature deviance, the extent to which the curvature of the trajectory of the participant’s finger deviated between the intended response and an idealized straight line, corresponded to a more controlled response-selection process. This process acts to resolve that conflict in order to generate the appropriate response and indicates the extent to which participants were influenced by the conflict in choosing the alternative response they could have made (see also Botvinick et al., 2001, 2004; Cavanagh et al., 2011; Egner, 2008; Frank, 2006; Munakata et al., 2011; Shenhav et al., 2013; Yeung et al., 2004). More generally, these two dependent measures potentially reflect different facets of the evaluative processing that Amir et al. (in press) suggested was critical in deciding whether or not to accept a distribution.
Statement of Relevance
Young children in the United States show distinct judgments when presented with unfair distributions. They reject cases in which they are disadvantaged—that is, in which they get fewer resources than others. Between the ages of 5 and 8, they develop a tendency to reject advantageous inequities, in which they get more resources than others. In this study, we tracked the movement of participants’ fingers while they reached to make these decisions; this allowed us to study the cognitive mechanisms that underpinned their judgments. We found that one type of inhibitory control was needed for both 5- through 8-year-olds and adults to assess distributions that were unfair to them, and this mechanism was stable over development. A different type of inhibition, which changed between ages 5 and 8, was needed to make the more egalitarian decision to reject advantageous inequities. Our novel research method allowed us to pinpoint the facets of inhibitory control that develop when children make social inferences.
Using reach tracking, we can examine children’s judgments about fairness in a manner that goes beyond simply correlating off-line measures of inhibitory control with social decisions. By measuring initiation latency and maximal curvature deviance, we can pinpoint how these different facets of the inhibitory-control process relate to children’s judgments as they are making a decision about accepting or rejecting different distributions of resources.
In the present study, we examined performance of 5- to 8-year-olds on an inequity game. Children were told that they could accept or reject distributions of resources (stickers) given to them and another child while the motion of their finger was tracked. We presented children with four distributions—two fair (one sticker for each child or four stickers for each child) and two unfair (one advantageous, in which the participant received four stickers and the other child received one, and one disadvantageous, in which the participant received one sticker and the other child received four). The overall question posed here is whether development is seen in one or both inhibitory-control processes indicated by reach tracking, which provides insight into the role of children’s developing control processes in their social decision-making and judgments of fairness.
Open Practices Statement
Because this study is (to our knowledge) the first of its kind, we did not preregister hypotheses, and we consider all analyses reported here exploratory. Raw data (tracker output) and summary data (i.e., analyzable summary statistics) are available on the Open Science Framework (https://osf.io/nd2fr/?view_only=b39f634340c444dd9506dbc6d8359565).
Method
Participants
The final sample consisted of 51 children (Mage = 83 months, range = 60−107 months, 27 female, 24 male) recruited from birth records and previous visits to the Causality and Mind Lab at Brown University. In order to maintain fidelity of the tracker data, all children were right-handed (as reported by a parent). The goal was to recruit children between the ages of 5 and 8, and the distribution was 17 five-year-olds, 16 six-year-olds, 11 seven-year-olds, and 7 eight-year-olds. The racial/ethnic distribution of the sample was as follows: 69% White, 12% Black, 8% Asian, 6% Hispanic, and 6% not reported. Sample size was determined by a power analysis based on the effect sizes of previous studies in our lab (Erb et al., 2017), which revealed a desired sample size of 48 (based on α = .05 and β = 0.20). The additional three participants were the result of overrecruiting. Eliminating their data does not change the reported analyses.
A convenience sample of adults (N = 18) was recruited through the university participant pool. All adult participants were right-handed and were tested in the laboratory (Mage = 20.13 years, range = 18−22 years; 11 female, 7 male).
Materials and apparatus
Figure 1 shows a pictorial representation of the reach-tracking apparatus. The electronic receiver was connected to a computer running MATLAB (The MathWorks, Natick, MA), and Psychophysics Toolbox (Version 3.0.11; Brainard, 1997; Kleiner et al., 2007; Pelli, 1997), which was used to project stimuli. These stimuli were projected from behind onto a plexiglass display (44 cm × 33 cm) arranged upright on a table perpendicular to the participant’s line of vision at a distance of 48 cm.
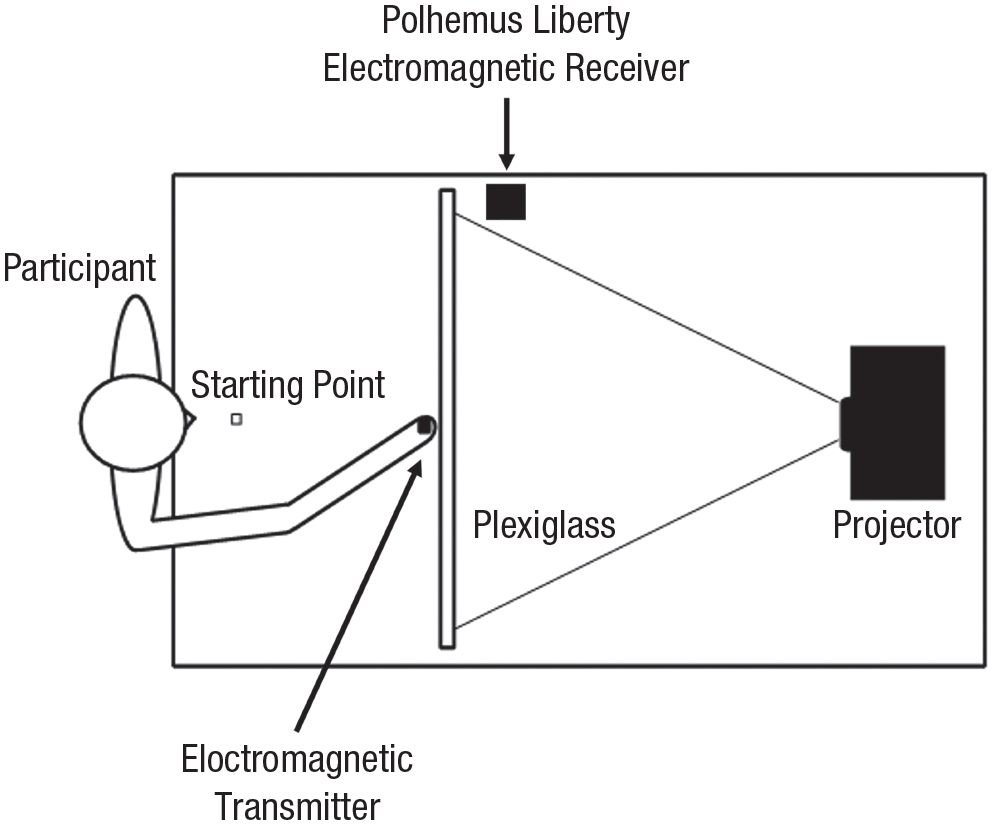
The experimental setup.
During the procedure, 3D finger positions were recorded at approximately 240 Hz using an electromagnetic position-and-orientation recording system with a measuring error of 0.03 cm root mean square. The Liberty Polhemus operating system requires three components to measure movement in three-dimensional space: a transmitter, a receiver, and a signal processor. An electromagnetic field was generated by a transmitter (2.26 × 1.27 × 1.14 cm) weighing 0.13 oz. This transmitter was connected to the participant’s right index finger via a Velcro strap near the tip. The receiver was located behind the plexiglass screen to the left of the participant. This receiver sensed the electromagnetic field generated by the moving transmitter. As the object moved within the field, the voltage in the receiver changed. These changes were directly related to the position and orientation of the transmitter within the receiver’s field. Last, the receiver sends these voltage signals back to the computer for processing. The computer was located behind and to the right of the projector.
The system determines the transmitter’s (i.e., the participants’ finger) exact location in three dimensions (x, y, and z) and three orientations (pitch, yaw, and roll) on the basis of the characteristics of the signals received from the transmitter. Participants rested their index finger on a Styrofoam block (2 × 2× 2 cm, referred to as the starting point in Fig. 1), placed 27 cm from the screen along the z-dimension (i.e., the distance between the participant and the display screen).
At the beginning of the experiment, the reach-tracking system was calibrated using a nine-point calibration process. Participants were asked to touch nine equally spaced points on the screen sequentially. Participants proceeded to the procedure only after this calibration was successful; otherwise, it was repeated.
Procedure
The procedure used here was reviewed and approved by the Brown University Institutional Review Board (Proposal No. 1905002457, “The Dynamics of Inhibition in Social Cognitive Development”). All children were tested in the laboratory after parents consented to their participation, and children assented through a verbal script. Children were introduced to the tracker by sitting at the table within reach of the touch screen. The sensor was attached to their right finger, and children ran through the calibration sequence.
The participants were then shown a set of four familiarization trials, each beginning with a central crosshair (2 × 2 cm) on the screen. The children were required to place their index finger on the starting block and were able to progress to each trial only when the experimenter ensured the child’s finger was on the starting block and was not moving from it. The experimenter advanced the sequence by pressing the space bar on a Bluetooth computer keyboard. Children were shown two response boxes (3 × 2 cm) that appeared on the upper right and upper left of the screen (10 cm diagonally from the crosshair). One was colored green and the other was colored red. Children were instructed that the green box was “accept” and the red box was “reject.” The location of the boxes was counterbalanced across participants. After the children placed their index finger on the starting block, the familiarization sequence showed the word “accept” or “reject,” instructing the child to move from the starting block to the corresponding colored box. There was no time limit to these trials.
After the familiarization sequence, children were then told that they would be playing a game with a member of the lab, Laura. Children were introduced to Laura by a photo displayed at the center of the screen. Next, children were directed to the initial screen shown in Figure 2. Two plastic bowls were placed on a small table to the left of the tracker apparatus, and the experimenter stood behind this table for the entirety of the experiment (and hence behind the child, who was seated at the tracker; parents sat in a vestibule outside the room, where their child’s performance was visible to them). Children were told that one bowl was for them. The experimenter would place their stickers in it as the game progressed, depending upon the choices they made. The other bowl was for Laura, and the experimenter would place Laura’s sticker in her bowl. Children were told that on each trial, they would see a distribution of stickers, and if they touched the green box, it meant they accepted the distribution, and they and Laura would each receive stickers. If instead they touched the red box, it meant they rejected the distribution, and no one would receive stickers on that trial. Children were told to make their decision as quickly as possible when they saw the distribution of stickers.
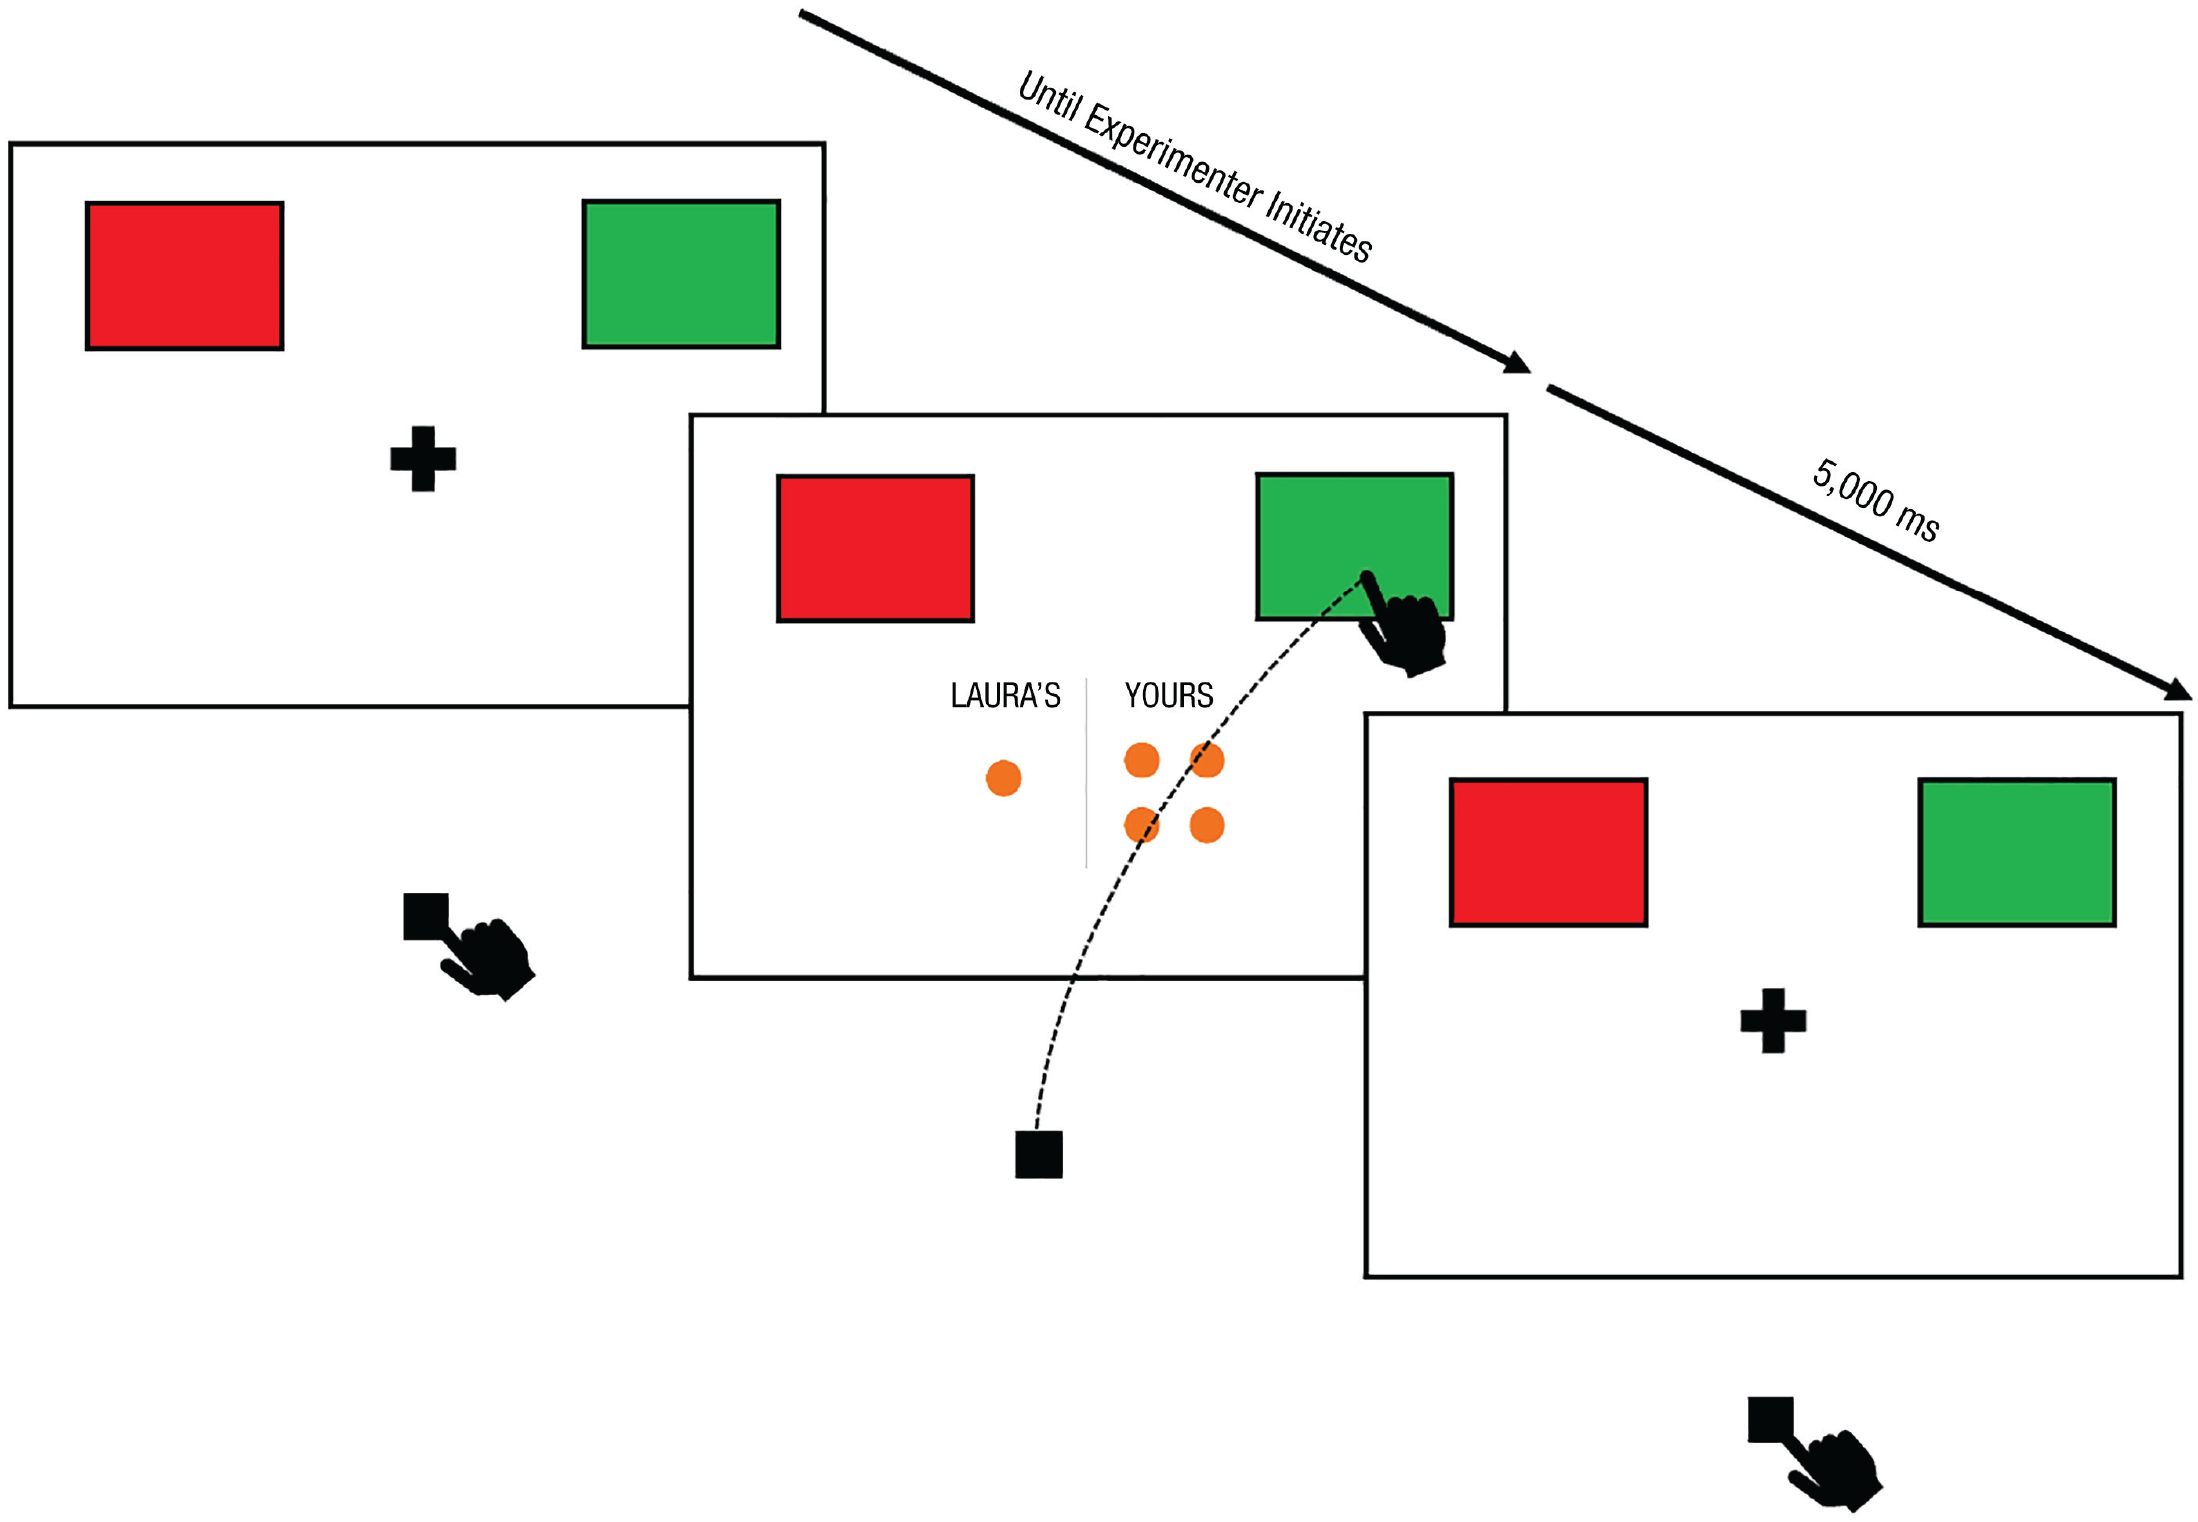
Illustration of a trial sequence in the main experiment block shown to children. It shows an example trial with a 1 to 4 distribution: If the participants accept the presented distribution, participants (“YOURS”) would earn four stickers whereas Laura (“LAURA’S”) would receive one sticker. Participants reached and touched one of the options to indicate their choice for a given distribution (green for “accept” or red for “reject”).
After children placed their finger on the starting block, the experimenter initiated a trial by pressing a button on the Bluetooth keyboard. Children were shown a distribution that designated the sticker amounts to them and Laura on that trial. Children were shown four types of distributions (within-subjects): 1-1 (one sticker for the child, one sticker for Laura), 1-4, 4-1, and 4-4. Children completed five trials of each distribution, randomly ordered. On each trial, children first saw a fixation cross, which disappeared when one of the four possible distributions appeared (see Fig. 2). If children selected the green “accept” response box, the experimenter would distribute the stickers from that trial into the two bowls. If children selected the red “reject” response, no stickers would be distributed after the trial.
Children had to complete their responses within 5 s. The display indicating the distribution remained until a response was completed or until 5 s had elapsed; if there was no response after 5 s, the child was considered to have timed out. Auditory feedback was given to indicate successful completion of reach within the time limit (accept: 600 Hz; reject: 200 Hz) and to indicate a slow response (400 Hz) over 5 s. These latter time-outs were not included in our analyses.
Adult participants were tested on the same reach-tracking apparatus as children. After participants completed the same nine-point calibration, they were given the same introduction to the procedure as the child participants and the same four types of trials to accept or reject. However, there were some differences in the procedure. First, instead of seeing red and green squares, the squares were black and read “accept” and “reject.” Second, instead of being shown the number of resources they would receive, the distributions were presented to them in writing (e.g., you: 1, Laura: 1, for the 1-1 trial). Third, adult participants received 50 trials of each distribution for a total of 200 trials (compared with the 20 presented to children). Fourth, adults were not given actual stickers after each trial, like children. Instead, the units were referred to as “points” and a counter of their total points was present on the screen. Fifth, when adults returned to the starting position, they had to keep their finger still for 500 ms, which indicated the start of the next trial; the experimenter did not have to press a key on the Bluetooth keyboard between each trial, but a random amount of time (750–1,500 ms) was introduced between each trial to ensure that adults did not move their finger in anticipation of the onset of the stimulus. Finally, adults were given 2 s to respond instead of the 5 s children were given. Adults timed out on 2.3% of the trials, and those data were not included in any analysis.
Data processing
Data-analysis procedures for reach movements were adapted from previous studies (Gamble & Song, 2021; Erb et al., 2016; Menceloglu et al., 2021; Moher et al., 2015). We conducted offline analysis on the continuous reach-movement data using custom MATLAB software created for our project. Movement velocity was calculated from the three-dimensional position traces after filtering with a second-order low-pass filter (cutoff frequency: 10 Hz). A velocity threshold of 10 cm/s was used to mark the movement onset and movement offset time; once this threshold was exceeded, we marked movement onset, and once velocity went below it, we marked movement offset. Initiation latency was defined as the time elapsed between stimulus onset and movement onset. Trials in which the initiation latency time was less than 200 ms (~8% of all trials for the child sample and ~7% of all trials for the adult sample) were removed, as these potentially indicated that participants anticipated the appearance of the stimulus. Movement time was defined as the time elapsed between movement onset and movement offset. The total time of the trial was defined as the sum of movement time and initiation latency.
Maximal curvature deviance in each participant’s reaching trajectories was calculated using a customized algorithm in MATLAB created for the project. For each reach, we divided the reach generated by the participant into 100 equally spaced units (based on a normalization curve). We then considered an imaginary straight line from the participant’s initial finger position to the final finger position in 2D (x-y) space. We computed a set of line segments that connected each of these 100 points on the participant’s actual trajectory to the imaginary line in such a way that each segment intersected that line at a right angle; we thus created a set of 100 right triangles formed by the starting point, a point on the participant’s trajectory, and a point on the imaginary straight line. Using the law of cosines, we could calculate the length of the line segment between the participant’s actual reach and the imaginary straight line for each of those 100 triangles. Maximal curvature deviance was the largest value of the length of these 100 segments divided by the length of the imaginary straight line (to create a ratio based on the length of the reach). The sign at each sample was calculated for each point on the movement trajectory by determining the angle of deviation relative to the starting position. If that angle was directed toward the alternative response option, the sign was positive; if it was directed away from the alternative response option, it was negative (following Desmurget et al., 1997; Erb et al., 2018; Moher & Song, 2013).
Reach movements were classified as proper responses if they landed within a response (3 × 2 cm) within 5 s (for children) or 2 s (for adults). The identification of these movements by the algorithm was visually inspected to verify its accuracy, movement trajectory, and curvature values for every trial for every participant. For trials in which the default threshold clearly missed part of the movement or included substantial movement back to the starting point, thresholds were adjusted manually to more appropriate levels for that trial (< 10% of all trials). Finally, curvature results were categorized into two basic patterns of response: (a) reaches that have a single maximum curvature deviation (either positive or negative) and (b) reaches that had both a maximal positive and maximal negative deviance score. These response patterns were inspected manually to determine whether they represented participants’ initially making a reach toward the alternative option and then changing their reach midway and potentially overcompensating. This would cause a greater negative deviation curve, which would misrepresent the child’s curvature score. This occurred on 21% of the trials, and when it did, we used the positive deviation score as a measure of curvature to avoid skewing the data.
Finally, if any participant showed excess erroneous movement (meandering and zigzagging between green “accept” and red “reject” boxes) or timeouts on over 10% of trials, such participants were removed from further analysis. Five additional child participants were excluded for this reason; no adults were excluded for this reason. We suspect that these children were not engaged by the study, as their reaches reflected engagement with other facets of the experimental setup (such as the bowl of stickers). We excluded these data to control for outliers in responses.
Results
We divide the Results section into analyses of the choices children and adults made, their initiation latency, and then maximal curvature data. In each case, we present the child data first and then compare the children’s data to the adults’.
Choice data
Child data
Figures 3a and 3b show the percentage of trials on which children and adults accepted each distribution. Children accepted the fair distributions 90% (SE = 1.9%) and 89% (SE = 1.8%) of the time for the Self 1–Other 1 and Self 4–Other 4 distributions, respectively. They accepted the unfair distribution in which they were disadvantaged (Self 1–Other 4) 47% of the time (SE = 3.4%), and the unfair distribution in which they were advantaged (Self 4–Other 1) 59% (SE = 3.1%) of the time. We constructed a general estimating equation with a robust correlation matrix on whether children accepted each trial, assuming a binomial logistic distribution of responses. Trial number and distribution were within-subjects factors, and age (in months) was a between-subjects factor. All main effects were considered, as well as all interactions not involving trial number (as there was no theoretical reason to believe that the trial number would interact with any variable).
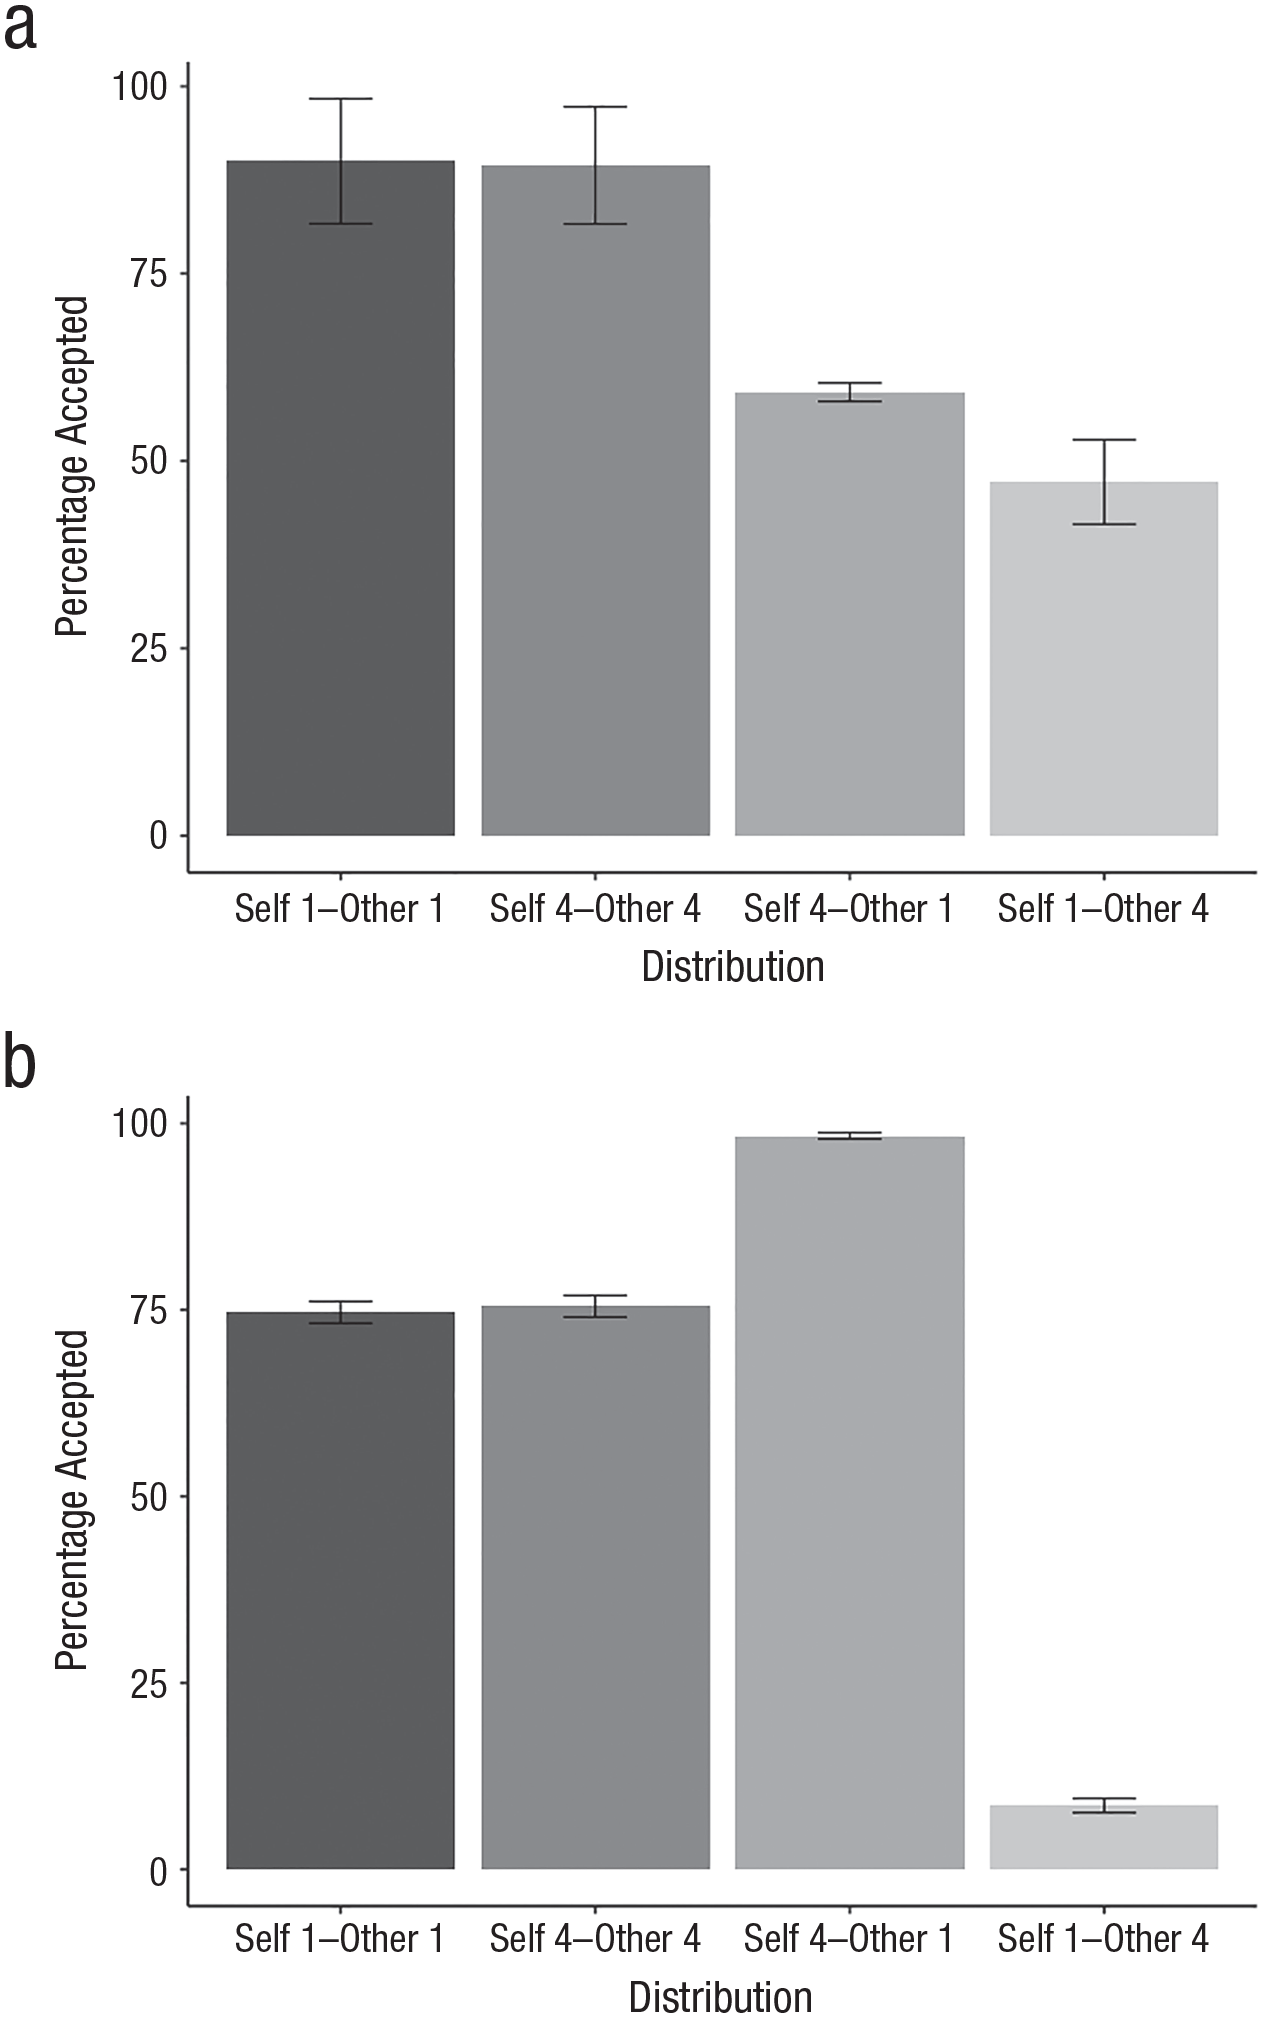
Percentage of distributions children (a) and adults (b) accepted in each trial. Error bars show standard deviations.
This analysis showed a main effect of distribution, Wald χ2(3) = 9.99, p = .02, r = .06, and a main effect of age, with older children in general accepting fewer trials than younger children, β = −0.05, SE = 0.02, 95% confidence interval (CI) = [−0.09, −0.01], Wald χ2(1) = 5.72, p = .02, odds ratio (OR) = 0.95. The interaction between distribution and age was a marginal trend, Wald χ2(3) = 7.58, p = .056, r = .06. The effect of trial number was not significant.
Because there was not a significant effect of trial number, we examined the proportion of trials of each distribution that children accepted. In general, children did not accept the two fair distributions differently, t(50) = −0.16, p = .87, d = 0.01, nor did they accept the two unfair distributions differently, t(49) = 1.54, p = .13, d = 0.26, but they did accept the fair distributions more often than the unfair ones, t(49) = 6.66, p < .001, d = 1.13. Moreover, as children got older, they rejected the 4-1 distribution more often, rs(49) = −.62, p < .001, as well as the 4-4 distribution, rs(49) = −.34, p = .01. They also showed a marginal trend to reject the 1-4 distribution more often as they got older, rs(48) = −.25, p = .08.
Adult data
Adults accepted the two fair distributions 75% of the time (both SEs = 2%); they accepted the advantageous inequity distribution, in which they received four points and the other person one point, 98% of the time (SE = 0.4%); and they accepted the disadvantageous distribution, in which they received one point and the other person four, 9% of the time (SE = 0.8%). Running the same type of generalized estimating equation (GEE) analysis on the adult data, we found a main effect of distribution, Wald χ2(3) = 37.50, p < .001, r = .11. Adult participants did not accept the two fair distributions differently, Wald χ2(1) = 0.03, p = .86, but were less likely to accept a fair distribution than the advantageous inequity, β = −2.99, SE = 0.89, 95% CI = [−4.74, −1.24], Wald χ2(1) = 11.26, p < .001, OR = 0.05, and were more likely to accept a fair distribution than the disadvantageous inequity, β = 3.45, SE = 0.74, 95% CI = [2.00, 4.90], Wald χ2(1) = 21.72, p < .001, OR = 31.50.
To compare the adult and child data, we ran a 4 (Distribution) × 2 (Age Group) repeated-measures analysis of variance (ANOVA) on the means of participants’ choices. This analysis revealed a main effect of distribution, F(3, 198) = 41.85, p < .001, partial η p 2 = .39, and a significant interaction between distribution and age group, F(3, 198) = 16.21, p < .001, partial η p 2 = .20. This interaction revealed that children and adults responded differently on the two unfair distributions—t(67) = 3.64, p < .001, g = 0.99 for the 4-1 distribution and t(66) = −3.64, p < .001, g = −0.99 for the 1-4 distribution. Children were more likely to accept the two fair distributions, but these differences were only marginal trends—t(67) = −1.92 and −1.94, both p values = .06, both g values = −0.52 for the 1-1 and 4-4 distributions, respectively.
Initiation latency
The mean initiation-latency data across the four distributions are shown in Figure 4a for the child sample and Figure 5 for the adult sample. We first analyzed the children’s data by constructing a general estimating equation assuming a robust correlation matrix and a linear response distribution. Trial number and distribution were within-subjects factors, and age (in months) was a between-subjects factor, using the same analysis strategy as analyzing choice. This analysis showed an overall effect of trial number; children’s initiation latencies got faster over the course the experiment, β = −0.02, SE = 0.005, 95% CI = [−0.03, −0.01], Wald χ2(1) = 22.38, p < .001, OR = 0.98. There was also a main effect of distribution, Wald χ2(3) = 8.74, p = .03, r = .06. No other significant main effect or interaction was found. Simple effect analysis revealed no significant difference between the two fair distributions, β = 0.02, SE = 0.33, Wald χ2(1) = 0.01, p = .95. The initiation latencies between the two unfair distributions did differ; children were slower to respond to the distribution in which they received one sticker and the other received four than when they received four and the other received one, β = −0.78, SE = 0.33, 95% CI = [−1.43, −0.13], Wald χ2(1) = 5.50, p = .02, OR = 0.46. Children were also slower to respond on the 1-4 distribution than on either fair distribution, β = −1.01 and −1.03, SE = 0.48 and 0.41, 95% CI = [−1.95, −0.07], [−1.83, −0.24], Wald χ2(1) = 4.44 and 6.49, p = .04 and .01, both ORs = 0.36, for the 1-1 and 4-4 distributions, respectively.
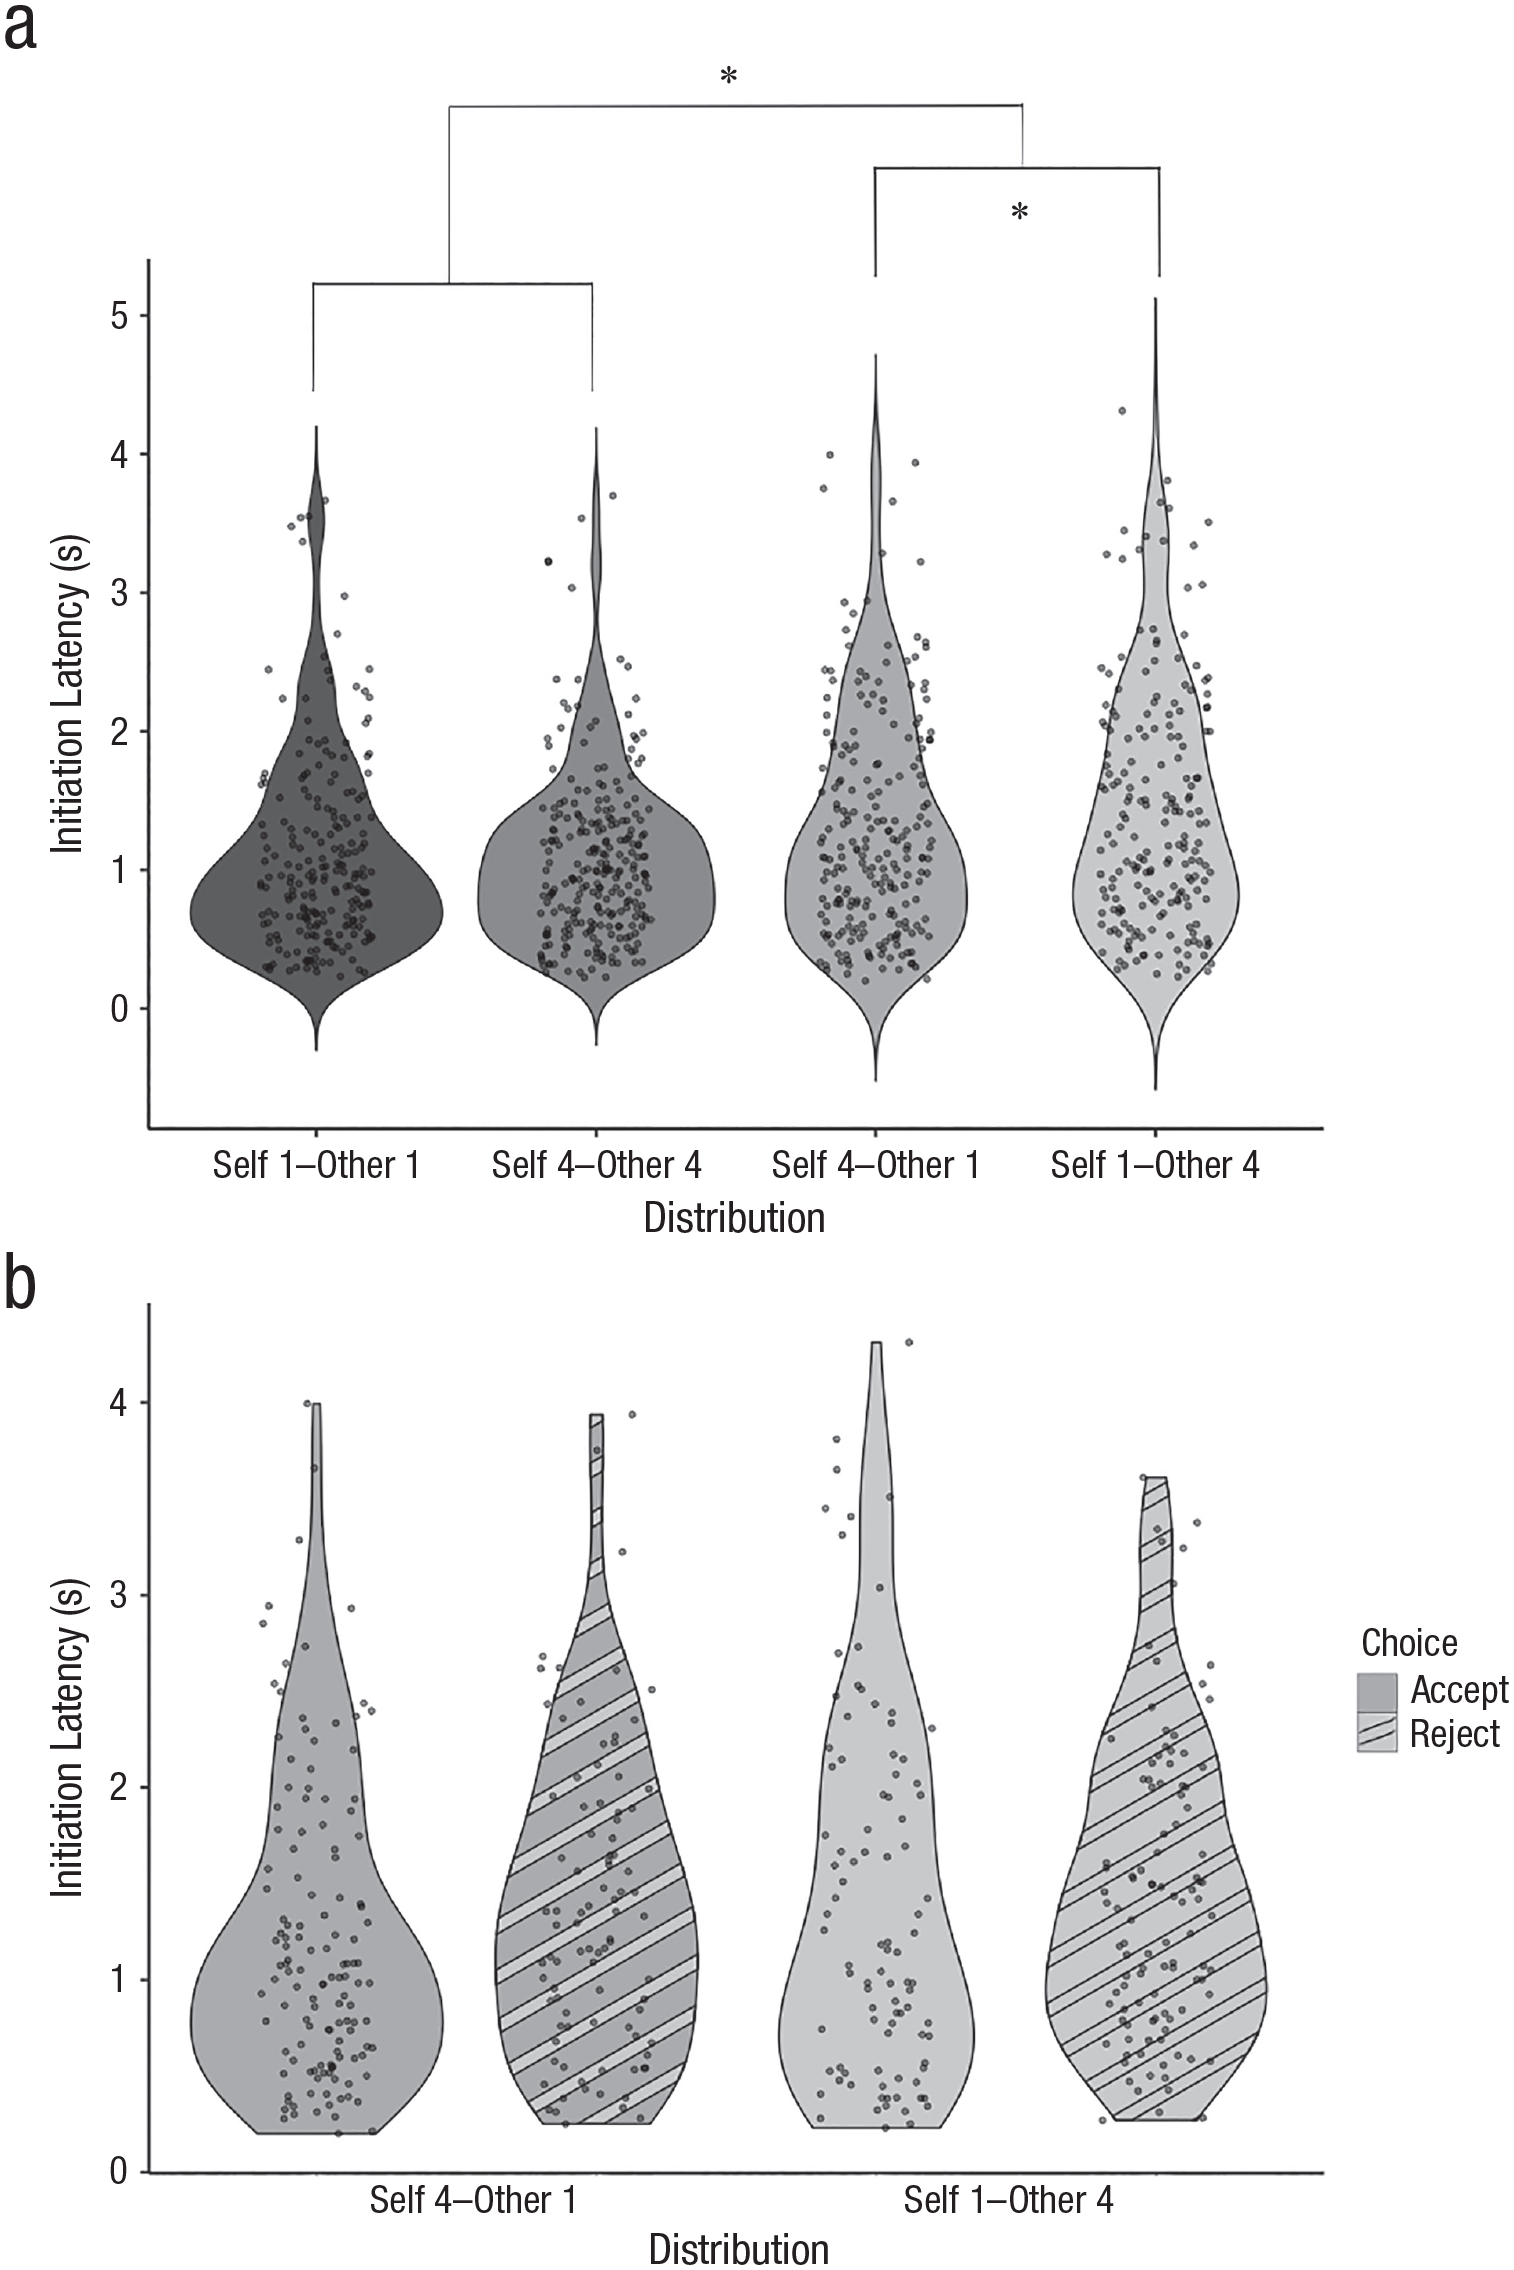
Initiation latency data across the four distributions for the child sample overall (a) and based on the decision to accept or reject the distribution for the two unfair distributions (b).
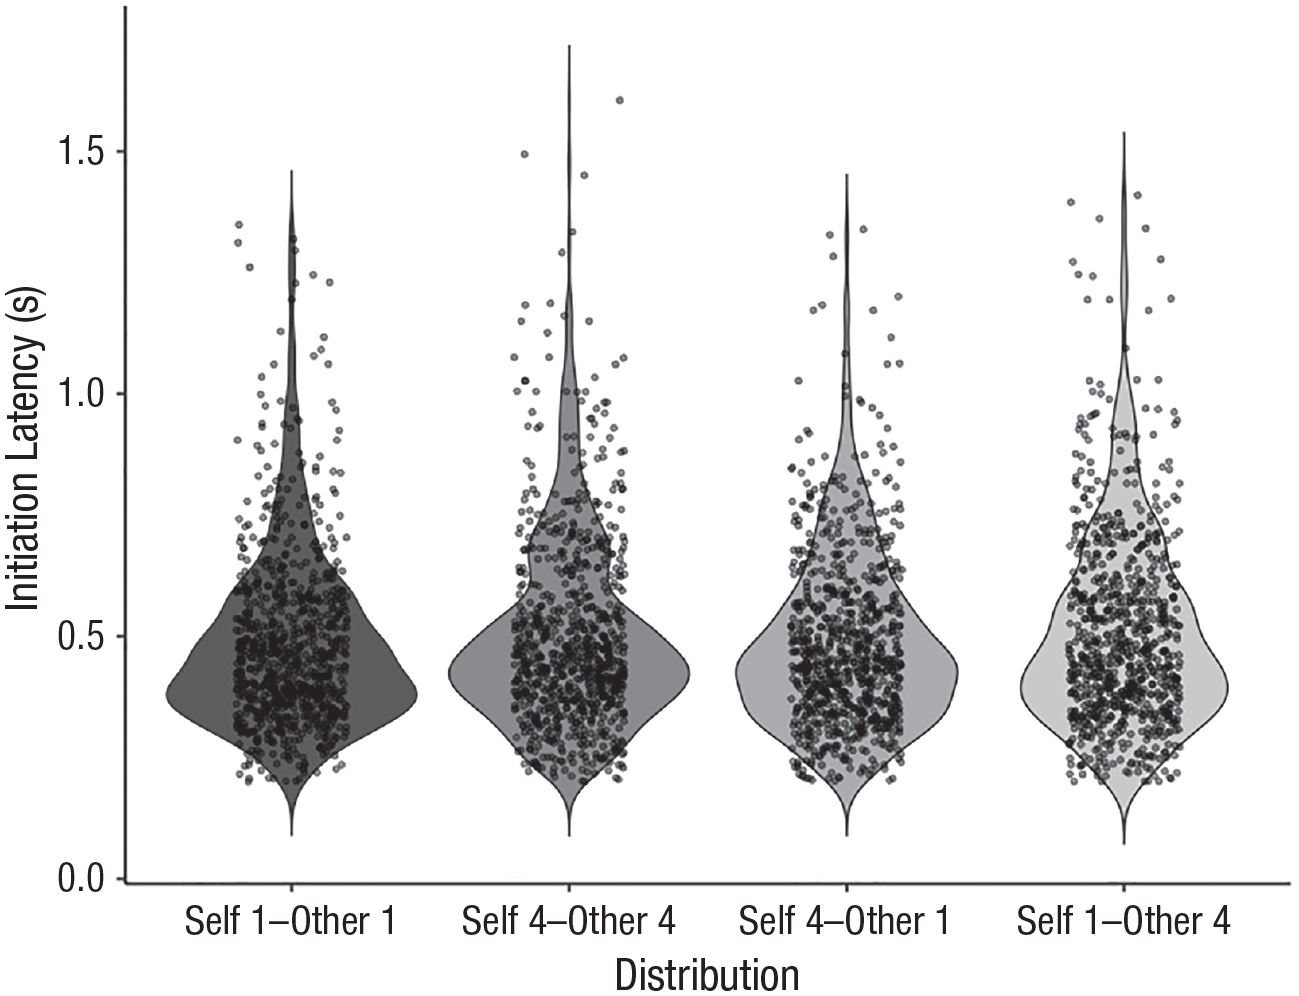
Initiation latency data across the four distributions for the adult sample overall.
Because children mostly chose to accept the fair distributions, we considered how children responded to the unfair distributions when they accepted or rejected the distribution. These data are shown in Figure 4b. We analyzed the initiation latency for these two distributions with a general estimating equation assuming a robust correlation matrix and a linear response distribution. Trial number and distribution were within-subjects factors, and age (in months) and choice were between-subjects factors. When only a main-effect model was considered, this revealed a main effect of trial number, Wald χ2(1) = 8.77, p = .003, r = .06, and a main effect of distribution, Wald χ2(1) = 3.83, p = .05, r = .05, but no other significant effects. When interactions were added to the model, only the main effect of trial number persisted in significance, Wald χ2(1) = 8.78, p = .003, r = .03.
The adult data were analyzed in the same manner as the children’s data. This analysis showed an overall effect of trial number; adults initiation latencies got faster over the course of the experiment, β = −0.001, SE = 0.0001, 95% CI = [−0.001, −0.00003], Wald χ2(1) = 18.86, p < .001, OR = 0.99. There was also a main effect of distribution, Wald χ2(3) = 8.74, p = .03, r = .05. Similar to the child data, adults had the longest initiation latencies on the 1-4 distribution, and they were significantly slower on that distribution than on the 4-1 distribution, β = −0.02, SE = 0.01, 95% CI = [−0.04, −0.01], Wald χ2(1) = 8.94, p = .003, OR = 0.98, and on the 1-1 distribution, β = −0.02, SE = 0.01, 95% CI = [−0.03, −0.01], Wald χ2(1) = 8.81, p = .003, OR = 0.98, but not the 4-4 distribution, β = −0.01, SE = 0.01, 95% CI = [−0.03, 0.01], Wald χ2(1) = 1.14, p = .29. Because adults almost always accepted the 4-1 distribution and almost always rejected the 1-4 distribution, we did not replicate the analysis of those distributions on the basis of the choices participants made, as we did with children. Of importance is that adults, like children, showed the slowest initiation latencies on the 1-4 distribution, a point we will return to in the Discussion section.
Maximum curvature deviance
We analyzed maximum curvature deviance using the same strategy as initiation latency. These data are shown in Figure 6a for the child sample and Figure 6b for the adult sample. To analyze the child data, we constructed a general estimating equation assuming a robust correlation matrix and a linear response distribution. Trial number and distribution were within-subjects factors. Age (in months) was a between-subjects factor, using the same analysis strategy as analyzing choice. This model revealed no significant effects, all Wald χ2 values < 3.38, all p values > .22, all r values < .002.
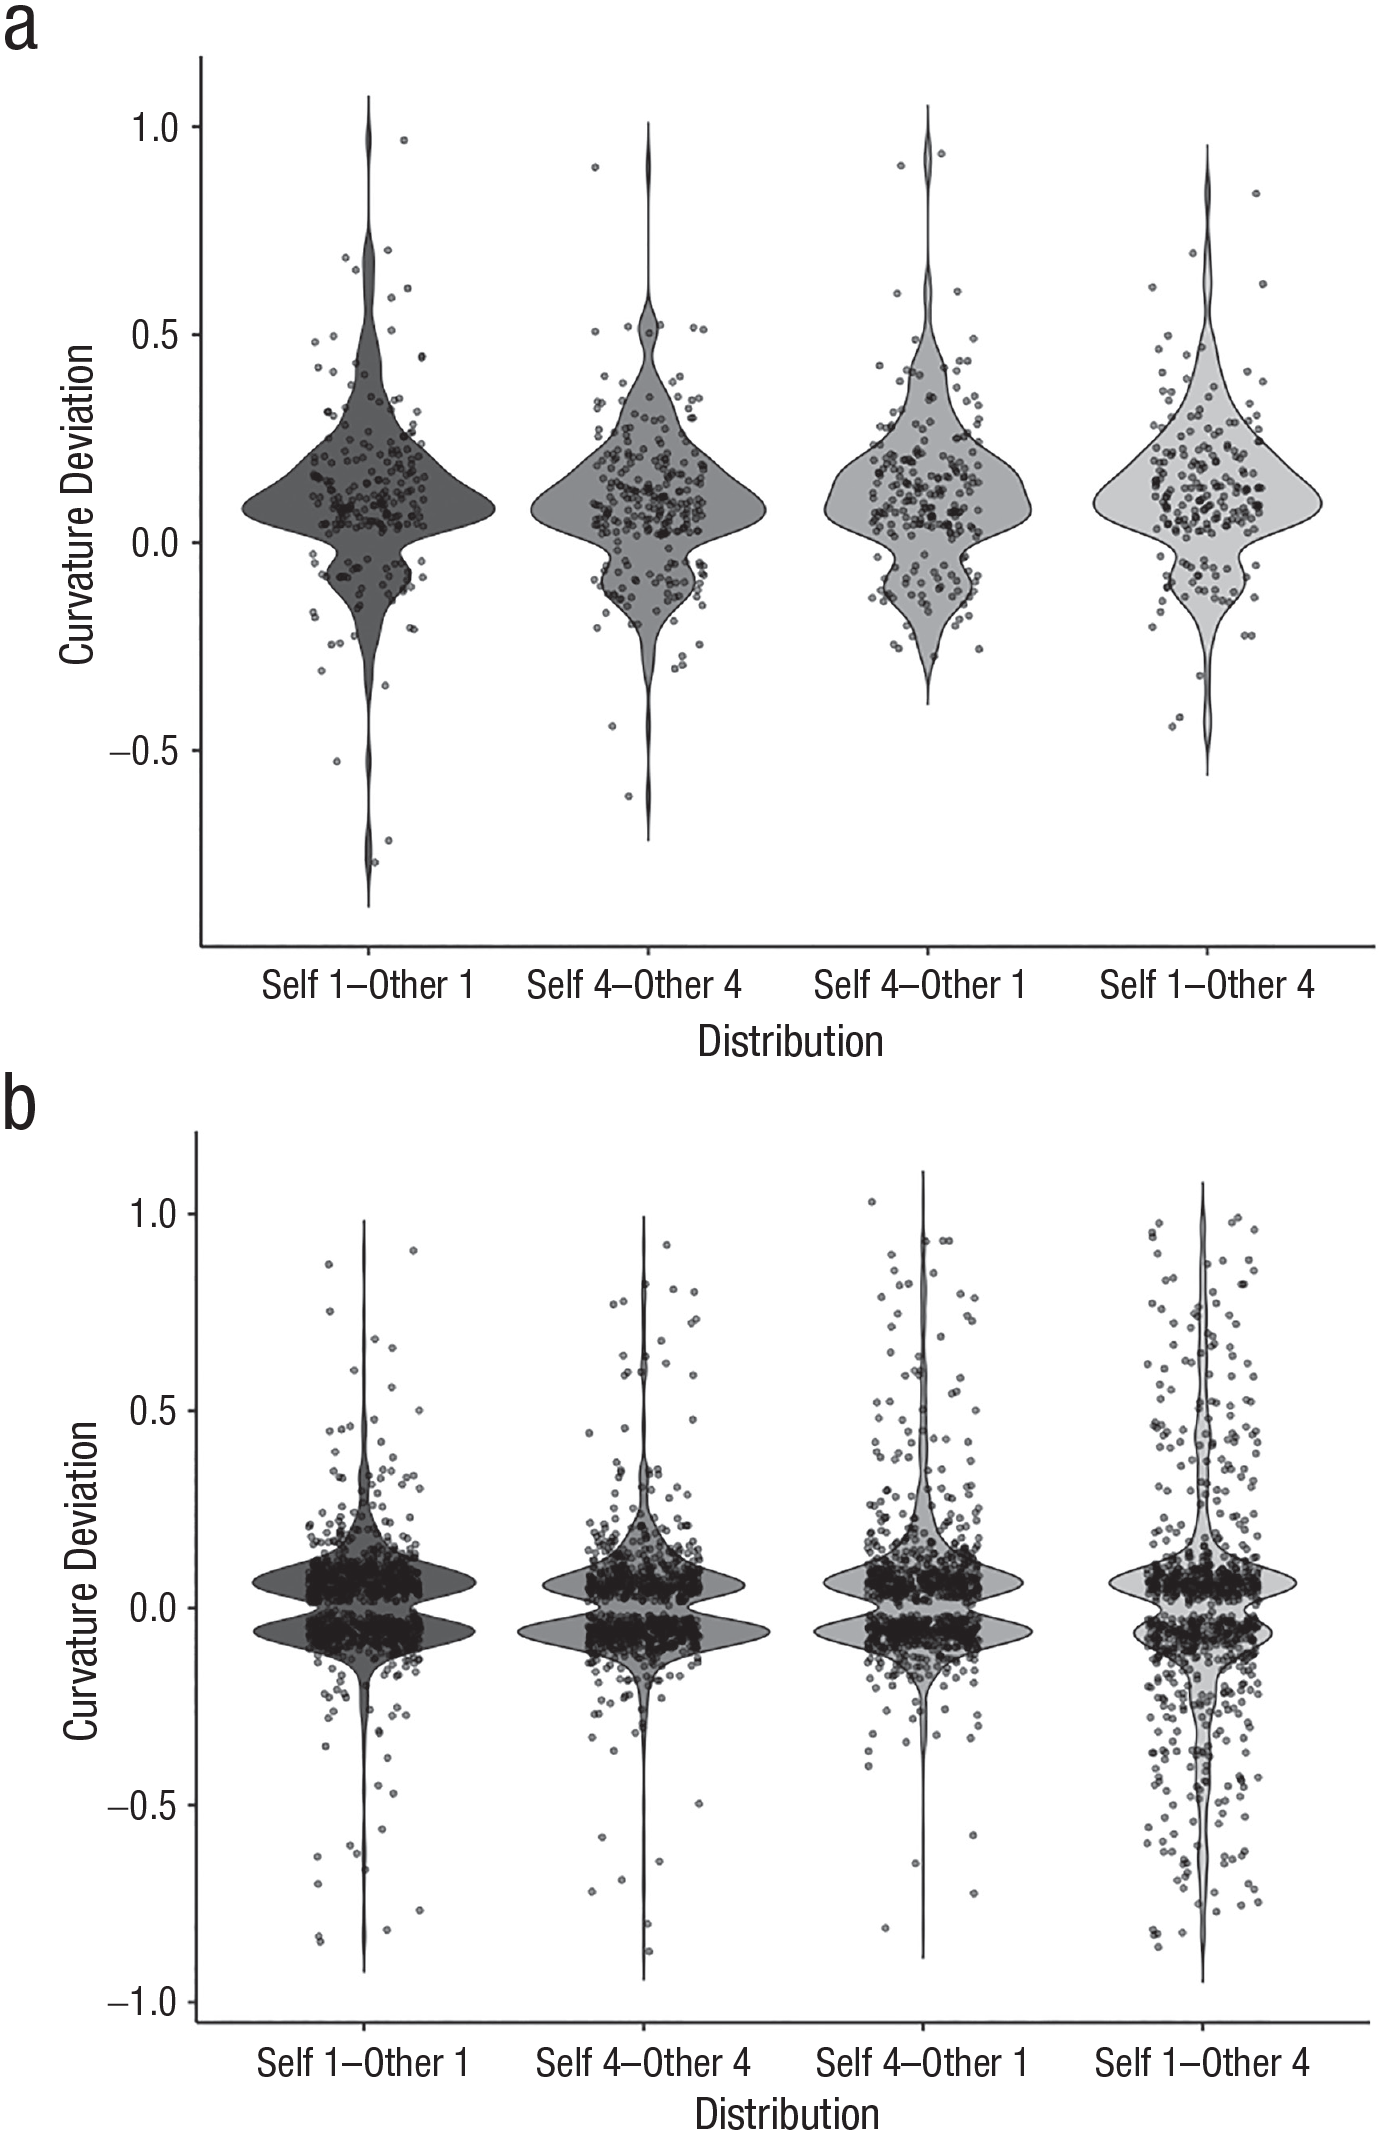
Average maximum curvature deviance for the four distributions for the child sample (a) and the adult sample (b).
However, in a more exploratory analysis, when only the two unfair distributions were considered including the choices children made in the analysis, a different pattern of results emerged. In this model, there was a main effect of trial number, with children becoming more deviant throughout the experiment, β = 0.003, SE = 0.001, 95% CI = [0.001, 0.006], Wald χ2(1) = 5.56, p = .02, OR = 1.003. Parameter estimates revealed no other main effects were present, but there was a significant interaction between the two unfair distributions and whether children chose to accept or reject the distribution, β = −0.65, SE = 0.29, 95% CI = [−1.21, −0.09], Wald χ2(1) = 5.13, p = .02, OR = 0.52, which was subsumed by a significant three-way interaction between distribution, choice, and age, β = 0.007, SE = 0.003, 95% CI = [0.001, 0.01], Wald χ2(1) = 5.47, p = .02, OR = 1.01.
To consider these interactions, we performed a median split by age on the data set. Data separated by choice to accept or reject the distribution are shown in Figure 7a (younger half of the sample; Mage = 71.59 months, range: 60−83 months) and Figure 7b (older half of the sample; Mage = 95.83 months, range: 84−107 months). We constructed the same general estimating equations on each half of the data set. The model of the older sample showed no significant results, except the significant effect of trial number, β = 0.004, SE = 0.002, 95% CI = [0.001, 0.007], Wald χ2(1) = 6.21, p = .01, OR = 1.01. The younger sample, by contrast, showed the same significant three-way interaction between distribution, age, and choice, β = 0.02, SE = 0.01, 95% CI = [0.002, 0.04], Wald χ2(1) = 4.71, p = .03, OR = 1.02. In particular, younger children showed more deviance when rejecting an advantageous inequity, β = −0.007, SE = 0.003, 95% CI = [−0.01, −0.001], Wald χ2(1) = 6.16, p = .01, OR = 0.99, but there were no other significant effects of age.
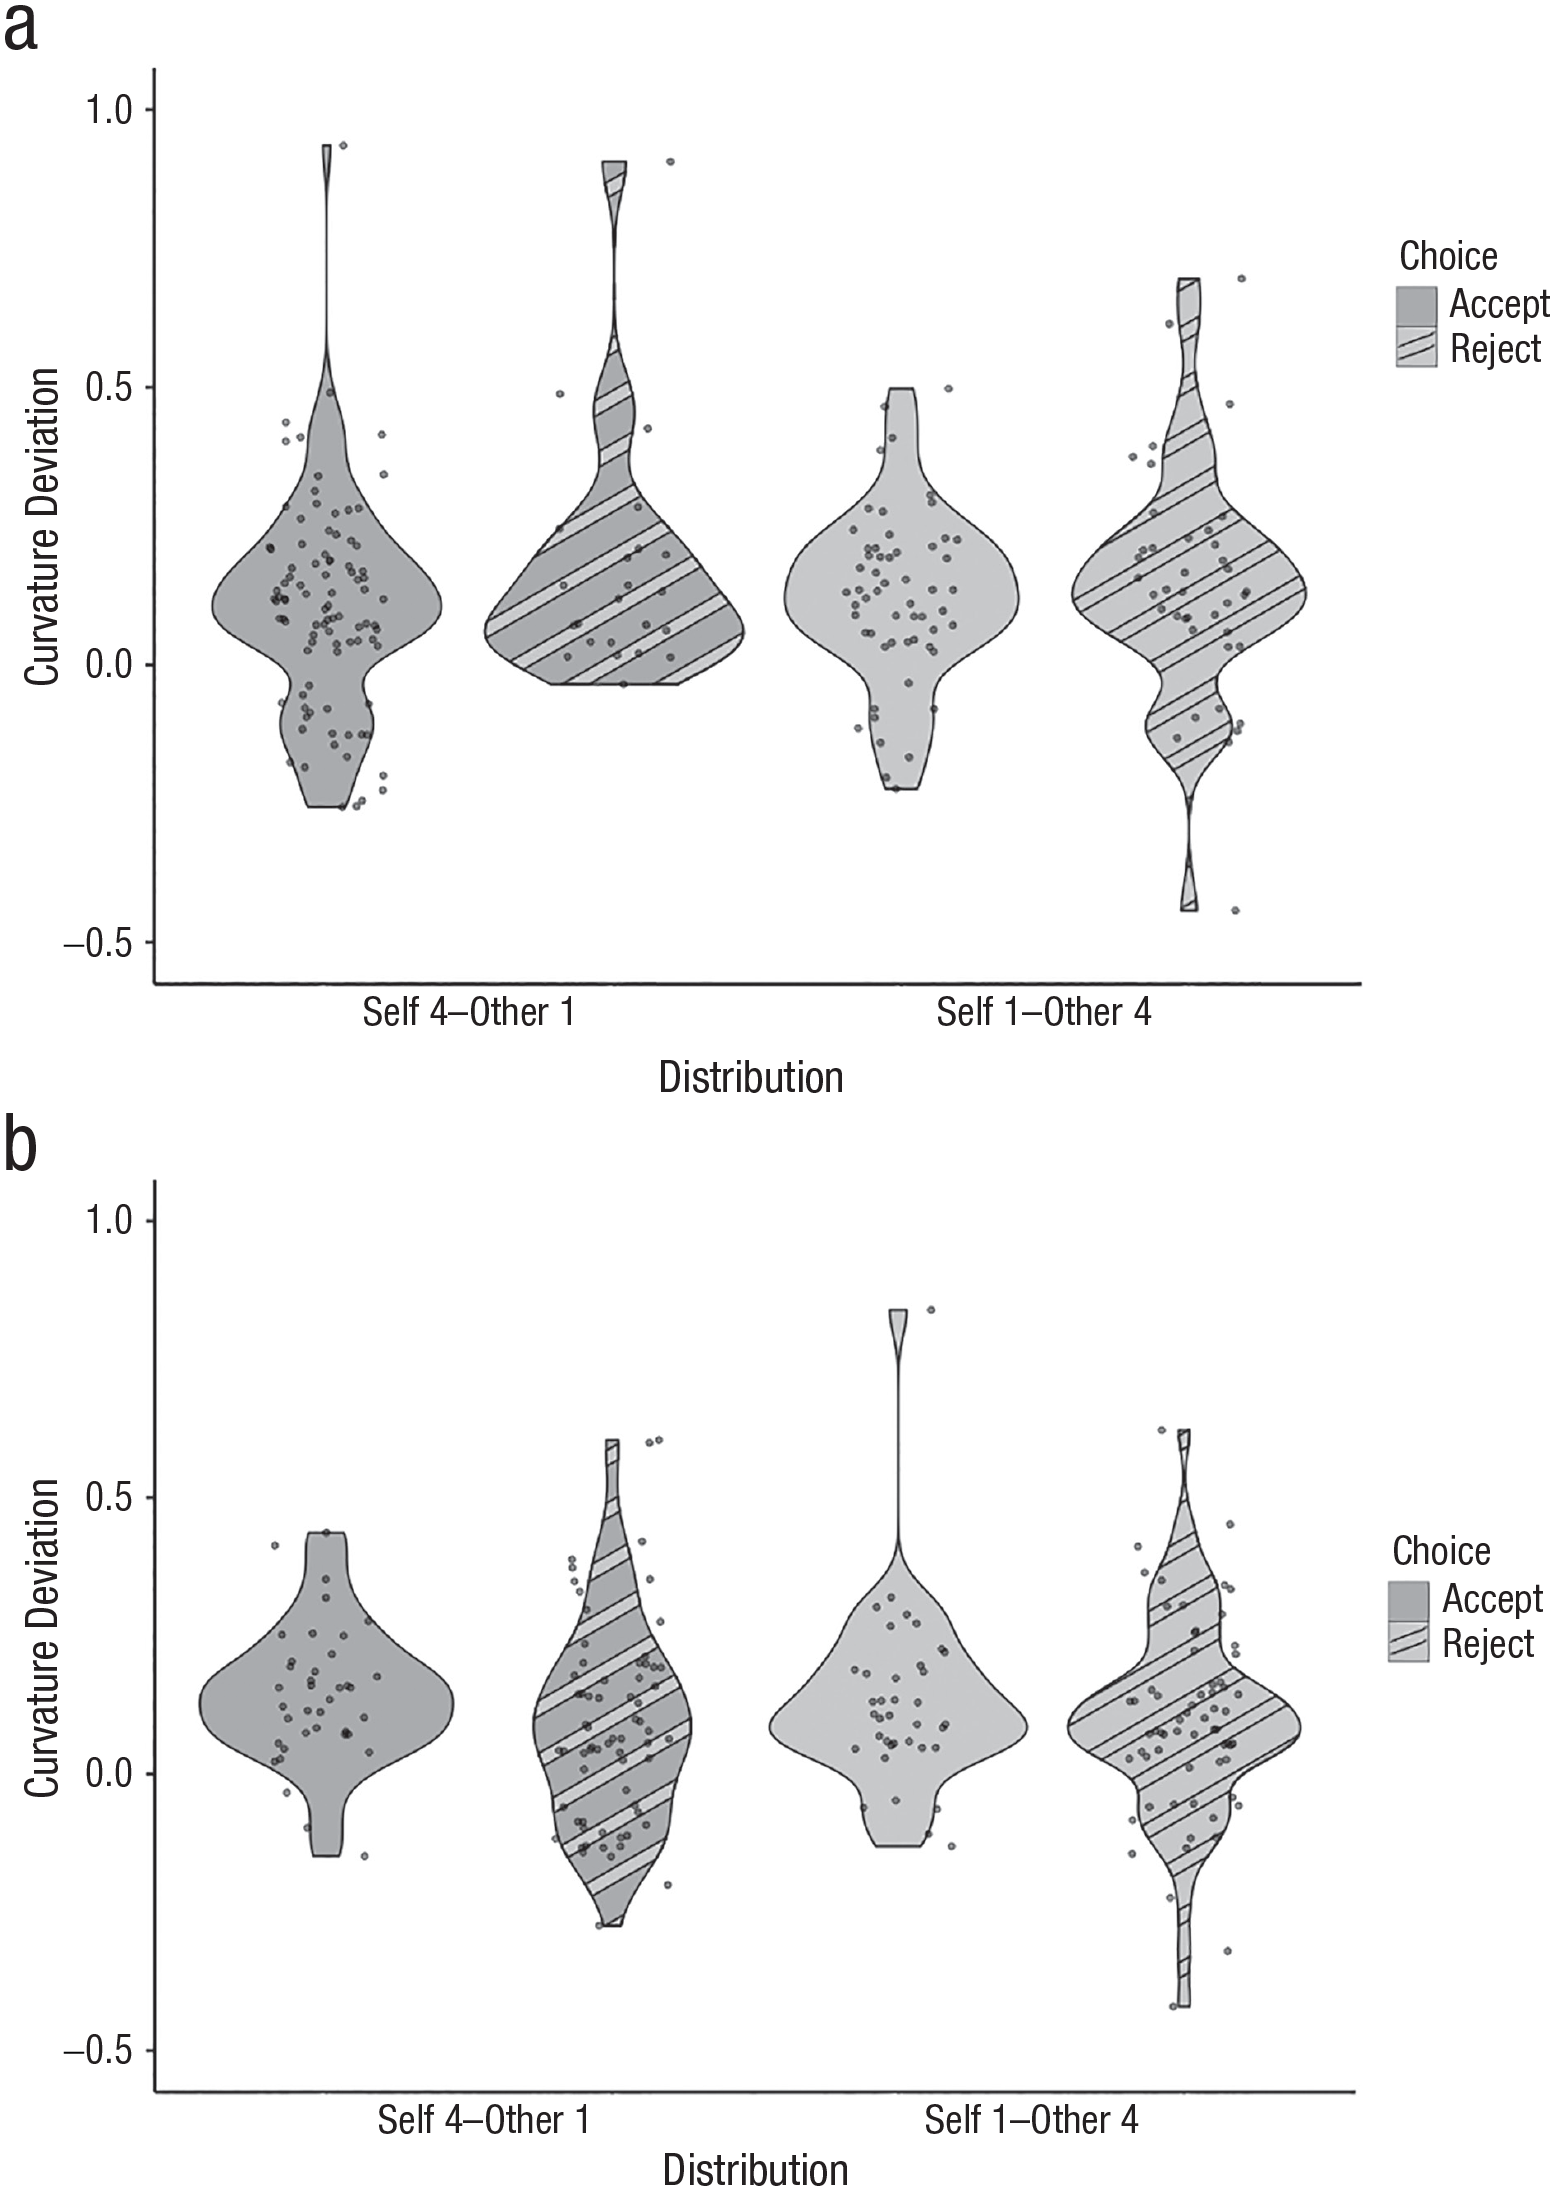
Curvature deviance for the younger half (a) and older half (b) of the sample on the two unfair distributions, based on the decision to accept or reject the distribution.
To analyze the adult data, we built a GEE model that examined trial number, distribution, and the choice that participants made on each trial. This model yielded only a significant interaction between distribution and choice, Wald χ2(3) = 10.33, p = .02, r = .06. Investigation of this interaction revealed that when adults rejected the 4-1 distribution, they were more deviant (M = .28, SE = .16) as opposed to when they accepted the 4-1 distribution (M = .02, SE = .01). However, adult participants rejected this distribution on only 8 out of the 835 trials that were analyzed. Indeed, when choice was not included in the GEE analysis, the analysis resulted in no significant effects, all Wald χ2 values < 0.61, all p values > .43.
Discussion
In this study, children aged 5 to 8 and adults were presented with four distributions of resources between themselves and another person which they could accept or reject while their responses were tracked over 3D space and time. Two distributions were fair, but with different quantities (1-1 or 4-4). Two were unfair, and either advantaged or disadvantaged the participant (4-1 or 1-4). The reach-tracking paradigm allowed us not only to measure the choice children made, but also to take two metrics—initiation latency and maximal curvature deviance—that reflect the distinct process of inhibitory control (Erb et al., 2016, 2017, 2018).
These findings suggest that there are distinct inhibitory processes involved in participants’ judgments about whether to accept or reject distributions of resources; certain inhibitory processes are stable by age 5, whereas others develop between the ages of 5 and 8 (and further throughout childhood). Both the children and adults we sampled required more response-threshold processing resources when making inferences about unfair distributions than when making inferences about fair distributions, and this was true across both samples. This was particularly true for the longer initiation-latency results for the disadvantageous inequity than it was for the other conditions.
On the surface, these longer initiation latencies for the unfair distributions might be seen as inconsistent with the results of the Chajes et al. (2022) study. Chajes et al. found that children were slower to respond when choosing to offer a fair distribution to another, as opposed to an advantageous inequity. Because our study considered the decision to accept or reject a distribution rather than to create one, more inhibitory resources might have been necessary when interpreting a disadvantageous inequity. In contrast, it is possible that more inhibitory resources are necessary to be fair as opposed to be greedy when creating a distribution. A future investigation could consider children’s choices of created distributions in the modified dictator game from that study using the reach-tracking paradigm; we might expect the choice to be fair to require more response-threshold demands and hence to have longer initiation latencies.
We also found that how children resolved the conflict between their detection of an unfair distribution and their decision to accept or reject it showed a developmental progression. This was indicated not only in their choices, but also in their changing maximal curvature deviance. This is a novel facet of the reach-tracking paradigm. When children rejected the advantageous inequity, younger children were more attracted to the alternate option (i.e., showed more curvature deviance) than older children. This suggests that when the older children in our sample rejected such distributions, they were potentially less swayed by gaining resources than by upholding a social norm of equity.
However, what is different between children and adults is how they responded to such advantageous inequities. Adults accepted almost all of the occurrences of the distribution in which they were given an advantageous inequity (98% of the trials) and accepted almost none of the occurrences of the distribution in which they were given a disadvantageous inequity (only 8% of the trials). This is potentially due to adults treating arbitrary points differently from the way children treat stickers, as well as adults potentially not showing the same advantageous-inequity aversion that was present in children’s responses (see also Camerer, 2003). This suggests that although the mechanisms we have articulated here describe children’s developing responses to fair and unfair distributions, there might still be fundamental changes beyond the age of 8 that might motivate different choices in adults. Extending this investigation to an older group of children might illuminate the mechanisms of the different patterns of responses.
A limitation of the present study is that the psychophysical nature of the procedure required in-person testing in a laboratory space in which participants must interact with an apparatus like a touch screen. This novel setting might have affected how some children responded. Although few children (and no adults) were excluded because they could not respond to the temporal dynamics of the procedure, investigating these findings with a broader sample would make the findings more generalizable.
Further, these data do not take into account the culture of the sample. Because of the in-person nature of the testing, the children tested here were mostly from middle- to upper-middle-class families in the northeastern United States, and the adults were college students at an Ivy League university. It is possible that the longer initiation latencies in response to the disadvantageous inequities reflected an inhibitory process in which the default is that participants are not often disadvantaged. Thus, participants might have required more inhibitory control to process distributions in which they received fewer resources. However, when participants were asked to reason about inequities, the means by which they resolved disadvantageous and advantageous inequities differed. The latter requires the inhibition of the desire to gain resources, which influenced the younger children in the sample more than the older children or the adults, even when they chose to reject the distribution. Such an assumption is consistent with the differential findings of Amir et al. (in press) on children’s decision-making across cultures (see also Blake et al., 2015). Amir et al. found different drift rates across cultures, so the relations between initiation latency and maximal curvature deviance might also be different. If such speculation is correct, we might not expect to see such effects if the reach-tracking paradigm is used in cultures where this might not be a default assumption. Thus, reproducing this study with a more diverse sample might not only extend the findings but might help further explore the mechanisms that underlie different cultural norms regarding inequity and their development.
In conclusion, this study provides novel insight into the development of children’s reasoning about inequities. Children in this sample, like adults, required more of one kind of inhibitory control to process that they were disadvantaged. This process was more akin to detecting conflict or recognizing that more resources are necessary to make a decision. As children got older, they were more likely to bring a different kind of inhibitory control to bear when resolving the conflict between an expectation of fairness and the actual distribution. For younger children, rejecting advantageous inequities potentially involved being more influenced by the fact that they were giving up resources, whereas for older children, the act of doing so might have been more influenced by upholding a fairness norm. An open question is whether these results correlate with children’s explanations or rationales for their decisions, which could be investigated in future studies. More generally, 3D reach tracking offers a novel method to study the role of inhibitory control as children are making decisions. Further research using this method could also consider what specific inhibitory processes are involved in measures of social cognitive development.
Footnotes
Acknowledgements
We would like to thank Angela Li, Sofia Gerlain, Hannah Inck, Abby Powell, Harper Robbins, Yuyi Taylor, and Jessica Tuchin for their assistance with participant recruiting, stimulus design, and testing.
Transparency
Action Editor: Leah Somerville
Editor: Patricia J. Bauer
Author Contributions