
Abstract
Recent research suggests imagery is functionally equivalent to a weak form of visual perception. Here we report evidence across five independent experiments on adults that perception and imagery are supported by fundamentally different mechanisms: Whereas perceptual representations are largely formed via increases in excitatory activity, imagery representations are largely supported by modulating nonimagined content. We developed two behavioral techniques that allowed us to first put the visual system into a state of adaptation and then probe the additivity of perception and imagery. If imagery drives similar excitatory visual activity to perception, pairing imagery with perceptual adapters should increase the state of adaptation. Whereas pairing weak perception with adapters increased measures of adaptation, pairing imagery reversed their effects. Further experiments demonstrated that these nonadditive effects were due to imagery weakening representations of nonimagined content. Together these data provide empirical evidence that the brain uses categorically different mechanisms to represent imagery and perception.
Keywords
For most people, the experience of mental imagery is categorically and undeniably different from visual perception. It is degraded, vague, fleeting, or even nonexistent. Despite these striking phenomenological differences, recent research on imagery suggests a tight coupling between imagery and perception. They share similar patterns of brain activity (Albers et al., 2013; Dijkstra et al., 2017; Lee et al., 2012; Naselaris et al., 2015; Pearson, 2019), and imagery shows functional effects much like weak perception in priming, learning, conditioning, and adaptation (Ishai & Sagi, 1995; Lewis et al., 2013; Pearson et al., 2008, 2015; Tartaglia et al., 2009). With the bulk of recent research pointing to the similarities between perception and imagery, the cause of such phenomenological differences remains unknown. A recently proposed hypothesis states that the neurophysiological mechanism behind the striking differences in imagery and perception might be the means by which the two different types of representations are formed: modulation versus driving (Koenig-Robert & Pearson, 2021). Perception-related feedforward connections have been classically regarded as driving, meaning that they increase spiking rates in the visual cortex, compared with baseline (Klink et al., 2017; Sherman & Guillery, 1998). Imagery is driven by feedback connections, which appear to largely modulate (although not always; see Aru et al., 2020; Bastos et al., 2012), often inhibiting rather than driving neuronal activity, especially in low-level visual areas (Bullier et al., 2001; Huang et al., 2007, 2017; Hupé et al., 1998). It is thus possible that the neural mechanisms supporting visual imagery representations are mainly explained by the modulation of ongoing activity (i.e., the baseline activity of visual areas) rather than the driving of neural spiking de novo above baseline. Two such different mechanisms, producing different levels of neural activity, might be the source of imagery’s different phenomenological experience from that of perception. Here, we aimed to test this hypothesis in a series of behavioral experiments utilizing the sensory bias of imagery on subsequent perception.
We first devised a novel use of binocular rivalry to compare the mechanisms behind imagery with sensory perception. The historical difficulty with assessing the representational nature of imagery, and comparing it with perception in behavioral experiments, is that the relationship between the visual energy (e.g., contrast) of a prior stimulus and its effect on subsequent processing displays a nonmonotonic function (Brascamp et al., 2007). Initial increases in visual energy will increase facilitatory effects on subsequent perception to a point (Fig. 1A: Priming). Then, any further increases in energy switch to suppression, as neurons encoding the relevant features start to fatigue, beginning a reduction in facilitatory effects (Brascamp et al., 2007). Accordingly, it has been difficult to pinpoint the precise location on the “stimulus energy” curve where the facilitatory bias of imagery begins (Brascamp et al., 2007; Chang et al., 2013; Chang & Pearson, 2018; Ishai & Sagi, 1995; Pearson et al., 2008; Tanaka & Sagi, 1998) as it falls on the nonmonotonic section of the function (orange color; left side of Fig. 1A). To overcome this, we utilized strong perception (i.e., high-contrast oriented gratings) to first bring the visual system in a state of adaptation, the monotonic side of the energy function (blue color; right side of Fig. 1A). Once in an adapted state, any further neural stimulation from those same visual features will increase adaptation effects, reflected here by suppression of those features from dominance in binocular rivalry (the other orientation will dominate). Thus, using this adapted state as our baseline enabled us to then disambiguate the functional nature of both weak perception and imagery, because any changes to the baseline would be unambiguous in that monotonic section of the curve.
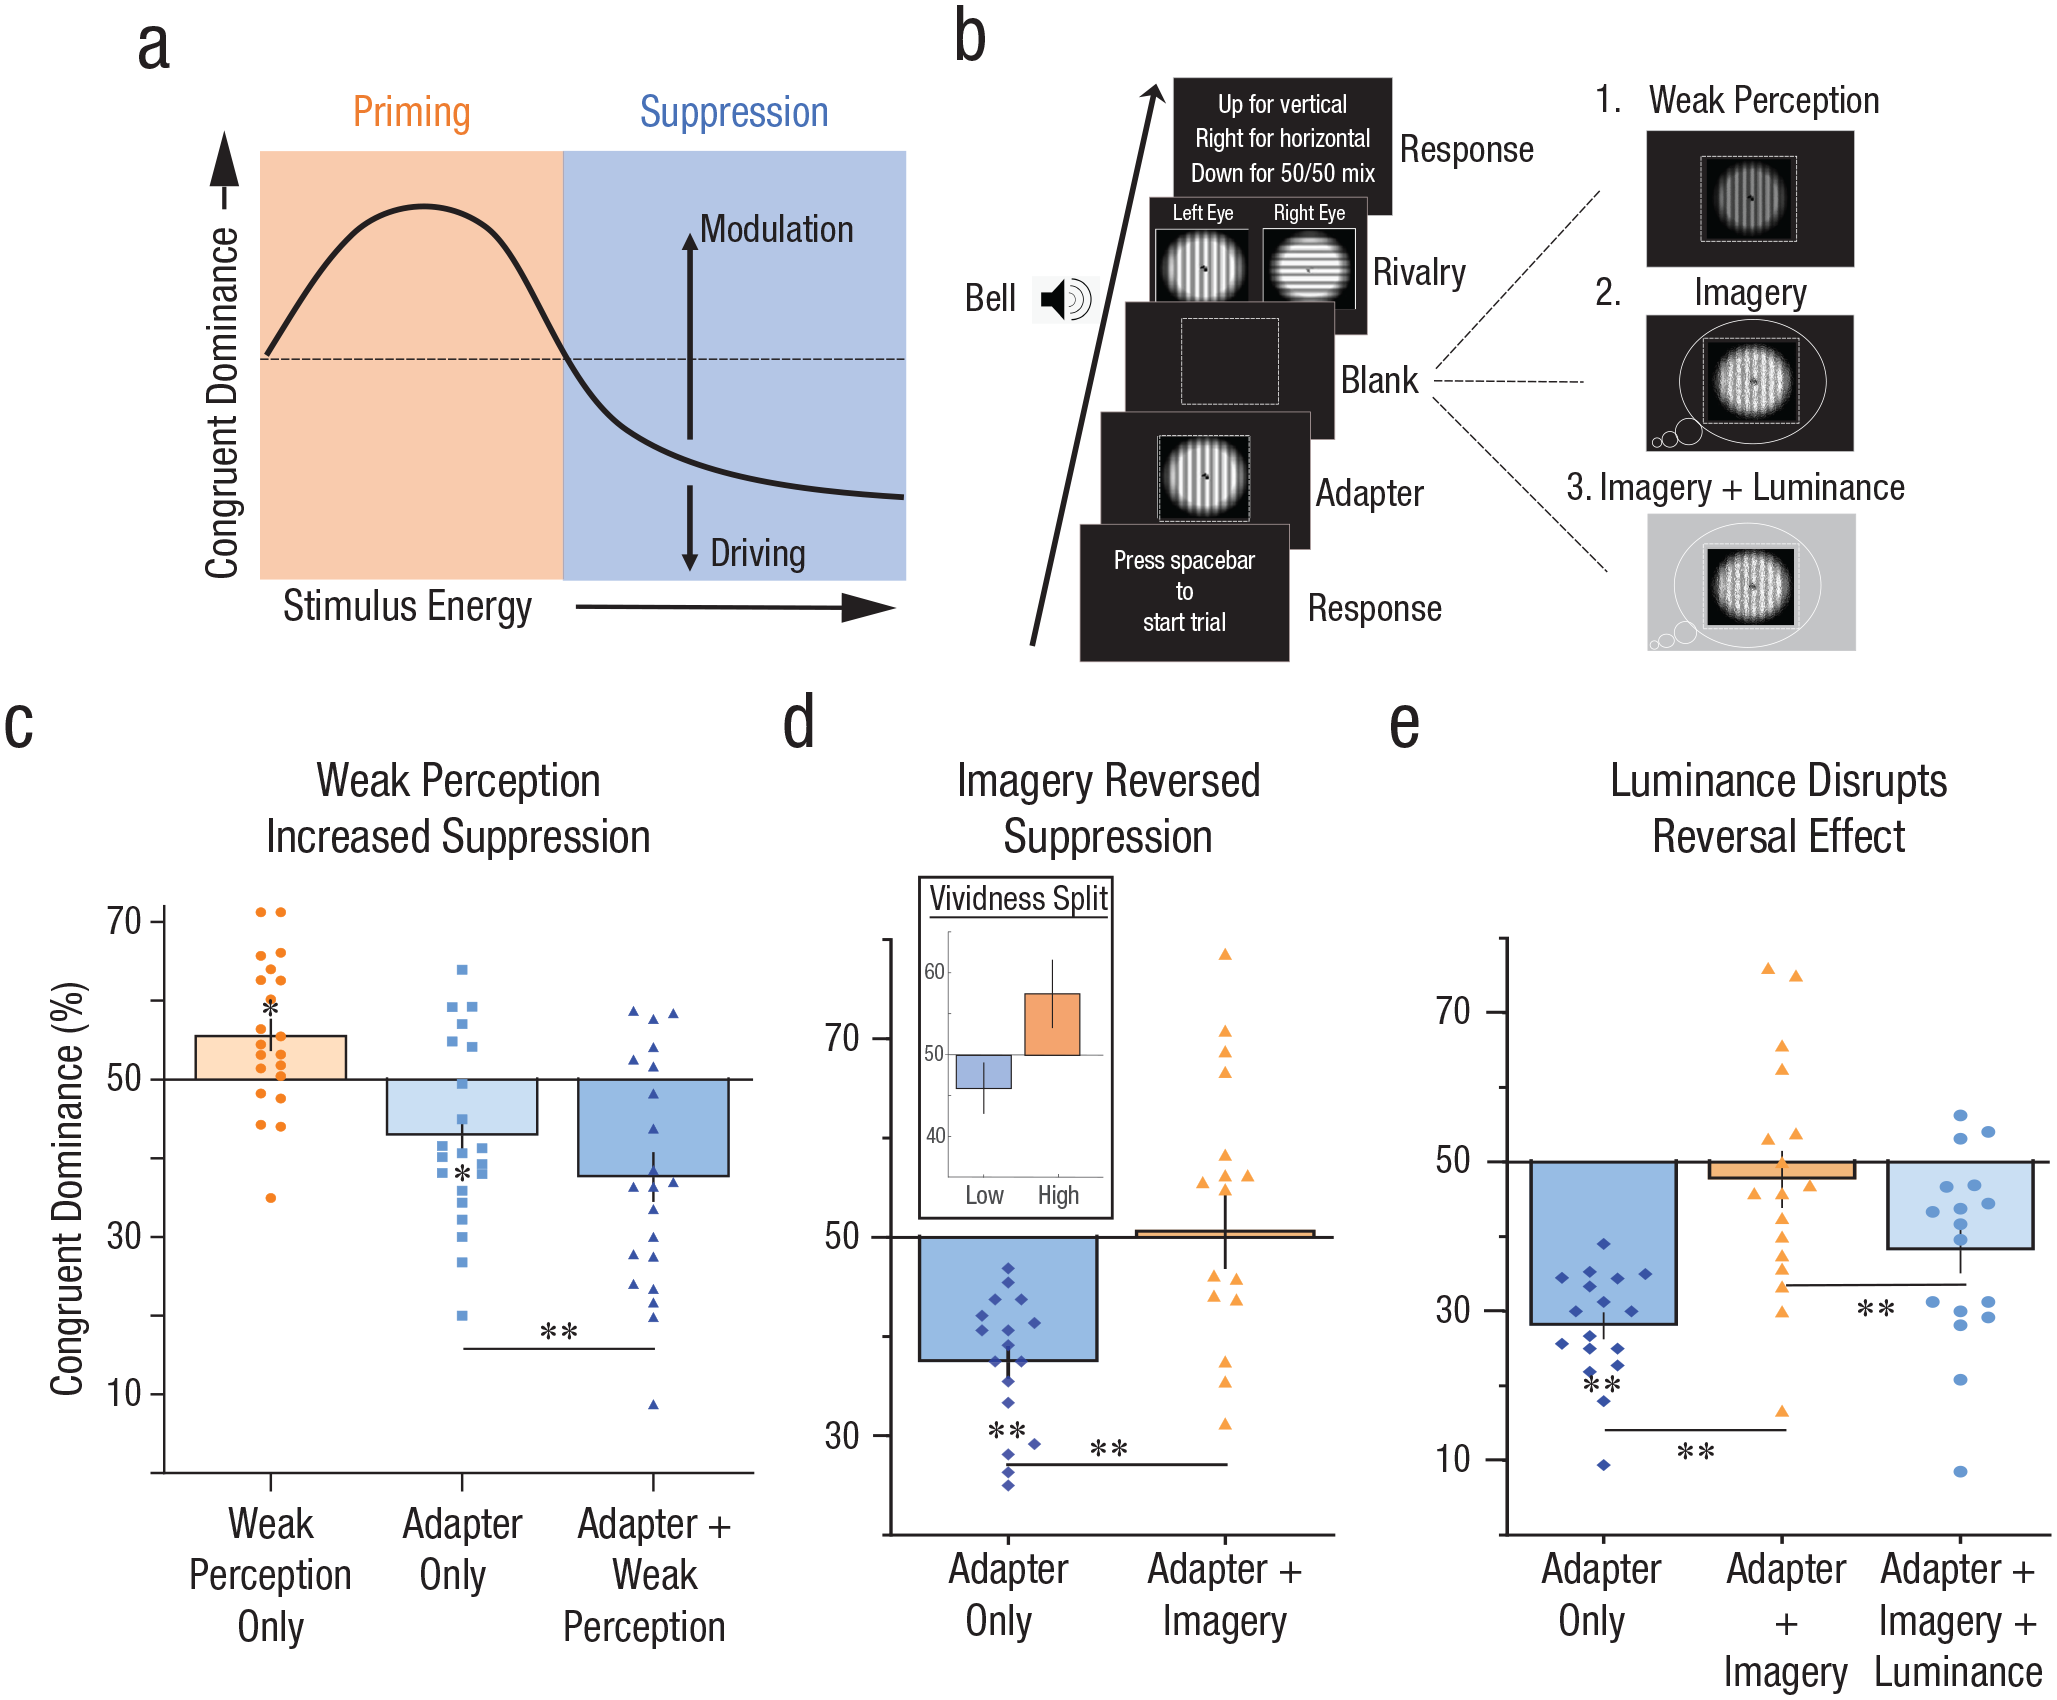
Adaptation paradigm, procedure, and results of the experiments. (a) Suppression paradigm. As a stimulus’s energy increases, it can initially increase priming by strengthening its perceptual trace for subsequent perception (blue area, priming). Once its energy begins to cause neuronal fatigue, any increase in energy will increase this fatigue and subsequent suppression of activity, leading to adaptation (blue area, suppression). If this nonmonotonic effect is not taken into account, it is unknown where one stimulus might exert its influence along the priming curve (either before or after the initial increase in priming with increase in energy). Therefore, in our paradigm, imagery was analyzed only in addition to adapters causing suppression, thus preventing ambiguity of the results. (b) Procedure for first three experiments. Participants viewed an adapter followed by a blank gap, then binocular rivalry, indicating what orientation dominated their perception. In the imagery condition, participants imagined the adapter after its presentation during the blank gap. In the imagery + luminance experiment, on half of the trials, the background would ramp up in luminance during the imagery time. In the perceptual experiment, instead of imagery, a weak perceptual prime was presented. (c) Weak perceptual stimuli increased the effect of the perceptual adapters, as predicted by the suppression curve. (d) The opposite effect was found for imagery, reversing the effects of suppression. (e) Experiment 1 imagery result was replicated, additionally showing that the brightness of the background reduced the effect, reflecting a perceptual and not cognitive effect of imagery on rivalry priming. All error bars represent standard error of the mean. An asterisk represents Bonferroni adjusted paired-sample t test p value less than .05; two asterisks, less than .025.
Method
Participants
Binocular rivalry experiments
All experiments were approved by the University of New South Wales Human Research Ethics Committee. All methods in this study were performed in accordance with the guidelines and regulations from the Australian National Statement on Ethical Conduct in Human Research (https://www.nhmrc.gov.au/guidelines-publications/e72). All participants gave informed written or online questionnaire consent to participate in the experiment as part of the requirements for their course. All participants had normal or corrected-to-normal vision. We aimed to test 15 to 20 participants in each experiment in order to replicate previous binocular rivalry research using mental imagery (Chang & Pearson, 2018; Pearson et al., 2011; Sherwood & Pearson, 2010). For Experiment 1: Weak Perception, we tested 23 participants (13 female, mean age 21.7 years), with two participants not finishing the experiment because of failure of eye dominance stabilization. For Experiment 2: Imagery, we tested 22 participants (15 female, mean age 21 years), with five participants failing to finish the experiment also because of failure of eye dominance stabilization. Last, for Experiment 3: Imagery + Luminance, we tested 22 participants (13 female, mean age 22.4 years), with five participants left out of final analysis also because of failure of eye dominance stabilization.
Statement of Relevance
Imagine trying to describe a favorite memory to a friend. The mental image is not as defined or strong as the original experience, right? Our research delved into this phenomenon, showing that the process of mental imagery and visual perception are quite different. When we imagine something, we create a sort of picture in our mind, but without the sensory input that comes from the eyes. To help create this mental picture, our brain employs a clever strategy: It dims the activity related to elements we do not imagine, rather like turning down the background noise to focus on a conversation. This paradigm shift in our understanding might explain why mental imagery is seldom experienced as richly as perception and may put an upper limit to its strength.
Visual discrimination experiments
For Experiment 4: Adapters + Imagery, we tested 19 participants (10 female, mean age 19.3 years), for Experiment 5: Imagery with No Adapters, we tested 11 participants (4 female, mean age 28.7 years).
Visual stimuli and apparatus
Binocular rivalry experiments
We used a Samsung 2494HS widescreen LCD monitor connected to a 14 HP Z230 Tower Workstation. The monitor had a resolution of 1,920 × 1,080 pixels and refresh rate of 60 Hz. Participants’ heads were placed on a chin rest 50 cm away from the monitor displayed in a dark room to reduce confounding visual variables.
A mirror stereoscope was used to present each eye with an oriented grayscale grating. A white square box (visual angle = 2.853o) with a white fixation point (visual angle = 0.157o) at the center was used in aiding binocular convergence for each eye (see Fig. 1B). In each experiment, a static vertical grating was presented to the left eye, and a static horizontal grating was presented to the right eye, with the fixation point in the center of each grating. The gratings (visual angle = 2.5126°, contrast = 15%) were defined by a sinusoidal modulation in stimulus contrast applied to a Gaussian-windowed mean luminance profile (spatial frequency 0.24 cycles per degree), ramping up in luminance at the center. Adapter gratings were presented monocularly, randomized to each eye across trials. The average luminance of the box was 77 cd/m2. Average luminance and contrast of the gratings changed for each participant depending on their adaptation results during QUEST (see Method: QUEST). The lowest luminance value used for gratings was 1.24 cd/m2, and the highest was 82.8cd/m2. The lowest-contrast value used was 3%, and highest was 100%. Background color was the black. We requested participants to maintain focus and fixate the fixation point.
Visual discrimination experiments
We used an Asus ROG PG279Q 27-inch LCD monitor connected to a 14 HP Z230 Tower Workstation. The monitor had a resolution of 2,560 × 1,440 pixels and refresh rate of 60 Hz. Participants’ heads were placed on a chin rest 50 cm away from the monitor displayed in a dark room to reduce confounding visual variables.All experiments were programmed and run in MATLAB (Mathworks, Natick, MA) using the Psychophysics Toolbox extensions (Brainard, 1997; Kleiner et al., 2007; Pelli, 1997).
Test stimuli were oriented gratings exactly as used in the binocular rivalry experiments with full contrast overlayed on visual noise (see Supplementary Figure 8 in the Supplemental Material). Static visual noise was a 50 × 50 pixel square box with luminance for each pixel randomly generated every trial, with average values of luminance = 1.99 cd/m2; CIE color space, x = 0.307, y = 0.373. The transparency of the test stimulus overlaying the visual noise was adjusted based on QUEST results per participant as described later (see Estimating Noise-to-Signal Ratios in the Supplemental Material).
Adapters were oriented gratings exactly the same dimensions as used in the binocular rivalry experiments (see Visual Stimuli and Apparatus), with orientations randomized across trials for each block. Adapters were presented for 5 s at full contrast with average luminance of 77.9 cd/m2. To avoid the confound of afterimages, adapters were presented in one of six phases (0°, 30°, 60°, 90°, 120°, or 150°, selected randomly) that randomly alternated every 0.16 s as per previous research (Bradley et al., 1988). Longer adapter times were used in this experiment compared with the binocular rivalry studies, as pilot experiments revealed that 3 or 4 s was not long enough to produce adequate suppression of discrimination accuracy. Background color was the black.
Procedure
Binocular rivalry experiments
Experiment 1: weak perception
After completing the QUEST: Estimating Adapter Contrasts blocks (see Supplemental Materials: QUEST), participants moved on to the main experiment for weak perception. Participants first viewed a screen with white text stating, “Press spacebar to start trial” (see Fig. 1B: Weak Perception). Once selecting spacebar, a 2.5-s blank gap was used before the first adapter was presented.
This experiment was split into three conditions: adapter only, weak perception only, and adapter + weak perception. In the adapter-only condition, an adapter grating was presented for 1.5 s, followed by a 1-s gap, followed then by binocular rivalry for 750 ms. In the weak-perception only condition, a 1.5-s blank gap was followed by a weakly presented grating for 500 ms, followed by a 500-ms blank gap, followed then by binocular rivalry for 750 ms. Finally, the adapter + weak-perception condition consisted of the adapter grating presented for 1.5 s, followed by the weakly presented grating for 500 ms, followed by a 500-ms gap, then the binocular rivalry for 750 ms. Thus, each condition’s trials took the same amount of time (3.25 s) and followed the exact same sequential logic. Gratings’ orientations were pseudorandomized across trials for each block. At the end of each trial, participants were presented with white text asking, “What did you see? Up for vertical, right for horizontal, down for 50/50 mixed.” After indicating what dominated rivalry with the arrow keys, a blank gap appeared for 2.5 s as an interval between trials. Participants on average completed 106 trials per condition, for a total of 318 trials for the experiment. Conditions were presented an equal number of times in a pseudorandomized order for each block.
Experiment 2: imagery
Participants followed the same sequence as in Experiment 1: Weak Perception, but with different adapter and blank-gap times. A longer gap was used in order to give time for participants to imagine gratings, which necessitated a longer time for adapter grating presentations in order for their effects to persist through to binocular rivalry. Thus, the adapter stimulus was presented for 3 s, followed by a 3-s blank gap (only focal point remains visible in box) and then binocular rivalry for 750 ms. Adapter gratings’ orientations were randomized across trials for each block. For the imagery condition, participants were asked to imagine the perceptual adapter as vividly as possible during the blank gap. They were instructed to “use their mind’s eye to imagine the adapter exactly as it was presented, as if it never disappeared off screen during the blank.” Following rivalry, participants were presented with white text asking, “What did you see? Up for vertical, right for horizontal, down for 50/50 mixed.” They were instructed to use arrow keys to indicate which orientation had dominated their perception during rivalry.
For imagery trials, after dominance was reported, new white text appeared, asking, “How vivid was your imagery? 1 for very low, 2 for moderate low, 3 for moderate high, 4 for very high.” Participants were instructed to indicate how clearly and vividly they were able to imagine the adapter stimulus during the gap. At the completion of every trial, a 2.5-s blank gap was used as an interval before the next trial began. For the adapter-only condition, participants performed four blocks of this task with 36 trials in each block, for a total of 144 trials (36 trials per grating contrast). For the adapter + imagery condition, participants performed four blocks of this task with 18 trials in each block, for a total of 72 trials (36 trials per grating contrast). Each block presented only one condition (adapter only or adapter + imagery), but blocks were counterbalanced across the experiment. Participants were encouraged to take short breaks at the end of each block. Before the session, participants completed a supervised training block to ensure they understood the task requirements.
Experiment 3: imagery + luminance
For Experiment 3, we investigated if the bias in rivalry was reduced due to bright luminance during the imagery period. Thus, the procedure was sequentially identical to Experiment 2 for the adapter-only and adapter + imagery conditions except for stimuli timings. In the adapter-only and adapter + imagery conditions, participants were presented with an adapter stimulus for 4 s, followed by a 5-s blank gap (only focal point and box present), followed by binocular rivalry for 750 ms. However, during the adapter + imagery + luminance condition, the background luminance of the screen increased during the imagery block as per previous experiments (Kwok et al., 2019; Pearson et al., 2008). Thus, a longer blank gap (and therefore longer adapter time) was necessary in order to account for the time for luminance to ramp up and down. During the 5-s imagery gap, luminance would smoothly ramp up for 1 s to white (luminance = 48 cd/m2; CIE color space, x = 0.301, y = 0.366), remain white for 3 s, then smoothly ramp back down to black for 1 s. For the adapter-only condition, participants performed four blocks of this task with 18 trials in each block, for a total of 72 trials (36 trials per grating contrast). For the adapter + imagery conditions, participants performed four blocks of this task with 18 trials in each block, for a total of 72 trials (36 trials per luminance condition). Adapter-only blocks were presented separate from imagery blocks. Imagery blocks contained an equal but pseudorandomized order of luminance and no-luminance trials. Adapter-only and imagery blocks were counterbalanced across the experiment. Participants were encouraged to take short breaks at the end of each block. Before the session, participants completed a supervised training block to ensure they understood the task requirements.
Discrimination experiments
Experiment 4: adapters + imagery
For experimental trials, once the space bar was selected, the text was immediately replaced by a fixation point for 2.5 s before the onset of the adapter stimulus. The adapter stimulus was then presented for 5 s, followed by a 3-s blank gap (only focal point remains visible) and then test stimulus for 50 ms (Fig. 1F). Test stimuli were presented in pseudorandomized order. The order of the orientation of adapters was pseudorandomized for each block such that an equal number of congruent- or incongruent-oriented adapters was presented for each test stimulus.
For the imagery condition, participants were asked to imagine the perceptual adapter previously presented as vividly as possible during the blank gap. They were instructed to “use their mind’s eye to imagine the adapter exactly as it was presented, as if it never disappeared off screen during the blank.” Following the test, participants were presented with white text asking, “What did you see? Up for vertical, right for horizontal, down for nothing.” They were instructed to use arrow keys to indicate which orientation they had seen within the visual noise. If they could not see an orientation, they were instructed to press the Down arrow. Following discrimination, participants viewed white text asking to select a number referring to their confidence in discrimination: “How confident? 1 for very low, 2 for moderate low, 3 for moderate high, 4 for very high.”
For imagery trials, following confidence reports, new white text appeared, asking, “How vivid was your imagery? 1 for very low, 2 for moderate low, 3 for moderate high, 4 for very high.” Participants were instructed to indicate how clearly and vividly they were able to imagine the adapter stimulus during the gap. At the completion of every trial, a 2.5-s blank gap was used as an interval before the next trial began. For each condition, participants performed six blocks of this task with 30 trials in each block, for a total of 180 trials (60 congruent, 60 incongruent, 60 no test stimulus). Adapter-only and imagery blocks were counterbalanced across the experiment. Participants were encouraged to take short breaks at the end of each block. Before the session, participants completed a supervised training block to ensure they understood the task requirements.
Experiment 5: imagery with no adapters
For this experiment, we aimed to keep the procedure as identical to Experiment 4 as possible but without the presentation of adapters. This was to investigate the possible effects of congruent and incongruent imagery on discrimination accuracy without adapters previously presented. As in previous experiments, participants were first prompted with white text stating, “Press spacebar to begin trial.” Once the space bar was pressed, the text was immediately replaced by a fixation point for 3 s with a white circle drawn following the edges of the test gratings (see Supplementary Figure 9 in the Supplemental Material). This provided an area in which to imagine lines during imagery trials. The circle was presented during imagery and non-imagery blocks in order to account for any potential effects it might have on discrimination accuracy. After 3 s, the test stimulus was presented for 50 ms. Following the test, participants followed the same procedure as before, indicating confidence ratings.
For the imagery condition, before each block, participants viewed a horizontal and a vertical grating with the same spatial frequency as test gratings in order to familiarize themselves with what to imagine. They were instructed to begin the block only after they became confident that they could imagine the gratings from memory. For each trial, participants were first presented with the fixation point and white circle, followed by a briefly presented text above the circle indicating which orientation to imagine (“Imagine vertical” or “Imagine horizontal”). The order of orientations participants were asked to imagine was pseudorandomized for each block. The text disappeared after 0.5 s, followed by a blank gap (only fixation point and circle remained on screen) for 3 s. Participants were asked to imagine the prompted oriented grating as vividly as possible during this blank gap (once the text had disappeared). Participants then answered vividness and confidence questions as in previous binocular rivalry experiments.
At the completion of every trial, a 3-s blank gap was used as an interval before the next trial began. For the no-imagery condition, participants performed three blocks with 30 trials in each, for a total of 90 trials (30 vertical, 30 horizontal, 30 no test stimulus trials). For the imagery condition, participants performed six blocks of this task with 30 trials in each block, for a total of 180 trials (60 congruent imagery, 60 incongruent imagery, 60 no test trials). No-adapter and imagery blocks were counterbalanced across the experiment. Participants were encouraged to take short breaks at the end of each block. Before the session, participants completed a supervised training block to ensure they understood the task requirements.
Results
As a proof-of-concept and sanity check, we sought to see if the effects of weak perception increased suppression from prior adaptation, as measured with subsequent rivalry. Once in a state of adaptation/suppression (blue area; right side of Fig. 1A), any further stimulation, even by a weak perceptual stimulus, should additively increase adaptation and hence increase suppression in subsequent rivalry (Fig. 1A) as documented previously (Brascamp et al., 2007). Accordingly, we first presented an adapter stimulus for 1.5 s, followed by a 1-s blank gap. In another condition, we presented a weak perceptual grating for 0.5 s in the blank gap in order to test if it would be additive to adaptation (Fig. 1B: Weak Perception). As in previous research (Brascamp et al., 2007; Chang & Pearson, 2020; Pearson et al., 2008; Pearson & Brascamp, 2008), adapter gratings presented alone suppressed their orientation from dominance in subsequent rivalry (Fig. 1C, light-blue middle bar, adapter-only condition), M = 42.9%, SEM ±2.56%, t(20) = −2.77, p = .0354, 95% confidence interval (CI) = [37.56 48.25], k = 3 (Bonferroni adjusted two-tailed t test against chance: 50%), and weak perceptual gratings presented alone produced rivalry priming (Fig. 1C, orange leftmost bar, weak-perception-only condition), M = 55.67%, SEM ±2%, t(20) = 2.76, p = .0366, 95% CI = [51.38 59.95], k = 3 (Bonferroni adjusted two-tailed t test against chance: 50%). Importantly, as predicted by Figure 1A, presenting the weak grating following the high-contrast adapter grating increased the suppression effects on subsequent rivalry compared with the adapter-only condition (Fig. 1C, blue rightmost bar, adapter + weak-perception condition), M = −5.3%, SEM ±1.3%, t(20) = 3.995, p = .0021, 95% CI = [2.5, 8], k = 3 (Bonferroni adjusted two-tailed t test). Thus, weak perception, when presented alone, had a facilitative priming effect, hence “mimicking” imagery in previous binocular rivalry experiments (Brascamp et al., 2007; Chang et al., 2013; Keogh & Pearson, 2011, 2021; Pearson et al., 2008). However, when presented following a high-contrast adapter, a weak perceptual stimulus produced an additive effect, increasing suppression and presumably the state of adaptation in visual cortex.
Imagined gratings, much like low-contrast perceptual gratings, produce facilitative priming effects on subsequent rivalry and detection tasks (Chang & Pearson, 2020; Ishai & Sagi, 1995; Pearson et al., 2008; Pearson & Brascamp, 2008). This has been interpreted as evidence of the representational similarity and mechanistic overlap between imagery and weak perception (Pearson, 2019; Pearson et al., 2015), supporting the theory that imagery is much like a weak version of afferent sensory perception. Such a theory would predict that imagery after strong perception would have additive adaptation effects, much like strong and weak perception. Accordingly, in a new experiment (Fig. 1B: Imagery), we tested if an adapter followed by an imagined grating would add to the adaptation effect much like a weak perceptual grating did. This experiment followed the same sequential logic as the weak perception experiment, however with different timings in order to allow time for imagery production. We thus presented adapters for 3 s, followed by a 3-s blank gap for imagery. During the blank gap, participants imagined the previously presented adapter grating until they heard a bell, which was followed by the rivalry stimuli. Again, the adapter alone produced strong suppression (Fig. 1D, blue left bar, adapter-only condition), M = 37.42%. SEM ±1.66%, t(16) = 7.58, p = 2.1866e-06, 95% CI = [34, 41], k = 2 (Bonferroni adjusted two-tailed paired-sample t test against chance: 50%). However, contrary to an excitatory-only imagery prediction, pairing imagery with the perceptual adapter had the opposite effect of pairing with weak perception, significantly reducing the level of suppression compared with the adapter-only condition (Fig. 1D, right orange bar), M = +13.36%, SEM ±3.4%, t(16) = −3.925, p = .0024, 95% CI = [–20.57, –6.14], k = 2 (Bonferroni adjusted two-tailed paired-sample t test against adapter only). This reversal of suppression suggests that imagery cannot be simply explained by driving excitatory activity analogous to weak perception.
To rule out any high-level decisional bias or attentional effects we ran several control conditions utilizing the documented disruptive effects of uniform background luminance on imagery. Bright uniform background luminance has been shown to reduce the amount of imagery priming but not for other cognitive functions, such as attention (Keogh & Pearson, 2011; Pearson et al., 2008; Sherwood & Pearson, 2010). In an independent experiment, we added uniform background luminance to the screen during the imagery period (Fig. 1B: Imagery + Luminance). Replicating our prior results, adapter alone again produced strong suppression (Fig. 1E, leftmost blue bar), M = 28.06%, SEM ±1.81%, t(16) = 12.12, p = 3.5760e-09, 95% CI = [24.22, 31.89], k = 2 (Bonferroni adjusted across-subjects two-tailed t test against 50% chance), and adding imagery to the adapter again significantly reduced suppression, replicating the effect (Fig. 1E, middle orange bar, adapter + imagery condition), M = +19.61%, SEM ±4.52%, t(16) = −4.34, p = .001, 95% CI = [–29.19, –10], k = 2 (Bonferroni adjusted across-subjects paired-sample two-tailed t test against adapter-only condition). Importantly, when imagery was performed against the uniform irrelevant background luminance (eyes open), there was a significant decline, M = −0.3444, SEM ±0.1088, in vividness ratings (Supplementary Fig. 11 in the Supplemental Material), t(16) = 3.1656, p = .006, 95% CI = [−0.5751, −0.1138], two-tailed t test. The presence of luminance also led to a significantly reduced effect of imagery on reversing suppression (Fig. 1E, rightmost light-blue bar), M = −10.11%, SEM ±3.25%, t(16) = 2.32, p = .0338, 95% CI = [0.85, 18.15], across-subjects two-tailed paired-sample t-test adapter + imagery condition difference with adapter + imagery + luminance condition), further suggesting this effect was driven by imagery rather than by response biases.
Across each imagery experiment, we also included catch trials (see Method) to assess any imagery-induced response bias, consisting of a sham rivalry stimulus (50/50 grating blend) as per previous research (Koenig-Robert & Pearson, 2019; Pearson et al., 2008; Rademaker & Pearson, 2012). Catch trials were reported veridically (as mixed) at high levels, 97.8%, p = 5.6103e-76, one-sample t test against chance. Together, both experimental controls, the background-luminance and catch trials, suggest that the reversal of suppression by imagery is occurring at a sensory level, ruling out high-level decisional explanations.
We then analyzed whether the subjective strength of imagery (vividness) has an effect on the results. In Experiments 2 (Imagery) and 3 (Imagery + Luminance), participants reported imagery vividness in a trial-by-trial basis (see Fig. 1B). To account for idiosyncratic self-report differences, we normalized vividness ratings by Z score per participant across the imagery condition, then split into low vividness (below-average vividness) and high vividness (above average) trials. Data from Experiment 2 (Fig. 1D inset) showed that low-vividness trials did not significantly reverse the adapter’s suppression effects on rivalry dominance (Supplementary Fig. 1 in the Supplemental Material), M = 8.3%, SEM ±3.68%, t(16) = 2.317, p = .068, 95% CI = [0.72, 16.34], k = 2 (Bonferroni adjusted two-tailed t test), but high-vividness trials did (Supplementary Fig. 1 in the Supplemental Material), M = 20.08%, SEM ±3.7%, t(16) = 5.422, p = .0001, 95% CI = [12.22, 27.93], k = 2 (Bonferroni adjusted two-tailed t test). This reversal of suppression during high-vividness trials was significantly stronger than any effect of low-vividness trials (Supplementary Fig. 1 in the Supplemental Material), M = 11.54%, SEM ±5.09%, t(16) = 2.2660, p = .0377, 95% CI = [0.74, 22.34], two-tailed t test.
Likewise, in Experiment 3 (Fig. 1E), high-vividness trials significantly reversed suppression in the adapter + imagery condition (Supplementary Fig. 2 in the Supplemental Material), M = 25.07%, SEM ±5.48%, t(16) = 4.57, p = 6.3600e-04, 95% CI = [13.44, 36.67], k = 4 (Bonferroni adjusted two-tailed t test against adapter-only condition), and the adapter + imagery + luminance (Supplementary Fig. 2 in the Supplemental Material), M = 19.07%, SEM ±5.66%, t(16) = 3.37, p = .0156, 95% CI = [7, 31], k = 4 (Bonferroni adjusted two-tailed t test against adapter-only condition). However, there was a reduced reversal in suppression for low-vividness trials in the adapter + imagery condition (Supplementary Fig. 2 in the Supplemental Material), M = 13.74%, SEM ±4.42%, t(16) = 3.11, p = .0268, 95% CI = [4.38, 23.1], k = 4 (Bonferroni adjusted two-tailed t test against adapter-only condition), and no significant difference in the adapter + imagery + luminance condition (Supplementary Fig. 2 in the Supplemental Material), M = 1.76%, SEM ±5.24%, t(16) = 0.33, p > 1, 95% CI = [–9.34, 12.87], k = 4 (Bonferroni adjusted two-tailed t test against adapter-only condition).
Overall, these analyses show that the vividness of imagery was important such that more vivid (subjectively rated as closer to perception) imagery had a stronger reversal of rivalry suppression. This is opposite to what would be predicted by an excitatory perception-like account of mental imagery (Koenig-Robert & Pearson, 2021). Thus, these results indicate that the suppressive (i.e., caused by adaptation) effects of perception and the faciliatory effects of imagery are nonadditive over time. Imagery actually reversed the suppressive effects of the adapters rather than increasing them. These data provide compelling novel evidence that imagery cannot be a weakened version of sensory perception and that the two must differ somehow in their neural mechanisms of image representation.
That weak perception had an additive effect with visual adaptation was unsurprising, given that prior research shows increasing stimulus energy of adapted features increases suppression of those features from rivalry dominance (Brascamp et al., 2007; Pearson et al., 2008). However, imagery’s reversal of suppression was a novel finding, which prompted us to investigate the underlying mechanism by which imagery elicited this effect. Because binocular rivalry contains both adapted and nonadapted patterns simultaneously (the two rivalry patterns), it was unclear whether imagery’s reversal of suppression was via modulation of adapted or nonadapted stimuli or a mixture of both. It is possible that imagery somehow resets the visual system’s state of adaptation, reversing neural saturation of adapted features. Alternatively, it is possible that imagery suppressed the nonimagined representation, as has been suggested for auditory activity during visual imagery (Amedi et al., 2005). Suppression of nonimagined features may have effectively balanced out the dominance between the adapted stimuli and its rival, resetting dominance toward chance level. Both hypotheses fit with the rivalry data thus far. We therefore devised an experiment to tease apart the possible mechanisms by which imagery reversed adapter suppression in rivalry.
In addition, we were also interested if these effects generalized beyond the paradigm of binocular rivalry. We hypothesized that imagery might be mainly weakening nonimagined representations (similar to attention; see Gazzaley et al., 2005) because of its reliance on modulatory (often inhibitory) feedback connections (Koenig-Robert & Pearson, 2021). This weakening of the nonimagined content might just have resembled a reversal of adaption caused by our use of rivalry as the dependent measure and its compound nature (e.g., two gratings presented simultaneously). We hypothesize that imagining the adapted grating might be mainly suppressing nonimagined content and hence representations of the nonadapted grating, thus effectively reversing the adapter’s suppressive effects on rivalry. To test this, we developed a perceptual discrimination paradigm in which participants discriminated the orientation of a single target grating among static visual noise, subsequent to an adapter and imagery (Fig. 2A). Having only a single grating as the dependent measure, as opposed to the two in the rivalry display, allowed us to test the effects of imagery on congruent or incongruent representations independently. Any weakening of the nonimagined representations would result in a relative lower performance in the incongruent-imagery condition. If, however, imagery was resetting the state of adaptation, then we should see a release from the adaptation elevation aftereffect in the congruent condition.
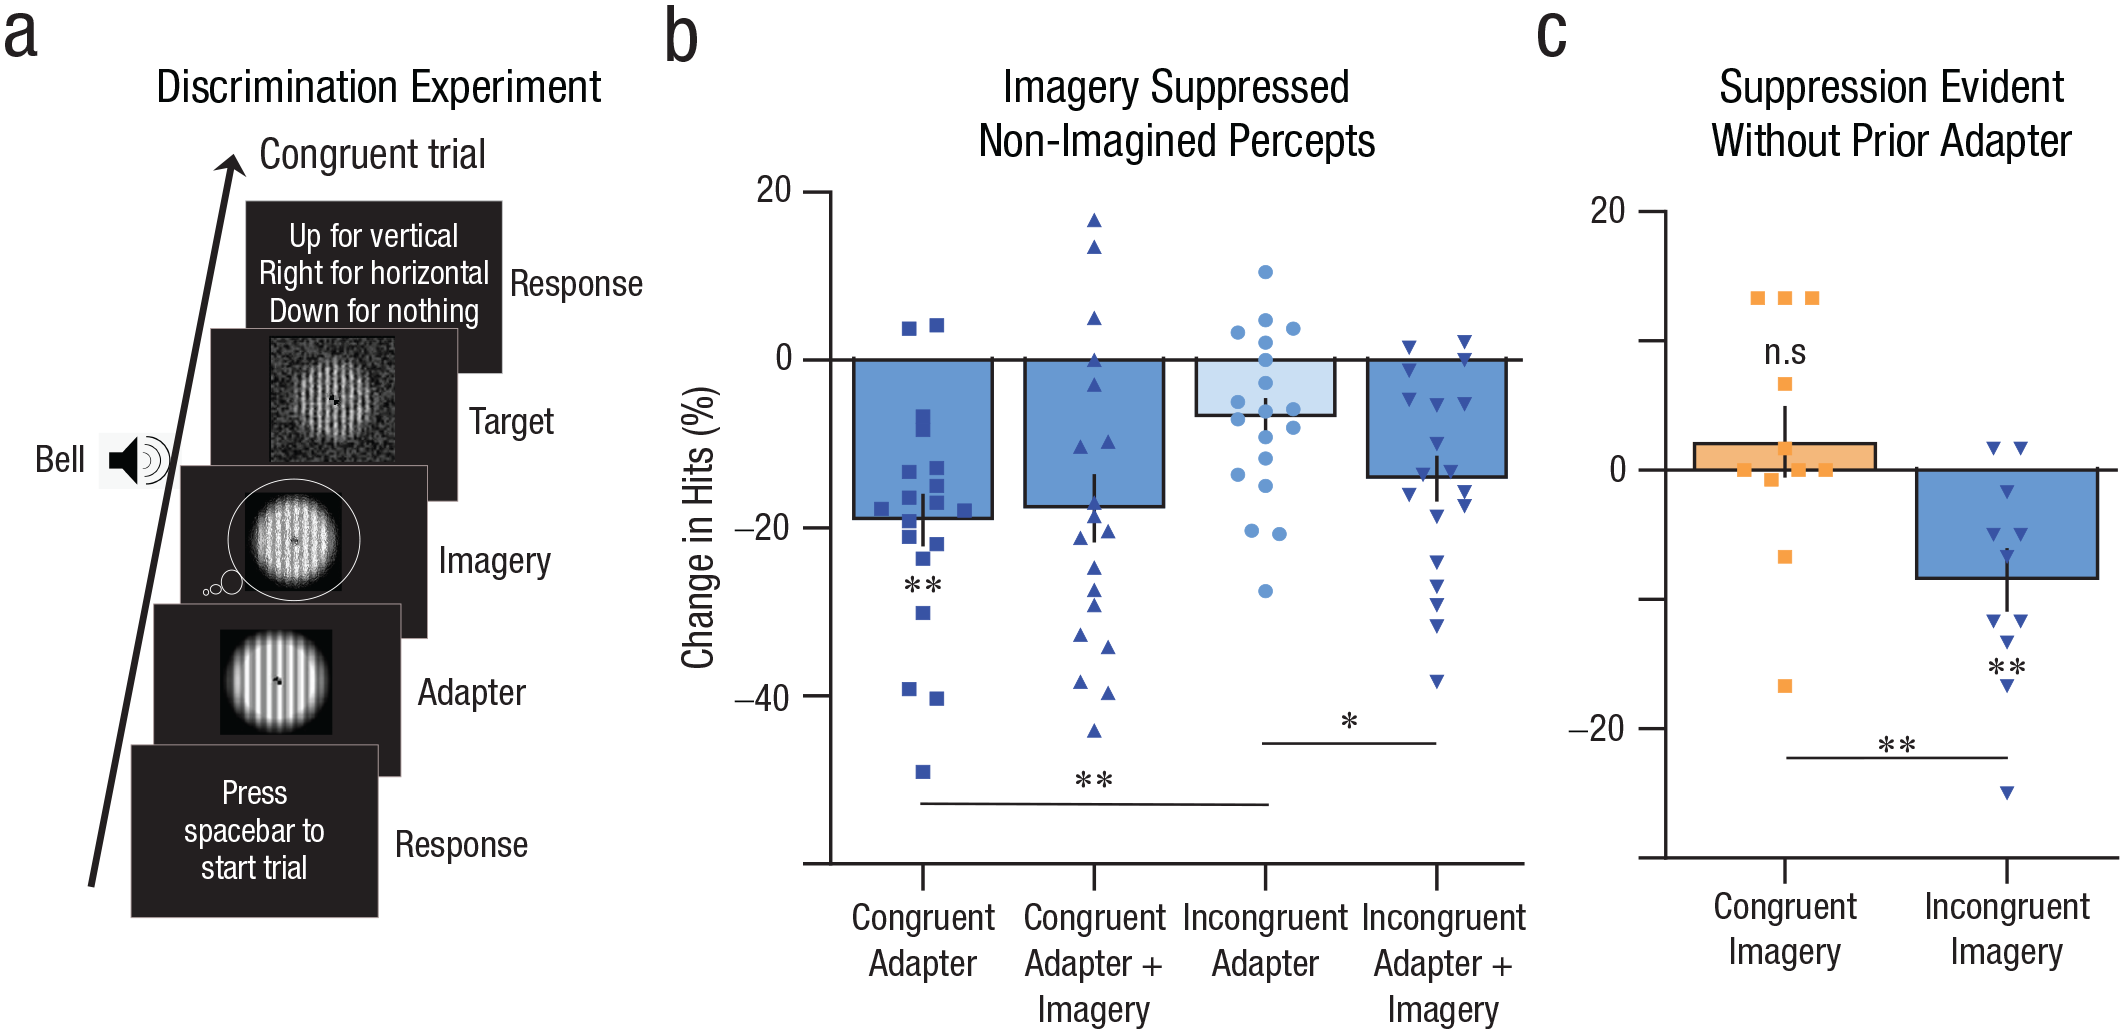
Discrimination experiment procedure and results. (a) Procedure for follow-up discrimination experiment. Participants viewed an adapter followed by a blank gap and then a weakly presented grating within visual noise. Congruent trials had adapters with orientations the same as the test grating, and incongruent trials had orthogonally oriented adapters to test. The adapter and imagery orientations were always the same regardless of condition. For imagery trials, participants imagined the oriented adapter as vividly as possible during the blank. (b) Congruent perceptual adapters led to stronger suppression of discrimination accuracy than incongruent adapters. However, imagining congruent adapters had no effect on discrimination accuracy, whereas imagining incongruent adapters did. This result suggests that imagery drove suppression effects in rivalry through inhibition of nonimagined visual feature processing. (c) Effect of imagery on discrimination accuracy without adapters presented prior. Incongruent imagery led to less discrimination accuracy than baseline. All error bars represent standard error of the mean. An asterisk represents Bonferroni adjusted paired-sample t test p value less than .05; two asterisks, less than .025.
In the adapter-only condition, 19 participants viewed a full-contrast oriented grating for 5 s, then a 3-s blank screen, followed by the target grating for 55 ms (see Method). The orientation of the target could either be congruent (Fig. 2A: Congruent Trial) or incongruent (90°) to the adapter. The orientation of imagined gratings was always the same as the adapter’s orientation. Figure 2B shows the reductions in target hit rates from the blank baseline condition (no adapter, no imagery). Congruent adapters significantly reduced the hit rate compared with baseline (Fig. 2B, leftmost blue bar), M = −19.03%, SEM ±3.13%, t(18) = 6.08, p = 1.4167e-05, 95% CI = [13.61, Inf]), k = 4 (Bonferroni adjusted two-tailed t test against baseline) and also in comparison to incongruent adapters (Fig. 2B, middle-right light-blue bar), M = −12.28%, SEM ±2.31%, t(18) = 5.325, p = 6.9237e-05, 95% CI = [8.28, Inf], k = 4 (Bonferroni adjusted two-tailed t test), an orientation-specific threshold elevation aftereffect (Blakemore & Nachmias, 1971; Regan & Beverley, 1985).
Adding congruent imagery following the congruent adapters during the blank gap led to no significant difference in hit rate compared with congruent adapters alone (Fig. 2B, middle-left blue bar), M = −1.39%, SEM ±2.99%, t(18) = 0.466, p = 2.5872, 95% CI = [–4.89, 7.68], k = 4 (Bonferroni adjusted two-tailed t test). Strikingly, adding incongruent imagery after the incongruent adapter (i.e., imagining the same orientation as the adapter but orthogonal to the test) led to a significant decrement in the hit rate compared with the incongruent adapter alone (Fig. 2B, rightmost blue bar), M = −7.35%, SEM ±2.54%, t(18) = 2.892, p = 0.0388, 95% CI = [2.01, 12.69], k = 4 (Bonferroni adjusted two-tailed t test). To assess potential response biases during this experiment, one third of trials were empty with only the visual noise presented at test. For these empty trials, participants made 21% false alarms on average, incorrectly indicating they had seen a grating. However, the orientation selected during false alarms was equally likely to be congruent or incongruent to imagery (Supplementary Fig. 3 in the Supplemental Material), M = −0.0025%, SEM ±7.4%, t(18) = −0.03, p = .97, 95% CI = [–15.79, 15.3] (two-tailed t test), suggesting no overt decisional bias. Hence, imagery’s suppressive effect on orthogonal orientation discrimination was likely driven by perceptual rather than a high-level decisional bias. These data suggest that imagery exerts its effect by weakening the nonimagined grating representation rather than resetting the state of adaption, thus effectively acting as a modulator, attenuating the nonimagined representations. This provides novel evidence for the proposed modulation hypothesis of mental imagery (Koenig-Robert & Pearson, 2021): that imagery might be down-regulating nonimagined feature processing.
We further wanted to investigate whether perceptual adapters had any impact on the false-alarm rates and if these could reveal some sort of attention effect or criterion shift. We therefore analyzed whether false alarms were impacted by the presence of an adapter before the test stimuli. We found that false alarms (i.e., participants stating they saw a grating of either orientation on blank test trials) were significantly higher when following an adapter compared with the nonadapter condition (Supplementary Fig. 9 in the Supplemental Material), M = 14.58%, SEM ±3.58%, t(18) = 4.0728, p = 7.1423e-04, 95% CI = [0.0706, 0.2210] (two-tailed t test, noncorrected). However, there was no significant difference in congruent or incongruent false alarms (Supplementary Fig. 10 in the Supplemental Material), M = 1.33%, SEM ±1.15%, t(19) = 1.1587, p = 0.2617, 95% CI = [–0.0108, 0.0375] (two-tailed t test, noncorrected). This means that participants were equally likely to state that they had seen either orientation during blank trials regardless of the orientation of the preceding adapter. Thus, as in the imagery condition, perceptual adapters were not driving a criterion shift toward or away from their orientation.
To further ensure that the adapter prior to imagery was not somehow changing the nature of imagery, we ran a follow-up experiment without the adapters (see Method). Incongruent imagery led to significant reduction in discrimination accuracy compared with congruent imagery (Fig. 2C), M = −10.69%, SEM ±3.17%, t(10) = 3.37, p = .007, 95% CI = [−17.75, −3.62] (two-tailed t test), and no-imagery baseline (Fig. 2C), M = −8.48%, SEM ±2.46%, t(10) = −3.454, p = .012, 95% CI = [−13.96, −3], k = 2 (Bonferroni adjusted two-tailed t test). In other words, participants got worse at the discrimination task after imagery of the orthogonal orientation, not better. Interestingly, this is the opposite effect typically found postadaptation to orthogonal perceptual gratings (Clifford et al., 2001, 2003; Westheimer & Gee, 2002, 2003). These results further suggest that imagery mainly attenuated the representations of nonimagined features (orientation), rather than resetting the adaptation to the baseline, and provide further evidence for imagery behaving in ways that are often opposite to perception. Interestingly, here congruent imagery did not lead to a significant increase in accuracy compared with baseline (Fig. 2C), M = 2.21%, SEM ±2.78, t(10) = 0.79, p = 0.89, 95% CI = [–3.98, 8.4], k = 2 (Bonferroni adjusted two-tailed t test), a result not in line with previous priming research (Ishai & Sagi, 1995; Pearson, 2019). However, trials rated as more vivid did trend toward stronger priming compared with low-vividness trials (Supplementary Fig. 4 in the Supplemental Material), t(10) = 1.35, p = .1, 95% CI = [–Inf, 2.63] (across-subjects one-tailed t test, noncorrected).
Interestingly, vividness during incongruent imagery showed an opposite trend, with high-vividness trials trending toward significantly lower hits than low-vividness trials (Supplementary Fig. 4 in the Supplemental Material), t(10) = 1.27, p = .12, 95% CI = [–4, Inf] (across-subjects one-tailed t test). Furthermore, congruent-imagery trials that led to hits had significantly higher average vividness scores compared with hits that followed incongruent-imagery trials, t(10) = 2.04, p = .0343, 95% CI = [3.87, Inf] (across-subjects one-tailed t test, noncorrected). This shows that imagery vividness was positively correlated with discrimination accuracy for congruent imagery and negatively correlated with incongruent imagery. Importantly, this experiment also included empty catch trials to assess bias. On these trials, participants made an average of 16.32% false alarms and had no significant bias toward congruent or incongruent gratings (Supplementary Fig. 5 in the Supplemental Material), t(10) = 2.09, p = .064, 95% CI = [–0.2, 6.7] (two-tailed t test, noncorrected).
Discussion
Overall, our results provide novel behavioral evidence that imagery and perceptual representations are sustained by different neural mechanisms. Across multiple experiments and replications, we show that although weak perception and imagery can seemingly have similar functional effects on subsequent perception (facilitatory), the two processes seem to have different representational mechanisms. When in a state of adaptation, weak perception was additive, increasing the level of adaptation, as “read out” by greater rivalry suppression. Imagery was nonadditive, and actually subtractive, meaning that it eliminated the effects of prior adaptation on rivalry. Further, we show that these effects are linked to imagery vividness, they are liable to disruption by concurrent uniform background luminance, and biases in rivalry reporting can be ruled out by the veridical catch trials.
Our visual discrimination experiments showed that imagery was not simply reversing the state of adaptation and “refreshing” imagined feature processing. Instead, the data suggest that imagery mainly drives suppression of nonimagined feature representations, which cancelled out the suppressive effects of prior adapters on rivalry. Together, these data suggest that imagined visual representations may, in part, be formed by suppressing nonimagined representations. Thus, unlike perception, which predominantly drives neuronal spikes, imagery’s effect on early visual areas might be operating by a mechanism of neural modulation possibly in conjunction with weaker excitation rather than chiefly excitation alone.
There are, however, other possible interpretations of these results, as the observation that imagery did not increase adaptation does not necessarily rule out excitatory-only accounts of imagery. It is possible that imagery activates a representation that is sufficiently distinct from perceptual representations to not increase adaptation. However, several studies have shown that imagery representations overlap with perception both functionally (Chang et al., 2013; Chang & Pearson, 2018; Dijkstra et al., 2021, 2022; Keogh et al., 2020; Keogh & Pearson, 2011; Pearson et al., 2011; Pearson & Brascamp, 2008; Sherwood & Pearson, 2010) and spatially (Cichy et al., 2012; Dijkstra et al., 2017, 2019; Ganis et al., 2004; Naselaris et al., 2015). Furthermore, outside of binocular rivalry, imagery has been shown to produce adaptation aftereffects akin to perceptual adapters (Mohr et al., 2009, 2011; Winawer et al., 2010; Zamuner et al., 2017). Thus, that imagery was nonadditive to perceptual adaptation was surprising given the evidence for representational overlap with perception. Further, even with sufficient nonoverlap to explain the nonadditive effect, nonoverlapping representations would not explain the suppression reversal effect back to baseline that we observed in our results.
Based on our findings, it appears that the most parsimonious explanation is that mental imagery uses inhibition as a mechanism to construct perception-like visual representations (Koenig-Robert & Pearson, 2021). This is supported by the fact that mental imagery was nonadditive to adapter-induced suppression and, indeed, seems to reverse it. Mental imagery reversed suppression in rivalry and suppressed nonimagined feature discrimination. These findings suggest that mental imagery is likely using inhibition as a key mechanism to build its visual representations rather than solely excitation.
The neurophysiological mechanism behind the striking phenomenological differences between imagery and perception might then be due to the neural mechanisms by which the two different types of representations are formed: modulation and excitation (Koenig-Robert & Pearson, 2021). Results from functional magnetic resonance imaging research, showing the blood-oxygen-level-dependent (BOLD) response from imagery, have often been interpreted as evidence for imagery driving spiking in visual cortex (Albers et al., 2013; Chen et al., 1998; Kosslyn & Thompson, 2003; Mellet et al., 2000; Naselaris et al., 2015; O’Craven & Kanwisher, 2000; Reddy et al., 2010; Slotnick et al., 2005; Stokes et al., 2009; Thirion et al., 2006), even though BOLD responses are produced by both excitatory and inhibitory presynaptic inputs (Logothetis, 2008). However, our data suggest and electrophysiological work has shown that feedback more often modulates existing spiking activity in early visual areas, rather than generating spiking de novo (Bullier et al., 2001; Huang et al., 2007, 2017; Hupé et al., 1998). While afferent perception drives spiking in visual cortex, imagery feedback signals may in part form representations via modulation of ongoing activity by down-regulating neural activity associated with nonimagined feature processing. This down-regulation is evident in the deleterious effects of imagery on perceptual discrimination and the reversal of adapter effects in binocular rivalry. Thus, our results call for further investigation to move imagery research beyond the common heuristic that imagined representations are simply a “weak form of perception.”
Interestingly, prior research has suggested that during visual imagery, the auditory cortex is deactivated (Amedi et al., 2005). Likewise, in our data, it would seem that nonimagined features are deactivated or suppressed. This suggests that feedback signals inducing a mental image are modulatory, suppressing neural activity coding for nonrelevant processing, as seen in recent work on attention (Couperus & Mangun, 2010; Daffner et al., 2012; Gazzaley et al., 2005; Lin, 2014; Wühr & Frings, 2008) and working memory (Feldmann-Wüstefeld & Vogel, 2019; Fukuda & Vogel, 2009; Sawaki & Luck, 2011; Zanto & Gazzaley, 2009). In previous electrophysiology work, attention has been shown to facilitate enhancement of signals driven by the attended stimulus while suppressing signals driven by the unattended stimulus (Forschack et al., 2017). Is it possible that imagery is using a similar mechanism on the endogenous ongoing activity in the brain (Koenig-Robert & Pearson, 2021)? As both imagery and attention use feedback mechanisms to modulate activity in the visual cortex, it is likely imagery would make use of similar suppressive mechanisms to attention.
Previous studies have shown that imagery can facilitate perceptual detection, likely through increasing stimulus specific sensory evidence (Dijkstra et al., 2021, 2022; Ishai & Sagi, 1995). Our findings provide additional insight into how imagery might facilitate perceptual processing through inhibition. Indeed, imagery may add stimulus-specific perceptual information via the mechanisms of inhibition to reduce sensory noise. Normalization models of neural activity suggest that the strength of stimulus-specific neural responses are determined by a ratio of stimulus drive (i.e., stimulus-specific excitatory activity) and noise (i.e., excitatory activity of nonpreferred neurons; Carandini & Heeger, 2012). This means that the strength of a stimulus’s sensory representation can be increased by increasing the intensity of the stimulus (e.g., by increasing its gain). However, the strength of the representation can also be enhanced by reducing irrelevant nonpreferred activity (i.e., noise), which increases the relative difference between stimulus input activity and noise. This theoretical framework provides a plausible avenue for understanding how imagery might increase stimulus-specific sensory evidence through inhibition. Similar results have been observed using attention, which has been shown to sharpen selectivity and neural responses of attended-to stimuli through inhibition of nonattended feature processing (Bartsch et al., 2017; Ling et al., 2009; Liu et al., 2007).
The lack of facilitation results observed in our studies could be due to mechanistic or methodological limitations. It is possible that the facilitation of discrimination through increased excitatory activity was too weak to alter discrimination accuracy in the presence of robust bottom-up driven neuronal adaptation (Fig. 2B). Furthermore, the absence of facilitation in the no-adapter experiment (Fig. 2C) might be due to task difficulty. Considering that longer periods of imagery cause stronger facilitatory effects (Pearson et al., 2008), increasing the imagery time before test might improve this. Interestingly, adaptation effects can last for varying durations, ranging from milliseconds to minutes or possibly longer (Dragoi et al., 2002; Kohn, 2007), and the effects of mental imagery on subsequent perception have been shown to persist for at least 5 s (Pearson et al., 2008) and up to 5 min (Ishai & Sagi, 1995). Taken together, these findings suggest that the inhibition induced by mental imagery may persist for some time, modulating subsequent perceptual processing. Importantly, our rivalry and discrimination stimuli were presented immediately at release of imagery (see Figs. 1B and 2A), suggesting the observed effects were independent of hysteresis effects. As a result, it remains uncertain whether the inhibitory effects of imagery persist over a delay, similar to the way that adaptation and facilitation effects appear to.
Last, as the experiments were behavioral, it is not possible to completely rule out explanations of higher-level processes beyond the visual cortex. We did, however, use multiple methods to control for this. Previous research has shown luminance disrupts imagery but not other higher-order cognitions, such as attention (Keogh & Pearson, 2011; Pearson et al., 2008; Sherwood & Pearson, 2010). Here we showed that imagery’s reversal of adapter suppression was significantly weakened by increased irrelevant background luminance. Additionally, trials in which participants rated their imagined gratings as more vivid led to stronger reversal of adapter suppression in rivalry and increased suppression of incongruent features during visual discrimination. Thus, the sensory production of mental images was important to our observed effects. Moreover, during false-alarm trials, participants showed no evidence of criterion shifts, as the false alarms were equally likely to be congruent or incongruent with the imagined or adapted stimulus. If imagery was simply influencing participants to guess more liberally in line with or away from imagined features, we would expect this to appear in participants’ decisions here.
Another alternative explanation is that imagery was abolishing sensory history altogether, returning rivalry dominance to chance. Although we did not run an imagery-only condition for rivalry, extensive prior research has shown imagery’s facilitatory effects on subsequent rivalry dominance (Chang et al., 2013; Chang & Pearson, 2018; Keogh et al., 2020; Keogh & Pearson, 2011; Pearson et al., 2011; Pearson & Brascamp, 2008; Sherwood & Pearson, 2010), showing that imagery biases rather than neutralizes perception. Additionally, if imagery abolished sensory history, prior congruent adaptation should have been reversed in discrimination tasks. However, we show a suppression effect of incongruent imagery on nonimagined feature discrimination with and without prior adaptation and no effect of imagery following congruent adapters. Thus altogether, our study contributes with fundamental psychophysical evidence while providing a novel framework for future physiological research to further elucidate the possible neural machinery of the observed suppression effect driven by mental imagery.
Evidence links conscious awareness with the levels of cortical activity (Beck et al., 2006; Boehler et al., 2008; Dehaene et al., 2001; Ress & Heeger, 2003; Silvanto et al., 2005; Wyart & Tallon-Baudry, 2009). Hence it follows that a neural modulatory mechanism, such as that proposed here for imagery, would be inherently limited in its ability to produce strong perception-like qualia. In other words, if imagery is better characterized as modulatory (as our data suggest), then imagery would have an inherent mechanistic upper limit in terms of its degraded, vague, or weak qualia. Such a functional mechanism might for most of us condemn imagery to always be phenomenologically different from perception. These data also have implications for the interpretation of much of the behavioral imagery work using binocular rivalry, which has been interpreted as prior imagery priming perception (Chang & Pearson, 2018; Pearson, 2019; Pearson et al., 2008, 2015). However, the current data suggest that imagery might be suppressing representations of nonimagined features, thereby mimicking priming in the binocular rivalry experiments by weakening the orthogonal orientation. One of the limitations of the current work is that we investigated only imagery of simple oriented gratings. It remains unknown if these trends would extend to complex or dynamic imagery (e.g., faces or motion). Although imagery was not additive to adaptation here, imagery induced adaptation has been observed with higher-level stimuli, such as motion (Gilden et al., 1995; Winawer et al., 2010). As the majority of feedback connections being modulatory is likely only the case for lower-level areas like V1 and V2 (Huang et al., 2007, 2017; Hupé et al., 1998), it is possible we would see different effects when imagery is reliant on representations coded by higher-level brain areas.
Supplemental Material
sj-docx-1-pss-10.1177_09567976231198435 – Supplemental material for Different Mechanisms for Supporting Mental Imagery and Perceptual Representations: Modulation Versus Excitation
Supplemental material, sj-docx-1-pss-10.1177_09567976231198435 for Different Mechanisms for Supporting Mental Imagery and Perceptual Representations: Modulation Versus Excitation by Thomas Pace, Roger Koenig-Robert and Joel Pearson in Psychological Science
References
Supplementary Material
Please find the following supplemental material available below.
For Open Access articles published under a Creative Commons License, all supplemental material carries the same license as the article it is associated with.
For non-Open Access articles published, all supplemental material carries a non-exclusive license, and permission requests for re-use of supplemental material or any part of supplemental material shall be sent directly to the copyright owner as specified in the copyright notice associated with the article.