
Abstract
To what extent do aesthetic experiences arise from the human ability to perceive and extract meaning from visual features? Ordinary scenes, such as a beach sunset, can elicit a sense of beauty in most observers. Although it appears that aesthetic responses can be shared among humans, little is known about the cognitive mechanisms that underlie this phenomenon. We developed a contour model of aesthetics that assigns values to visual properties in scenes, allowing us to predict aesthetic responses in adults from around the world. Through a series of experiments, we manipulate contours to increase or decrease aesthetic value while preserving scene semantic identity. Contour manipulations directly shift subjective aesthetic judgments. This provides the first experimental evidence for a causal relationship between contour properties and aesthetic valuation. Our findings support the notion that visual regularities underlie the human capacity to derive pleasure from visual information.
Introduction
Aesthetic considerations impact human behavior (Chatterjee & Vartanian, 2014; Vessel et al., 2019). Visual information elicit a sense of aesthetic pleasure in perceivers (Biederman & Vessel, 2006; Brielmann & Pelli, 2018; Chatterjee, 2022; Palmer et al., 2013). Across different cultures, artists similarly arrange visual features and use heuristics to communicate information (Cavanagh, 2005; Mamassian, 2008; Sayim & Cavanagh, 2011). Mere lines carry information about category membership (Walther et al., 2011) and affect (Bar & Neta, 2006; Damiano et al., 2021). General mechanisms of human vision help parse a complex visual scene into attentional targets with the goal of understanding the environment (Võ et al., 2019). This meaning-making process is facilitated by detecting visual primitives that help with evaluating the potential cost and reward for interacting with different objects and environments (Bar & Neta, 2006; Biederman, 1987; Chatterjee, 2022).
What is the nature of these visual features, and what role do they play in aesthetic judgments? We investigate the contributions of contour properties and their spatial relations in aesthetic judgments of natural scenes. It is possible to detect to structural regularities in complex visual scenes using biologically-inspired computer vision techniques (Rezanejad et al., 2019; Walther et al., 2023; Walther & Shen, 2014). These techniques can help uncover a visual language for aesthetics. Given the universal mechanisms of human vision (Graham & Redies, 2010; Iigaya et al., 2021), humans may have evolved an ongoing readiness for aesthetic evaluations, which conferred evolutionary advantages, such as finding a potential mate or ideal habitat (Brielmann & Pelli, 2018; Chatterjee, 2022; Wassiliwizky & Menninghaus, 2021).
People need to identify objects in their environment to act on them (Gibson, 1986). Similar objects tend to share visual features that help us recognize their category membership despite variations in their appearance. According to recognition-by-components theory, an extension of Marr’s framework for vision (Marr, 1982), this process occurs via a set of visual primitives, akin to geometric building blocks of shapes, which are viewpoint invariant (i.e., nonaccidental; Biederman, 1987). Importantly, contour junctions are nonaccidental properties that convey information about spatial relationships of objects and surfaces in 3D space. These features help people recognize shapes presented in varying orientations and under perceptually ambiguous situations, and they even underlie our ability to accurately categorize objects and scenes (Attneave, 1954; Cavanagh, 2005; Walther & Shen, 2014; Wilder et al., 2019). Viewpoint-invariant visual features are represented along the ventral visual stream and shown to play an important role in detecting shape skeletons and aesthetic qualities (Ayzenberg et al., 2022; Sun & Firestone, 2021), as well as affective responses to contour (Bar & Neta, 2006; Damiano et al., 2021; Vartanian et al., 2013).
This article investigates whether nonaccidental properties previously found to underlie the ability to perform general visual perceptual tasks, such as object recognition and scene categorization (Biederman, 1987; Walther & Shen, 2014), predict subjective aesthetic valuations. We take an empirical approach to studying the effect of systematic variation in visual features in scenes on observers’ aesthetic responses (Berlyne, 1970; Brielmann & Pelli, 2018). If visual-processing mechanisms underlie the capacity to derive pleasure from seeing, then understanding the causal relationship between statistical properties of contours and subjective aesthetic valuations of scenes is the first step to understanding aesthetics from below (Fechner, 1876).
In Experiment 1, we built a contour model of aesthetic valuation using individual contour properties—orientations, lengths, curvature, and junctions. In Experiment 2, contours in each scene were modified to change the aesthetic value of a given scene, generating contour-modified scenes with different aesthetic value. In Experiment 2, we tested whether an independent group of observers perceived contour-modified scenes with high-value contours more aesthetically pleasing than scenes with low-value contours. In Experiment 3, we expanded the range of features in the contour model from Experiment 2 to include quantitative measures of spatial relations between adjacent contours—separation, parallelism, and local mirror symmetry. We then generated new contour-modified scenes and obtained aesthetic valuations of these scenes from a second independent group of observers, controlling for individual differences. We used scene inversion to manipulate access to scene semantic content and explicitly measured it in a separate scene-categorization experiment. Last, we investigated the relative statistical contributions of individual contours and their spatial relations in aesthetic responses. The data, materials, and code for this study are publicly available on the Open Science Framework (https://osf.io/rb2wc/). The study was not preregistered.
Statement of Relevance
What makes some pictures more pleasing to our eyes than others? Artists and architects have long known that our brains can be tricked into liking some images and environments over others by using carefully curated combinations of visual features. We are beginning to understand that aspects of aesthetic experiences, such as how much a person likes a particular image, can be shared among people with different backgrounds and interests. We also know that the human visual system uses structural regularities in contour—lines that mark the outline of various shapes in a scene—to help us process information efficiently. In this study, we asked whether these structural regularities can be used to predict how pleasant an image looks on average to a group of adults from around the world. By changing different contour properties in images we could control how much people judged an image to be enjoyable to view.
Experiment 1
In Experiment 1, we asked whether a supervised learning algorithm trained on statistical properties of individual contours can generate accurate predictions of aesthetic values for line drawings and color photographs of scenes.
Method
Stimuli
The stimuli consisted of color photographs (n = 475) and line drawings (n = 475) of natural scenes from the Toronto Scenes Dataset available freely on the Open Science Framework (https://osf.io/9squn/). This image set has been characterized in several previous studies (Torralbo et al., 2013; Walther et al., 2011; Walther & Shen, 2014). The line drawings were produced by trained artists by tracing the most salient outlines in a set of color photographs (Walther et al., 2011). These scenes were rated as good exemplars of six scene categories—offices, mountains, beaches, forests, and cities (Torralbo et al., 2013). Line drawings provide explicit access to structural contour properties present in scenes (Walther et al., 2011).
Participants
In Experiment 1, participants were recruited using Prolific (https://www.prolific.co) and provided with an average hourly monetary compensation of between CAD$12 and $15. For line drawings, a total of 75 participants provided ratings. For color photographs, ratings were obtained in a separate experiment with 121 participants providing ratings for a larger set of 1,243 images. The recruited samples were gender balanced (50% females and 50% males). This study was approved by the University of Toronto Research Ethics Board (Protocol No. 30999) and adhered to the tenets of the Declaration of Helsinki. After providing informed consent, participants were redirected to the Inquisit software (https://www.millisecond.com) to begin task administration remotely. Inclusion criteria for participation were fluency in English, an approval rating of > 95%, and past participation in at least 10 studies on the platform. Exclusion criteria were based on recommendations for identifying careless responders in self-report studies (Maniaci & Rogge, 2014; Meade & Craig, 2012). Responses were analyzed using several data-screening methods, including 40 Max LongString (maximum number of identical consecutive responses), failure on two out of three attention-check items (e.g., “please press the number 3 on your keyboard”), and an unusually short completion time (i.e., > 3 SDs below the mean). A total of 6 participants were excluded from the analysis. The criteria were based on a pilot study and were set before data collection began.
Procedure
For line drawings, each participant viewed and rated between 150 and 158 images, chosen pseudorandomly from a set of 475 line drawings in such a way that an equal number of images were drawn from a given scene category. For color photographs, each participant viewed and rated between 213 and 214 images pseudorandomly drawn from a larger set of 1,243 images. There were three versions of the experiment for line drawings and five for photographs. Between 14 to 38 independent ratings were obtained for each scene. After viewing each image, participants provided aesthetic judgments on a 5-point Likert scale in response to the following question: “How much do you enjoy looking at this image?” The response options were 1 = not at all, 2 = barely enjoy, 3 = somewhat enjoy, 4 = enjoy, and 5 = enjoy very much. In addition, subjective ratings for two other measures of fluency and complexity were also obtained but not included in the present analysis. Each experiment consisted of two blocks of images with an opportunity to take a short break after the first block. Images remained on the screen until participants provided a response, with a time limit of 30 s. Presentation time was not limited because of differences in aesthetic judgments as a function of presentation times (Verhavert et al., 2018). The average time taken to complete the experiments was between 32 and 50 min. The average trial response time was 2.1 s. The total duration of the experiments included instructions, self-paced breaks, and questionnaires to assess the observer’s personal characteristics. Aesthetic judgment responses were converted to normalized scores (z-scores) for a given participant. The mean of responses was subtracted from each response, and this value was divided by the standard deviation of responses. Then, for each image, an average aesthetic value was calculated by obtaining the average z-scores across different individuals.
Extracting contour properties
Properties of individual scene contours (orientation, length, curvature) and contour junctions (angles and type) were computed on the basis of the methodology described by Walther and Shen (2014). Previous studies have used these quantifications of scene-contour properties (Damiano et al., 2021; Wilder et al., 2019). The methodology for extracting the statistical distribution of contour properties in real-world scenes is now implemented in a freely available software package, the Mid-Level Vision Toolbox (https://mlvtoolbox.org; Walther et al., 2023). Briefly, for a given scene line drawing, 8-bin histograms of a given contour property (e.g., orientation) were constructed to quantify the distribution of this property in a scene. Orientation refers to the counterclockwise angle of the line from the horizontal. The orientation histogram bins ranged from horizontal to vertical and were centered at 0° (Orientation 1), 22.5° (Orientation 2), 45° (Orientation 3), 67.5° (Orientation 4), 90° (Orientation 5), 112.5° (Orientation 6), 135° (Orientation 7), and 157.5° (Orientation 8). For angles larger than 180°, the opposite angles were used. The length of each contour was calculated by summing the lengths of its segments. The length histogram ranged from 2 pixels to the sum of the width and length of the images in pixels. The logarithms of lengths were equally divided into 8 bins (Length 1, Length 2, etc.), ranging from short to long contours. Curvature was parameterized as the change in orientation from one contour segment to the next within a contour, divided by the length of the current contour segment. Curvature histogram bins ranged from 0° (Curvature 1) to 90° (Curvature 8) per pixel, which means ranging from low curvature (flat) to high curvature (sharp). Contour junctions were classified by their type (X, T, Y, Arrow, Star) and quantified using their number in the scene (i.e., how many times contours intersected with a given angle range). More information about contour classifications can be found in the work of Walther et al. (2023) and Walther and Shen (2014).
Histograms of all contour properties were normalized for the total number of pixels in each image to make it possible to compare scene properties across images with varying amounts of visual information (e.g., comparing busier and more sparsely populated images). Figure 1 shows the distribution of contour properties in scenes from the original stimulus set.
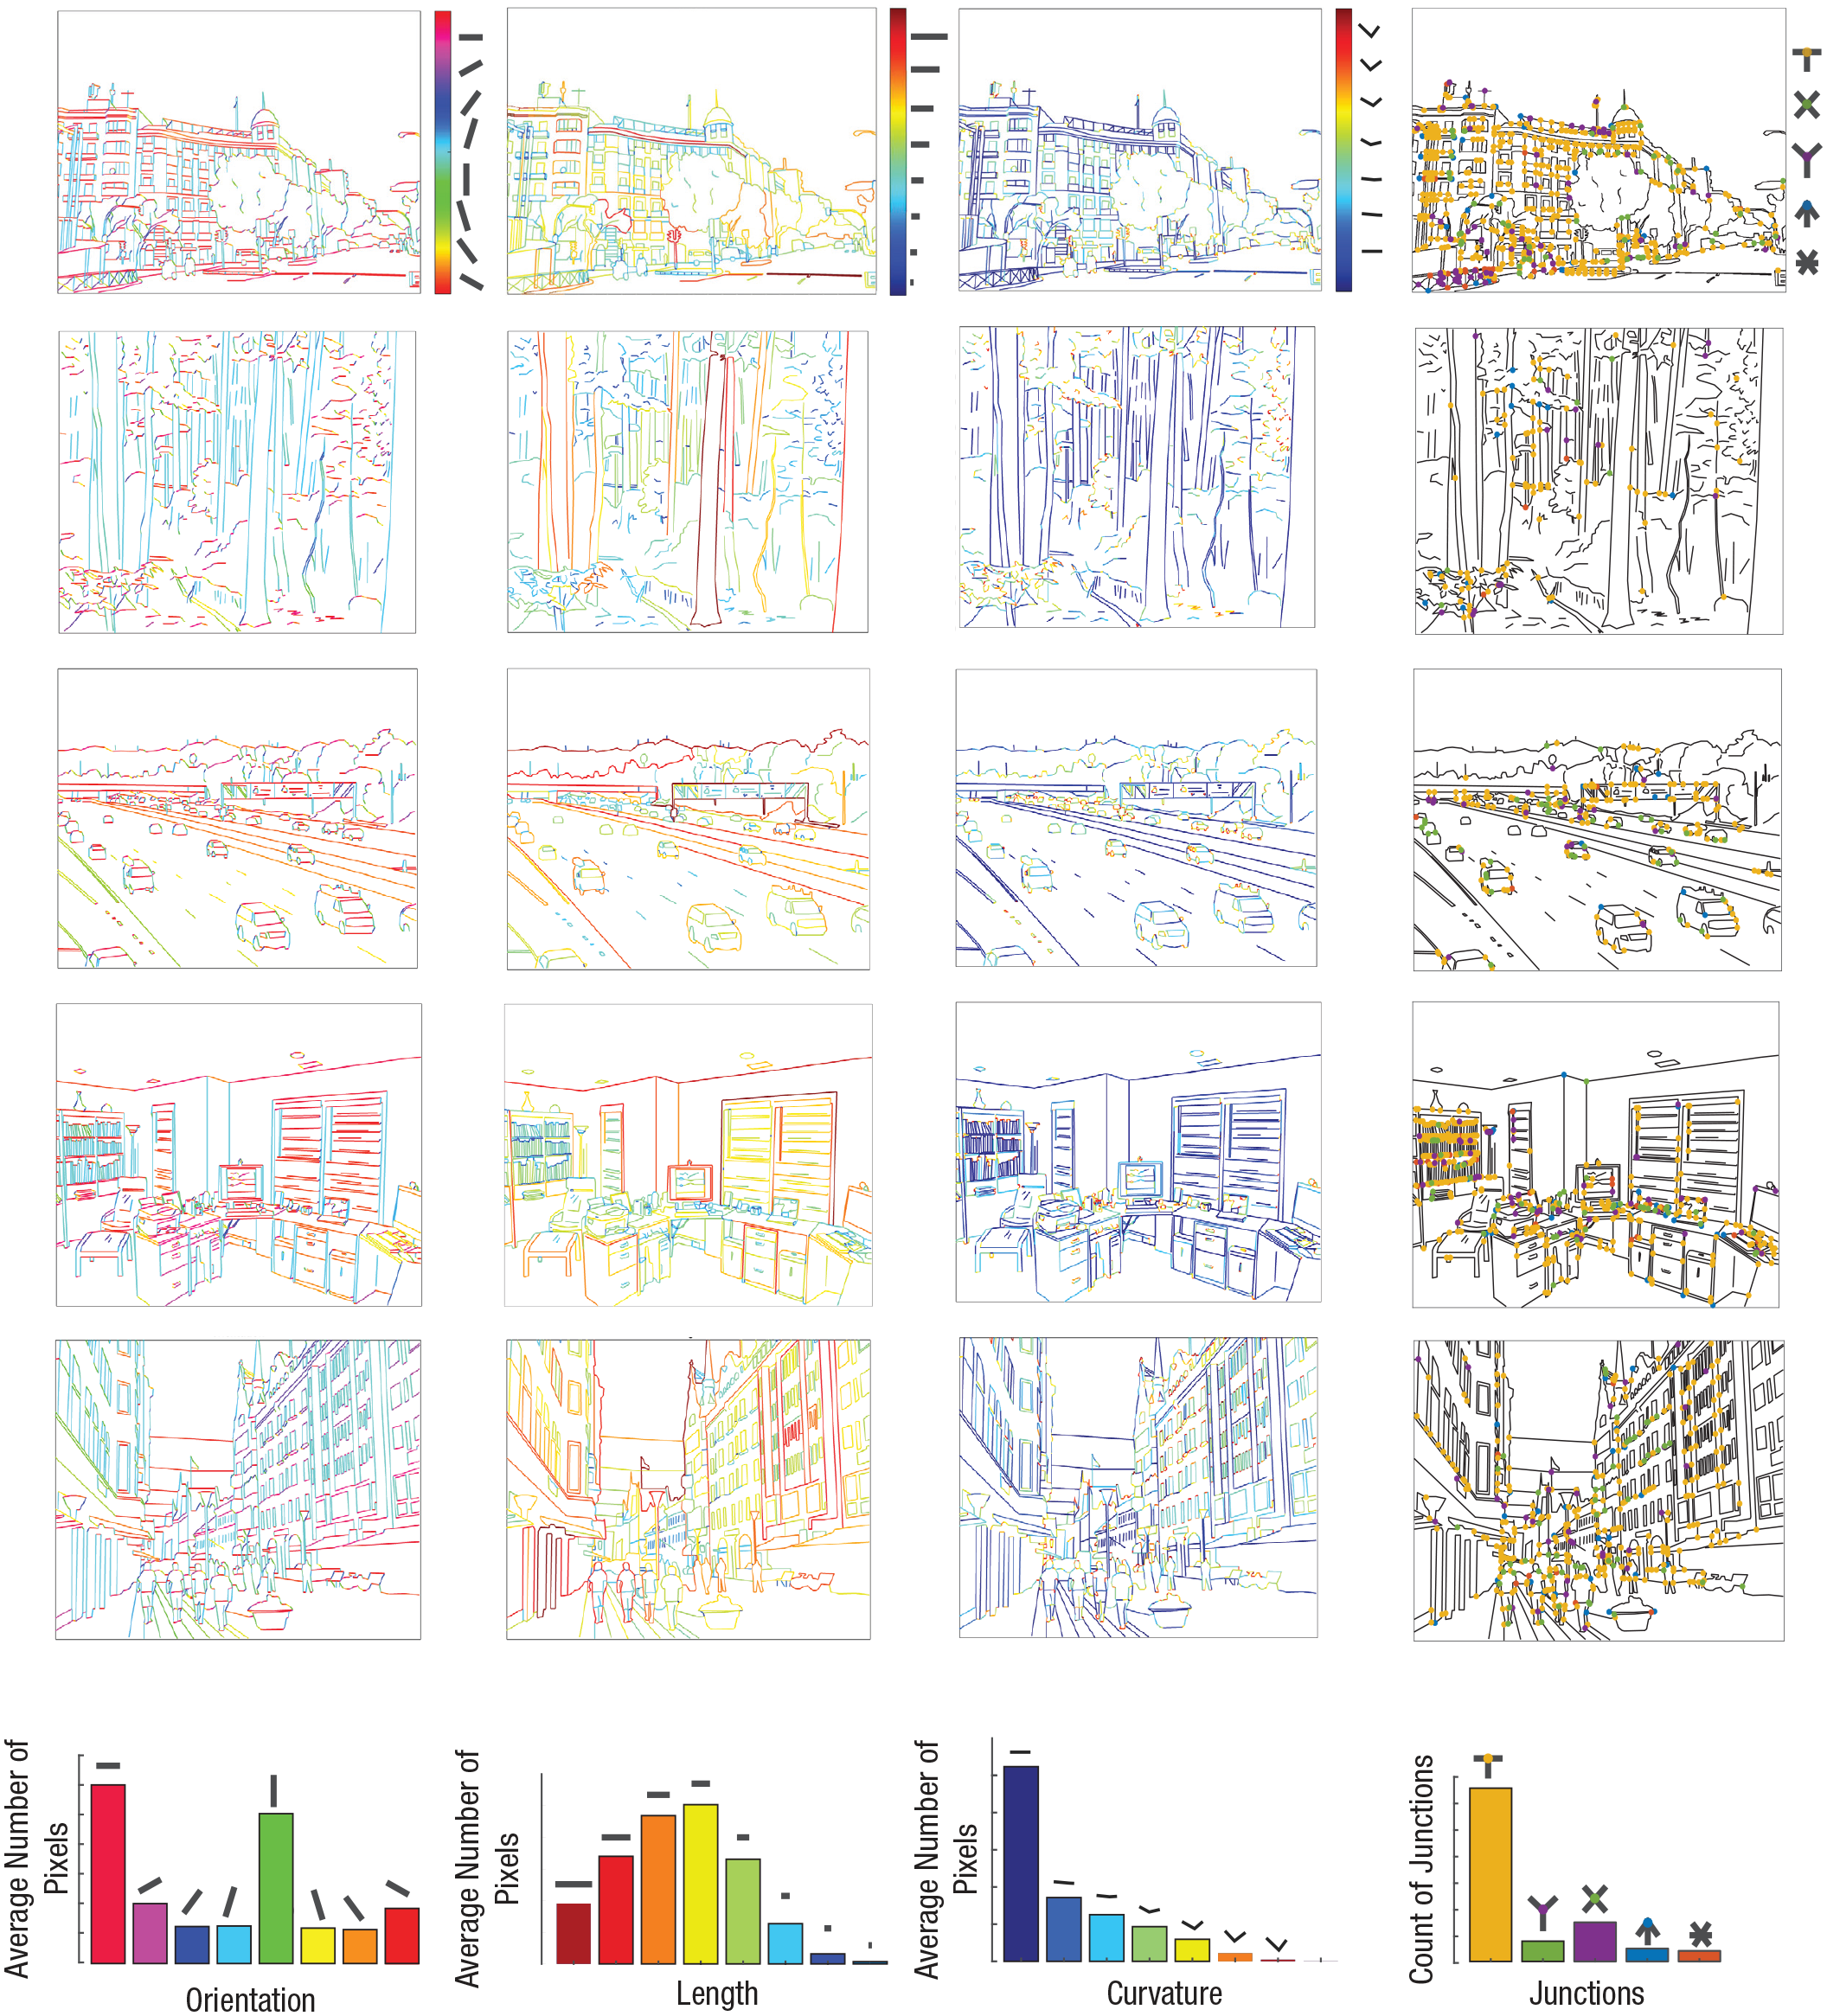
Visualization of contour properties for five representative line drawings. The bottom row shows the relative frequency of these properties for all stimuli.
Contour properties of objects and scenes have been investigated as the basis of high-level vision processes (Biederman, 1987). However, practical difficulties in extracting contours and their properties from photographs have confined such research to hand-coded (Hummel & Biederman, 1992, pp. 480–517) or semi-automated contours features (Elder & Goldberg, 2002). Individual features have been extracted directly from photographic images, such as rectilinearity (Nasr et al., 2014) or the distribution of oriented spatial frequencies (Oliva & Torralba, 2001). In the context of aesthetics, Iigaya et al. relied on features extracted from deep neural networks (Iigaya et al., 2021). To our knowledge, our approach is the first that defines a comprehensive set of contour features in closed mathematical form on the basis of contours in complex, real-world scenes.
Random forest algorithm
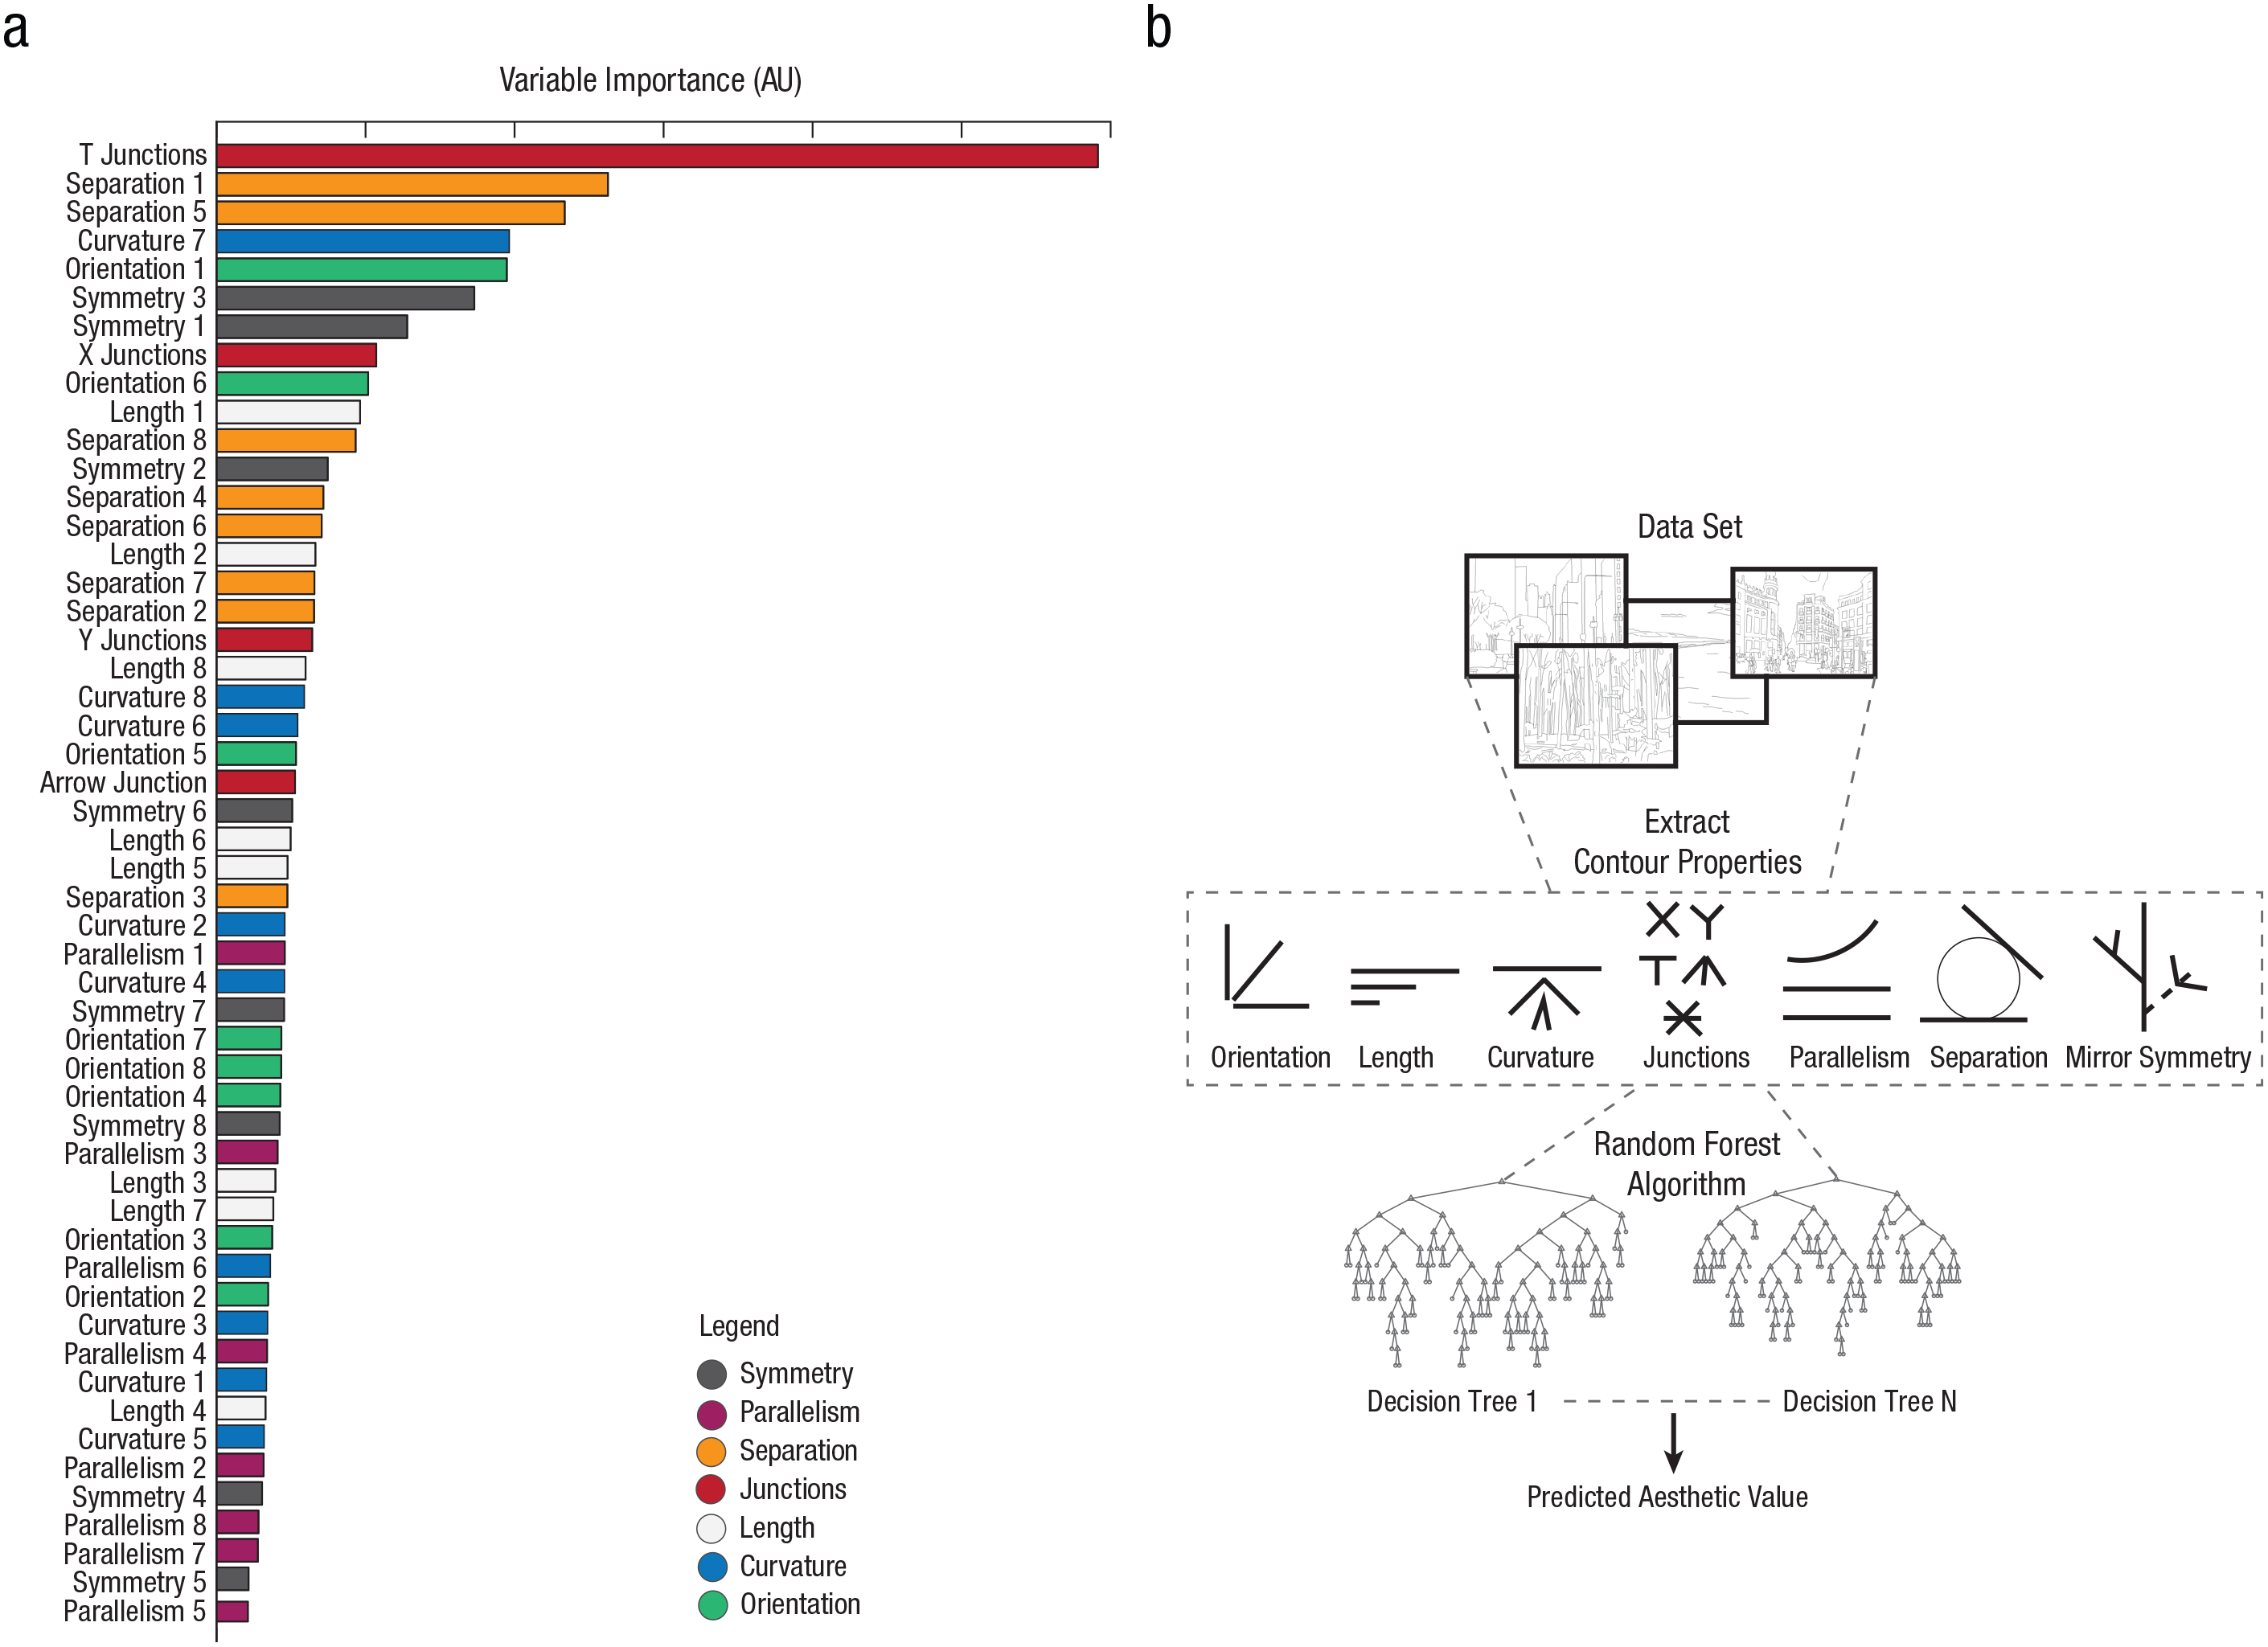
We trained a random forest (RF) regression model (RF Model 1; Fig. 2a), a supervised learning algorithm, to generate aesthetic-value predictions for scenes, using contour properties as features. Random forest models generate robust predictions in the presence of statistical dependencies and nonparametric data (Fife & D’Onofrio, 2022). Random forest models aggregate predictions from several decision trees. The fitensemble function from MATLAB’s Statistics and Machine Learning Toolbox was used to train an ensemble of boosted regression trees. Out-of-bag predictions were obtained using the oobPredict function, which computes predicted responses for a given training sample using only those trees that did not contain the sample in their bootstrap training set. For observations that are in the bootstrap training set for all trees, the predicted response is the weighted mean of all of the training responses. The correlation between the predicted and observed values was computed to provide a measure of prediction accuracy. The loss function was also applied to obtain the cumulative classification accuracy using mean squared error (MSE). MSE is the sum of squared residuals using “out-of-bag” observations at the tree level. The MSE provided the cross-validated accuracy of predictions. The contribution of each predictor in the model was assessed using “variable importance” (Fig. 2b). Variable importance for scene properties was calculated using mean decrease in impurity (Gini index), which compares the reduction in prediction accuracy when the predictor of interest is left out (Fife & D’Onofrio, 2022).
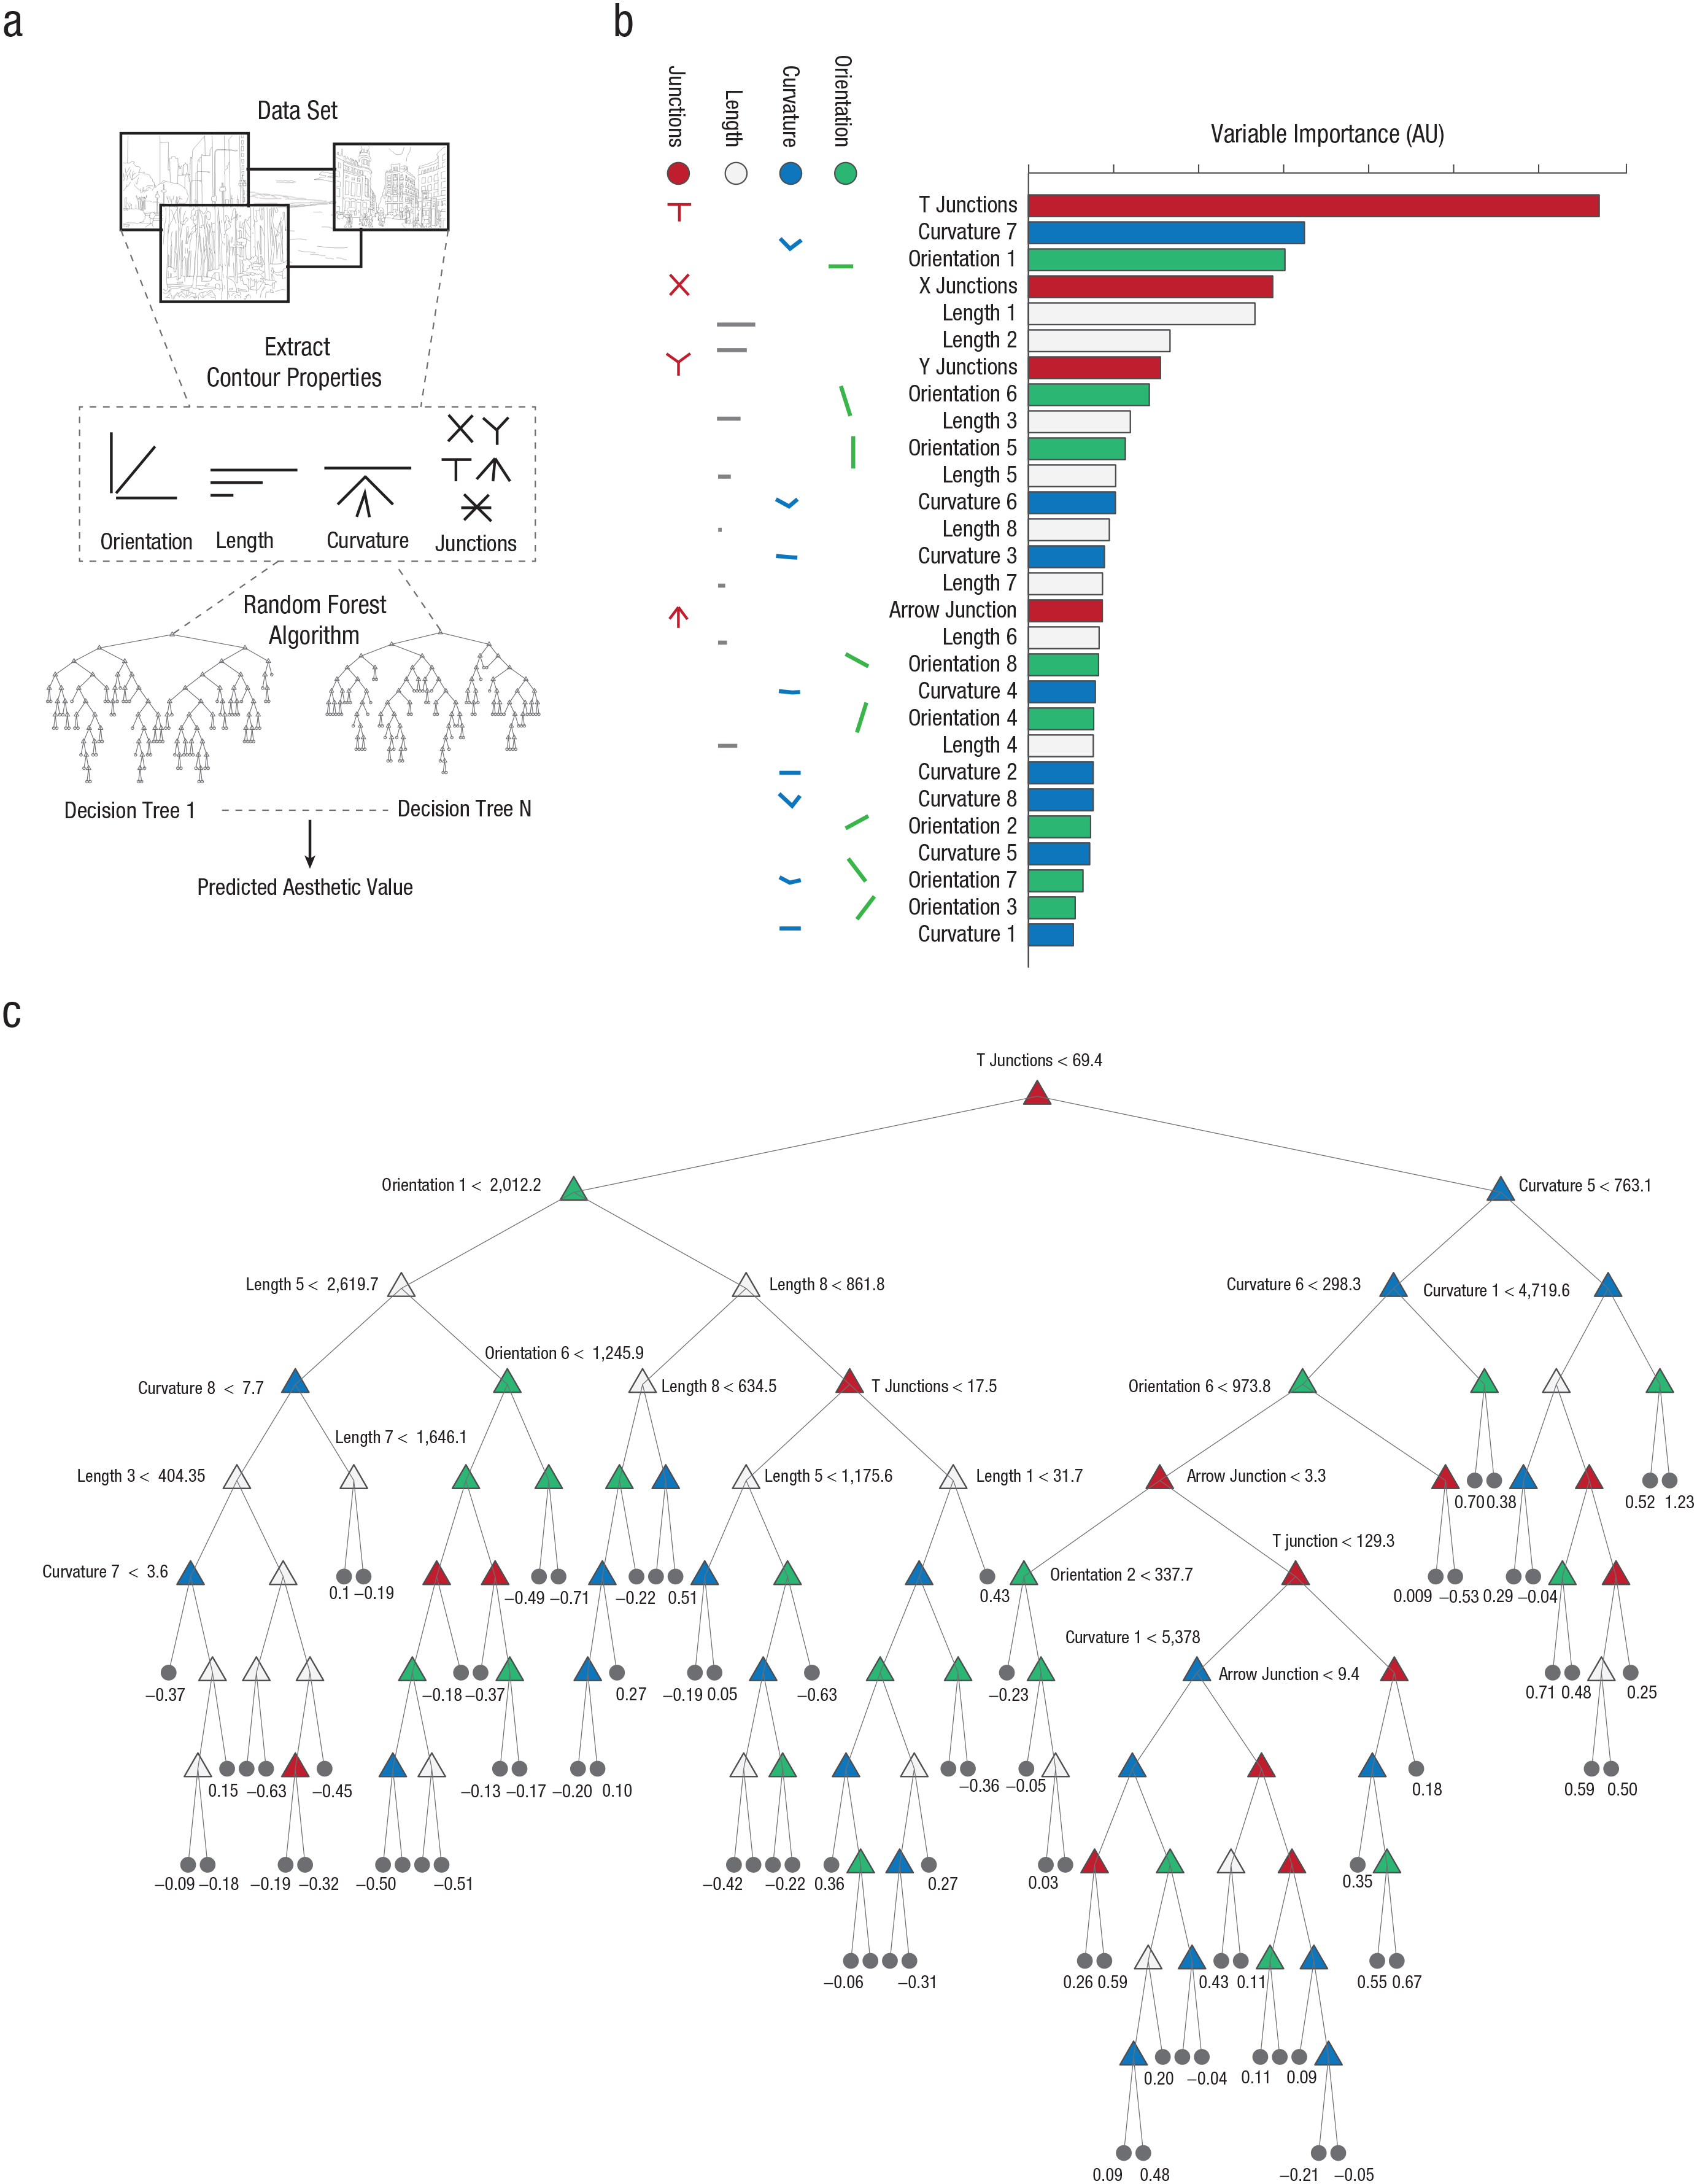
Some results from Experiment 1. In (a), a schematic of the construction of the random forest model is shown, from contour properties in Experiment 1. A variable importance plot is illustrated in (b), and a representative decision tree is shown in (c), with predicted aesthetic ratings at the bottom of the graph. AU = arbitrary units.
Figure 2c shows a representative decision tree for RF Model 1. In this model, 100 decision trees generated aesthetic-value predictions for different combinations of contour properties. Each decision tree used a randomly selected subset of images with replacement (bootstrapping) and assigned a predicted aesthetic value for those images. In the model, 29 contour properties were used as predictive features. These included eight normalized histograms for each of the three individual contour features—orientation, length, and curvature—and the number of five classes of contour junctions (T, X, Y, Arrow, Star). The algorithm averaged the predictions from these decision trees to derive a robust aesthetic-value prediction for a given scene (bootstrap aggregation). At the top node of the decision tree shown in Figure 2c, the algorithm asked whether the number of T junctions in the image exceeded an optimal threshold. This root node split the tree into two branches. Other contour features were then used to split the decision tree further until an aesthetic-value prediction for the random sample was reached at the leaf nodes.
Extracting color statistics
To test the consistency of statistical properties of contours across line drawings and color photographs of the scenes, we also collected aesthetic ratings of color photographs using the same procedure (Fig. 3a). A new random forest model (RF Model Color) was built for the aesthetic responses to color photographs with the addition of nine color statistics as predictors (Fig. 3b).
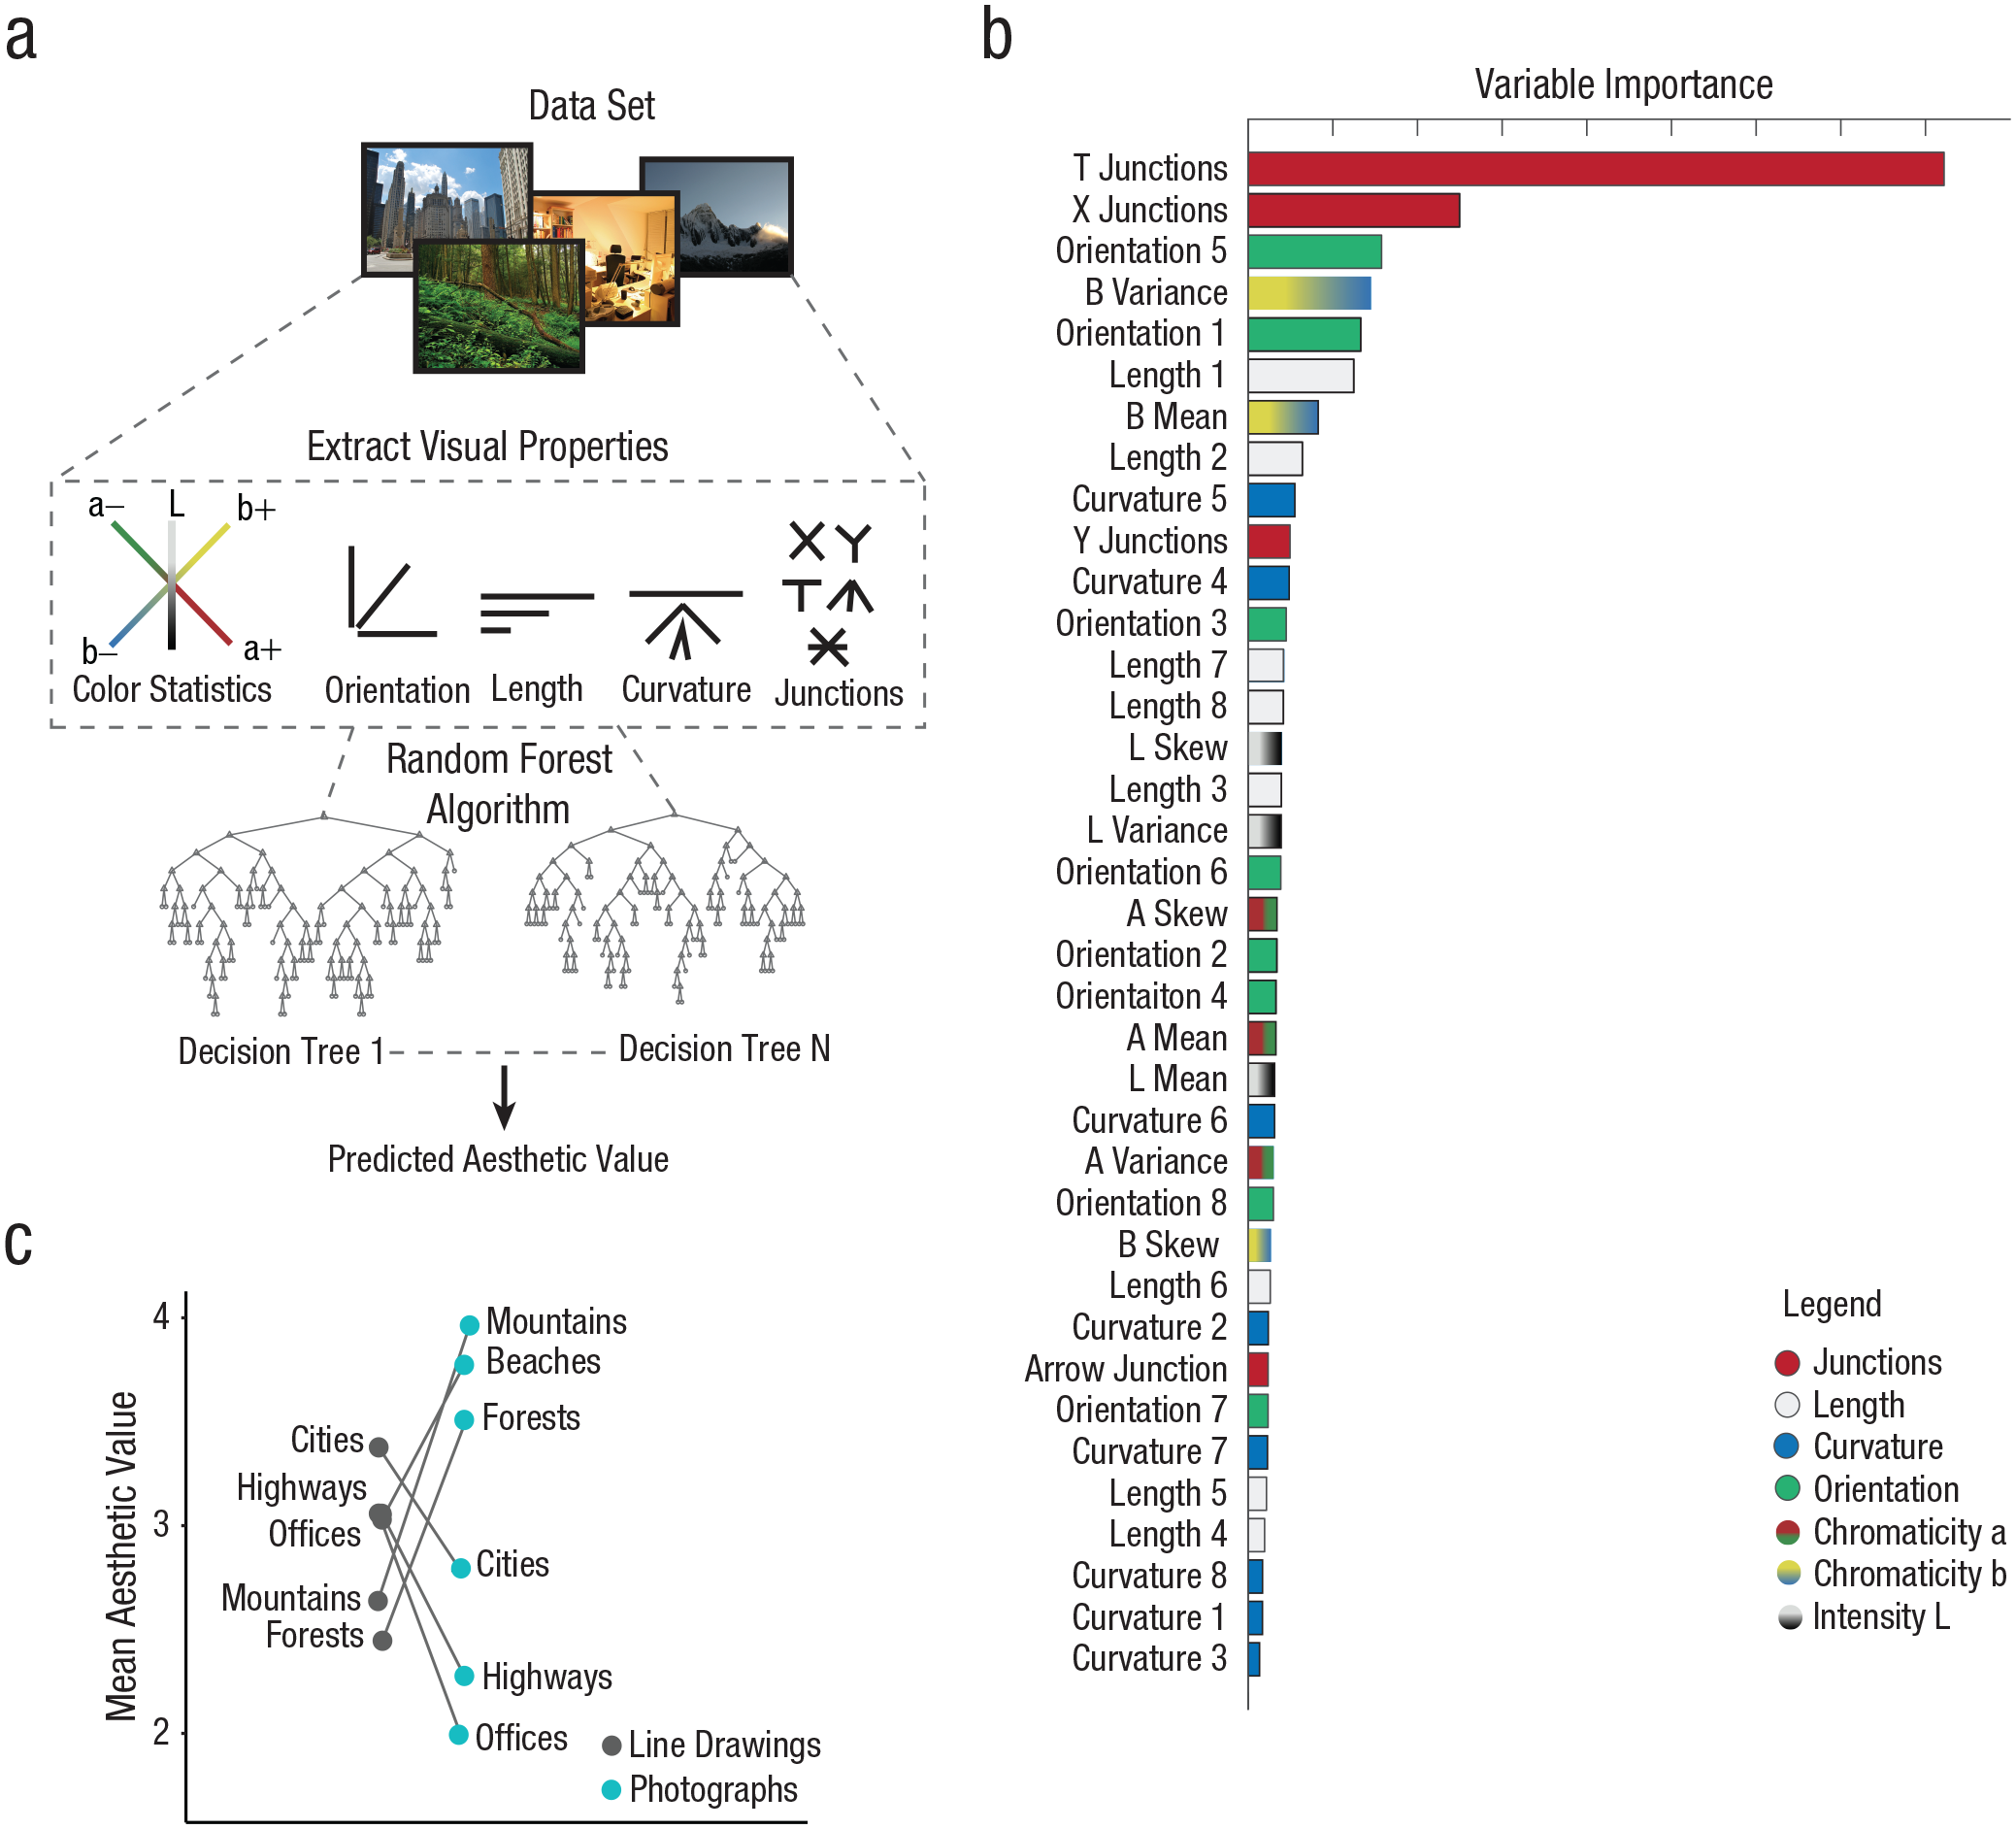
More results from Experiment 1. (a) schematic of the construction of the random forest model from image features for color photographs, (b) variable importance plot, and (c) mean aesthetic ratings for line drawings and color photographs for different scene categories.
Color statistics for each photograph were computed in the CIELAB color space (Nakauchi & Tamura, 2022). Each color is represented in a space consisting of three indices: lightness (L) and chromaticity (a, b). L represents a change in color intensity from black to white, chromaticity index a corresponds to a change from green to red, and chromaticity index b corresponds to a change from blue to yellow. For each of these indices, three statistics were computed: mean, variance, and skewness of the colorimetric values in the CIELAB color space, as described previously (Nakauchi & Tamura, 2022).
Results
On a scale from 1 to 5, the average aesthetic rating for the line-drawing stimulus set was 2.9 (SD = 0.5); for color photographs, it was 3.05 (SD = 0.85). Average normalized ratings for intact line drawings and color photographs based on scene categories were for beaches (line drawings = 0.07, SD = 0.42; color photographs = 0.58, SD = 0.34), for cities (line drawings = 0.36, SD = 0.35; color photographs = −0.18, SD = 0.41), for forests (line drawings = −0.4, SD = 0.28; color photographs = 0.35, SD = 0.29), for highways (line drawings = 0.09, SD = 0.30; color photographs = −0.62, SD = 0.29), for mountains (line drawings = −0.24, SD = 0.32; color photographs = 0.71, SD = 0.26), and for offices (line drawings = 0.1, SD = 0.3; color photographs = −0.84, SD = 0.31). Interestingly, human-made scene categories such as cities, offices, and highways were deemed to be liked more when viewed in line-drawing form than in photograph form.
Scene-contour properties (RF Model 1) predicted subjective aesthetic valuations of intact line drawings (Figs. 1 and 2). Cross-validation shows that predicted aesthetic values correlate significantly with observed aesthetic ratings (line drawings: r = .64, p < .001; color photographs: r = .77, p < .001; Fig. 4b). The MSE was .031 for line drawings and .058 for color photographs. The most robust finding concerning the contribution of contour properties in the model was that T junctions are the most informative visual cues for aesthetic-value predictions in scenes (Fig. 2b). This result was found for both line drawing (Fig. 2b) and color photograph (Fig. 3b) RF models. See Figure 3c for a visualization of the average aesthetic responses for different scene categories in line drawings and photographs.
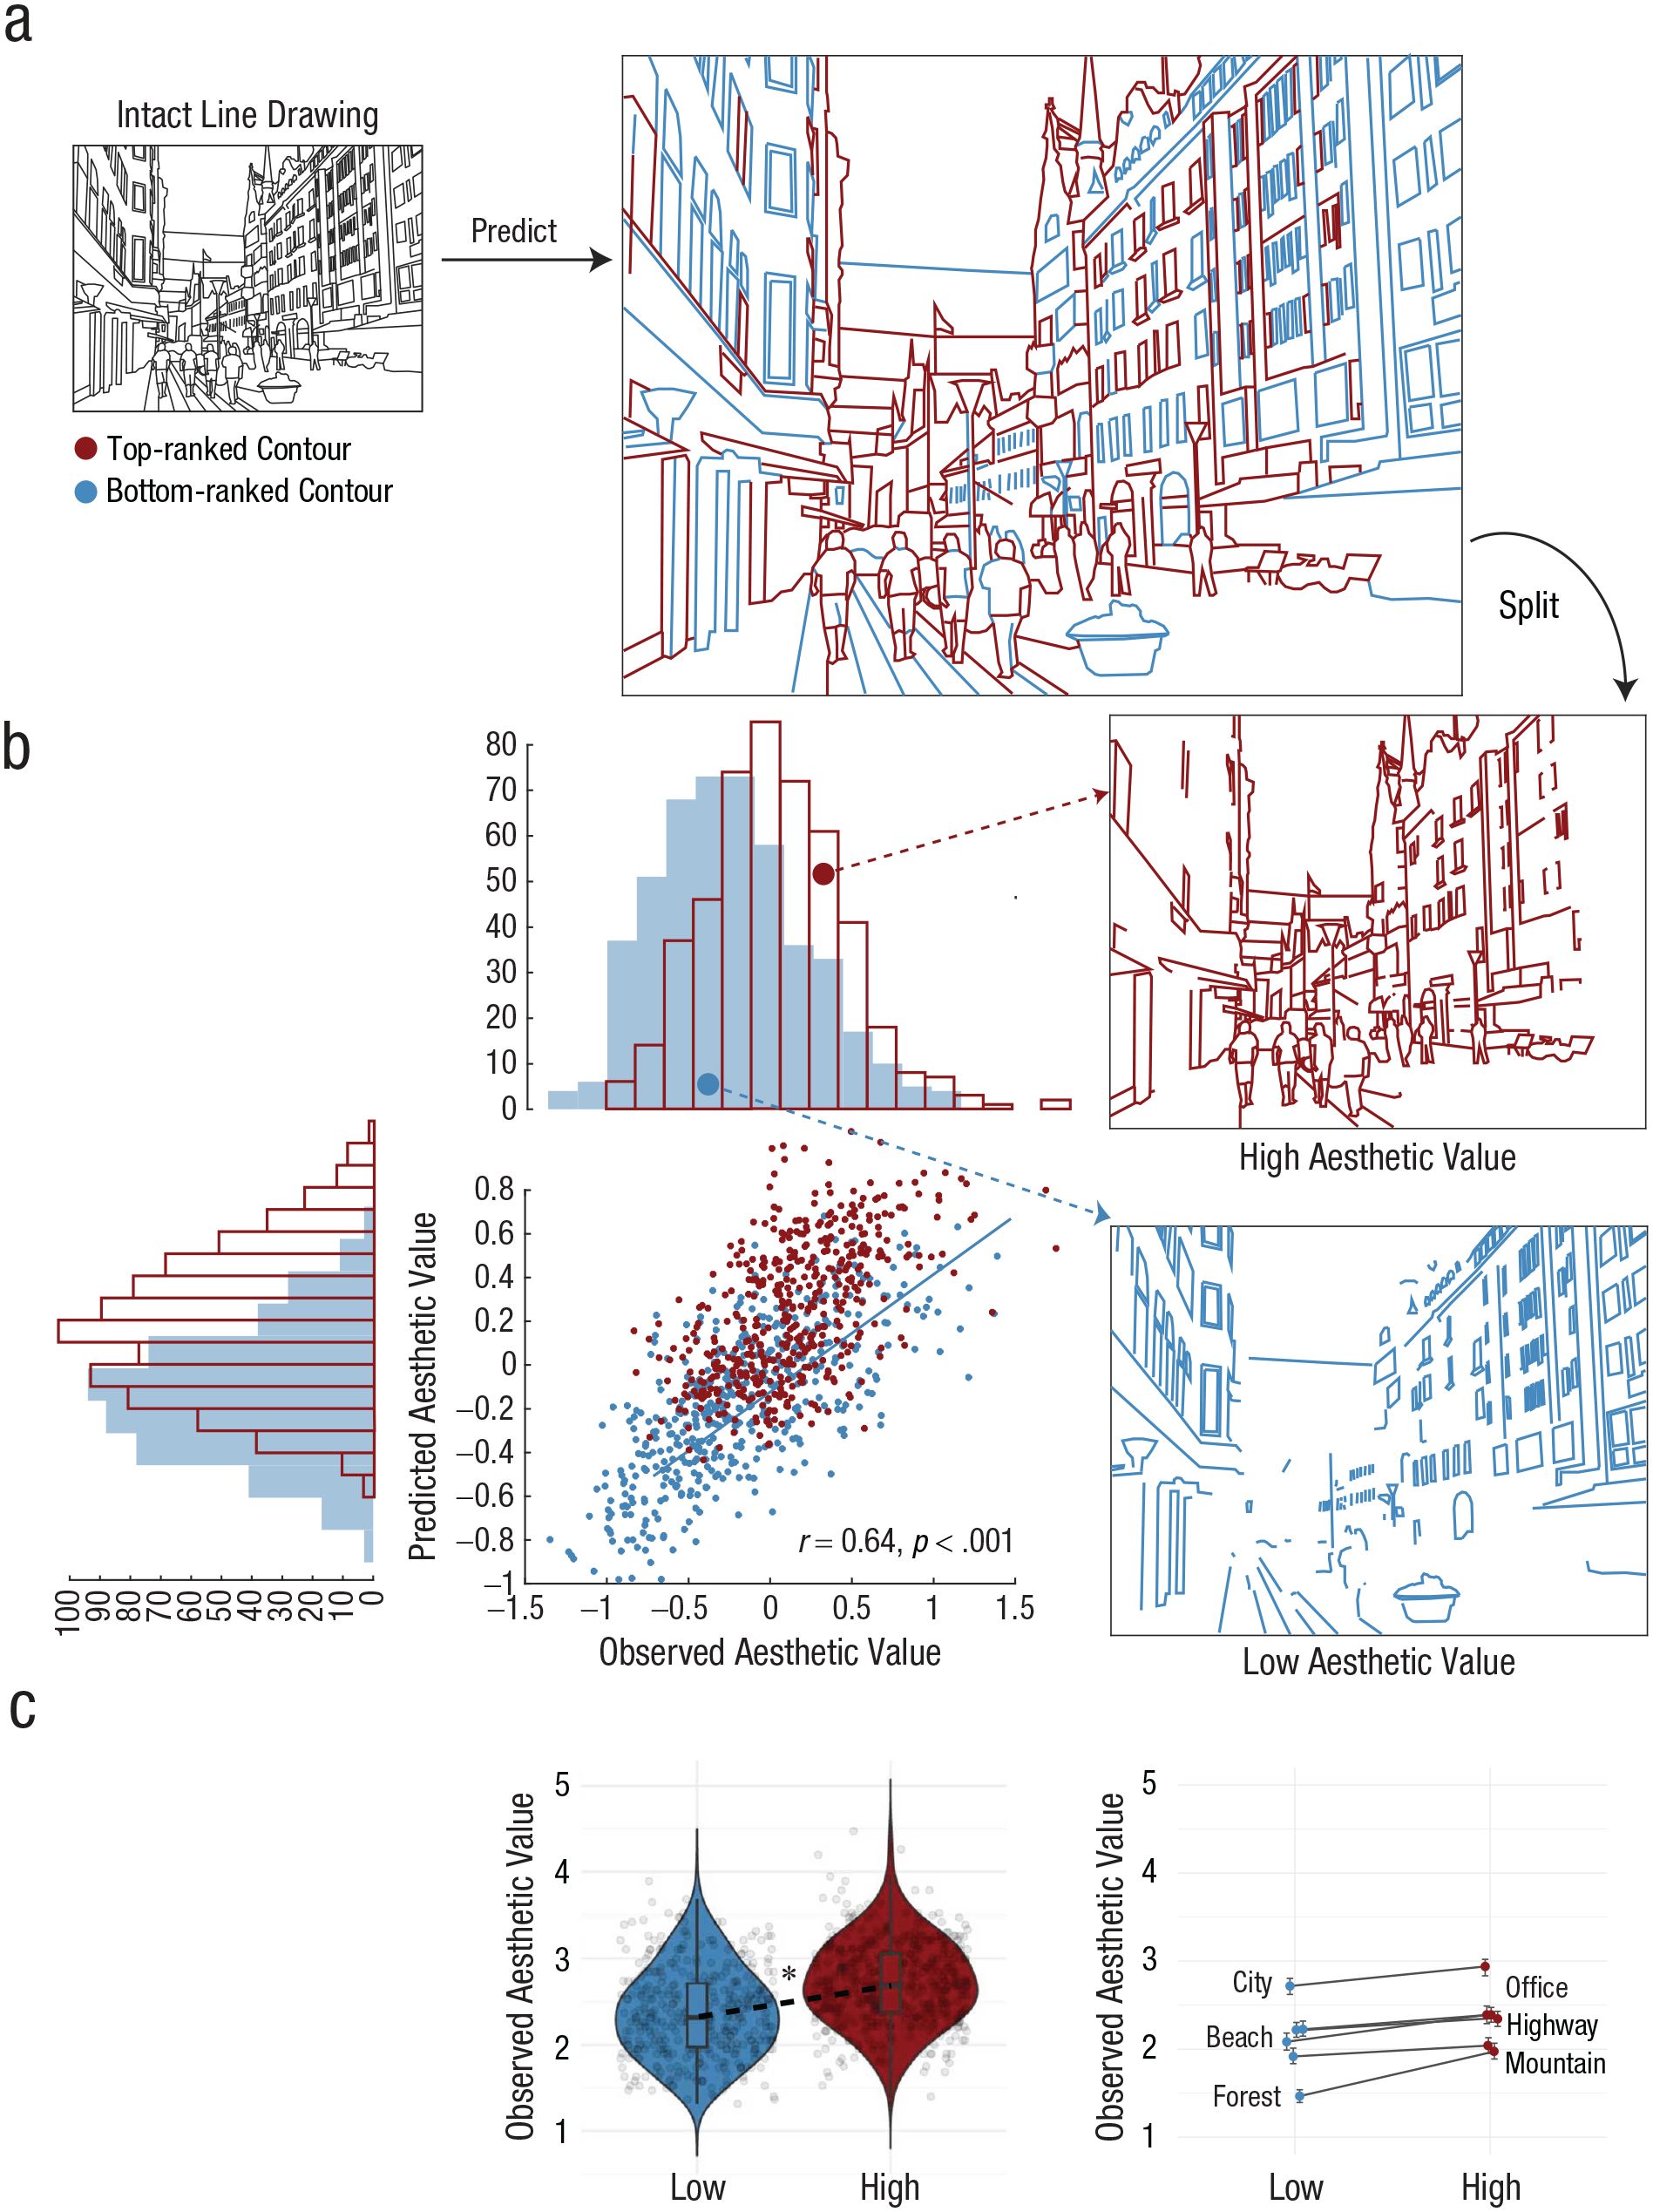
Line drawing analyses from Experiment 2. (a) contours in a city scene colour-coded by predicted aesthetic valuation from RF model 1. Half-split scenes containing either top-ranked or bottom-ranked contours generated for Experiment 2, (b) RF model 1 cross-validation showing the correlation between predicted and observed aesthetic values for high and low aesthetic conditions, and (c) left: Aesthetic judgements of half-split scenes, right: differences in aesthetic judgements of modified scenes across scene categories.
Experiment 2
In Experiment 2, we investigate whether a shift in aesthetic responses in an expected direction can be caused by modifying contour properties according to model predictions from Experiment 1.
Method
Stimuli
Using the trained RF Model 1, we generated predictions of aesthetic value for individual contours by considering the distribution of contour properties for this one contour in an image. Once we acquired the predicted aesthetic values, we ranked the contours from lowest to highest with respect to predicted aesthetic value. We then performed a median split of the contours so that equal numbers of contour pixels were contained in the top and the bottom half of the rank list. Contours that were not uniquely assigned to the top or bottom halves were omitted from both. We then rendered contour drawings that contained the bottom or the top half of the contours by predicted aesthetic value. Finally, we generated predictions for the aesthetic appeal for each scene. As anticipated, predictions for scenes consisting of the top-ranked contours were significantly higher than those consisting of the bottom-ranked contours.
Participants
Seventy-seven participants (52.1% female) were recruited using the same criteria and procedure as described in Experiment 1 (mean age = 25.3 years).
Individual differences
Several measures that captured the personal characteristics of the observers were included in this study. In Experiment 2, information on age, gender, educational attainment, environmental-type familiarity, mood or affect, creativity, artistic training, and experience was collected. Affect was measured using the Positive and Negative Affect Schedule (PANAS; Watson et al., 1988), a validated self-report questionnaire composed of 10-item scales to provide measures of positive affect (e.g., excited, inspired) and negative affect (e.g., afraid, sad). The Divergent Association Task was used to measure creativity, as described in a previous study (Olson et al., 2021). This task involves naming ten nouns that differ as much as possible from each other. The average semantic distance between generated nouns was shown to be a reliable marker of creativity (Olson et al., 2021). To assess their environmental familiarity, participants responded to the following question: “How would you describe the environment where you grew up?” The response choices included urban, suburban, and rural. To assess artistic experience and training, the participants responded to the following questions: “How often are you involved in practicing or learning about visual arts (e.g., painting, drawing, photography, design, architecture, filmmaking)?” and “How many years of artistic training do you have?” We also obtained information on formal education, which is a reliable indicator of an individual’s cognitive reserve.
Statistical analysis
We first used a paired-samples t test to test whether there is a statistically significant difference in mean aesthetic-value judgments ascribed to viewing modified scenes with high- versus low-ranked contours. To model the contribution of interindividual factors in addition to scene condition, we performed a linear mixed-effects model analysis using the lmer package (Bates et al., 2015) in R. We used age, gender, educational attainment, environmental-type familiarity, positive affect score, negative affect score, creativity score, years of artistic training and experience as fixed-effects predictors of aesthetic ratings, in addition to aesthetic condition. Participant identity was included as a random-effect term, using the following expression: lmer(response ~ condition +. . .+ (1 + condition|participant)). This means that slopes and intercepts of aesthetic responses were allowed to vary across participants. We used Satterthwaite’s approximation in the lmerTest package to calculate p values (Kuznetsova et al., 2017) with 95% confidence intervals (CIs) for fixed effects. The MuMIn package (Johnson et al., 2014) was used to derive conditional and marginal R2. We performed likelihood ratio tests and obtained Akaike Information Criterion (AIC) values to compare the models with fixed effects to the null models with only the random effects. These tests were used to assess the validity of the mixed-effects model.
Results
In Experiment 2, we found that contour-modified scenes that retained the top-ranked contours (M = 2.72, SD = 1.22) were perceived to be more aesthetically pleasing than contour-modified scenes with bottom-ranked contours preserved (M = 2.37, SD = 1.18), t(398) = 15.73, p < .00001, 95% confidence interval (CI) = [0.30, 0.39], Cohen’s d = 0.69. The effect was consistent across different scene categories (Fig. 4c).
The linear mixed-effects model showed a statistically significant effect for aesthetic condition with scenes containing high-ranked contours favored over scenes containing low-ranked contours (high vs. low estimate = 0.33, 95% CI = [0.27, 0.38], t(1, 76) = 12.36, p < 2 × 10⁻¹⁶). In this model, affect was a significant predictor of aesthetic responses: Higher scores on the negative-affect index were associated with higher aesthetic ratings (estimate = 0.052, 95% CI = [0.015, 0.09], t(1, 67) = 2.59, p = .01). The marginal (fixed effects) and conditional (fixed and random effects) pseudo-R2 values for the mixed-effects model were 0.068 and 0.388, respectively. The standard deviation of the random effect for participants was 0.68, showing considerable variation between participants with respect to the fixed effects. Other individual factors such as age—estimate = 0.012, 95% CI = [−0.011, 0.037], t(1, 67) = 0.98, p = .33; gender (male vs. female)—estimate = −0.07, 95% CI = [−0.37, 0.22], t(1, 67) = −0.45, p = .65; creativity—estimate = 0.007, 95% CI = [−0.015, 0.03], t(1, 67) = 0.59, p = .55; artistic training—estimate = 0.049, 95% CI = [−0.10, 0.20], t(1, 67) = 0.58, p = .55; and experience—estimate = −0.009, 95% CI = [−0.088, 0.069], t(1, 67) = −0.22, p = −.22; environmental familiarity—urban versus rural estimate = 0.17, 95% CI = [−0.25, 0.59], t(1, 67) = 0.74, p = .45; suburban versus rural estimate = 0.20, 95% CI = [−0.24, 0.66], t(1, 67) = 0.87, p = .38; and positive affect—estimate = 0.036, 95% CI = [−0.007, 0.08], t(1, 67) = 1.53, p = .12—were not significant predictors of aesthetic responses.
Experiment 3
We showed in Experiment 1 that a random forest model of aesthetic valuation using contour properties as predictors successfully predicted subjective aesthetic judgments of scenes (Fig. 4b). In Experiment 2, we found that altering individual contour properties on the basis of model predictions directly changed subjective aesthetic responses to scenes. Following these findings, we aimed to probe further the contributions of higher-level visual representations in aesthetic responses. Finally, in Experiment 3, we investigated the contributions of spatial-relationship cues and disruption of semantic processing through scene inversion on aesthetic valuations of scenes.
To understand the role of higher-level visual representations in shifting aesthetic responses in contour-modified scenes, we asked whether the effect of preference for top-ranked contours over bottom-ranked contours persists when semantic processing of the scenes is disrupted (Fig. 7). Inversion is thought to disrupt the ability of observers to detect the configuration or semantic aspects of visual stimuli (Epstein et al., 2006). Face and scene inversions make object identification, change detection, and extraction of visual properties harder (Epstein et al., 2006; Hayes & Henderson, 2022). In Experiment 3, we used scene inversions to explore the impact of disrupting configurational and holistic information processing on aesthetic judgments of contour-modified scenes. If the aesthetic valuation of inverted contour-manipulated scenes were to follow the same pattern as observed in Experiment 2, this would suggest that top-ranked contours are more aesthetically pleasing than bottom-ranked contours even when access to semantic content is reduced through scene inversion. Finally, we verified that the contour manipulations did not disrupt access to semantic information in a categorization experiment.
Method
Participants
Seventy-seven participants were recruited using the same criteria and procedure described in Experiment 1 (mean age = 24.5 years) for aesthetic-rating experiments. Similarly, 60 participants were recruited in a separate scene-categorization experiment using the same criteria. The recruited samples were gender balanced.
Extracting contour properties
Spatial relations between adjacent contours for each image were computed on the basis of medial-axis computations for complex scenes, a novel methodology developed by Rezanejad et al. (Rezanejad, 2020; Rezanejad et al., 2019). Parallelism refers to the rate of change in the distance between adjacent contours from the medial axis, separation is the contour’s distance from the medial axis, and local mirror symmetry reflects the degree to which a part of the image is reflected across a straight axis. We therefore computed a measure of local mirror symmetry from the local curvature of the medial axis. As with individual contour properties, normalized 8-bin histograms of contour spatial relationships for these three measures were constructed (Fig. 5). Code for computing these properties is available at http://mlvtoobox.org (Walther et al., 2023).
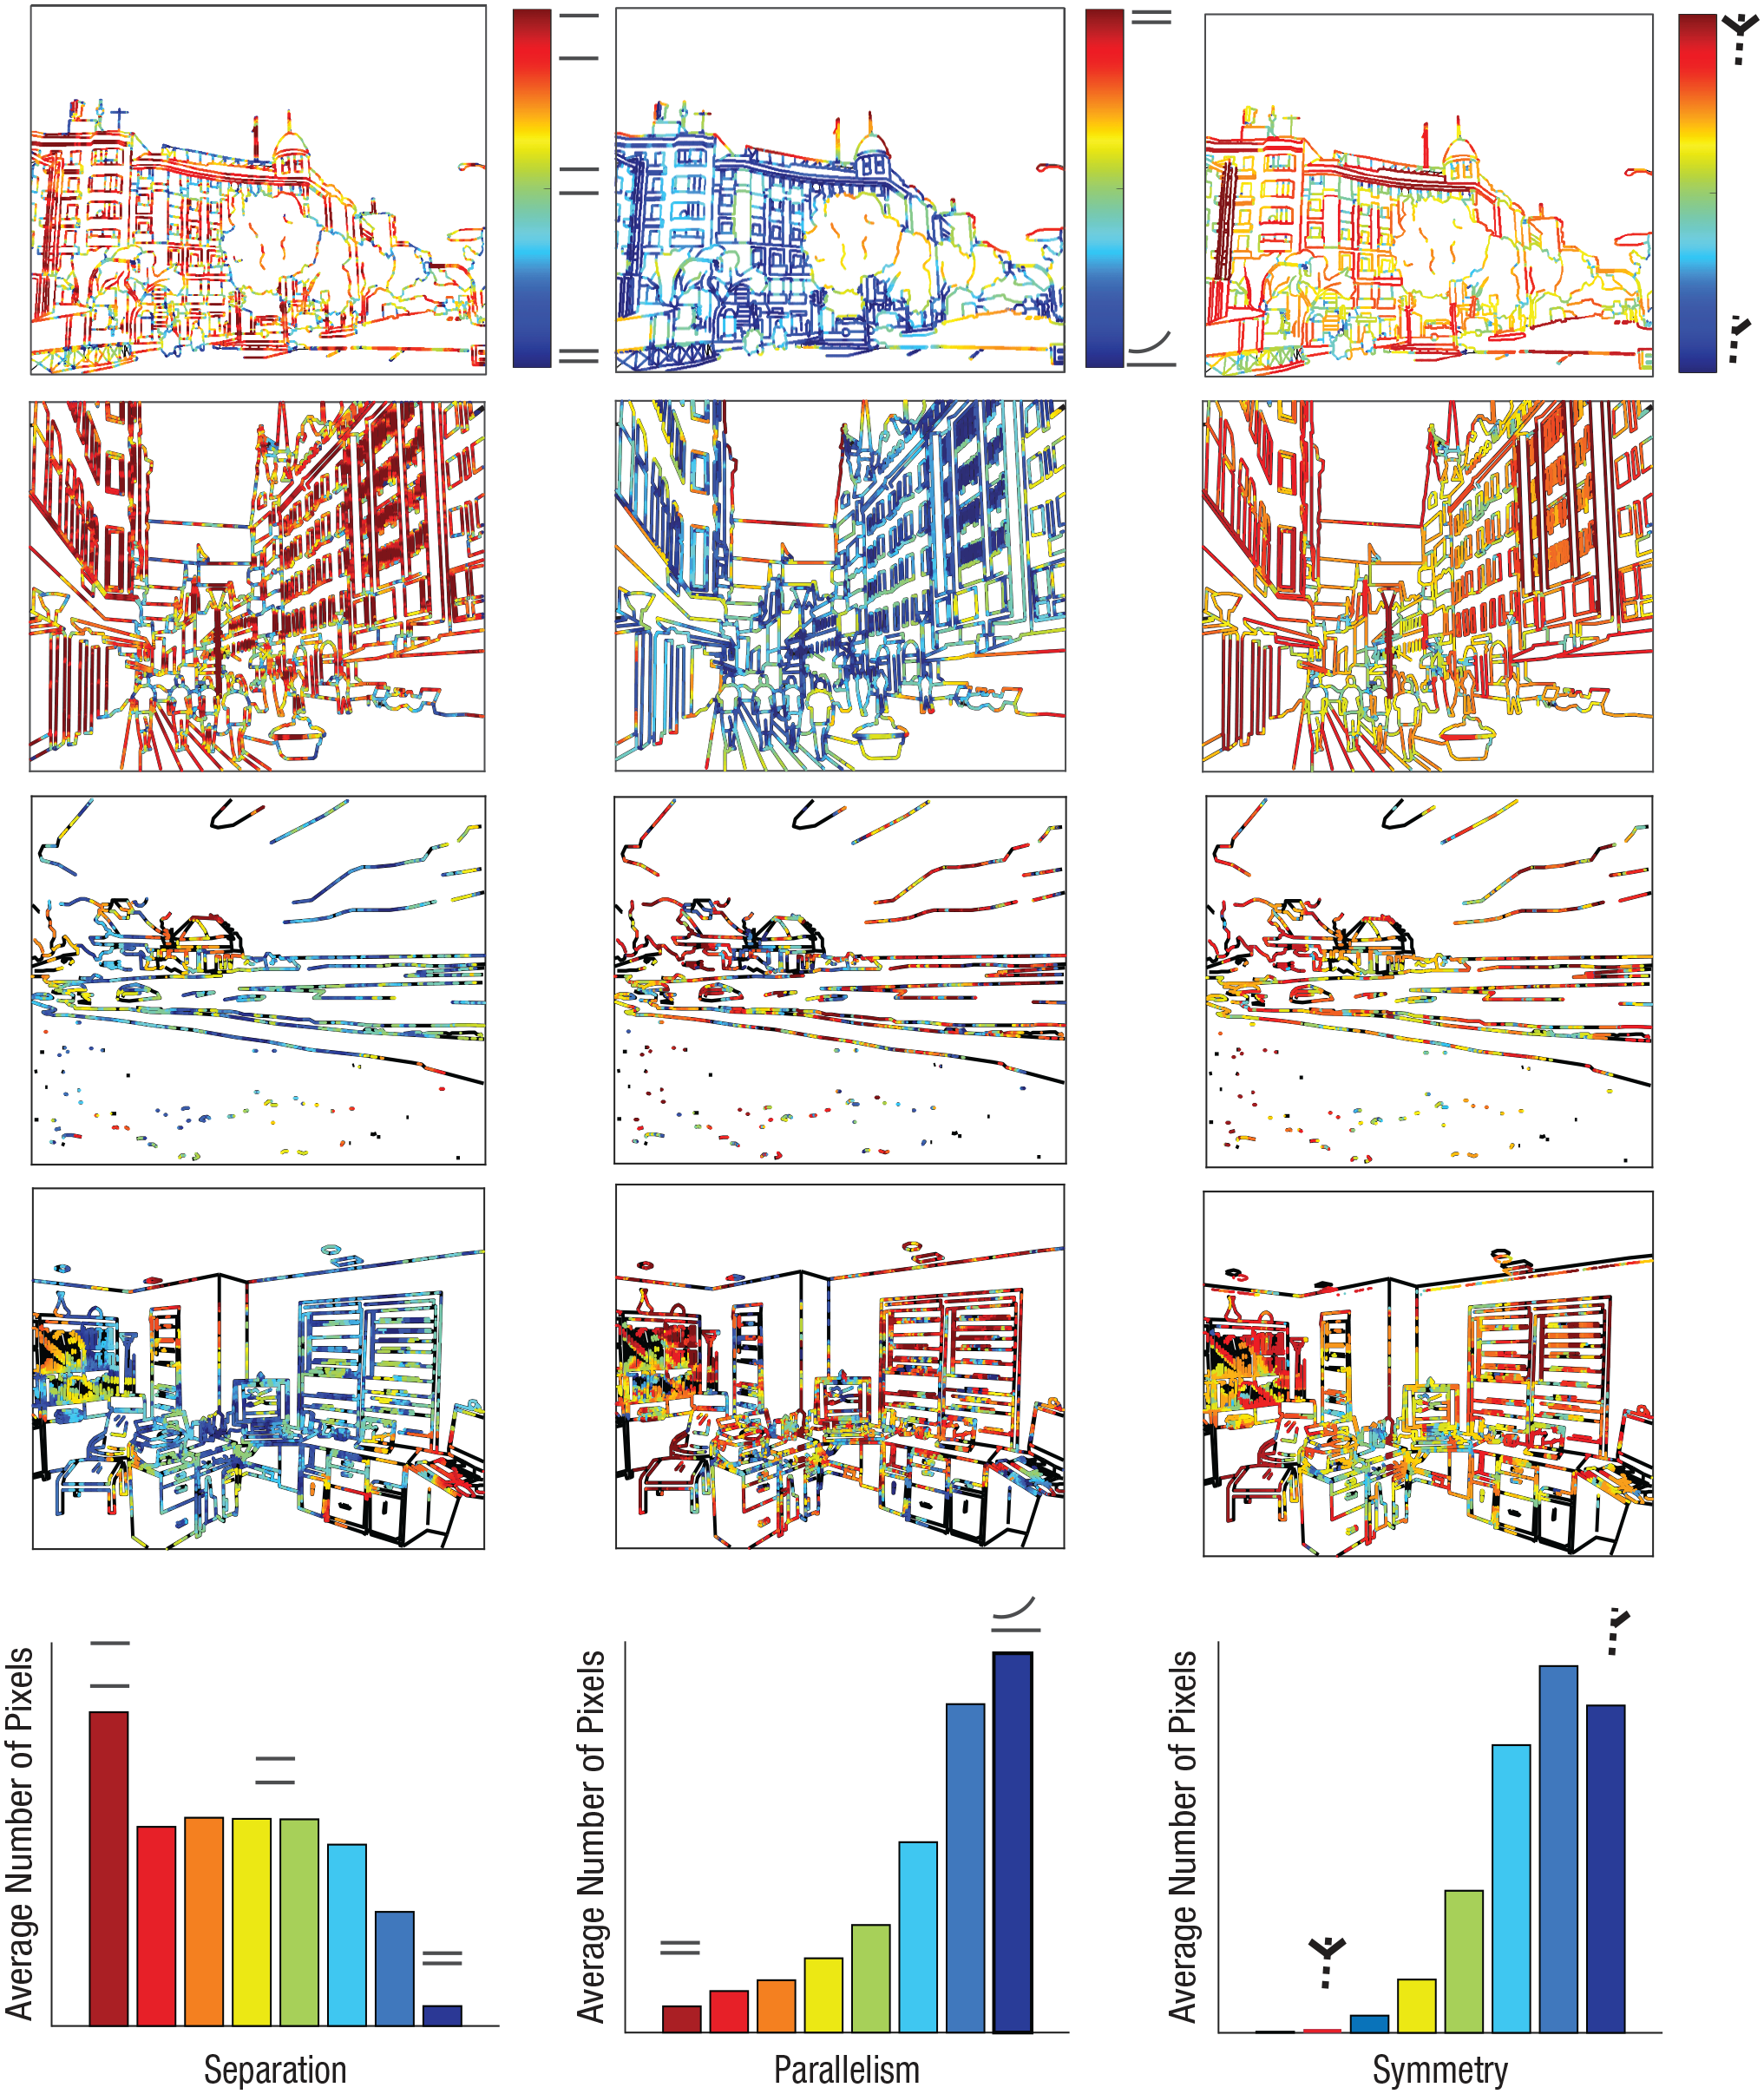
Visualization of measures of the spatial relation between contours for four representative line drawings. The bottom row shows the distribution of these properties for all stimuli.
Random forest algorithm
In this experiment, a new random forest model (RF Model 2) was used to predict average normalized aesthetic ratings for a given scene, using the same procedure as the one used in Experiment 1. In this experiment, histogram bins of spatial relation properties of adjacent contours (separation, parallelism, mirror symmetry) were added to the feature list. A total of 53 features were used as predictors of aesthetic value (Fig. 6).
Results of Experiment 3. (a) variable importance plot, and (b) schematic of the construction 453 of random the forest model from image features for Experiment 3. AU = arbitrary units.
Stimuli
Following the same procedure for stimuli generation as in Experiment 2, half-split images based on predicted scores from RF Model 2 were generated for this experiment; 132 of these contour-modified scenes were also presented in an inverted condition (i.e., rotated by 180 degrees) with a randomized presentation order (Fig. 7).
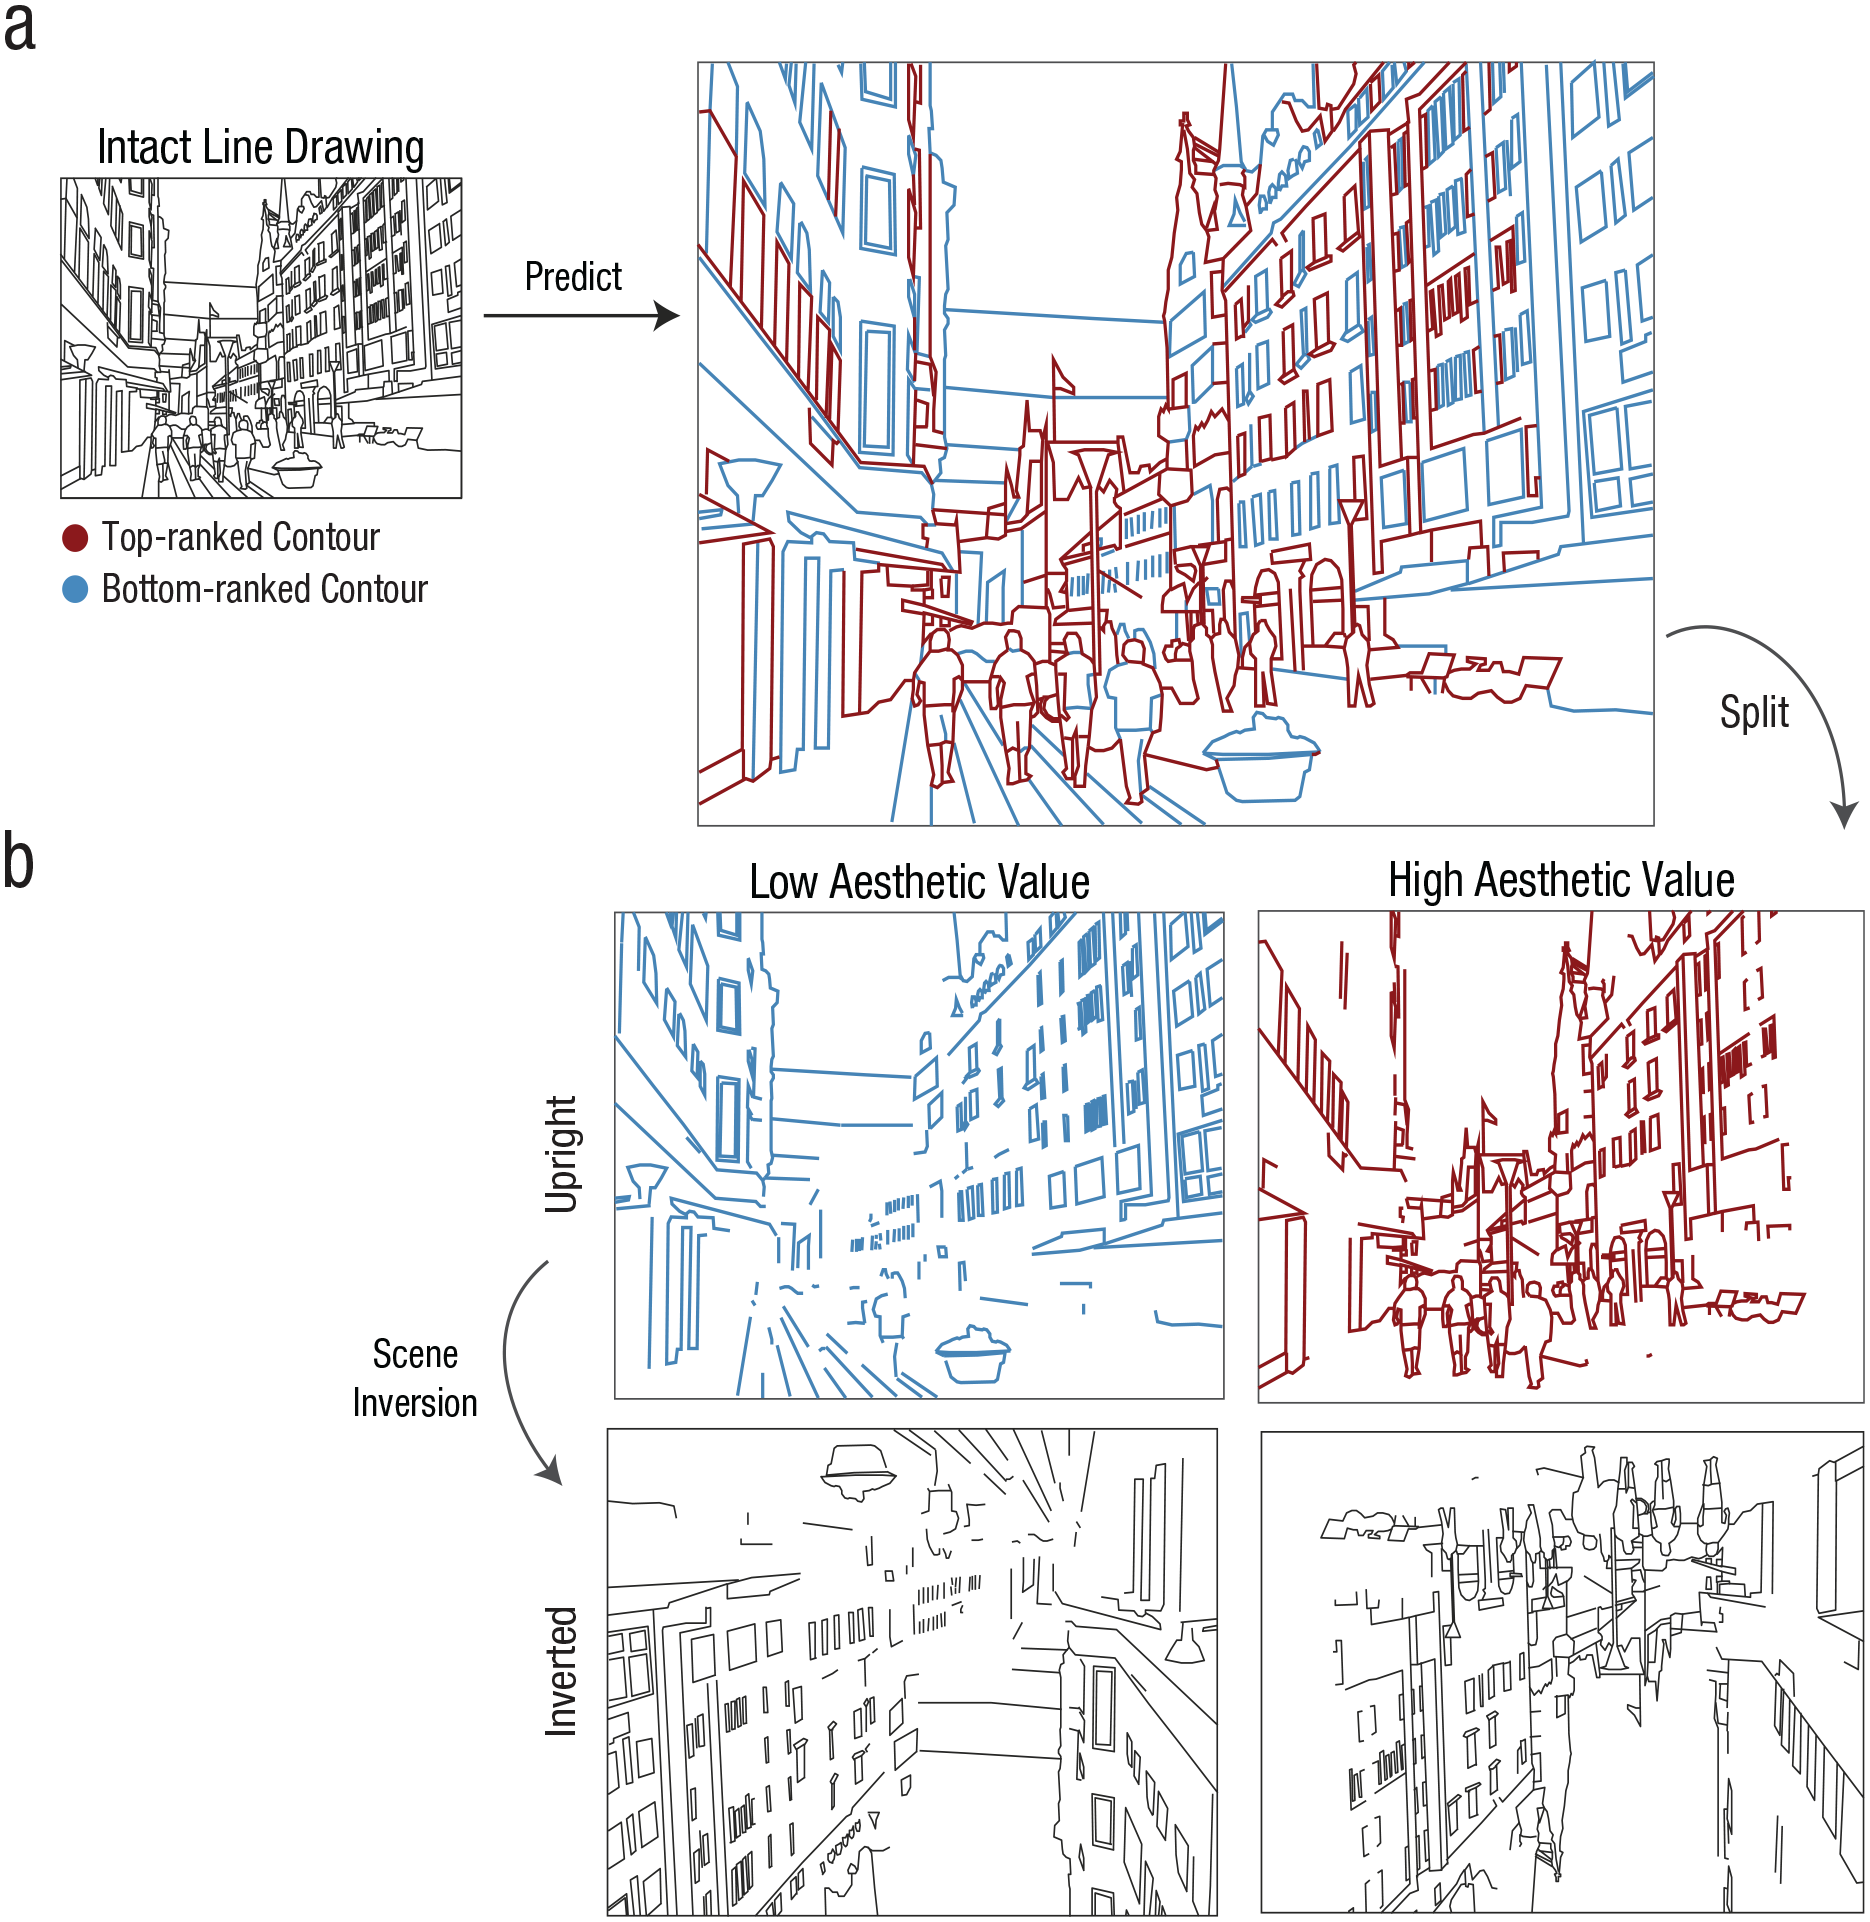
More results of Experiment 3. In (a) are shown contour valuations in a city scene based on predicted aesthetic values obtained from RF Model 2 (Experiment 3); in (b) are shown the top-ranked (red) and bottom-ranked (blue) contours used to generate split drawings. These split drawings were inverted (i.e., rotated by 180 degrees) to disrupt semantic processing.
Procedure
Aesthetic judgments of contour-modified scenes were collected following the procedure used in Experiments 1 and 2. The experiment was run using Inquisit software with participants recruited from Prolific. There were 950 upright and 132 inverted contour-modified scenes, and they were rated by 18 to 20 observers. Five versions of the experiments were used, so each participant rated a maximum of 266 images.
In a separate categorization experiment, participants were shown half-split and inverted stimuli in a random presentation order and asked to respond with the category of the scene. Each participant categorized 350 scenes, which contained balanced numbers of images from each scene category (aesthetic and inverted conditions). There were six possible scene categories. The key mapping (e.g., s = forest, d = city, f = mountain, j = highway, k = beach, l = office) was pseudorandomized for different participants. Each participant completed 10 practice trials with feedback before proceeding to the main experiment. Each trial started with the presentation of a fixation cross at the center of the display for 100 ms, followed by the scene image. Category keys were also shown at the bottom of the page as a reminder of the key mapping. Response time was limited to 10 s. Figure 8c shows a schematic of the categorization experiment. Categorization accuracy was computed as the fraction of correctly categorized images for each participant and averaged across participants.
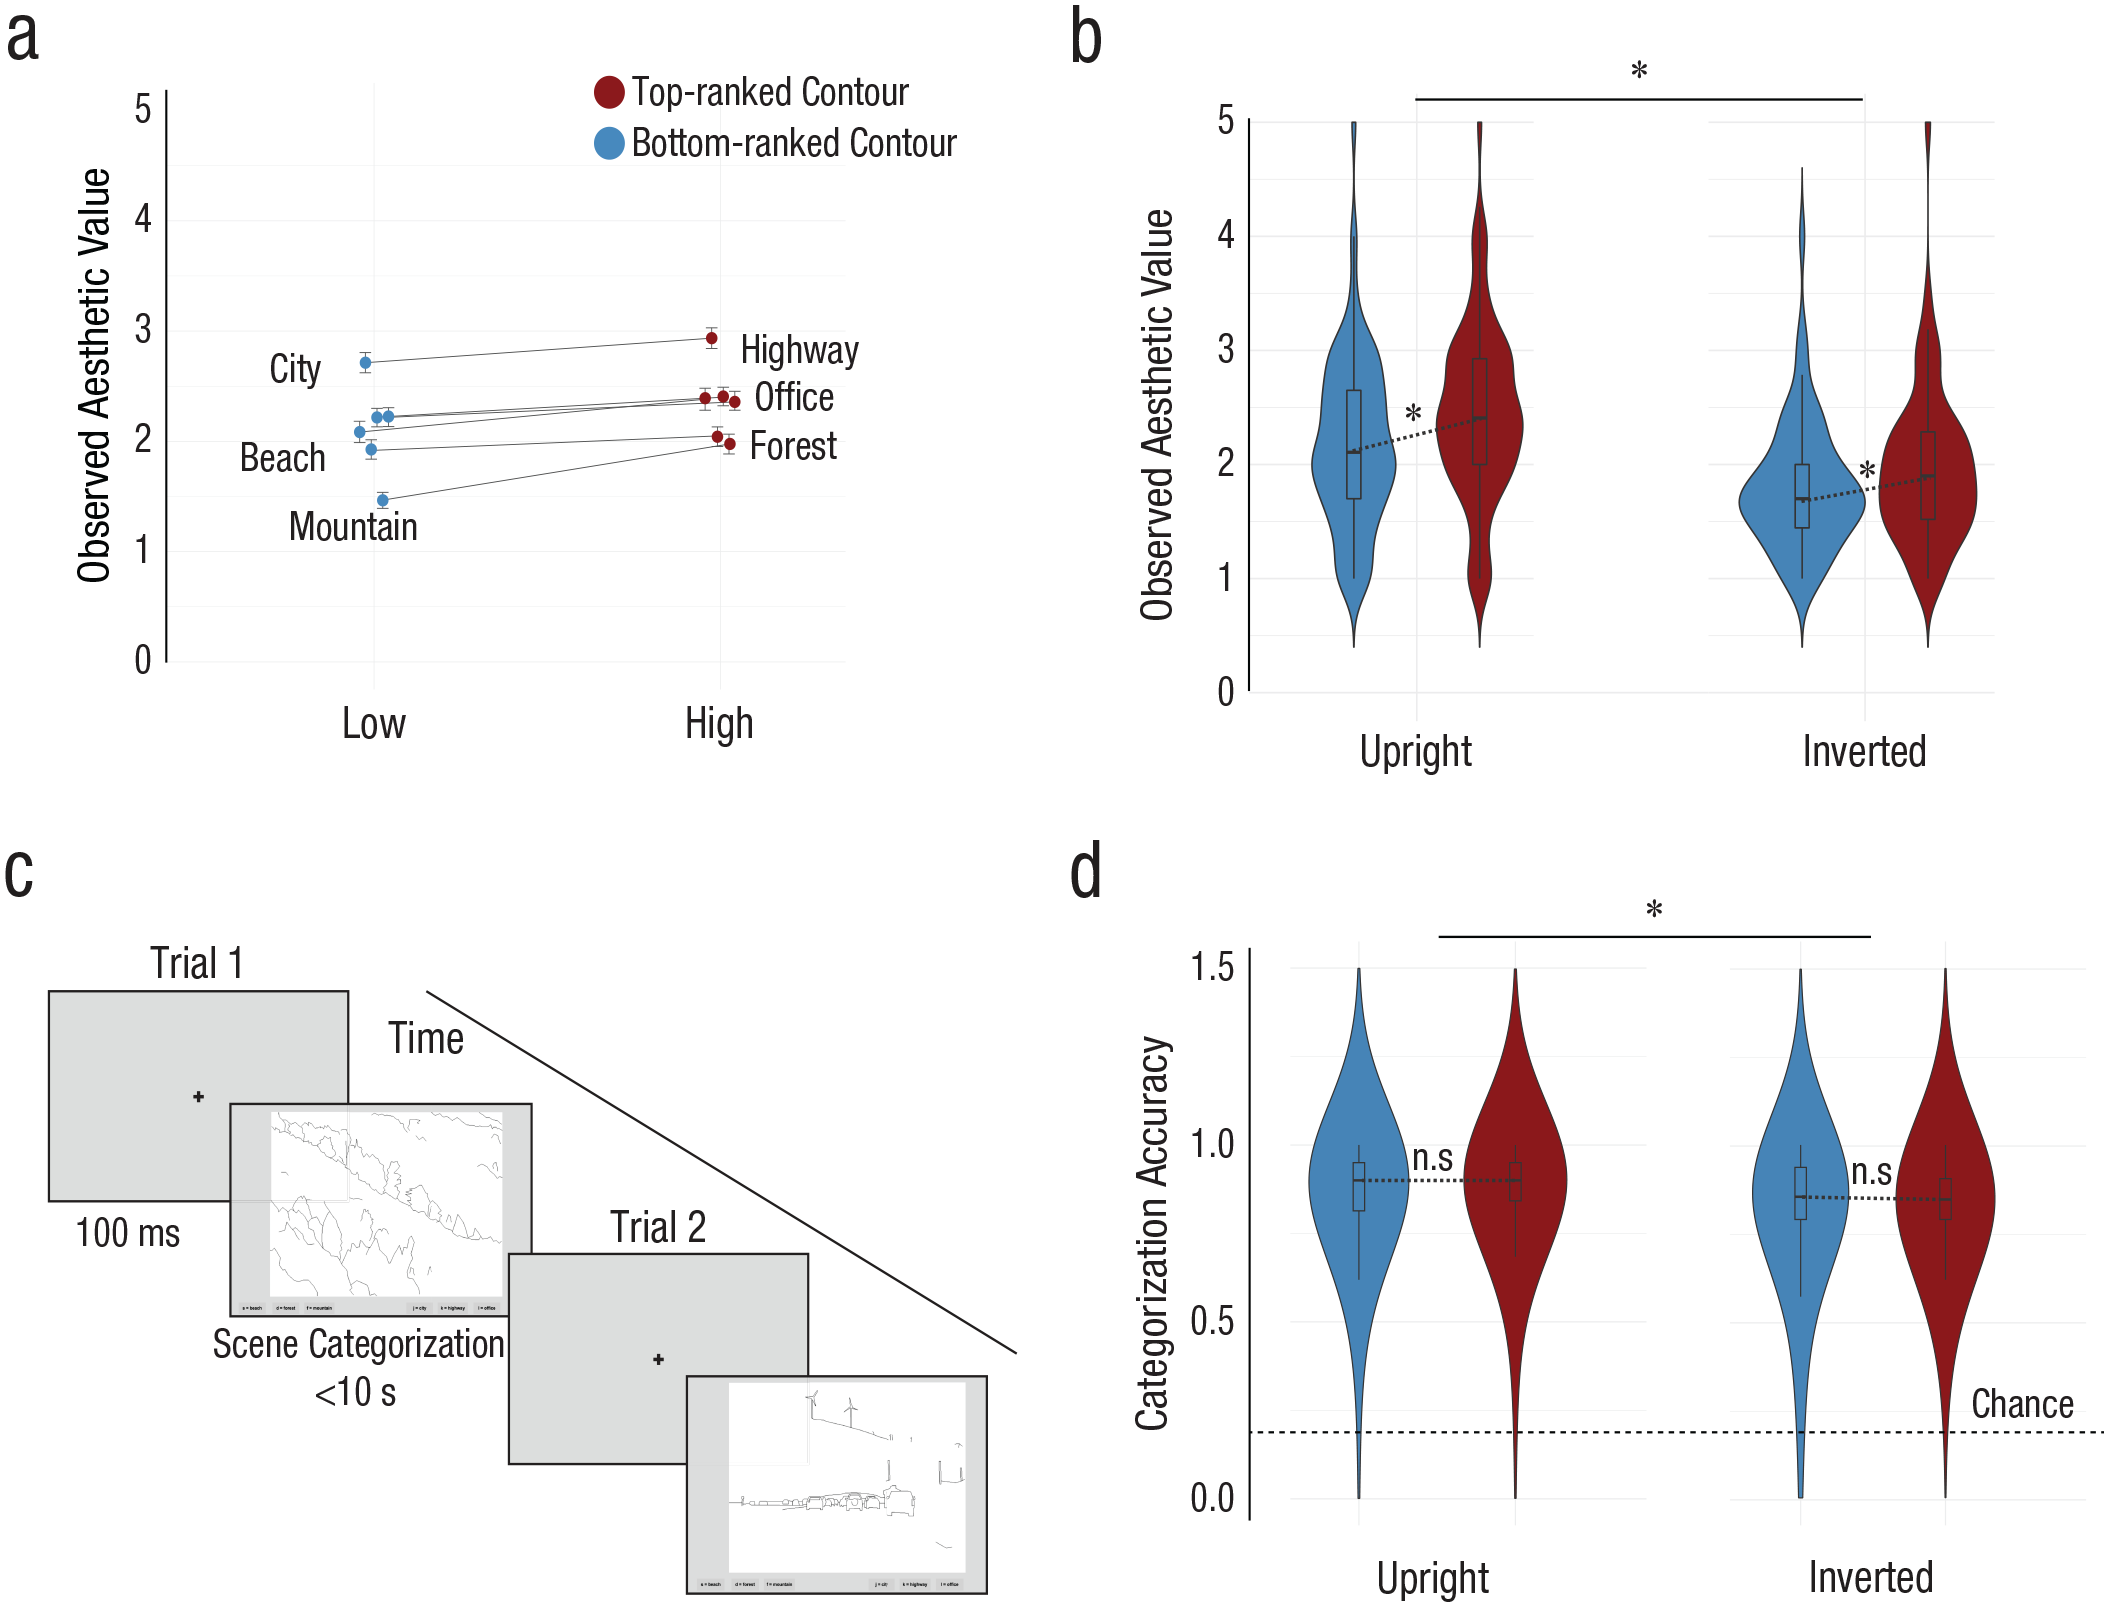
Results for Experiment 3, including (a) mean aesthetic ratings across categories for each aesthetic condition in Experiment 3 and (b) violin plots showing the distribution of aesthetic judgments for upright and inverted images in both aesthetic conditions (*p < .001). The effect was consistent across scene categories. In (c) is shown a schematic of the scene-categorization experiment, and in (d) is shown mean categorization accuracy for aesthetic and semantic conditions. Errors bars represent 95% confidence intervals.
Individual differences
Similar to Experiment 2, several measures that captured the personal characteristics of the observers were included in this study, including age, gender, educational attainment, environmental-type familiarity, and mood or affect. In addition, the aesthetic responsiveness assessment (AReA) was administered, which provides a broad measure of individual differences in responsiveness to aesthetic experiences (Schlotz et al., 2021). This measure consists of three separate subscales—aesthetic appreciation, creative behavior, and intense aesthetic experience.
Model comparison
A variance partitioning analysis was conducted to examine the correlations among the residuals of RF Model 1 (contour properties) and RF Model 2 (contour properties and spatial relations). We obtained the residuals of Model 1 (Y1) and Model 2 (Y2). A partial-correlation analysis was conducted using Y1, Y2, and aesthetic responses from Experiment 1 (Y). The ppcor package in R was used for this computation (Kim, 2015). Partial correlations are used to explore the amount of variance explained by one variable after eliminating the effects of other variables in a model.
Results
The random forest model (RF Model 2) trained on individual contour properties and spatial relation cues predicted aesthetic responses. These predictions were significantly correlated with observed aesthetic ratings (r = .62, p < .001). The MSE was .027.
A two-way analysis of variance showed a significant main effect for both the aesthetic condition, F(1, 494) = 323.77, p < .001, 95% CI = [0.22, 0.29], Cohen’s d = 0.10, and the semantic condition (inverted vs. upright estimate = 0.40), 95% CI = [0.35, 0.44], F(1, 573) = 375.81, p < .001. As in Experiment 2, we found that contour-modified scenes that retained the top-ranked contours (M = 2.35, SD = 1.26) were perceived to be more aesthetically pleasing than scenes with bottom-ranked contours preserved (M = 2.11, SD = 1.23; Fig. 8a). This effect was also found within inverted scenes, Mdiff = 0.14, 95% CI = [0.04, 0.23], padj = .002. We also found that aesthetic judgments of upright drawings were more favorable than aesthetic judgments of inverted drawings for both the high aesthetic condition, Mdiff = 0.45, 95% CI = [0.38, 0.53], padj < .00001, and the low aesthetic condition, Mdiff = 0.34, 95% CI = [0.26, 0.42], padj < .00001 (Fig. 8b).
A linear mixed-effects model showed a statistically significant effect for aesthetic condition with high-ranked contours favored over low-ranked contours (high vs. low estimate = 0.33), 95% CI = [0.27, 0.38], t(1, 76) = 12.36, p < 2 × 10⁻¹⁶). The marginal (fixed effects) and conditional (fixed and random effects) pseudo-R2 values for the mixed-effects model were 0.159 and 0.382, respectively. The standard deviation of the random effect for participants was 0.63, showing considerable variation between participants with respect to the fixed effects. Consistent with results from Experiment 2, affect was a significant predictor of aesthetic responses. Higher scores on negative affect were positively associated with aesthetic ratings, β = 0.014, 95% CI = [0.003, 0.03], t(1, 65) = 2.33, p = .02, whereas higher scores on positive affect were negatively associated with aesthetic ratings, β = −0.01, 95% CI = [−0.02, −0.002], t(1, 65) = −2.21, p = .03.
Other individual factors were not significant predictors of aesthetic responses. These included age, β = 0.004, 95% CI = [−0.018, 0.026], t(1, 66) = 0.33, p = .74; gender (male vs. female), β = 0.32, 95% CI = [0.03, 0.62], t(1, 65) = 2.06, p = .04; gender (other vs. female), β = −0.41, 95% CI = [−1.67, 0.84], t(1,66) = −0.60, p = .54; aesthetic responsiveness (creative behavior), β = 0.034, 95% CI = [−0.10, 0.20], t(1, 65) = 1.23, p = .21; aesthetic responsiveness (intense aesthetic experience), β = 0.05, 95% CI = [−0.10, 0.20], t(1, 65) = 1.82, p = .07; aesthetic appreciation, β = −0.009, 95% CI = [−0.10, 0.20], t(1, 65) = −0.56, p = .57; environmental familiarity (urban vs. rural), β = 0.17, 95% CI = [−1.25, −0.03], t(1, 67) = 0.74, p = .45; and environmental familiarity (suburban vs. rural), β = 0.20, 95% CI = [−0.12, 0.06], t(1, 67) = 0.7, p = .38.
Comparison of Experiment 2 RF model and Experiment 3 RF model
We found that the RF model consisting of contour properties alone (RF Model 1) explained 87.1% of the variance in aesthetic responses, F(1, 473) = 3,193, p < .001, R2 = .87. The RF model consisting of both contour properties and spatial relation cues (RF Model 2) similarly explained 86.1% of the variance in aesthetic responses, F(1, 473) = 2,922, p < .001, R2 = .86. The partial correlation between the RF Model 1 and aesthetic responses after eliminating the effect of RF Model 2 was .35. Thus, contour properties explained 62.7% of the variance once spatial relations (RF Model 2) were accounted for.
Control experiment for semantic content
The average accuracy in the scene-categorization tasks for the high (M = 0.87, SD = 0.14) versus low (M = 0.86, SD = 0.15) aesthetic conditions was comparable, F(1, 948) = 1.9, p = .168 (high vs. low aesthetic condition difference = .013, 95% CI = [−.005, .031]), showing that access to overall scene semantic content is not differentially altered by these specific contour manipulations. Similarly, for inverted scenes, categorization accuracy was comparable across high (M = 0.82, SD = 0.14) and low (M = 0.81, SD = 0.85) aesthetic conditions, F(1, 98) = 0.21, p = .647 (high vs. low aesthetic condition difference = .015, 95% CI = [−.051, .082]). Interestingly, the average categorization-accuracy performance was significantly higher for upright (M = 0.87, SD = 0.14) compared with inverted (M = 0.82, SD = 0.17) scenes, F(1, 1048) = 10.64, p = .001 (upright vs. inverted difference = −.05 [95% CI = −.08, −.02]). This confirmed that the scene-inversion manipulation disrupted semantic processing of both low and high aesthetic conditions and that targeted contour manipulations did not change the semantic content of scenes (Fig. 8d).
Discussion
We have demonstrated that observers’ aesthetic responses to natural scenes can be shifted in a predicted direction by manipulating the properties of contours within a scene. We presented a contour model of visual aesthetics and a method for modifying contour properties according to predicted aesthetic value. We modified contours in scenes while retaining scene identity and showed a causal relationship between participants’ aesthetic judgments and contour properties. For different semantic categories of scenes and in different groups of observers, we found that scenes with top-ranked contours were judged to be more aesthetically pleasing than scenes with bottom-ranked contours, as predicted by the model. We also showed that disrupting access to semantic content through scene inversion does not change the aesthetic advantage of top-ranked contours, indicating that the feature manipulations directly change aesthetic judgments rather than affect semantic processing. This effect was confirmed in a scene-categorization task, which showed that the categorization performance is diminished by a scene-inversion manipulation but not by aesthetic contour manipulations. Finally, we found that there is considerable individual variation in the extent to which contour manipulations shift aesthetic evaluations, with observers’ negative affect as a predictive individual characteristic.
In three experiments, we investigated the extent to which individual contour properties (orientation, length, curvature, junctions) and spatial relations between them (separation, parallelism, local mirror symmetry) contributed to subjective aesthetic responses. Our results show that much of the variance explained in responses is attributed to modifications of individual contour properties. Notably, contour junctions, specifically T junctions, were found to be the most potent visual cue for informing subjective aesthetic judgments, consistent with their important role in object and scene perception (Biederman, 1987; Choo & Walther, 2016). Different junction types are thought to carry different types of visual information—a property often used by artists in different cultures to create aesthetic effects (Cavanagh, 2005; Sayim & Cavanagh, 2011). For example, X junctions signal transparency, whereas T junctions signal occlusion boundaries (Cavanagh, 2005). T junctions help with recognizing objects and their configurations in space. These informative visual cues facilitate scene understanding and a subsequent sense of environmental safety, possibly through learned scene grammar (Võ et al., 2019), spatial schemas (Farzanfar et al., 2023), or perceptual fluency (Reber et al., 2004). The presence of nonaccidental scene properties likely improves aesthetic valuations by increasing information gain about the 3D structure of the scene and category membership as well as by possibly eliciting a sense of psychological safety. The robust effect of T junctions as a key predictor of aesthetic value in our models suggests that visual cues that resolve perceptual ambiguities and facilitate understanding of scene geometry are important for shaping our aesthetic judgments.
We found that aesthetic evaluations are shaped by contour properties but not to the exclusion of individual observers’ characteristics. It is noteworthy that affect (Watson et al., 1988) modulated the relationship between contour and aesthetic valuations in such a way that participants with stronger negative affect were more likely to rate line drawings favorably. Previous studies have shown human preferences for certain contour properties, such as curvature in objects, faces, and architectural scenes (Bar & Neta, 2006; Vartanian et al., 2013), but context moderates this effect (Chuquichambi et al., 2022; Dai et al., 2022). Another study found that threat judgments can be predicted by contour properties (Damiano et al., 2021). Daniel Berlyne conceptualized the arousal potential of visual stimuli as the mediator between collative variables (e.g., novelty and complexity) and aesthetic response (Berlyne, 1970; Silvia, 2005). Changes in momentary reports of subjective happiness have also been shown to reflect a state represented by reward prediction-error signals in midbrain dopaminergic neurons (Rutledge et al., 2014). These findings suggest that aesthetic responses are coupled with affective responses (Chatterjee & Vartanian, 2014) in such a way that simple lines can indeed modulate affective responses. In response to viewing line drawings of scenes, we also found that individuals with higher negative baseline affect are more likely to be “pleasantly surprised,” as shown by an elevation in their self-reported aesthetic experience. We hypothesize that negative affect increases an individual’s potential for arousal and aesthetic responsiveness (Schlotz et al., 2021). More research is needed in this area to help us understand whether aesthetic responses are distinct from both reward and affective processing.
Our results support the notion of a perceptual reward system (Biederman & Vessel, 2006; Vessel et al., 2021). Previous studies that have investigated the role of statistical image properties using global quantitative measures such as contrast, entropy, spatial frequency, and self-similarity (Graham & Redies, 2010; Iigaya et al., 2021; Palmer et al., 2013). In this study, we found that structural contour properties are remarkably predictive of aesthetic responses to natural scenes. This methodology allowed us to investigate aesthetic valuation beyond the global level of a scene and to focus on target local elements. Specifically, local elements that are defined by the medial axis are represented in the ventral visual stream (Ayzenberg et al., 2022). These local regions guide attentional processes that are supported by midlevel vision neural substrates (Ayzenberg et al., 2022; Peirce, 2015). Contour properties also help people recognize visual primitives that make it easier to recognize items that share similar features with items encountered in the past and encoded in their semantic memory store. Research has shown that individuals tend to agree more with one another when evaluating real-world scenes than works of art and architecture (Vessel et al., 2018, 2019) and that viewing nature scenes has restorative effects (Berman et al., 2008; Kaplan & Kaplan, 1989). Aesthetic pleasure likely depends on visual properties that conferred evolutionary advantages and played a role in affordances—the possibilities for use and action that an external environment offers (Brielmann & Pelli, 2018; Gibson, 1986; Vartanian et al., 2013). Contour regularities may also guide human spatial navigation in the form of spatial schemas (Farzanfar et al., 2023); the extent to which aesthetic qualities of space facilitate navigation is an active area for future research.
Interestingly, we found that aesthetic judgments of natural scenes were lower when line drawings of scenes were evaluated compared with when their photographs were evaluated. Line drawings of cities and other human-made artifacts, on the other hand, were liked more than their photographed counterparts. This interesting finding can be explained by a complexity-fluency trade-off phenomenon (Berlyne, 1970; Donderi, 2006). Line drawings contain less information. Therefore, an inherently more complex scene category, such as a city, is more likely to reach the optimal arousal point when presented as a drawing than as a comparably more complex color photograph. By contrast, natural scene categories are liked more as photographs than as line drawings, presumably because the decrease in complexity in the drawings moves them away from the optimal arousal point. Similarly, perceptual grouping cues such as symmetry that increase information gain are associated with aesthetic responses (Arnheim, 1974; Attneave, 1954; Bertamini et al., 1997; Van de Cruys & Wagemans, 2011; Koffka, 1935; Palmer, 1992; Wagemans, 1993) and have been found to contribute to aesthetic judgments to some degree in our study. Given the facilitative effect of prototypicality on aesthetic valuations across a range of stimuli (Brielmann & Pelli, 2018; Martindale & Moore, 1988; Palmer et al., 2013), we propose that visual features that enhance our perception of aesthetic value are likely also involved in category learning.
We note that the generalizability of our findings is potentially limited to an adult population recruited remotely. We have shown that changes to contour properties and grouping cues directly alter aesthetic responses, even for inverted scenes with disrupted semantic processing. Our experimental method using targeted contour modifications allowed us to show a causal relationship between visual properties and aesthetic responses to scenes, taking prior correlational evidence of regularities in human aesthetic responses to an experimental test.
Footnotes
Transparency
Action Editor: M. Natasha Rajah
Editor: Patricia J. Bauer
Author Contributions