
Abstract
Education has been claimed to reduce aging-associated declines in cognitive function. Given its societal relevance, considerable resources have been devoted to this research. However, because of the difficulty of detecting modest rates of change, findings have been mixed. These discrepancies may stem from methodological shortcomings such as short time spans, few waves, and small samples. The present study overcame these limitations (N = 1,892, nine waves over a period of 20 years). We tested the effect of education level on baseline performance (intercept) and the rate of change (slope) in crystallized and fluid cognitive abilities (gc and gf, respectively) in a sample of Japanese adults. Albeit positively related to both intercepts, education had no impact on either the gc or the gf slope. Furthermore, neither intercept exhibited any appreciable correlation with either slope. These results thus suggest that education has no substantial role (direct or mediated) in aging-related changes in cognition.
Cognitive decline is a phenomenon that affects every human regardless of illness or trauma. With advancing age, decreases in general cognitive function considerably impact one’s quality of life and occupational performance. Aging-associated loss of cognitive function is furthermore predictive of dementia onset. Developing effective pathways for slowing down the cognitive aging process is a matter of substantial societal interest. Enhancing education has been claimed to be an effective strategy for achieving this goal. The relationship between cognitive abilities and educational and job attainment is apparent. For example, IQ, a standard measure of general cognitive ability, is the best predictor of one’s academic and professional success (Deary et al., 2007; Schmidt & Hunter, 1998). Moreover, education appears to be inversely related to cognitive impairment and the probability of developing dementia (Satizabal et al., 2016).
Although there is a broad consensus about the significant role of cognitive abilities in educational achievement, whether education causes an increase in cognitive performance is still a matter of debate. Ritchie and Tucker-Drob (2018) have estimated that additional compulsory years in school are associated with a slight increase in a wide range of cognitive tests. This result suggests a possible causal, rather than merely correlational, relationship between education level and cognitive abilities. The mechanisms behind the phenomenon are still unclear, though. Formal education may enhance cognitive function, train effective thinking styles, boost concentration, or, more trivially, teach test-relevant materials (for a review, see Ceci, 1991). It is thus yet to be clarified whether the observed improvements in cognitive test performance reflect one or more acquired domain-general (and, hence, transferable) skills or simply the boosted ability to resolve cognitive tests.
The relationship between education and aging-related cognitive declines has also been investigated. In fact, even if we assume that education does cause an increase in cognitive abilities, that does not necessarily imply that education buffers cognitive declines. The most prominent theory that provides an explanatory mechanism for the putative influence of education on cognitive declines is cognitive reserve (Cabeza et al., 2018; Stern, 2009). Cognitively, physically, and socially engaging life experiences, such as education, may be beneficial in old age. Specifically, such activities contribute to forming (a reserve of) knowledge and skills that can make the individual more able to cope with the detrimental effect of aging on the brain and cognition.
Those studies evaluating the effect of education on rates of aging-related decline in cognitive abilities have provided somewhat mixed findings. For example, analysis of the data provided by two of the largest longitudinal surveys monitoring cognitive trajectories over decades, the Seattle Longitudinal Study and the Victoria Longitudinal Study, has led to discrepant conclusions. Gerstorf et al. (2011) have found that education is associated with decelerated loss of performance in some cognitive skills, such as inductive reasoning and verbal fluency. Conversely, Zahodne et al. (2011) have reported null effects for all the cognitive tests examined. Notably, a recent meta-analysis estimated that the overall impact of education on rates of cognitive decline is substantially null (Seblova et al., 2020). Nonetheless, a considerable amount of between-study heterogeneity (i.e., nonrandom variance) remains unexplained. This latter result is of paramount relevance because even the slightest deviation in trajectories of cognitive decline may lead to very pronounced individual differences in the long run.
The Present Investigation
General cognitive ability (g) consists of two correlated yet conceptually distinct constructs (McGrew, 2009). Crystallized abilities (gc) refer to cognitive skills that individuals gain and develop in their social environment. This concept encompasses skills such as numeracy, literacy, and any domain-specific knowledge. Conversely, fluid abilities (gf ) pertain to domain-general cognitive mechanics such as working memory and processing speed. Adding to the complexity of the problem, gc and gf exhibit different patterns of change across the life span. Gc is usually not particularly affected by age. In fact, performance on gc cognitive tests may even increase because participants who take the same test multiple times tend to acquire knowledge relevant to the test (Rönnlund et al., 2005; Schaie, 1994). By contrast, gf usually shows a steeper aging-associated decline (Nishita et al., 2013). In addition, compared with gc, gf appears to be significantly less malleable to training (Moreau, 2022; Ritchie et al., 2015; Sala, Aksayli, et al., 2019; Sala, Jopp, et al., 2019).
Statement of Relevance
The importance of slowing down cognitive decline cannot be overstated. Loss of cognitive function has a massive impact on quality of life. Formal education has been claimed to attenuate declines. Recent studies have found that educational attainment in youth is associated with higher cognitive abilities in late adulthood. Nonetheless, the effect of education on rates of decline is unclear. Most previous investigations in the field cover a limited amount of time. The impact of education on cognitive declines may be too slight to spot after only a few years. This study overcame this issue. We examined the relationship between education and cognitive decline in nearly 2,000 Japanese adults over a period of 20 years. Our results confirm that education is not associated with cognitive decline. Aging does not seem to be kinder to the more educated.
The way education may affect cognitive abilities is thus twofold. The first dimension concerns what abilities are involved (gc vs. gf ). The second dimension regards what aspects of cognitive trajectories are targeted (baseline levels vs. rates of change). Moreover, these dimensions may interact. For instance, aging-related cognitive decline may be decelerated by superior baseline levels, as in the cognitive-reserve hypothesis.
Longitudinal change is often assessed via latent growth curve (LGC) models (Newsom, 2015). This statistical method allows the researcher to create two latent variables: an intercept and a slope representing baseline levels and rates of change, respectively. Because we examined two distinct types of cognitive abilities (gc and gf ), the model had to be extended to include four latent variables (two intercepts and two slopes). Finally, these latent variables can be conveniently regressed on several variables of interest (i.e., time-invariant covariates).
Although this modeling approach is ideal for studying (multivariate) change, its complexity poses a challenge. To reach a statistical power adequate to detect minor deviations in longitudinal change (and its between-individual variance), three elements are necessary: large samples (e.g., N > 1,000), numerous time points (e.g., more than five waves), and large time spans (e.g., decades; Brandmaier et al., 2018; Hertzog et al., 2006). Meeting these three conditions is a rare occurrence in the field (Gerstorf et al., 2011; Zahodne et al., 2011). The consequent lack of statistical power may thus be one of the sources of the nonrandom variance observed in Seblova et al.’s (2020) meta-analysis.
The present work addressed the above issues. We evaluated the impact of education on cognitive baseline levels and aging-related rates of decline. We also assessed the potential effects of baseline levels on decline rates. Pivotal to the aims of this study, we (a) employed data that met the requirements for statistical power and (b) incorporated both gc and gf measures in a single model to account for their shared variance.
Open Practices Statement
The data and analysis code for this study have been made publicly available via OSF and can be accessed at https://osf.io/7xbyf/. The design and analysis plan for the study were not preregistered.
Method
Participants
The data were collected as a part of the National Institute for Longevity Sciences–Longitudinal Study of Aging (NILS-LSA; Shimokata et al., 2000). The NILS-LSA is a population-based prospective cohort study that focuses on aging and age-related diseases. The participants were sex- and age-stratified random samples of Japanese community-dwelling adults between the ages of 40 and 79 years at baseline (Wave 1: 1997–2000). This baseline sample consisted of 2,267 participants who completed follow-up assessments every 2 years until Wave 7 and up to 5 years in the last two waves (Wave 2: 2000–2002, Wave 3: 2002–2004, Wave 4: 2004–2006, Wave 5: 2006–2008, Wave 6: 2008–2010, Wave 7: 2010–2012, Wave 8: 2013–2016, and Wave 9: 2018–2022). The study was reviewed and approved by the Ethics Committee of Human Research at the National Center for Geriatrics and Gerontology, Japan (No. 1351-2, No. 899-6), and all participants provided written informed consent before participating in the study.
Inclusion criteria
This baseline sample consisted of 2,267 individuals. Participants had to satisfy two conditions to be included in the present investigation: (a) no history of dementia at baseline (Wave 1) assessment and (b) at least one data point in addition to baseline assessment. Four participants were excluded for a history of dementia, and 360 participants were excluded for not having at least one additional data point. In addition, participants with incomplete cognitive assessments at baseline or incomplete information about any of the covariates (n = 11) were excluded. A total of 1,892 participants were therefore included in the analyses.
Statistical analysis
Model
Multivariate LGC (MLGC) modeling was employed (Robitaille et al., 2012). One latent intercept and one latent slope were estimated for each gc and gf. All the factor loadings, which represent the direct effects of latent factors on the observed variables, were fixed to 1 for the intercepts. Following current recommendations, we assumed age-related cognitive decline to be nonlinear (Ghisletta et al., 2020). In addition, because the data were sometimes collected at unequal intervals (e.g., Wave 8 and Wave 9), the slope factor loadings had to be estimated accordingly. Therefore, the slope factor loadings were fixed to 0 and 1 for the first and last wave (to set the scale), respectively, whereas the other loadings were freely estimated. The model included a set of time-invariant covariates (i.e., predictors of the four latent variables). Residual variances were constrained to be equal across waves to facilitate convergence. The two slopes and the two intercepts were allowed to covary. The cognitive tests and the numeric covariates were scaled and centered. The structure of the model is shown in Figure 1.
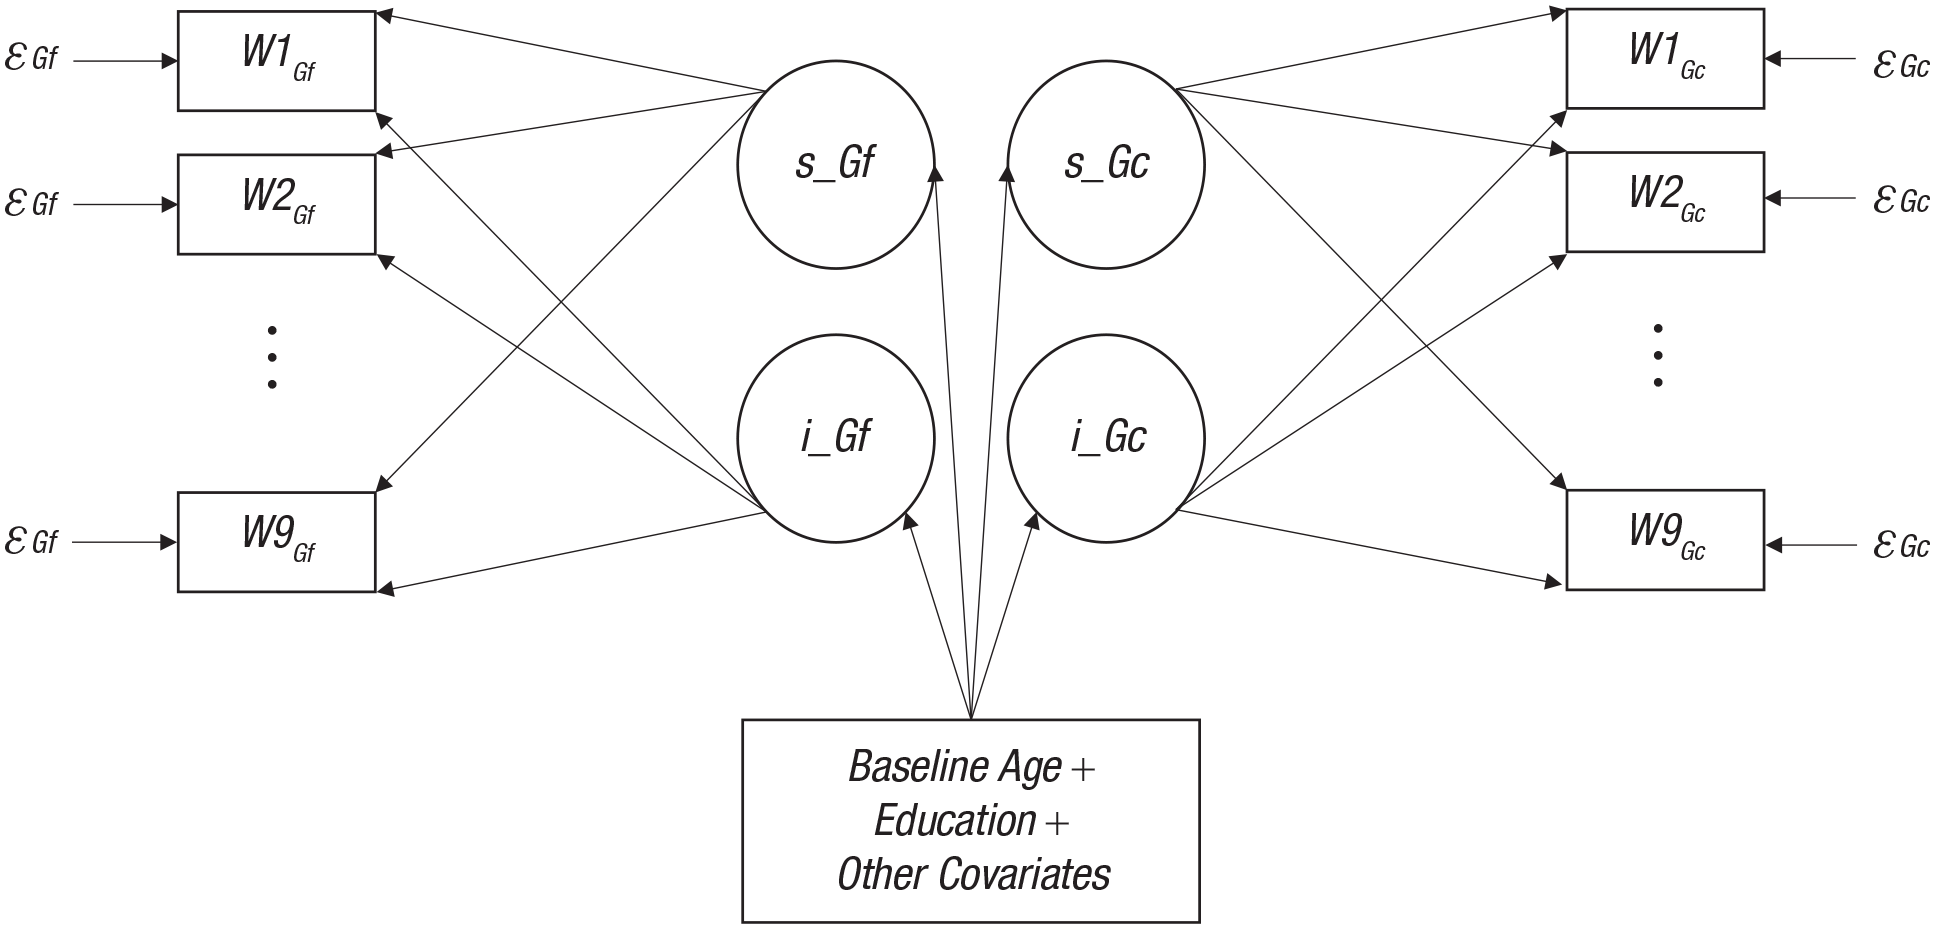
The multivariate latent growth curve (MLGC) model. Rectangles represent observed variables (i.e., cognitive measures and covariates), and circles represent latent variables (i.e., intercepts and slopes). The latent variables were allowed to covary. Arrows point to exogenous variables. The εs are residual (i.e., unexplained) variances. The cognitive measures from Wave 3 to Wave 8 are omitted for exposition purposes. Gf = fluid cognitive abilities; Gc = crystallized cognitive abilities; s = slope (rate of change), i = intercept (baseline); W = wave.
Analyses were run with the lavaan (Rosseel et al., 2017) and semTools (Jorgensen et al., 2016) packages for the R programming environment (R Core Team, 2021). Descriptive statistics were calculated with the RcmdrMisc R package (Fox, 2022). The semPower R package (Moshagen & Erdfelder, 2016) was employed for power analysis.
Power analysis
The sample size was not determined a priori. A post hoc power analysis was run. A sample size of 1,892 was associated with nearly 100% power to reject an incorrect model (amount of misspecification set at root-mean-square error of approximation [RMSEA] = 0.050, α = .005). The number of participants was thus considered adequate to provide reliable results.
Variables
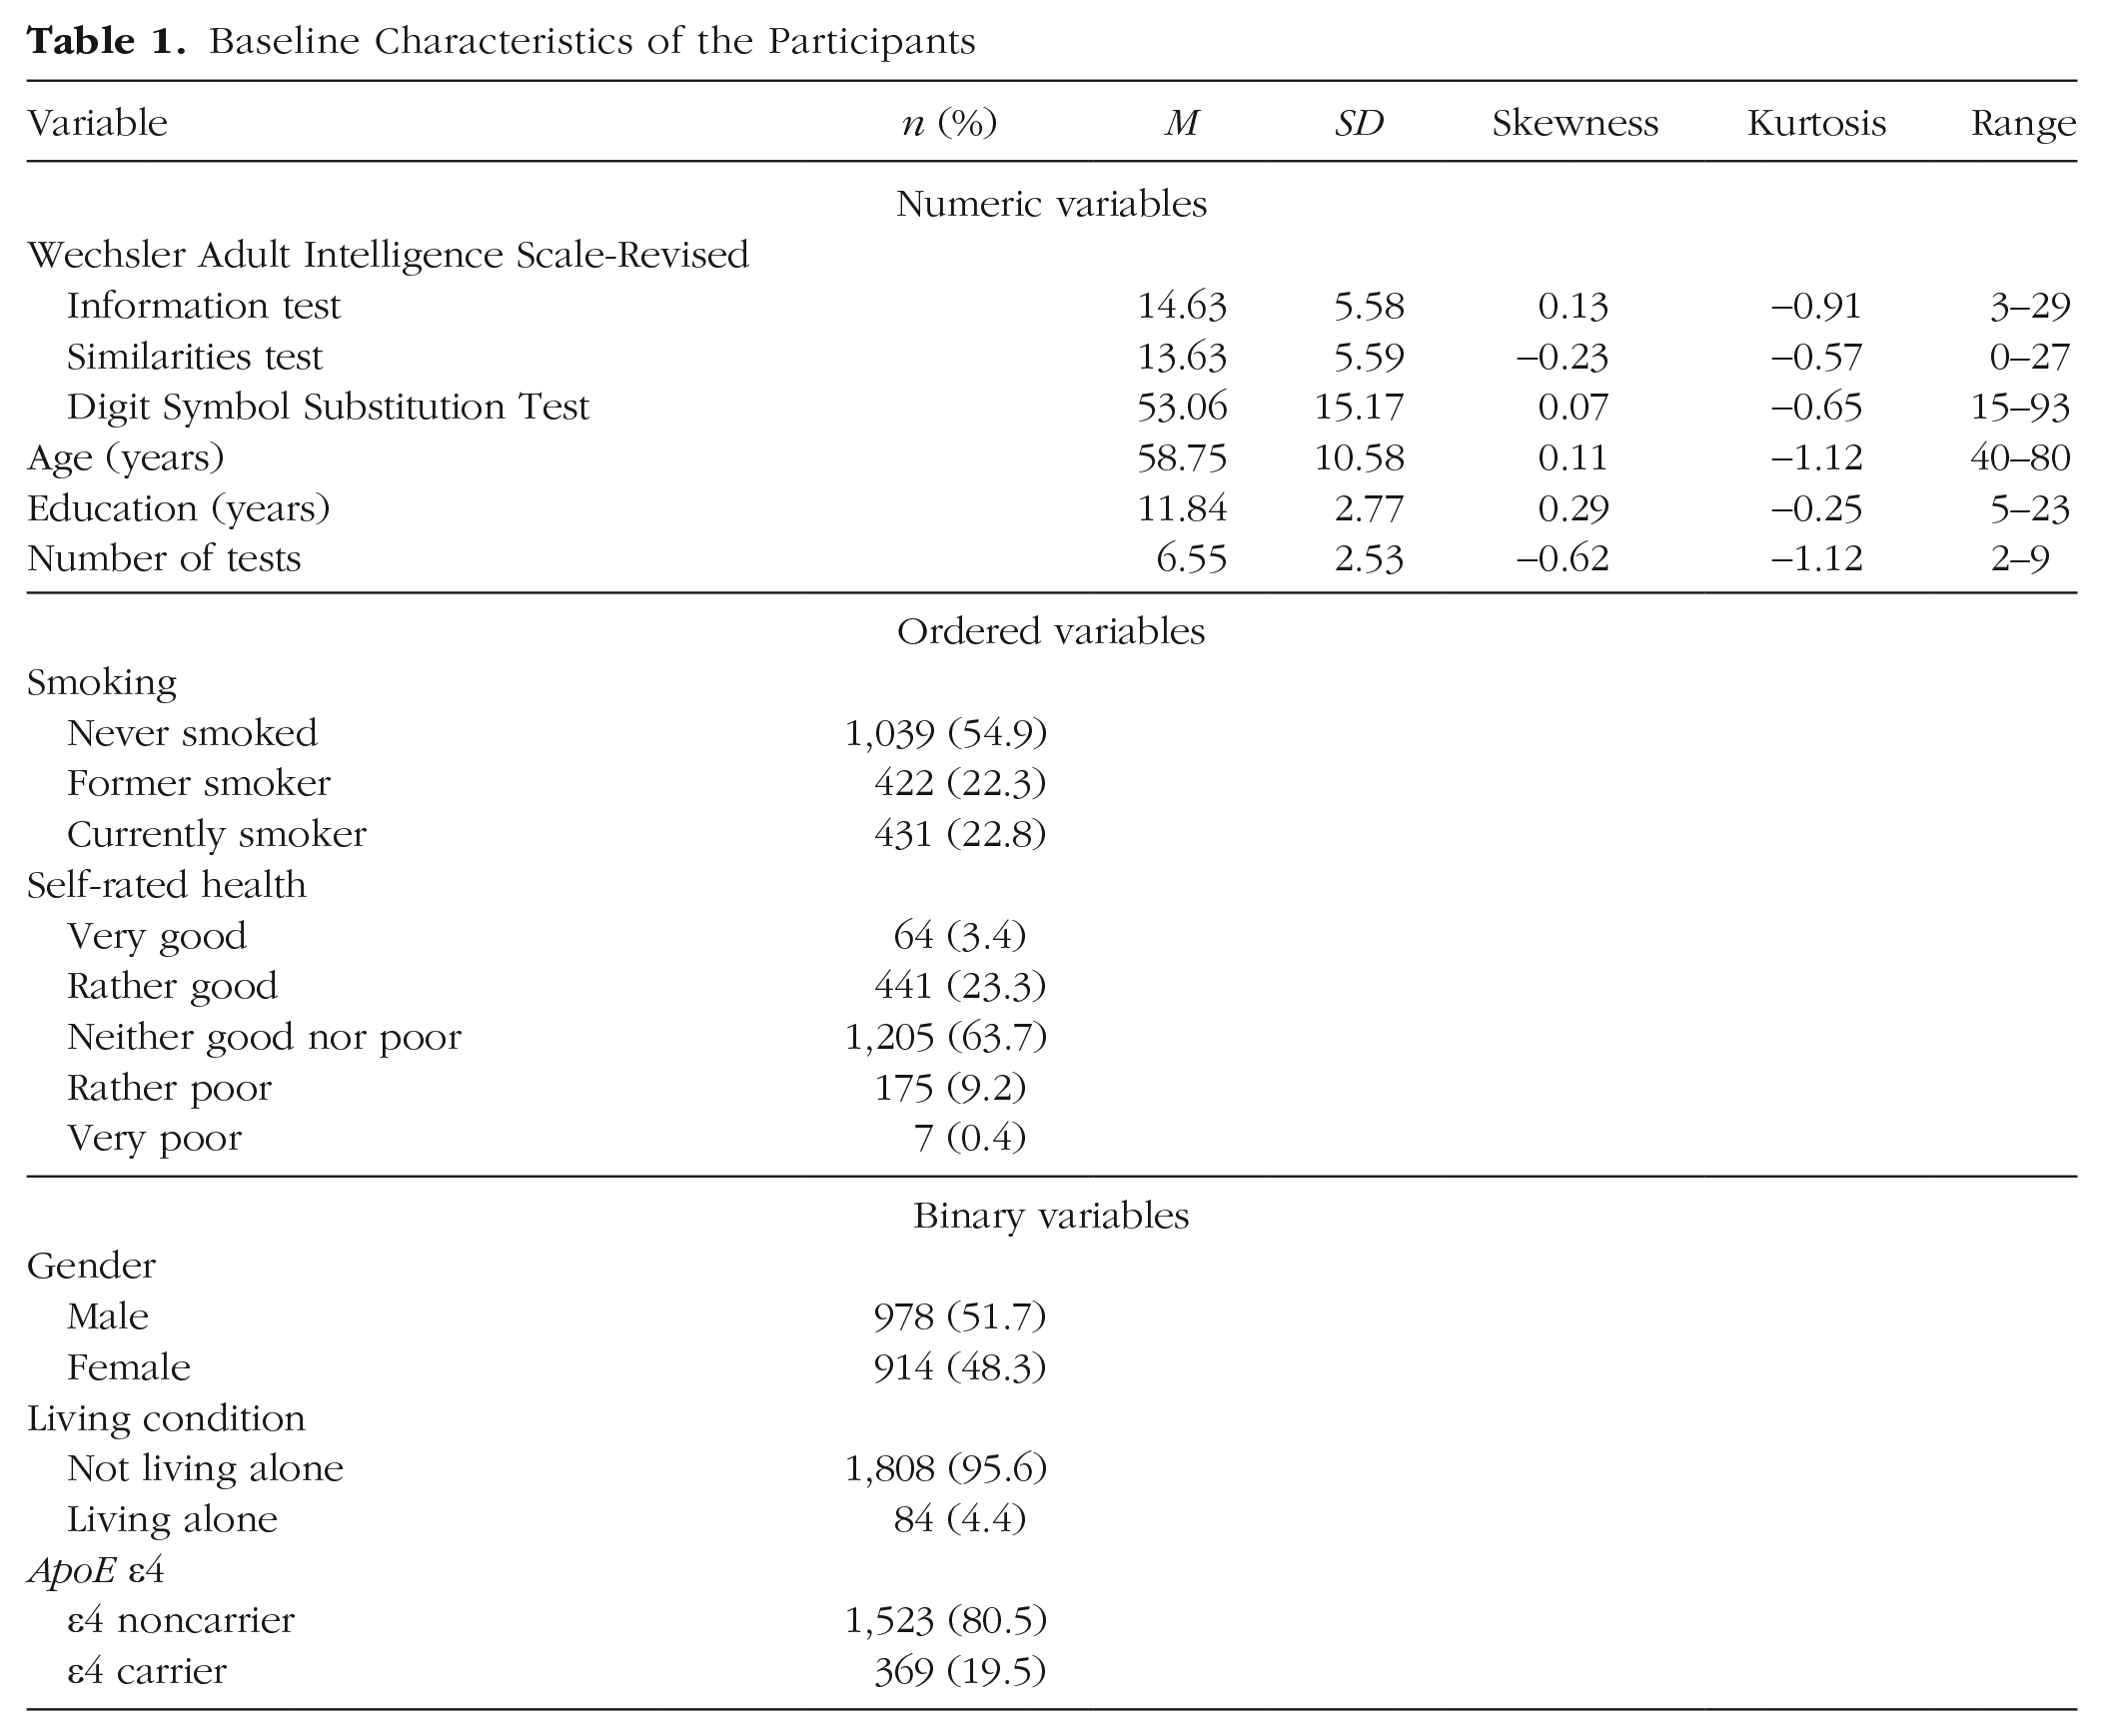
Table 1 reports descriptive statistics of the variables at the beginning of the survey.
Baseline Characteristics of the Participants
Cognitive assessment (observed variables, numeric)
Cognitive function was assessed with three subscales of the Wechsler Adult Intelligence Scale–Revised (WAIS-R; Wechsler, 1988): the Information test, the Similarities test, and the Digit Symbol Substitution Test (DSST). Trained clinical psychologists and psychology graduate students administered the test. The Information test included a set of general knowledge questions and measured the participant’s knowledge acquired from culture. In the Similarities test, the participant was asked to associate similar words or concepts. This subtest measured acquired verbal comprehension. Finally, the DSST consisted of a series of rows in which the participant was asked to detect a set of target symbols as quickly and accurately as possible. This test measured the participant’s processing speed. A composite score (average of z scores) for the Information and Similarities tests was calculated. This composite score highly correlates (r = .98) with the verbal comprehension score of the WAIS (Palmer et al., 2003), which is an excellent proxy for gc. The DSST was used as a proxy for gf (Fry & Hale, 1996). Its correlation with the WAIS processing speed score is .91 (Palmer et al., 2003). This battery of cognitive tests was thus deemed adequate to assess the constructs of interest.
Intercepts and slopes (latent factors)
The intercepts and slopes were estimated from the observed gc and gf variables (i.e., two intercepts and two slopes). The mean slopes indicated whether cognitive function increased or decreased on average over time. The mean intercepts represented the scaled estimated average baseline performance. The intercept variance and the slope variance measured between-subject differences at baseline and in aging-associated change, respectively.
Education (numeric covariate)
Participants had a mean of 11.84 years of education (SD = 2.77, range = 5–23).
Age (numeric covariate)
The mean age of the sample at baseline was 58.75 years (SD = 10.58, range = 40–80). This variable was included as a control because baseline participant age was likely to be associated with both the intercepts and slopes.
Gender (binary covariate)
At the start of the survey, the number of male and female participants was 978 and 914, respectively. Participant gender (0 = male, 1 = female) was included as a control variable because it was confounded with education level (e.g., among older adults, Japanese men are more educated than women, on average).
Additional covariates
We also included whether the participant was living alone (binary covariate; 0 = no, 1 = yes), a smoker (three-level ordered covariate; 1 = never smoked, 2 = former smoker, 3 = currently smoker), or a carrier of the ApoE ε4 allele (binary covariate; 0 = no, 1 = yes) as covariates. These control variables were added because they have been found to be associated with cognitive decline (Livingston et al., 2020; Montagne et al., 2020). Finally, participants’ number of assessments (from two to nine) was included to control for test–retest effects.
Self-rated health (five-level ordered covariate)
Participants were asked to assess their health on a 5-point Likert scale (1 = very good, 2 = rather good, 3 = neither good nor poor, 4 = rather poor, 5 = very poor). Health was included as an auxiliary variable to test the missing at random (MAR) assumption (for details, see below).
Results
Preliminary analysis
Throughout the nine waves of the survey, a significant number of data points were lost because of attrition (or occasional dropouts). The numbers of participants at each wave are shown in Table 2.
Number of Participants by Wave
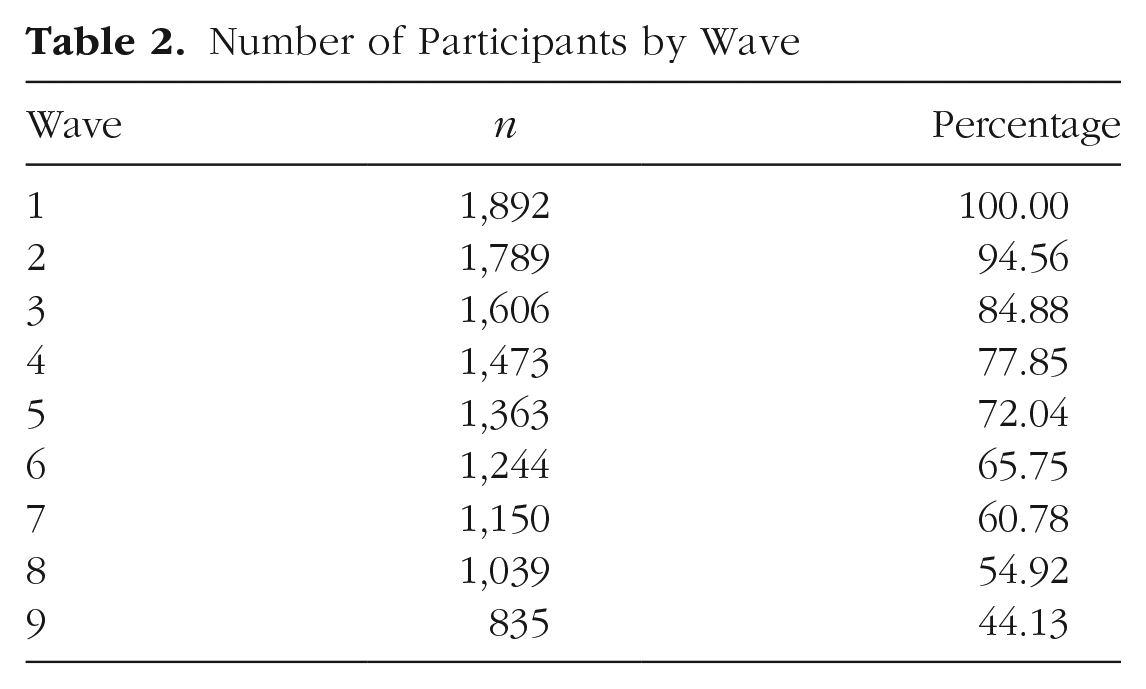
The mean duration between the first and last data collection was 14.15 years. Full information maximum likelihood (FIML) was implemented to handle missing data, a method that required the MAR assumption to be met. We thus ran a model including self-rated health as the auxiliary variable (Enders, 2008). All the covariates were excluded from this preliminary model to facilitate convergence. Results of χ2 tests for models with and without the auxiliary variable were nearly identical, χ2 (159) = 1,070.397 and χ2 (159) = 1,071.813, respectively. The inclusion of the auxiliary variable did not produce any meaningful differences in the fit indexes or the parameter estimates either. This result suggested that the MAR assumption was met. The auxiliary variable was therefore dropped in the main analysis.
Main analysis
Baseline age, gender, and education were added to the model as time-invariant covariates (i.e., predictors of the two latent intercepts and the two latent slopes). The impact of the intercepts on the slopes was evaluated as well. In accordance with commonly accepted fitness criteria (Hu & Bentler, 1999), the model fitted the data satisfactorily, χ2(257) = 1,296.787, comparative fit index = 0.975, RMSEA = 0.046, and standardized root-mean-square residual = 0.05.
As expected, the trajectory of the slopes was nonlinear. The factor loadings of the gc slope were 0, 0.210, 0.407, 0.646, 0.829, 0.931, 1.035, 1.060, and 1. The estimate of the mean gc slope was −0.210 (p = .005). That is, participants’ performance in gc decreased by −0.210 standard deviations on average over the course of the survey. Factor loadings for the gf slope were 0, 0.039, 0.015, 0.050, 0.146, 0.180, 0.279, 0.517, and 1, and its mean was −1.706 (p < .001). Participants’ gf performance thus worsened at an accelerated pace throughout the survey. This latter result reflected the accelerated rate of decline, especially in the last three waves (Fig. 2). Overall, these results were in line with the current state of affairs in the field (for a review, see Lövdén et al., 2020).
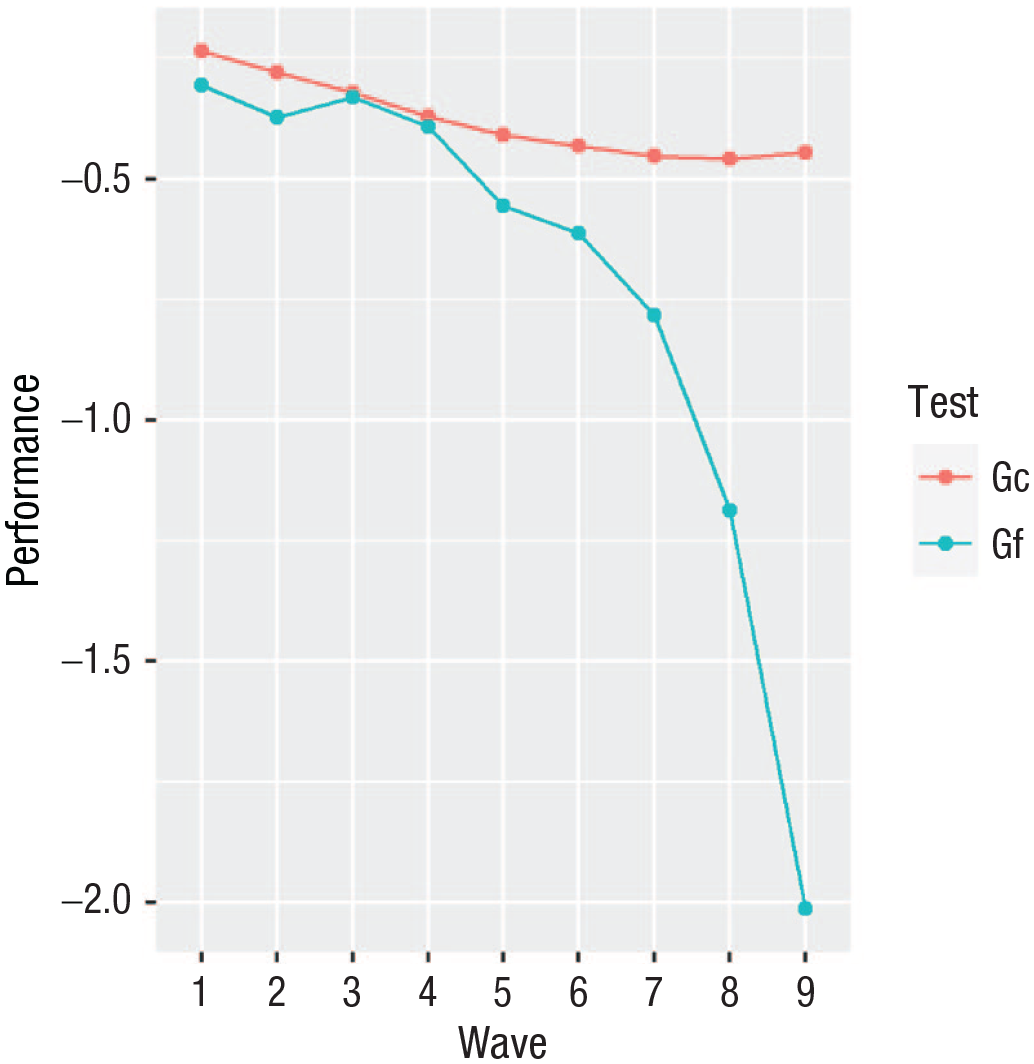
Estimated mean trajectory of decline in crystallized and fluid cognitive abilities (gc and gf, respectively) across the nine waves of the survey. Performance equals the factor loading multiplied by the mean slope plus the mean intercept.
The residual variances of the intercepts were 0.401 and 0.329 for gc and gf, respectively (both significantly different from 0; ps < .001). As expected, the residual variances of the slopes were smaller (0.066 and 0.090 for gc and gf, respectively) but highly significant (ps < .001). Also, Raudenbush’s (1988) reliability coefficient was calculated for all the latent factors (i.e., intercepts and slopes). This coefficient (range = 0–1) assessed the stability of the estimate of the latent factor. More specifically, the more between-subject variability compared with within-subject variability, the higher the coefficient. The intercepts exhibited near-perfect reliability (0.977 and 0.977 for gc and gf, respectively). The slopes’ coefficients were slightly smaller but still indicated a high reliability (0.877 and 0.920 for gc and gf, respectively). Overall, these results confirmed that the model possessed enough statistical power to reliably detect small longitudinal changes.
The model-implied zero-order correlation between the two intercepts and the model-implied zero-order correlation between the two slopes were .540 and .649, respectively. This result was in line with previous research showing that both baseline cognitive performance and longitudinal rates of change are correlated across different cognitive abilities but not so correlated to be regarded as unidimensional.
The intercepts were substantially unrelated to either slope. All the model-estimated standardized covariances (i.e., effect sizes) were smaller (in absolute value) than 0.077 (all ps ≥ .103).
The effects of the covariates on the four latent factors were mostly small or trivial. The only exceptions were age and the number of tests. Predictably, participants’ age was inversely related to both the intercepts (the older the participant, the less able they were at baseline) and the slopes (the older the participant, the quicker their rate of decline). Apart from the gc intercept, whose age-related effect size was close to 0 (−0.065), the other effect sizes were robust (all ≤ −0.509). As expected, the effect of the number of tests was more pronounced for the slopes (0.251, 0.528) than for the intercepts (0.137, 0.098).
Education was positively associated with both intercepts, although its effect size was meaningfully smaller with regard to gf (0.241) than gc (0.530). By contrast, education exerted no effect on the gc slope (−0.042, p = .188) or the gf slope (−0.042, p = .102). All the details of the regression analysis are reported in Table 3.
Results of the Regressions of the Multivariate Latent Growth Curve (MLGC) Model
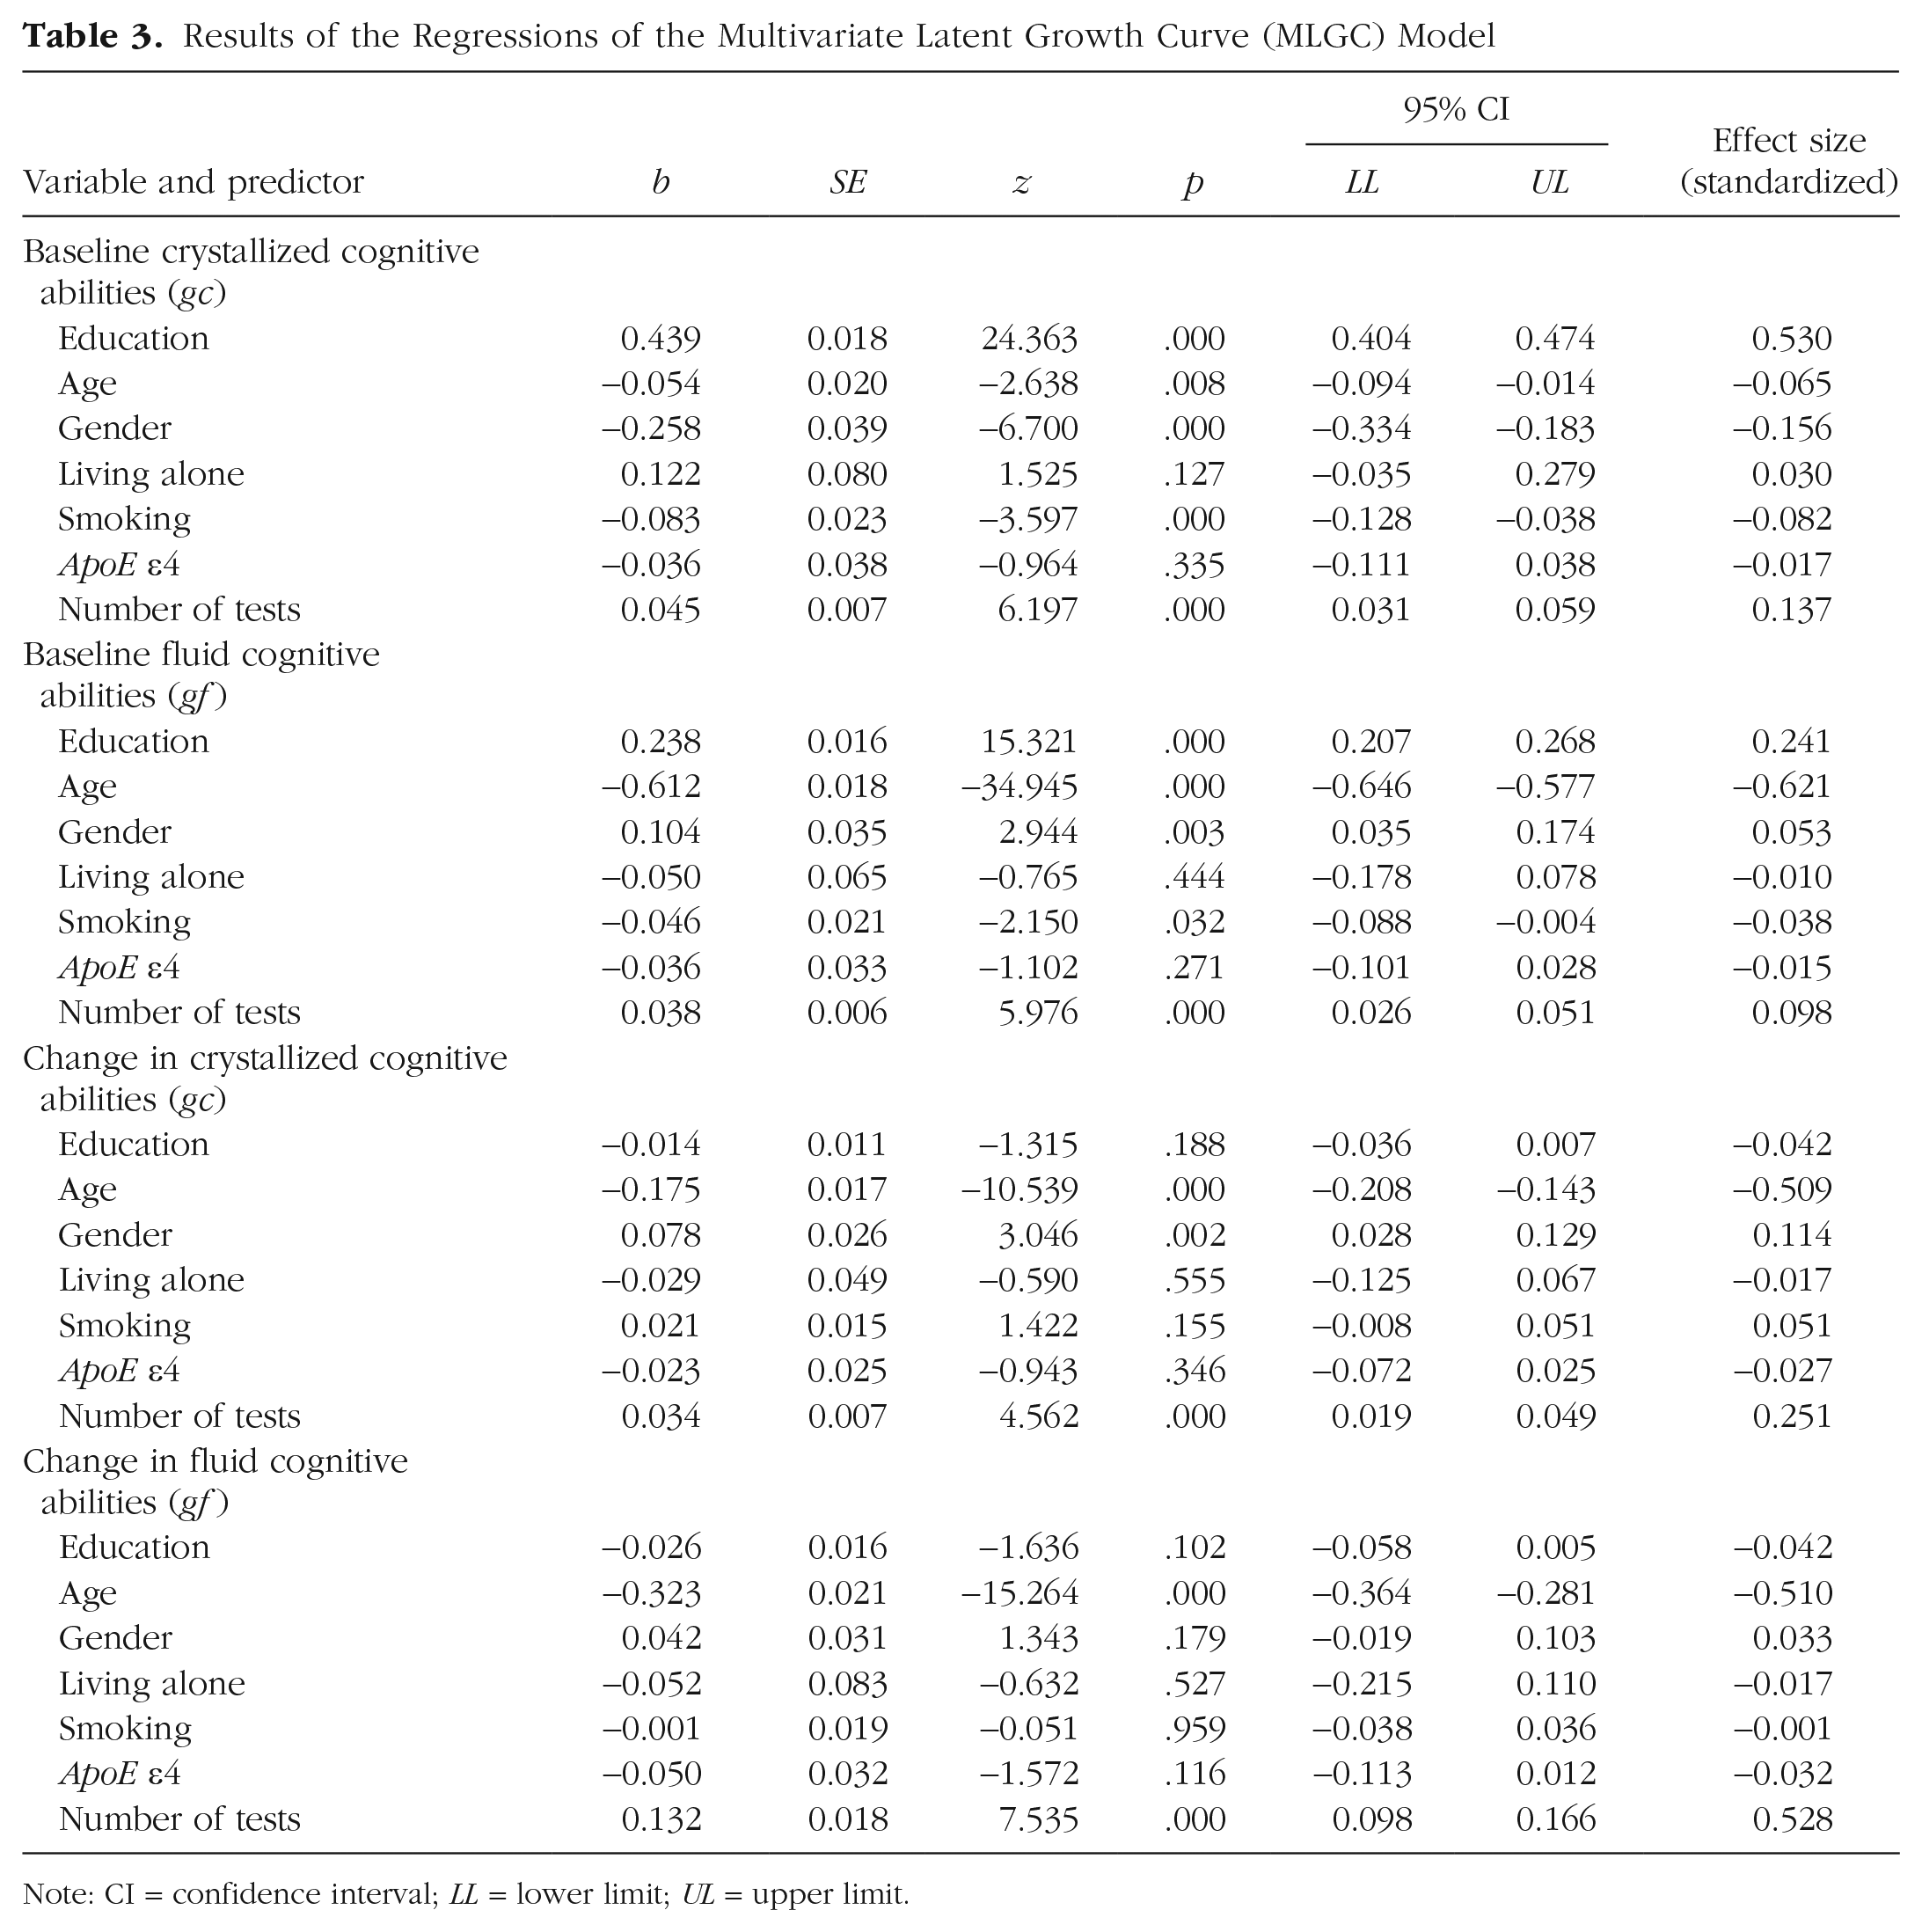
Note: CI = confidence interval; LL = lower limit; UL = upper limit.
Discussion
This work evaluated the relationship between years of education and cognitive abilities of a large sample of Japanese adults over nine waves and more than 20 years. We aimed to measure the impact of education on cognitive abilities over two dimensions: (a) the type of cognitive abilities (gc and gf) and (b) the elements characterizing aging-associated trajectories (baseline levels [intercepts] and rates of change [slopes]). To achieve this goal, we built an MLGC model that implemented a 2 × 2 design (i.e., two latent intercepts and two latent slopes, one for gc and gf each). Several control variables (covariates) were included to rule out possible confounding effects. This bivariate approach allowed us to take into account the variance shared between gc and gf. To our knowledge, no previous study has used MLGC modeling to investigate the link between education and aging-related cognitive declines.
We found that the association between education and cognitive abilities was a function of the two aforementioned dimensions. Participants’ gc baseline levels were robustly related to education. This outcome was no surprise because gc assessed, to a large degree, knowledge usually acquired in educational settings. Conversely, although the gc mean slope indicated a small average decrease throughout the survey, education had no impact on rates of change. Regarding gf, participants’ performance declined at an increased pace over the years. The effect of education on gf baseline levels was positive but limited in magnitude. Importantly, education exerted no effect on gf rates of decline. Finally, neither intercept showed any appreciable covariance with either slope. Thus, the relationship between education and rates of change was not mediated by baseline levels in either cognitive domain. Crucially, these null findings are hardly attributable to low statistical power.
Overall, our results corroborate the current view on aging-associated declines in gc and its relationship with educational attainment (Lövdén et al., 2020). Gc declines, if any, are negligible and virtually unaffected by education. Nevertheless, education exerts a substantial impact on gc baseline levels. Education is, therefore, effective at conveying domain-specific knowledge and skills but does not appear to influence their trajectories across adulthood and old age. Analogously, the positive effect of education on participants’ gf baseline levels somewhat aligns with previous research. Most important to the scope of this work, education had no impact on gf declines.
On the basis of these results, it is possible to outline two additional considerations. First, the effect of education on one’s gf baseline levels remains relatively limited in size. Although one might argue that something is better than nothing, it is unlikely that this effect is entirely caused by education. The association between academic and fluid cognitive abilities is well known. Thus, the effect of education on gf baseline levels is likely to be, to a nonnegligible extent, correlational in nature. Second, education has no mediated impact on the rates of decline either, which may appear counterintuitive. It would not be unreasonable to expect that more educated individuals experience kinder rates of decline in fluid cognitive abilities because they have developed a cognitive reserve and make more informed decisions. For example, highly educated people may be, on average, more knowledgeable about healthy lifestyles that would contribute to preserving their cognitive function. However, this does not seem to be the case. Therefore, the association between educational attainment and the observed lower risk of developing dementia often reported in epidemiological studies (Satizabal et al., 2016) may not be primarily mediated by cognitive function. Alternative explanations may involve other perks associated with high socioeconomic status, such as access to better health care or the possibility of engaging in (cognitively, physically, and socially demanding) leisure activities (Paggi et al., 2016; Sala, Jopp, et al., 2019).
Conclusions
Altogether, our findings highlight that aging is not kinder with the more educated. This state of affairs represents a sturdy obstacle to the implementation of effective educational programs against cognitive decline. Despite that, education does have an effect on baseline levels of cognitive abilities, but the benefits are greater for gc than for gf (0.530 and 0.241, respectively). Furthermore, it is unlikely that the estimated effect of education on gf is wholly causal and not at all correlational. Because fluid abilities appear to be better predictors of aging-related conditions such as dementia (Bajpai et al., 2022), the difficulty of positively influencing one’s gf baseline levels and rates of decline may thus be a matter of more relevance for public health than enhancing gc. Therefore, education may still play a role in delaying aging-related conditions such as dementia, but it is probably a secondary one.
Finally, we have underscored that the design of the NILS-LSA survey (i.e., a large sample tested on nine occasions over more than 20 years) and MLGC modeling are the most compelling elements of the present work, especially in relation to previous investigations. That said, it is worth mentioning the study’s main limitations. First, the amount of attrition is significant. Less than half of the initial participants have taken part in all nine assessments. FIML estimation mitigates the probability of severe bias in parameter estimation. Also, the presence of attrition over two decades is all but surprising. Nevertheless, given the magnitude of the data loss, we cannot help but recommend some caution in interpreting the results. Second, our study involved only Japanese participants. Whether the conclusions drawn here extend to Western societies should be ascertained. Moreover, the DSST is the only measure of cognitive fluid abilities in this study. Although this test is a reliable tool for assessing processing speed (Palmer et al., 2003) and a good proxy for gf (Fry & Hale, 1996), it would be worth including tests assessing other core cognitive mechanics (e.g., working memory capacity) to evaluate the generalizability of our findings. In this respect, using multivariate methods to reanalyze longitudinal surveys such as the Seattle Longitudinal Study and the Victoria Longitudinal Study, which include a larger number of measurements, may provide valuable insights.
Footnotes
Acknowledgements
We thank Fernand Gobet for commenting on an earlier draft of this article. We also express our gratitude to all the participants and the National Institute for Longevity Sciences–Longitudinal Study of Aging staff.
Transparency
Action Editor: Karen Rodrigue
Editor: Patricia J. Bauer
Author Contributions