
Abstract
Offering an inferior and rarely chosen third (decoy) option to decision makers choosing between two options has a paradoxical effect: It increases the choice share of the option most similar to the decoy. This attraction effect is robust when options are numeric but rarely occurs in humans when options are visual, even though it occurs in animals. Building on psychophysics, we examined two types of visual attributes: quantitative and qualitative. Quantitative visual attributes (e.g., different bottle volumes) can be perceived as magnitudes. Qualitative visual attributes (e.g., different colors), however, do not fall onto a magnitude scale. One can perceive that a bottle’s volume is twice that of another bottle but not that a green bottle’s color is twice that of a red bottle. We observed robust attraction effects for quantitative visual attributes (4,602 adults, 237 college-age participants), which reversed to repulsion effects when the visual attributes were qualitative (6,005 adults).
The attraction effect (Huber et al., 1982) has drawn wide attention across behavioral sciences. It demonstrates that decision makers’ preferences shift flexibly depending on context. It violates rational choice theory. Although the effect seemed large, replicable, and applicable to the field, recent research has sparked doubt about its scope (Frederick et al., 2014; Trendl et al., 2021; Yang & Lynn, 2014).
The attraction effect—or asymmetric dominance effect—concerns decisions between two competing choice alternatives: target A and target B (i.e., a competitor). When the choice set contains a third alternative, decoy A, which resembles target A but is inferior to it, decision makers choose target A more often at the expense of target B but hardly ever choose decoy A.
It is unclear why the attraction effect arises only in particular domains. Animals also exhibit the effect, suggesting that it is fundamental (Latty & Trueblood, 2020; Lea & Ryan, 2015; Schuck-Paim et al., 2004; Shafir et al., 2002). In humans, it is large when the choice options are presented in number format (Huber et al., 1982; Simonson, 1989) or when numbers are represented graphically (Cataldo & Cohen, 2019; Dimara et al., 2017; Farmer et al., 2017; Król & Król, 2019); however, very rarely has the effect emerged when the choice options were images of physical objects or the objects themselves (e.g., differently colored jelly beans; Frederick et al., 2014; Gaudeul & Crosetto, 2019; Simonson & Tversky, 1992; Stewart, 1989; Trendl et al., 2021; Yang & Lynn, 2014). This seems surprising given that the animal studies obviously did not involve numerals. Also surprising, humans do exhibit the effect, albeit to a smaller extent (Spektor et al., 2021), when judging the size of geometric objects (Choplin & Hummel, 2005; Liao et al., 2020; Trueblood et al., 2013).
Most important, current explanations of the preferential attraction effect principally apply to both numbers and images. There is no empirical investigation of what may differentiate those rare occasions when a visual effect is observed. Seeking to address this theoretical gap, we reasoned that preferential attraction effects might occur with visual stimuli but are supported by a property that is inherent only to a particular type of visual stimulus.
Building on how psychophysicists have conceptualized classes of perceptual attributes (Spence, 2011, 2019; Stevens, 1957), we distinguish two types: Quantitative visual attributes are visual stimulus properties that people can perceive as magnitudes (e.g., length, numerousness of random dots, brightness); qualitative visual attributes do not allow such perception (e.g., an object’s color, shape, position in space). One can perceive that a bottle’s volume is twice that of another but not that, say, a green bottle’s color is twice that of a red bottle. Thus, like numbers, quantitative visual attributes allow mental representations of magnitudes, whereas qualitative visual attributes do not. We emphasize, however, that visual magnitude representations are not numeric representations. Nevertheless, a later stage cognitive mechanism appears to process both kinds of quantitative information (Bonn & Cantlon, 2017; Walsh, 2003).
Many explanations of the attraction effect assume that decision makers compare target A with decoy A rather than target B with decoy A because they perceive decoy A as more similar to target A than to target B. As a result of comparing target A with the inferior decoy A, they perceive target A as more favorable. In other words, a contrast effect occurs, in which judgments of target A shift away from judgments of decoy A. The literature has suggested three types of contrast effects, any of which could contribute to attraction effects. As an illustration of these effects, consider bottle size (larger being preferred) as an attribute. When the smaller decoy A is present, decision makers may (a) perceive the size of target A as larger (contrast of attribute magnitudes; Choplin & Hummel, 2002; Wedell, 1991), (b) transform the larger size of target A to more positive valence (contrast during evaluation of magnitudes; Ratneshwar et al., 1987; Wedell, 1991), or (c) compare the valences of target A and decoy A, augmenting the positive valence of target A (hedonic contrast; Roe et al., 2001).
The first two types of contrast effects should be more likely to occur when the perceptual system represents magnitudes (as with quantitative visual attributes) than when it does not (as with qualitative visual attributes). Assuming that at least one of these two contrast effects contributes to attraction effects, we thus derived as our main hypothesis that quantitative visual attributes facilitate attraction effects more than qualitative visual attributes do.
Statement of Relevance
Say that as a self-service restaurant owner you offer two beverages—large for $10, small for $3—but prefer to sell the small beverage to promote health or increase profit. Could you, without lowering the small beverage’s price, increase the likelihood that your customers choose it? Researchers discovered more than 40 years ago that you could—by offering an unattractive third beverage that resembles the $3 beverage: say, a $5 small beverage. Researchers believed until recently that such irrelevant choice options—decoys—paradoxically but consistently shift choices (a phenomenon dubbed “the attraction effect”). It has been puzzling, therefore, that in recent studies in which participants looked at images depicting the options instead of numbers describing them (such as liters and dollars), decoys failed to shift choices. One key to the puzzle may be image type: We observed robust attraction effects with images depicting quantitative information such as bottle size but not with images depicting qualitative information such as shape.
This hypothesis would be supported by attraction effects with quantitative visual attributes along with any of the following three data patterns: a smaller attraction effect with qualitative rather than quantitative visual attributes, no attraction effect with qualitative visual attributes, or a reverse attraction effect with qualitative visual attributes.
A reverse attraction effect, or repulsion effect (Frederick et al., 2014), occurs when decoy A decreases the choice share of target A. As an illustration of how a repulsion effect might occur, imagine choosing among one white shirt and two blue shirts—the blue shirts being target A and decoy A. Recognizing their color similarity, decision makers may perceive the blue shirts as two exemplars of one category and assimilate their other attribute values (e.g., button colors), including their valences, toward the typical category values (Medin & Schaffer, 1978; Nosofsky, 1986). This could decrease the target’s valence (a tainting effect; Simonson, 2014) and increase the decoy’s valence.
We regard quantitative visual attributes as a causal facilitator of visual attraction effects. However, because attraction effects may have multiple and compensatory causes, we view the presence of quantitative visual attributes as neither necessary nor sufficient for visual attraction effects.
In the present research, we conducted two types of experiments in which choice options were images and a decoy was asymmetrically dominated by one target. The first type of experiment used quantitative visual attributes (e.g., bottle size), the second type used qualitative visual attributes (e.g., color). We predicted that a decoy should elicit (a) an attraction effect when attributes are quantitative visual and (b) a smaller attraction effect, no attraction effect, or a repulsion effect when attributes are qualitative visual.
Open Practices Statement
Anonymized raw data and code for the experimental stimuli have been made publicly accessible via OSF and can be accessed at https://osf.io/4easw/. We preregistered the sample size, predictions, data-exclusion criteria, and analysis strategy for all experiments except Experiment 4 (see Table 1 for links to each preregistration).
Sample and Recruitment Information for Each Experiment
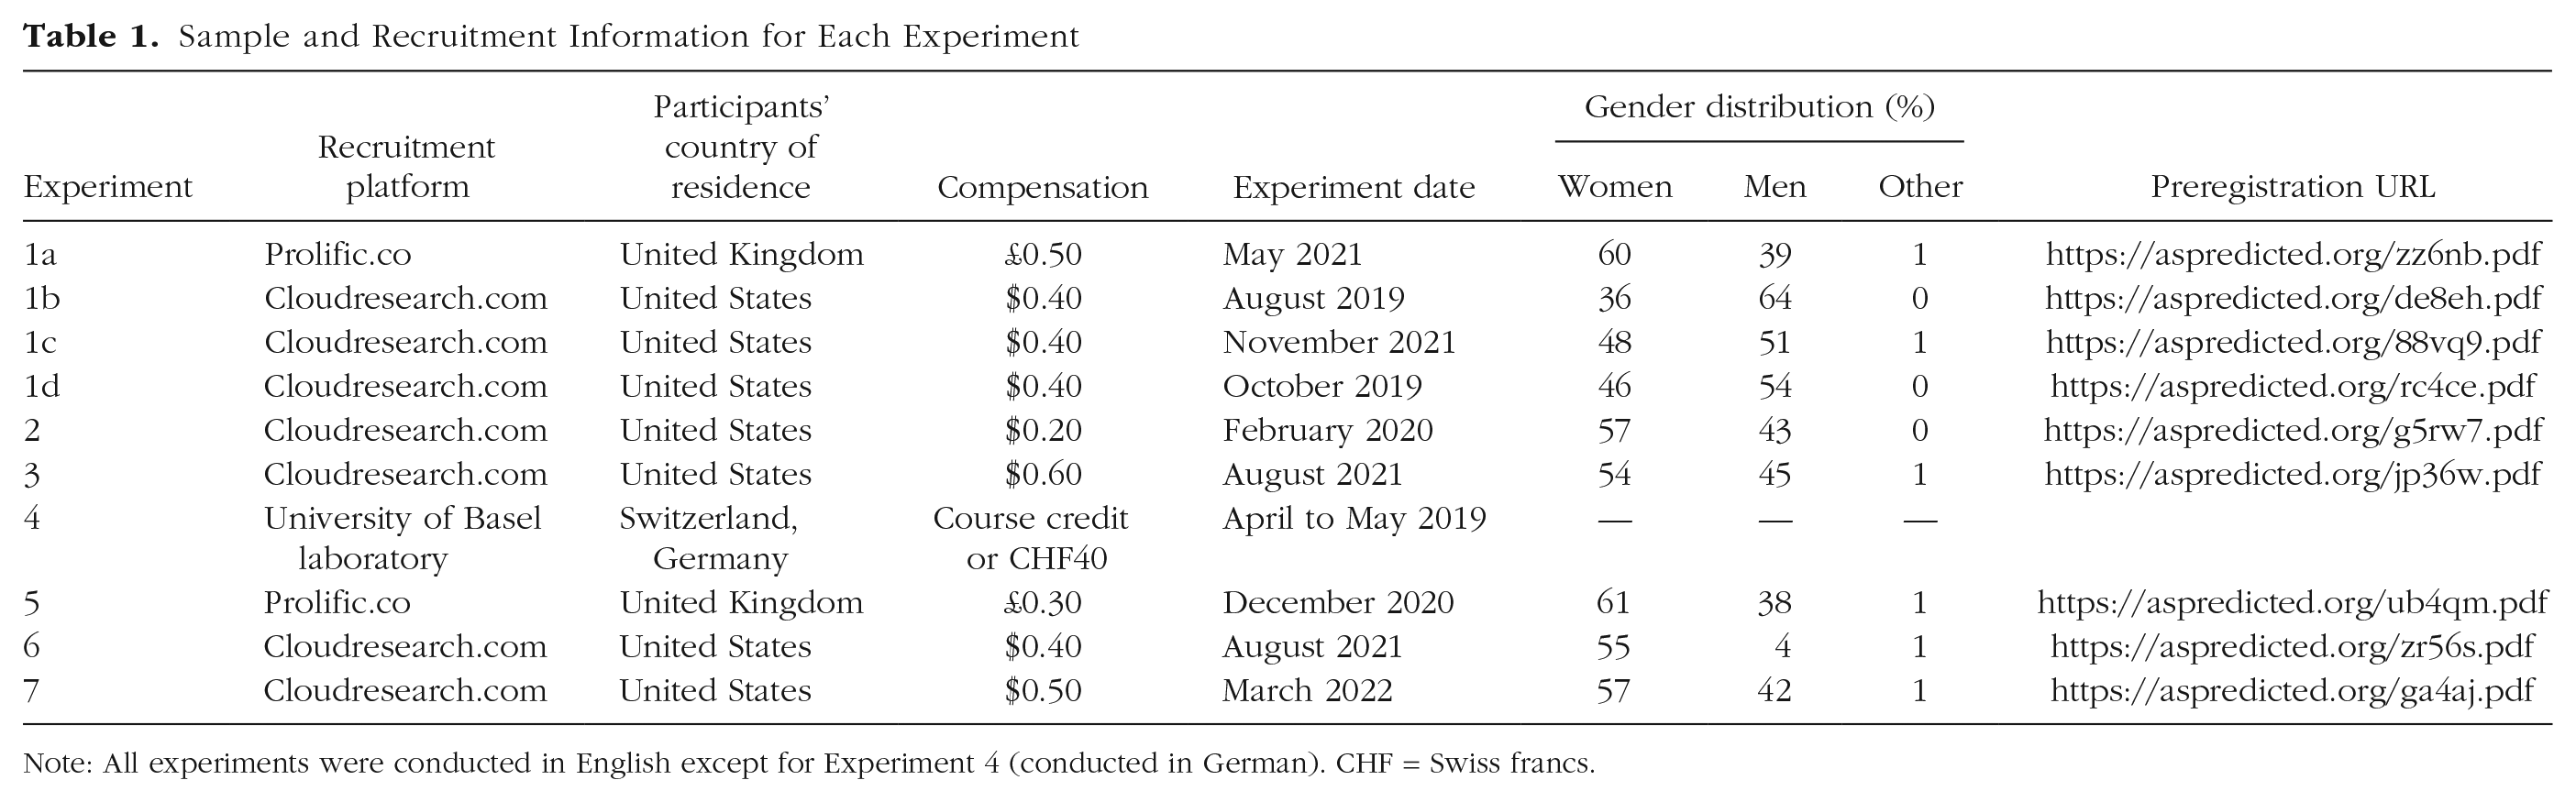
Note: All experiments were conducted in English except for Experiment 4 (conducted in German). CHF = Swiss francs.
General Method
Table 1 reports the preregistration URLs, details about participant samples, and recruitment information for each experiment (Experiment 1e and Experiment 4 are reported in the Supplemental Material available online). This research met the ethical guidelines and legal requirements of the University of Basel and the country in which it is based (Switzerland).
We set our sample sizes by rounding up to a larger number of participants than suggested by power analyses with power of .8 and a significance level (p) of .05. When we had no basis for estimating an effect size for the power analysis (Experiments 1a, 5, and 6) or when a pilot study indicated a small effect size (Experiment 3 and 7), we assumed a small effect (ϕ) of .10 (Cohen, 1988). Our initial experiments with quantitative visual attributes revealed medium and large effect sizes. We thus assumed a medium effect size (ϕ) of .30 for subsequent experiments with quantitative visual attributes (Experiments 1b–1d, 2, and 4, as well as Experiment 1e reported in the Supplemental Material; Cohen, 1988).
We counterbalanced the spatial configuration of choice options (e.g., two targets placed left–right vs. right–left) differently across experiments. Our objective was not to investigate how different configurations might moderate the effect of a decoy (Evans et al., 2021); nevertheless, we analyzed whether our data revealed such moderation. We did not detect any significant moderation except in Experiment 3. However, this did not alter our conclusions. If a test for moderation resulted in a p value less than .15, we report the test below; otherwise, we report it in the Supplemental Material. The Supplemental Material also reports more detailed methods.
Experiment 1a: Olive Oil Bottles With Two and Three Choice Options
Method
We requested 1,500 online participants from Prolific.co for an experiment with a 3 (decoy: small vs. none vs. big) × 2 (configuration: big target left, small target right vs. big target right, small target left) between-subjects design. Participants imagined shopping for artisan olive oil. They saw a photograph featuring either two or three bottles and selected the one they would purchase. Participants read that bigger bottles cost more, but a bottle of a given size (thus a given price) may contain different amounts of olive oil (Fig. 1).
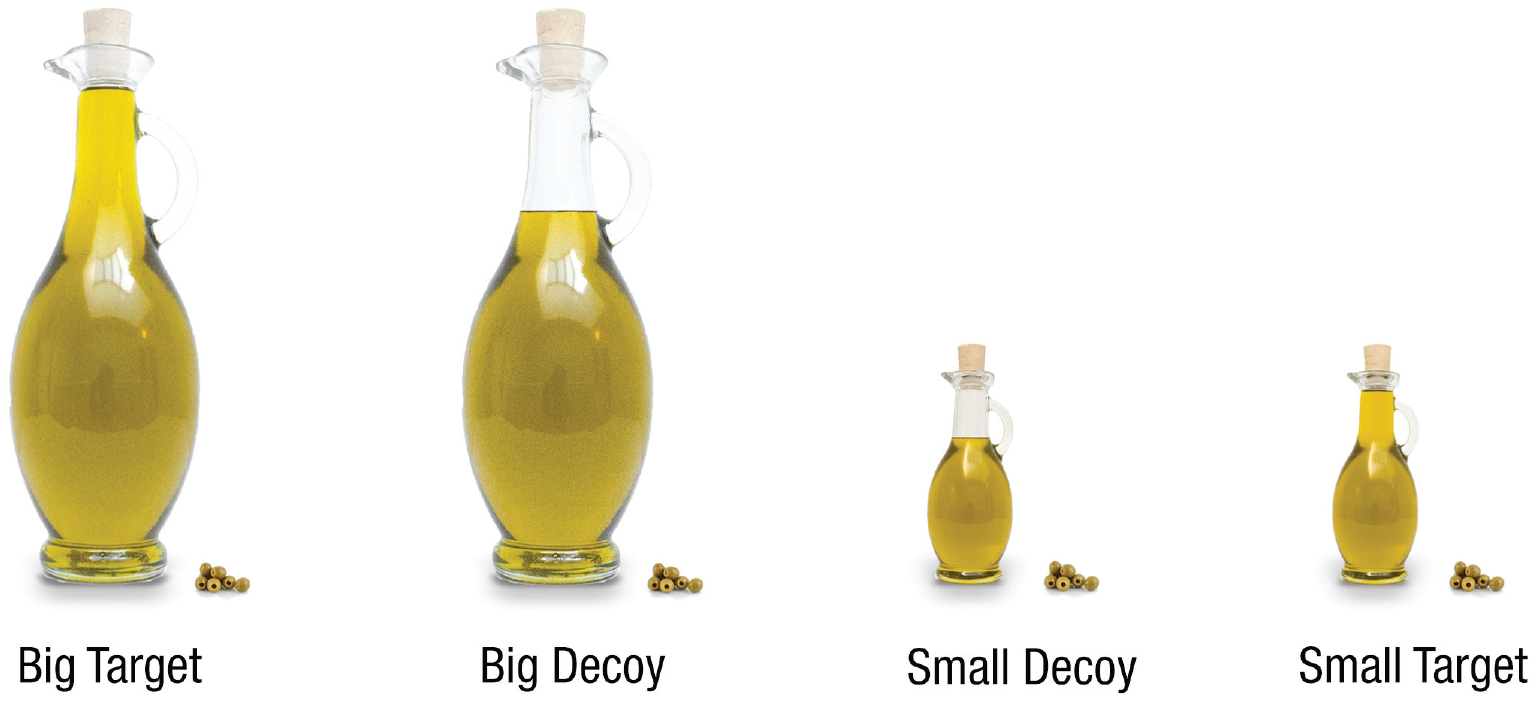
Bottles used in of Experiment 1a. Bottles were placed horizontally without labels. Each participant saw two targets, and some also saw one decoy placed in the middle.
The no-decoy condition showed a binary choice set consisting of two bottles filled to the top: a big target bottle (i.e., much oil at a high price) and a small target bottle (i.e., little oil at a low price). In this condition, we aimed to establish a baseline for how choice shares were divided between these two targets, thus allowing us to infer the effect of adding a decoy bottle on target choices.
We created two decoys. Specifically, a decoy and its corresponding target were the same size (and price), but the decoy contained less oil than its target (Fig. 1). Each decoy condition showed a choice set consisting of one decoy bottle placed between the two target bottles; the small-decoy condition showed a small decoy, and the big-decoy condition showed a big decoy.
We counterbalanced the left versus right placement of the target bottles (i.e., the experimental factor configuration) between subjects. When the decoy was present, it was always placed in the middle of the choice set, equidistant from both target bottles. We used this decoy-in-middle configuration to avoid encouraging participants to compare the decoy with a particular target (Evans et al., 2021; Spektor et al., 2018). However, in Experiment 1c we placed the decoy at the sides to investigate whether the attraction effect depends on placing the decoy in the middle.
Results
Among the 1,493 participants who completed the experiment (60% women; age: M = 37.59 years, SD = 14.16), we excluded 13 for failing the attention check and 24 for selecting a decoy option.
Type of decoy offered (i.e., small, none, big) influenced participants’ choices, χ2(2, N = 1,456) = 243.31, p < .001; ϕ = .41, 95% confidence interval (CI) = [.36, .45]. As predicted, both decoy bottles produced attraction effects (Table 2). Specifically, compared with offering no decoy, offering the big decoy increased the choice share of the big target from 42.5% to 69.9% and decreased the choice share of the small target from 57.5% to 30.1%, χ2(1, N = 973) = 73.98, p < .001; ϕ = .28, 95% CI = [.21, .34]. Likewise, compared with offering no decoy, offering the small decoy increased the choice share of the small target from 57.5% to 80.1% and decreased the choice share of the big target from 42.5% to 19.9%, χ2(1, N = 984) = 58.51, p < .001; ϕ = .24, 95% CI = [.18, .30].
Choice Shares in Experiment 1a
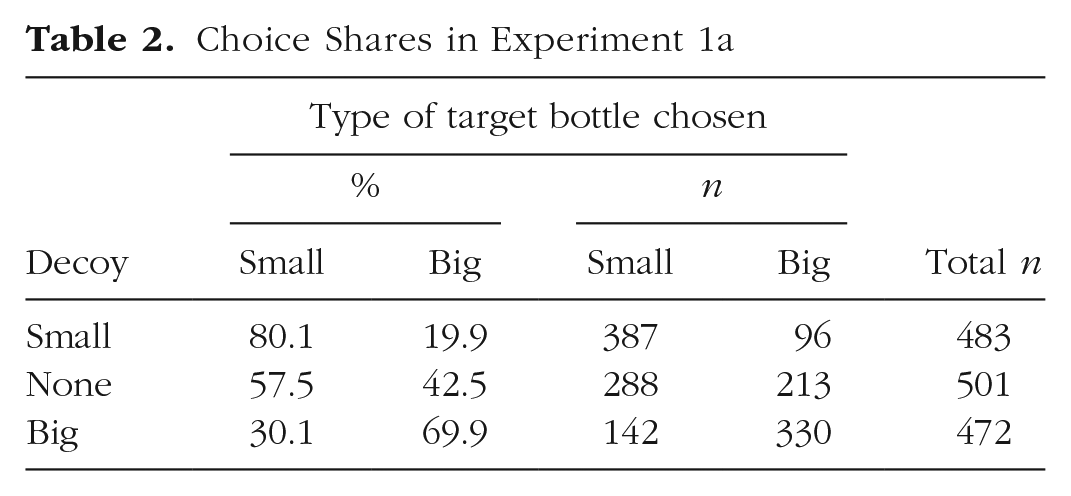
These results established an attraction effect with quantitative visual stimuli. Adding the big decoy to the binary choice set increased the choice share of the big target by 27.4%, whereas adding the small decoy to the binary choice set increased the choice share of the small target by 22.6%.
Experiment 1b: Olive Oil Bottles With Price Tags
Many previous experiments that failed to find visual attraction effects combined one visual attribute with one numeric attribute. To probe whether the difficulty of trading off attributes from two different processing modes (numeric, depictive; Pearson & Kosslyn, 2015) might eliminate the visual attraction effect, we added numeric price tags to each bottle in Experiment 1b. The attraction effect remained (p = .003; ϕ = .30, 95% CI = [.11, .50]; see the Supplemental Material).
Experiment 1c: Olive Oil Bottles With Decoy Placed at the Sides
In Experiment 1c, we placed the decoy at the sides and its corresponding target in the middle to examine whether the decoy-in-middle configuration used in Experiments 1a and 1b is required to obtain attraction effects. The attraction effect remained (p < .001; ϕ = .50, 95% CI = [.44, .56]; see the Supplemental Material). The three-way Configuration × Decoy × Choice interaction in a log linear analysis was nonsignificant, χ2(1, N = 770) = 2.60, p = .11. Thus, the Decoy × Choice interaction (i.e., the attraction effect) did not significantly interact with the options’ configuration.
Experiment 1d: Olive Oil Bottles With Vertically Separated Decoy
It has been suggested that attraction effects are akin to visual size illusions such as the Ebbinghaus illusion (Simonson, 2014), which involve low-level perceptual mechanisms (Ben-Shalom & Ganel, 2012; Choplin & Medin, 1999). Our effect may then require that both target and decoy be visually juxtaposed, forming a perceptual unit. Thus, we aligned bottles vertically, with the decoy and its corresponding target separated by the other target (Fig. 2), undermining the perception of the target and its decoy as a unit. The attraction effect remained (p < .001; ϕ = .35, 95% CI = [.25, .44]; see the Supplemental Material).

Bottles used in Experiment 1d’s vertical-alignment condition. The decoy at the bottom was separated from its target at the top. Participants saw no labels.
Contrary to our result, previous findings have shown that a similar alignment manipulation (with horizontally displayed options) reverses the attraction effect in size judgments (i.e., when participants’ task is to select the object they judge to be the largest among a set of visually depicted objects; Evans et al., 2021). This suggests fundamental differences between perceptual attraction effects and preferential (visual) attraction effects.
Experiments 2, 3, and 4
The visual preferential attraction effect held when we added price tags to bottles, when we visually separated the decoy from its target, and when we presented the choice options in different orders. It was also important to test our hypothesis across different quantitative visual attributes. The olive oil bottles confound area with height. To determine whether each of these quantitative visual attributes generates attraction effects, we examined length and area in Experiments 2 and 3, respectively; Experiment 4 examined yet another quantitative visual attribute: image resolution.
Experiment 2: seating chart
Method
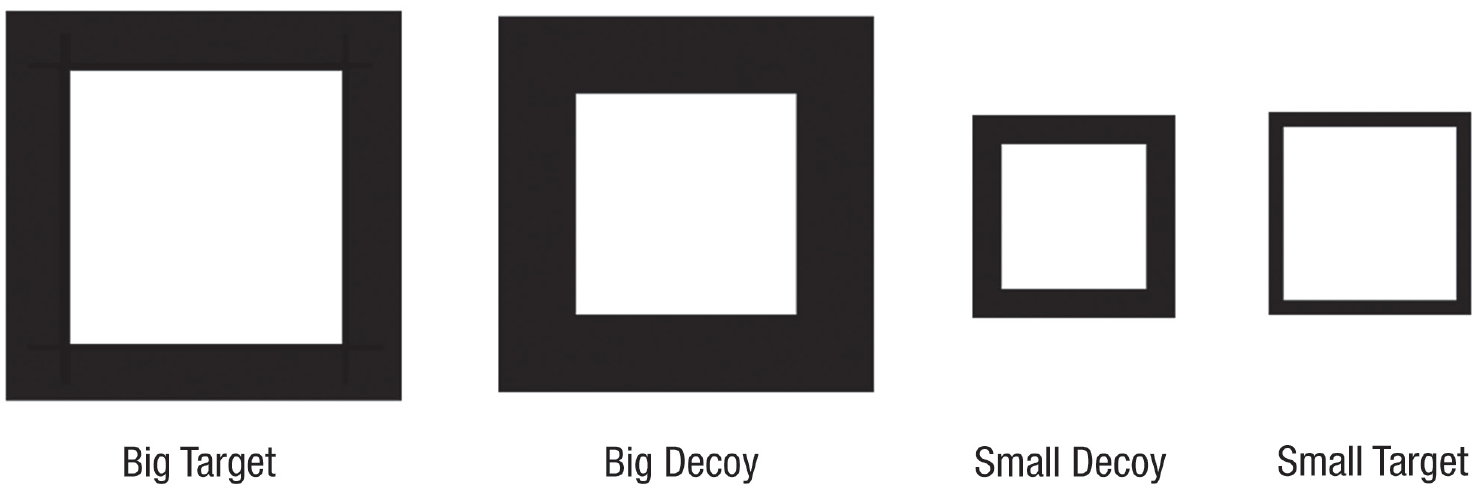
We requested 200 participants on Cloudresearch.com. Here and in the remaining experiments with quantitative visual attributes, we dropped the no-decoy condition and compared choice shares among the two three-option conditions, as is now common (Trueblood et al., 2014). In a between-subjects, single-factor design—decoy (left vs. right)—participants imagined purchasing a ticket to watch a debate in an auditorium. A seating chart displayed the positions of the two debaters on a stage and three available seats to choose from: two targets and one decoy. The decoys on the left and right, respectively, served the targets on the left and right (Fig. 3). Participants selected their preferred seat after reading that their objective was to sit as close as possible to both debaters and that the available seats cost the same.
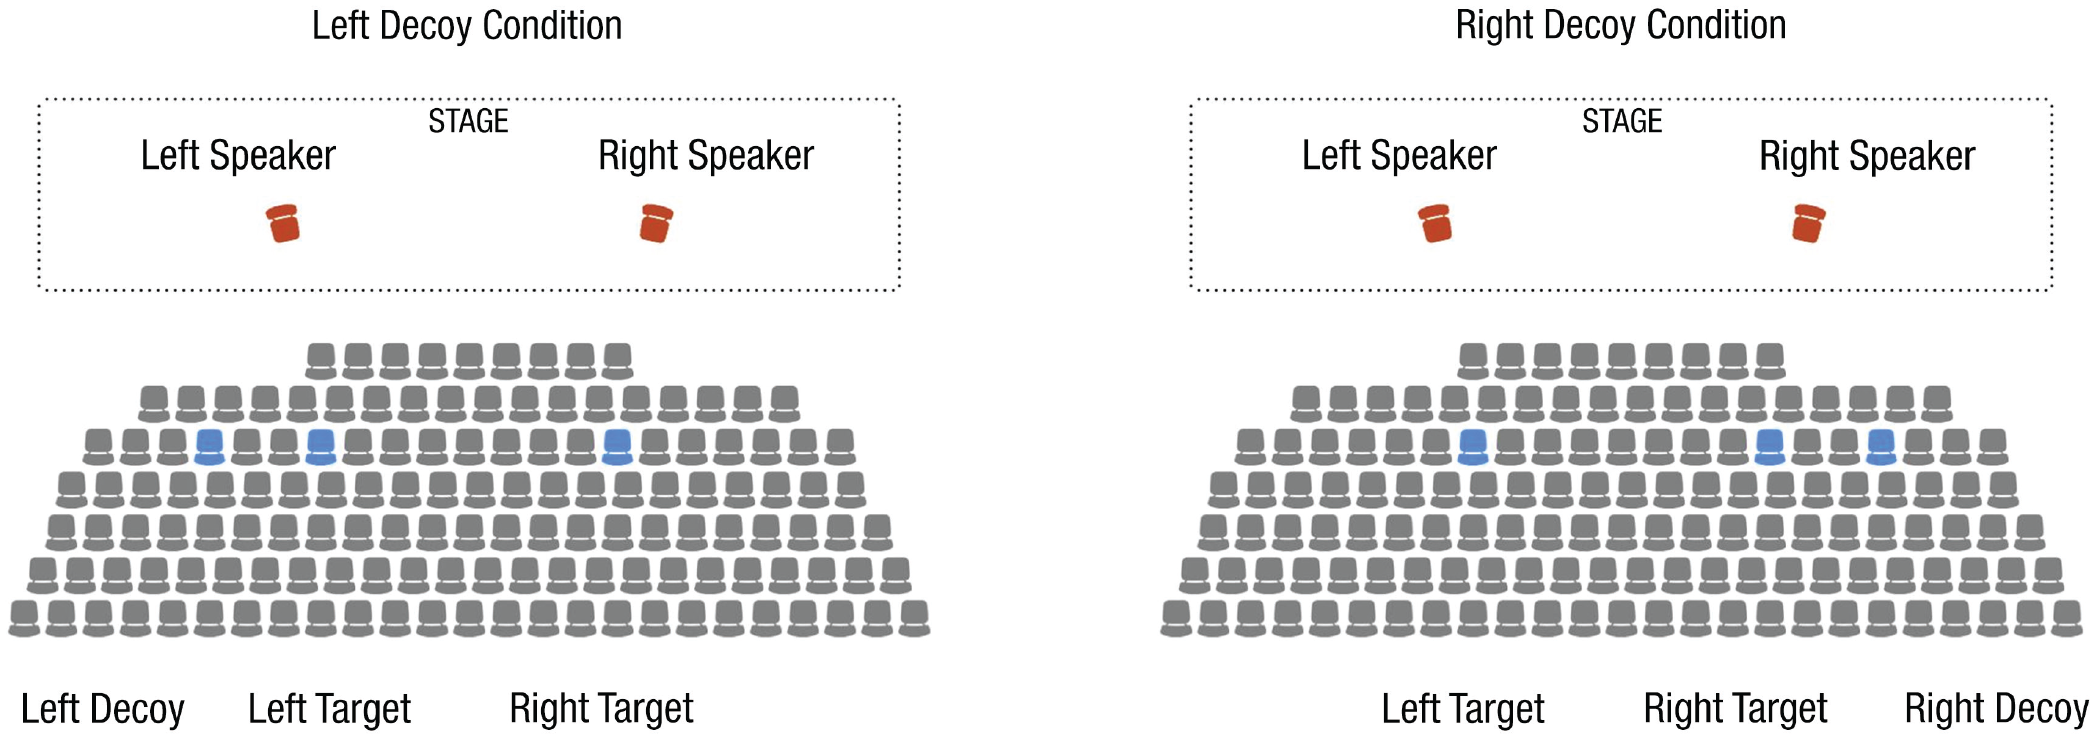
Seating charts used in Experiment 2. Participants saw no text except the label “STAGE.”
The target seats were placed to create a trade-off between distances to each speaker: The left target was close to the left speaker but far from the right speaker, and vice versa for the right target. Each decoy was dominated by the available seat closest to it. For instance, the left decoy was dominated by the left target because it was farther away from both speakers than the left target was.
Results
Two hundred participants completed the experiment (57% women; age: M = 37.10 years, SD = 11.85). We excluded four participants for failing the attention check, 12 for selecting a decoy seat, and two for correctly guessing the purpose of the experiment. 1
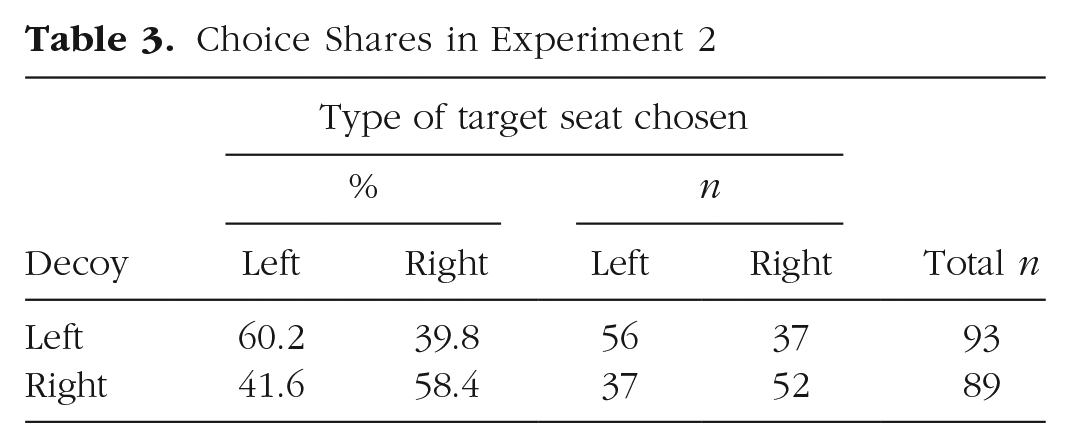
As expected, we observed an attraction effect (Table 3). Shifting the decoy seat from left to right increased the choice share of the right target seat from 39.8% to 58.4% and decreased the choice share of the left target seat from 60.2% to 41.6%, χ2(1, N = 182) = 6.33, p = .01; ϕ = .19, 95% CI = [.05, .33].
Choice Shares in Experiment 2
Experiment 3: game of chance
Method
We requested 1,600 participants on Cloudresearch.com. Participants read about a game of chance in which a machine shoots a cue ball at high speed onto a pool table with no pockets. The pool table’s surface is marked by black and white areas (Fig. 4). The player wins only if the ball comes to rest on the white area; therefore, the proportion of white area to total area determines the probability of winning. The amount of money won is proportional to the size of the white area. We asked participants to imagine playing the game and picking one of three tables. One table was a decoy, always placed in the middle. It was similar in size to its corresponding target but had a smaller white area (Fig. 4). Thus, it offered a smaller chance of winning and a smaller reward than did its target. Numeric winning probabilities and winners’ rewards were as follows: The big target represented a 48% probability of winning $50, the big decoy represented a 34% probability of winning $32.50, the small decoy represented a 51% probability of winning $14, and the small target represented a 73% probability of winning $20. However, participants were shown the images of the tables without these numbers. The experiment had a 2 (decoy: small vs. big) × 2 (configuration: big target left, small target right vs. small target left, big target right) between-subjects design.
Pool tables used in Experiment 3. Each participant saw both target tables and one of the two decoy tables. Participants saw no labels.
Results
The experiment was completed by 1,604 participants (54.2% women, age: M = 41.21 years, SD = 13.47). We excluded 35 participants for failing the attention check and 93 for selecting a decoy.
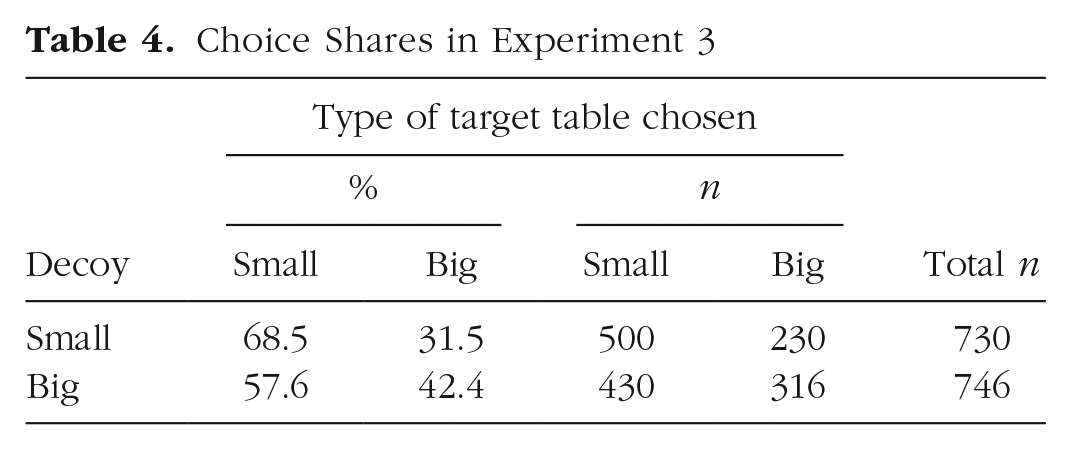
As expected, we observed an attraction effect (Table 4). Compared with offering the small decoy table, offering the big decoy table increased the choice share of the big target table from 31.5% to 42.4% and decreased the choice share of the small target table from 68.5% to 57.6%, χ2(1, N = 1,476) = 18.64, p < .001; ϕ = .11, 95% CI = [.06, .16].
Choice Shares in Experiment 3
The three-way Configuration × Decoy × Choice interaction in a log linear analysis was significant, χ2(1, N = 1,476) = 4.62, p = .03. Thus, the Decoy × Choice interaction (i.e., the attraction effect) interacted significantly with the big and small targets being placed on either the right or the left. Choice shares in both these conditions were in the direction of an attraction effect; however, the effect was statistically significant when the small target was on the left and the big target was on the right, χ2(1, N = 726) = 20.84, p < .001; ϕ = .17, 95% CI = [.10, .25], but not when the big target was on the left and the small target was on the right, χ2(1, N = 750) = 2.38, p = .12; ϕ = .06, 95% CI = [−.01, .13]. Of all the experiments reported in this article, Experiment 3 was the only one that generated a significant three-way Configuration × Decoy × Choice interaction. We therefore concluded that the attraction effect generally emerged irrespective of which configuration was used.
Experiment 4: photo prints
Attraction effects with numeric stimuli have a unique built-in feature: All attributes are mapped to numbers, which may facilitate mapping them to a single mental scale. The previous experiments mimicked this feature by mapping two choice attributes (e.g., prize money, probability of winning) to only one type of visual attribute (e.g., area). To examine whether the visual attraction effect is limited to choice options that differ on only one type of visual attribute, we varied choice objects on two different quantitative visual attributes in Experiment 4: size of photographs and their resolution.
Method
We recruited 237 participants from a university participant pool for an experiment in our laboratory. Participants’ main task was to select their preferred instant photo printer on the basis of sample prints. To make this selection, they viewed three different prints of the same photograph on photographic paper, representing each printer’s output. The prints differed in size and resolution: The small target print had high resolution (6.8 cm × 5.1 cm, 300 dots per inch [DPI]), and the big target print had low resolution (12 cm × 9 cm, 150 DPI). We constructed two decoy prints equal in size to their respective targets, creating high similarity to the target but deteriorating their resolutions below that of their respective targets (small decoy print: 120 DPI, big decoy print: 80 DPI). The big decoy was dominated only by the big target (i.e., asymmetric dominance). Although the small decoy was dominated by both targets, given its size, it was more similar to the small target than to the big target. The experiment had a 2 (decoy: small vs. big) × 2 (configuration: big target left, small target right vs. big target right, small target left) between-subjects design. The decoy was always placed next to and to the left of its target (see the Supplemental Material), resulting in two configurations with the decoy in the middle and two other configurations with the decoy on the left side. This was a compromise to counterbalance potential effects of decoy and target placement. Unlike in our other experiments, participants had the option of not choosing any of the printers.
Results
We excluded one participant for selecting a decoy, three for not choosing any printer, and one for correctly guessing the purpose of the experiment. 2
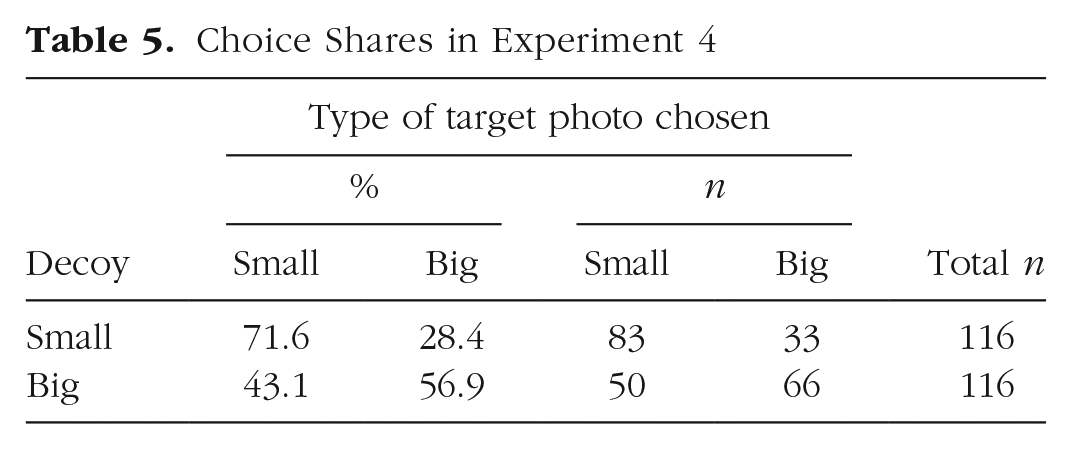
As expected, we observed an attraction effect (Table 5). Compared with offering the small decoy print, offering the big decoy print increased the choice share of the big target from 28.4% to 56.9% and decreased the choice share of the small target from 71.6% to 43.1%, χ2(1, N = 232) = 19.19, p < .001; ϕ = .29, 95% CI = [.16, .41].
Choice Shares in Experiment 4
Experiments 5 to 7: Qualitative Visual Attributes
The remaining experiments used qualitative visual attributes: line pattern and clothing color (Experiment 5), typeface and arrangement of letters in a logo (Experiment 6), and color and shape of signage (Experiment 7). We expected weakened or reversed attraction effects with qualitative visual attributes. In Experiments 5 to 7, we showed a decoy option for only one of the two target options (as is common, we refer to the other target option as the competitor). In the typical attraction-effect paradigm, target and competitor differ on two attributes, although sometimes on only one attribute (Frederick et al., 2014). Across experiments, we implemented both versions.
Experiment 5: scarves
Method
We requested 1,500 online participants from Prolific.co for an experiment with a 2 (decoy: absent vs. present) × 2 (configuration: target left, competitor right vs. competitor left, target right) between-subjects design. Participants imagined shopping for a scarf. In the main choice task, they saw images of two or three scarf fabrics (Fig. 5) and selected the one they preferred. Participants saw either only the target and competitor fabrics or all three fabrics. Thus, the research design contained a two-option core set that established a baseline for the choice shares of the target and the competitor.
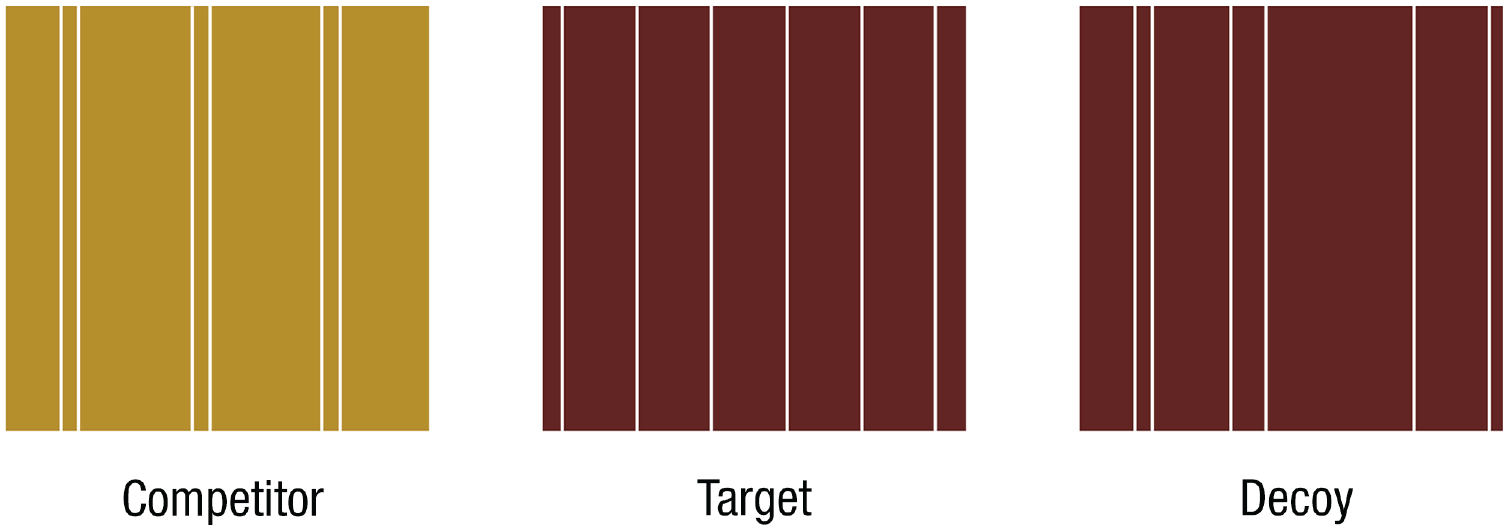
Scarf fabrics used in Experiment 5. Participants did not see the labels below the fabrics.
Recall that we aimed to test whether qualitative visual attributes weaken attraction effects. However, we also expected attraction effects to weaken when some participants failed to perceive the dominance relationship between the target and the decoy (Huber et al., 2014). We thus aimed to exclude such participants because only then could we attribute any weakened attraction effect to qualitative visual attributes. To identify these participants, we introduced a second choice task after the main choice task. In this target-versus-decoy choice task, we showed all participants only the target and the decoy and asked them to select their preferred option or indicate that they could not decide between these two options.
Because we predicted a weakened or a reversed attraction effect, as a conservative testing strategy, we chose configurations of choice options that might facilitate target–decoy comparisons and thus attraction effects (Evans et al., 2021; Spektor et al., 2018). Specifically, we kept the decoy next to the target and separated from the competitor. This resulted in two possible configurations that were counterbalanced between subjects: (a) decoy, target, competitor and (b) competitor, target, decoy. In the no-decoy condition, we simply dropped the decoy, which also resulted in two configurations that we counterbalanced.
As reported below, in Experiment 7, which involved qualitative visual attributes, we experimentally varied a target-in-middle configuration and a decoy-in-middle configuration. Note that across experiments with quantitative visual attributes, we also systematically varied both configurations, with Experiment 1c using the target-in-middle configuration and Experiments 1a, 1b, and 3 using a decoy-in-middle configuration.
Results
The experiment was completed by 1,496 participants (61% women; age: M = 36.92 years, SD = 14.32). We excluded those participants who failed the attention check (n = 47), preferred the decoy in the target-versus-decoy choice task (n = 577), or indicated indifference in that task (n = 100). Of the remaining participants, we excluded four (1% of those shown a decoy) who chose the decoy option in the main choice task.
Consistent with our prediction for qualitative visual stimuli, the attraction effect disappeared and even reversed (Table 6). Compared with offering no decoy fabric, offering a decoy fabric decreased the choice share of the target fabric from 64.8% to 55.2% and increased the choice share of the competitor fabric from 35.2% to 44.8%, χ2(1, N = 768) = 7.26, p = .007; ϕ = .10, 95% CI = [.03, .17].
Choice Shares in Experiment 5
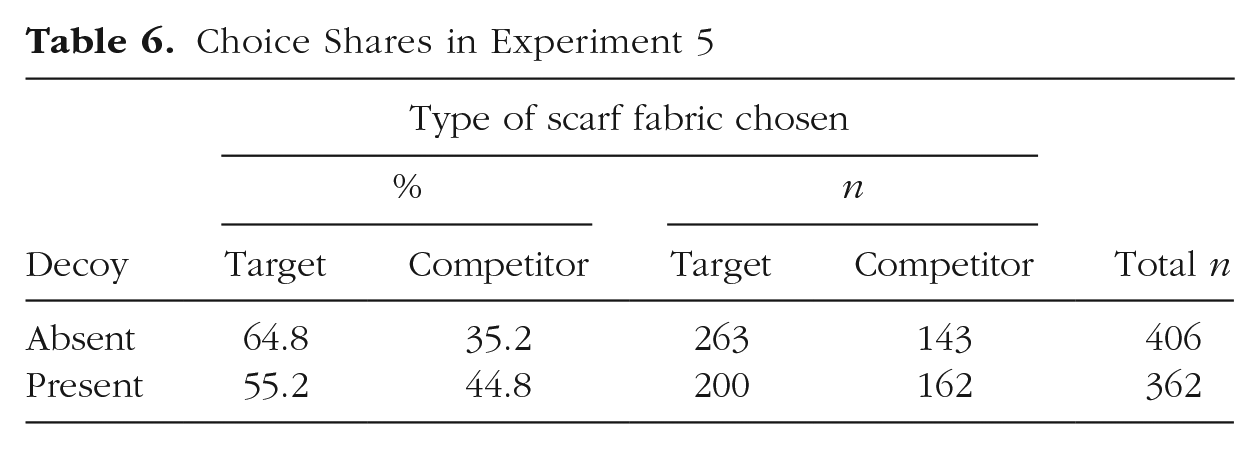
The three-way Configuration × Decoy × Choice interaction in a log linear analysis was nonsignificant, χ2(1, N = 768) = 2.85, p = .09. Thus, the Decoy × Choice interaction (i.e., the repulsion effect) did not significantly interact with the configuration of choice options.
Discussion
Showing qualitative visual stimuli resulted in a choice pattern opposite to an attraction effect. That is, offering a third option similar to a target reduced the choice share of the target. This could have happened in one of two ways (Huber et al., 2014). First, a repulsion effect may occur if decision makers shift choice share from the target to the competitor while viewing the third option as a decoy (i.e., an inferior option). Second, a similarity effect (Tversky, 1972) may occur if decision makers shift choice share from the target to the third option while viewing it as a viable alternative to the target.
In this research, we were interested in the effect of decoys; consequently, we used the target-versus-decoy choice task to retain only those participants who viewed the third option as a decoy. If this procedure worked as intended, our results would show a repulsion effect. If, on the other hand, it retained some participants who viewed the third option as a viable alternative to the target, which is conceivable, a similarity effect might underlie our results. To instill confidence that our participants viewed the third option as a decoy, we designed Experiments 6 and 7 to yield very low decoy choices in the main task.
Experiment 6: logos
Method
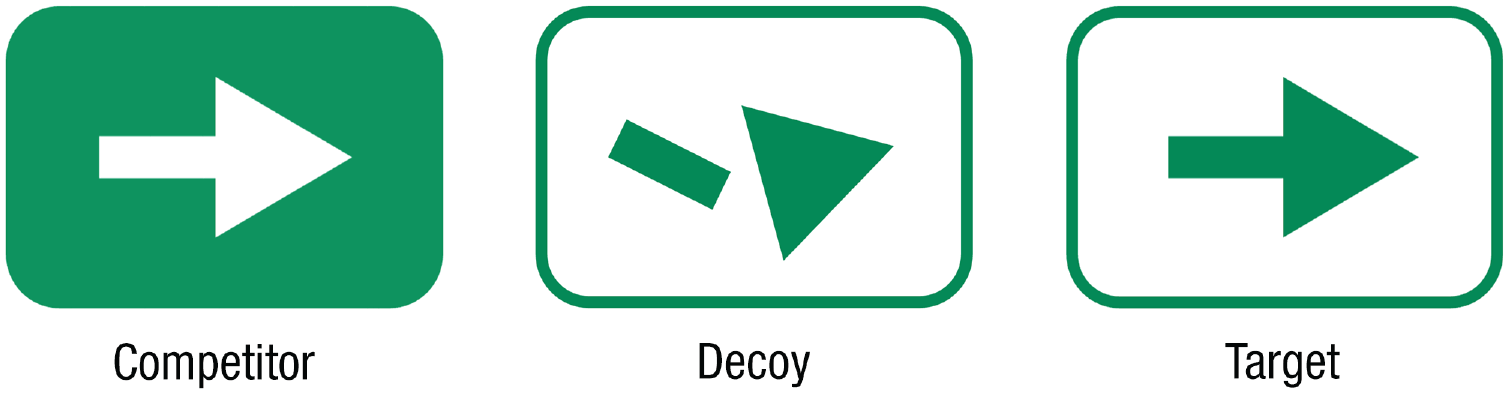
We requested 2,000 participants on Cloudresearch.com and asked them to imagine choosing a logo for their start-up business named “United.” We created three logos that differed on two attributes: typeface (Futura vs. Cheltenham) and letter spacing (even vs. uneven). As shown in the far-right logo in Figure 6, uneven letter spacing introduces a design flaw (Graves, 1951). The target and competitor logos featured even letter spacing and differed on only one attribute: typeface (Fig. 6, left and middle). The decoy logo had the same Futura typeface as the target logo but was inferior because of its uneven letter spacing (Fig. 6, right).

Logos used in Experiment 6. Participants did not see the labels below the logos. The decoy and the target were adapted from Graves’s (1951) taste test. The decoy differed from the target in that it had uneven letter spacing—a design flaw (Graves, 1951). Target and competitor typefaces differed but both had even letter spacing.
As before, a binary choice condition showed target and competitor, whereas a three-option condition showed target, decoy, and competitor. We counterbalanced logo configuration as in Experiment 5, with the target in the middle. The experiment had a 2 (decoy: absent vs. present) × 2 (configuration: target left, competitor right vs. competitor left, target right) between-subjects design. After the main choice task, all participants performed a target-versus-decoy choice task as in Experiment 5.
Results
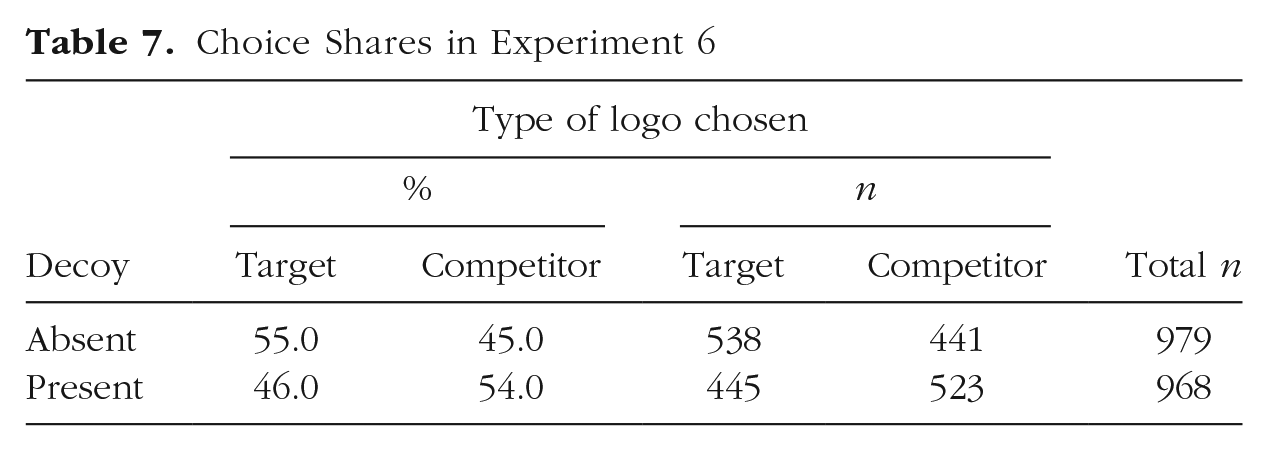
The experiment was completed by 2,005 participants (55% women; age: M = 39.95 years, SD = 13.05). We excluded 43 participants for failing the attention check and 15 (1.5% of those shown a decoy) for selecting the decoy option in the main choice task. The low percentage of decoy choices indicates that participants indeed regarded the decoy as inferior to the target. The reason is that similar percentages of participants select the decoy in asymmetric dominance studies with numeric stimuli in which the decoy is unambiguously inferior to the target (Huber et al., 1982). Of note, we observed this result without having to exclude participants on the basis of the target-versus-decoy choice task. Excluding participants on the basis of the target-versus-decoy choice task led to results similar to those reported below (see the Supplemental Material).
Results were consistent with our prediction for qualitative visual stimuli, showing that the attraction effect reversed (Table 7) as in Experiment 5. Specifically, compared with offering no decoy logo, offering a decoy logo decreased the choice share of the target logo from 55.0% to 46.0% and increased the choice share of the competitor logo from 45.0% to 54.0%, χ2(1, N = 1,947) = 15.71, p < .001; ϕ = .09, 95% CI = [.05, .13]. Because the decoy was inferior to the target, this result is inconsistent with a similarity effect but consistent with a repulsion effect.
Choice Shares in Experiment 6
Experiment 7: arrow signs
Experiment 7 had three objectives: implementing a clearly inferior decoy with different stimuli, manipulating the choice option placed in the middle (target vs. decoy), and using a disadvantaged target (i.e., one that participants chose less often than the competitor). Disadvantaged targets favor attraction effects (Evangelidis et al., 2018). Thus, a repulsion effect would be particularly supportive of our hypothesis.
Method
We requested 2,500 participants on Cloudresearch.com and asked them to imagine choosing an arrow sign directing visitors to their front gate. We created three signs that differed on two qualitative visual attributes: shape and color scheme. The target and competitor signs featured regular arrows and differed only in terms of color scheme (Fig. 7). The decoy sign had a similar color scheme as the target sign but was inferior to it because it featured a distorted arrow (Fig. 7). We did not follow this main choice task with a target-versus-decoy choice task, contrary to Experiments 5 and 6.
Arrow signs used in Experiment 7. Participants did not see the labels below the signs.
As before, a binary choice condition showed target and competitor, whereas a three-option condition additionally showed a decoy. Recall that Experiments 5 and 6 used only a target-in-middle configuration, which implied that the decoy was always located on a side. In the current experiment, we varied two configurations between subjects: (a) target in middle and (b) decoy in middle. Our objective was to determine whether a repulsion effect would emerge with each configuration. Specifically, when we showed a decoy, we placed it either in the middle or, when its target was in the middle, at the sides. Also as before, we counterbalanced between subjects the locations of target and competitor on the left versus right of each other. In sum, the experiment employed a partially crossed between-subjects design, orthogonally crossing target–competitor configuration (target left, competitor right vs. competitor left, target right) and decoy (present vs. absent) and nesting decoy location (sides vs. middle) within the decoy-present condition.
Results
The experiment was completed by 2,504 participants (57% women, age: M = 40.87 years, SD = 12.97). We excluded 68 participants for failing the attention check and two (0.2% of those shown a decoy) for selecting the decoy option. The low number of decoy choices indicates that, as in Experiment 6, participants judged the decoy as inferior to the target.
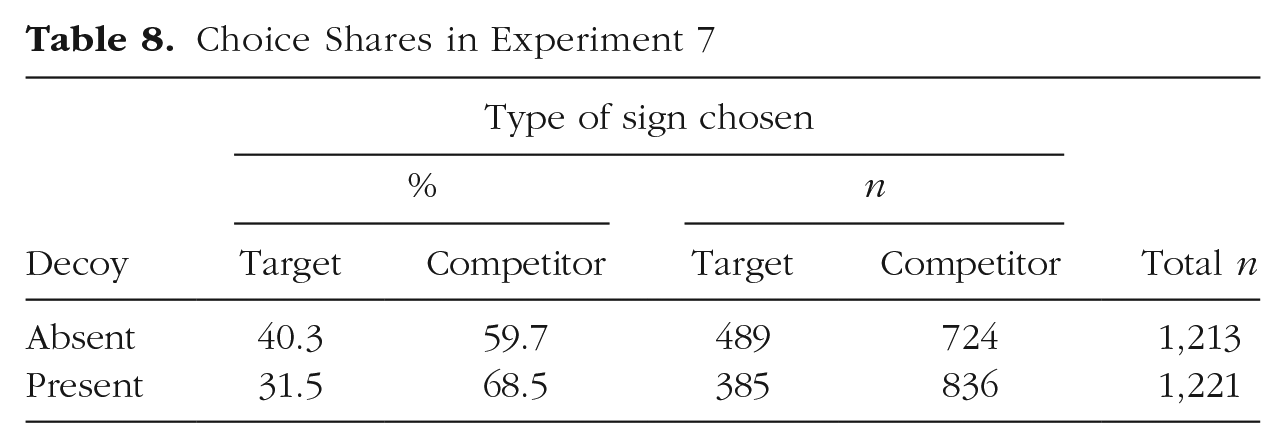
Consistent with our prediction for qualitative visual stimuli, results revealed that there was no attraction effect; instead, there was again a repulsion effect (Table 8). Compared with offering no decoy, offering a decoy decreased the choice share of the target from 40.3% to 31.5% and increased the choice share of the competitor from 59.7% to 68.5%, χ2(1, N = 2,434) = 20.39, p < .001; ϕ = .09, 95% CI = [.05, .13]. This effect held regardless of the decoy location. That is, compared with offering no decoy, offering a decoy significantly decreased the choice share of the target whether it was placed on the left or right side of the choice set, χ2(1, N = 1,827) = 14.79, p < .001; ϕ = .09, 95% CI = [.04, .14], or in the middle of the choice set, χ2(1, N = 1,820) = 12.04, p < .001; ϕ = .08, 95% CI = [.04, .13]. Thus, the repulsion effect was not contingent on a particular placement of the decoy.
Choice Shares in Experiment 7
In contrast to Experiments 5 and 6, in this experiment, we planned to implement a disadvantaged target. This plan succeeded, as indicated by fewer participants choosing the target (40.3%) than the competitor (59.7%) in the no-decoy condition, χ2(1, N = 1,213) = 45.53, p < .001. Attraction effects have been observed more frequently when the target is disadvantaged (Evangelidis et al., 2018). Therefore, this experiment offered a very conservative test of whether qualitative visual attributes weakened the attraction effect, given that any weakening influence of these attributes would have to counteract an attraction effect strengthened by a disadvantaged target. Finally, in this experiment, we observed a repulsion effect with yet a different qualitative visual stimulus.
General Discussion
We investigated preferential decisions among images of choice objects. Attraction effects emerged for quantitative visual attributes but reversed for qualitative visual attributes. Until now, studies have not shown whether quantitative versus qualitative visual attribute type is a moderator of the attraction effect.
Our observations of robust attraction effects with quantitative visual attributes show that preferential attraction effects principally exist with visual stimuli. This is important because the existence of preferential visual attraction effects has been subject to debate (Frederick et al., 2014; Huber et al., 2014; Król & Król, 2019; Simonson, 2014; Trendl et al., 2021; Yang & Lynn, 2014). We contribute to this debate by showing that the visual versus numeric distinction is not a conceptual boundary condition for the attraction effect.
The disappearance of the attraction effect with qualitative visual stimuli is consistent with our account. Furthermore, our data seem inconsistent with three plausible alternative accounts. First, attraction effects can reverse when the target is advantaged (Evangelidis et al., 2018). However, Experiment 7 documented a repulsion effect with a disadvantaged target. Second, particular presentation orders may reverse preferential attraction effects, akin to reversals in perceptual attraction effects (Evans et al., 2021; Spektor et al., 2018). We can rule this out because, across our experiments, each type of configuration produced both attraction and repulsion effects in a theory-consistent manner. Third, attraction effects can disappear when participants view the decoy as competing with the target rather than as inferior to it (Huber et al., 2014). In Experiments 6 and 7, very few participants chose the decoy—a strong indication of decoy inferiority.
We observed the attraction effect over a range of different visual stimuli that involved different types of quantitative attributes, increasing the likelihood that these results will generalize to other visual stimuli with quantitative visual attributes. Although our focus was on visual attributes, our theorizing may apply to nonvisual perceptual attributes such as loudness and temperature (quantitative perceptual attributes perceived, respectively, by hearing and touch) and taste qualities of food (e.g., sweet vs. sour, which are qualitative perceptual attributes). Testing our hypothesis with nonvisual perceptual stimuli remains a task for future research. Also, we mostly recruited European and American residents from online recruitment platforms, and they participated online. Future research may test whether our results will generalize to other respondent populations and settings, such as field settings.
Preferential repulsion effects are as interesting as attraction effects (Roe et al., 2001); yet they have been observed only rarely and, to the best of our knowledge, only with quantitative visual attributes (Król & Król, 2019; Liao et al., 2020; Spektor et al., 2018). Observing preferential repulsion effects with qualitative visual attributes thus opens new avenues for future research. Here, we have only speculated about the possible mechanism, suggesting that decoy and target may be perceived as two instances of one category, resulting in assimilating their attributes toward the category norm (Medin & Schaffer, 1978; Nosofsky, 1986).
Supplemental Material
sj-docx-2-pss-10.1177_09567976221134476 – Supplemental material for Preferential Attraction Effects With Visual Stimuli: The Role of Quantitative Versus Qualitative Visual Attributes
Supplemental material, sj-docx-2-pss-10.1177_09567976221134476 for Preferential Attraction Effects With Visual Stimuli: The Role of Quantitative Versus Qualitative Visual Attributes by C. Miguel Brendl, Özgün Atasoy and Coralie Samson in Psychological Science
Supplemental Material
sj-pdf-1-pss-10.1177_09567976221134476 – Supplemental material for Preferential Attraction Effects With Visual Stimuli: The Role of Quantitative Versus Qualitative Visual Attributes
Supplemental material, sj-pdf-1-pss-10.1177_09567976221134476 for Preferential Attraction Effects With Visual Stimuli: The Role of Quantitative Versus Qualitative Visual Attributes by C. Miguel Brendl, Özgün Atasoy and Coralie Samson in Psychological Science
Footnotes
Acknowledgements
We thank Jerome Schwarz for his research assistance and acknowledge that Experiment 3 is based on his master’s thesis, which was prepared under the first author’s supervision.
Transparency
Action Editor: Angela Lukowski
Editor: Patricia J. Bauer
Author Contributions
Notes
References
Supplementary Material
Please find the following supplemental material available below.
For Open Access articles published under a Creative Commons License, all supplemental material carries the same license as the article it is associated with.
For non-Open Access articles published, all supplemental material carries a non-exclusive license, and permission requests for re-use of supplemental material or any part of supplemental material shall be sent directly to the copyright owner as specified in the copyright notice associated with the article.