
Abstract
Visual object recognition is not performed in isolation but depends on prior knowledge and context. Here, we found that auditory context plays a critical role in visual object perception. Using a psychophysical task in which naturalistic sounds were paired with noisy visual inputs, we demonstrated across two experiments (young adults; ns = 18–40 in Experiments 1 and 2, respectively) that the representations of ambiguous visual objects were shifted toward the visual features of an object that were related to the incidental sound. In a series of control experiments, we found that these effects were not driven by decision or response biases (ns = 40–85) nor were they due to top-down expectations (n = 40). Instead, these effects were driven by the continuous integration of audiovisual inputs during perception itself. Together, our results demonstrate that the perceptual experience of visual objects is directly shaped by naturalistic auditory context, which provides independent and diagnostic information about the visual world.
Keywords
When we look around the world, pertinent visual information can be ambiguous or indeterminate. To overcome this problem and to form meaningful representations, the visual system not only relies on the visual features of an object itself but also incorporates prior knowledge and concurrently available contextual information (Bar, 2004; Biederman et al., 1973; Davenport & Potter, 2004). This integration of available information is not exclusively visual either, as available information from every sensory system is evaluated, weighed, and integrated to form a complete perceptual experience (Alais & Burr, 2004; Chen & Spence, 2010, 2011a; Ernst & Banks, 2002; Körding et al., 2007; Schneider et al., 2008). However, most of the work on multisensory integration has focused on characterizing how hearing a sound can facilitate visual processing; here, we investigated whether naturalistic sounds alter our phenomenology of visual objects. In other words, does the sound of a seal barking change our visual experience and make visual information appear more seal-like than it actually is? Or do sounds simply improve perceptual processing of related visual objects by speeding responses or improving accuracy.
It is well established that simple auditory information, such as a noise burst or a beep, can influence visual processing of low-level visual stimuli quite dramatically, for example by enhancing their early visual processing (Giard & Peronnet, 1999; McDonald et al., 2000; Störmer et al., 2009; Vroomen & De Gelder, 2000) or by disambiguating visual motion stimuli (Sekuler et al., 1997; Watanabe & Shimojo, 2001). Naturalistic sounds have also been found to affect higher-level visual processing, such that response times (RTs) are faster and accuracy is higher in object recognition tasks when sight and sound are congruent relative to incongruent (Chen & Spence, 2011a; Williams & Störmer, 2019). However, it is unclear whether real-world sounds simply enhance perceptual processing—leading to a more rapidly achieved or more accurate representation for congruent audiovisual conditions—or whether sounds can change how we see visual objects. Here, we focused on testing this hypothesis by investigating whether incidental naturalistic sounds can alter the visual representations of pertinent visual objects.
We addressed these questions by investigating how naturalistic sounds modulate the visual processing of ambiguous objects. We used a visual discrimination task with a perceptual locus (Sadr & Sinha, 2004; Williams & Störmer, 2019) and designed a novel set of object stimuli that were paired at random with related or unrelated sounds. Because the influence of sound on vision seems particularly effective when visual information is noisy or dubious—where sounds provide independent and unequivocal clues about the visual environment (Alais & Burr, 2004; Heron et al., 2004; Rohe & Noppeney, 2015; Watanabe & Shimojo, 2001)—we used ambiguous visual stimuli paired with clear and distinct sounds. Specifically, we created a set of ambiguous visual stimuli by morphing together the features of two visual objects (objects A and B, e.g., a hammer and a seal; Fig. 1a) and presented these stimuli with naturalistic sounds that were congruent with one of these progenitor objects. Visual objects and sounds were presented simultaneously, and participants looked for a target object in visual noise, after which they precisely reported that object using a continuous report method. We examined whether participant’s reports of the visual objects were altered by the sounds they heard—in particular, whether sounds would shift the perceptual representation toward the features related to the sound. In a series of control experiments, we also tested at what processing stage these audiovisual effects arose and found evidence consistent with the hypothesis that the effects of sounds on visual object recognition have an early, perceptual locus.
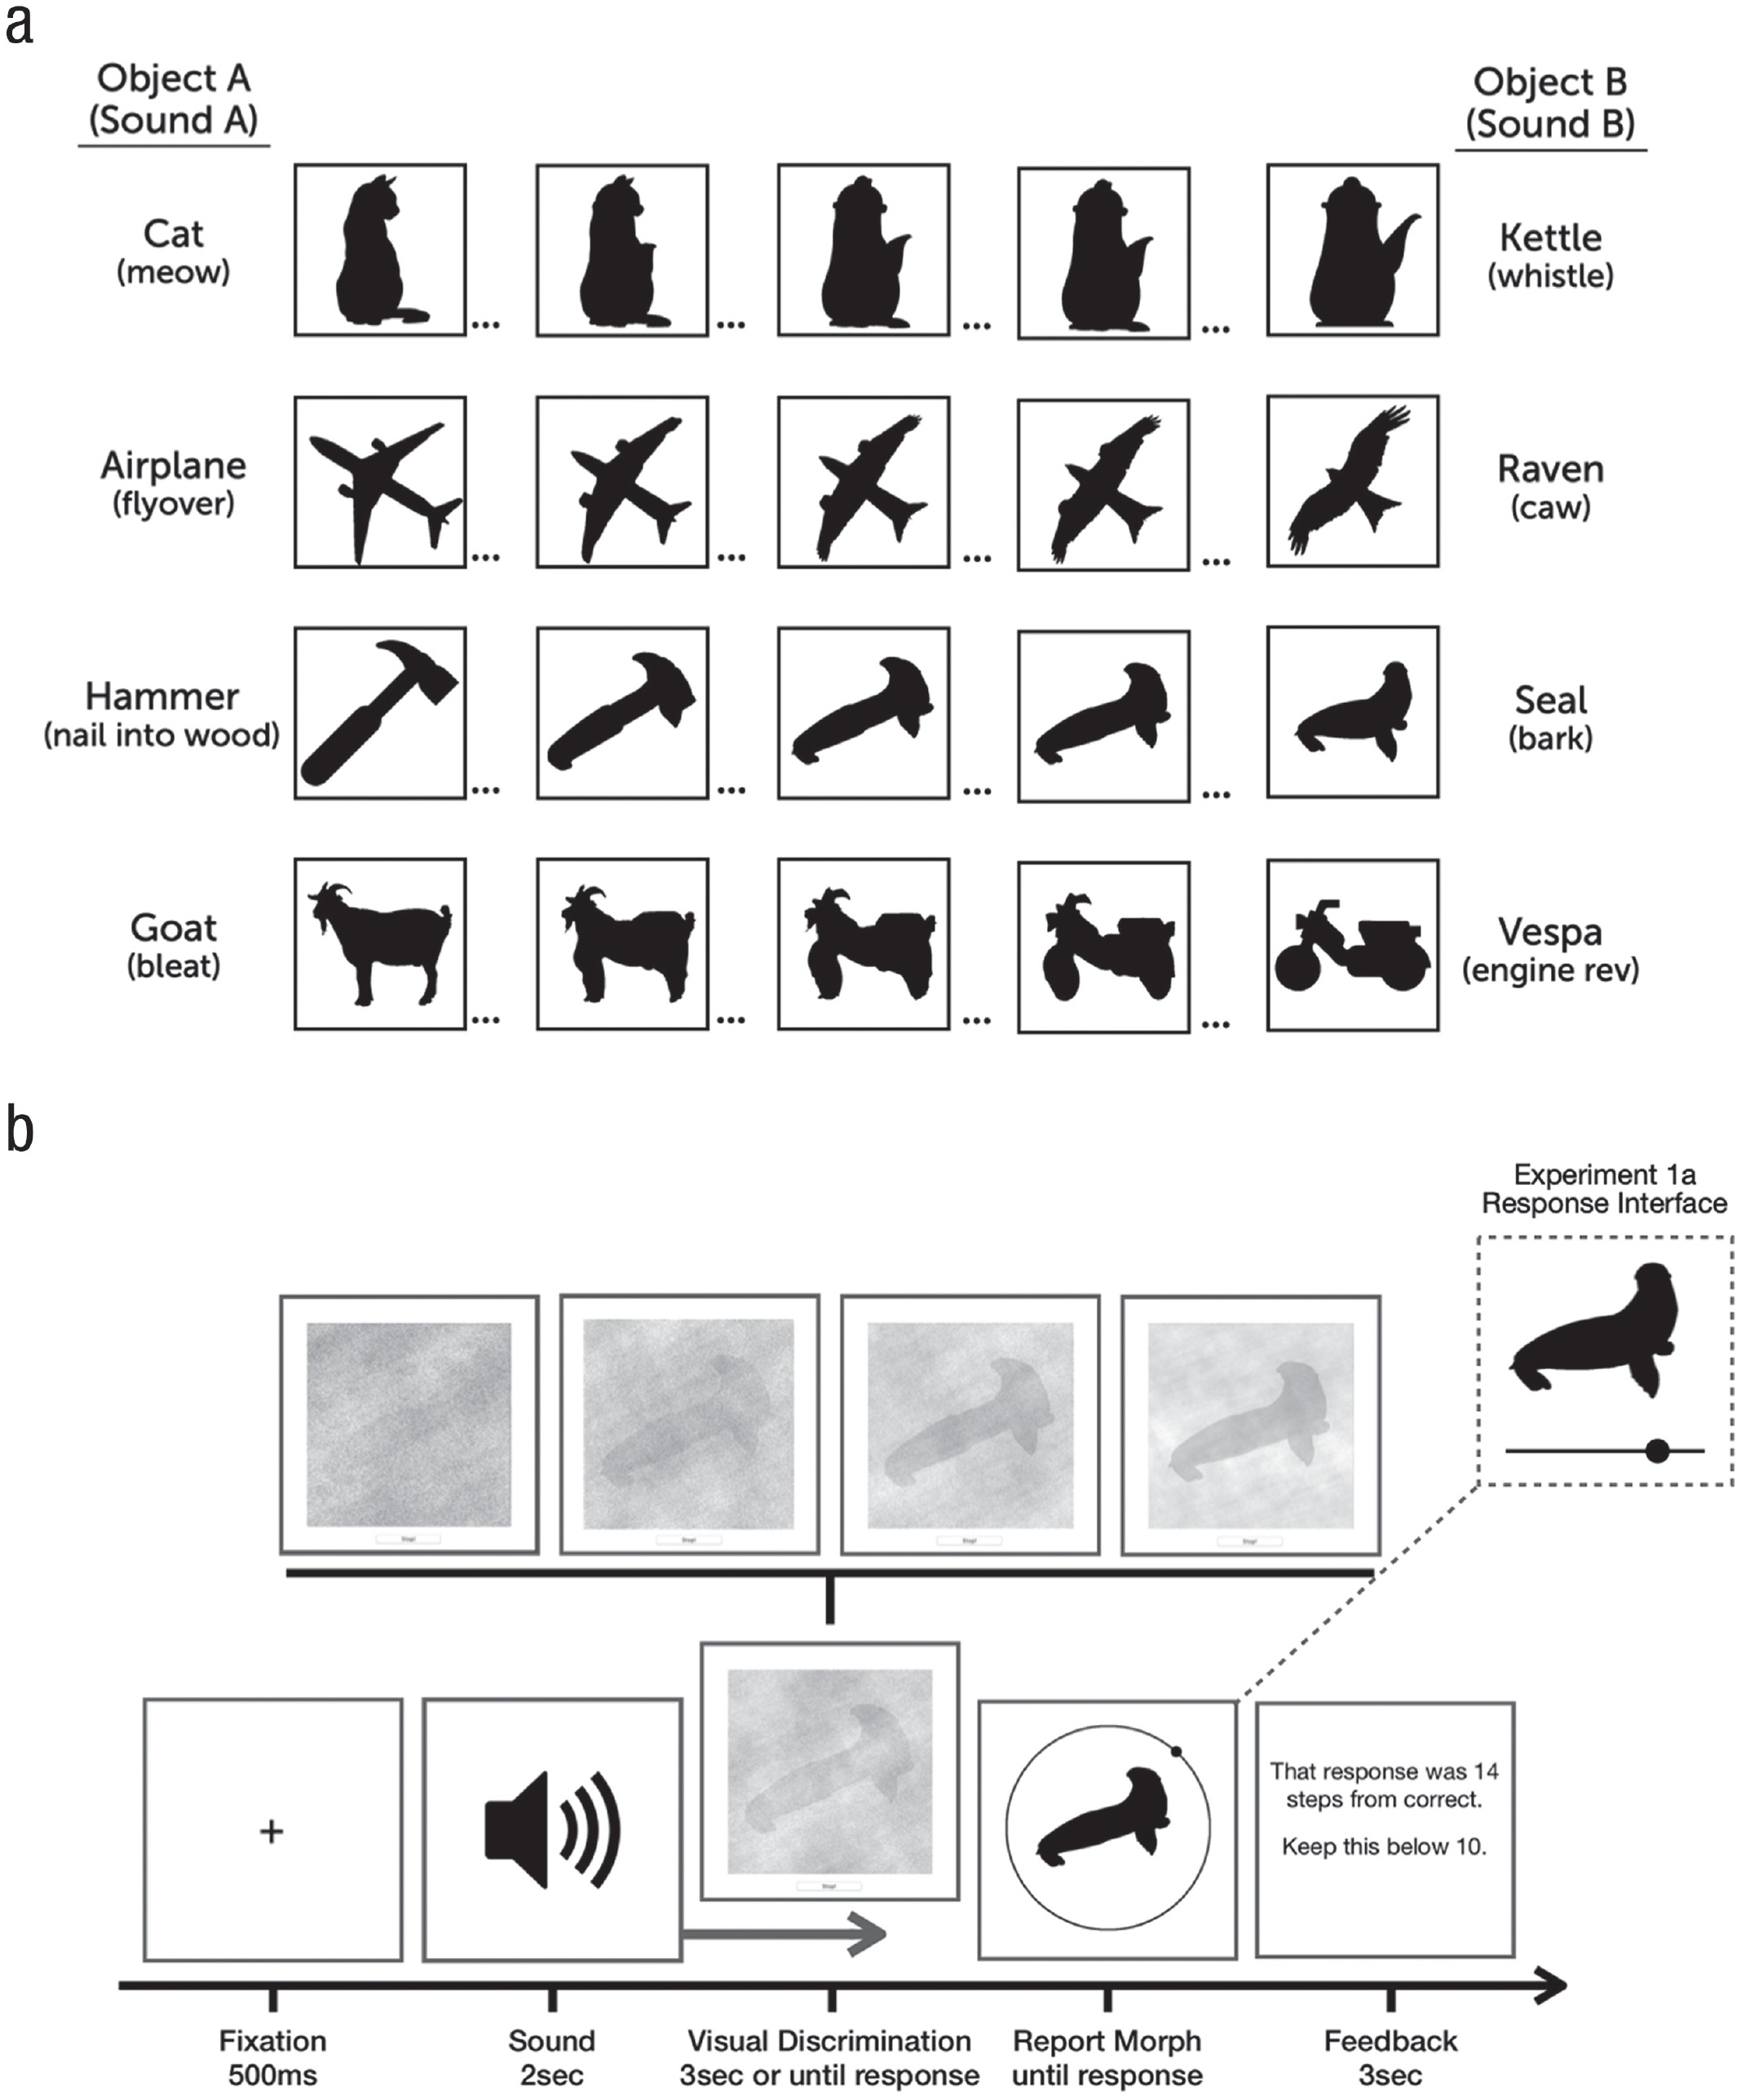
Stimuli and task. (a) The four object pairs used in the experiments. The leftmost column shows anchor objects A, and the rightmost column shows anchor objects B (anchor-object sounds are shown in parentheses). Between each anchor object were 98 unique morphs that maintained features of both anchor objects. (b) General task design. Sounds played while a noisy object slowly faded into view (an example of the denoising process is shown above the visual discrimination panel). Experiment 1a used a linear response slider, whereas Experiment 1b used a circular response wheel.
All data, scripts, and stimuli needed to replicate these experiments and analyses are available on OSF (https://osf.io/85kwv).
Experiment 1
On each trial, an ambiguous visual stimulus that was a morph of two objects (i.e., the target morph; see Fig. 1) slowly faded into view from visual noise, while the sound of a real-world object played. Participants were instructed to press a button as soon as they could accurately recreate the target morph using continuous report (Fig. 1b), in which they had to adjust a test object to the one they had seen during the visual discrimination phase as accurately as possible. Critically, the sounds could be either related or unrelated to the target morph: Unrelated sounds were highly dissimilar from the target morph (e.g., a whistling train for the hammer–seal morphs), whereas related sounds matched the identity of one of the target morph’s anchor objects. 1
Statement of Relevance
Perception is inherently multisensory, and even senses that might appear to be irrelevant play a role in how we perceive the world. To what extent do our senses influence and change our perceptual experience? For example, imagine you catch a glimpse of something rapidly flying by a window. Because it could be any number of things, auditory information could be incredibly useful for resolving this uncertainty: A buzzing would suggest it was a drone, whereas a caw suggests it was a crow. Does the sound of a drone make this dubious object appear more drone-like than it otherwise would have? Here, we tested how naturalistic sounds affect the perception of visual objects and found that object representations are shifted toward the visual features that are congruent with the sound. These findings demonstrate that what we hear has profound impacts on how we perceive the visual world.
Method
Participants
All participants gave informed consent in accordance with the procedures approved by the institutional review board at the University of California (UC) San Diego. Participants were between 18 and 25 years old and reported having normal hearing and normal or corrected-to-normal vision. Twenty-five undergraduates (14 women; mean age = 20.6 years) from UC San Diego took part in our online Experiment 1a in exchange for course credit. Data from six participants were removed because of poor task performance, leaving 19 participants in the final sample (see the Analysis section for more details on exclusion criteria). In Experiment 1b, 49 undergraduates (35 women; mean age = 20.52 years) from UC San Diego took part in this online study in exchange for course credit. Data from nine participants were removed because of poor task performance, leaving 40 participants in the final sample. Experiment 1b included more participants to ensure that we could detect potentially smaller effects after shortening the experiment to make it more suitable for online testing. To determine an appropriate number of participants, we performed a power analysis on the data obtained from Experiment 1a and found that we could adequately detect effects of sound on report error as low as Cohen’s dz = 0.45 with a sample size of 40 (power of .8 and an α of .05; using the base R package pwr; Champley et al., 2018).
Stimuli
A total of 12 real-world sounds were selected from online repositories (e.g., BBC Sound Effects, bbcsfx.acropolis.org.uk; freesound, freesound.org) and were edited to be 2 s in length and have roughly equivalent amplitudes (within and across stimuli when played at roughly 70 dB sound pressure level). Eight of the sounds were paired such that each sound in that pair could be distinct on the basis of auditory and semantic qualities (e.g., hammer–seal; see Fig. 1a). For each object pair, we collected and edited an additional unique sound that was unrelated to the audiovisual object pair. Unrelated sounds were selected to be as distinct as possible from the object pair (e.g., a train whistle for the hammer–seal object pair), whereas related sounds were selected to closely match sounds made by either anchor object A or anchor object B (see Fig. 1a for object sounds). For each sound pair, we collected or created a silhouette of a visual object that matched the object identity of the sound. For ambiguous objects, each silhouette also needed to share visual similarities such as shape, contours, and orientation with the silhouette from the other side of the object continuum. Using each silhouette as end points, we generated a set of 100 novel silhouettes by morphing the features of the two objects (object A and object B) for each object pair (Fig. 1a). We used a morphing program to fuse objects together and create these ambiguous morph pairs (Liao et al., 2014). The morphing procedure optimizes the retention of the original image features while avoiding ghosting artifacts and is based on three principal parameters: similarity (to match regions of images with similar edge structure), smoothness of the mapping (resulting vector fields favor the affine function in the absence of other constraints), and deviation from user-specified correspondence. We manually added specified correspondence points to resolve ambiguities and increase morphing performance.
Because the morphing process creates relatively arbitrary, psychologically nonuniform steps between 1 and 100, individual morph steps were rated in a separate online study to assess the psychometric functions for each of the morph pairs and to measure how the physical morph steps related to perceptual similarity. Here, participants were shown object A and object B (the unique images that anchored the end points of the continuum) and reported whether a test morph (randomly selected from the continuum) was visually more similar to object A or B. From these data, we generated psychophysical curves and selected three morphs from each object-pair continuum that corresponded to the points where 20%, 50%, and 80% of responses indicated that the morph appeared more as object A relative to object B. Note that although we aimed to introduce variability and greater ambiguity in the target stimulus set by selecting three different steps for each object pair, we planned to collapse data across these different morph levels for our main analysis to obtain adequate power. In sum, the image set contained four unique object pairs, each with three unique morphs (12 images total).
For the visual discrimination phase, stimuli were edited to form a continuous and difficult perceptual task that would allow the simultaneous presentation of a sound and a noisy visual object. First, to create noise masks that would effectively obscure the target silhouettes, we combined all 12 silhouette images and completely randomized the phase of this composite image. Thus, the power spectrum of the resulting noise image was correlated with that of all silhouettes and was completely unrecognizable. Then, we created a simple random noise mask using the function imnoise() in MATLAB (The MathWorks, Natick, MA) and overlaid this random noise mask on top of the phase-scrambled noise mask. Together, this resulted in a mask that effectively obscured the target morph silhouettes with both phased and random noise (see Fig. 1b).
Throughout each trial, the mask slowly became more transparent to reveal more of the underlying target image until only 40% of the noise mask remained. Also, on each trial, the phase of the target image was initially randomized 100% and then faded into a recognizable morph by slowly reducing the phase randomization until it was fully intact. The exact parameters of how quickly the noise faded and the target morph became more visible were based on pilot data from an in-lab version, which showed that participants could recognize the image when 60% image clarity was reached, which took roughly 3 s. All phase randomizations and noise masks were created prior to the online experiment; this ensured that the exact same stimuli were viewed by each participant.
Procedure
Participants performed 240 or 120 trials (Experiment 1a and 1b, respectively) that were split among three sound conditions: 40% of the sounds were related to visual anchor object A (e.g., the sound of hammering a nail into wood), and another 40% were related to visual anchor object B (e.g., the sound of a seal barking), and the remaining 20% served as a baseline condition, were unrelated to the visual object pair, and did not match either of the anchor objects. The nonmatching, unrelated sounds were selected to be unrelated to either of the sounds or visual objects. Related sounds were not predictive of which target morph appeared as the target in the visual discrimination phase (e.g., the sound of a seal barking could be presented when any of the three target morphs were presented). Each trial began with the playback of a 2-s sound of a real-world object, and participants were instructed to attend to this sound. Five hundred milliseconds after the sound onset, the visual discrimination phase appeared centrally (400 × 400 pixels) on the participant’s browser of choice. The visual object always started completely obscured by visual noise and would slowly fade in to become more visible as time elapsed. More specifically, visual noise levels decreased by roughly 1% every 50 ms until the participant clicked the mouse to indicate that they had enough visual information to accurately perform the subsequent continuous report of the target object.
The mouse click stopped the visual discrimination phase, and if participants did not press the button within 3 s—when the phase randomization reached 40% noise and the object was identifiable though still obscured by noise—they received feedback encouraging them to accumulate visual information more quickly (these trials were discarded and not analyzed). Target images were randomly chosen on each trial and paired with one of the three sound conditions. Once the visual discrimination phase was completed, participants were presented with the response interface: A response silhouette (300 × 300 pixels) was shown as a probe above a continuous response slider (400 pixels wide). The probe was chosen randomly from the possible morph steps (1–100), and participants clicked and dragged a response dot along the continuous response line until they matched the probe to the target morph from the visual discrimination phase. Participants locked their response by clicking the mouse and then received feedback on their error (number of steps from the correct answer for 3 s). Participants then clicked to initiate the next trial.
Experiment 1a used a linear response slider in which the leftmost edge corresponded to anchor object A (Morph Step 1) and the rightmost edge corresponded to anchor object B (Morph Step 100). Further, we used three distinct morphs per object pair, and these morphs corresponded to three similar positions on the response slider across trials. Thus, it is possible that participants used these reliable positions along the response slider as a cue when responding—instead of focusing on the visual features of the response morph itself. To mitigate these concerns, and to replicate the effects of Experiment 1a using a different response format, in Experiment 1b, we presented participants with a response wheel that was rotated randomly on every trial so that there was no correspondence between positions on the response wheel and the visual response morph presented centrally, across trials (see Fig. 1b). Thus, the task in Experiment 1b was identical to that in Experiment 1a except that participants performed only half of the trials (and thus had less exposure and practice with these stimuli and task) and when the response screen appeared, a black ring (400 × 400 × 3 pixels) with a small position dot (50 × 50 pixels) surrounded the response morph (300 × 300 pixels). On every trial, the response ring was rotated by a random amount so that the angle of the position dot corresponded with a distinct morph step across trials. Thus, participants were not able to use the response interface itself as an anchor to find a particular morph but had to solely rely on the response morph, which was changing continuously as participants moved along the response wheel.
Analysis
For each sound condition (unrelated or related: A and B), we calculated a participant’s median RT on the visual discrimination phase and their mean report error on the continuous report phase by sound condition. When comparing RT, we first checked to see whether RT differed between related sound A and sound B conditions. Across all experiments, we found no difference and thus collapsed RT estimates across sound A and B when comparing related and unrelated conditions. Error on continuous report was determined as the number of morph steps between the correct response (target morph) and the provided response. Morphs were numbered 1 to 100, and negative responses represent a response that is closer to 1 (object A) than the correct response and vice versa for positive responses. We calculated a participant’s mean error per sound condition (sound A, B, and unrelated) and submitted these data to an analysis of variance (ANOVA). Report error in each figure is represented as the difference in average error between the related and unrelated conditions.
Exclusion criteria were decided in advance on the basis of preliminary pilot data. Data from participants were excluded if their average report error or average RT exceeded 3 standard deviations from the group mean. Furthermore, for each individual participant, all trials on which report error or RT exceeded 4 standard deviations from their mean were excluded. Last, any trials on which participants did not respond in the visual discrimination phase—instead opting to wait the entire duration of the trial—were excluded from further analysis. Data from participants were excluded from further analysis if more than 10% of trials were missing from their data set because of this removal process.
Results
We first submitted report error and RT on the visual discrimination and the continuous report phases, respectively, to a multivariate ANOVA (MANOVA). Here, we found a significant effect of sound on both RT and error, F(4, 72) = 6.67, p < .001, η2 = .27. We next submitted continuous report responses to an ANOVA, which revealed a significant main effect of sound (sound A, sound B, or an unrelated sound), F(2, 36) = 10.05, p < .001, η2 = .36. Our primary interest was whether related sounds A and B affected the same visual stimulus differently; thus, we next compared the mean error for each related sound with the error on unrelated sound trials—which matched the complexity and naturalistic properties of the related sounds, thus effectively serving as a neutral condition. These subsequent pairwise comparisons revealed that the sounds corresponding to anchor object A shifted responses toward that side of the object-morph continuum and away from responses on unrelated trials, t(18) = −2.16, p = .044, Cohen’s dz = 0.50, 95% confidence interval (CI) = [0.031, 0.959], whereas sounds corresponding to object B shifted responses in the opposite direction with roughly equal magnitude, t(18) = 2.57, p = .019, Cohen’s dz = 0.59, 95% CI = [0.199, 0.979] (see Fig. 2b). We next focused on RT during visual discrimination, which reflected the rate at which visual information was meaningfully integrated into a complete object. Participants were faster, on average, when they heard a related sound (1,638 ms) compared with an unrelated sound (1,682 ms), t(18) = 2.47, p = .023, Cohen’s dz = 0.57, 95% CI = [0.198, 0.936]. This difference suggests that, on unrelated trials, participants required roughly 10% more visual evidence than on related trials to perform the task with roughly equal levels of accuracy (mean absolute error = 6.00 vs. 6.07), t(18) = 0.39, p = .7, Cohen’s dz = 0.089, 95% CI = [0.086, 0.093], Bayes factor favoring the null over the alternative hypothesis (BF01) = 3.94. Thus, auditory information accelerated visual feature extraction from the noisy images and possibly increased participants’ confidence in their visual judgments as well (Williams & Störmer, 2019). Additionally, we conducted a linear mixed-effects analysis to account for variability in the stimulus set and, after accounting for this variance, found a main effect of sound for RT, χ2(2) = 6.27, p = .043, and report error, χ2(2) = 6.05, p = .048.
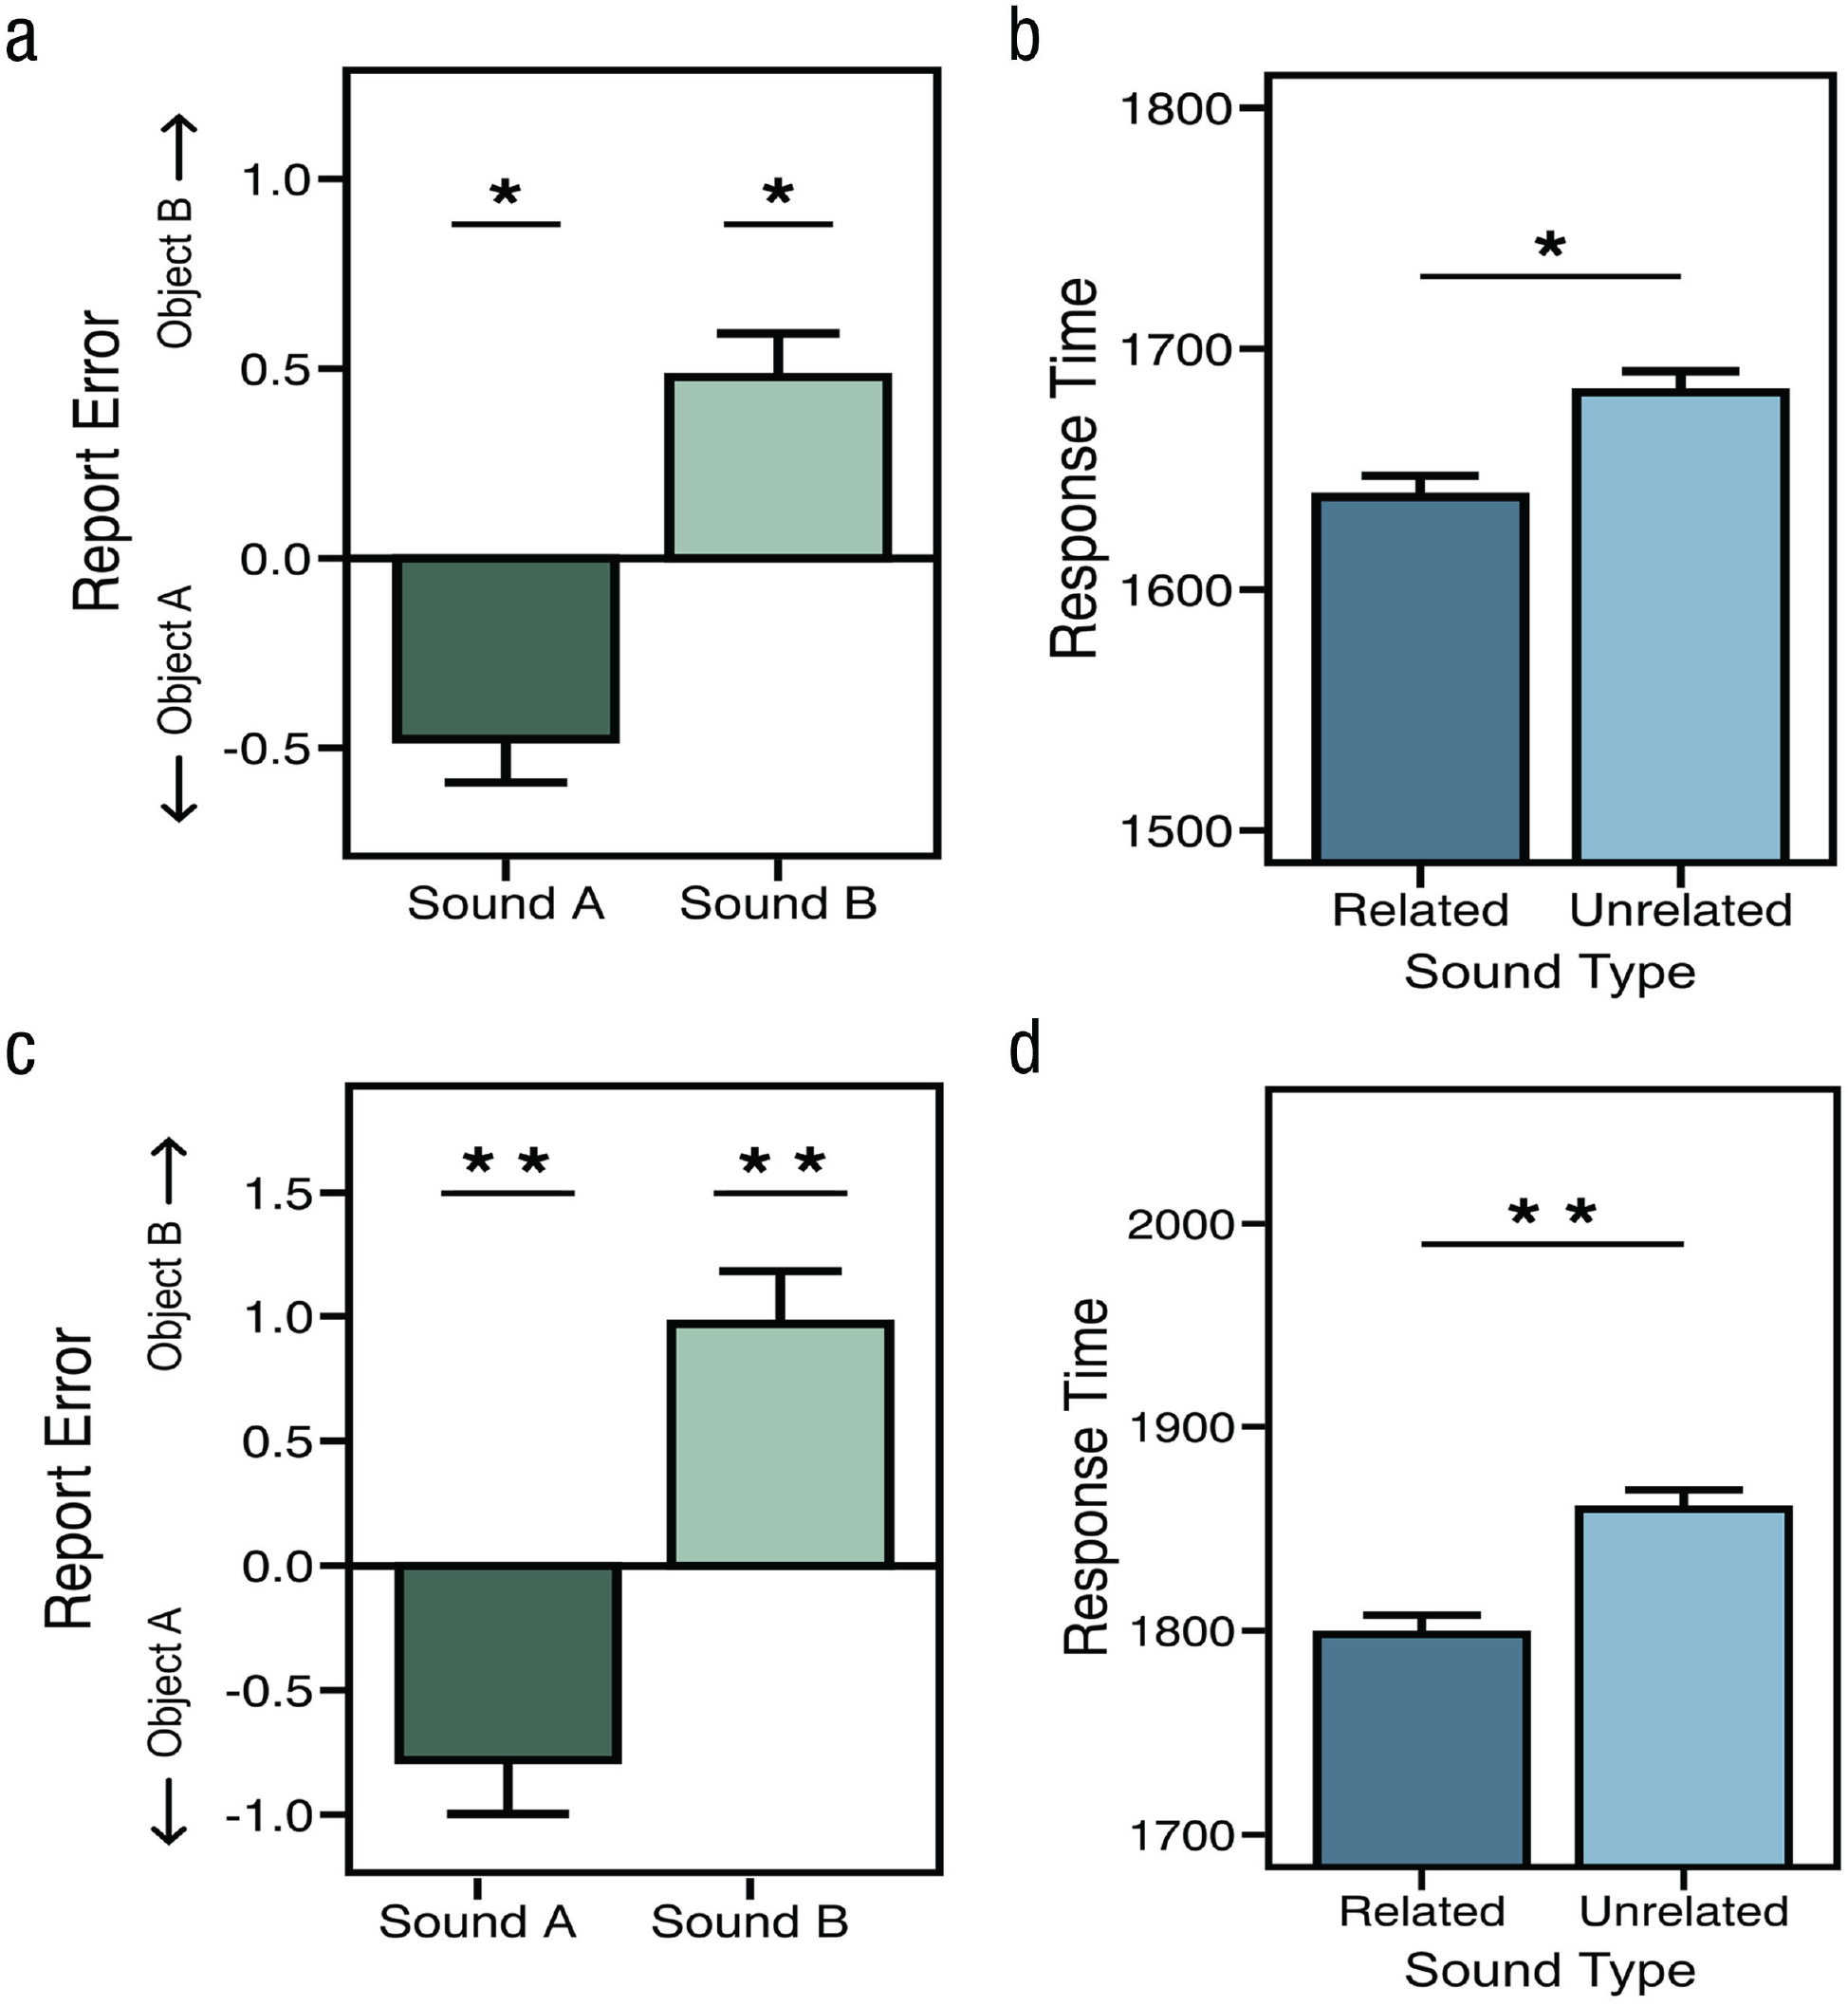
Data from Experiments 1a (top row) and 1b (bottom row). Average report error (difference from unrelated sounds) for Experiment 1a (a) and Experiment 1b (c) shows that related sounds influenced report error such that the response morph appeared more like the sound’s anchor-object identity. The right column demonstrates that, for both Experiment 1a (b) and Experiment 1b (d), sounds influenced response time such that participants were faster when they heard a related sound compared with an unrelated one.
Experiment 1a used a linear response interface where the leftmost edge corresponded to anchor object A (Morph Step 1) and the rightmost edge corresponded to anchor object B (Morph Step 100). It is therefore possible that participants used these reliable positions along the response slider as a cue when responding—instead of focusing on the visual features of the response morph itself. To mitigate these concerns in Experiment 1b, we implemented a response wheel that rotated randomly on every trial (Fig. 1b). We submitted RT and report error to a MANOVA and found a main effect of sound, F(4, 156) = 8.508, p < .001, η2 = .18. Next, we found that sounds had a reliable effect on report error, F(2, 78) = 11.23, p < .001, η2 = .22, and that related sounds shifted responses away from the average error on unrelated trials and toward the visual features of anchor object A, t(39) = −2.58, p = .014, Cohen’s dz = 0.41, 95% CI = [–0.20, 1.02], and object B, t(29) = 2.77, p = .01, Cohen’s dz = 0.42, 95% CI = [–0.31, 1.16] (Fig. 2). RT from the visual discrimination phase was again faster when sounds were related to the target morph (M = 1,798 ms) than when they were unrelated (M = 1,860 ms), t(39) = 3.22, p = 0.003, Cohen’s dz = 0.51, 95% CI = [0.12, 0.89], and like before, this difference in RT did not result in a reliable difference in accuracy (Ms = 6.83 vs. 6.84), t(39) = 0.03, p = .98, Cohen’s dz = 0.004, 95% CI = [–0.001, 0.009], BF01 = 5.86. We also found that the variability in our stimulus set did not extinguish the main effect of sound on RT, χ2(2) = 29.44, p < .001, or report error, χ2(2) = 29.44, p < .001. Taken together, the results from these experiments demonstrate that related auditory information speeds visual object processing while also shifting feature representations of visual objects toward those features that match the incidental auditory context.
Experiment 2
The results of Experiments 1a and 1b led us to hypothesize that sounds influence concurrent visual processing by shifting ambiguous visual inputs toward visual features that are congruent with the sound. However, it could be that sounds influence later, nonperceptual processing stages, such as decisional and response processes. Although such a postperceptual account seems incompatible with faster RT for related relative to unrelated sounds, we directly tested this alternative in Experiments 2a and 2b by presenting sounds when they should have the greatest impact over decisional processes: during the continuous report phase.
Method
Participants
In Experiment 2a, all participants were 18 to 23 years old (mean age = 20.36 years), reported normal hearing and normal or corrected-to-normal vision, and gave informed consent in accordance with the procedures approved by the institutional review board at UC San Diego. Forty-nine participants (32 women) from UC San Diego took part in this online experiment in exchange for course credit. Data from seven participants were removed using the same criteria as described above, leaving 40 participants in the final sample. In Experiment 2b, all participants were 18 to 34 years old (mean age = 20.69 years), and 96 participants (76 women) from UC San Diego took part in this online experiment in exchange for course credit. Data from 11 participants were removed using the same criteria as described above, leaving 85 participants in the final sample. Exclusion criteria were identical to those in Experiment 1.
Procedure
The task was identical to that in Experiment 1b, except that sounds now started to play immediately following the visual discrimination phase and during continuous report. Each trial began with the same visual discrimination phase, except with no sound and, after a button press, the visual input stopped, a real-world sound began to play, and the continuous report interface was presented (after 500 ms; Fig. 3). If the effect is largely driven by a decisional process (such as response bias or low-confidence responses), we would expect a similar, or perhaps even larger, effect of sound on visual perception relative to that found in Experiments 1a and 1b. If, however, real-world sounds primarily affect perceptual and not decisional processes, then this manipulation should eliminate or reduce the effect because perceptual processing is likely complete by the time participants begin reporting the target item. In Experiment 2b, on half of all trials, a sound started playing shortly before the visual discrimination task (as in Experiments 1a and 1b), and on the remaining half of the trials, the sound was played after the visual discrimination task and during the continuous response task (as in Experiment 2a). These sound-onset conditions were presented in blocks (30 trials per block) and interleaved.
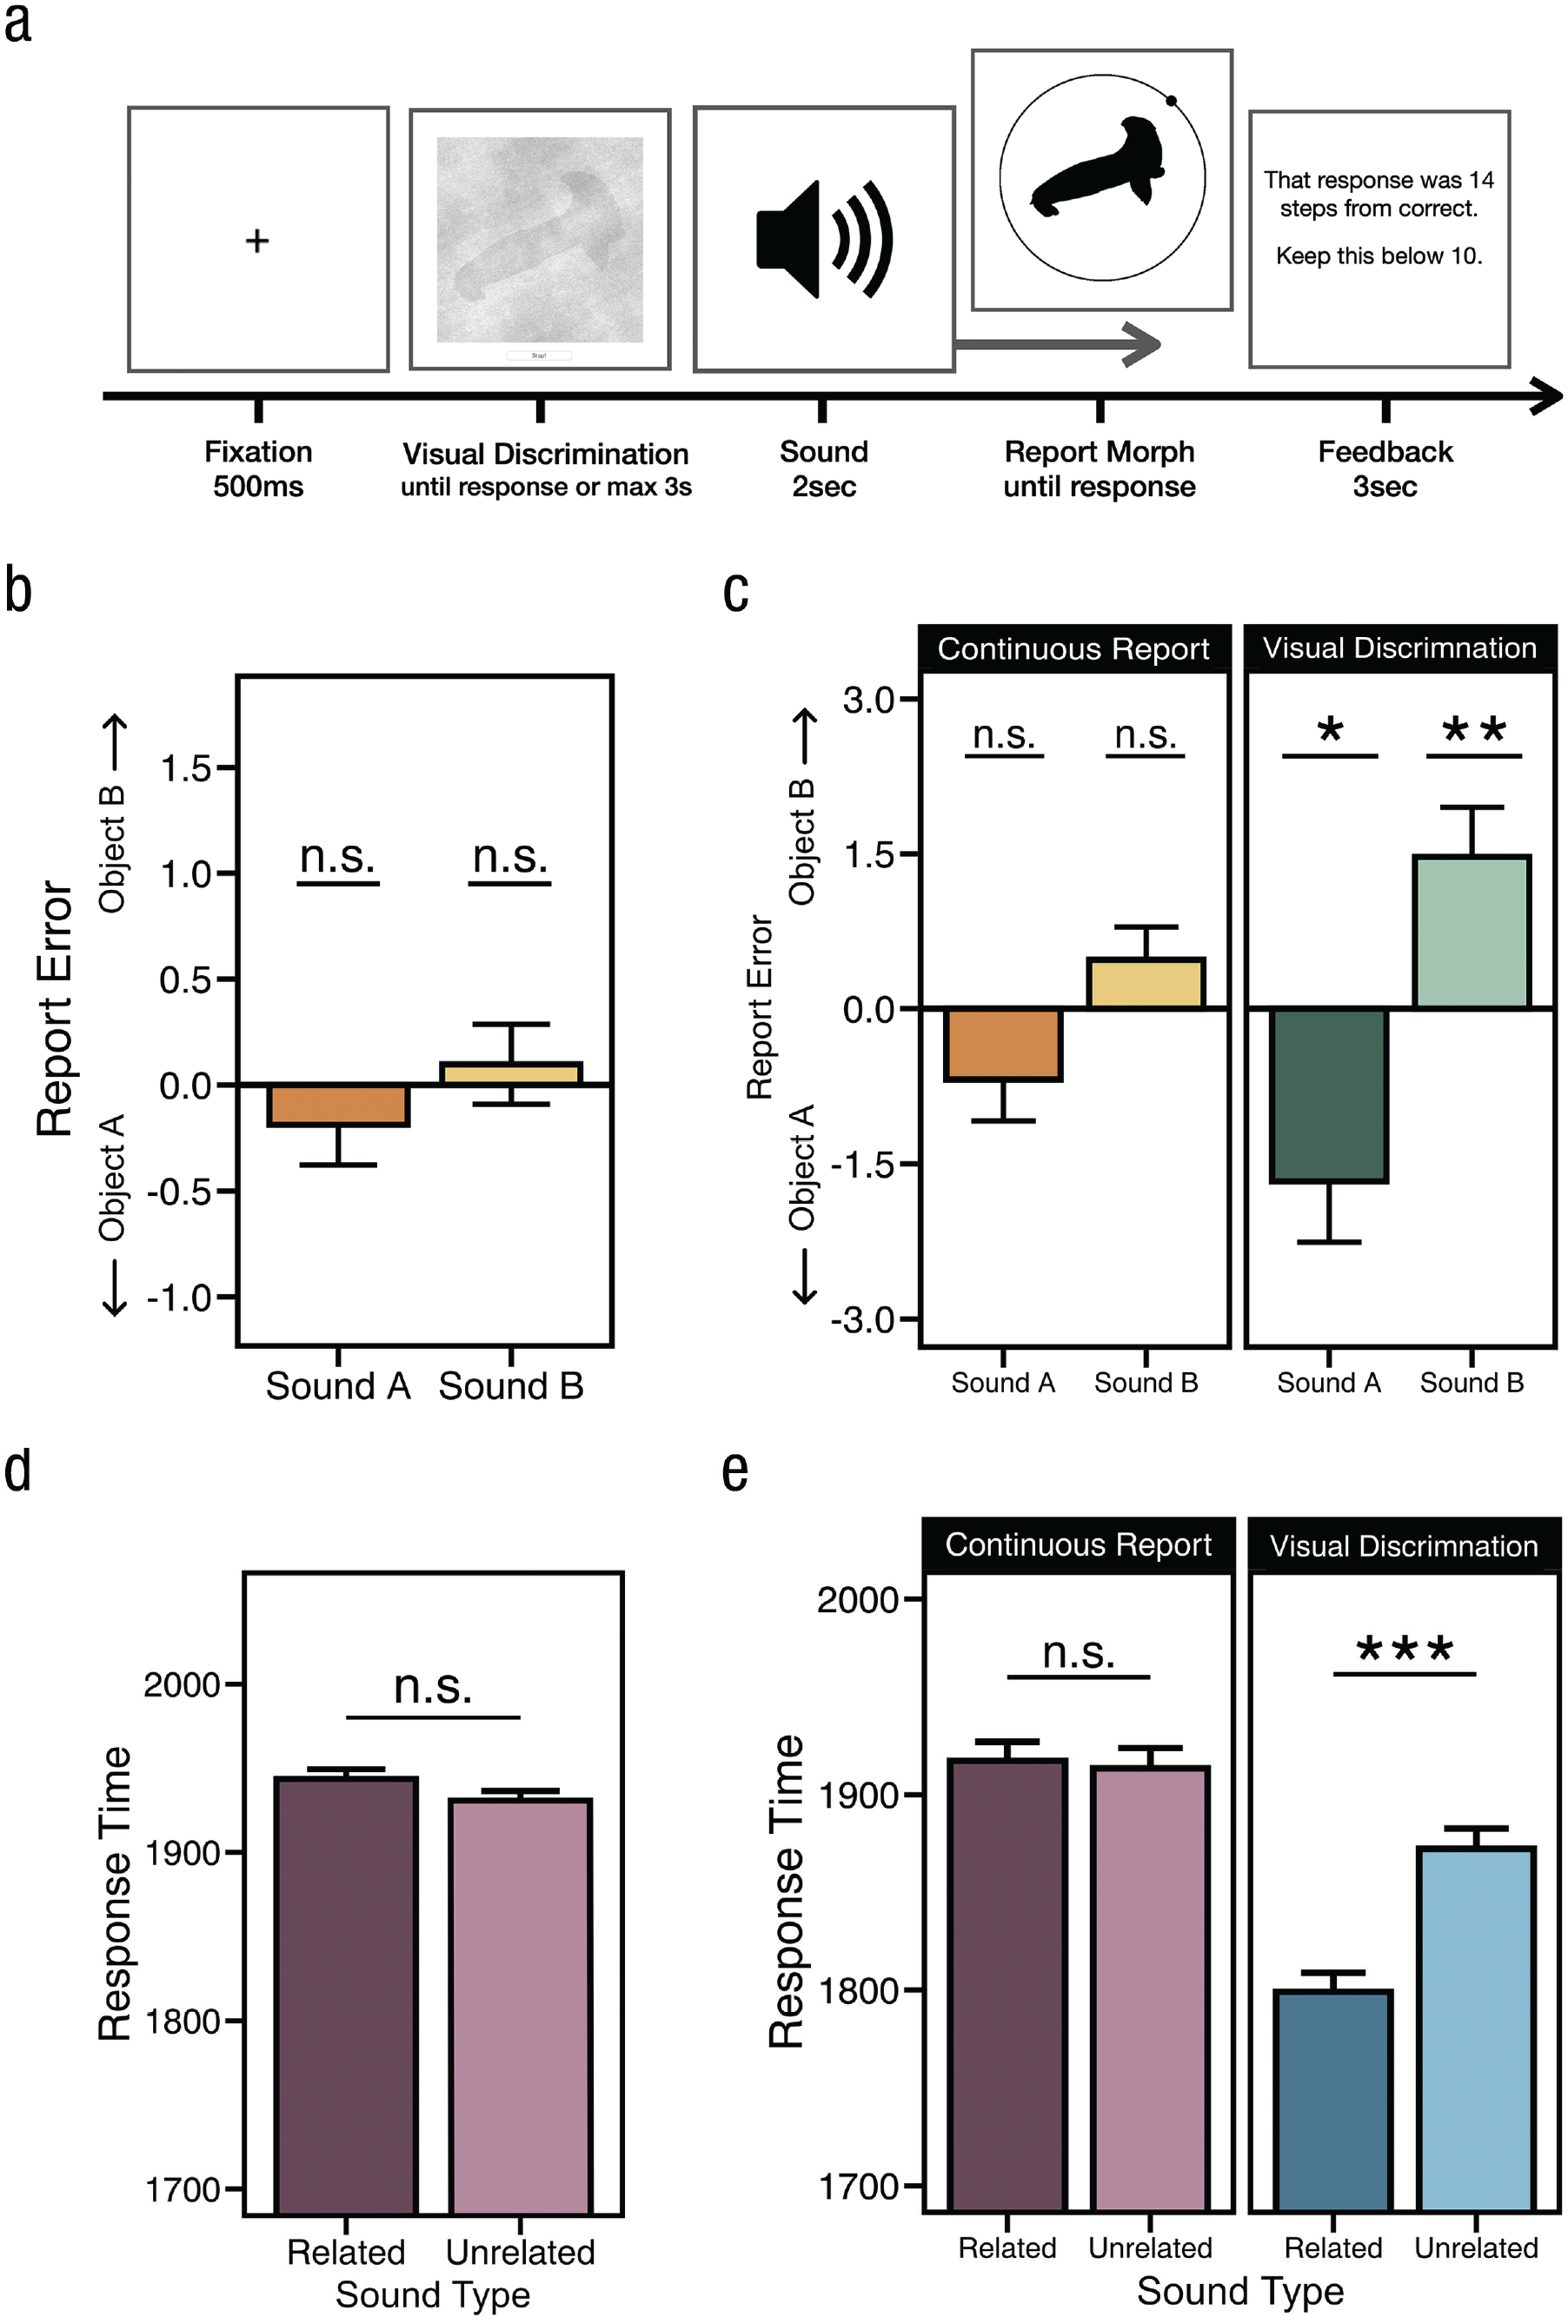
Results and task design from Experiments 2a and 2b. (a) Task design. Sounds were always played during the continuous report phase in Experiment 2a and on half of all blocks in Experiment 2b. (b, c) Average report error (difference from unrelated) for Experiment 2a and Experiment 2b (separated by when the sound onset began). Related sounds influenced report error such that the response morph appeared more like the sound’s anchor object when the sound was played during the visual discrimination phase (c, green bars) and not when played during the continuous report phase (b, c, orange bars). (d) Response time for related and unrelated trials in Experiment 2a. (e) Response time for related and unrelated trials in Experiment 2b, separated by when the sound was played: during continuous report (purple bars) or visual discrimination phases (blue bars). Results show that RT was reliably affected only when sounds were heard during the visual discrimination phase.
Results
In Experiment 2a, we submitted RT and report error to a MANOVA and found no main effect of sound, F(4, 156) = 0.44, p = .78, η2 = .01. Following up, we found that sounds had no significant impact on report error, F(2, 78) = 0.38, p = .69, η2 = .009 (Fig. 3b), and as expected, RT on related (M = 1,911 ms) and unrelated trials (M = 1,906 ms) was not significantly different, t(39) = 0.29, p = .77, Cohen’s dz = 0.04, 95% CI = [-0.379, 0.286], BF01 = 5.63 (Fig. 3d). A closer analysis of report error found no significant impact of sound. Report error on neither sound A trials, t(39) = 0.82, p = .42, Cohen’s dz = 0.12, 95% CI = [-0.362, 0.621], nor sound B trials, t(39) = 0.24, p = .81, Cohen’s dz = 0.03, 95% CI = [–0.831, 0.755], was significant, and we found compelling evidence to support these null findings (BF01 = 4.28 and 5.70, respectively).
In Experiment 2b, we combined manipulations from Experiments 1b and 2a in a within-subject design and varied whether sounds were played during the continuous report phase (as in Experiment 2a) or were played during the visual discrimination phase (as in Experiments 1a and 1b). We submitted RT and report error to a MANOVA with both sound and sound-onset conditions and found main effects of sound, F(4, 336) = 9.19, p < .001, η p 2 = .10, and sound onset, F(2, 83) = 6.16, p = .003, η p 2 = .13, as well as a significant interaction, F(4, 336) = 4.76, p < .001, η p 2 = .05. We next focused on report error and found a main effect of sound, F(2, 84) = 11.31, p < .001, η p 2 = .12; there was no main effect of sound onset (during or after visual discrimination), F(1, 84) = 0.16, p = .69, η p 2 = .001, and there was a significant interaction, F(2, 168) = 3.39, p = .036, η p 2 = .04. To explore the interaction, we compared the effect of sound on report error and found that sounds produced a significantly larger effect when they were played during the visual discrimination phase compared with when they were played during the continuous report phase, t(84) = 2.34, p = .021, Cohen’s dz = 0.25, 95% CI = [-1.425, 1.934] (see Fig. 3c).
We next analyzed report error independently for each sound-onset condition. When participants heard sounds during the visual discrimination phase, we found that related sounds shift responses toward anchor object A, t(84) = 2.30, p = .024, Cohen’s dz = 0.25, 95% CI = [-1.696, 1.198], and object B, t(84) = 2.96, p = .004, Cohen’s dz = 0.32, 95% CI = [-0.668, 1.309]. These results were significant after analyses accounted for stimulus variability as well, χ2(2) = 58.59, p < .001. However, and in contrast to these findings, when participants heard sounds during the continuous report phase (Fig. 3d), we found that error on unrelated trials was not significantly different from error on sound A trials, t(84) = 1.56, p = 0.12, Cohen’s dz = 0.16, 95% CI = [-1.043, 0.705], BF01 = 2.61, and sound B trials, t(84) = 1.42, p = .16, Cohen’s dz = 0.15, 95% CI = [-0.51, 0.818], BF01 = 3.18.
We then examined RT and found significant main effects of sound, F(2, 168) = 7.34, p < .001, η p 2 = .8, and sound onset, F(1, 84) = 12.25, p = .001, η p 2 = .13, as well as a significant interaction, F(2, 168) = 6.12, p = .003, η p 2 = .07. Participants were significantly faster on related trials (M = 1,779 ms) compared with unrelated trials (M = 1,852 ms), t(84) = 4.05, p < .001, Cohen’s dz = 0.44, 95% CI = [0.079, 0.7996] (Fig. 3e, blue bars), when sounds played during the visual discrimination phase, and this difference in RT did not lead to significant differences in accuracy (Ms = 7.76 vs. 7.31), t(84) = 1.21, p = .23, Cohen’s dz = 0.13, 95% CI = [-0.875, 0.612], BF01 = 4.13 (see Fig. 3e). As expected, we observed no significant difference in RT between the related (M = 1,899 ms) and unrelated (M = 1,903 ms) conditions when sounds were played during the continuous report phase, t(84) = 0.25, p = .80, Cohen’s dz = 0.03, 95% CI = [-0.287, 0.343], BF01 = 7.99 (Fig. 3e, purple bars).
Overall, RT was on average slower when sounds were played during the continuous report phase compared with the visual discrimination phase, but this difference in RT (i.e., having target images with lower levels of noise) was not statistically significant, t(84) = 1.58, p = .12, Cohen’s dz = 0.17, 95% CI = [-0.817, 0.475], BF01 = 2.55, and the numerical difference in RT did not lead to a significant difference in report error across sound-onset conditions (Ms = 7.38 vs. 7.54), t(84) = 0.62, p = .54, Cohen’s dz = 0.06, 95% CI = [-0.85, 0.725], BF01 = 6.94. These results replicate those of the previous experiments and demonstrate that sounds have their greatest influence when they are presented concurrently with visual information and can thus be integrated directly with incoming visual information.
Experiment 3
Experiments 2a and 2b suggest that this perceptual shifting is not largely driven by postperceptual mechanisms. However, another possibility is that the semantic content of these naturalistic sounds drives preperceptual, top-down influences on visual perception (although, top-down mechanisms may diminish multisensory effects). To test whether sounds might activate high-level semantic representations—that subsequently influence sensory processing—in Experiment 3, we presented the full length of a sound prior to the onset of the visual discrimination phase (cf. Cox & Hong, 2015; Lupyan & Ward, 2013), which provides the same audio-semantic content as before but should primarily drive preperceptual mechanisms that have been shown to require a longer delay between sound and target onset (Boutonnet & Lupyan, 2015; Chen & Spence, 2018a, 2018b; Lupyan & Ward, 2013).
Method
Participants
All participants were between 18 and 25 years old (mean age = 20.1 years), reported normal or corrected-to-normal vision, and gave informed consent in accordance with the procedures approved by the institutional review board at UC San Diego. Forty-eight undergraduates (25 women) from UC San Diego took part in this online study in exchange for course credit. Data from eight participants were removed using the same criteria as described above, leaving 40 participants in the final sample.
Procedure
The task was identical to that in Experiment 1b, except that sounds now preceded the visual discrimination task by 3 s (Fig. 4a). Each trial started with a real-world sound (2 s) and after it finished, the presentation of the visual discrimination task automatically began after the 3-s delay.
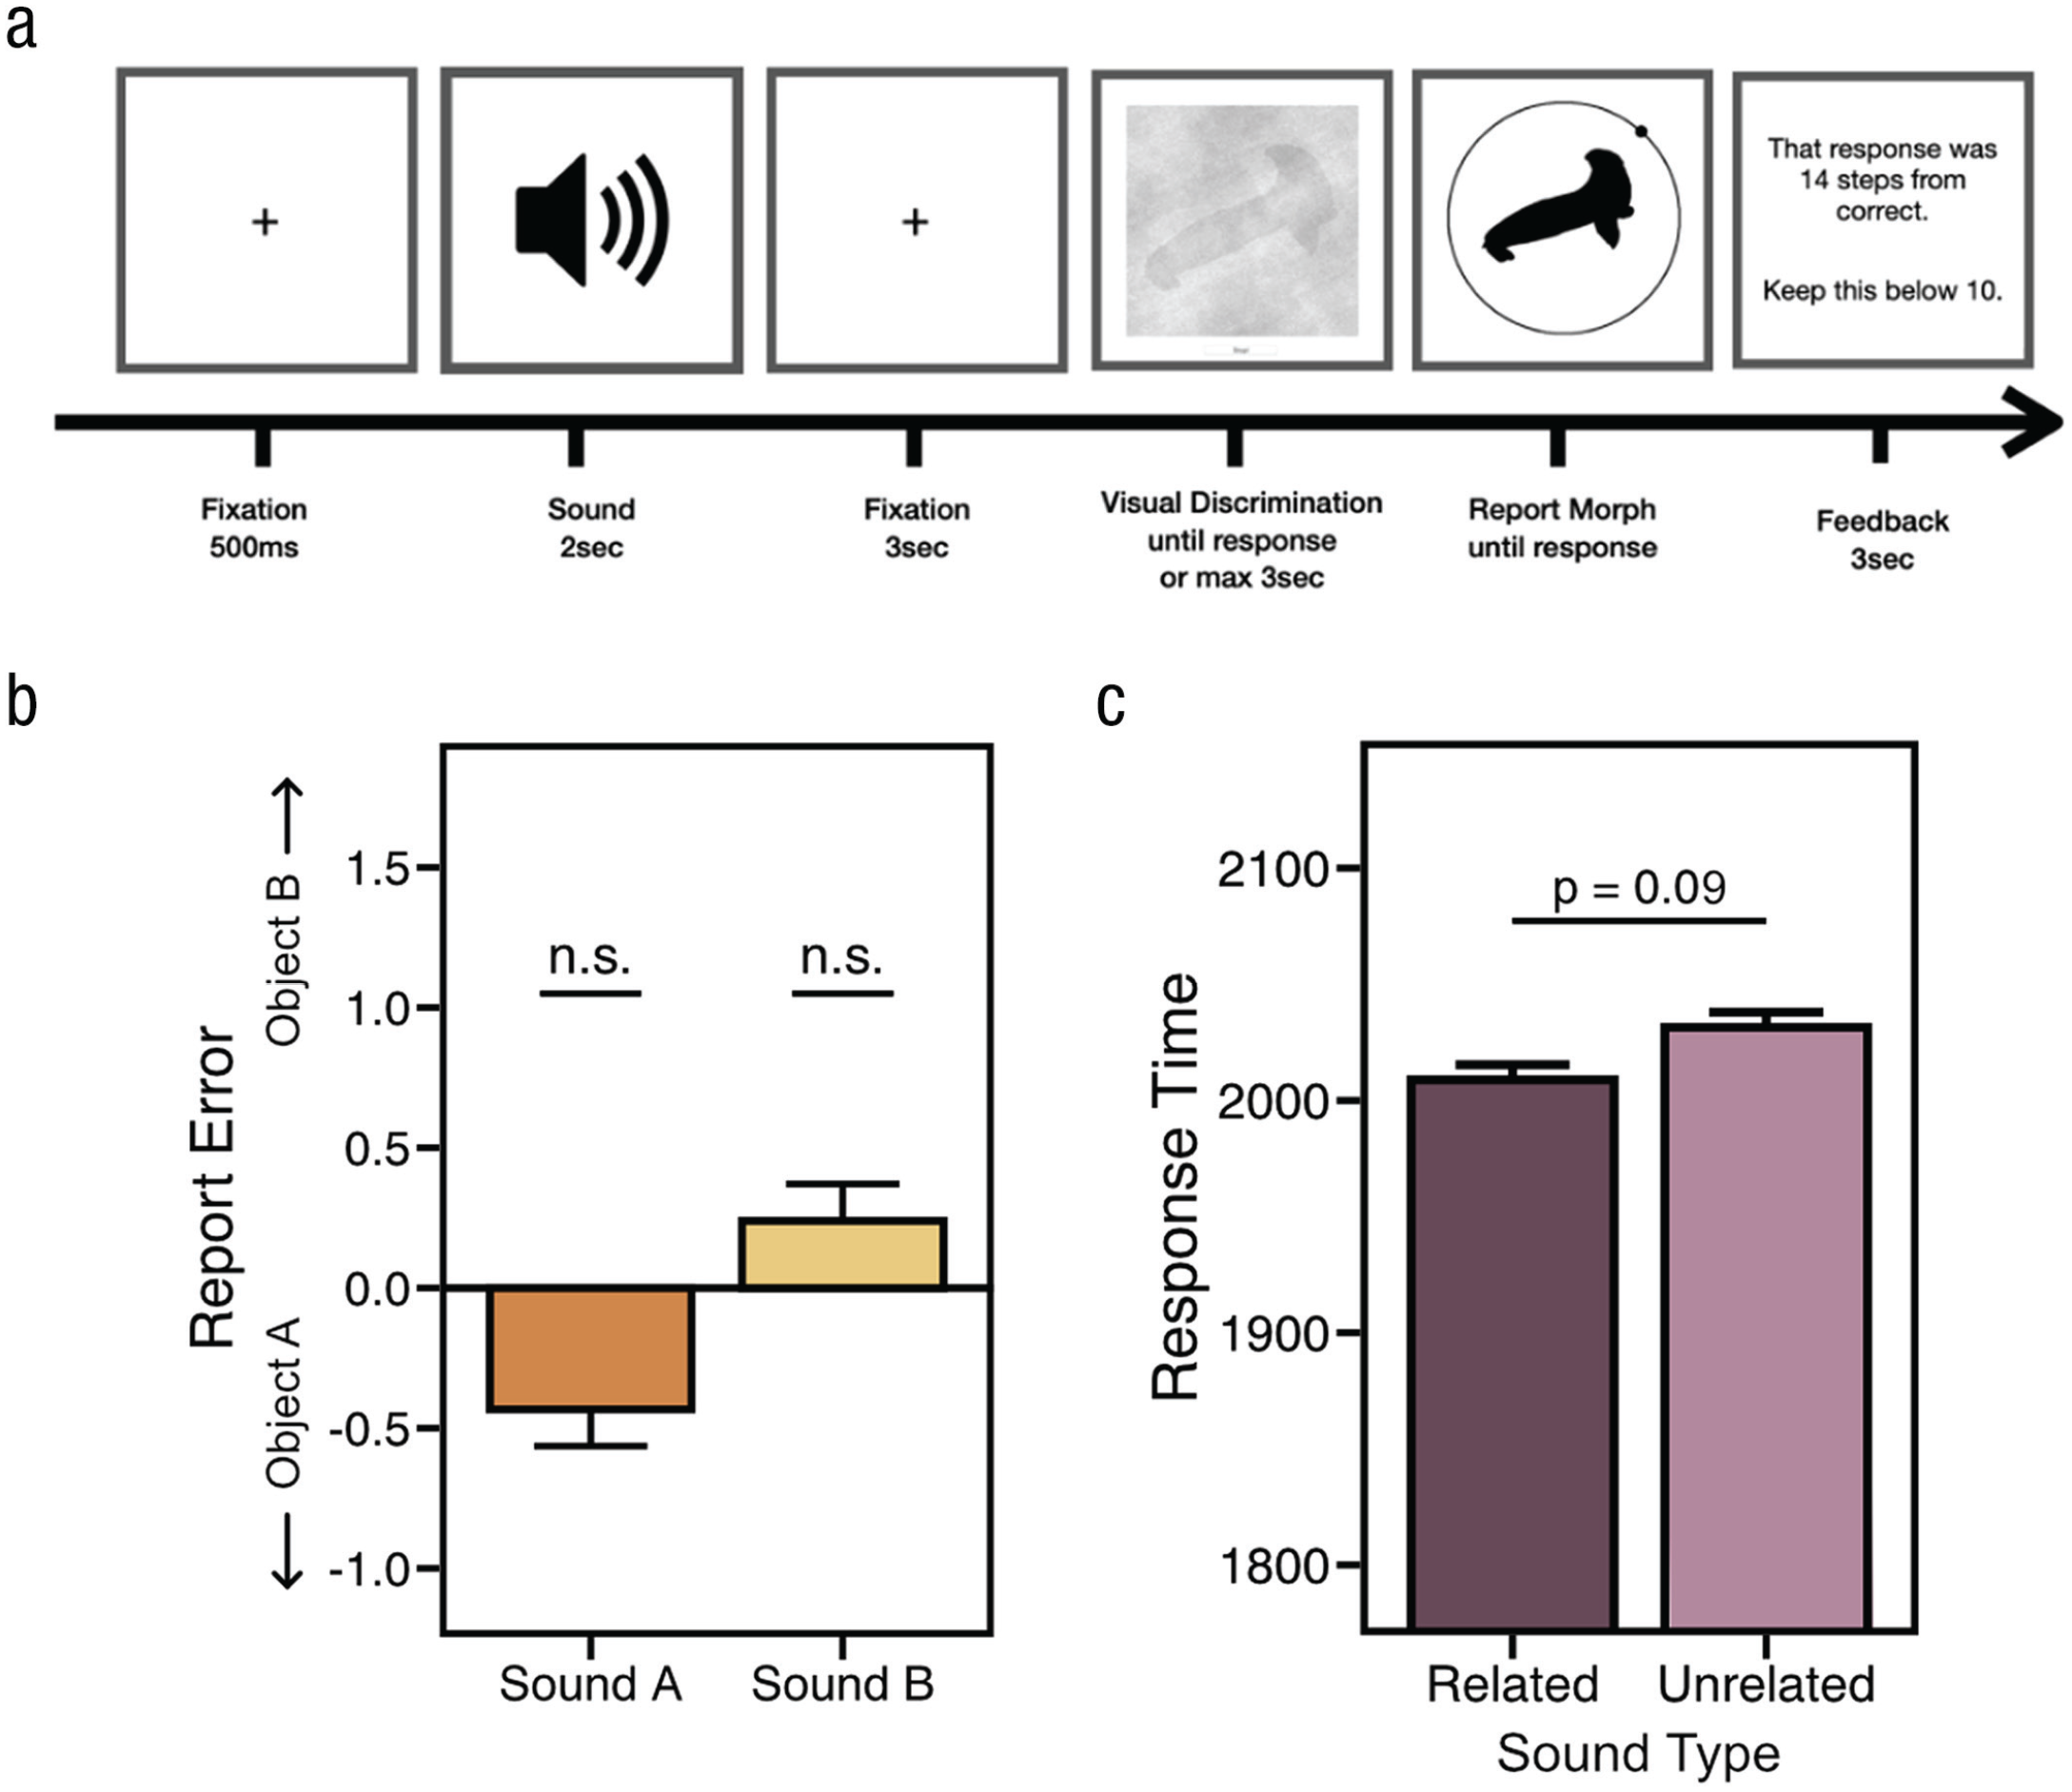
Results from Experiment 3. (a) Sounds were played prior to the onset of the visual discrimination phase. (b) Report error. We found a substantially reduced, nonsignificant effect (Cohen’s dz = 0.13) for sound A and sound B, suggesting that expectation and attention did not play a substantial role in the effects observed in Experiments 1a, 1b, and 2b. (c) Response times for related and unrelated conditions.
Results
We submitted RT and report error to a MANOVA and found no main effect of sound, F(4, 156) = 2.18, p = .07, η2 = .05. We found that sounds did not have a significant impact on report error, F(2, 78) = 2.08, p = .13, η2 = .05 (Fig. 4b), and we did not find a significant RT benefit for related sounds (Ms = 2,008 vs. 2,037 ms), t(39) = 1.73, p = .09, Cohen’s dz = 0.27, 95% CI = [-0.073, 0.619], BF01 = 1.50 (Fig. 4c). Preplanned t tests of report error further demonstrated that error on unrelated trials was not significantly different from error on sound A trials, t(39) = 1.19, p = 0.24, Cohen’s dz = 0.18, 95% CI = [-0.593, 0.968], BF01 = 3.04, or sound B trials, t(39) = 0.64, p = .53, Cohen’s dz = 0.10, 95% CI = [-0.725, 0.927], BF01 = 4.84. We also compared the small effect of sound that we found in Experiment 3 with that found in Experiment 1b and submitted error to an ANOVA. Here, we found no main effect of experiment, F(1, 78) = 0.18, p = 0.67, η p 2 < .01), a main effect of sound, F(1, 78) = 24.04, p < .0001, η p 2 = .24, and a significant interaction, F(1, 78) = 4.21, p = .0435, η p 2 = .05.
Thus, the effects observed in Experiment 1b were above and beyond the small (and unreliable) effect observed in Experiment 3. Furthermore, the observed effect sizes across experiments, further support this: The average effect size (dz) of report error for Experiment 3 was 0.13, and for Experiments 1a, 1b, and 2b, effect sizes (dzs) ranged from 0.3 to 0.59. Overall, these results suggest that the effects we observed in Experiments 1a and 1b and Experiment 2b were largely driven by the continuous presentation of sight and sound and less so by attentional mechanisms or other top-down goals and expectations. This reinforces previous findings stressing the importance of the temporal overlap of incoming audiovisual stimuli, as predicted by multisensory integration accounts (Chen & Spence, 2011b, 2018a; Colonius & Diederich, 2004; Meredith et al., 1987; van Atteveldt et al., 2007).
Discussion
Our results suggest that naturalistic auditory information alters the representations of objects we see. Specifically, we found that visual features of object representations are shifted toward features that are congruent with a concurrent auditory stimulus: The same ambiguous object (e.g., a 50% seal and 50% hammer morph) was perceived as more hammer-like when paired with a hammer sound and more seal-like when paired with the sound of seal barking. In a series of control experiments, we demonstrated that these cross-modal effects are not due to biases at decision nor response stages (Experiments 2a and 2b), nor is explicit semantic knowledge about the sounds sufficient to elicit these effects (e.g., volitional search for specific features; Experiment 3). Instead, sounds exert a reliable effect on visual perception only when both stimuli overlap temporally. Additionally, and broadly consistent with other research on this topic, our findings revealed that the sounds hasten the accumulation of related visual information, resulting in faster RTs for related, relative to unrelated, audiovisual inputs.
How might sounds exert influences over visual perception? In the natural world, sounds are causally predictive of the object that generated them—cats cannot bark, for example—and thus, sounds provide independent and informative cues about the visual world. This reliable and highly predictive relationship between audiovisual events can drive changes in early visual processing regions of the brain (van Atteveldt et al., 2014), leading to selective processing of relevant visual features. Previous work has shown that auditory information can rapidly affect the earliest stages of visual processing (Giard & Peronnet, 1999), that auditory and visual signals are integrated in a near-optimal way (Alais & Burr, 2004; Aller & Noppeney, 2019; Burr et al., 2009), that predictive relationships between stimuli lead to a selective reweighting of probabilistically relevant features (Bell et al., 2016; de Lange et al., 2018; Kok et al., 2012), and that these effects are largely driven by previous experience (Gau & Noppeney, 2016; Seriès & Seitz, 2013; Stocker & Simoncelli, 2006). For example, Kok and colleagues (2012) showed that when sensory information predicts an event, processing of probabilistically irrelevant features is suppressed relative to relevant features—those that are more likely to be observed—ultimately sharpening the processing of relevant sensory information. Taken together, these results led us to hypothesize that the clear sounds presented in our study exerted a strong influence over early visual processing, which led to a selective modulation of visual features that were inferred to come from the same generative object (i.e., ambiguous features are presumed to be dog-like when co-occurring with the sound of a barking dog). This suggests that naturalistic sounds do not simply hasten visual perception but that this speed decrease may be the result of shifting perceptual representations toward expected visual features. Additionally, within this framework, such sharpening of sensory processing can also lead to a facilitation of visual feature extraction for expected features, as evidenced by faster RTs for related relative to unrelated sounds.
Another possible source of this effect may be that high-level semantic knowledge influences visual perception (Chen & Spence, 2011a). For example, presenting linguistic labels prior to a visual object has been shown to boost perceptual processing (Lupyan & Ward, 2013). However, the present results are inconsistent with the hypothesis that activating semantic knowledge underlies the perceptual changes we observed here, because the semantic content of real-world sounds alone did not reliably shift perceptual representations (Experiment 3). Our results support the more implicit and low-level process of probabilistic inference (Seriès & Seitz, 2013), where the purported effects of semantics and top-down goals on visual perception operate through separate mechanisms (Cox & Hong, 2015; Gordon et al., 2019; Helbig & Ernst, 2008). Furthermore, finding that audiovisual events need to overlap temporally to exert an effect is also in line with the notion that the learned structure from the world—here, that sounds are exclusively produced by appropriate objects and that audiovisual events co-occur in time—influences how we perceive novel sensory information (Summerfield & Egner, 2009).
Our results broadly relate to work that has shown influences of auditory context on visual-perceptual processing for realistic objects. However, in previous work, the crossmodal facilitation of visual perception (a) was often observed after explicit familiarization or training with the audiovisual stimuli; (b) was often observed with a task that required participants to report whether the sound and image were congruent, thus examining RT and accuracy rather than perceptual biases; and (c) typically involved rapid presentation of the visual stimulus—where some trials might represent uncertain or low-confidence perception, possibly resulting in biases or specific response strategies (Chen & Spence, 2011a, 2018b; Schneider et al., 2008). Here, we avoided these potential limitations and designed a task with a unique stimulus set that allowed us to measure more naturally occurring crossmodal effects and assess the perceptual representations themselves. In particular, (a) participants received no training and had no direct experience with the experimental stimuli prior to participating; (b) the task entailed and encouraged participants to accurately report the visual target irrespective of the audiovisual relationship, thus avoiding potential congruency biases; and (c) participants were in control of the amount of visual information they accumulated, thus allowing us to more confidently assume that participants had sufficient visual information to complete each trial accurately. Importantly, this last point demonstrates that this crossmodal effect is not limited to especially noisy perceptual representations, nor are they the product of uncertainty at response (especially because participants were encouraged on every trial to keep their error as low as possible), suggesting that well-formed perceptual representations are nonetheless influenced by auditory context.
Overall, our findings demonstrate that the ongoing perceptual processing of novel and ambiguous stimuli is altered by related auditory context such that the ultimate perceptual representation is shifted toward sound-congruent features. Our results favor a multisensory rather than a decisional or strategic account, in which visual and auditory information are continuously integrated such that inputs from one modality—in our case audition—trigger inferences about the world that the visual system uses to interpret concurrent ambiguous information. Most broadly, our study demonstrates the importance of investigating visual processing as an integrative rather than an isolated process (Körding et al., 2007) and that multisensory integration plays a critical role in forming visual object representations.
Footnotes
Acknowledgements
We thank Timothy Brady, Edward Vul, Maria Robinson, and Jonathan Keefe for their helpful conversations, comments, and suggestions.
Transparency
Action Editor: Rachael Jack
Editor: Patricia J. Bauer
Author Contributions