
Abstract
The current work estimated the relative importance of joke and audience characteristics for the occurrence of amusement. Much psychological research has focused on stimulus characteristics when searching for sources of funniness. Some researchers have instead highlighted the importance of perceiver characteristics, such as dispositional cheerfulness. Across five preregistered studies (Ns = 118–54,905) with varied stimuli and perceiver samples (website visitors, students, Mechanical Turk and Prolific users), variance-decomposition analyses found that perceiver characteristics account for more variance in funniness ratings than stimulus characteristics. Thus, psychological theories focusing on between-persons differences have a relatively high potential for explaining and predicting humor appreciation (here, funniness ratings). Crucially, perceiver-by-stimulus interactions explained the largest amount of variance, highlighting the importance of fit between joke and audience characteristics when predicting amusement. Implications for humor-appreciation theories and applications are discussed.
Keywords
Humor profoundly affects our emotions (Ford et al., 2016; Fritz et al., 2017), social life (Treger et al., 2013; Wilbur & Campbell, 2011), and health (Martin, 2004; Romundstad et al., 2016). Research forwards both material and audience characteristics as determinants of amusement, while their relative importance remains unknown. For theories and practitioners to accurately predict amusement, we need to understand the relative importance of material and audience.
According to Martin and Ford (2018), humor is
a broad, multifaceted term that represents anything that people say or do that others perceive as funny and tends to make them laugh, as well as the mental processes that go into both creating and perceiving such an amusing stimulus, and also the emotional response of mirth involved in the enjoyment of it. (p. 3)
Many theories attempt to distinguish humorous from nonhumorous stimuli (e.g., McGraw & Warren, 2010). However, most theories do not explicitly state to what extent humor appreciation is attributable to the material, the observer, or their interaction. We used a variance-decomposition approach (Krueger, 2009) to disentangle the potential of these three components to explain variation in perceived funniness. The dimension of funniness (next to boringness and offensiveness) forms part of the overarching concept of humor appreciation (i.e., the evaluation of humorous stimuli; Heintz, 2020; Ruch & Rath, 1993).
Some research suggests that “funniness” can be attributed to specific content or structural qualities of jokes. Incongruity is often described as necessary for something to be humorous, meaning that a stimulus must entail a seeming inconsistency with one’s cognitions that can be resolved by understanding (“getting”) the joke (for reviews of cognitive incongruity and violations in humor, see Warren et al., 2021). Another assumption is that humorous material must be understandable to be funny (Cunningham & Derks, 2005). Further, early theories argued that humor serves as a valve for suppressed urges (Ferguson & Ford, 2008); accordingly, sexual and aggressive content should heighten the amusement felt in response to jokes (McCauley et al., 1983; Wilson & Molleston, 1981; but see Herzog et al., 2006; Ruch & Hehl, 1988). Other work suggests that humor appreciation stems from surprise (Fearman, 2014; Jääskeläinen et al., 2016; Pollio & Mers, 1974; but see Warren et al., 2021) and the extent to which stimuli have a high elaboration potential (Wyer & Collins, 1992).
At the same time, other research has emphasized that audience characteristics play a significant role in determining humor success (Carrell, 1993). Some people seem “humorless” or difficult to amuse (Hofmann et al., 2018; Ruch, 2007b). This variation between people has genetic as well as environmental roots (Vernon et al., 2008). Trait cheerfulness, one’s temperamental disposition toward humor, also captures individual differences in humor appreciation (Ruch et al., 2019). Various measures have been developed, including measures of general and content-specific humor appreciation (e.g., Carretero-Dios & Ruch, 2010; Ruch et al., 1997). Gelotophobia entails dispositional loathing of laughter, which also predicts experienced amusement (Ruch et al., 2009). Other between-persons differences in humor appreciation stem from people’s situational mindset and mood (e.g., Gervais & Wilson, 2005; Ruch et al., 1997; Wicker et al., 1981) and more stable dispositions such as emotional intelligence, extraversion, and sensation seeking as well as political and moral beliefs (Carretero-Dios & Ruch, 2010; Gignac et al., 2014; Yam et al., 2019). In sum, numerous dispositional and situational tendencies of audience members affect whether humorous material will be met with either amusement and laughter or unease and silence.
Last, amusement might stem primarily from the fit between stimulus and perceiver characteristics. The main effects of humor materials are often moderated by perceivers’ knowledge, dispositions, or attitudes. For instance, some people are equipped to enjoy complex jokes, whereas others find them neither understandable nor enjoyable (Cunningham & Derks, 2005). Similarly, there are audiences for which humorous aggression reliably works well and others for which it does not (Swani et al., 2013). The benign violation theory (McGraw et al., 2010) states that attempts at humor are generally perceived as funny if they constitute benign violations of a perceiver’s expectations. Given that people hold different expectations (and employ different thresholds for benignity), the interaction between audience and material lies at the core of current humor theories (Warren et al., 2021). Colloquially, the preference for certain types of humorous stimuli is often referred to as a personal sense of humor. However, sense of humor is also used to describe the overall tendency to enjoy humor, the ability to create humor, and general temperament and resilience in dealing with adversity (Ruch, 2007a). Critically, this term can entail a muddling of perceiver main effects and perceiver-by-stimulus interaction effects on amusement.
Statement of Relevance
When attempting a joke, you likely ask yourself, “Will the person in front of me laugh?” At least three factors are at play: the joke (e.g., is it funny?), the listener (e.g., how do they usually respond to humor?), and their interaction (e.g., is there a match between joke content and listener taste?). Here, across a variety of archival and new studies, we assessed which factor is the most important when predicting the success of your joke. Results consistently showed that the quality of the joke was the least informative because humor tastes vary immensely across people. Most important was the match between joke content and listener preferences, but the overall tendency of a person to respond positively was also relatively important. Thus, you should know your audience rather than trying to find the best joke in the world.
We used a variance-decomposition approach to test how predictive the three potential sources of amusement variance are: material, perceiver, and their interaction. Being able to estimate the relative importance of these sources of amusement is beneficial for at least three reasons. First, future research efforts and theorizing could target components in accordance with their explanatory power. Second, machine-learning models and humor recommendation systems could be set up using the optimal set of predictor variables. Last, the plentiful humor theories could be categorized or weighed in line with the importance of their key ingredients.
Studies 1 to 4
Method
In the first set of studies, samples of participants rated the funniness of various humor stimuli. All samples were collected from the original authors of the respective studies (see Table 1). The sample in Study 1 consisted of adult, English-speaking Amazon Mechanical Turk workers (age: M = 35.37 years, SD = 11.74; 58% female, 42% male) who rated the funniness of single English words. The sample in Study 2 consisted of all visitors to a joke-rating website. Their demographic data were not tracked. The samples in Study 3 (age: M = 20.8 years, SD = 4.70; 69% female, 31% male) and Study 4 (age: M = 18.81 years, SD = 1.22; 59% female, 35% male) consisted of university students who rated the funniness of cartoons and videos, respectively.
Stimulus and Sample Specifications for Studies 1 to 4
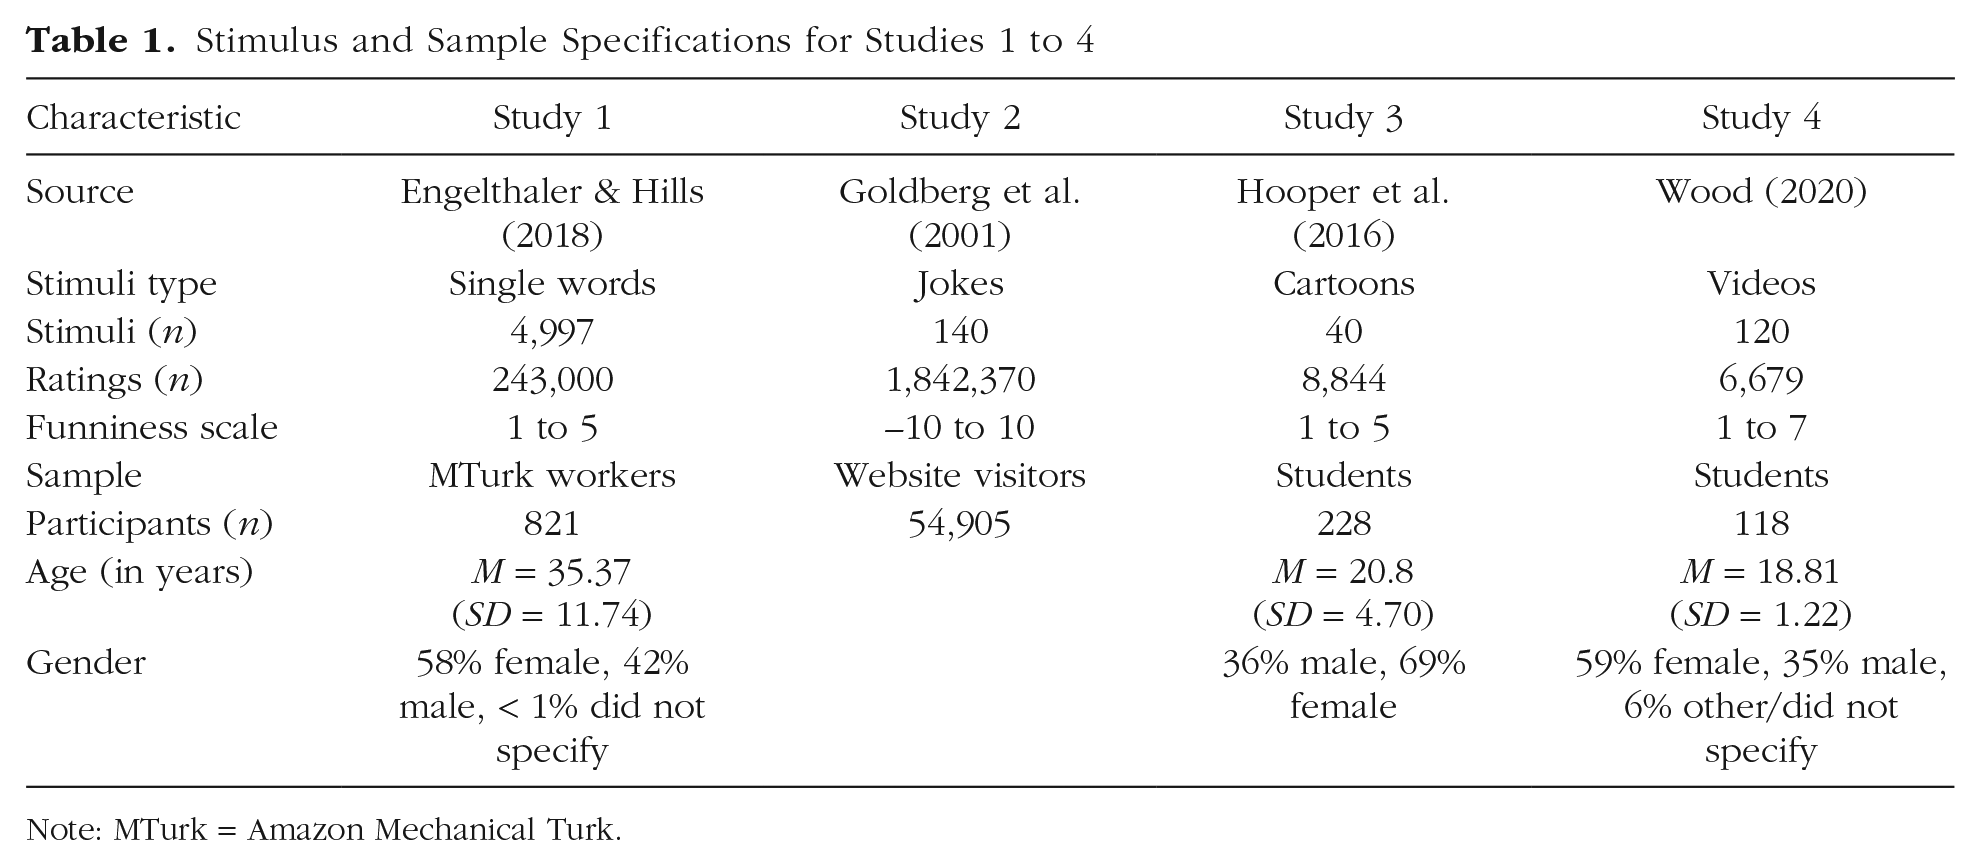
Note: MTurk = Amazon Mechanical Turk.
Throughout all studies, we predicted that rater characteristics would be more predictive of amusement than joke characteristics given the low interrater reliabilities (i.e., high interrater variance in humor ratings) observed in past research (Nusbaum et al., 2017). The steady decline in simplistic theories on what makes things funny (Warren et al., 2021) compared with the endurance of perceiver characteristics in the literature (Heintz, 2019) speaks to this hierarchy.
We used four published data sets that employed crossed (Rater × Stimuli) designs to isolate variance in amusement due to rater characteristics from variance due to material characteristics. These studies included different types of stimuli (text, cartoons, videos, and single words) and participants (both student and online samples; see Table 1).
The supplementary materials (see https://osf.io/t69jd/) include histograms of funniness ratings for each study, which do not display evidence of floor or ceiling effects for the stimuli and thus have enough variance to be analyzed. Many ratings toward the extremes of the scales could have suppressed the importance of stimuli differences for amusement. For each data set, we fitted multilevel models with random intercepts per rater and stimulus. These models allowed us to estimate the variance in funniness ratings accounted for by differences between materials and differences between perceivers, respectively. Our hypotheses and analyses were preregistered at https://osf.io/t69jd/.
Results
For each data set, we fitted the multilevel models 500 times using bootstrapped samples of perceivers and jokes. Table 2 depicts the amount of funniness variance predicted by perceivers and materials as well as the difference between both estimates and 95% confidence intervals (CIs). Variance from interaction effects cannot yet be quantified in this set of studies because they require repeated exposure of the same participant to the same stimuli (Hehman et al., 2017).
Results From Multilevel Models in Studies 1 to 4
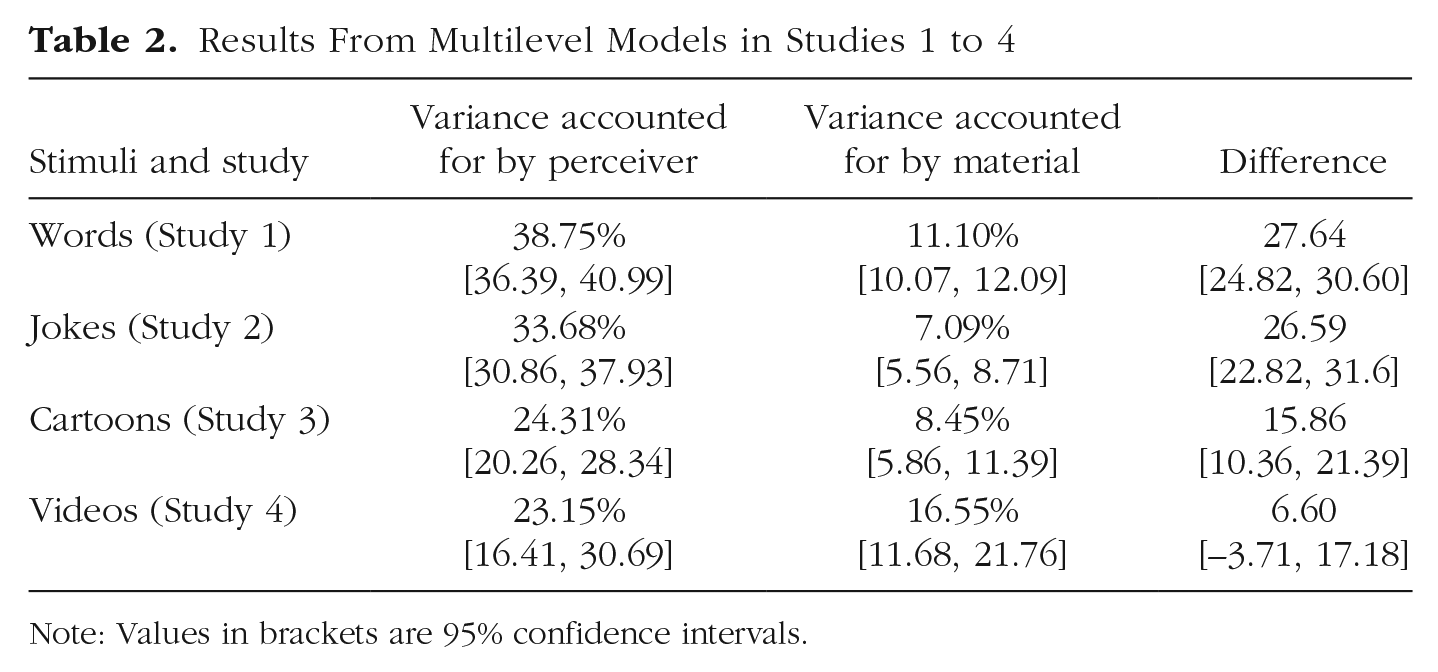
Note: Values in brackets are 95% confidence intervals.
Figure 1 displays the relative predictive power of perceiver characteristics (top heat map) and joke characteristics (bottom heat map) when predicting reactions of individuals to specific jokes.
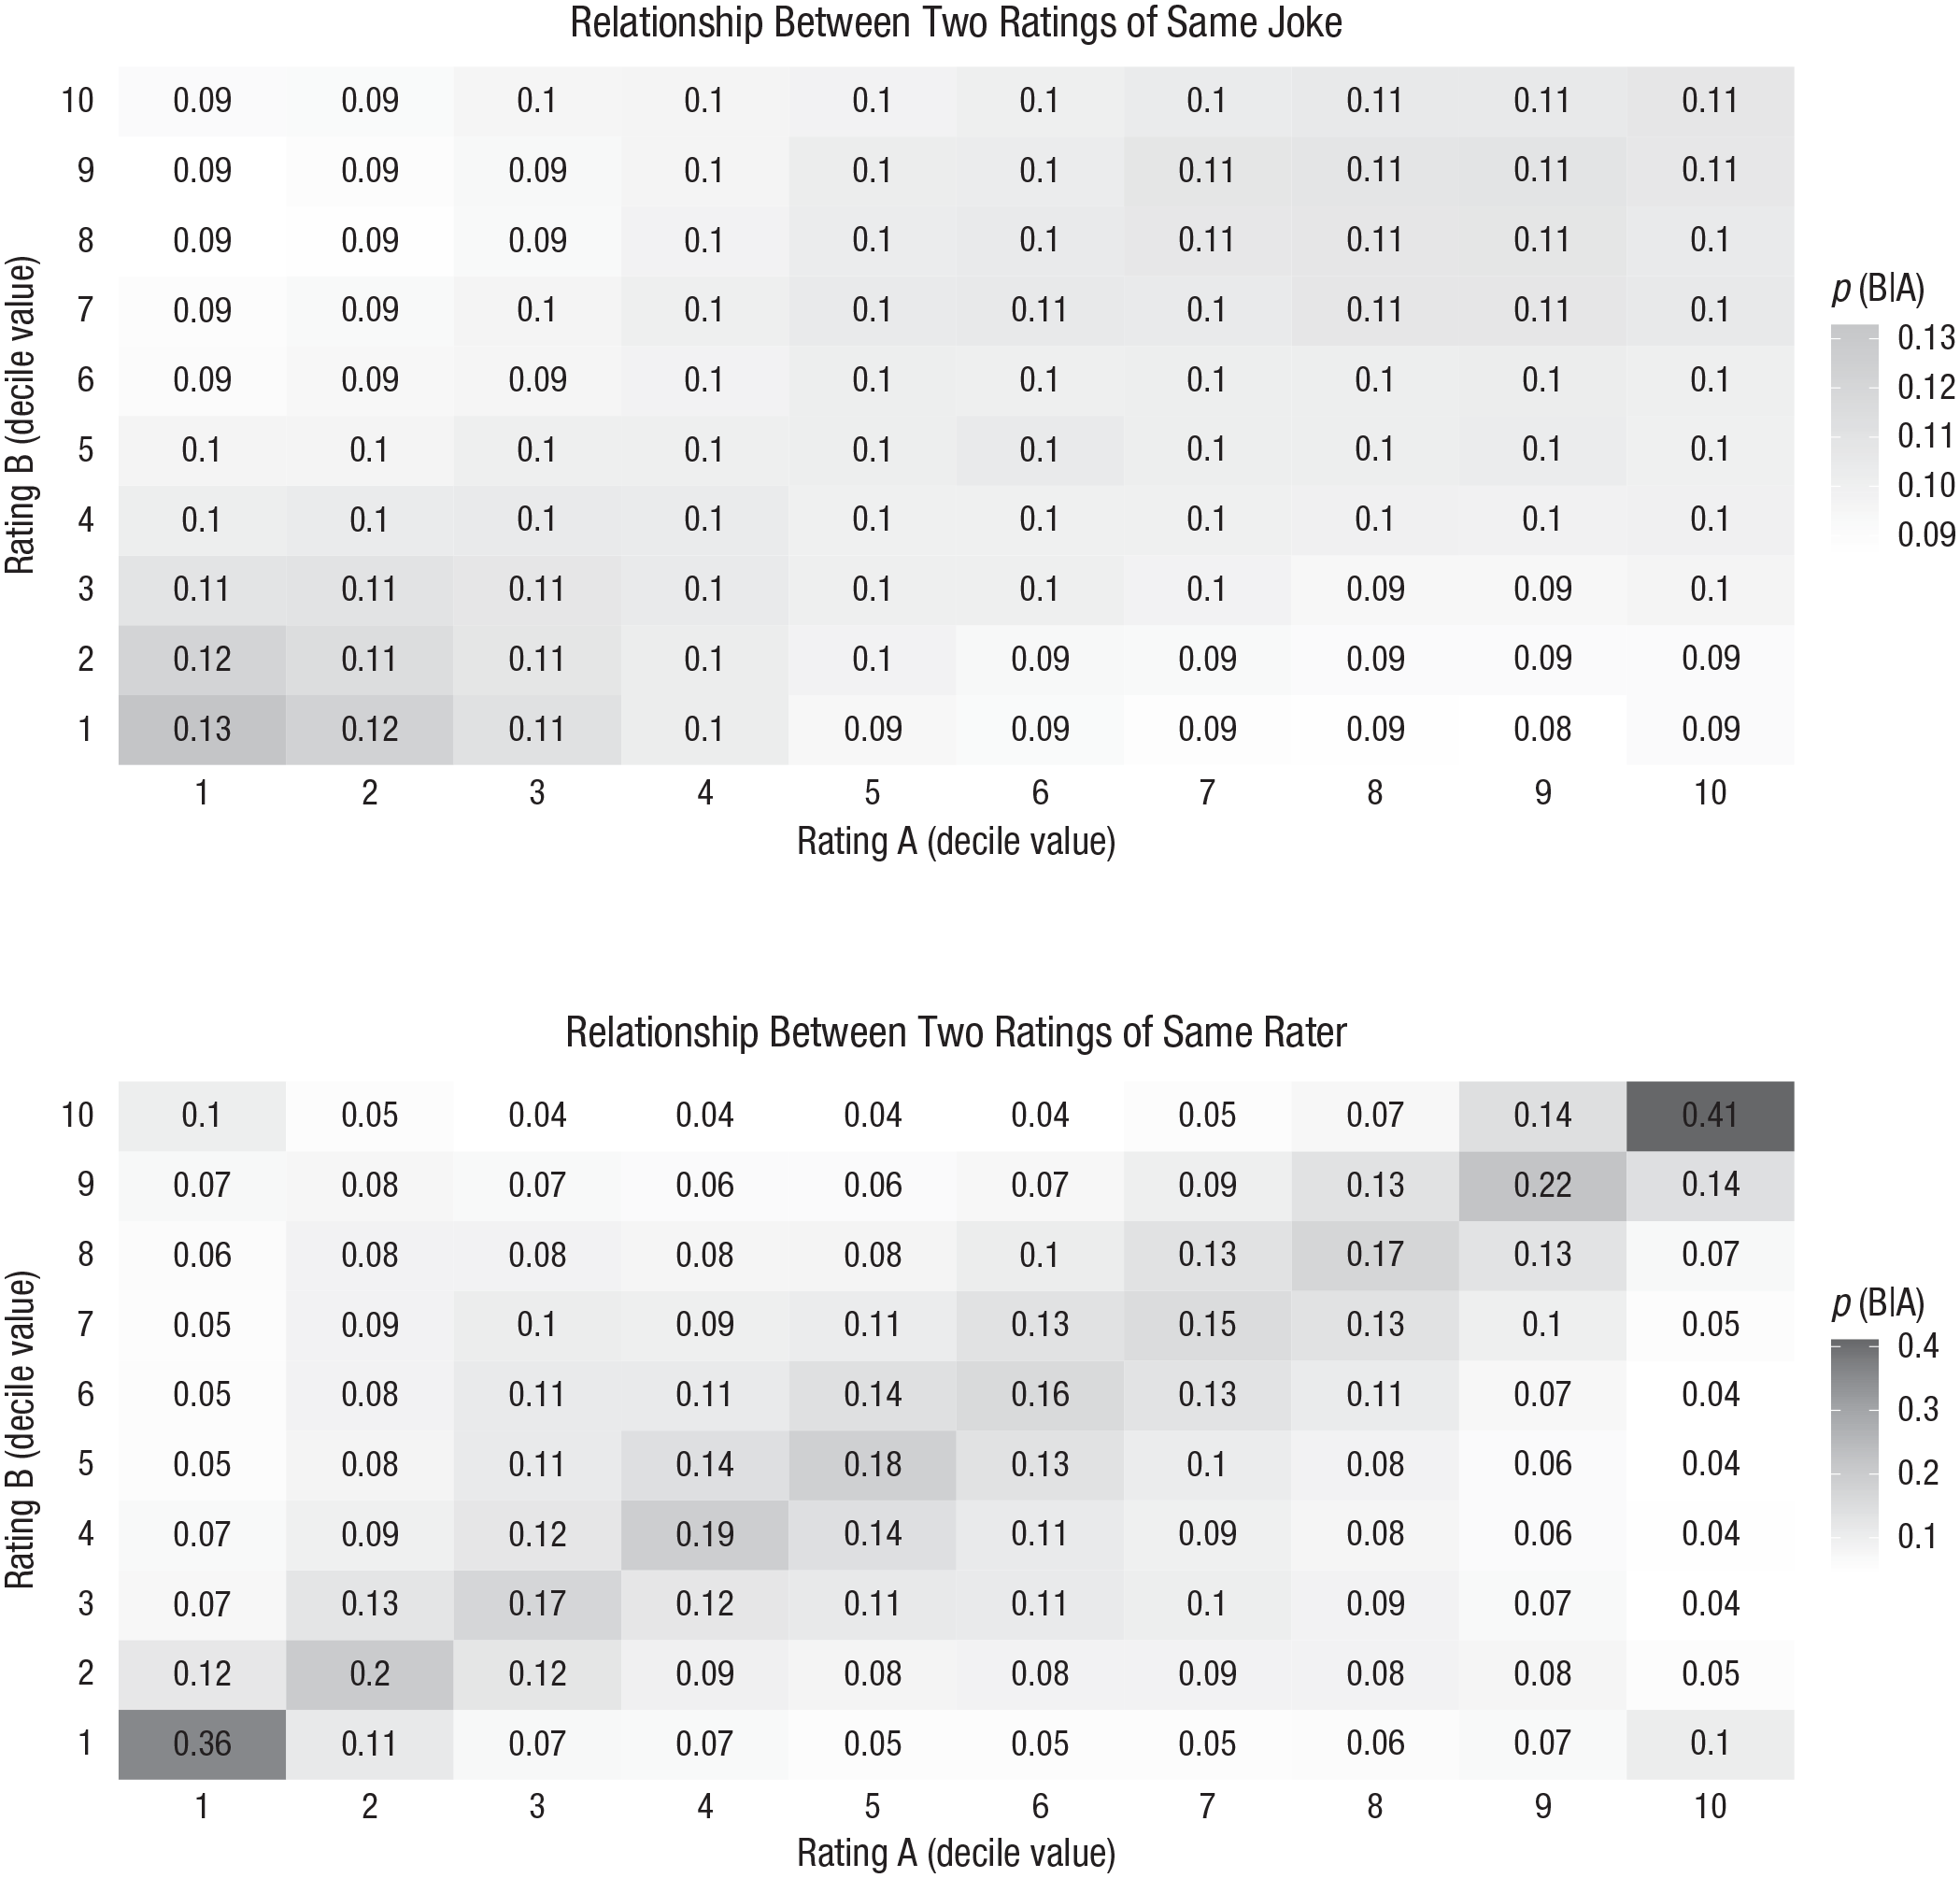
Power of perceiver characteristics and joke characteristics when predicting reactions of individuals to specific jokes (Study 2). The probability of rating B given rating A of the same humor stimulus is shown in the top heat map. As an example, look at cell (10, 10). The value is .11, meaning that if a random Rater A scored this joke a 10, there was a probability of .11 that a randomly selected Rater B also scored it a 10. The probability of rating B given rating A by the same rater is shown in the bottom heat map. As an example, look at cell (10, 10). The value is .41. That means that if Rater A scored a joke a 10, there is a probability of .41 that this rater scored a different randomly selected stimulus also a 10. (For heat maps for all individual data sets, see the supplementary material at https://osf.io/t69jd/.)
Discussion
Studies 1 to 4 found that rater characteristics have stronger relationships to funniness ratings than material characteristics. Thus, when a person’s reported amusement is predicted, it is generally more important to know who does the rating than what the joke is. The importance ratio varied considerably; rater differences were between 4.8 and 1.4 times more important than stimuli differences. We anticipated that information-rich humor formats (videos) might reduce the gap in importance by being able to affect ratings through additional features (e.g., audio, movement). Conversely, minimalistic stimuli such as single words or short jokes put relatively more strain on the perceiver to adopt a humorous mindset and “find the funny” in the material. Although we preregistered this expected difference for video stimuli, we did not anticipate that the CI for the difference between rater and material effects in Study 4 would include zero. In this regard, it is also important to note that Study 4 offered the smallest statistical power as evidenced by the larger CIs. Study 5 was designed to address this and other limitations.
Study 5
In this last study (preregistration: https://osf.io/t69jd/), we addressed three limitations of the previous analyses. First, statistical power was limited in Study 4 and somewhat limited in Study 3. Second, we could not quantify the predictive power of perceiver-material interactions from the existing data because they require repeated funniness ratings. Third, the rater samples and the stimuli samples were relatively homogeneous within studies, which is a good representation of humor research but neglects the diversity of both comedic materials and audiences in everyday life. This is a clear limitation for variance-decomposition studies because they require stimuli and rater samples that are representative of a wide range of humor situations. To address this lack of diversity, we obtained (repeated) ratings of a diverse set of stimuli by a relatively diverse participant sample from Prolific.co. We actively tried to maximize the diversity in stimulus formats, contents, and appreciation by online audiences. Despite that, we maintained our prediction that rater differences would be more predictive of funniness ratings than stimulus differences, whereas the importance ratio would likely lie toward the low end of the spectrum from the previous analyses. Given its dominance in current humor-appreciation theories, we predicted that the perceiver-by-stimuli interaction would be most predictive of amusement.
Method
The data collection was approved by the ethics committee of the first author’s research organization. As in the previous studies, raters were presented with humorous materials, which they rated according to perceived funniness on a 7-point scale ranging from not funny at all to very funny. The rating procedure was repeated after 3 weeks. We estimated 3 weeks to be sufficient for participants to forget their numerical responses from the first wave, thereby preventing mindless answer repetition.
Participants
All 911 participants were recruited on Prolific.co in January and February 2021. Participants needed a 90% approval quota on their previous studies and English as their first language. Preregistered exclusion criteria were that participants watched the videos with audio (21 exclusions), did not have technical issues with more than two stimuli (three exclusions), and passed an attention check about the content of the last shown video (76 exclusions). The remaining sample of 811 participants included 518 women, 289 men, two people identifying with a different gender, and two people preferring to not answer (age: M = 35.31 years, SD = 12.68). During the second wave of ratings, we managed to re-recruit 555 participants passing the same exclusion criteria again. In both waves, each participant evaluated the same sub-batch of 35 stimuli. The total number of ratings was 85,785.
Material
We collected 105 different humorous materials from different websites, social media portals, video channels, and books (see supplementary materials at https://osf.io/t69jd/). To maximize the diversity of the stimuli, we used 35 stimuli per format (text, image, or video/gif), respectively. Each format included stimuli from seven different humor categories suggested in the past (Martin et al., 2003; Ruch, 1992). These categorizations include self-defeating, affiliative, aggressive, self-enhancing, sexual, incongruity-resolution, and nonsense humor. Note that most stimuli fell into multiple categories (e.g., at least one content and structure category) because everyday humor usually combines different dimensions (e.g., a sexual joke with an incongruity-resolution structure that aggressively targets a specific person). Interstimulus correlations and latent factors were computed using the “example script factor analysis.R” script at https://osf.io/t69jd/. A categorization of the stimuli by us and two independent researchers can be found in the supplementary material (https://osf.io/t69jd/) and was conducted to ascertain that no humor dimensions are absent from the corpus. In 100 out of 105 cases, the coraters reproduced the label assigned by the authors. This supports the assessment that the selection of stimuli is fairly diverse. The stimuli include knock-knock jokes, memes, fail videos, celebrity interviews, political and artistic content, musical comedy, talk shows, movies, sitcoms, nonsensical texts, cartoons, standup comedy, puns, riddles, roasts, interactions with animals, jokes about group stereotypes, jokes about science, pickup lines, humorous tweets, and bloopers. Next to diverse formats and contents, we actively sought out stimuli with different levels of success as indicated by upvotes/downvotes on social media, rankings on joke websites, and commercial success (e.g., professional productions vs. non-viral video content). Notice that the diversification of stimuli regarding success on Internet forums actively avoids floor and ceiling effects while stacking the deck against our previous finding that stimuli differences explain less funniness variance than rater differences.
Results
We fitted a multilevel model predicting funniness ratings using random intercepts for perceivers, stimuli, and perceiver-stimulus pairs 500 times using bootstrapped samples of perceivers and stimuli. The average variance accounted for by perceivers was 20.05% (2.5th percentile = 18.22, 97.5th percentile = 21.91), whereas differences between stimuli accounted for 13.07% (2.5th percentile = 9.96, 97.5th percentile = 16.57). The differences between both values were on average 6.99 percentage points (2.5th percentile = 2.80, 97.5th percentile = 11.20). The unique interactions between raters and stimuli predicted 34.84% of funniness variance (2.5th percentile = 33.16, 97.5th percentile = 36.46). The difference in predictive power between rater characteristics and interaction characteristics was 14.79 percentage points (2.5th percentile = 12.30, 97.5th percentile = 17.47). The difference in predictive power between stimulus characteristics and interaction characteristics was 21.77 percentage points (2.5th percentile = 16.74, 97.5th percentile = 25.95).
Discussion
Again, rater characteristics were better predictors of funniness than the nature of the humorous material. As predicted, the difference was on the low end of the spectrum because we actively diversified the quality of the materials. Most importantly, Study 5 highlights that, despite being prominently discussed, neither rater nor stimuli effects are the most insightful when it comes to predicting amusement. Rather, it is their interaction that predicts humor appreciation. Some jokes are relatively good and some audiences are relatively easy, but most notably, certain jokes work well for certain audiences.
General Discussion
What is at the root of amusement: the joke, the audience, or their interaction? Raskin (1998) observed that “a typical humor theory . . . tends to ignore the differences between various senses of humor, striving instead to learn the nature of the funny” (p. 96). The current work points out that such theories focus on the least informative part of a humorous experience: the material. Personality psychologists focus instead on differences between audiences, which we indeed found to be more predictive of funniness ratings. The most recent humor theories sacrifice some of the parsimony of earlier approaches by highlighting (sometimes implicitly) interactions between humor and rater characteristics (e.g., Martin et al., 2003; McGraw & Warren, 2010). According to the current results, these newer humor theories are the most promising approach for providing the most accurate predictions of amusement. For instance, when designing humor recommendation systems (e.g., for an app or social media platform), researchers must decide a priori which predictors will optimize laughter and amusement. The current work empirically supports interactionist theories forwarding that the best predictor variables will unite information from specific audiences and specific stimuli. Conversely, content theories focused on finding key ingredients that make humor stimuli reliably funny should be deemphasized because they are likely to perform poorly in the wild.
Past efforts sometimes muddled findings from different levels of analysis, which potentially contributed to suboptimal allocations of research efforts. Ruch (1995) demonstrated that decisions to aggregate and correlate responses to humor across subjects, stimuli, neither, or both affect numerical results and their meaning, which can explain seeming inconsistencies in published work. Similarly, applied studies using machine-learning methods to predict amusement have ignored interaction and rater-level predictors or tried to minimize their effects by aggregating responses of different raters (e.g., Shahaf et al., 2015). Our analyses suggest that they miss out on substantial gains in insight and prediction accuracy. Standardizing humor interventions for health or social bonding is equally daunting because it ignores audience characteristics and potential mismatches between joke characteristics and preferences of the audience. Relatedly, comedians regularly report the difficulty of avoiding “bombing” with their well-rehearsed programs by trying to adjust to the present audience.
Albeit informative, audience-level predictors are often relatively difficult to assess or use in practice. Humorous material contains only a few bytes of readily accessible and easily encodable information (e.g., topic, length, word choice), whereas a single audience member is filled with insurmountable volumes of relevant but often unknown variables (e.g., “Do they like Donald Trump?” “Are they vegan?”). Thus, it is relatively challenging to “know your audience” and use that knowledge toward predicting amusement. To this end, humor-appreciation researchers have accumulated empirical findings on specific audience-by-stimulus interactions (for a list, see the supplementary materials at https://osf.io/t69jd/). The aforementioned benign violation theory condenses these interactions to personal assessments of benignity and violation. This condensation can potentially simplify assessments in a practical context. However, it is to be verified whether it preserves the predictive power of audience-by-stimulus interactions observed in the current work.
Limitations and future research
Sample and stimuli selection can drive findings in variance-decomposition studies. For instance, if we had included nonhumorous stimuli (e.g., news articles), the focal research question would gradually shift from “What determines funniness ratings of humor stimuli?” to “What determines funniness ratings of stimuli?” which would have boosted the variance accounted for by stimuli differences. Thus, the findings observed here (and generally in variance-decomposition studies) must always be interpreted under consideration of the targeted rater and stimuli populations. Further, we concentrated exclusively on performance humor, which can be employed and repeated across different social situations. In everyday life, the high ratio of spontaneous, social laughter to solitary laughter speaks strongly to the central role of social context in amusement (Addyman et al., 2018; Dezecache & Dunbar, 2012). Isolating the social context as an additional source of variance requires substantial investments. Specifically, it requires multiplying the (already large) number of ratings by the number of social contexts, each of which is designed and realized in a standardized way by the researchers. Thus, adding a social level to the current variance-decomposition approach is challenging. However, such challenges will need to be tackled to extend the current analyses from performance humor to spontaneous, social forms of humor, perhaps by first varying a few social variables that are known to be impactful (e.g., social identities of joke tellers and perceivers; Lynch, 2010). Further, the current work serves as a blueprint for prominently discussed questions about other facets of humor appreciation, such as “How much of the variation in offensiveness ratings is due to interstimulus versus interrater differences?”
Conclusion
Some attempts at humor are better than others. However, differences between perceivers ultimately play a larger role in determining amusement. More important yet is the interaction between humor characteristics and audience characteristics. By honoring this hierarchy of explanatory power in future studies and theories, psychological science can spur on the personalization of humor experiences in the real world rather than the search for the perfect joke.
Footnotes
Transparency
Action Editor: Paul Jose
Editor: Patricia J. Bauer
Author Contributions
The conceptualization, investigation, methodology, project administration, resources, software, validation, writing of the original draft, writing of the revisions, and editing were done by H. Rosenbusch, A. M. Evans, and M. Zeelenberg jointly. H. Rosenbusch did the formal analyses, data curation, and visualization. A. M. Evans and M. Zeelenberg did the supervisory tasks. All the author approved the final manuscript for submission.