
Abstract
One of the most robust effects in cognitive psychology is anchoring, in which judgments show a bias toward previously viewed values. However, in what is essentially the same task as used in anchoring research, a perceptual illusion demonstrates the opposite effect of repulsion. Here, we united these two literatures, testing in two experiments with adults (total N = 200) whether prior comparative decisions bias cognitive and perceptual judgments in opposing directions or whether anchoring and repulsion are two domain-general biases whose co-occurrence has so far gone undetected. We found that in both perceptual and cognitive tasks, anchoring and repulsion co-occur. Further, the direction of the bias depends on the comparison value: Distant values attract judgments, whereas nearby values repulse judgments. Because none of the leading theories for either effect account for both biases, theoretical integration is needed. As a starting point, we describe one such joint theory based on sampling models of cognition.
Keywords
Much research in decision-making has investigated how judgments may be biased by preceding experience, but there is a disconnect between the cognitive and perceptual literatures on this subject that we believe has thus far gone unnoticed. On one hand, research in cognitive psychology has found anchoring, in which preceding a judgment with some arbitrary value can pull subsequent responses toward that value: For example, estimates of the percentage of African countries in the United Nations were higher when participants first judged whether this value was above or below a high comparison value and lower when first judged against a low comparison value (Tversky & Kahneman, 1974). Such effects have subsequently been widely replicated, and similar results have been found for related, incidental, and self-generated anchor values (Ariely et al., 2003; Chapman & Johnson, 1994, 1999; Epley & Gilovich, 2006). On the other hand, more recent research in perceptual tasks has used a similar paradigm but found an opposing effect: Preceding perceptual judgments with similar comparative decisions has been observed to lead to a repulsion from the given decision boundary. For example, deciding whether a set of moving dots is traveling clockwise or counterclockwise from a given reference line leads subsequent judgments of the true direction to be further from the reference than equivalent judgments without such a comparison (Jazayeri & Movshon, 2007; Zamboni et al., 2016).
These two sets of findings then present an apparent contradiction: In some cases, judgments are pulled toward decision values, whereas in others, they are pushed away. A key question then is how these two effects relate to one another: Why would similar decisions lead to different effects in these tasks? Despite the correspondence between these paradigms, there has been very little acknowledgment of these divergent findings; although some work has investigated similar concepts in preferential choice in reaction to the addition of new alternatives (Tsetsos et al., 2010; Turner et al., 2018), to our knowledge, there has not yet been any comparison of these effects in more basic direct estimation tasks. 1
Indeed, although multiple explanations have been offered for both anchoring and repulsion, the separation between these literatures means that these theories have thus far remained independent of one another: Accounts for one effect do not predict the other. In the case of anchoring, a common explanation is that the comparison value is used as a starting point for the subsequent judgment and adjusted until an “acceptable” answer is reached (Epley & Gilovich, 2006; Jacowitz & Kahneman, 1995; Lichtenstein & Slovic, 1971; Simmons et al., 2010; Tversky & Kahneman, 1974). More recently, this has been formalized using statistical sampling algorithms (Lieder et al., 2018) based on the suggestion that such effects result from a rational trade-off between time and accuracy: Further adjustment may produce more accurate judgments but may not be worth the additional effort incurred. Alternative accounts propose that the anchor activates relevant information to direct responses to the comparison that are then reused in judgments (Chapman & Johnson, 1999; Mussweiler & Strack, 2000; Strack & Mussweiler, 1997), that the comparison is treated as a cue toward the correct answer (Schwarz et al., 1991), and that anchors distort the scale used to select responses (Frederick & Mochon, 2012; Mochon & Frederick, 2013).
Repulsion, meanwhile, has been attributed to a reweighting of sensory information to aid the initial comparison, which then favors signals further from the boundary in the subsequent judgment (Jazayeri & Movshon, 2007), or a truncation of beliefs following decisions to ensure that judgments are consistent with that choice (Luu & Stocker, 2018). We ourselves have previously offered an explanation for repulsion based on adaptive stopping of a mental sampling process: Beliefs are sampled until there is substantial evidence for one alternative over the other in the initial comparison, resulting in a bias away from the comparison boundary (i.e., indifference) in the samples and, therefore, any estimates based on these samples (Zhu et al., 2019).
Here, we sought to bridge the gap between these literatures by examining the connection, or lack thereof, between anchoring and repulsion and what this suggests for models of human judgments. In broad terms, the distinction between anchoring and repulsion could be explained by two main hypotheses. The first possibility is that these effects are domain specific and that anchoring is restricted to cognitive judgments and repulsion to perceptual judgments. This would suggest that the systems used in cognitive and perceptual tasks each have their own individual biases. If this is the case, then the current independent explanations for each effect could remain unchanged, although it is notable that the majority of these explanations make no reference to such domain dependency and so offer no reason for such specificity.
Statement of Relevance
Previous research has found that estimates are pulled toward values in preceding comparisons in cognitive tasks (e.g., “Was Attila the Hun defeated before or after 1300?”) but pushed away from values in preceding comparisons in perceptual tasks (e.g., “Was the number of dots just shown higher or lower than 25?”). Although this could suggest that different psychological systems are involved in each type of task, here we show that both effects can be found in both task types depending on how close the comparison value is to the target value: Estimates are pulled toward far-off values but pushed away from nearby values. Because existing explanations each predict only one of these effects, we propose a new joint theory positing that people sample a series of potential values in their mind to answer both comparisons and estimates. Our results thus unite two previously separate lines of research, revealing new ways in which both real-world cognitive and perceptual judgments can be biased.
The alternate possibility is that these effects may each be domain general, reflecting global properties of human judgment displayed across multiple tasks, and have been observed only individually because of the nature of the tasks used to elicit them: Indeed, a key difference in these tasks beyond domain is the placement of the decision boundary relative to the target, being close to the target in repulsion tasks but more distant in anchoring tasks. This would then mean that each effect could be observed outside of its original domain or even that both could be found in the same task, depending only on the placement of the decision boundary. Furthermore, in contrast to the domain-specific hypothesis, any model of these judgments would then have to predict both effects in order to offer a complete account of behavior, providing a challenge to existing theories.
In this study, we aimed to separate these possibilities by testing whether both anchoring and repulsion can indeed be displayed in the same task. This was assessed experimentally in both the perceptual and cognitive domains using highly similar designs.
Experiment 1: Perceptual Judgments
In Experiment 1, we looked for both anchoring and repulsion in a perceptual task similar to those used in previous displays of repulsion (Jazayeri & Movshon, 2007; Zamboni et al., 2016; Zhu et al., 2019). We asked participants to make judgments of numerosity against preselected comparison values as well as in absolute estimates. The key modification from such work, however, was the inclusion of decision boundaries further from the target, allowing for tests of anchoring in the perceptual domain.
Method
Participants
Fifty adult participants were recruited via Prolific in return for £5 in financial compensation. Because the task was partly designed to replicate repulsion effects, we recruited a sample size that would provide an approximately equivalent number of data points as in previous examinations of repulsion (e.g., Jazayeri & Movshon, 2007; Zamboni et al., 2016) after accounting for differences in trial count per participant given the restrictions of an online experiment. The sample included 32 men and 17 women (one declined to provide gender information), and ages ranged between 18 and 56 years (M = 25 years). Ethical approval for the experiment was given by the University of Warwick Humanities and Social Sciences Research Ethics Committee.
Design and materials
Experiment 1 involved a numerosity task in which sets of dots briefly appeared on screen and participants were asked about the number of these dots in different ways. Twenty potential dot counts were used in the task, divided into a low region of 21 to 30 and a high region of 71 to 80, although participants were informed only that counts would fall between 0 and 100. To reduce focus on salient numbers, we directed participants to make all responses using an on-screen semicircular scale marked only with the limits of 0 and 100; a semicircular shape was used so we could designate a cursor position equidistant from any point on the scale. This cursor position, which was marked with a white cross, could be used as a reset point to avoid any influence of prior mouse position between responses.
Figure 1 provides an illustration of the experiment. The task used two key question types: decisions and estimates. Decisions required participants to compare the number of dots with a preselected comparison value, marked by an orthogonal line on the scale, and to choose whether the actual number was higher or lower than the comparison value. Each potential dot count was compared with both a nearby and a distant comparison value across each participant’s trials to mirror previous repulsion and anchoring designs, respectively. Two comparison values were therefore set according to the center point of the two dot regions and labeled as the low (25.5) and high (75.5) boundaries. This created 40 potential trial combinations (20 dot counts and two boundaries), which were divided into four cases depending on boundary (low vs. high) and dot region (low vs. high). For clarity, we use low and high to refer to the absolute magnitude of the regions and boundaries, and local and distant to refer to the relationship between these values: Local cases (low boundary and low region, high boundary and high region) tested repulsion, and distant cases (low boundary and high region, high boundary and low region) tested anchoring. Decisions were made on all trials.
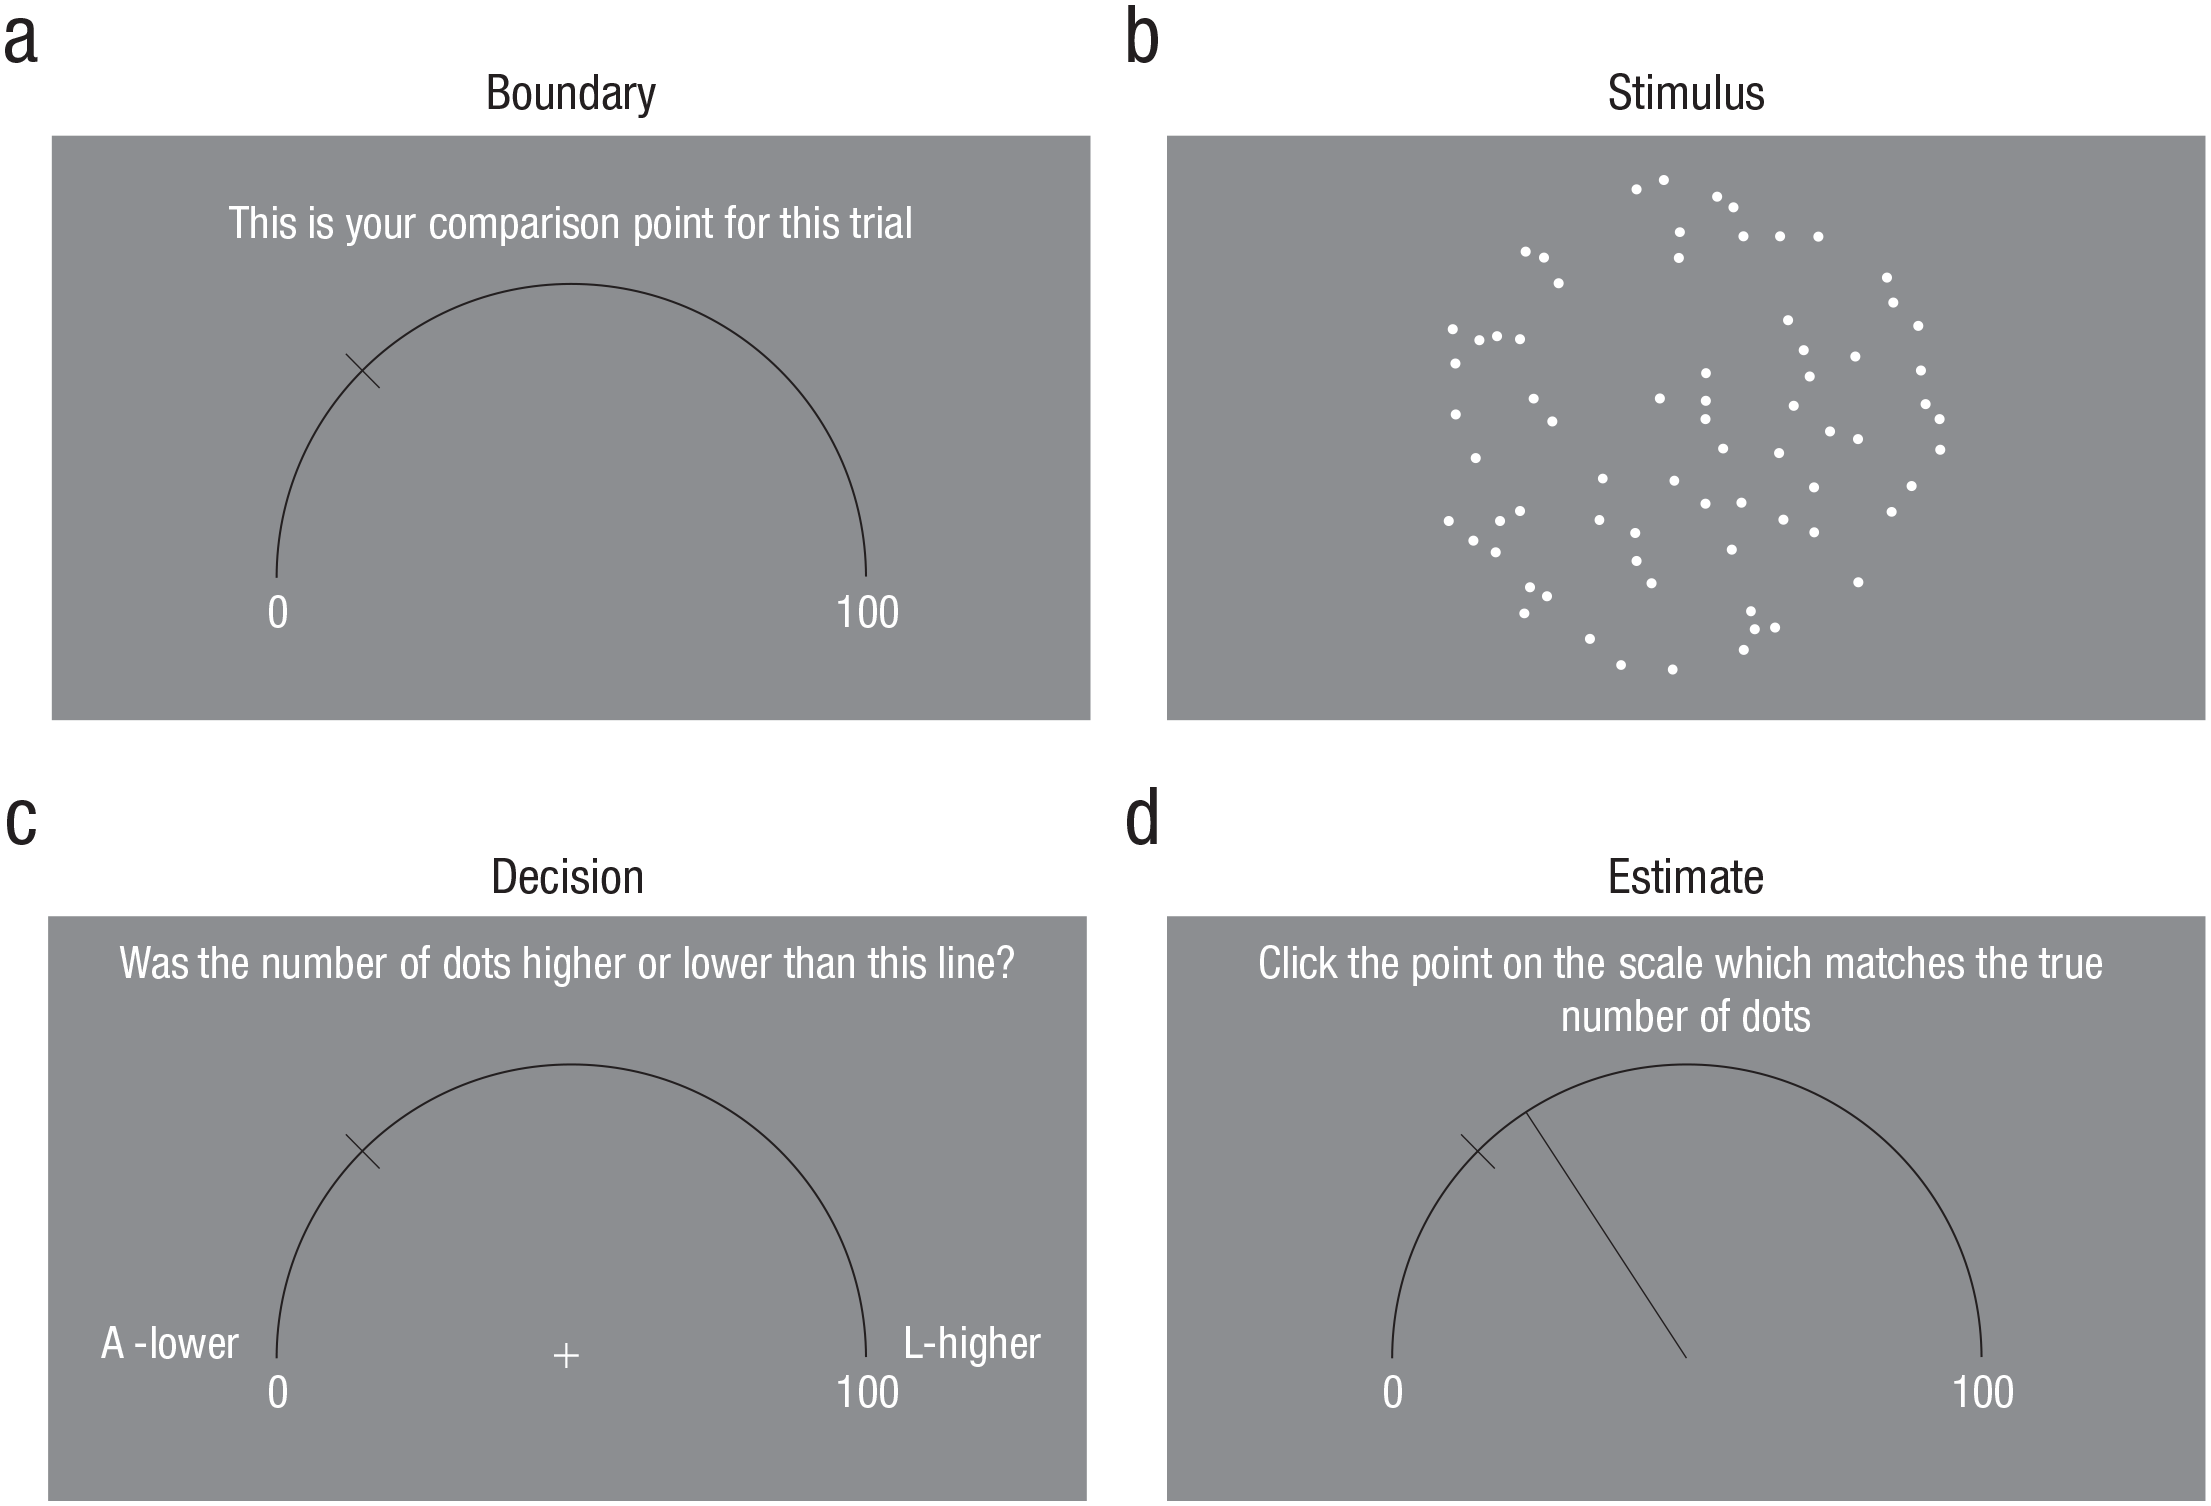
Example trial sequence from Experiment 1. Participants were first shown a scale from 0 to 100 on which a line marked either a low boundary (shown here) or a high boundary (a). The given boundary was either near or distant from the number of dots shown in a subsequent stimulus array (b). After the array disappeared, participants were asked to decide whether the number of dots in the array had been higher or lower than the boundary line (c). On 30% of trials (randomly selected), participants were additionally asked to estimate the true number of dots (d).
Estimates required participants to directly report the number of dots by clicking a point on the semicircular scale that matched their answer, which prevented rounding to salient values as may occur with symbolic numerical responses. Participants made all estimates by first clicking the equidistant point of the scale, in order to prevent bias from prior mouse position, and then drawing a line to the intended response point on the scale. Unlike decisions, estimates were required in only 30% of trials, randomly selected for each participant. This procedure was adopted from previous repulsion designs (Jazayeri & Movshon, 2007; Zamboni et al., 2016) in order to prevent participants from anticipating estimates on each trial.
Procedure
The experiment was run online using the Pavlovia platform and was programmed with the PsychoJS software package (Version 2020.1.3; Peirce et al., 2019). Before starting the task, participants were informed that the experiment involved a dot-counting task and were introduced to the semicircular scale used in all trials, the two potential comparison values, and the decision and estimate question types.
When each trial began, the comparison point for the subsequent decision appeared on the semicircle to make participants aware of the boundary when the target stimulus was shown. Comparison points were presented as randomly selected from the two possible values (i.e., high or low) to prevent any assumption that the boundary was informative as to the number of dots for that trial: The screen rapidly alternated between the two possible boundaries for 1 s before settling on the boundary for that trial for 2 s. Following presentation of the comparison point, a fixation cross was shown for 0.5 s. The dot array then appeared for 0.5 s, after which the decision phase immediately began. Participants then had to indicate whether the dot count was higher or lower than the selected boundary value using a key on the keyboard. If an estimate was included on a given trial, participants were then asked to indicate the point on the scale that corresponded with the actual dot count by drawing a line with the mouse from the equidistant cross to the outer line. If an estimate was not requested for that trial, participants were given on-screen feedback on their decision (“Correct” or “Incorrect”). No feedback was given for trials in which estimates were requested.
To demonstrate the procedure, we began the task with a set of four practice trials drawn from a subset of the main experimental trials common to all participants. This was followed by the main trial block, which consisted of five repetitions of each of the 40 trial combinations described above for a total of 200 trials, presented in a random order. As noted above, decisions were requested on all trials, whereas 30% of trials were randomly selected to include an estimate.
After completing all trials, participants were asked whether they believed that the comparison points were related to the dot values for their respective trials; this question was included to examine whether the decision boundary was treated as informative about the true dot count. Finally, participants were debriefed on the aims and expectations of the experiment.
Results
Data from two participants were lost because of computer error during submission. Three participants were excluded for basing their estimates on decision boundaries rather than dot counts (measured as > 20% of a participant’s estimates falling within 1 point of the displayed boundary value), and one further participant was excluded for answering at the nondisplayed boundary for that trial (i.e., answering at the high boundary when the low boundary was shown and vice versa, measured as > 20% of estimates falling within 2 points of the nondisplayed boundary value, using a wider window given that this boundary was not shown on these trials). After exclusions, data from 44 participants were left for analysis. Estimates that differed from the true dot count for that trial by more than 50 points were classified as errors and removed from analysis, which resulted in the filtering of 25 estimates (0.95%) across all participants; this criterion was based on the difference between the two boundary values to avoid excluding strong anchoring effects from the data. Finally, estimates made within 200 ms were excluded because of potential imprecision in use of the response scale, which resulted in the removal of a further 61 estimates (2.31%).
Anchoring
We first performed a standard anchoring analysis comparing estimates between the high- and low-boundary conditions. To simplify this comparison, we averaged estimates for each participant within each combination of region and boundary, which yielded four averages per person. Comparisons were then made between average responses from the high- and low-boundary cases in each region using paired-samples t tests; regions were separated to allow for different effects between higher and lower target values. Given the near ubiquity of anchoring effects in previous research, these were all one-tailed tests. Our assumption was that responses would be higher for the high-boundary cases and lower for the low-boundary cases, although the significance criterion for these tests was Bonferroni corrected from .05 to .025 because of the use of two comparisons.
Estimates in the low dot region were significantly higher when preceded by the high-boundary comparison (M = 26.5, 95% confidence interval [CI] = [25.0, 27.9]) than the low-boundary comparison (M = 24.4, 95% CI = [22.9, 25.8]),
Repulsion
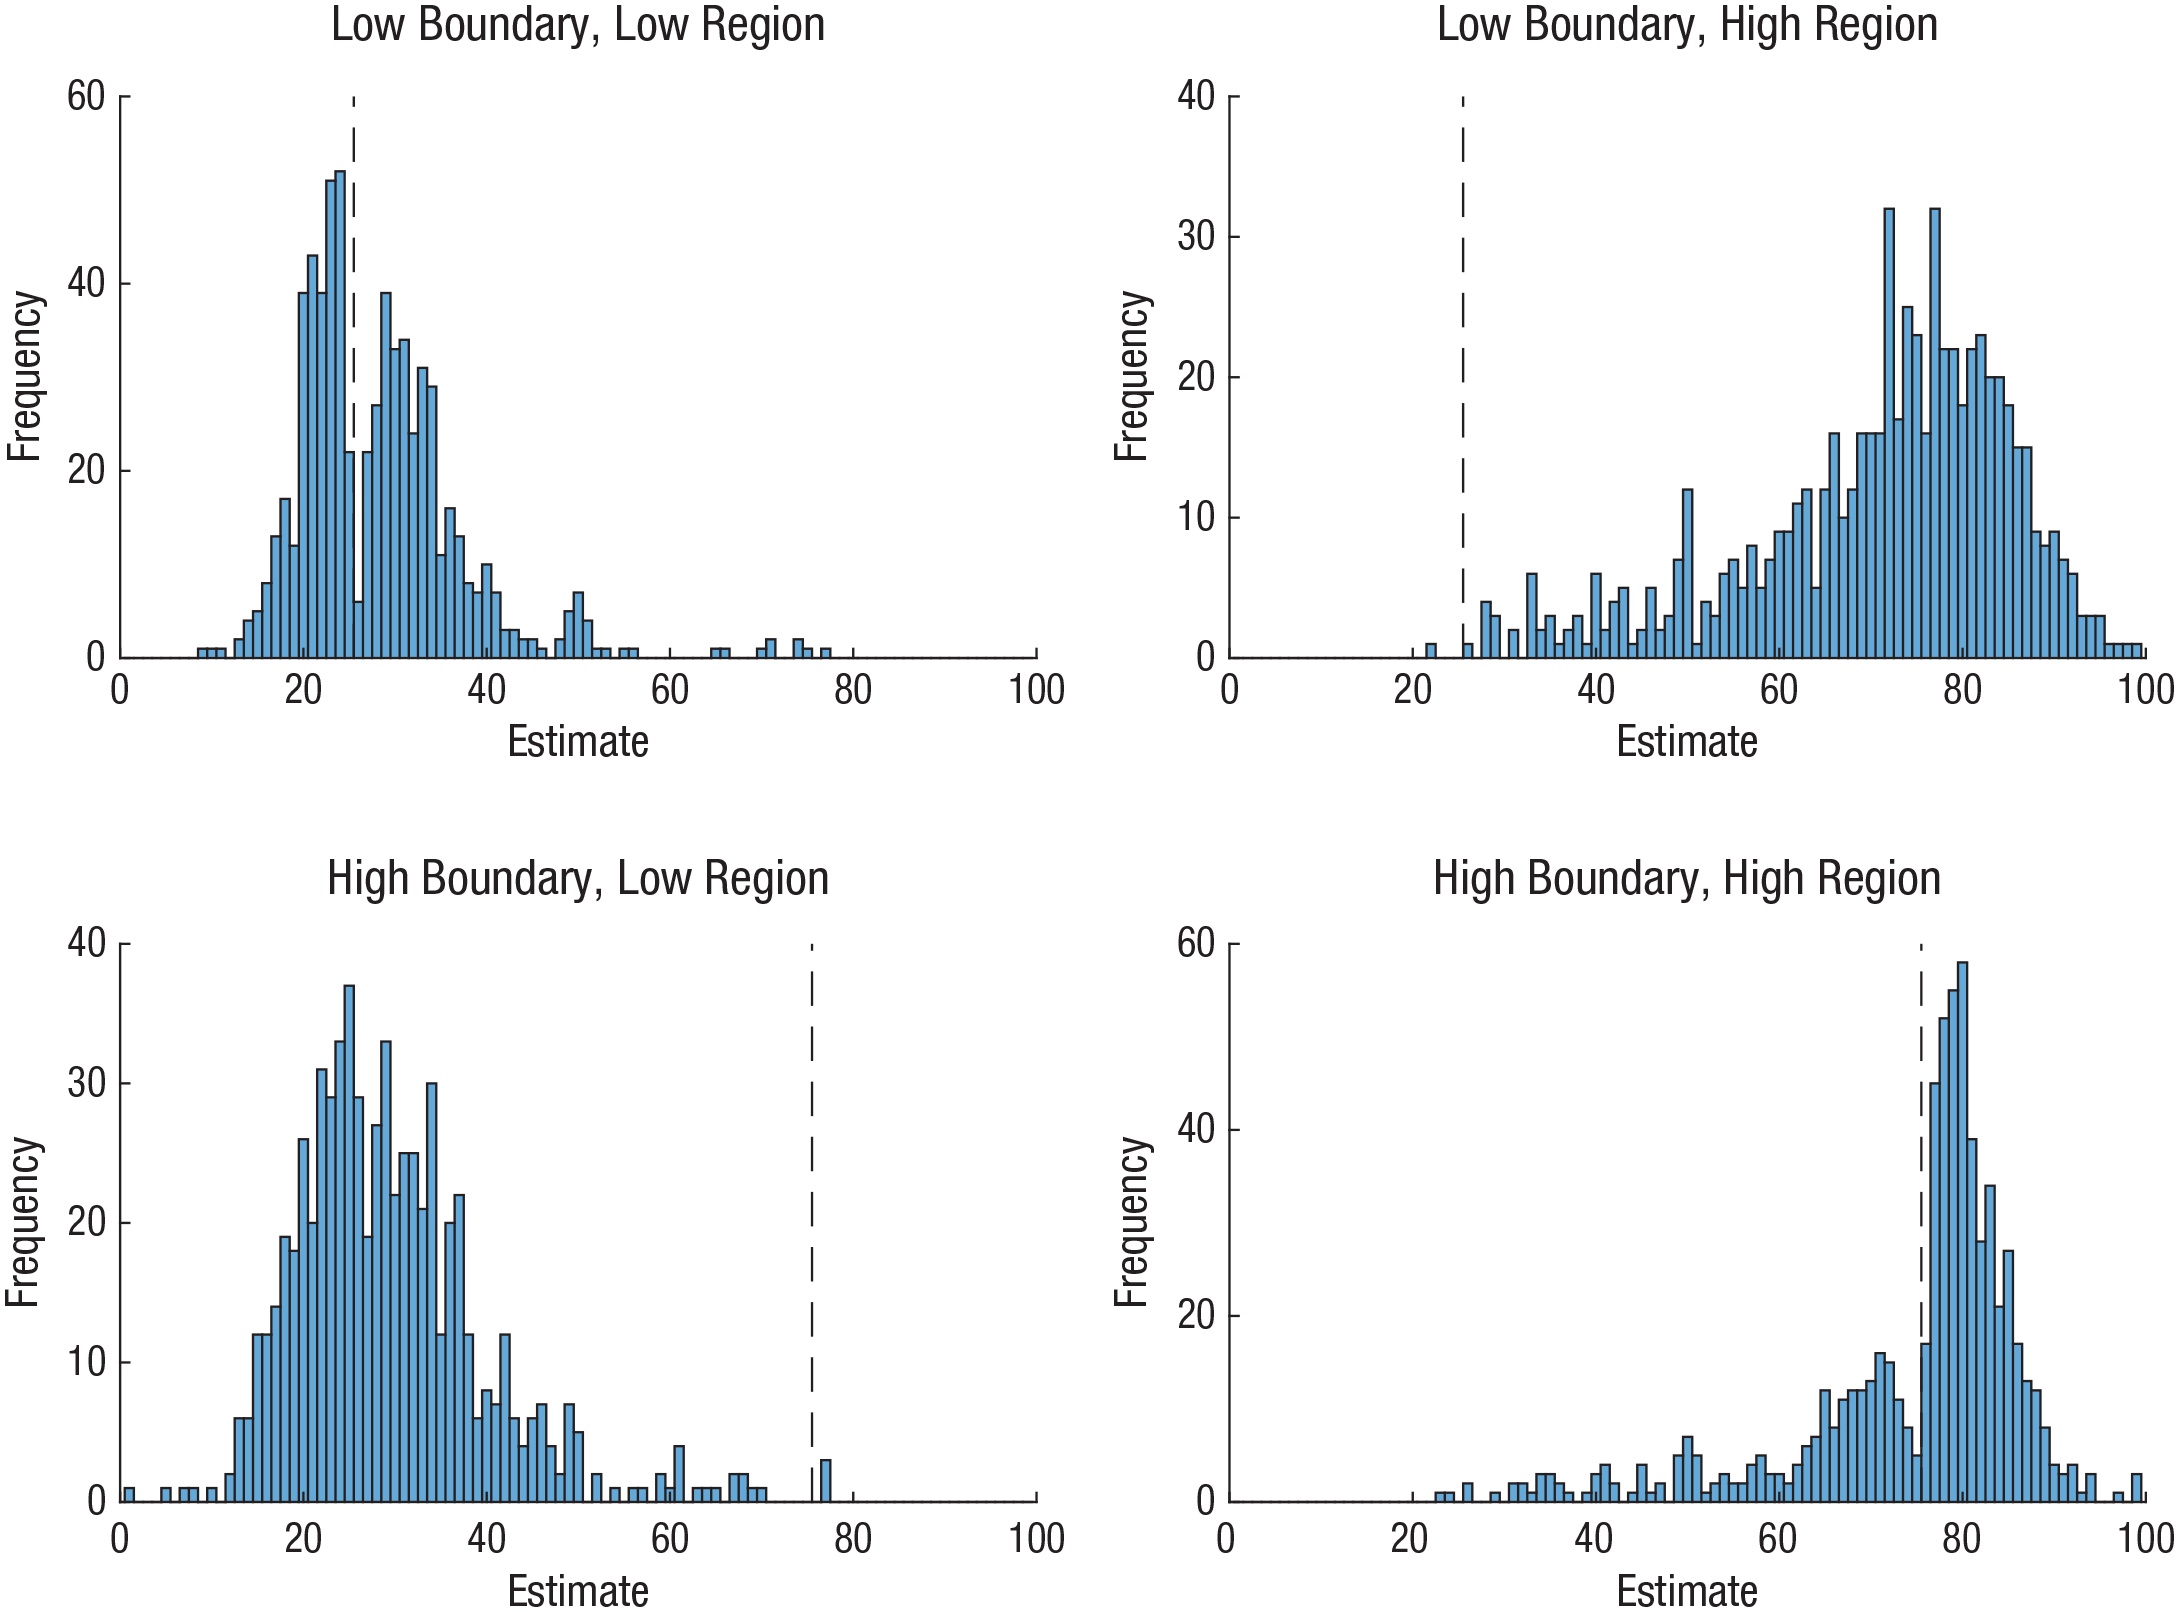
We next investigated repulsion effects by examining the response patterns around each decision boundary. Figure 2 shows the distribution of estimates for each of the four trial cases (low boundary and low region, high boundary and high region, low boundary and high region, and high boundary and low region). There was a notable divot around the boundary when participants responded to nearby stimuli values, although the divot appeared to fall slightly below the boundary in the high-boundary/high-region case. This divot was quantified using Hartigan’s dip test (J. A. Hartigan & Hartigan, 1985), as used in previous displays of perceptual repulsion (Zamboni et al., 2016). This test provides a score measuring the deviation from unimodality in the given distribution; higher scores indicate greater deviation. The dip test has advantages over methods such as kernel-density estimation because the dip test does not require definition of a specific distribution function or optimization of model parameters.
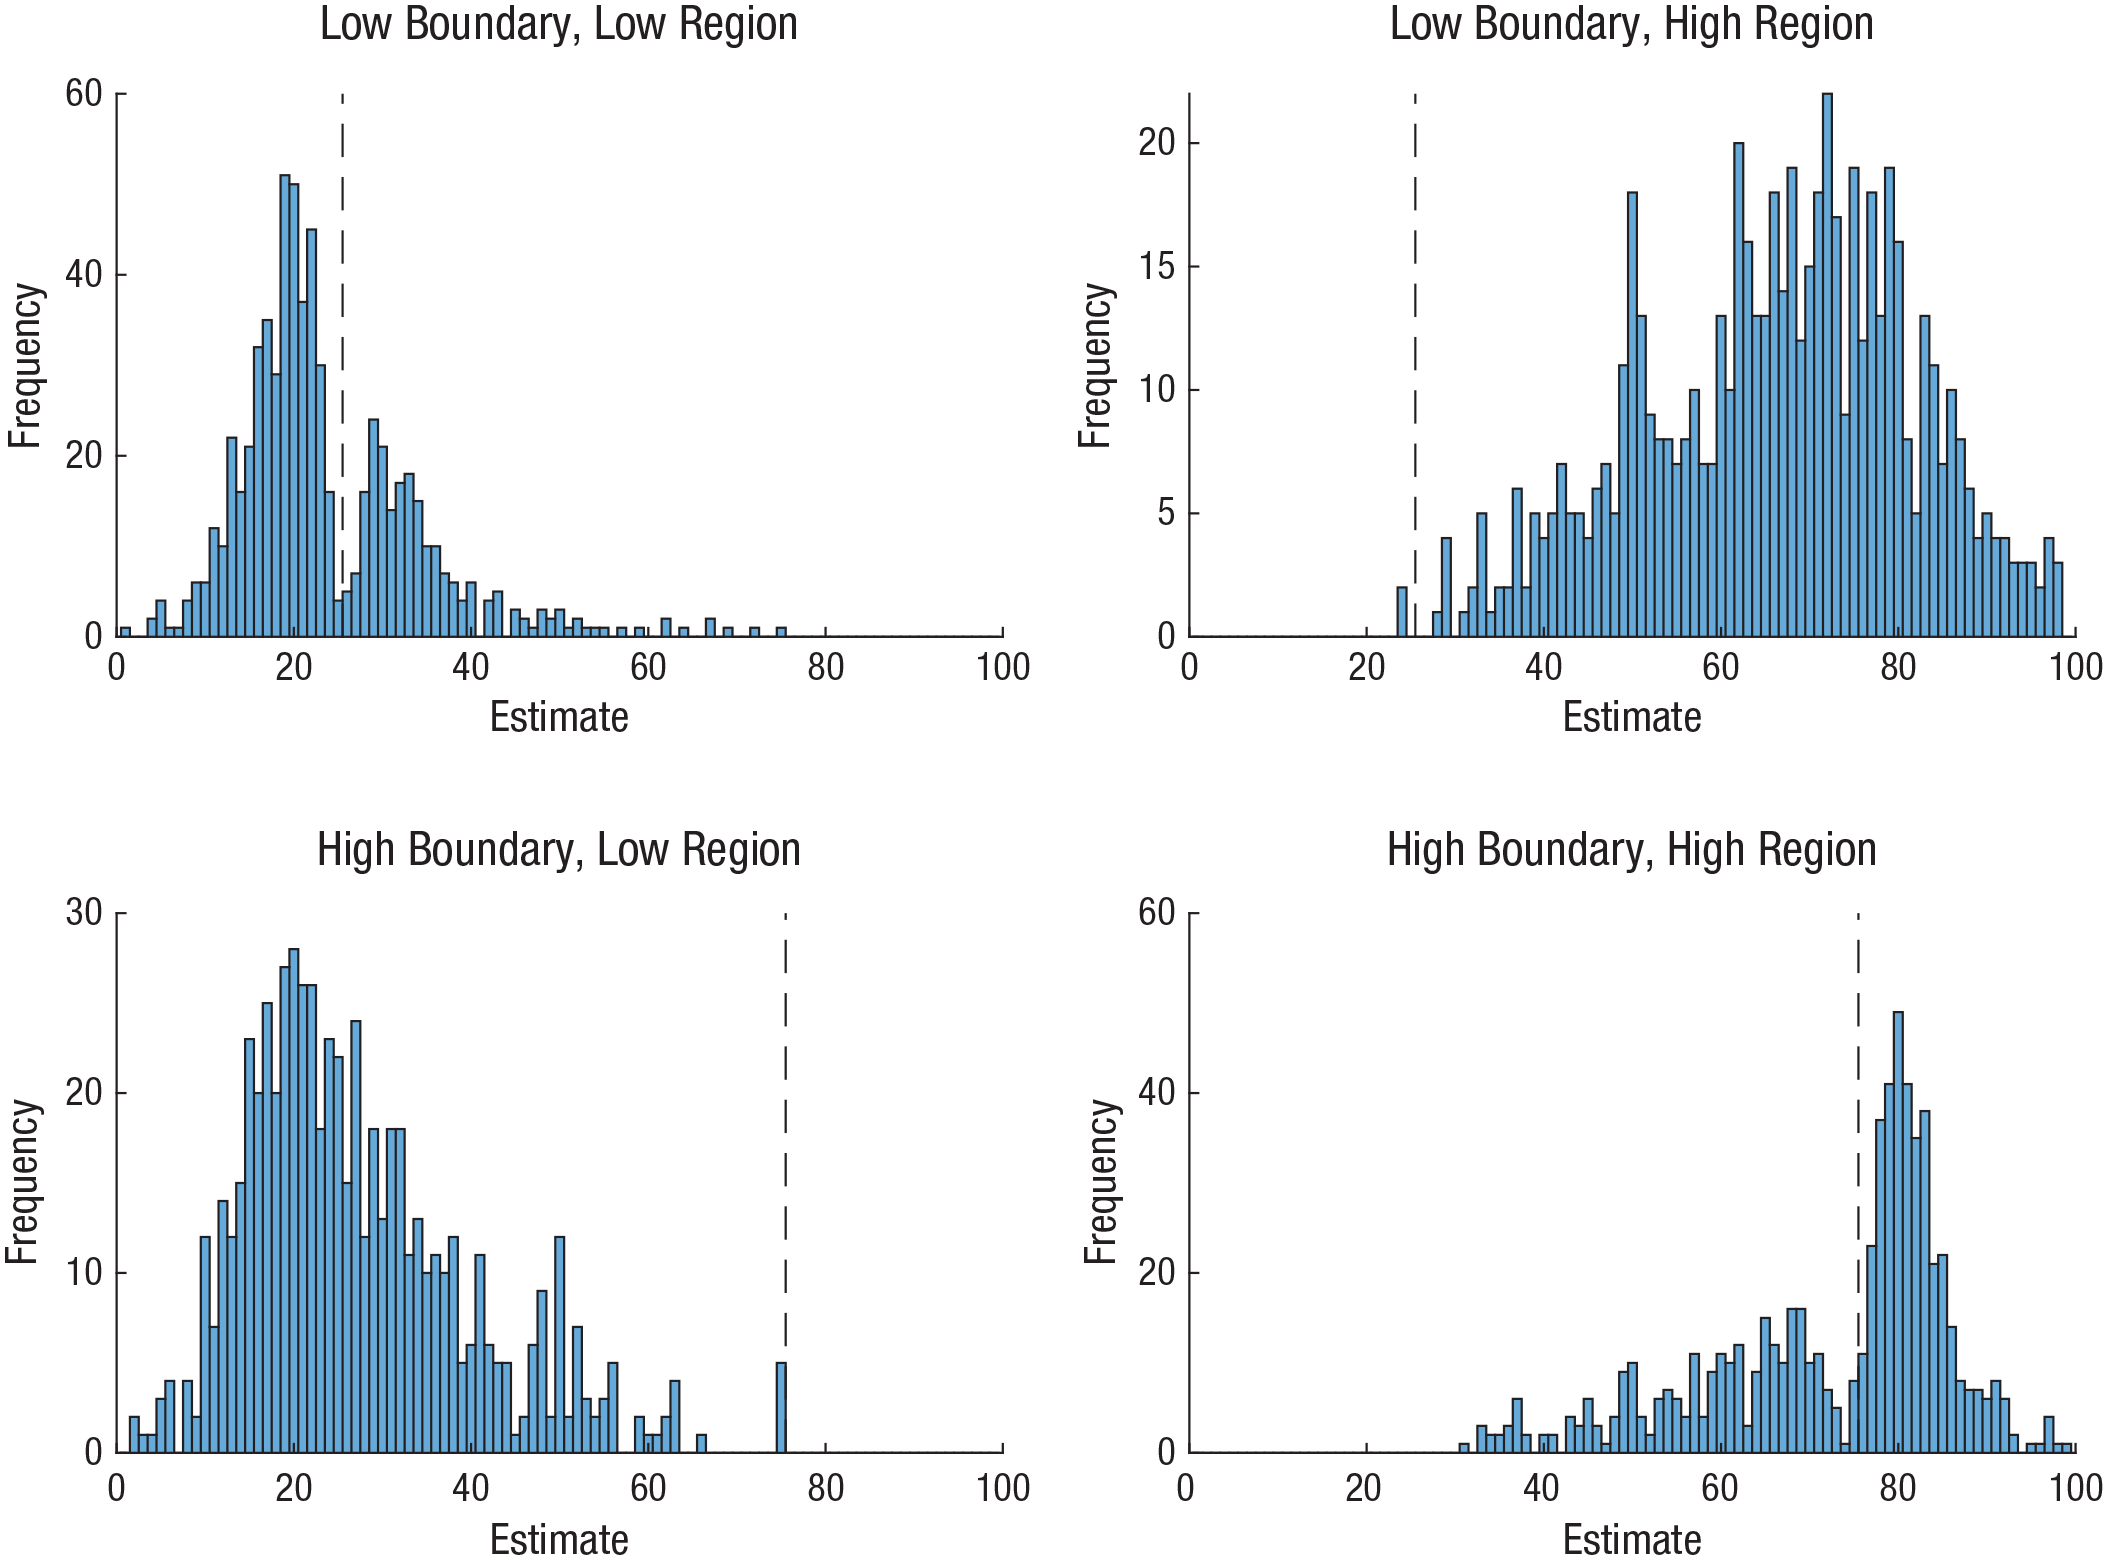
Distribution of participants’ estimates of the true number of dots in each array shown in Experiment 1, separately for each of the four trial cases. Dashed lines indicate decision boundaries preceding those estimates.
Dip statistics were calculated for each of the four trial cases. We also calculated the probability of each of these scores arising by chance in a comparison with 10,000 bootstrapped estimates using randomized uniform samples (P. M. Hartigan, 1985). These tests found a significant effect in the low-boundary/low-region case (dip = 0.023, p = .018) but no significant effects in the low-boundary/high-region (dip = 0.014,
Although the dip test provides an established measure of repulsion, issues could be raised with its use in this analysis because of the dependencies present in these data: The above response distributions collect multiple estimates from each participant to provide greater resolution, but this also means that these distributions were not composed of entirely independent observations. This does not violate any specific assumptions of the dip statistic itself but could lead to concerns that the above results are attributable to individual differences in estimates between participants. This cannot, however, be addressed by using average responses from each participant for each region and boundary as in the above anchoring analysis because such aggregation could in fact mask repulsion effects by collapsing responses above and below the apparent dip.
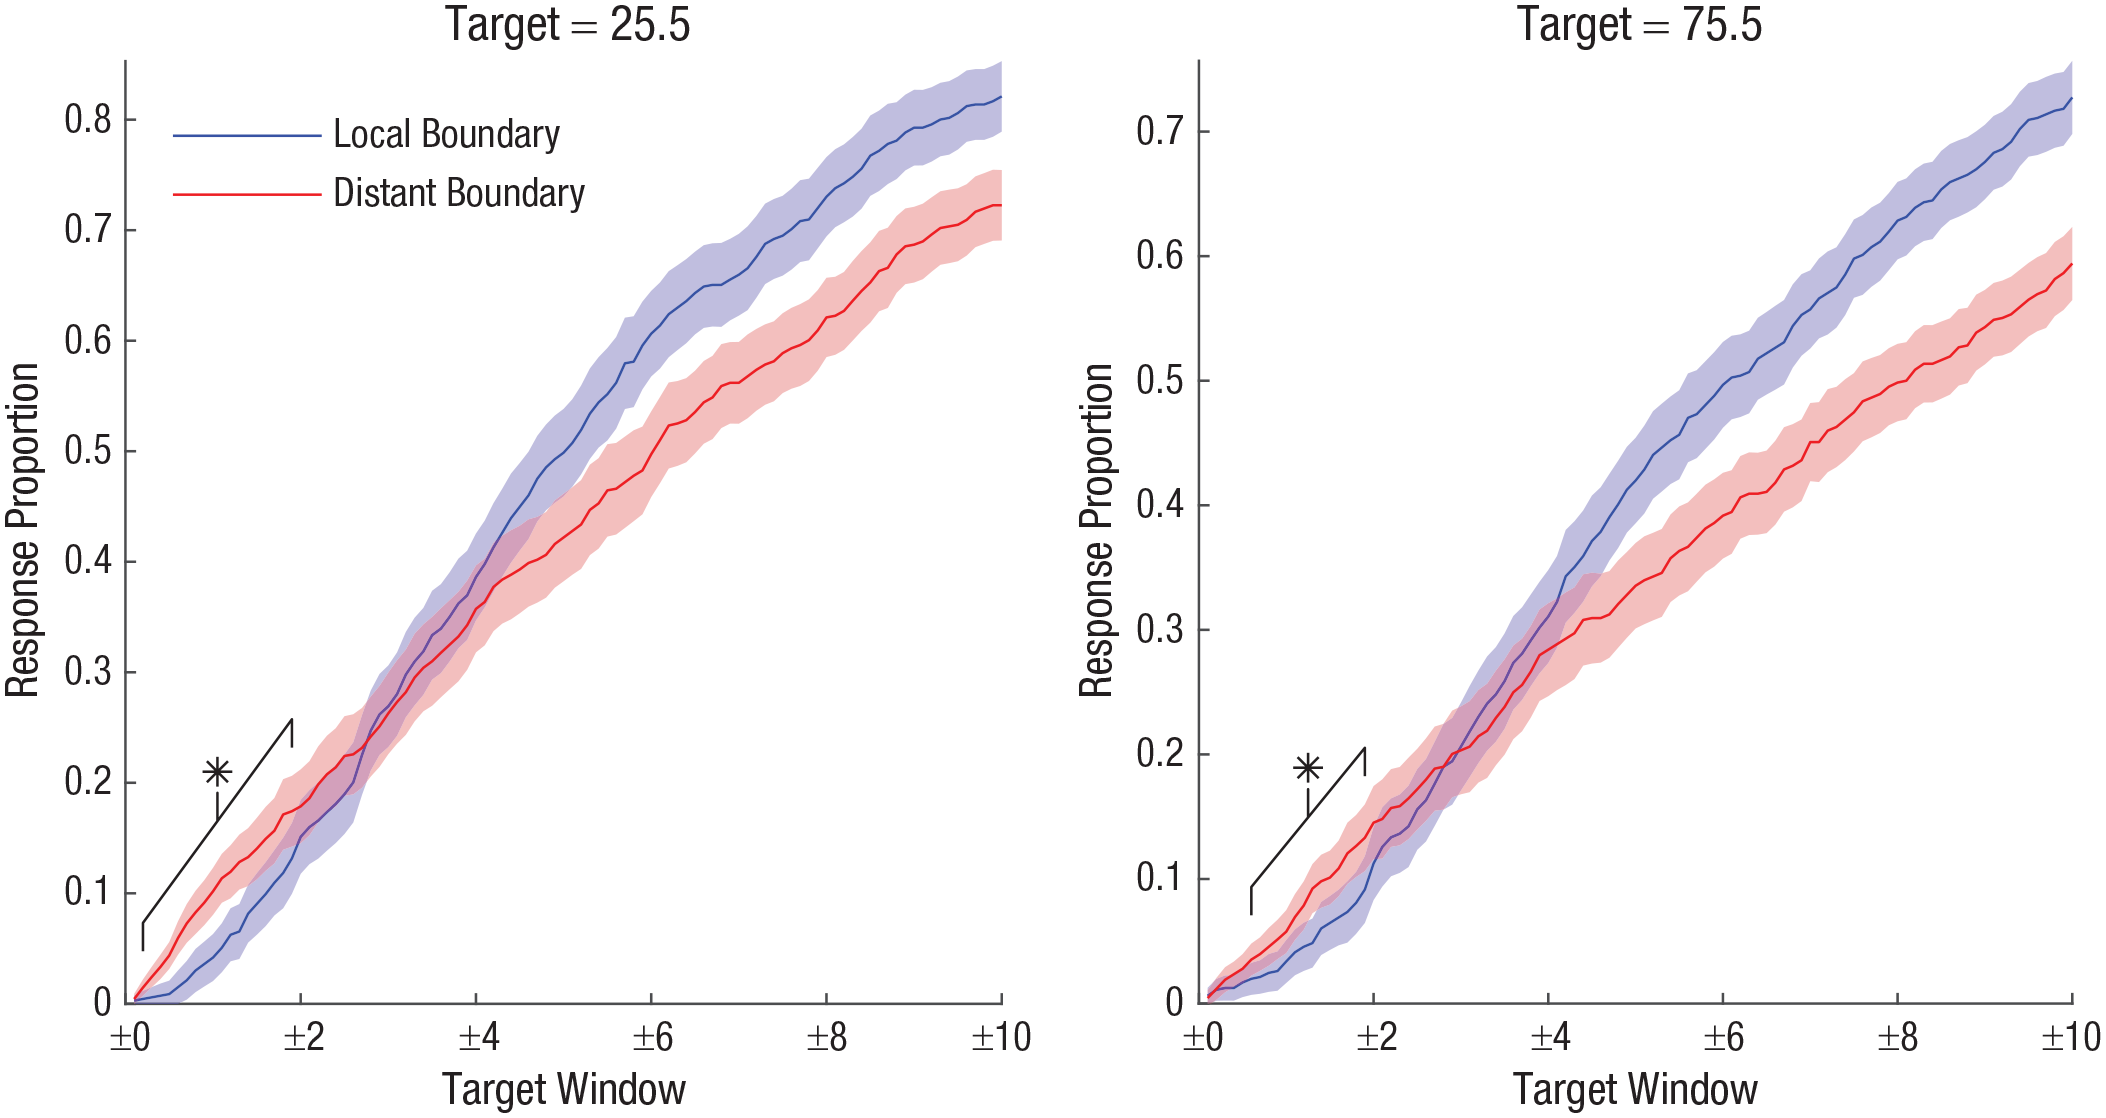
Thus, we supplemented the dip test with an additional analysis comparing the response rate falling around each boundary value when that boundary did and did not precede estimates. This was assessed using paired-samples t tests comparing each participant’s proportion of responses falling within a symmetrical window around each boundary value between boundary conditions to determine whether certain responses are less prevalent following comparison of a local boundary with a distant boundary, as illustrated in Figure 3.
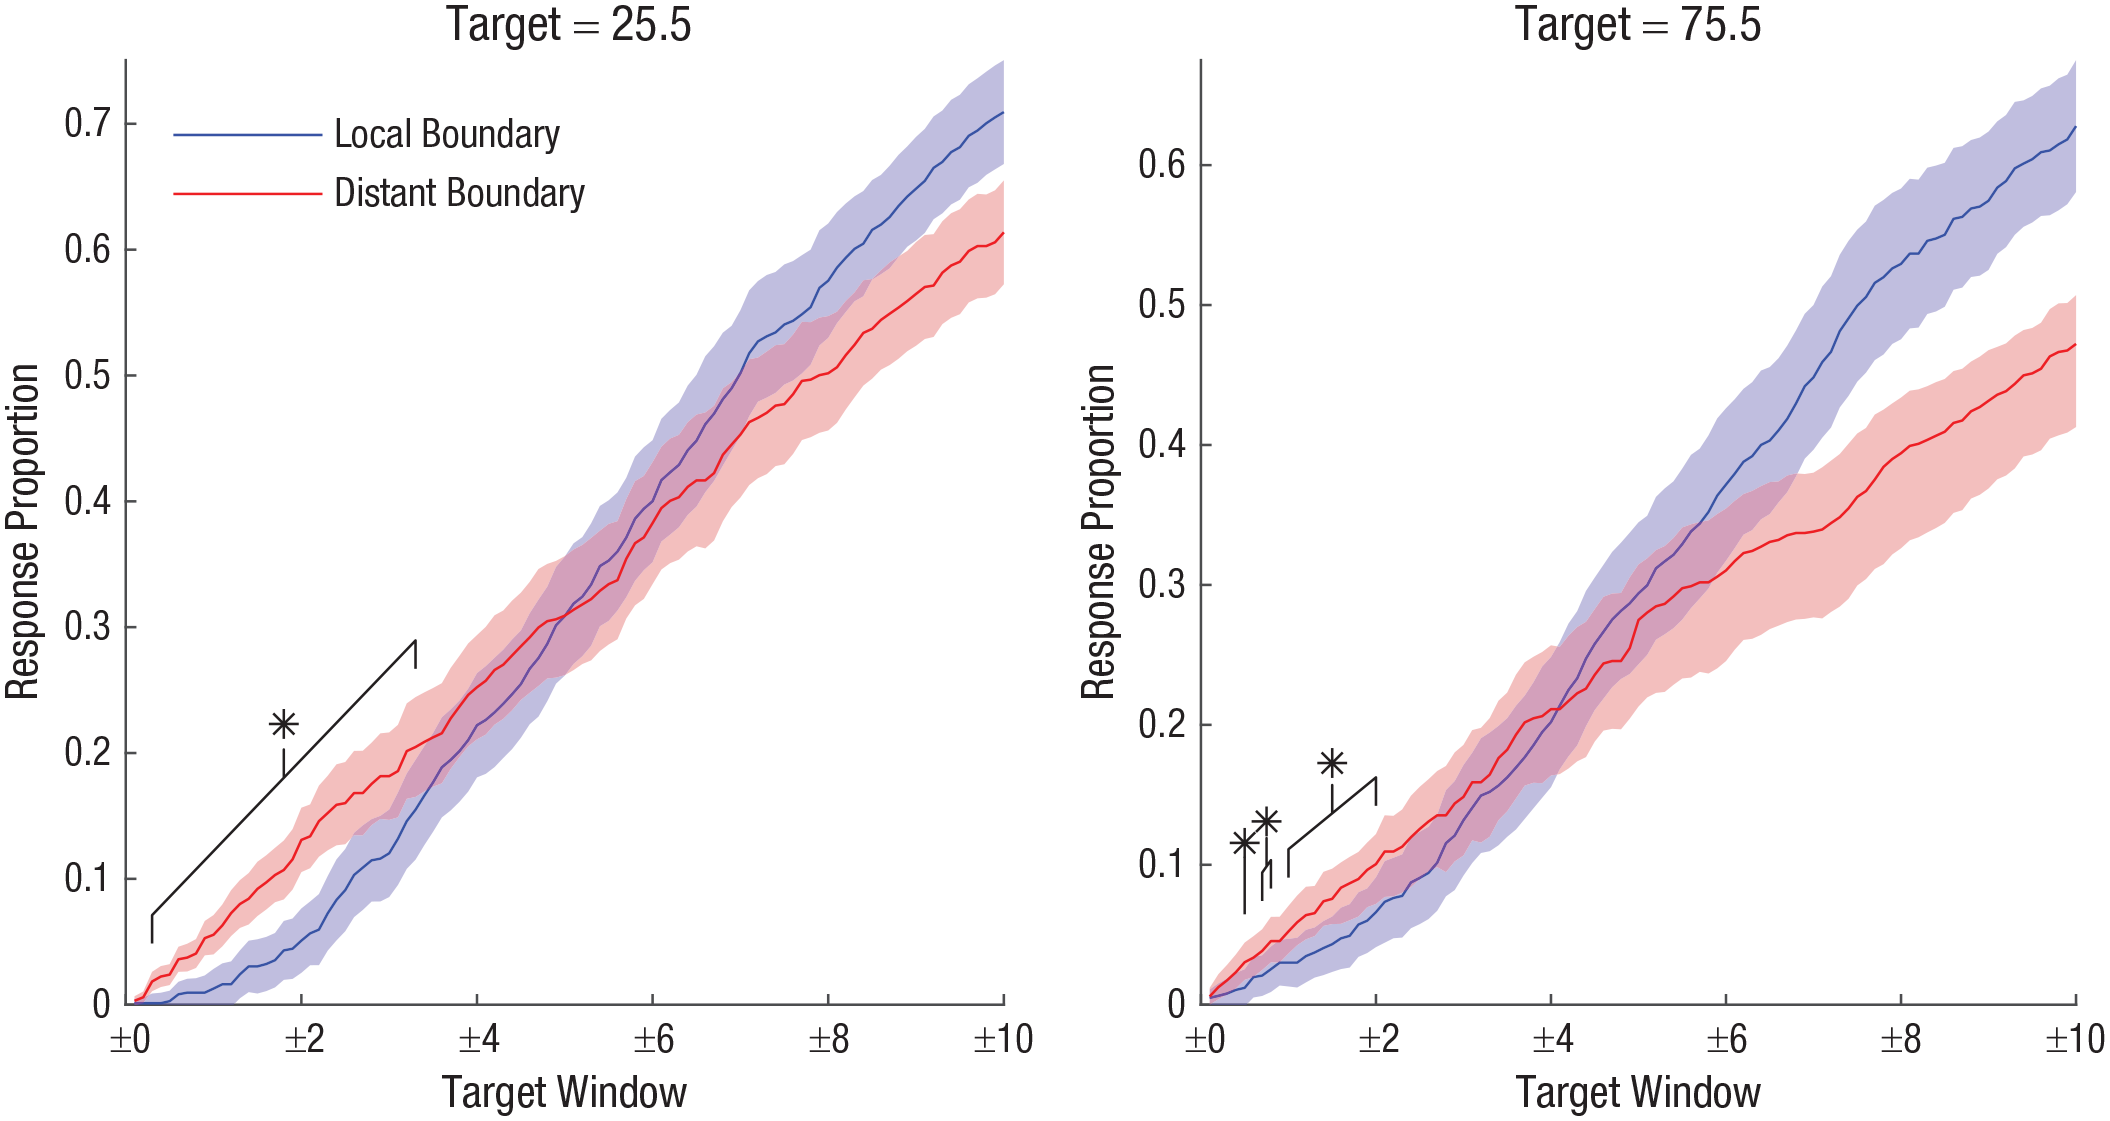
Mean proportion of responses falling within expanding windows around each boundary value (25.5 [low] vs. 75.5 [high]) as a function of boundary condition (local vs. distant) in each dot region in Experiment 1. Shaded areas denote 95% confidence intervals, corrected for within-subjects variation (O’Brien & Cousineau, 2014). Asterisks denote regions of significant repulsion effects (
We used tests at multiple window sizes to give a more detailed depiction of the distribution of estimates around each boundary. We did not correct for multiple comparisons because the relation between response proportions at similar window sizes meant that these tests were not independent of one another; all comparisons therefore used a significance criterion of
Summary
Experiment 1 provided evidence that both anchoring and repulsion can be observed in the same task: Estimates were pulled toward distant comparison values but pushed away from nearby comparison values. Such findings do not suggest domain specificity in these effects; instead, they indicate that these biases represent differing reactions according to boundary location rather than task type. To complement these results, we next examined whether similar patterns are displayed within the cognitive domain.
Experiment 2: Cognitive Judgments
In Experiment 2, we aimed to replicate as much of the design of Experiment 1 as possible in a cognitive-judgment task: Instead of making numerosity judgements, participants answered questions regarding commonly experienced values. This acted as a mirror to the previous experiment: We here sought to replicate previous displays of anchoring as well as to test for repulsion effects in such a design.
The hypotheses, experimental design, and planned data analysis for Experiment 2 were preregistered on the OSF (https://osf.io/bsajt/).
Method
Participants
One hundred fifty adult participants were recruited via the Prolific recruitment platform in return for £1.50 in financial compensation. We recruited a sample size that would provide an approximately equal number of observations to Experiment 1 after accounting for differences in trial count per participant (detailed below). The sample included 74 men and 74 women (two declined to provide gender information), and ages ranged between 18 and 65 years (M = 28.8 years). Ethical approval for the experiment was again provided by the University of Warwick Humanities and Social Sciences Research Ethics Committee.
Design and materials
Experiment 2 used a similar design to Experiment 1, except that the dot arrays were replaced with questions about the most likely age at which people perform certain behaviors (e.g., “What age is someone most likely to get married?”). Age was selected as a dimension because it provided an intuitive match to the 100-point scale used in Experiment 1 and is an aspect with which participants would be familiar. Unlike the dot arrays used in Experiment 1, these questions do not have objectively correct answers; instead, unbiased estimates were obtained using a preliminary survey in which a separate set of participants (N = 100) gave their own answers to these questions without any preceding comparisons (further details on this survey are given in the Supplemental Material). Participants in Experiment 2 were therefore asked to estimate the average answers given in this survey, which allowed us to designate responses as correct. Questions were selected to mirror the division between high and low stimulus regions from Experiment 1: 10 questions had answers of approximately 20 to 30, and 10 had answers of approximately 70 to 80 (based on survey responses). Both the questions and the expected answers are provided in the Supplemental Material.
Figure 4 provides an illustration of the experiment. The design of the task was highly similar to that in Experiment 1, except that age questions instead of dot arrays were used as target stimuli. On each trial, participants were asked to compare the answer to a given question with either a low or high boundary. This again created four trial cases according to boundary value (low vs. high) and question region (low vs. high). Given the similarity in stimulus regions between experiments, the same boundary values (25.5 and 75.5) were used. As in Experiment 1, these values represented the approximate midpoint of these regions, thus producing both local and distant comparison cases. In contrast to Experiment 1, however, all trials in Experiment 2 included a direct estimate of the target because each question was viewed only once by each participant; unlike the randomized dot arrays, the age questions do not vary between repetitions and so were not repeated so we could avoid potential carryover effects. Indeed, an initial experiment that presented questions repeatedly to each participant (detailed further in the Supplemental Material) found evidence of repulsion but not anchoring, suggesting that this design was too different from previous anchoring studies to effectively replicate the effect. This also means that each participant compared each question with only one of the two potential boundaries in their trials; thus, two versions of the question set were created, and these sets were balanced so that questions compared with the low boundary in one set were compared with the high boundary in the other, and vice versa. Each set was evenly divided between both regions and boundaries and thus contained five trials from each of the four trial cases, controlled to provide approximately equal average expected answers in each condition a priori on the basis of survey responses (for full details, see the Supplemental Material). Each participant was randomly assigned one of these sets at the start of the task to further reduce potential biases. As with Experiment 1, all responses were directed using a semicircular scale ranging between 0 and 100.
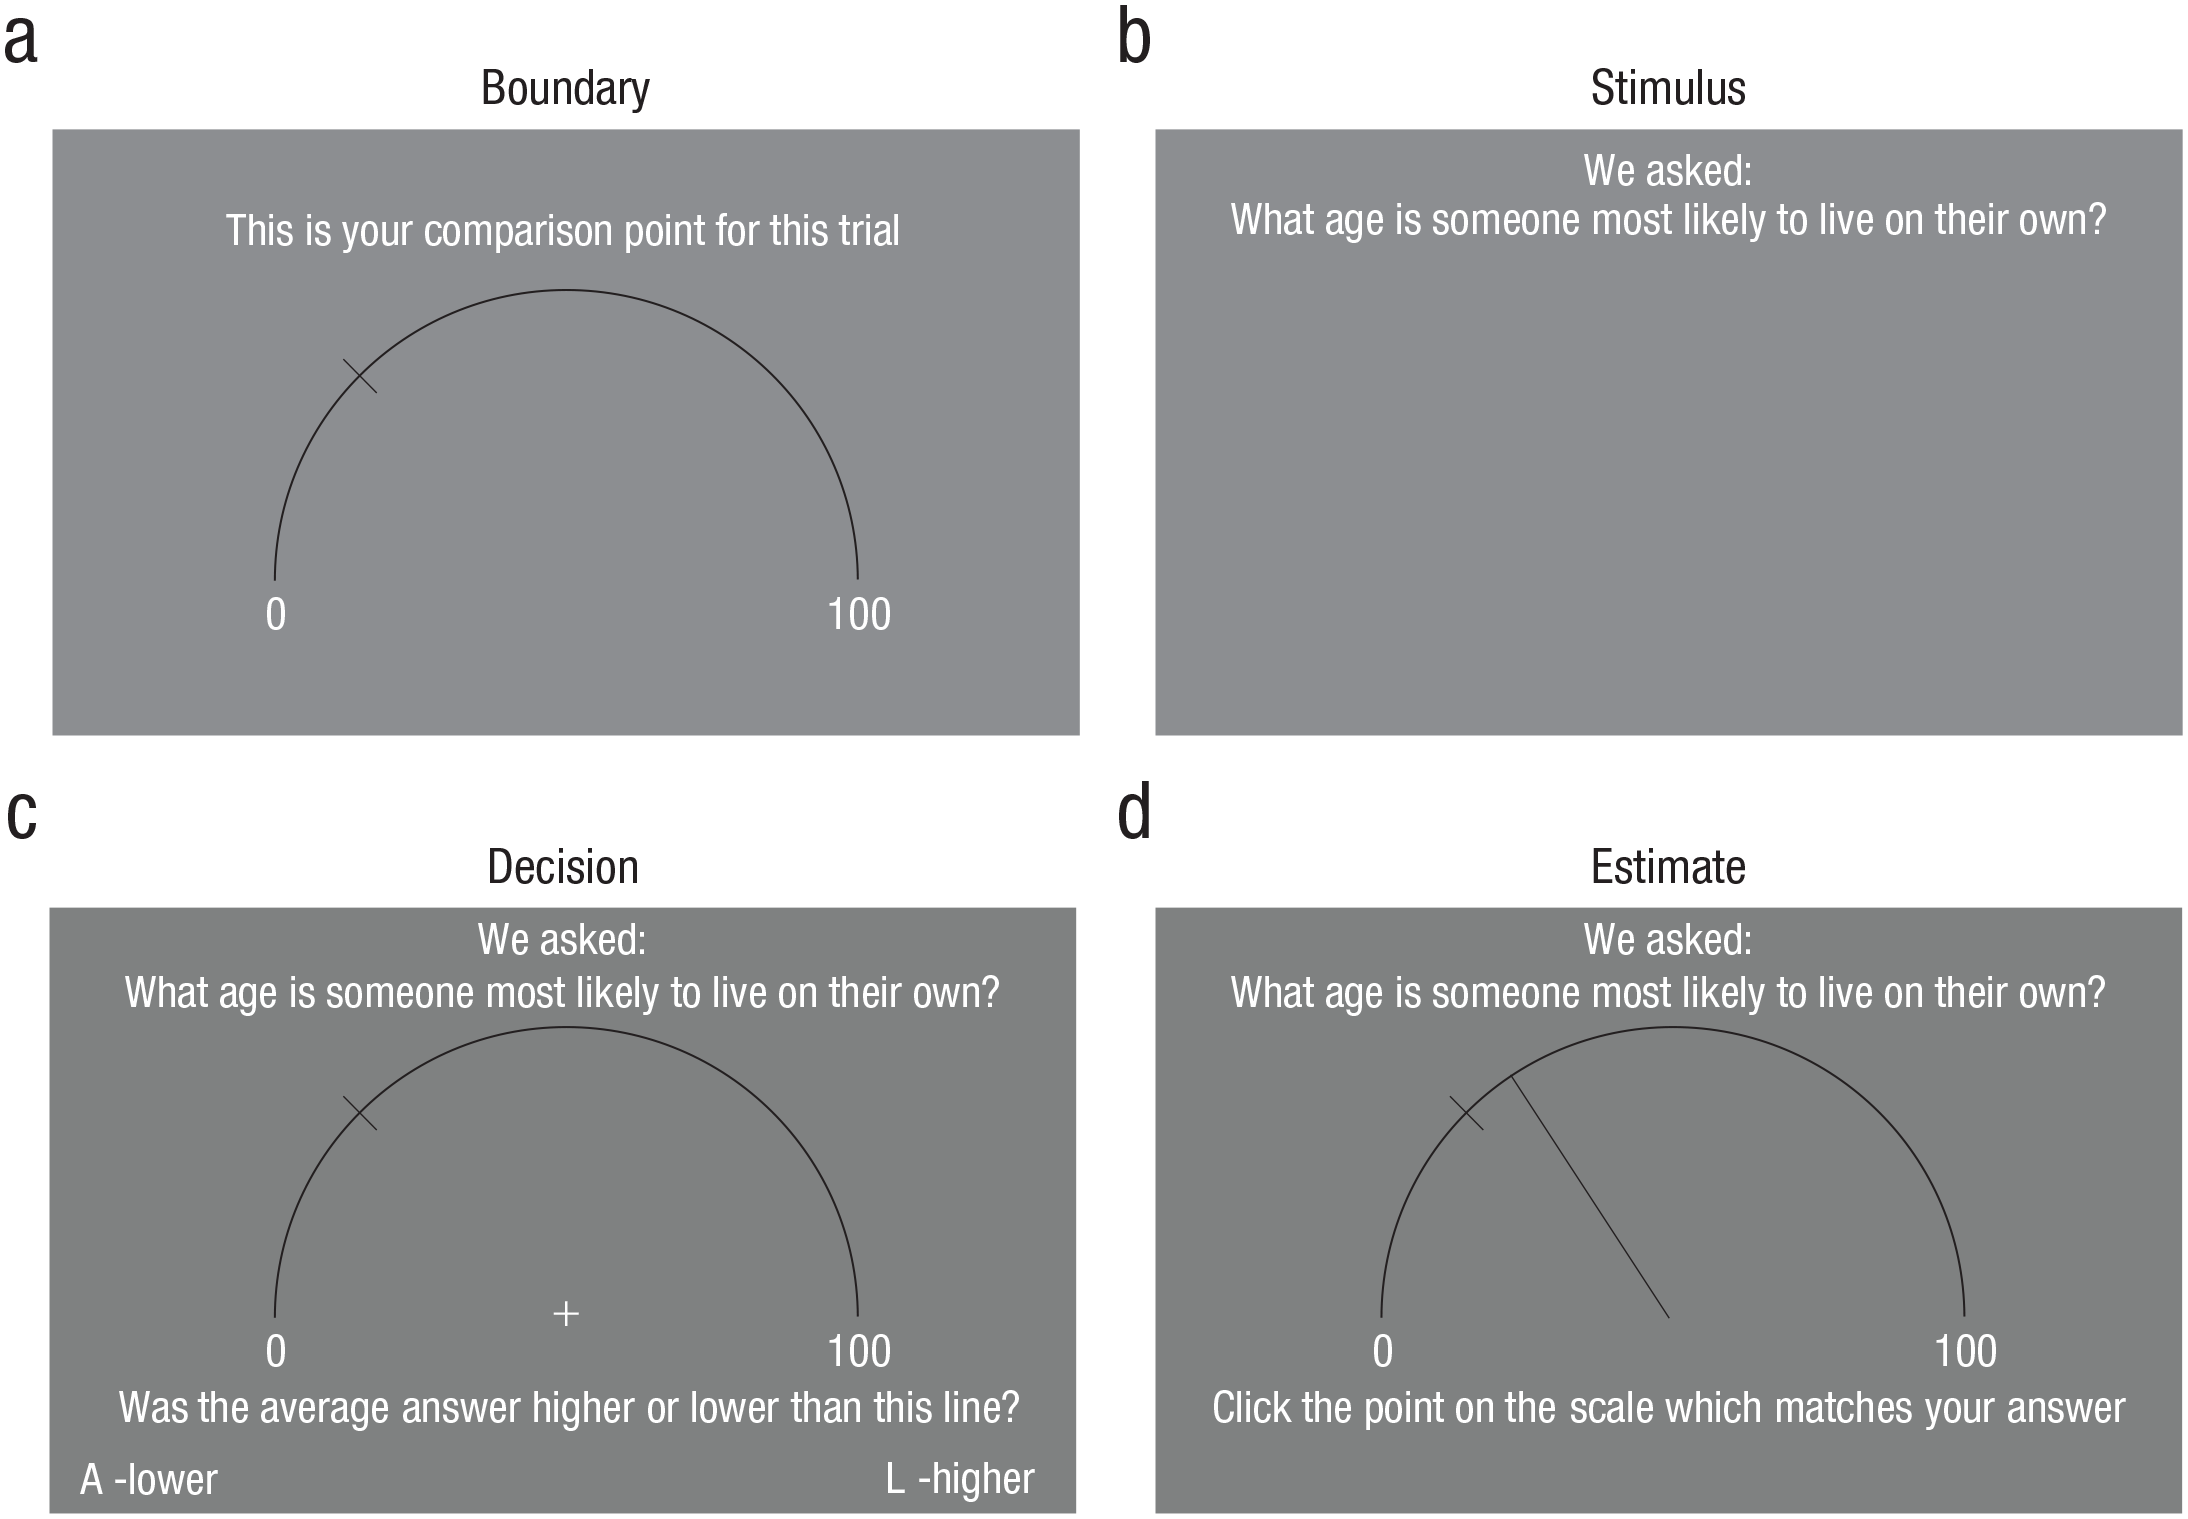
Example trial sequence from Experiment 2. Participants were first shown a scale from 0 to 100 on which a line marked either a low boundary (shown here) or a high boundary (a). The given boundary was either near or distant from the answer to the question shown in the subsequent stimulus (b). Participants were asked to decide whether the average answer to the question was higher or lower than the boundary line (c). On all trials, they were additionally asked to provide a direct estimate of the answer to the question (d).
Procedure
Experiment 2 used a similar procedure to that in Experiment 1, except that minor alterations were made to suit the different target stimuli. First, as noted, each question was viewed only once, meaning that each participant completed only 20 trials during the experiment. An estimate was requested on all trials so we would have a sufficient count for analysis. Second, to encourage engagement with the task, we gave participants feedback on every trial after making their estimate about whether their higher/lower decision was correct or incorrect (though no feedback was given about their estimate). Third, rather than being briefly displayed prior to decisions, each question was held on screen throughout both the decision and estimate to aid response. All other aspects of the procedure were identical to that of Experiment 1.
Results
Data from two participants were lost because of computer error in data submission. The same exclusion criteria were applied in Experiment 2 as in Experiment 1: 11 participants were removed for basing their responses on decision boundaries (six used the presented boundary, five used the alternate boundary), 39 total estimates (1.39%) were removed for being more than 50 years away from the true answer for that trial, and 38 estimates (1.36%) were removed for being made within 200 ms. These exclusion criteria were preregistered, with the exception of the use of the alternate boundary to guide estimates, which was not anticipated a priori. 2
Anchoring
Anchoring was examined using paired-samples t tests to compare mean estimates from each participant in the high- and low-boundary cases within each stimulus region. 3 This involved contrasts between answers to different questions within a region given that each participant compared a given question with only one of the two boundaries, although both the controls and counterbalancing of question sets should have limited any potential bias raised by such comparisons. As in Experiment 1, estimates in the low question region were significantly higher following comparison with the high boundary (M = 29.6, 95% CI = [28.8, 30.3]) than the low boundary (M = 28.3, 95% CI = [27.5, 29.1]), t(135) = 2.23, p = .014, d = 0.19, 95% CI = [0, 0.38], and estimates in the high question region were significantly lower following comparison with the low boundary (M = 71.0, 95% CI = [69.9, 72.1]) than the high boundary (M = 74.5, 95% CI = [73.4, 75.6]), t(135) = 4.48, p < .001, d = 0.38, 95% CI = [0.18, 0.58]. These results suggest that anchoring was observed in both regions, although this effect was again stronger in the high region. This further suggests that higher values were more susceptible to presentation of the comparison point. A breakdown of the results for each question is given in the Supplemental Material.
Repulsion
Estimate distributions from each trial case in Experiment 2 are shown in Figure 5. These distributions suggest lower rates of responses around the boundaries where these values were closer to the target, although these appear less prominent than in the perceptual case. It is also notable that the divot in the high-region/high-boundary case again appears to fall below the boundary, possibly indicating similar effects in this task. Repulsion was again assessed using Hartigan’s dip test of unimodality in each of the four trial cases. As in Experiment 1, dip tests revealed a significant effect in the low-boundary/low-region case (dip = 0.032, p < .001) but no significant effects in the low-boundary/high-region (dip = 0.011, p = .930), high-boundary/low-region (dip = 0.010, p = .984), or high-boundary/high-region (dip = 0.011, p = .908) cases. This again suggests that repulsion effects were more prominent in the low region, although in this case, such results may be attributable to a greater proportion of the mass falling above the boundary point in the high-boundary/high-region case.
Distribution of participants’ estimates of the answer to each question in Experiment 2, separately for each of the four trial cases. Dashed lines indicate decision boundaries preceding those estimates.
As in Experiment 1, the dip test was supplemented with an additional analysis comparing the rate of responses around each boundary value between boundary conditions (results are summarized in Fig. 6; for full details of these comparisons, see https://osf.io/s2md8/). This test again revealed significantly higher response rates around the boundary value for the distant boundary cases, further suggesting that participants had an aversion to estimates close to a displayed boundary, although the effect does appear more consistent between regions than in the previous experiment. Once again, however, this effect extended for only ±2 points around the boundary, eventually crossing over into anchoring effects at wider windows. As in the previous experiment, a nonparametric version of this analysis found nearly identical results, detailed further in the Supplemental Material. 4
Mean proportion of responses falling within expanding windows around each boundary value (25.5 [low] vs. 75.5 [high]) as a function of boundary condition (local vs. distant) in each stimulus region in Experiment 2. Shaded areas denote 95% confidence intervals, corrected for within-subjects variation (O’Brien & Cousineau, 2014). Asterisks denote regions of significant repulsion effects (
Summary
The results of Experiment 2 are highly consistent with those of Experiment 1, showing evidence of both anchoring and repulsion within cognitive estimates. This provides further evidence that such effects are not restricted to a specific domain but may both be considered general properties of human judgments.
Discussion
Across two experiments, we found that judgments of both perceptual and cognitive targets can be biased by preceding comparison decisions in two opposing ways: Judgments are drawn toward distant comparison values but pushed away from nearby comparison values. These data replicated both anchoring and repulsion effects documented in the existing literature but notably did so within the same task structure, the key deciding element being the relative position of the boundary to the target. Anchoring and repulsion may not be as opposed as they initially appear but could in fact be two aspects of an overarching estimation process that reacts differently to varying decision boundaries. Such findings bridge the previously disconnected literatures on these phenomena, revealing the importance of considerations of each effect to the other: Decision biases clearly do not run entirely in one direction but are sensitive to specific details of the task at hand. Furthermore, the consistency in results between the perceptual and cognitive tasks shows that both effects are not restricted to the domain in which they were originally shown, providing evidence that these effects are general aspects of human judgment rather than the result of more specialized systems, such as the sensory-reweighting explanation of repulsion (Jazayeri & Movshon, 2007).
The co-occurrence of these effects therefore carries major implications for existing theories of human judgment; as previously noted. Although many explanations have been offered for both anchoring and repulsion, they are designed to account for only one of these effects and so do not consider the other. These results demonstrate the need for theories that can unite these phenomena to accurately describe the range of human behavior, as any individual explanation alone is clearly insufficient. One avenue for such work is to look for potential combinations of existing explanations to create more general theories, although this is reliant on coherence between the individual elements. In this regard, we suggest that sampling theories are a particularly compelling candidate, not only having been offered for both effects individually (Lieder et al., 2018; Zhu et al., 2019) but also more naturally fitting together because of their common framework; indeed, we provide a preliminary definition of such a model in the Supplemental Material, showing that this model can predict both effects. Sampling theories also carry the advantage of explaining various other judgment biases beyond anchoring and repulsion (Dasgupta et al., 2017; Sanborn et al., 2021; Zhu et al., 2020), presenting the current findings as one aspect of a general resource-rational depiction of human behavior.
This is not to say that sampling is the only solution that can unite anchoring and repulsion; the current data do not provide sufficient detail to identify the underlying processes in these tasks, meaning that it remains possible that this co-occurrence may simply reflect the overlap of previously suggested independent mechanisms. Even so, this finding does at least constrain potential combinations to those with compatible mechanisms: If judgments are subject to both biases, then the factors responsible must ultimately be somehow integrated into a single response. Although this is simple for sampling mechanisms, other combinations are far less clear: For example, it is complicated to determine how anchoring theories such as scale distortion can be reconciled with self-consistency explanations for repulsion or, indeed, how sampling and nonsampling elements might be combined. This may not invalidate such theories but does present substantial challenges to be answered, whereas sampling’s consistent framework has an advantage in terms of parsimony. More targeted experimental designs, such as manipulations of response time or accuracy incentives that may impact the number of samples taken for a response, are thus required to further assess the sampling explanation and thereby the degree of bias. We therefore offer these results as a foundation for further research, providing new behavioral targets for future models.
It should also be noted that these results do not mean that anchoring and repulsion co-occur in all situations; indeed, an additional experiment (reported in the Supplemental Material) using an alternate cognitive-judgment task revealed evidence of repulsion but no replication of anchoring when questions were repeated multiple times. Such results help to illustrate the limits of these phenomena both individually and in combination and will require further development to define when and why such effects are displayed; for example, does the co-occurrence persist for incidental comparison values in place of explicit boundaries or where estimates are not constrained to a limited scale? This will be a key factor in distinguishing between models of these effects in subsequent research. More broadly, the current results present this co-occurrence only for two particular tasks (dot numerosity and age questions), both using similar online participant samples. Further work may therefore be required to assess how these findings generalize to alternate stimuli and subjects, though these data do already show consistent patterns across cognitive and perceptual domains, offering some support for their generality. It is also notable that anchoring itself has been found to be one of the more robust decision biases, displayed across both tasks and populations (Chapman & Johnson, 1999; Ariely et al., 2003; Epley & Gilovich, 2006; Harris & Speekenbrink, 2016), though the literature on repulsion is less extensive, which suggests that further examination is still needed.
Supplemental Material
sj-pdf-1-pss-10.1177_09567976221089599 – Supplemental material for Perceptual and Cognitive Judgments Show Both Anchoring and Repulsion
Supplemental material, sj-pdf-1-pss-10.1177_09567976221089599 for Perceptual and Cognitive Judgments Show Both Anchoring and Repulsion by Jake Spicer, Jian-Qiao Zhu, Nick Chater and Adam N. Sanborn in Psychological Science
Supplemental Material
sj-pdf-2-pss-10.1177_09567976221089599 – Supplemental material for Perceptual and Cognitive Judgments Show Both Anchoring and Repulsion
Supplemental material, sj-pdf-2-pss-10.1177_09567976221089599 for Perceptual and Cognitive Judgments Show Both Anchoring and Repulsion by Jake Spicer, Jian-Qiao Zhu, Nick Chater and Adam N. Sanborn in Psychological Science
Footnotes
Transparency
Action Editor: Vladimir Sloutsky
Editor: Patricia J. Bauer
Author Contributions
J. Spicer, J.-Q. Zhu, N. Chater, and A. N. Sanborn contributed to the concept and design of this study. J. Spicer coded and ran the experiments. J. Spicer analyzed the data in discussion with all the authors. J. Spicer drafted the manuscript, and the other authors provided revisions. All the authors approved the final manuscript for submission.
Notes
References
Supplementary Material
Please find the following supplemental material available below.
For Open Access articles published under a Creative Commons License, all supplemental material carries the same license as the article it is associated with.
For non-Open Access articles published, all supplemental material carries a non-exclusive license, and permission requests for re-use of supplemental material or any part of supplemental material shall be sent directly to the copyright owner as specified in the copyright notice associated with the article.