
Abstract
In our connected era, we spend significant time and effort satisfying our curiosity. Often, we choose which information we seek, but sometimes the selection is made for us. We hypothesized that humans exhibit enhanced curiosity in the context of choice. We designed a task in which healthy participants saw two lotteries on each trial. On some trials, participants chose which lottery to play. On other trials, the lottery was selected for them. Participants then indicated their curiosity about the outcome of the to-be-played lottery via self-report ratings (Experiment 1, N = 34) or willingness-to-wait decisions (Experiment 2, N = 34). We found that participants exhibited higher curiosity ratings and greater willingness to wait for the outcome of lotteries they had chosen than for lotteries that had been selected for them (controlling for initial preference). This demonstrates that choice boosts curiosity, which may have implications for boosting learning, memory, and motivation.
Keywords
Curiosity, our internal drive for information, is pervasive in everyday life and is a key driver of behavior (Kidd & Hayden, 2015). Humans have a preference for obtaining information, rather than missing out on it (Bennett et al., 2016; Charpentier et al., 2018; Rodriguez Cabrero et al., 2019; van Lieshout et al., 2018). In our connected era, we have a practically infinite amount of information at our fingertips. However, our time and (cognitive) resources are limited, and hence information selection is inevitable. In some cases, we can choose what information to consume (e.g., what websites to browse), but in other cases, the selection is made for us (e.g., in the traditional classroom). Given the pervasiveness of information seeking and the need for selection, understanding how choice of information influences curiosity is key.
Extensive evidence from behavioral and brain-imaging studies indicates that choosing an option increases its subjective value (Ariely & Norton, 2008; Brehm, 1956; Izuma et al., 2010; Sharot et al., 2009, 2010). Nevertheless, it is less clear whether choosing which information to sample also increases the subjective value of information, boosting curiosity. Preliminary support for this hypothesis comes from a recent study showing that (self-reported) interest was higher for participants who chose a topic (from a given set) than for participants who did not have a choice (Schutte & Malouff, 2019). However, in this study, analyses on effects of choice did not control for effects of prechoice preference.
We conducted two experiments, in which we separately quantified the effects of prechoice preference and of choice itself on curiosity. Furthermore, we used an implicit (as well as an explicit) measure of curiosity to reduce the impact of inferred demand characteristics of the task. Additionally, we manipulated two other factors that have been demonstrated to modulate curiosity—the expected value of the information and the size of the information update—to explore their relationship with the effect of choice on curiosity. Previous studies have demonstrated that participants are more curious the more positive they expect the information to be (Charpentier et al., 2018; Kobayashi et al., 2019; van Lieshout et al., 2018), as well as when they expect to receive a greater information update (i.e., a greater uncertainty reduction; Kobayashi et al., 2019; van Lieshout et al., 2018). Accordingly, we hypothesized that curiosity would increase as a function of the expected value and size of the information update and would be further boosted by choice. It was, however, unclear to us whether the effect of choice on curiosity would interact with the expected value of information (e.g., by amplifying subjective value) or with the size of the information update (e.g., by magnifying estimates of learning potential because of perceived controllability of the environment) or have independent effects.
Method
Participants
We tested participants until we had 34 usable data sets for each experiment. There was no prior research on the effect of choice on curiosity that we could rely on to determine the required sample size. We decided to obtain a sample size that would allow us to detect a within-subjects difference of at least a medium effect size (Cohen’s d > 0.5) with 80% power, using a two-tailed t test. A power analysis using G*Power (Version 3.1.9.3; Faul et al., 2007) indicated that this required a sample size of 34. Reassuringly, a recent study found an effect of choice on self-reported curiosity with a medium effect size (Schutte & Malouff, 2019), in line with the notion that our study was adequately powered to detect such effects.
Thirty-seven healthy individuals participated in Experiment 1, and another 40 healthy individuals participated in Experiment 2. Following our preregistration (https://osf.io/gseqn/), we excluded participants who missed more than 10% of total trials (Criterion 1). Additionally, we excluded participants who scored poorly according to at least one of two other performance criteria. Criterion 2 was when a participant gave the same curiosity rating in more than two thirds of their responses in Experiment 1 or made the same willingness-to-wait decision in more than 90% of their responses in Experiment 2. Criterion 3 was when a participant ranked lower than 3 standard deviations below the mean in choice-preference coherence (i.e., frequency of trials on which a participant chose the same vase that they had previously indicated that they preferred). We excluded three participants from Experiment 1 (one on the basis of Criterion 2 and two on the basis of Criterion 3) and six participants from Experiment 2 (five on the basis of Criterion 2 and one on the basis of Criterion 3). No participants were excluded on the basis of Criterion 1. The final sample in Experiment 1 (N = 34) included 26 women (age: M = 23.5 years, SD = 4.5); the final sample in Experiment 2 (N = 34) included 24 women (age: M = 23.5 years, SD = 3.1).
Statement of Relevance
Given the abundance of sources of information in our technological era, it is important to understand how selecting among them piques our curiosity. Our findings suggest that choice has a key role in determining what information we are more likely to consume: When we make an autonomous or free choice regarding what source to sample information from, we become more curious about that information. Free choice and autonomy, as tools to enhance curiosity and boost learning and memory, open up promising avenues for future research and applications. One clear domain of application is education, where the benefits of autonomy and curiosity for learning have been long recognized but remain to be exploited. Advancing our understanding of the benefits of choice on curiosity and learning will contribute to the tailoring of more robust educational interventions and programs.
All participants had normal or corrected-to-normal vision. Both experiments were approved by the local ethics committee (CMO Arnhem-Nijmegen, The Netherlands) under the general ethics approval for standard studies conducted at the Donders Centre for Cognitive Neuroimaging (CMO 2019/288 v. 2.2). Prior to participation, all participants gave written informed consent according to the Declaration of Helsinki.
Procedure
To assess the effect of choice on curiosity, we designed an experimental task in which we manipulated, on a trial-to-trial basis, whether participants made a choice or not and measured their subsequent curiosity. In each trial of the task, participants saw two lotteries, but only one was selected and played. Lotteries were depicted in the form of vases containing marbles, accompanied by a label indicating the number of points associated with each marble. Each vase contained 20 marbles of two types: blue and red. A marble could be worth any number from 10 to 90 points, in steps of 10 (10 points, 20 points, 30 points, etc.). The two types of marbles within a lottery always had different values. The distribution of marbles of each type within the vase ranged from 5% to 95% in steps of five (5%–95% of vase, 10%–90% of vase, 15%–85% of vase, etc.). On some trials, the participant chose the selected lottery, whereas on other trials, the computer selected it for them. Participants were told that they would always earn a monetary payoff in proportion to the points associated with the outcome of the selected lottery but that they could not always see the outcome after each trial. At the end of each trial, we assessed participants’ curiosity using ratings (Experiment 1: explicit curiosity) or willingness-to-wait decisions (Experiment 2: implicit curiosity).
The procedure for the two experiments was almost identical; the key difference was that in Experiment 2, participants could decide to see the outcome, whereas in Experiment 1, this was randomly determined. This resulted in three differences between the two experiments. First, during the sign-up and instructions of Experiment 1 (explicit curiosity), the term “curiosity” was used to describe the task, whereas in Experiment 2 (implicit curiosity), “wanting to see the outcome” was used instead. Second, the final part of each trial differed between the two experiments (Fig. 1), and third, this resulted in Experiment 2 being slightly longer in duration than Experiment 1. We used willingness to wait to assess curiosity implicitly, given that it is an acknowledged measure of the motivational value of an item (Frederick et al., 2002) and it has been used repeatedly to successfully measure curiosity (Kang et al., 2009; Marvin & Shohamy, 2016; van Lieshout et al., 2018; van Lieshout, Traast, et al., 2021).
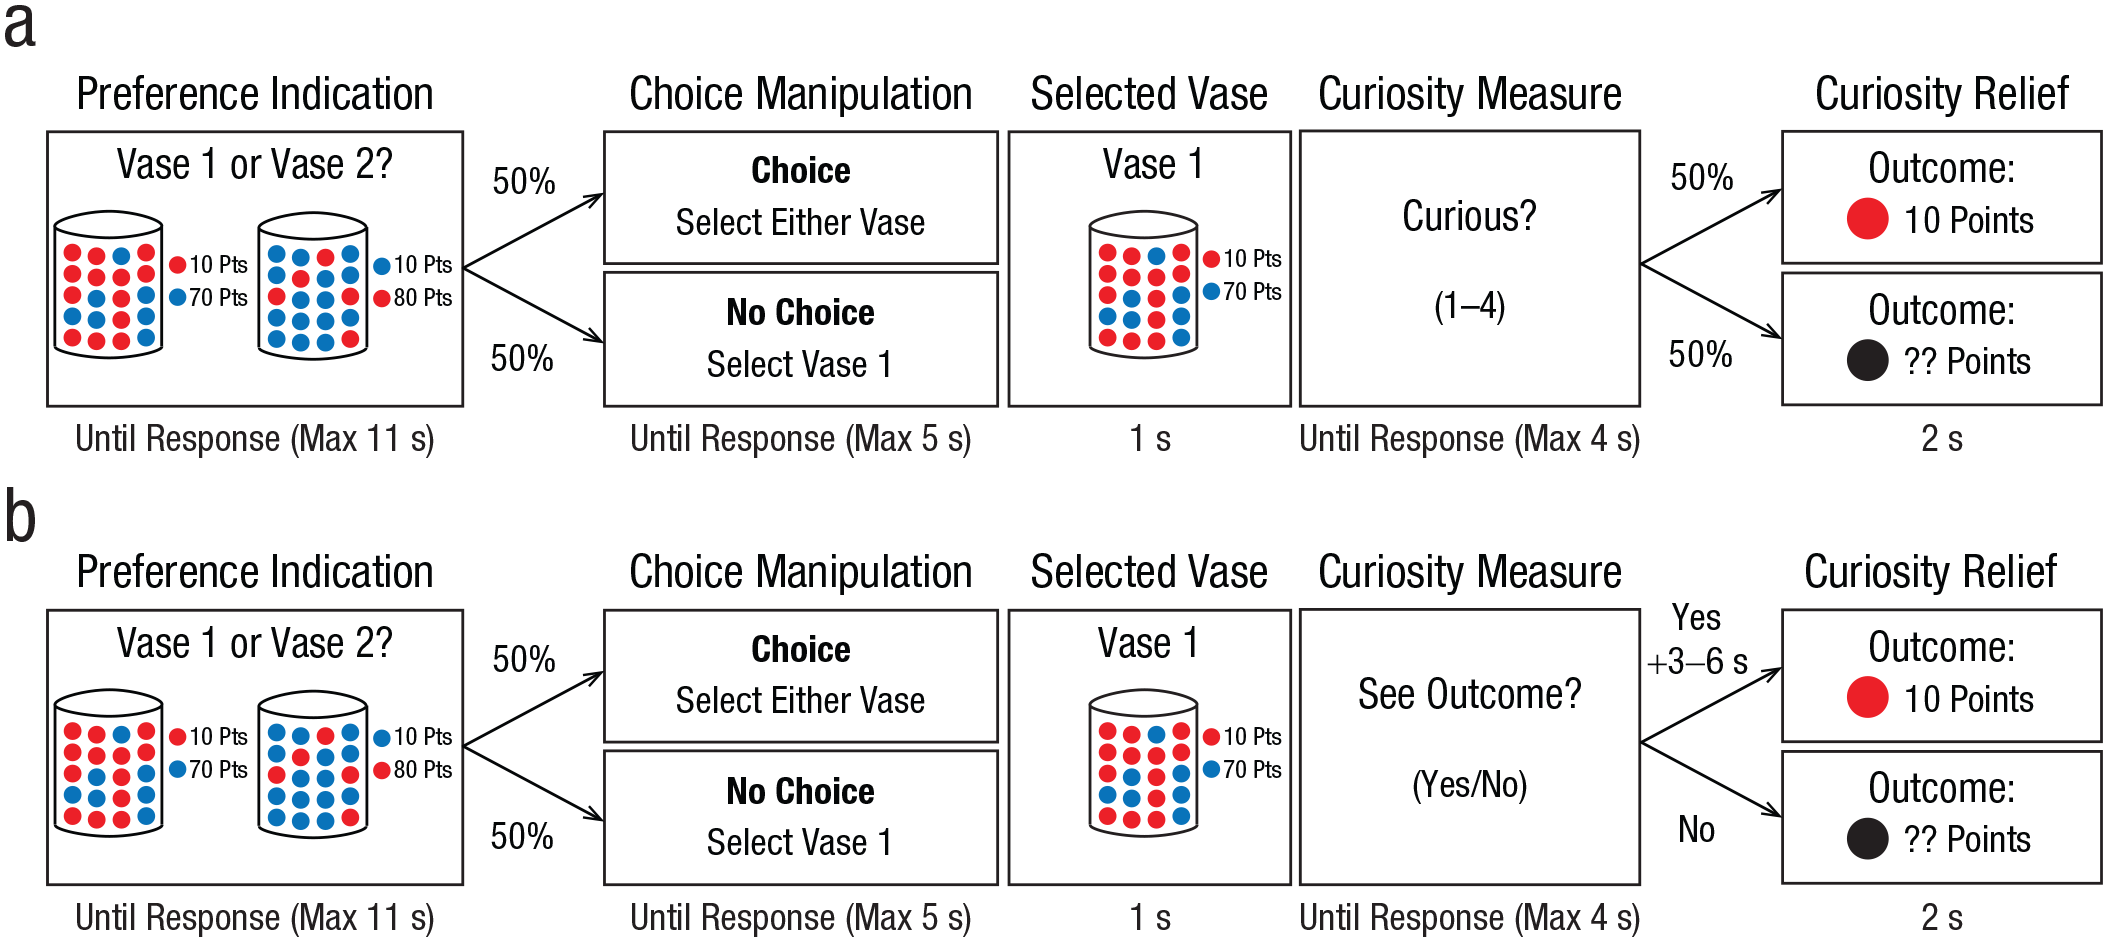
Example timelines from Experiments 1 and 2. At the beginning of each trial in Experiment 1 (explicit curiosity), participants saw two lotteries in the form of vases and indicated which one they preferred (a). After that, one of the two lotteries was selected, either by the participant (choice; 50% of trials) or by the computer (no choice; 50% of trials). This selected lottery both determined the reward that participants would receive and was subsequently addressed in the latter curiosity assessment, potentially providing curiosity relief. In no-choice trials, the computer selected the lottery initially preferred by the participant half of the time (no choice/preferred; 25% of total trials) and the other lottery half of the time (no choice/not preferred; 25% of total trials). This distinction within no-choice trials was not made explicit to participants. After providing a response, participants saw the selected lottery. They then indicated how curious they were using a scale ranging from 1 (not curious) to 4 (very curious). Finally, participants saw a screen in which the outcome of the lottery was either shown (50% of trials) or hidden (50% of trials). Whether the outcome was shown or hidden was determined randomly and was not contingent on participants’ curiosity responses. Participants were awarded the points corresponding to the outcome of the lottery in every trial (added to their total point sum), regardless of whether they got to see the outcome or not. The task in (b) Experiment 2 (implicit curiosity) was identical to that in Experiment 1, up to (and including) when participants saw the selected lottery. After seeing the selected vase, participants had to indicate whether or not they wanted to see the outcome of the lottery. If participants wanted to see the outcome, they waited an additional 3 s to 6 s before continuing to the final screen that showed the outcome. If they did not want to see the outcome, they continued without any additional delay to a final screen on which the outcome was hidden. As in Experiment 1, participants were awarded the points corresponding to the outcome of the lottery in every trial. Pts = points.
Before starting the experiment, participants received written instructions, after which they verbally summarized the task to the experimenter and performed two practice blocks (20 trials in total). We informed participants that each trial would begin with two lotteries, of which only one would be selected (either by them or by the computer) and played. For each selected lottery, either chosen by the participant or selected by the computer, a marble would be picked at random on the basis of the distribution in the vase, and the participant would earn the associated points. At the end of the experiment, all the points would be added, and the participant would receive a bonus payment proportional to the final amount.
In both experiments (Fig. 1), each trial began with a fixation cross shown for 0.5 s, followed by a blank screen for 0.5 s. Then, participants saw two lotteries side by side and had to indicate which lottery they preferred (“Vase 1 or Vase 2?”). Lotteries were presented until participants gave a preference response, up to a maximum of 10 s. If no preference was given within this time, the lotteries disappeared, and participants had an additional 1-s interval to respond (i.e., adding up to a total response time of 11 s). Participants then saw a blank screen for 0.5 s, followed by a cue indicating whether they would choose which of the two lotteries would be played (“Choose”; i.e., choice trials) or whether the lottery would be selected for them by the computer (“Match”; i.e., no-choice trials). This cue was presented for 1 s and was immediately followed by a response screen displaying the vase labels (“Vase 1” and “Vase 2”) and a rectangle between them (in choice trials) or highlighting one of the labels (in no-choice trials). The position in which each vase label was presented (i.e., left or right) was randomized on a trial-by-trial basis, so that participants had to attend to the screen instead of simply repeating the button press given at the preference stage of the trial. Participants always had to provide a response, either to choose or to match the option selected by the computer, within a maximum of 4 s. Then, participants saw a blank screen for 0.5 s, after which they saw the selected lottery again for 1 s, followed by another blank screen for 0.5 s. Up to this point, trials were identical in both experiments.
In Experiment 1 (explicit curiosity; Fig. 1a), each trial continued with a screen displaying the prompt, “How curious are you about the outcome?” to which participants responded on a scale from 1 (not curious) to 4 (very curious) within a period of 4 s. Participants responded with their right hand on a button box using their index finger, middle finger, ring finger, and little finger to indicate curiosity responses of 1, 2, 3, and 4, respectively. After a 0.5-s blank screen, participants saw a final screen for 2 s that displayed the selected lottery and a box with the shown or hidden outcome. When the outcome was shown, the box contained a marble of the color that had been picked (red or blue) and the points earned on that trial. When the outcome was hidden, the box contained a black marble and a string of question marks (“???”). The outcome box appeared with a 0.5-s delay after onset of the lottery and remained visible for 1.5 s. The outcome was shown in half of the trials and hidden in the other half to ensure that the task remained engaging. This was randomly determined and did not depend on participants’ curiosity ratings. We informed participants that the points they earned on every trial would be added to their final sum, regardless of whether they got to see the outcome or not.
In Experiment 2 (explicit curiosity; Fig. 1b), each trial continued with the prompt, “Do you want to see the outcome?” to which participants gave a binary “yes” or “no” response within a period of 4 s. Participants responded with their right hand on a button box using their index finger to indicate “yes” and their middle finger to indicate “no.” If participants pressed “no,” they continued (after a 0.5-s blank screen) to a final screen in which the outcome was hidden. If participants pressed “yes,” they waited an additional 3 s to 6 s before continuing to a final screen in which the outcome was shown. These displays were identical to those in Experiment 1. Critically, whether the outcome was shown or not was contingent on participants’ willingness-to-wait responses. All participants were aware of these contingencies and of the additional delay and knew that the points they earned on every trial would be added to their final sum regardless of whether they chose to see the outcome or not.
Trials could last a minimum and maximum of, respectively, 15 s and 26.5 s in Experiment 1 and 15 s and 32.5 s in Experiment 2. Throughout each trial, participants gave three responses: They (a) indicated which lottery they preferred, (b) selected a lottery (for choice and no-choice trials), and (c) indicated how curious they were (Experiment 1) or whether they wanted to wait to see the outcome (Experiment 2). If participants did not provide all three required responses within the allocated time, the trial was aborted, and participants saw a message during the remaining duration of the trial reminding them to respond faster.
The experiment was divided into eight blocks, each followed by a break. Participants spent between 1 hr 10 min and 1 hr 40 min in the lab in Experiment 1 and 1 hr 10 min and 1 hr 50 min in Experiment 2. The duration of the session in Experiment 2 was affected by the number of trials in which participants chose to see the outcome. Prior to signing up to the experiment, participants were told that they would be paid a fixed amount of €12 (Experiment 1) or €14 (Experiment 2) plus an undefined bonus. The base payment was proportional to the approximate duration of each experiment (1 hr 30 min and 1 hr 45 min, respectively). On the basis of the sum of the points that participants earned during the task, they all received a bonus of €1.5, resulting in compensation of €13.50 (or €15.50 if there was a delay) for Experiment 1 and €15.50 (or €17.50) for Experiment 2. The experiments were programmed and conducted using Presentation software (Version 20.2, Build 07.25.18; Neurobehavioral Systems, 2018).
Lotteries were paired, resulting in 116 unique combinations that were presented twice: once for choice and once for no-choice trials. This resulted in a total of 232 unique lotteries, which appeared in random order. Even though each pair of lotteries was presented twice, vases were sampled from a list of 232 different configurations (i.e., marbles in different positions of the vase, even for vases of the same type), so each exact trial display was unlikely to repeat itself. Vase configurations were counterbalanced for color so that neither red nor blue dominated the stimuli overall.
Design
To disentangle any effect of preference from the effect of choice (i.e., to deconfound initial preference for a lottery from the act of choosing a lottery), we ensured that participants indicated their preferences at the beginning of each trial. Participants then received a choice trial half of the time (50% of trials) and a no-choice trial the other half (50% of trials). In choice trials, participants freely chose the lottery themselves. In no-choice trials, the computer selected participants’ preferred lotteries half of the time (25% of trials; no-choice/preferred condition) and their not-preferred lotteries the other half (25% of trials; no-choice/not-preferred condition). By collecting participants’ preferences and manipulating the presence of choice, we were able to create these three distinct conditions, into which we later sorted trials: choice-preferred, no-choice/preferred, and no-choice/not-preferred trials. When contrasted in pairs, these conditions differed only in one critical dimension: By contrasting the choice-preferred with the no-choice/preferred condition, we assessed the effect of choice independent of preference; by contrasting the no-choice/preferred with the no-choice/not-preferred condition, we assessed the effect of preference under conditions of no choice. This allowed us to quantify the independent effects of preference and choice on curiosity.
Furthermore, we manipulated two other features of the lotteries: expected value and outcome uncertainty. We generated the values of expected value and outcome uncertainty by manipulating the distributions of marbles within a vase and their associated points.
The expected value for each lottery reflects its mean expected reward and was given by the average of the points associated with the marbles weighted by their distributions within the vase (i.e., probabilities of being picked). This was done as follows:
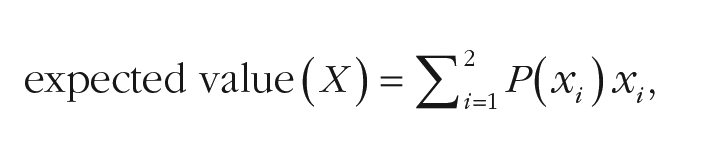
where P(xi) denotes the probability that a marble type i would be drawn, and xi denotes the points associated with such marble type (i.e., blue or red).
The value of outcome uncertainty for each lottery reflects the spread of the possible outcomes and was given by their variance. This was done as follows:
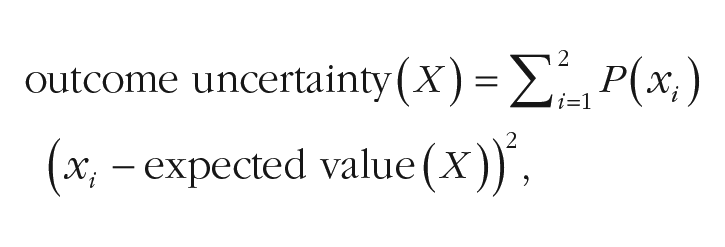
where P(xi) denotes the probability that a marble type i would be drawn, and expected value(X) denotes the expected value of the vase.
Note that we used a different calculation for outcome uncertainty than in a previous study using a similar task (van Lieshout et al., 2018) and different from the calculation we initially preregistered. Given that both metrics are nearly identical, and variance is a more common measure of uncertainty (Preuschoff et al., 2008; Symmonds et al., 2011), we decided to adopt this metric of outcome uncertainty.
Pairs of lotteries were closely matched in terms of both expected value and outcome uncertainty. By sampling a range of values of expected value and outcome uncertainty, we aimed to gain insight into the mechanisms underlying any effect of choice on curiosity.
Analysis
Preprocessing and filtering
We read in, concatenated, filtered, and summarized the data using RStudio (Version 1.1.383; RStudio Team, 2020) in the R programming environment (Version 3.5.3; R Core Team, 2019). We filtered out trials in which participants missed or did not respond within the allocated times for any of the three required responses (0.37% of total trials in Experiment 1; 0.37% in Experiment 2). Furthermore, we filtered out choice trials in which participants had chosen a lottery other than their preferred one (2.73% of total trials in Experiment 1; 2.93% in Experiment 2). Because we expected participants to exhibit their preferences through their choices, we assumed that inconsistencies were due to changes of mind or response errors.
We sorted the remaining trials into three selection conditions: choice-preferred trials (48.61% of included trials in Experiment 1; 48.42% in Experiment 2), no-choice/preferred trials (25.72% of included trials in Experiment 1; 25.79% in Experiment 2), and no-choice/not-preferred trials (25.67% of included trials in Experiment 1; 25.79% in Experiment 2).
Mixed-effects modeling using brms
We modeled the data using the brm function of the brms package (Version 2.13.0) in the R programming environment (Bürkner, 2017, 2018), fitting a cumulative-logit model for the ordinal response data from Experiment 1 and a Bernoulli distribution model for the binomial response data from Experiment 2. We used the brms package instead of the initially planned approach (see the preregistration), given that the brms package has functions for both ordinal and binomial data, allowing for a more consistent analysis approach. Furthermore, we performed additional statistical analyses using repeated measures analyses of variance (ANOVAs) and their Bayesian equivalent (see the Supplemental Material available online) to verify the robustness of our results and to quantify the evidence for the null hypothesis for nonsignificant results.
The dependent variable in Experiment 1 was curiosity rating, an ordinal variable containing the values 1, 2, 3, and 4. In Experiment 2, the dependent variable was willingness to wait, a binary variable with the values “no” and “yes” that we recoded to 0 and 1, respectively, for this analysis.
The independent variables of interest were selection condition (choice preferred, no choice/preferred, and no choice/not preferred), expected value, and outcome uncertainty. Expected value and outcome uncertainty were continuous predictors, which we mean-centered and scaled. Selection condition was a factor with three levels, for which we created two sum-to-zero contrasts. We contrasted choice-preferred with no-choice/preferred trials to assess the effect of choice, and no-choice/preferred with no-choice/not-preferred trials to assess the effect of preference. With categorical predictors, brms provides estimates only for each contrast and not for the factor as a whole. Given that we were interested in disentangling the effects of choice and preference, this was suitable. Hence, in the results of the analysis with brms, we report statistics only for each contrast and not for the factor of selection condition as a whole.
Both models in brms (for Experiment 1 and Experiment 2, respectively) included predictors for the main effects of selection condition (represented as the two contrasts described earlier), expected value, and outcome uncertainty, as well as for the interactions between (a) selection condition and expected value and (b) selection condition and outcome uncertainty, as fixed effects. The models included a full random-effects structure (Barr, 2013; Barr et al., 2013) so that a random intercept and random slopes for all effects were included for each participant.
We fitted the models using four chains with 10,000 iterations (5,000 for warm-up) and inspected the model summaries for convergence (paying attention to
Data visualization
For data visualization, we recoded the values of the independent variable in Experiment 2 from “no” and “yes” to 0 and 100, so that the mean implicit curiosity value reflected participants’ willingness-to-wait percentage.
Furthermore, we transformed the dependent variables in both experiments (curiosity ratings in Experiment 1 and willingness to wait in Experiment 2) to avoid any effects of expected value in the outcome-uncertainty plots and vice versa. Even though expected value and outcome uncertainty were manipulated independently and showed no significant linear correlation, these two predictors were operationalized such that high values of outcome uncertainty were possible only for trials with intermediate values of expected value. Plotting the raw data for each predictor without correcting for the other would distort its relationship with curiosity in the visualization. To avoid this, we fitted a linear regression for each participant and condition with curiosity as the dependent variable and outcome uncertainty as the predictor and used the residuals plus the mean as the corrected curiosity values in the expected value visualization. We performed the same procedure in the outcome-uncertainty visualization.
Next, we organized the data from the continuous predictors, expected value and outcome uncertainty, into four bins. We calculated the first, second, and third quartiles to be used as cutoffs between bins. We included trials with values below or equal to the first quartile in Bin 1, trials above the first quartile and below or equal to the second quartile in Bin 2, and so forth for Bins 3 and 4. Finally, we calculated the mean of the dependent variable for each bin and selection condition. To display error bars representative of the within-subjects study designs, we subtracted the subject-specific mean for all cells and calculated the demeaned standard errors of the mean. We performed this separately for both expected value and outcome uncertainty. This visualization is shown in Figure 2.
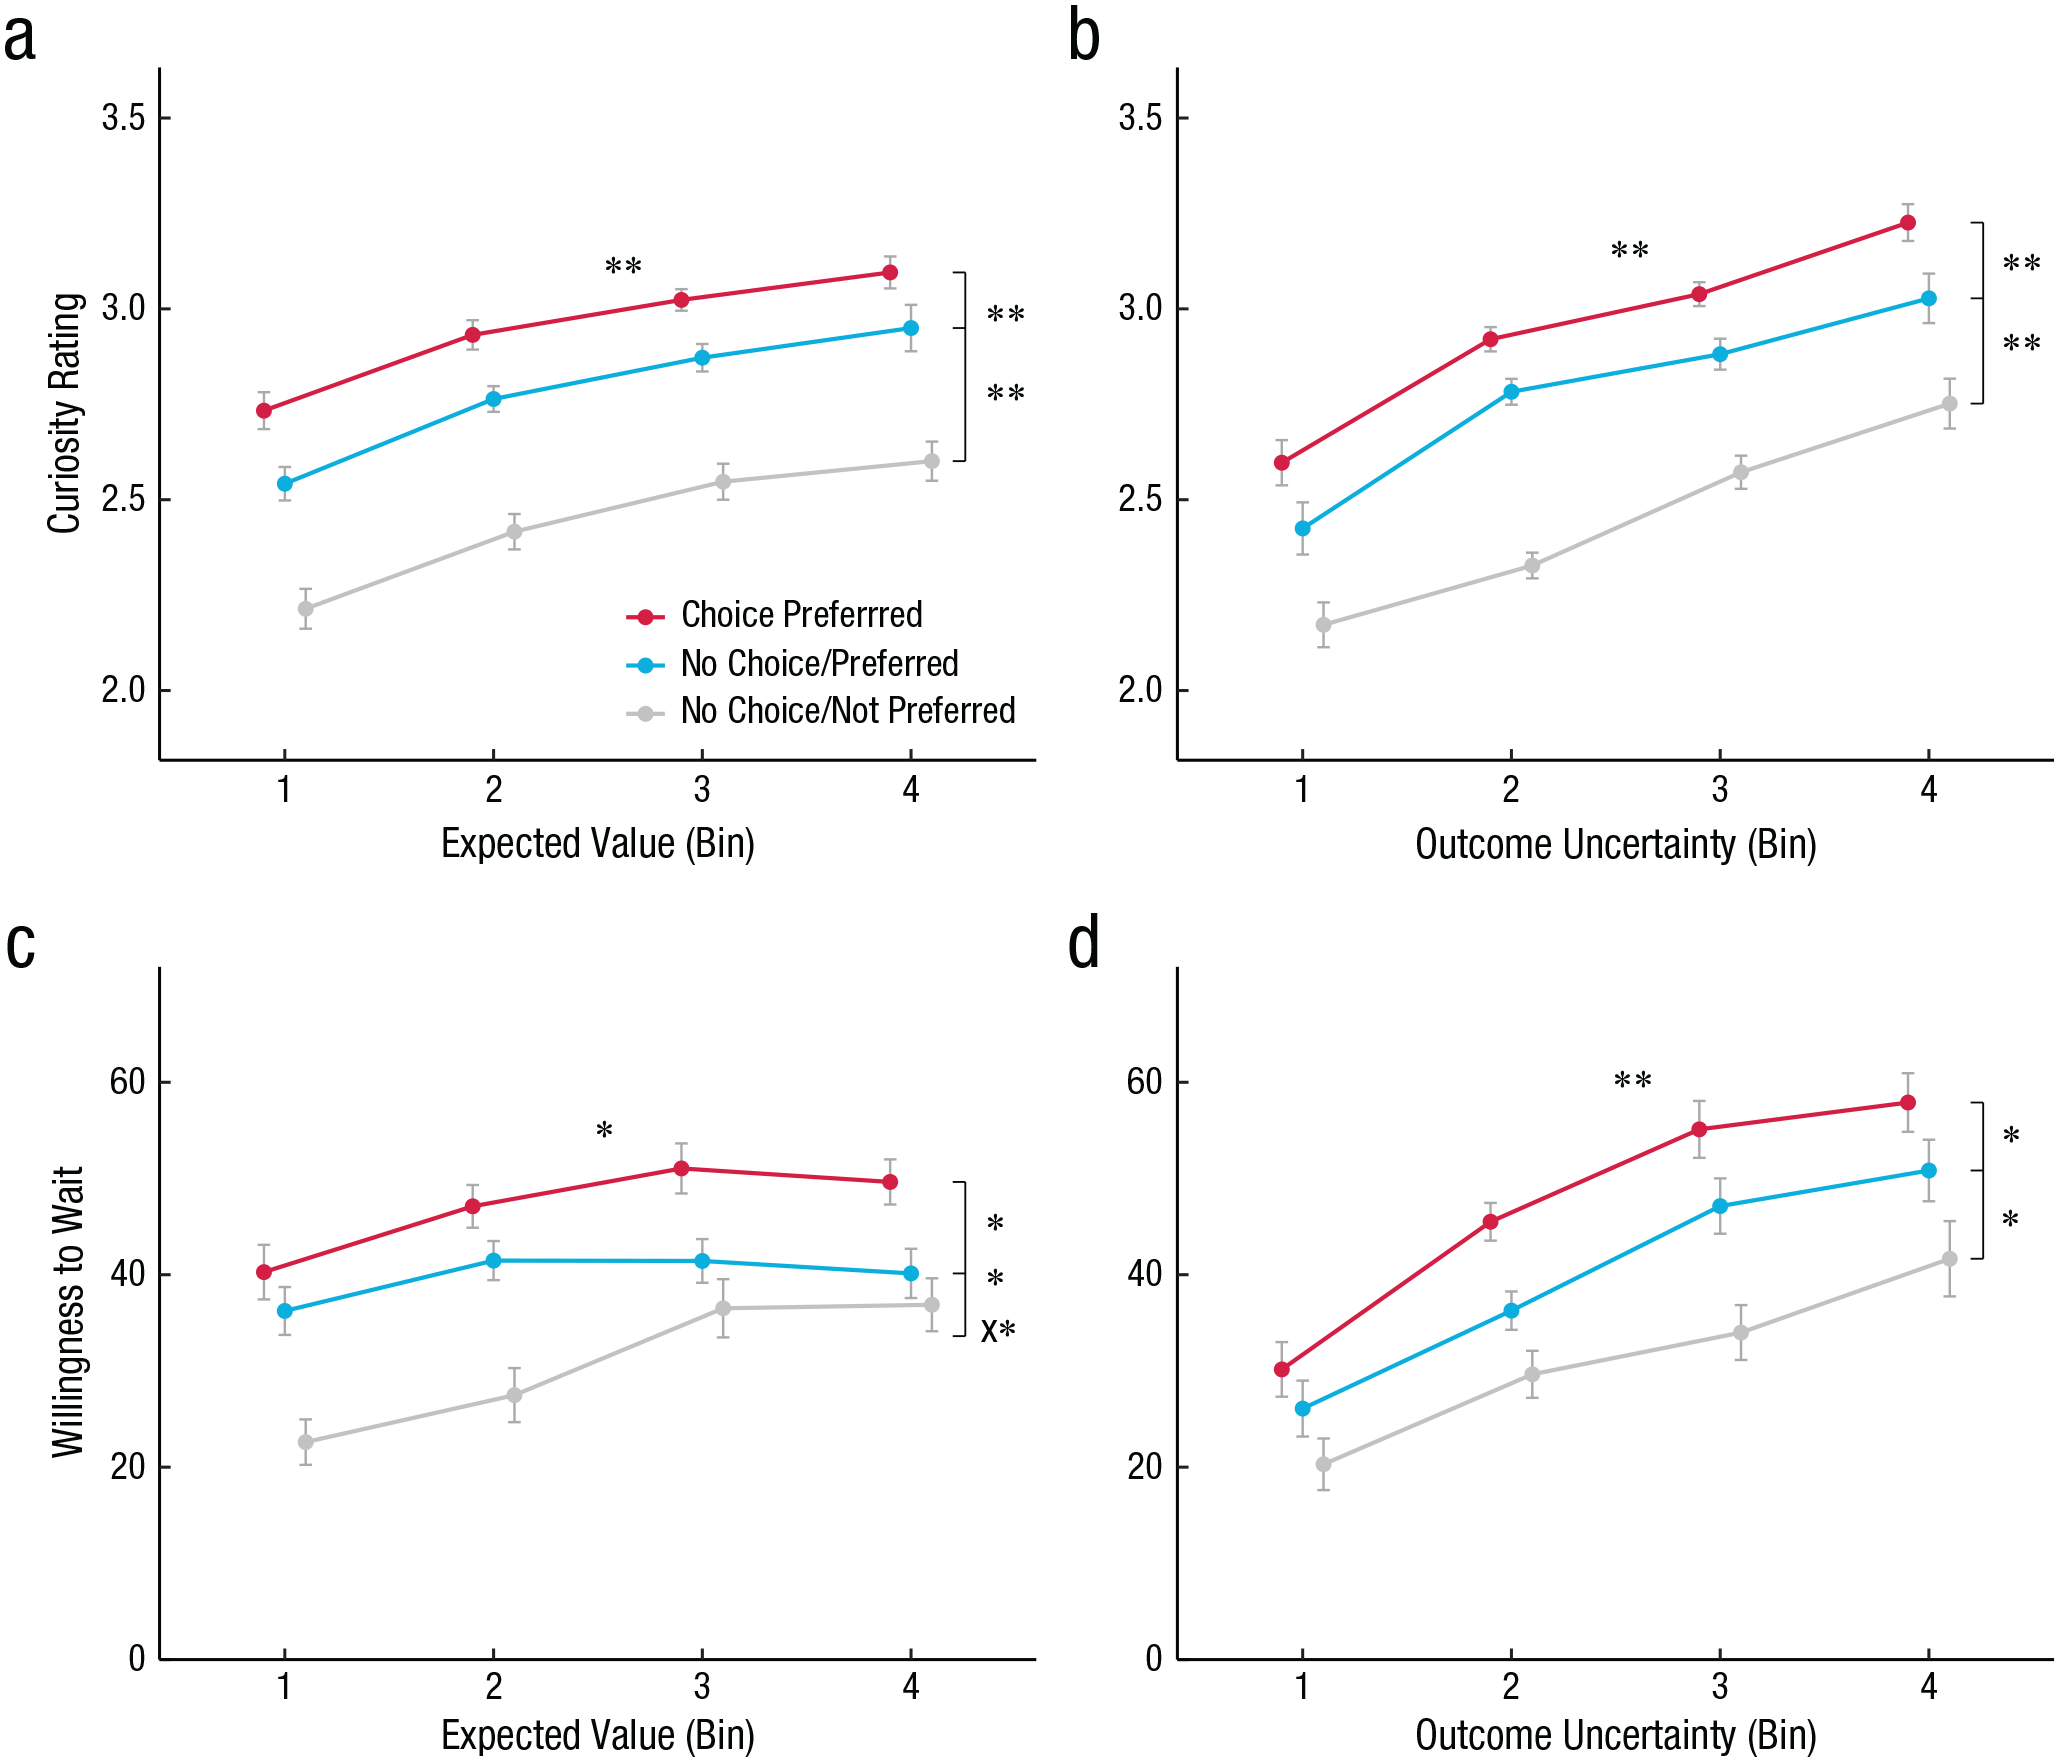
Choice and preference in Experiment 1 (explicit curiosity) and Experiment 2 (implicit curiosity). The mean curiosity rating in each of the three selection conditions in Experiment 1 is shown as a function of (a) expected value and (b) outcome uncertainty. Curiosity ratings were given on a scale from 1 (not curious) to 4 (very curious). The mean percentage of willingness-to-wait decisions in each of the three selection conditions in Experiment 2 is shown as a function of (c) expected value and (d) outcome uncertainty. Willingness to wait was indexed by the percentage of “yes” responses to the question of whether participants wanted to see the outcome of each trial. Error bars represent standard errors after subject-specific means were subtracted (demeaned standard errors of the mean). Asterisks next to brackets indicate significant differences between conditions (*p < .01, **p < .001), as determined by repeated measures analyses of variance. The X in (c) indicates that there was an interaction between expected value and selection conditions no choice/preferred vs. no choice/not preferred. The asterisks above the slopes indicate a main effect of expected value (a, c) and a main effect of outcome uncertainty (b, d).
Additionally, to illustrate to what extent participants showed choice and preference effects, we calculated the mean curiosity ratings in Experiment 1 and willingness-to-wait percentages in Experiment 2 for each participant and selection condition. This visualization is shown in Figure 3.
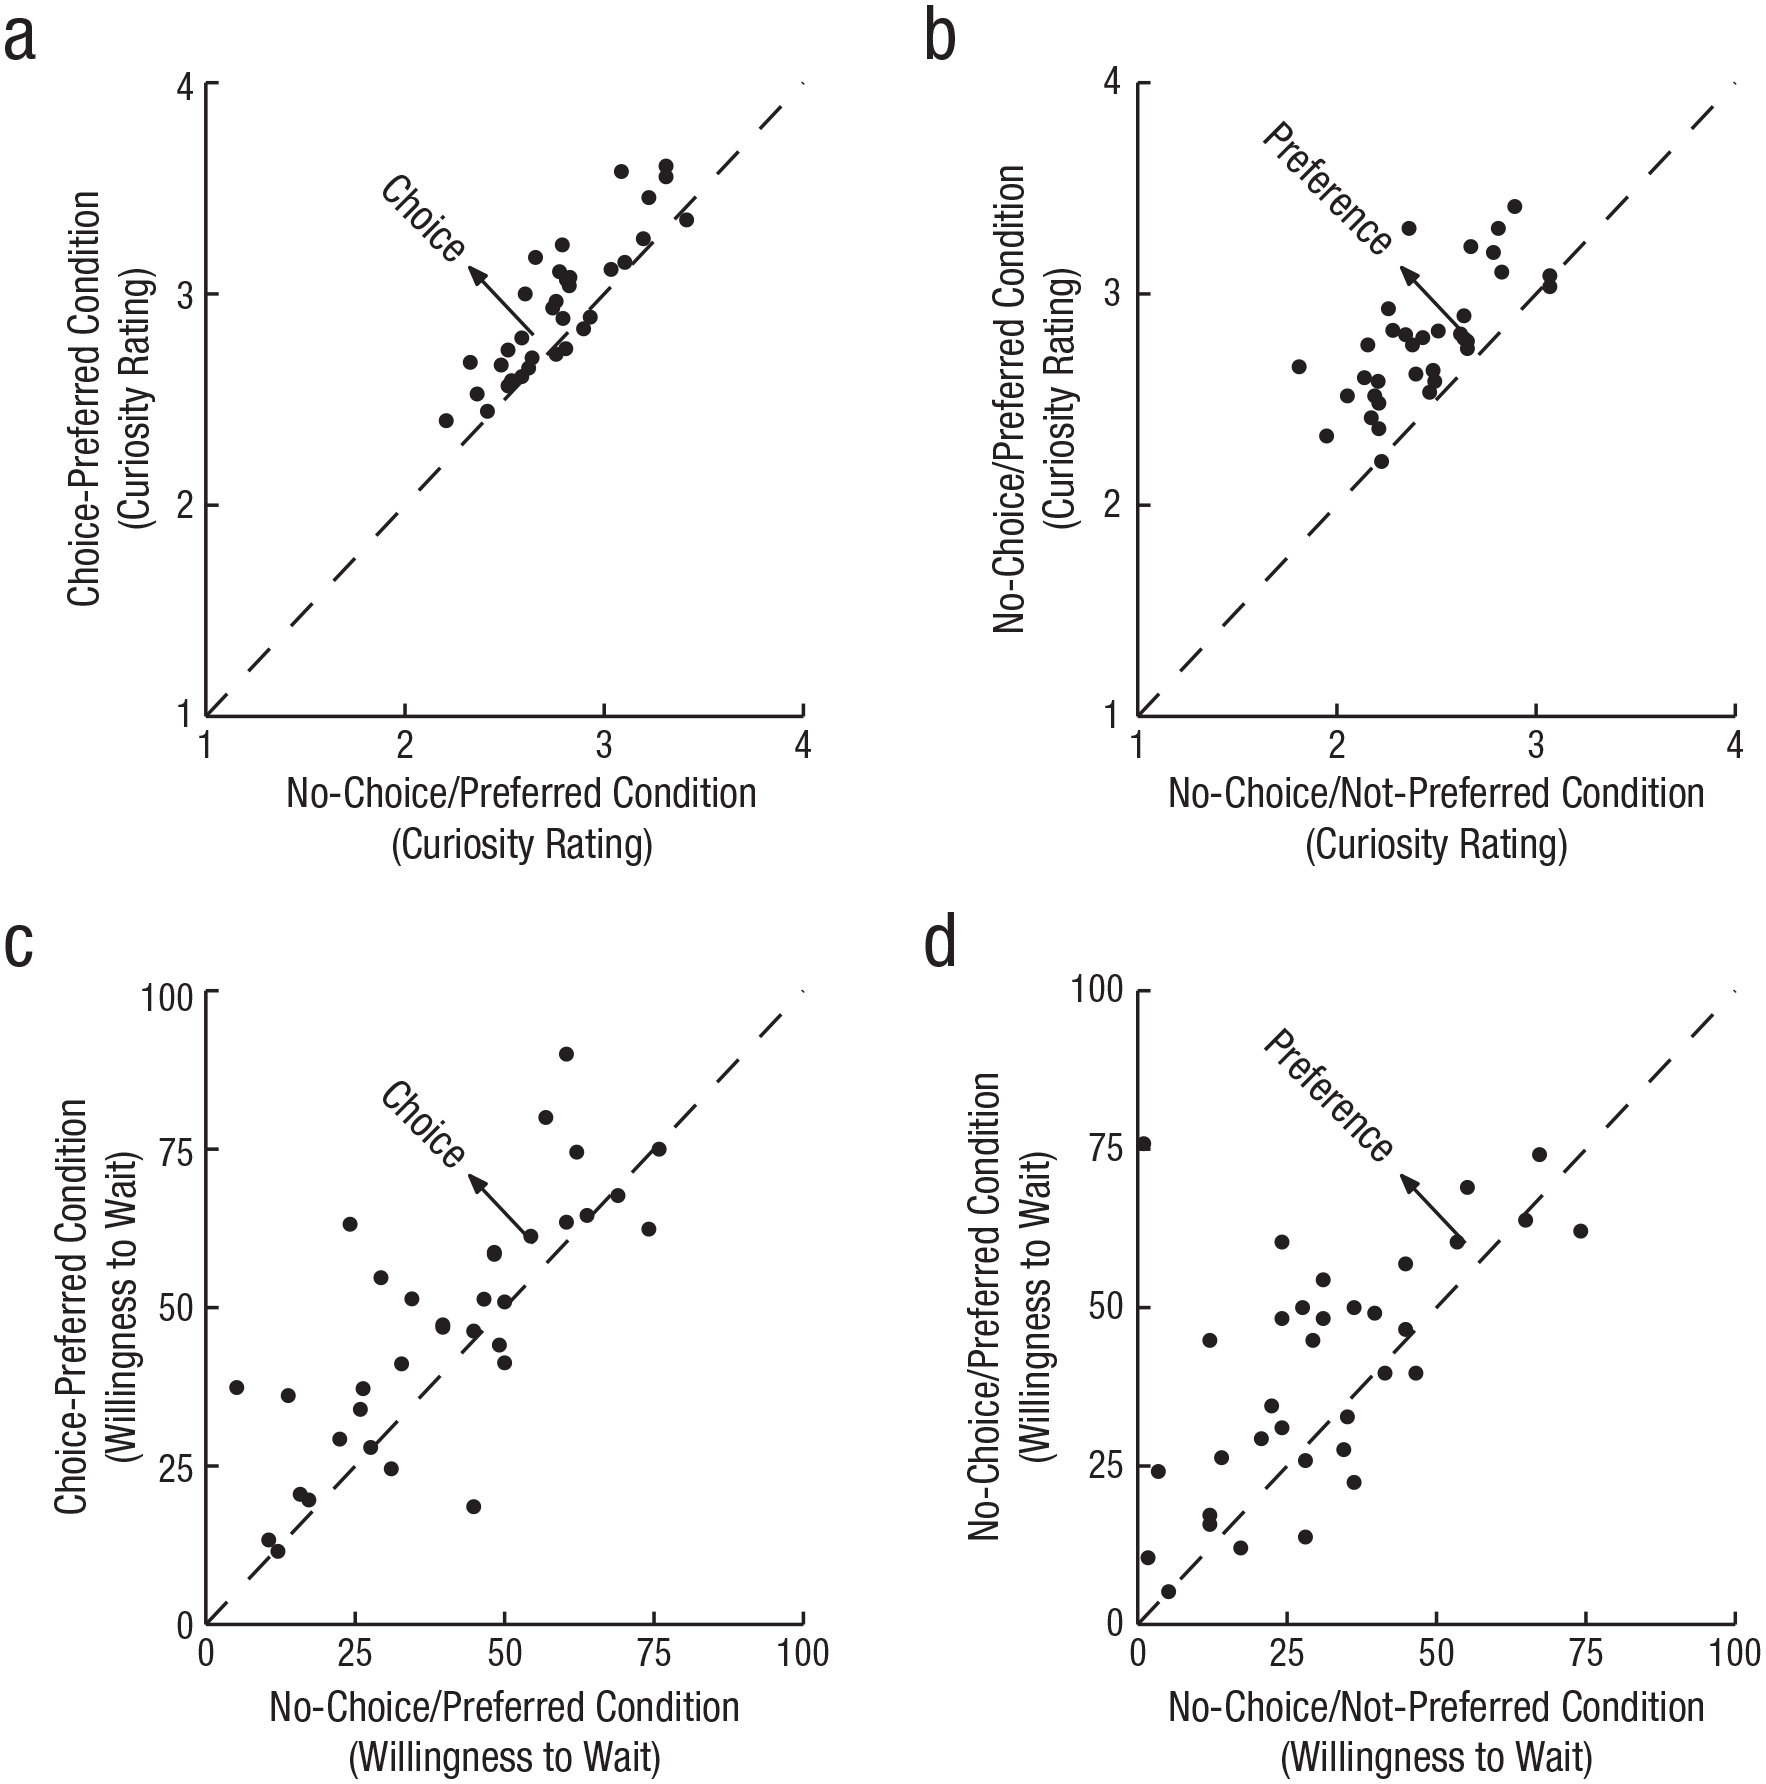
Comparisons between selection conditions in Experiment 1 (explicit curiosity; top row) and Experiment 2 (implicit curiosity; bottom row). The top row shows the relation between individual curiosity ratings in (a) the choice-preferred and no-choice/preferred conditions and (b) the no-choice/preferred and no-choice/not-preferred conditions. The bottom row shows the relation between willingness-to-wait decisions in (c) the choice-preferred and no-choice/preferred conditions and (d) the no-choice/preferred and no-choice/not-preferred conditions. The degree to which each point deviates from the diagonal in the 45° left-upward direction (indicated by the arrow) represents the magnitude of each effect for a given participant.
Results
Choice and preference independently enhanced curiosity
Choice enhanced curiosity; participants were more curious about lotteries that they had chosen themselves (curiosity ratings: M = 2.94, SD = 0.33; willingness to wait: M = 47.19%, SD = 19.81%) than about those that had been provided to them (matching their preference; curiosity ratings: M = 2.78, SD = 0.3; willingness to wait: M = 40.19%, SD = 19.23%). This was the case when curiosity was measured explicitly (brms contrast: 95% CI = [0.46, 0.71]; Figs. 2a and 2b) as well as implicitly (95% CI = [0.24, 0.63]; Figs. 2c and 2d). Additionally, we found an effect of preference: When lotteries were provided to participants, they were more curious about lotteries that they had indicated as preferred relative to their not-preferred ones (curiosity ratings: M = 2.44, SD = 0.3; willingness to wait: M = 30.66%, SD = 18.63%). Again, this was the case when curiosity was measured explicitly (95% CI = [0.57, 0.85]; Figs. 2a and 2b) as well as implicitly (95% CI = [0.24, 0.76]; Figs. 2c and 2d).
These effects of choice and preference on curiosity were present in a large proportion of the participants (Fig. 3).
Curiosity increased as a function of expected value and outcome uncertainty
Furthermore, we found that curiosity monotonically increased with expected value; the larger the reward participants expected to earn, the more curious they were. This was the case when curiosity was measured both explicitly (95% CI = [0.24, 0.51]; Fig. 2a) and implicitly (95% CI = [0.08, 0.31]; Fig. 2c).
Similarly, curiosity monotonically increased with outcome uncertainty; when lotteries were more uncertain (i.e., the larger the information update participants could gain), the more curious participants were. This was the case when curiosity was measured explicitly (95% CI = [0.31, 0.72]; Fig. 2b) as well as implicitly (95% CI = [0.23, 0.65]; Fig. 2d).
The effect of expected value on explicit curiosity did not differ between chosen and provided lotteries (95% CI = [−0.07, 0.05]) or between preferred and not-preferred lotteries (95% CI = [−0.10, 0.11]). However, we did find an interaction between expected value and selection condition when assessing curiosity implicitly: Whereas the effect of expected value on implicit curiosity did not differ between chosen and provided lotteries (95% CI = [−0.09, 0.07]), it did differ significantly between preferred and not-preferred lotteries (95% CI = [−0.23, 0.03]; Fig. 2c).
Additionally, the effect of outcome uncertainty on curiosity did not differ between selection conditions, whether curiosity was measured explicitly (choice vs. no choice: 95% CI = [−0.02, 0.12]; preferred vs. not preferred: 95% CI = [−0.09, 0.05]) or implicitly (choice vs. no choice: 95% CI = [−0.06, 0.11]; preferred vs. not preferred: 95% CI = [−0.07, 0.17]).
Discussion
In the current set of experiments, we assessed whether freely choosing which information to sample increased curiosity. We found that curiosity about the outcome of a lottery was enhanced for lotteries that were freely chosen, relative to lotteries that were equally preferred but not freely chosen. In the absence of choice, curiosity was higher for lotteries that were preferred than for those that were not preferred. Furthermore, we investigated the effects of expected value and outcome uncertainty of lotteries on curiosity. In line with previous findings (Charpentier et al., 2018; Kobayashi et al., 2019; van Lieshout et al., 2018), our results showed that curiosity increased as a function of both of these factors. Interestingly, the effect of choice was independent of expected value and outcome uncertainty: Choice enhanced curiosity irrespective of how valuable the outcome was expected to be and of how much information could be gained from seeing it.
Choice boosted curiosity when participants reported their curiosity levels both explicitly (Experiment 1) and implicitly, by deciding to “pay” for information with their time (i.e., willingness to wait; Experiment 2). The fact that participants not only self-reported increased curiosity but were willing to give up a valuable resource (i.e., time) to see the outcome makes it unlikely that the effects were due to any inferred experimental-demand characteristics.
Our finding that choice increased curiosity generalizes the phenomenon of choice-induced preference change, observed in studies on value-based choice (Brehm, 1956; Izuma et al., 2010; Sharot et al., 2009, 2010), to the context of information seeking: Choice might boost the value of information just as it boosts the value of chosen options. Future studies could employ pre- and postchoice neuroeconomic preference tools to establish whether choice indeed alters the subjective value assigned to information.
Regarding what mechanisms underlie this choice-related curiosity boost, one possibility is that choice enhanced curiosity via an increase in (subjective) expected value. On the basis of previous evidence that perceived control inflates the subjective value of options proportionately to their objective value (Wang & Delgado, 2019), we initially predicted that an effect of choice on curiosity mediated by an increase in subjective expected value would result in an interaction between choice and expected value, whereas we observed an additive effect. Nevertheless, it is possible that choice enhanced curiosity by increasing subjective expected value equally for all levels of objective expected value. We cannot evaluate this possibility with our current data, but it is an interesting question that could be addressed in future studies using a revealed-preference procedure to assess participants’ subjective valuations of the chosen and unchosen vases.
Another possibility is that this choice-induced increase in curiosity resulted from participants’ drive to improve the quality of their decisions (i.e., learning to make better choices). Humans might learn through lifelong exposure that information and self-evaluation are especially useful under circumstances of agency (e.g., choice has been suggested to boost prediction errors; Cockburn et al., 2014). Hence, even though in our task, choice and no choice did not differ regarding learning opportunity, choice might generally boost capacity (or willingness) to learn, having enhanced curiosity in choice versus no choice in our experiment.
Alternatively, it could be that, rather than choice enhancing curiosity, no choice reduced it. In the choice condition, participants’ preferred lottery was always selected, but it was selected only half of the time in the no-choice condition. This could have generated an aversive association between no-choice and unfavored options or outcomes, in comparison with which choice appeared to boost curiosity. In this case, we would expect the effect of choice on curiosity to have increased throughout the task, as participants learned the contingencies and developed the aversive association for the no-choice condition. Follow-up analyses suggest that the effect of choice on curiosity was stable throughout the task (see the Supplemental Material), rendering this explanation unlikely. It remains possible that participants exhibited an aversion toward the no-choice condition right from the start. Further investigation is needed to assess to what extent choice increases curiosity and no-choice decreases it, for instance in a between-subjects experiment, in which one group performs the current task (choice vs. no choice) and another a no-choice task (otherwise matched).
An intriguing question for future work pertains to the neural mechanisms underlying the effect of the choice-related curiosity boost. Given the link between midbrain dopamine neuronal firing and information-prediction errors (Bromberg-Martin & Hikosaka, 2011), it is plausible that the mechanism suggested to underlie choice-induced preference change, involving feedback projections from the striatum to the midbrain (Cockburn et al., 2014), could also account for choice-induced increases in curiosity.
In addition, the noradrenaline system might play a role, given its implication in modulating arousal, which is likely enhanced in conditions of increased autonomy (Howells et al., 2010; Sara & Bouret, 2012; Varazzani et al., 2015). A role for noradrenaline in information seeking is also supported by recent evidence suggesting pharmacological blockade of noradrenergic-receptor stimulation with propranolol, decreased information gathering in a task in which participants uncovered cards until they felt confident to guess a predominant feature (Hauser et al., 2018). Hence, the increased autonomy experienced under choice in our task may have further implicated the noradrenergic system, boosting participants’ information-seeking drive.
Preference enhanced curiosity. In other words, for lotteries selected without participants having a choice, they were more curious about lotteries that they preferred than those they did not, suggesting that preference itself boosts the perceived value of information. Alternatively, it is possible that the mechanism underlying the effect of preference on curiosity was akin to that of choice, given that in our experiments, participants had to provide a preference indication (i.e., engaging in a comparison process, making a decision, and executing a response), which they might have experienced as a kind of choice.
Curiosity increased as a function of expected value. In other words, the more positive participants expected the information to be, the more curious they were. This aligns with previous findings that humans prefer information about future desirable outcomes over information about undesirable outcomes (Kobayashi et al., 2019) and are willing to pay for the positive information (Charpentier et al., 2018). This effect of expected value was more marked than in previous studies with a similar paradigm but without the valuation and choice phases (van Lieshout, de Lange, & Cools, 2021; van Lieshout et al., 2018; van Lieshout, Traast, et al., 2021). Unlike in the previous studies, participants in the current study were instructed to make a value-based comparison between pairs of lotteries to indicate their preferred option and to make a selection. These task features likely increased the salience of the expected value of the lotteries. Other characteristics of the task might have boosted participants’ attention and/or engagement further, including the longer duration of the lottery presentation (up to 11 s, vs. 3 s in previous studies) as well as the fact that participants got to continue with their preferred lotteries in the majority of trials (75%), whereas in previous studies, participants did not have a choice between lotteries. Surprisingly, we found that in lotteries with higher expected value, the effect of preference on implicit curiosity diminished. One possible explanation is that this higher expected value became more salient than other features of the trial, driving participants to focus their attention on the points they could win and less so on whether their preferred lottery was selected. Nevertheless, it is not clear to us why this would be the case when curiosity was assessed implicitly but not explicitly.
Our findings are in line with recent evidence that autonomy boosts curiosity: Participants who watched a video of their choice (from a given set) self-reported higher interest in the topic than those who watched a video without a choice (Schutte & Malouff, 2019), and participants bid larger amounts for lotteries they chose than those they had not chosen (Jiwa et al., 2021). However, in these recent studies, autonomy was confounded with preference. In the earlier study (Schutte & Malouff, 2019), the researchers did not consider participants’ preferences when assigning the options. This resulted in participants in the choice condition likely choosing their preferred option, and participants in the no-choice condition likely receiving their not-preferred option (with a probability of .66 because there were three options). In the more recent study (Jiwa et al., 2021), participants always made a choice, but half of the times, their choice was vetoed (resulting in a loss of agency). In agency trials, participants always received their chosen (presumably preferred) option, whereas in no-agency trials, they always received an unchosen (presumably not preferred) option. These designs did not enable dissociation between preference and choice; hence, the supposed effect of choice on curiosity also included a (confounded) effect of preference. Our study goes beyond these previous efforts by quantifying the effects of choice and preference separately, by demonstrating that these two factors boost curiosity independently, and by reporting these effects using both explicit (ratings) and implicit (willingness-to-wait) measures of curiosity.
Our paradigm enabled us to manipulate choice, outcome uncertainty, and expected value in a quantitative and controlled fashion, allowing us to draw inferences independently of extraneous variables. Although other paradigms relate more closely to real-world situations (e.g., trivia paradigms; Kang et al., 2009; Ligneul et al., 2018), these more naturalistic paradigms pose more difficulty in deconfounding factors of no interest, such as participants’ real-life knowledge and interests. Nevertheless, it would be important for future research to broaden the scope of application by, for instance, combining performance on this task with tracking sampling of real-life information (e.g., browsing news sites).
Furthermore, curiosity (Gruber et al., 2014; Kang et al., 2009; Kidd & Hayden, 2015) and choice (Cockburn et al., 2014; Murty et al., 2015) have both been shown to boost learning and memory, implicating couplings between reward-related areas (i.e., ventral striatum) and the hippocampus. However, the exact nature of the link between curiosity and choice in boosting memory remains unknown, an interesting question being whether enhanced memory for chosen items is mediated by increased curiosity. One step in that direction would be to introduce a curiosity assessment in paradigms that manipulate autonomy in learning—for example, memory for novel associations (Murty et al., 2015) or about stories and pseudoinformation—connecting these so far independently studied effects. Our findings may open the way for future work aimed at linking autonomy with curiosity and dopamine or noradrenaline as well as further investigating the nature of the relationship between choice, curiosity, learning, and memory.
Supplemental Material
sj-docx-1-pss-10.1177_09567976221082637 – Supplemental material for Choice Boosts Curiosity
Supplemental material, sj-docx-1-pss-10.1177_09567976221082637 for Choice Boosts Curiosity by Patricia Romero Verdugo, Lieke L. F. van Lieshout, Floris P. de Lange and Roshan Cools in Psychological Science
Footnotes
Transparency
Action Editor: Leah Somerville
Editor: Patricia J. Bauer
Author Contributions
All the authors contributed to the concept and design of the studies. P. Romero Verdugo collected the data. P. Romero Verdugo analyzed the data under the supervision of L. L. F. van Lieshout. All the authors interpreted the data. P. Romero Verdugo drafted the manuscript, and L. L. F. van Lieshout, F. P. de Lange, and R. Cools provided critical revisions. All the authors approved the final manuscript for submission.
References
Supplementary Material
Please find the following supplemental material available below.
For Open Access articles published under a Creative Commons License, all supplemental material carries the same license as the article it is associated with.
For non-Open Access articles published, all supplemental material carries a non-exclusive license, and permission requests for re-use of supplemental material or any part of supplemental material shall be sent directly to the copyright owner as specified in the copyright notice associated with the article.