
Abstract
The subjective experience of causing an action is known as the sense of agency. Dysfunctional sense of agency over speech has been suggested as a cause of auditory hallucinations. However, agency over speech has not been extensively characterized in previous empirical studies. Here, we manipulated self-voice identity, an indicator of self, embedded in the acoustic quality of voice and examined implicit and explicit measures of the sense of agency. Experiment 1 (N = 29 adults) demonstrated more compression of a perceived interval between action and outcome when participants heard their undistorted voices than their pitch-distorted voices. Experiment 2 (N = 28 adults) revealed a strong top-down effect of self-voice identity: Specifically, the judgment of agency over speech was more resistant than the judgment of agency over hand/limb movement to low-level sensorimotor inconsistency. Our findings provide new insight into the sense of agency over speech and an informative perspective for understanding aberrant experience in auditory hallucinations.
The subjective experience that “I” am the one who is causing an action, referred to as the sense of agency, is fundamental to the sense of self (Gallagher, 2000; Haggard, 2017). Theoretical studies have hypothesized that some types of delusions or hallucinations arise from dysfunction in the sense of agency (Blakemore et al., 2003; Frith et al., 2000; Gallagher & Trigg, 2016). Psychological experiments have provided supportive evidence for this hypothesis by examining awareness in patients with schizophrenia during hand/limb movements (Haggard et al., 2003; Synofzik et al., 2010; Voss et al., 2010, 2017; Werner et al., 2014). Furthermore, it has been suggested that an auditory hallucination also results from dysfunction in the sense of agency over speech (Ford, 2016; Frith, 1992). However, compared with the sense of agency over hand/limb movement, the mechanism underlying the sense of agency over speech has not been extensively characterized.
A comparator model, one of the theoretical models of the sense of agency, emphasizes the role of the sensorimotor system based on a computational model of motor control (Blakemore et al., 2000; Frith et al., 2000). Here, an internal forward model (Miall & Wolpert, 1996) predicts sensory outcomes of action from an efference copy of a motor command and then compares the predicted and actual outcomes in the brain. If the two outcomes are congruent, people perceive causality between their action and consecutive sensory outcomes and, as a result, feel their agency over the action. Suppression of auditory event-related potential for self-voice has been suggested to reflect this comparative process in the sensorimotor system (Ford et al., 2007; Ford & Mathalon, 2005; Heinks-Maldonado et al., 2005, 2007). Thus, the predictive sensorimotor system has been recognized as important for the sense of agency over speech (Ford, 2016; Jones & Fernyhough, 2007; Seal et al., 2004).
In addition to such internal motoric signals, the sense of agency is influenced by external cues, such as prior beliefs, environmental contexts, or post hoc inferences (Moore et al., 2009; Synofzik et al., 2008; Wegner et al., 2004). A cue-combination framework explains that the sense of agency is determined by integrating internal and external agency cues weighted by the precision of information concerning each cue (Kawabe et al., 2013; Lush et al., 2019; Moore & Fletcher, 2012; Wolpe et al., 2013). What are potential sources of external cues in the context of speech? A sensory outcome of speech contains an indicator of self, an element of the physical self (Gillihan & Farah, 2005), in its acoustic quality. Such a self-indicator enables people to quickly and precisely identify whether a voice is derived from themselves or another person. The self-voice identity is thus plausibly thought to serve as a source of an external cue that enhances the sense of agency uniquely over speech. However, it is poorly understood whether and how self-voice identity contributes to the sense of agency as the source of an external agency cue.
Statement of Relevance
The sense of agency, defined as the subjective experience that “I” am the one who is causing an action, is an important aspect of the sense of self. Dysfunction in the sense of agency over speech has been suggested as a cause of auditory hallucinations, an important diagnostic criterion for schizophrenia. However, it has not yet been extensively characterized. Here, we addressed this question by examining both implicit (intentional binding) and explicit (agency judgment) measures of the sense of agency. These measures show that the sense of agency over speech is enhanced by hearing one’s own voice, rather than someone else’s, as an outcome of speech. We provide empirical evidence that people are aware of one’s selfhood through daily actions. This research contributes to a comprehensive understanding of aberrant experience in auditory hallucinations.
In the current study, we sought to characterize the sense of agency over speech using both implicit and explicit measures. We first examined temporal compression of a perceived interval between speech and voice feedback. This compression, termed intentional binding, is often used as an implicit measure of the sense of agency because the amount of compression decreases in the case of involuntary actions (Haggard et al., 2002). In the first experiment, we manipulated self-voice identity by distorting the pitch of a feedback voice and examined whether the perceived interval would be more compressed if participants heard an undistorted rather than a distorted self-voice following their own speech act. Importantly, a recent empirical study demonstrated intentional-binding-like effects without intentional actions, suggesting that intentionality does not necessarily relate to intentional binding (Suzuki et al., 2019). Our second experiment examined the effect of self-voice identity on the sense of agency over speech on a conceptual cognitive level (i.e., judgment of agency; Synofzik et al., 2008, 2013). We required participants to explicitly report on their agency (how much they felt they had caused the voice to be heard) when they heard their own pitch-distorted or undistorted voice as feedback. We also inserted a time interval between their speech and the voice feedback and manipulated the length of the interval to examine how self-voice identity interacts with an action–outcome temporal mismatch in the judgment of agency.
Experiment 1: Intentional Binding During Speech
Method
Participants
Twenty-nine healthy volunteers (15 men and 14 women) with a mean age of 21.7 years (range = 19–25 years) participated in Experiment 1. All participants were undergraduate or graduate students from the University of Tokyo and were recruited by the research assistant (Hiroki Tarumi). We determined the sample sizes on the basis of our preliminary experiment (for details, see Section S1 in the Supplemental Material available online). To do so, we conducted a power analysis for a repeated measures analysis of variance (ANOVA) using G*Power (Version 3.1; Faul et al., 2007), which determined that a sample of 29 participants would be needed to detect an effect size (η p 2) of .42 with power of .95 and α of .05. Written informed consent was obtained from all volunteers in accordance with the latest version of the Declaration of Helsinki.
Apparatus
Experiment 1 was conducted in a soundproof room. Participants seated themselves in front of a microphone (Sennheiser MD42; Sennheiser, Wedemark, Germany) on a desk and wore headphones (HyperX Cloud Revolver Pro Gaming Headset; Kingston Technology Company, Fountain Valley, CA). The microphone was connected to an effector (Behringer Virtualizer Pro; Behringer, Willich, Germany) via an amplifier (AT-MA2 Microphone Amplifier; Audio-Technica, Machida, Tokyo, Japan). We used the effector to change the pitch of the spoken voice and to insert a time interval between speech and voice feedback. The effector’s sample rate was so high (46 kHz) that people could not detect any lag related to the experiment’s pitch distortion. White noise was mixed into the feedback voice using a sound mixer (Yamaha MW10C; Yamaha, Hamamatsu, Shizuoka, Japan) to reduce direct voice transmission (not via the effector and headphones) and bone conduction. A custom Python program (Version 3.4.4; Python Core Team, 2015) running on a laptop computer placed on a desk presented the visual stimuli and collected participants’ responses.
Procedure
Before participants performed the experimental task, they answered a questionnaire about their proneness to auditory hallucinations (see Section S3 in the Supplemental Material). Participants were required to report the perceived interval between their speech and voice feedback (Fig. 1a). At the beginning of each trial, a message was presented on the screen instructing them to utter one of five vowel sounds in the Japanese syllabary (“a,” “i,” “u,” “e,” or “o”). Participants pressed the “Enter” key when they were ready, and the message on the screen disappeared. Then, they vocalized the sound they were instructed to make into the microphone. They were required to vocalize the sound as briefly and clearly as possible and to speak directly into the microphone. Following a short interval (200 ms, 400 ms, or 600 ms), participants heard the spoken voice through the headphones. The feedback voice was pitch-shifted upward or downward by seven semitones (high- and low-pitch conditions, respectively) or presented without any distortion (neutral condition; for a voice sample in each condition, see Movie S1 in the Supplemental Material). After the message “Estimate the interval” was presented on the screen, participants reported the estimated interval between their speech and voice feedback using a numeric keypad. Participants reported the estimated interval in three digits, ranging from 100 ms to 999 ms. This interval-estimation paradigm has been extensively used to investigate intentional binding in previous studies (Barlas et al., 2017; Caspar et al., 2015, 2016, 2020; Engbert et al., 2007; Humphreys & Buehner, 2009; Imaizumi & Tanno, 2019; Suzuki et al., 2019). Participants completed four trials for each of the 45 conditions (3 Speech–Feedback Intervals × 3 Voice Distortions × 5 Sounds) in random order (i.e., 180 trials in total).
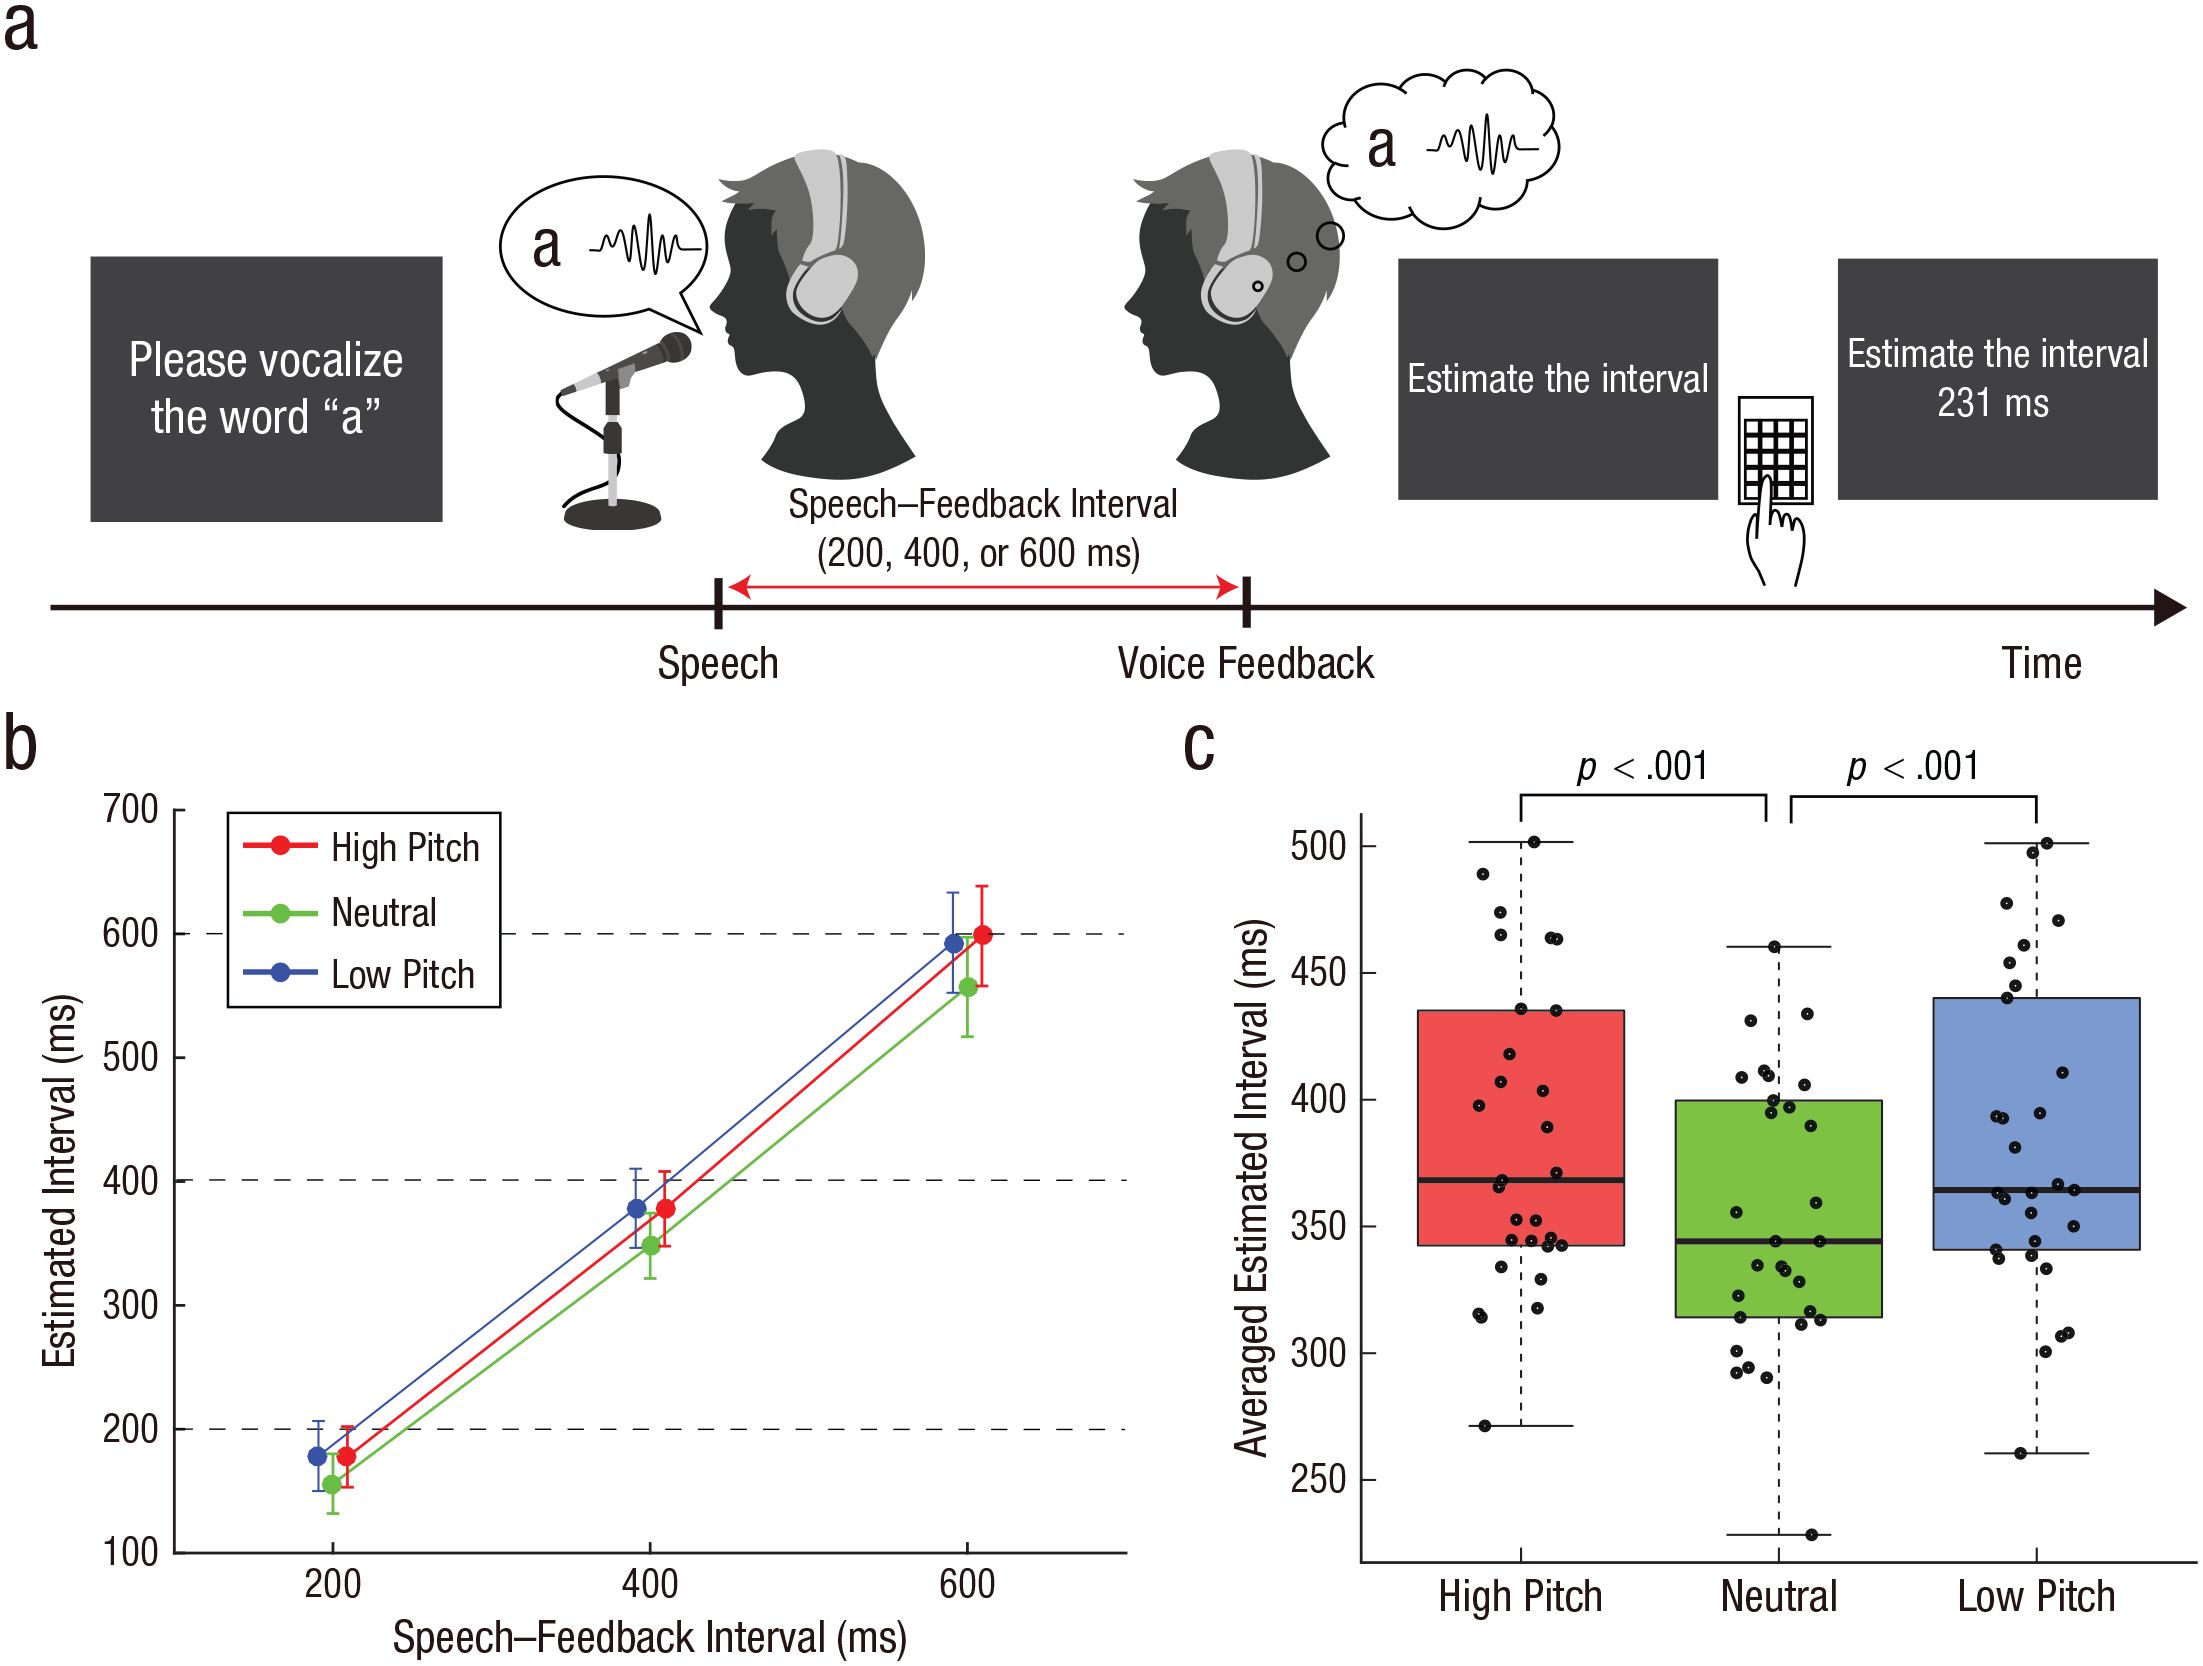
Paradigm and results from Experiment 1. The intentional-binding speech paradigm is shown in (a). Participants vocalized a sound and then their vocalization was played back to them after a short delay (200 ms, 400 ms, or 600 ms); this feedback was played with the pitch either distorted (low or high) or undistorted (neutral). They then reported the perceived length of the interval between their speech and the voice feedback. The mean estimated interval for each pitch and speech–feedback interval is illustrated in (b). Error bars indicate 95% confidence intervals. Horizontal dashed lines denote the actual speech–feedback interval. Note that circles for high- and low-pitch conditions are shifted slightly rightward and leftward, respectively, for display purposes. The averaged estimated interval across the three speech–feedback intervals (c) is shown separately for each pitch condition. In each box plot, the central horizontal line indicates the median, and the bottom and top edges of the box correspond to the 25th and 75th percentiles, respectively. The whiskers of each box plot represent values between each hinge and 1.5 times the interquartile range. Each dot represents one participant. Significant differences between pitch conditions are indicated by brackets.
Before the main task session, participants completed a practice session to become familiar with estimating an interval between speech and voice feedback. They vocalized the sound they were instructed to make and heard their spoken voice, as in the main task. Then, they reported the estimated interval between their speech and the voice feedback. They were then informed of the actual interval as feedback on the accuracy of their estimates. In the practice session, we set speech–feedback intervals at 11 levels from 0 ms to 1,000 ms, in 100-ms increments. The feedback voice was not distorted (i.e., the neutral condition only). Participants completed 22 trials in total (2 trials × 11 conditions in random order).
Data analysis
We averaged estimated intervals across the five sounds for each pitch and speech–feedback interval for each participant. Then, we conducted a 3 × 3 repeated measures ANOVA on estimated intervals with within-subjects factors of pitch (high, neutral, and low) and speech–feedback interval (200 ms, 400 ms, and 600 ms). If the sphericity assumption was violated, we applied Greenhouse-Geisser correction. Differences between pitch conditions were assessed using two-tailed paired-samples t tests, which were Bonferroni-corrected where appropriate.
We estimated Bayes factors (BFs) to quantify the strength of evidence for effects with one degree of freedom (Suzuki et al., 2019). BFs allowed us to assess evidence in favor of the null over the alternative hypothesis (BF01) or of insensitivity toward hypotheses. We conducted a Bayesian paired-samples t test in JASP (Version 0.14.1; JASP Team, 2020) using a default zero-centered Cauchy prior with a scale of 0.707 (Morey & Rouder, 2011; Rouder et al., 2009). With this default setting, 50% of the prior distribution is located between effect sizes from −0.707 to 0.707 for a two-sided hypothesis (Reader et al., 2021). In a preliminary experiment, we examined a simple main effect of pitch by comparing the means of estimated intervals between the neutral and high-pitch conditions and found the effect size (Cohen’s d) to be 0.80 (for details, see Section S1). Hence, the scale for the default Cauchy prior (the Cauchy prior width) was not considered unreasonably small or large for BFs in Experiment 1. We followed a typical heuristic to assess evidence for either hypothesis (Jarosz & Wiley, 2014; Jeffreys, 1939). BF01s greater than 3 indicate sensitivity to the null hypothesis, less than 0.333 denote sensitivity to the alternative hypothesis, and between 0.333 and 3 insensitivity to both. We also assessed the robustness of the BF by investigating the range of scaling values with which a conclusion would be consistent with that using the default scale (i.e., 0.707). Note that scales between 0 and 2 were explored because the JASP package could set scales within this range.
Results
We analyzed estimated intervals using a 3 × 3 repeated measures ANOVA with within-subjects factors of pitch and speech–feedback interval (Fig. 1b). We found a significant main effect of pitch, F(2, 56) = 18.3, p < .001, η p 2 = .39, and a significant main effect of speech–feedback interval, F(1.22, 34.3) = 245.9, p < .001, η p 2 = .90 (Greenhouse-Geisser corrected). There was no significant interaction, F(2.74, 76.68) = 0.76, p = .51, η p 2 = .026 (Greenhouse-Geisser corrected). Note that the effect size of pitch (η p 2 = .39) is comparable with or larger than effect sizes in previous studies that examined participant-estimated action–outcome intervals (Barlas et al., 2017; Caspar et al., 2015, 2016, 2020). Following the previous study on intentional binding (Suzuki et al., 2019), we calculated the mean of estimated intervals across the three speech–feedback intervals to examine a simple effect of pitch (Fig. 1c; for each speech–feedback interval, see Fig. S1 in the Supplemental Material). We compared the means among pitch conditions. These comparisons revealed that estimated intervals in the neutral condition were shorter than those in the high-pitch condition, t(28) = 5.54, p < .001, Cohen’s d = 1.03, Bonferroni corrected, BF01 = 3.1 × 10⁻⁴ (range in which scales were consistent with support for the alternative hypothesis = 0.001–2), and the low-pitch condition, t(28) = 4.90, p < .001, Cohen’s d = 0.91, Bonferroni corrected, BF01 = 0.002 (range in which scales were consistent with support for the alternative hypothesis = 0.001–2). Estimated intervals in the high-pitch condition were not significantly different from those in the low-pitch condition, t(28) = 0.25, p = .81, Cohen’s d = 0.046, BF01 = 4.92 (range in which scales were consistent with support for the null hypothesis = 0.388–2). The BF indicated that the null hypothesis (estimated intervals were the same in both conditions) was about 5 times more likely than the alternative hypothesis (estimated intervals were different). Collectively, distorted voice feedback weakens compression of the perceived interval between speech and voice feedback.
Follow-Up Experiment for Experiment 1
We were concerned that the effect of pitch found in Experiment 1 might be obtainable even without speech because of unexpected influences of our experimental manipulation (i.e., pitch distortion). The first concern was difficulty in detecting the onset of the distorted voice, which might cause longer estimated intervals in the high- and low-pitch conditions than in the neutral condition. We were also concerned that pitch distortion might affect the precision of outcome-timing judgment. A cue-combination framework explains that timing estimates of action and outcome events are weighted with the precision for either timing judgment (Kawabe et al., 2013; Lush et al., 2019; Moore & Fletcher, 2012; Wolpe et al., 2013). It may be that the precision of outcome-timing judgment was biased by pitch distortion, resulting in more compression in the neutral condition, even though participants perceived the equivalent causal relationship between action and outcome for all pitch conditions. To assess the above concerns, we conducted a follow-up experiment in which participants reported estimated intervals between two events without the causal relationship (between a beep and prerecorded voice).
Method
Participants
Twenty-nine healthy volunteers who joined Experiment 1 participated in this follow-up experiment. Written informed consent was obtained from all volunteers in accordance with the latest version of the Declaration of Helsinki.
Procedure
The apparatus and procedure in the follow-up experiment were almost identical to those in Experiment 1, but participants were required to report the perceived interval between a beep and a prerecorded voice sound (Fig. 2a) instead of reporting the perceived interval between their own speech and voice feedback. At the beginning of a trial, a message was presented on the screen prompting participants to press the “Enter” key. A beep was played after a random interval (2,000–5,000 ms) following the key press. Following a short interval (200 ms, 400 ms, or 600 ms), a recorded voice was replayed through the headphones. Then, participants reported the estimated interval between the time of a beep and voice using a numeric keypad. They were instructed to report the estimated interval in three digits, ranging from 100 ms to 999 ms.
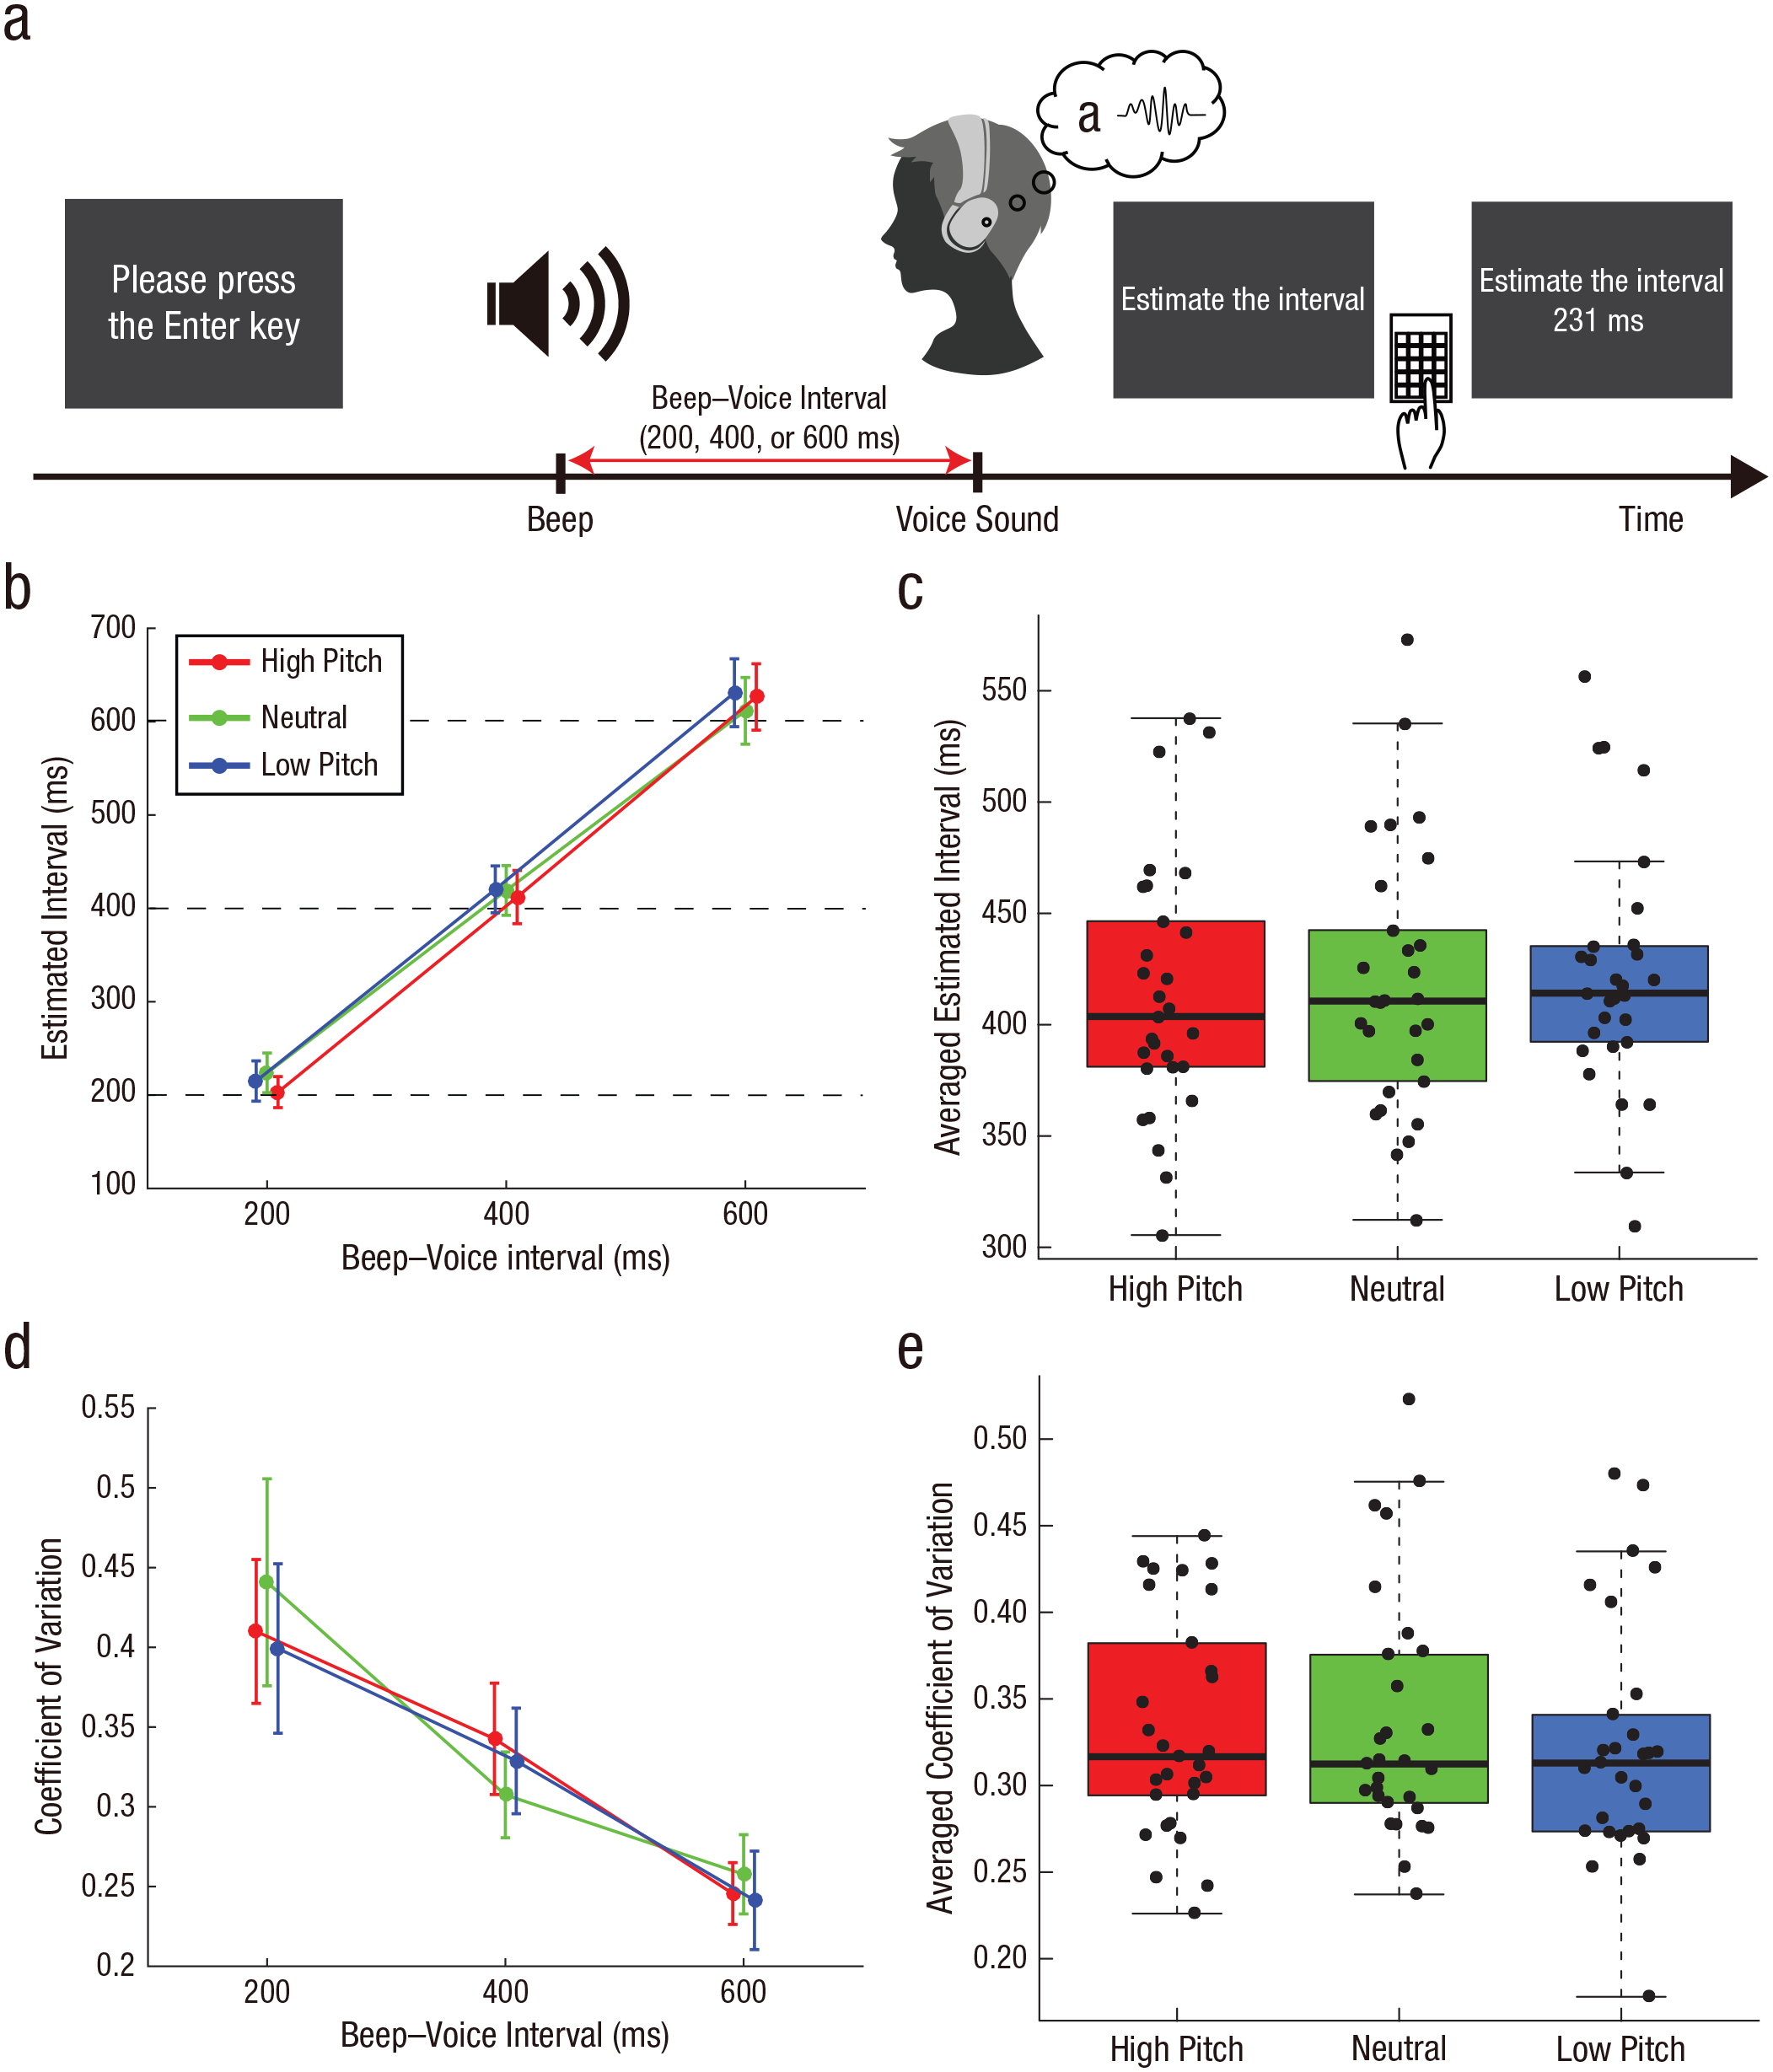
Paradigm and results from the follow-up experiment. The experimental task is shown in (a). Participants heard their own prerecorded voices 200 ms, 400 ms, or 600 ms after a beep; their voices were played with the pitch either distorted (low or high) or undistorted (neutral). They reported the perceived length of the interval between the beep and their voice. The mean (b) and coefficient of variation (d) of estimated intervals are shown for each pitch and beep–voice interval. Error bars indicate 95% confidence intervals. Horizontal dotted lines in (b) denote the actual beep–voice interval. Note that the circles of high- and low-pitch conditions are shifted slightly rightward and leftward, respectively, for display purposes. The estimated interval (c) and coefficient of variation (e) averaged across the three beep–voice intervals is shown separately for each pitch condition. In each box plot, the central horizontal line indicates the median, and the bottom and top edges correspond to the 25th and 75th percentiles, respectively. The whiskers of each box plot represent values between each hinge and 1.5 times the interquartile range. Each dot corresponds to one participant.
Before the experimental task, we recorded all participants’ voices as they vocalized five vowel sounds in the Japanese syllabary (“a,” “i,” “u,” “e,” and “o”). We extracted vocalization sections from the recorded auditory file. We distorted the pitch by shifting it upward or downward by seven semitones (high- and low-pitch conditions, respectively) using audio software (Audacity; Version 2.4.2; Audacity Team, 2020). Participants completed four trials for each of the 45 conditions (3 Beep–Voice Intervals × 3 Voice Distortions × 5 Sounds) in random order (i.e., 180 trials in total). They completed a practice session before the main task session. In the practice session, the beep–voice interval was set from 0 ms to 1,000 ms, in 100-ms increments. As in the practice session in Experiment 1, they received the actual interval as feedback after they reported their estimated interval. The recorded voice was replayed without pitch distortion. Participants completed two trials for each of the 11 conditions in random order (i.e., 22 trials in total).
Data analysis
We averaged estimated intervals across the five sounds for each pitch and beep–voice interval for each participant. We conducted a 3 × 3 repeated measures ANOVA on estimated intervals with within-subjects factors of pitch (high, neutral, and low) and beep–voice interval (200 ms, 400 ms, and 600 ms). We also calculated the coefficient of variation (ratio of standard deviation to the mean) of the estimated intervals in each pitch and beep–voice interval for each participant. We regarded the coefficient of variation as a measure of precision of voice-timing judgments because beeps had no causal relationship with voices and were identical in all pitch conditions. We conducted a 3 × 3 repeated measures ANOVA on coefficients of variation. If the sphericity assumption was violated, we applied Greenhouse-Geisser correction. In the post hoc test, Bonferroni correction was used for multiple comparisons. We obtained BFs to quantify strength of evidence and followed the heuristic used in Experiment 1.
Results
We analyzed the estimated intervals using a 3 × 3 repeated measures ANOVA with within-subjects factors of pitch and beep–voice interval (Fig. 2b). As a result, we found a significant main effect of beep–voice interval, F(1.28, 35.97) = 434.2, p < .001, η p 2 = .94 (Greenhouse-Geisser corrected). The main effect of pitch was nonsignificant, F(2, 56) = 1.04, p = .36, η p 2 = .036. An interaction of these two factors was significant, F(4, 112) = 3.13, p = .018, η p 2 = .10. We found that the estimated interval at the 200-ms beep–voice interval in the high-pitch condition was significantly shorter than that in the neutral condition, t(28) = 3.23, p = .0032, Bonferroni corrected. However, this effect was not associated with the main result in Experiment 1 (i.e., the shorter estimated interval in the neutral condition; Fig. 1b). As with the analysis of Experiment 1, we compared the mean of estimated intervals across the three beep–voice intervals in the neutral condition with that in the high-pitch and low-pitch conditions (Fig. 2c; for each beep–voice interval, see Figs. S2a, S2b, and S2c in the Supplemental Material). There was no significant difference in the mean between the high-pitch and neutral conditions, t(28) = 0.72, p = .48, Cohen’s d = 0.13, BF01 = 4.00 (range in which scales were consistent with support for the null hypothesis = 0.497–2), or between the low-pitch and neutral conditions, t(28) = 0.62, p = .54, Cohen’s d = 0.12, BF01 = 4.24 (range in which scales were consistent with support for the null hypothesis = 0.461–2). The Bayesian analysis showed that the null hypothesis was about 4 times more likely than the alternative hypothesis in both comparisons.
Next, we calculated the coefficient of variation of estimated intervals as a measure of precision of voice-timing judgments (Fig. 2d). A 3 × 3 repeated measures ANOVA revealed that a main effect of interval was significant, F(1.49, 41.8) = 52.5, p < .001, η p 2 = .65 (Greenhouse-Geisser corrected). Neither a main effect of pitch, F(1.5, 42.12) = 0.50, p = .56, η p 2 = .017 (Greenhouse-Geisser corrected), nor an interaction, F(1.85, 51.94) = 1.34, p = .27, η p 2 = .046 (Greenhouse-Geisser corrected), was significant. Figure 2e shows coefficients of variation averaged across the three beep–voice intervals (for each beep–voice interval, see Figs. S2d–S2f). We found no significant difference between the high-pitch and neutral conditions, t(28) = 0.30, p = .77, Cohen’s d = 0.055, BF01 = 4.86 (range in which scales were consistent with support for the null hypothesis = 0.393–2), or between the low-pitch and neutral conditions, t(28) = 0.79, p = .43, Cohen’s d = 0.15, BF01 = 3.80 (range in which scales were consistent with support for the null hypothesis = 0.528–2). The evidence quantified by BFs also supported the null hypothesis. Thus, pitch distortion likely did not affect the precision of outcome-timing judgment. Taken together, this follow-up experiment suggests that the effect observed in Experiment 1 is unlikely to have occurred without speech. Hence, the greater compression in Experiment 1 probably reflected the difference in the causal relationship between participant speech and feedback voice in a given pitch condition. Also, although pitch distortion might compress or expand the length of the feedback voice, this follow-up experiment indicates that changes in length, if any, likely did not affect the difference in estimated intervals among conditions.
Experiment 2: Subjective Ratings on Agency and Self-Voice Identity
Method
Participants
The same volunteers who joined Experiment 1, except for one woman, participated in Experiment 2 (N = 28). Written informed consent was obtained from all volunteers in accordance with the latest version of the Declaration of Helsinki.
Procedure
Participants were required to report subjective ratings regarding agency over speech and self-voice identity (Fig. 3a). The apparatus was identical to that in Experiment 1. At the beginning of each trial, a message was presented on the screen instructing participants to vocalize one of the five sounds in the Japanese syllabary (“a,” “i,” “u,” “e,” or “o”). The message disappeared immediately after participants pressed the “Enter” key, and participants spoke the sound they were instructed to make into the microphone. Following a short interval (50 ms, 200 ms, 350 ms, 500 ms, or 650 ms), the spoken sound was heard through the headphones. The feedback voice was pitch-shifted upward or downward by seven semitones (high- and low-pitch condition, respectively) or presented without distortion (neutral condition). After a message was presented on the screen, participants reported a subjective rating regarding agency over speech (agency rating) or regarding self-voice evaluation (self-voice rating). The message was “How much did you feel you had caused the voice that you heard?” for the agency rating and “How much did you feel that the voice you heard was your own?” for the self-voice rating. The rating employed a Likert-type scale ranging from 1 (not at all) to 9 (definitely). As in Experiment 1, we instructed participants to vocalize the sound as briefly and clearly as possible and to speak directly into the microphone.
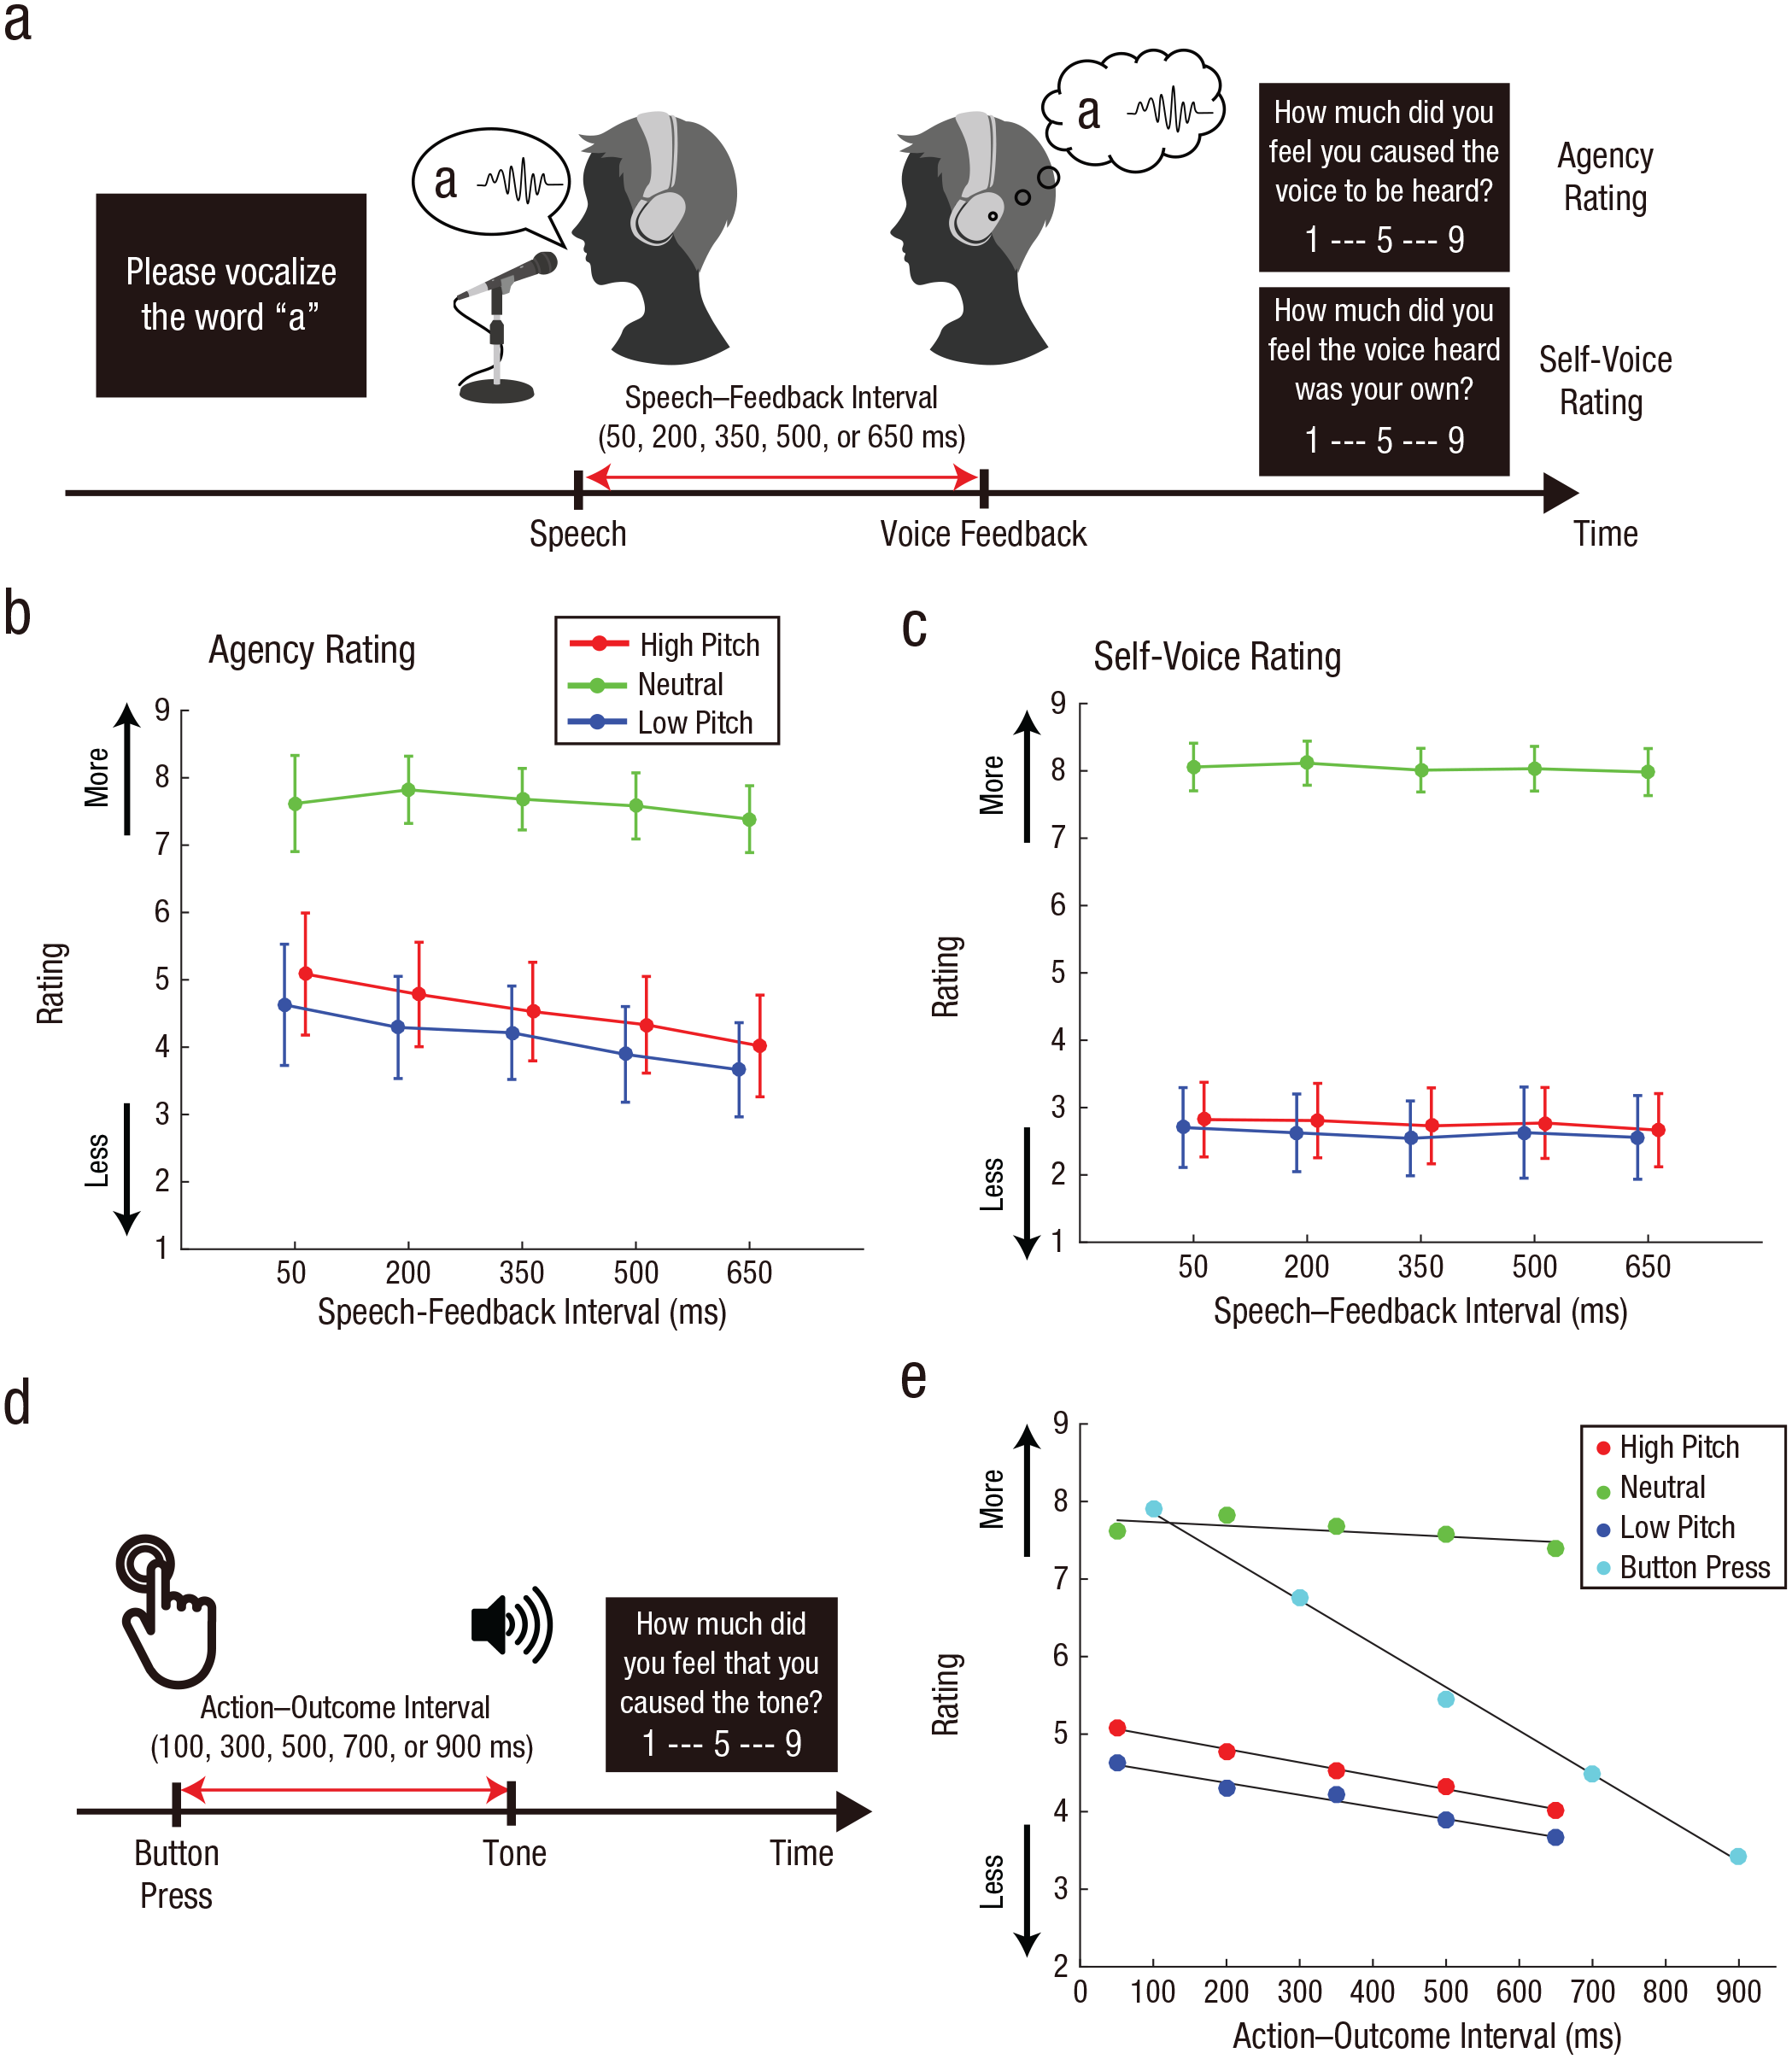
Paradigm and results from Experiment 2. The experimental task for explicit reporting on agency and self-voice evaluation is shown in (a). Participants vocalized a sound, and then their vocalization was played back to them after a short delay (50 ms, 200 ms, 350 ms, 500 ms, or 650 ms); this feedback was played with the pitch either distorted (low or high) or undistorted (neutral). On a 9-point Likert scale, they then reported how much they felt that they had caused the voice they heard (agency rating) or how much they felt that the voice they heard was their own (self-voice rating). The mean agency rating (b) and self-voice rating (c) is shown for each pitch and speech–feedback interval. Error bars indicate 95% confidence intervals. Note that circles for high- and low-pitch conditions are shifted slightly rightward and leftward, respectively, for display purposes. The button-press task from the study by Imaizumi and Tanno (2019) is shown in (d). Participants pressed a button and heard a tone after a short interval (100 ms, 300 ms, 500 ms, 700 ms, or 900 ms). On a 9-point scale, they reported how much they felt that they had caused the tone. The mean agency rating in the speech task of the current study and the button-press task (e) are plotted as a function of action–outcome interval and pitch condition. Black lines are regression lines that were fitted to the means of ratings in the respective conditions.
In Experiment 2, we did not require participants to complete a practice session. We were concerned about the possibility that they might confuse the agency rating with the self-voice rating if they reported both in a single trial or either in random order. Therefore, we required them to report agency ratings in the first half block and then self-voice ratings in the last half block. In each block, they completed two trials for each of the 75 conditions (5 Speech–Feedback Intervals × 3 Voice Distortions × 5 Sounds) in random order. Together with the two blocks, they completed 300 trials in total.
Data analysis
We averaged rating scores across the five sounds for each pitch and speech–feedback interval for each participant. We conducted a 3 × 5 repeated measures ANOVA on rating scores with within-subjects factors of pitch (high, neutral, and low) and speech–feedback interval (50 ms, 200 ms, 350 ms, 500 ms, and 650 ms). If the sphericity assumption was violated, we applied Greenhouse-Geisser correction.
As with Experiment 1, we calculated BFs to quantify the strength of evidence for a simple effect of pitch (Suzuki et al., 2019). We modeled the alternative hypothesis using a uniform distribution with a minimum of −8 and a maximum of 8. Because we employed a 9-point Likert scale for ratings, a minimum and maximum difference in ratings between two pitch conditions could be −8 and 8, respectively. BFU(−8, 8) refers to a BF based on this modeling. By contrast, we did not calculate BFs when examining slopes of a linear regression model fitted to ratings (see below). To our knowledge, no study has examined a change in agency ratings as a function of action–outcome interval with a speech paradigm similar to the one we used in the current study. Thus, we do not mention any conclusion from nonsignificant results derived from this analysis because we could not rationalize modeling of an alternative hypothesis (but see Dienes, 2019, who proposes a set of heuristics when no relevant past research is available).
Results
Figure 3b shows the mean agency rating for each pitch and speech–feedback interval. We conducted a 3 × 5 repeated measures ANOVA with within-subjects factors of pitch and speech–feedback interval. Results showed a significant main effect of pitch, F(1.39, 37.49) = 79.3, p < .001, η p 2 = .75 (Greenhouse-Geisser corrected) and a significant interaction between pitch and speech-feedback interval, F(4.85, 130.98) = 5.10, p < .001, η p 2 = .16 (Greenhouse-Geisser corrected). We did not find a significant main effect of speech–feedback interval, F(1.15, 30.96) = 2.67, p = .11, η p 2 = .090 (Greenhouse-Geisser corrected). Next, we compared the mean agency ratings across the five speech-feedback intervals among pitch conditions. We found a significant difference between the high-pitch and neutral conditions, t(27) = 8.66, p < .001, Cohen’s d = 1.64, Bonferroni corrected, BFU(−8, 8) = 1.06 × 1,015, and between the low-pitch and neutral conditions, t(27) = 10.2, p < .001, Cohen’s d = 1.92, Bonferroni corrected, BFU(−8, 8) = 1.42 × 1,021. The mean in the high-pitch condition was not significantly different from that in the low-pitch condition, t(27) = 2.34, p = .027, Cohen’s d = 0.442, Bonferroni corrected. The BF indicated that the data were insensitive to both hypotheses, BFU(−8, 8) = 0.42.
Next, we examined the relationship between an action–outcome temporal mismatch and the judgment of agency in the current speech paradigm by comparing it with the same relationship in the button-press paradigm reported by Imaizumi and Tanno (2019). In this previous study (Fig. 3d), participants pressed a button and, after a short interval (100 ms, 300 ms, 500 ms, 700 ms, or 900 ms), heard a tone via headphones. The participants then rated the perceived agency over the tone by answering the question, “How much did you feel that you had caused the tone?” We fitted a linear regression model to rating scores from each of the 34 participants as a function of action–outcome interval (in seconds). We also fitted the model to the agency ratings in Experiment 2. We found that the mean of the slopes was −5.6 (SD = 2.1) in the button-press task, whereas means were −0.47 (SD = 3.6), −1.7 (SD = 3.9), and −1.6 (SD = 4.1) in the neutral, high-pitch, and low-pitch conditions of the speech task, respectively (Fig. 3e). The slope in the button-press task was significantly and negatively steeper than the slopes under any conditions of the speech task—high-pitch condition: t(60) = 4.99, p < .001, Cohen’s d = 1.27, Bonferroni corrected; neutral condition: t(60) = 7.00, p < .001, Cohen’s d = 1.79, Bonferroni corrected; and low-pitch condition: t(60) = 5.00, p < .001, Cohen’s d = 1.28, Bonferroni corrected. The above comparisons clarified that the judgment of agency over speech was more resistant to action–outcome mismatch than that of agency over hand/limb movement.
Furthermore, we compared slopes among conditions in the speech paradigm. We found a significant difference in the slopes between the high-pitch and neutral conditions, t(27) = 4.01, p < .001, Cohen’s d = 0.76, Bonferroni corrected, and between the low-pitch and neutral conditions, t(27) = 3.17, p = .0038, Cohen’s d = 0.60, Bonferroni corrected. There was not a significant difference between the high-pitch and low-pitch conditions, t(27) = 1.03, p = .31, Cohen’s d = 0.19, Bonferroni corrected. Thus, the agency rating in the neutral condition was more resistant to action–outcome mismatch than in pitch-distorted conditions, which was the cause of the significant interaction between pitch and speech–feedback interval (see above).
Finally, regarding the self-voice rating (Fig. 3c), we found a significant main effect of pitch, F(1.56, 42.16) = 274.9, p < .001, η p 2 = .91. There was neither a significant main effect of speech–feedback interval, F(1.5, 40.45) = 0.94, p = .37, η p 2 = .034 (Greenhouse-Geisser corrected), nor a significant interaction, F(4.73, 127.58) = 0.19, p = .96, η p 2 = .0070 (Greenhouse-Geisser corrected). We compared the mean of self-voice ratings across the five speech–feedback intervals among pitch conditions. We found a significant difference between the high-pitch and neutral conditions, t(27) = 18.5, p < .001, Cohen’s d = 3.49, Bonferroni corrected, BFU(−8, 8) = 4.15 × 1,072, and between the low-pitch and neutral conditions, t(27) = 17.8, p < .001, Cohen’s d = 3.36, Bonferroni corrected, BFU(−8, 8) = 1.28 × 1,067. There was not a significant difference between the high-pitch and low-pitch conditions, and the BF supported the null hypothesis, t(27) = 0.806, p = .427, Cohen’s d = 0.152, Bonferroni corrected, BFU(−8, 8) = 0.04. Next, as with the analysis of the agency rating, we fitted a regression model to the self-voice ratings. The slopes of the regression model were −0.15 (SD = 1.2), −0.23 (SD = 1.4), and −0.19 (SD = 1.3) in the neutral, high-pitch, and low-pitch conditions, respectively. There was no significant difference in the slopes among the three pitch conditions—high-pitch vs. neutral: t(27) = 0.27, p = .79, Cohen’s d = 0.051; low-pitch vs. neutral: t(27) = 0.15, p = .88, Cohen’s d = 0.028; and high-pitch vs. low-pitch: t(27) = 0.26, p = .80, Cohen’s d = 0.049. Furthermore, we compared slopes obtained from the agency ratings with those from the self-voice ratings. We conducted a 2 × 3 repeated measures ANOVA on slopes with within-subjects factors of rating (agency and self-voice) and pitch (high, neutral, and low). We found a significant main effect of pitch, F(1.36, 36.70) = 5.60, p = .015, η p 2 = .17 (Greenhouse-Geisser corrected), and a significant interaction, F(1.59, 42.96) = 8.7, p = .001, η p 2 = .24 (Greenhouse-Geisser corrected). There was not a significant main effect of rating, F(1, 27) = 2.87, p = .10, η p 2 = .096. Taken together, both agency and self-voice ratings were sensitive to pitch distortion of the feedback voice. By contrast, each type of rating showed a different slope (a change in rating as a function of speech–feedback interval), depending on the pitch condition.
Discussion
In the current study, we sought to characterize the sense of agency over speech via implicit and explicit measures. The first experiment demonstrated the intentional-binding effect in a naturalistic speech paradigm (Fig. 1). What caused the greater compression of estimated intervals between speech and voice feedback in the neutral condition compared with the pitch-distorted conditions? According to a recent computational model postulating requirements for high sense of agency (Legaspi & Toyoizumi, 2019), there are two plausible causes of the greater compression in the neutral condition: (a) stronger prior belief of an action causing the outcome and (b) more reliable sensory inputs informing action and outcome timing. For the first cause, previous studies have demonstrated that prior causal beliefs combined with internal motoric cues influenced intentional binding (Caspar et al., 2016, 2020; Desantis et al., 2011; Moore et al., 2009). People are much more likely to hear their own voice than someone else’s voice as an outcome of a speech act in daily life. Such daily experience constructs the causal belief in favor of undistorted voice in the context of speech. This causal belief might have served as an external agency cue to intensify the sense of agency over speech in the neutral condition.
The second cause of the binding is the sensory reliability of action and outcome timing. The sensorimotor system predicts a sensory outcome of speech (i.e., feedback voice) and then compares the predicted and actual outcomes. People already have an internal forward model of speech established during daily activities. As the established internal model predicts undistorted voice as an outcome of speech, pitch distortion produces a discrepancy in acoustic quality between the predicted and actual outcomes. This discrepancy may perturb the neural activity involved in sensorimotor processing, resulting in less reliable sensory signals informing action and outcome timing and a weakened action–outcome causal relationship in pitch-distorted conditions. In summary, both (internal) predictive sensorimotor information and (external) prior causal beliefs plausibly enabled participants to more strongly perceive a causal relationship between speech and feedback voice in the neutral condition.
Suzuki et al. (2019) demonstrated intentional-binding-like effects arising from observing actions and outcomes that were believed to be causally related (causal binding; Buehner, 2012, 2015). The authors concluded that intentional binding does not necessarily reflect intention or the sense of agency. On the basis of the current results alone, we cannot deny the possibility that our study simply captured causal binding that was not responsible for the sense of agency over speech. Further experiments are needed to confirm that the present findings exceeded causal binding. One feasible idea is to employ a virtual reality setup such as that used by Suzuki et al. (2019). In that experiment, participants observed a virtual avatar’s mouth movement followed by their prerecorded voice, pitch-distorted or neutral, without their vocalization. Comparison of estimated intervals between mouth movement and voice feedback could determine whether the binding found in this study was causal binding.
A temporal mismatch between an action and its outcome is generally a critical factor that reduces the sense of agency in hand/limb-movement tasks (Asai & Tanno, 2007; Farrer et al., 2008; Franck et al., 2001; Imaizumi & Asai, 2017; Imaizumi & Tanno, 2019; Maeda et al., 2012, 2013). However, we found that agency ratings decreased less steeply as a function of action–outcome interval in the speech paradigm than in the button-press paradigm (Fig. 3e). The critical difference between the two paradigms is whether the outcome of an action (i.e., tone or voice sound, respectively) contains an indicator of self (i.e., physical self). The above findings suggest that the physical self that was embedded in the acoustic quality of feedback voice was incorporated into the judgment of agency over speech. Specifically, participants linked the feedback voice with their own speech act after they recognized the voice as their own, whereas this link was disconnected if they recognized the voice as someone else’s. This top-down cognitive effect of self-voice identity was so strong that the agency ratings became resistant to action–outcome temporal mismatch that could contribute to the sense of agency in a bottom-up process. Note that our additional experiment confirmed that participants recognized the undistorted voice as their own and the distorted voice in our experiment (i.e., ±7 semitones) as a non-self-voice (for details, see Section S2 in the Supplemental Material). Gillihan and Farah (2005) mentioned that the sense of agency concerns the role of the psychological self in causing the actions of the physical self. The physical self is, in the original context, equivalent to one’s physical body, but the present study sheds light on another aspect of the physical self: an indicator of self that is embedded in sensory feedback. This indicator can stimulate the psychological self. In future studies, we need to examine whether other stimuli could serve as self-indicators that cause a top-down effect on the sense of agency over speech. One practical idea is to display one’s face or someone else’s face in sensory feedback during speech by incorporating virtual reality techniques (Banakou & Slater, 2014) into the experimental paradigm of the current study.
There are three limitations to the methods of this study. The first is the influence of bone conduction. Bone conduction is one of the primary sensory inputs during speech, as well as voices heard through our ears. We cannot deny the bone-conduction effect on the sense of agency over speech, although we mixed white noise into the feedback voice to reduce this effect. However, this effect should be constant across all pitch conditions, so it likely did not affect our main conclusion that distorted self-voice feedback attenuated the sense of agency over speech. Second, the interval-estimation paradigm employed in Experiment 1 did not allow us to investigate action and outcome bindings individually. This indicates the difficulty of determining which binding is critical for our results from the perspective of a cue-combination mechanism. The third limitation is a possible effect of demand characteristics in Experiment 2. We interpreted the high agency ratings in the neutral condition as an index of strong feelings that participants had caused the voice they heard (Fig. 3b). However, another possible scenario is that participants gave higher scores because they recognized that they should do so when they heard their own voice. This scenario follows that they merely answered the question of whether the feedback voice was like their own. We found that self-voice ratings (judgments of whether the feedback voice was participants’ own) showed a different pattern from the agency rating depending on the pitch condition in terms of slopes (rating as a function of an action–outcome temporal mismatch; Figs. 3b and 3c). However, we cannot deny a possible confounding effect of pitch with demand characteristics in the agency rating because there is no evidence regarding participant expectancies. In addition to the task-specific limitations, the generalizability of our findings is potentially further limited because of the participant population used.
In summary, the current study highlights the uniqueness of the sense of agency over speech. The first experiment found two types of agency cues in the context of speech: predictive sensorimotor signals and prior causal beliefs. These cues, combined with other agency cues, enable us to perceive a strong action–outcome causal relationship when hearing our own voice following our speech. The second experiment revealed a strong top-down effect of self-voice identity on the sense of agency. This effect revealed that the judgment of agency over speech was more resistant than the judgment of agency over hand/limb movement to low-level sensorimotor inconsistency. These findings shed light on the nature of the subjective experience of self-agency during speech. They are also provide a deeper understanding of aberrant experience in auditory hallucinations (see also Section S3).
Supplemental Material
sj-docx-1-pss-10.1177_09567976211068880 – Supplemental material for I Hear My Voice; Therefore I Spoke: The Sense of Agency Over Speech Is Enhanced by Hearing One’s Own Voice
Supplemental material, sj-docx-1-pss-10.1177_09567976211068880 for I Hear My Voice; Therefore I Spoke: The Sense of Agency Over Speech Is Enhanced by Hearing One’s Own Voice by Ryu Ohata, Tomohisa Asai, Shu Imaizumi and Hiroshi Imamizu in Psychological Science
Footnotes
Acknowledgements
We thank Takaki Maeda (Keio University School of Medicine) for his insightful comments on this article from the viewpoint of a psychiatrist. We also thank Hiroki Tarumi for his assistance with data collection and Ayuko Misu and Marina Sano for their helpful discussions on the experimental design.
Transparency
Action Editor: Krishnankutty Sathian
Editor: Patricia J. Bauer
References
Supplementary Material
Please find the following supplemental material available below.
For Open Access articles published under a Creative Commons License, all supplemental material carries the same license as the article it is associated with.
For non-Open Access articles published, all supplemental material carries a non-exclusive license, and permission requests for re-use of supplemental material or any part of supplemental material shall be sent directly to the copyright owner as specified in the copyright notice associated with the article.