
Abstract
Touch is a powerful communication tool, but we have a limited understanding of the role played by particular physical features of interpersonal touch communication. In this study, adults living in Sweden performed a task in which messages (attention, love, happiness, calming, sadness, and gratitude) were conveyed by a sender touching the forearm of a receiver, who interpreted the messages. Two experiments (N = 32, N = 20) showed that within close relationships, receivers could identify the intuitive touch expressions of the senders, and we characterized the physical features of the touches associated with successful communication. Facial expressions measured with electromyography varied by message but were uncorrelated with communication performance. We developed standardized touch expressions and quantified the physical features with 3D hand tracking. In two further experiments (N = 20, N = 16), these standardized expressions were conveyed by trained senders and were readily understood by strangers unacquainted with the senders. Thus, the possibility emerges of a standardized, intuitively understood language of social touch.
Interpersonal touch is important for social interaction, precedes language as a form of communication in infants (Hertenstein, 2002), and is linked to the evolutionary development of language (Dunbar, 1993). In nonhuman primates, touch in the form of grooming is used for reconciliation after conflicts and promotes group cohesion (Dunbar, 2010). The way that adult humans use interpersonal touch may be governed by this evolutionary and developmental heritage. That is, there may exist neural infrastructure that is related to how the particular features of interpersonal touch (e.g., tapping, stroking, holding) are used for different purposes (e.g., getting someone’s attention, soothing, expressing affection). However, it is currently unknown whether humans communicate via a common repertoire of touch gestures or what determines successful communication.
There are challenges to investigating interpersonal touch in humans: Touch usually happens in private and complex social contexts (Cekaite & Kvist Holm, 2017) and is governed by the relationship between the people involved (Suvilehto et al., 2015, 2019). Nonetheless, several studies have shown that touch alone effectively communicates emotions such as anger, fear, disgust, love, gratitude, sympathy, happiness, and sadness (Hertenstein et al., 2009; Hertenstein, Keltner, et al., 2006; Hertenstein, Verkamp, et al., 2006). Indeed, touch is the preferred channel over body language and facial expressions for expressing both love and sympathy (App et al., 2011). Happiness, sadness, anger, and disgust are also successfully communicated, despite touch not being the preferred communication channel, likely because redundancy improves communication success (App et al., 2011).
An outstanding question is to what extent interpersonal touch strategies are universal, culturally determined, or idiosyncratic. One study showed that couples are more effective at touch communication than strangers (Thompson & Hampton, 2011), suggesting that couples may develop an idiosyncratic set of touch expressions, or touch language. Other studies described the physical features of social touch (Hertenstein et al., 2009; Hertenstein, Keltner, et al., 2006; Jung et al., 2015; Masson & Op de Beeck, 2018) but did not evaluate the different strategies for communication effectiveness. A recent study showed that the speed of stroking and the touched body location influence the touch receiver’s judgments about the emotional state and intentions of the person touching them, even when they are not trying to communicate a specific message (Kirsch et al., 2018). These findings suggest that some physical features of interpersonal touch could be reliably mapped to different messages.
Observing facial expressions can be a source of additional information for the receiver of a touch communication (Tsalamlal et al., 2015, 2018), and facial muscle activity changes in a way that is consistent with positive affect when people are gently stroked by a soft brush (Mayo et al., 2018; Pawling et al., 2017; Ree et al., 2020). It is not known whether there is a link between the affective state as measured by facial muscle activity and the capacity to either convey or interpret messages via touch.
In the current study, we investigated whether it is possible to optimize touch strategies by selecting specific physical features, so that touch messages can be understood broadly within one cultural context, outside of a close relationship. We first identified, within close relationships, the physical features of interpersonal touch (e.g., slow stroking, tapping with a finger) that were most associated with success and failure to communicate cued touch messages. We also investigated facial expressions that accompany touch communication, using facial electromyography (EMG), and tested whether variations in facial expressions were related to performance on the touch-communication task.
We then developed standardized touch expressions on the basis of the most successful touch features that we identified for each message. These were delivered by trained experimenters to strangers, and performance on the communication task was compared with that between people in a preexisting relationship. We also present a quantitative description in terms of motion and contact area characteristics for the standardized touch expressions. Data sets, analysis scripts, and other materials associated with this study are available on OSF (https://osf.io/cnj68/).
Statement of Relevance
Communicating via touch is a precursor of spoken language—both in an evolutionary sense and in human infant development. In adult life, touch is used to complement verbal communication, adding intimacy and emotion. It has been suggested that people in close relationships may use idiosyncratic techniques for communicating emotions via touch. This is because of research showing that romantic couples performed better at a touch-communication task than strangers did. In this work, we found that strangers can communicate using touch just as well as, or even better than, people in close relationships when appropriate touch strategies are used. We employed a standard set of touch strategies for expressing nonverbal social messages such as love, attention, happiness, sadness, gratitude, and calming. Using 3D hand tracking, we made precise measurements of the contact area, velocity, and duration of our standard set of touch expressions. These expressions were intuitively understood by strangers, similar to the way that emojis rely on a common understanding of facial expressions.
Method
We recruited pairs of participants with an existing close relationship (Table 1) to participate in our touch-communication task (Fig. 1a). The participants assigned to the role of sender were required to communicate a series of messages using touch alone, making any gestures they felt were appropriate. The receiver then had to identify the message from a list of options. Because we gave no instructions about the touch strategies to use, we refer to this as “intuitive” touch communication to contrast it with the standardized touch strategies that we later developed.
Overview of Experiments and Participants
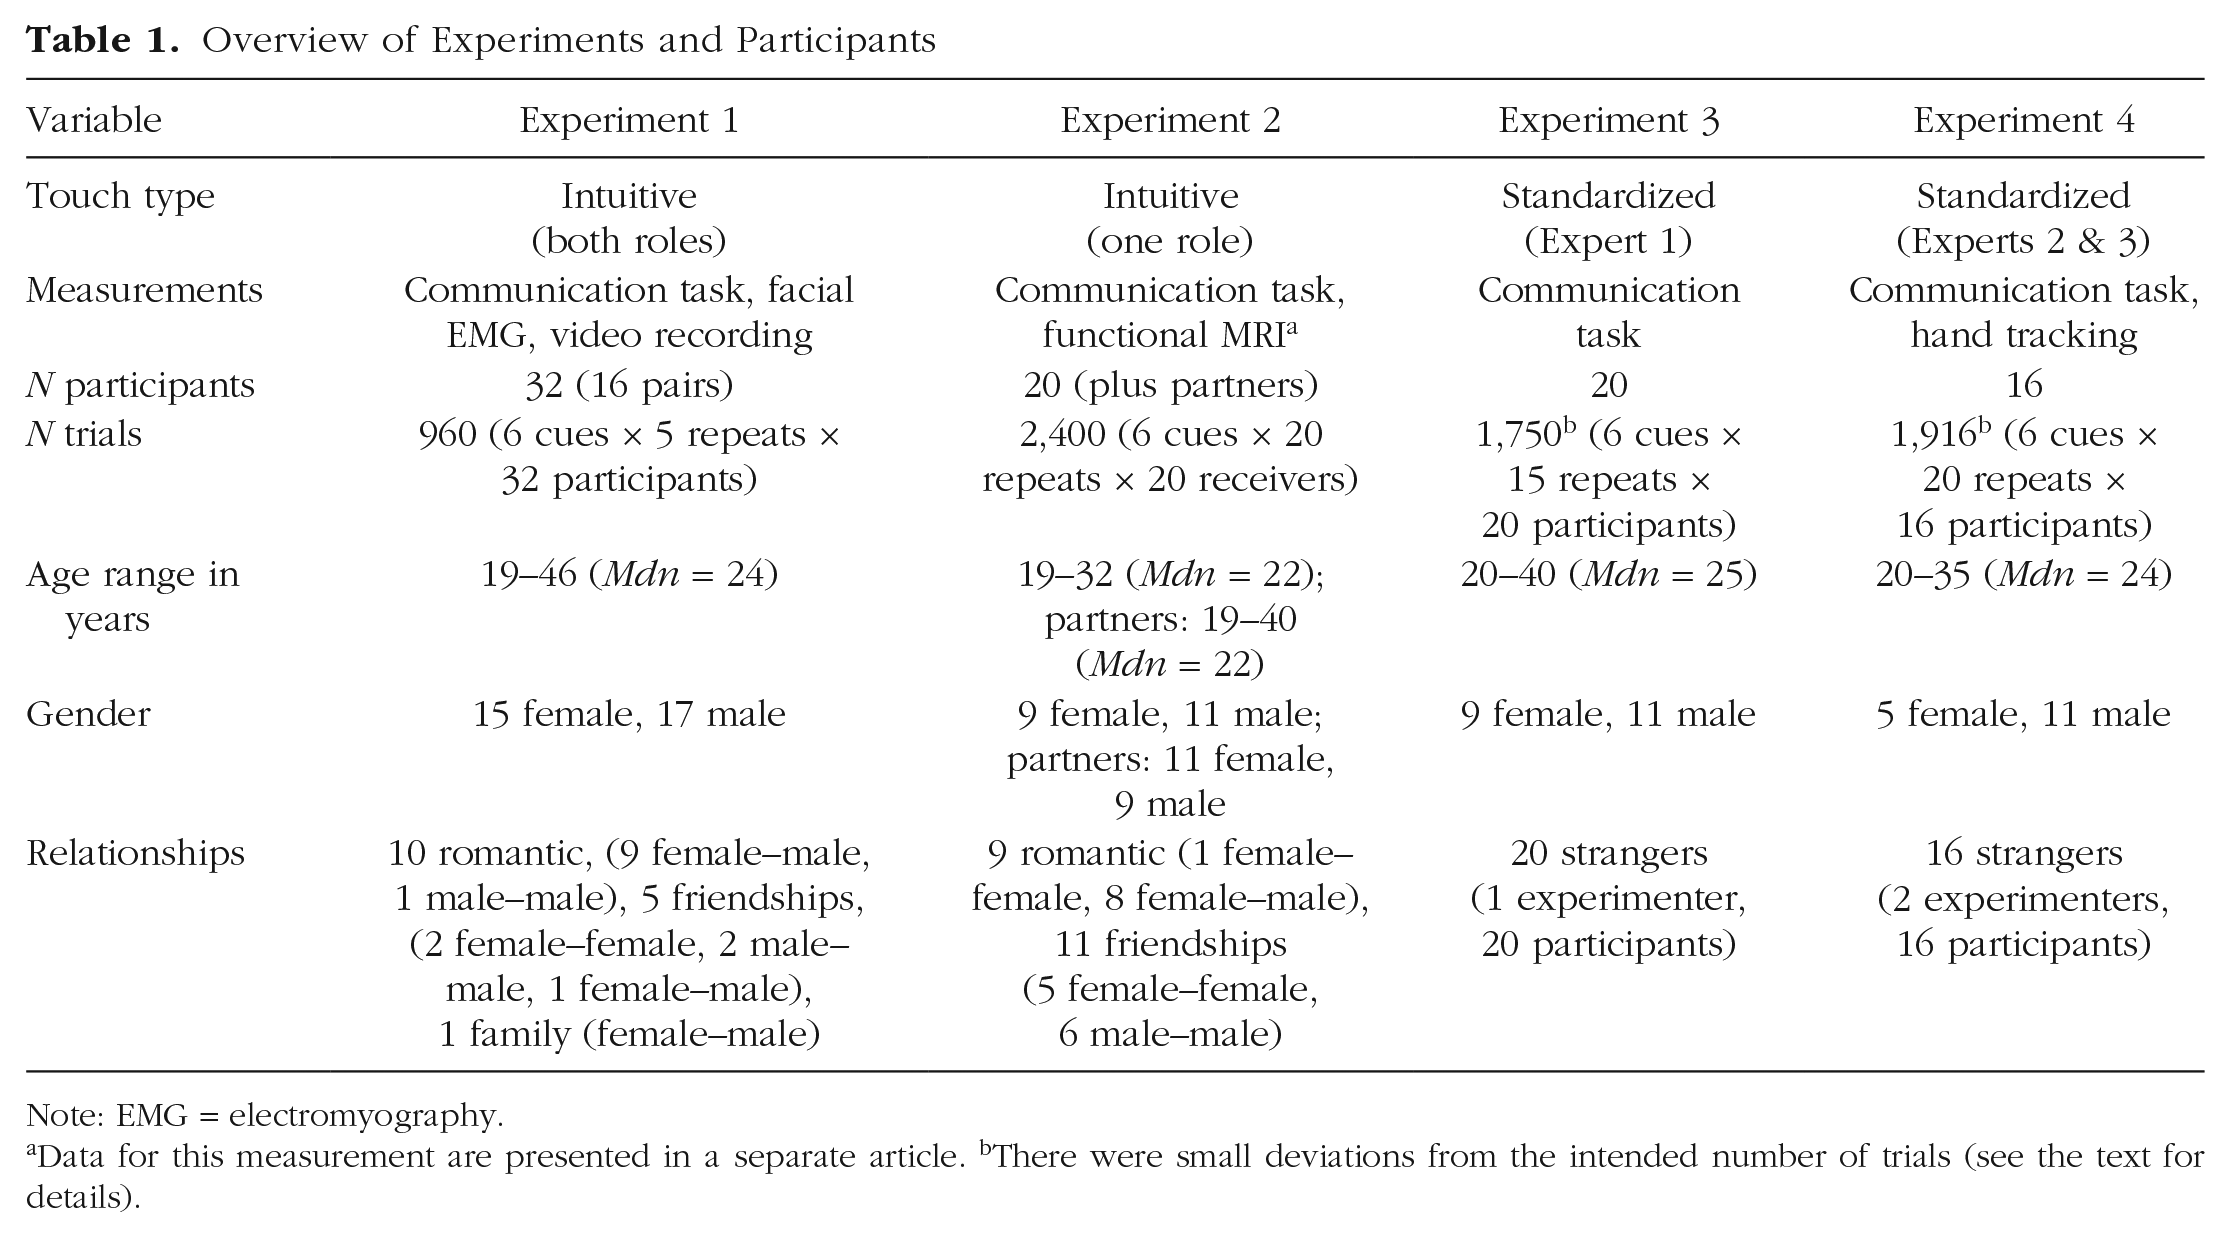
Note: EMG = electromyography.
Data for this measurement are presented in a separate article. bThere were small deviations from the intended number of trials (see the text for details).
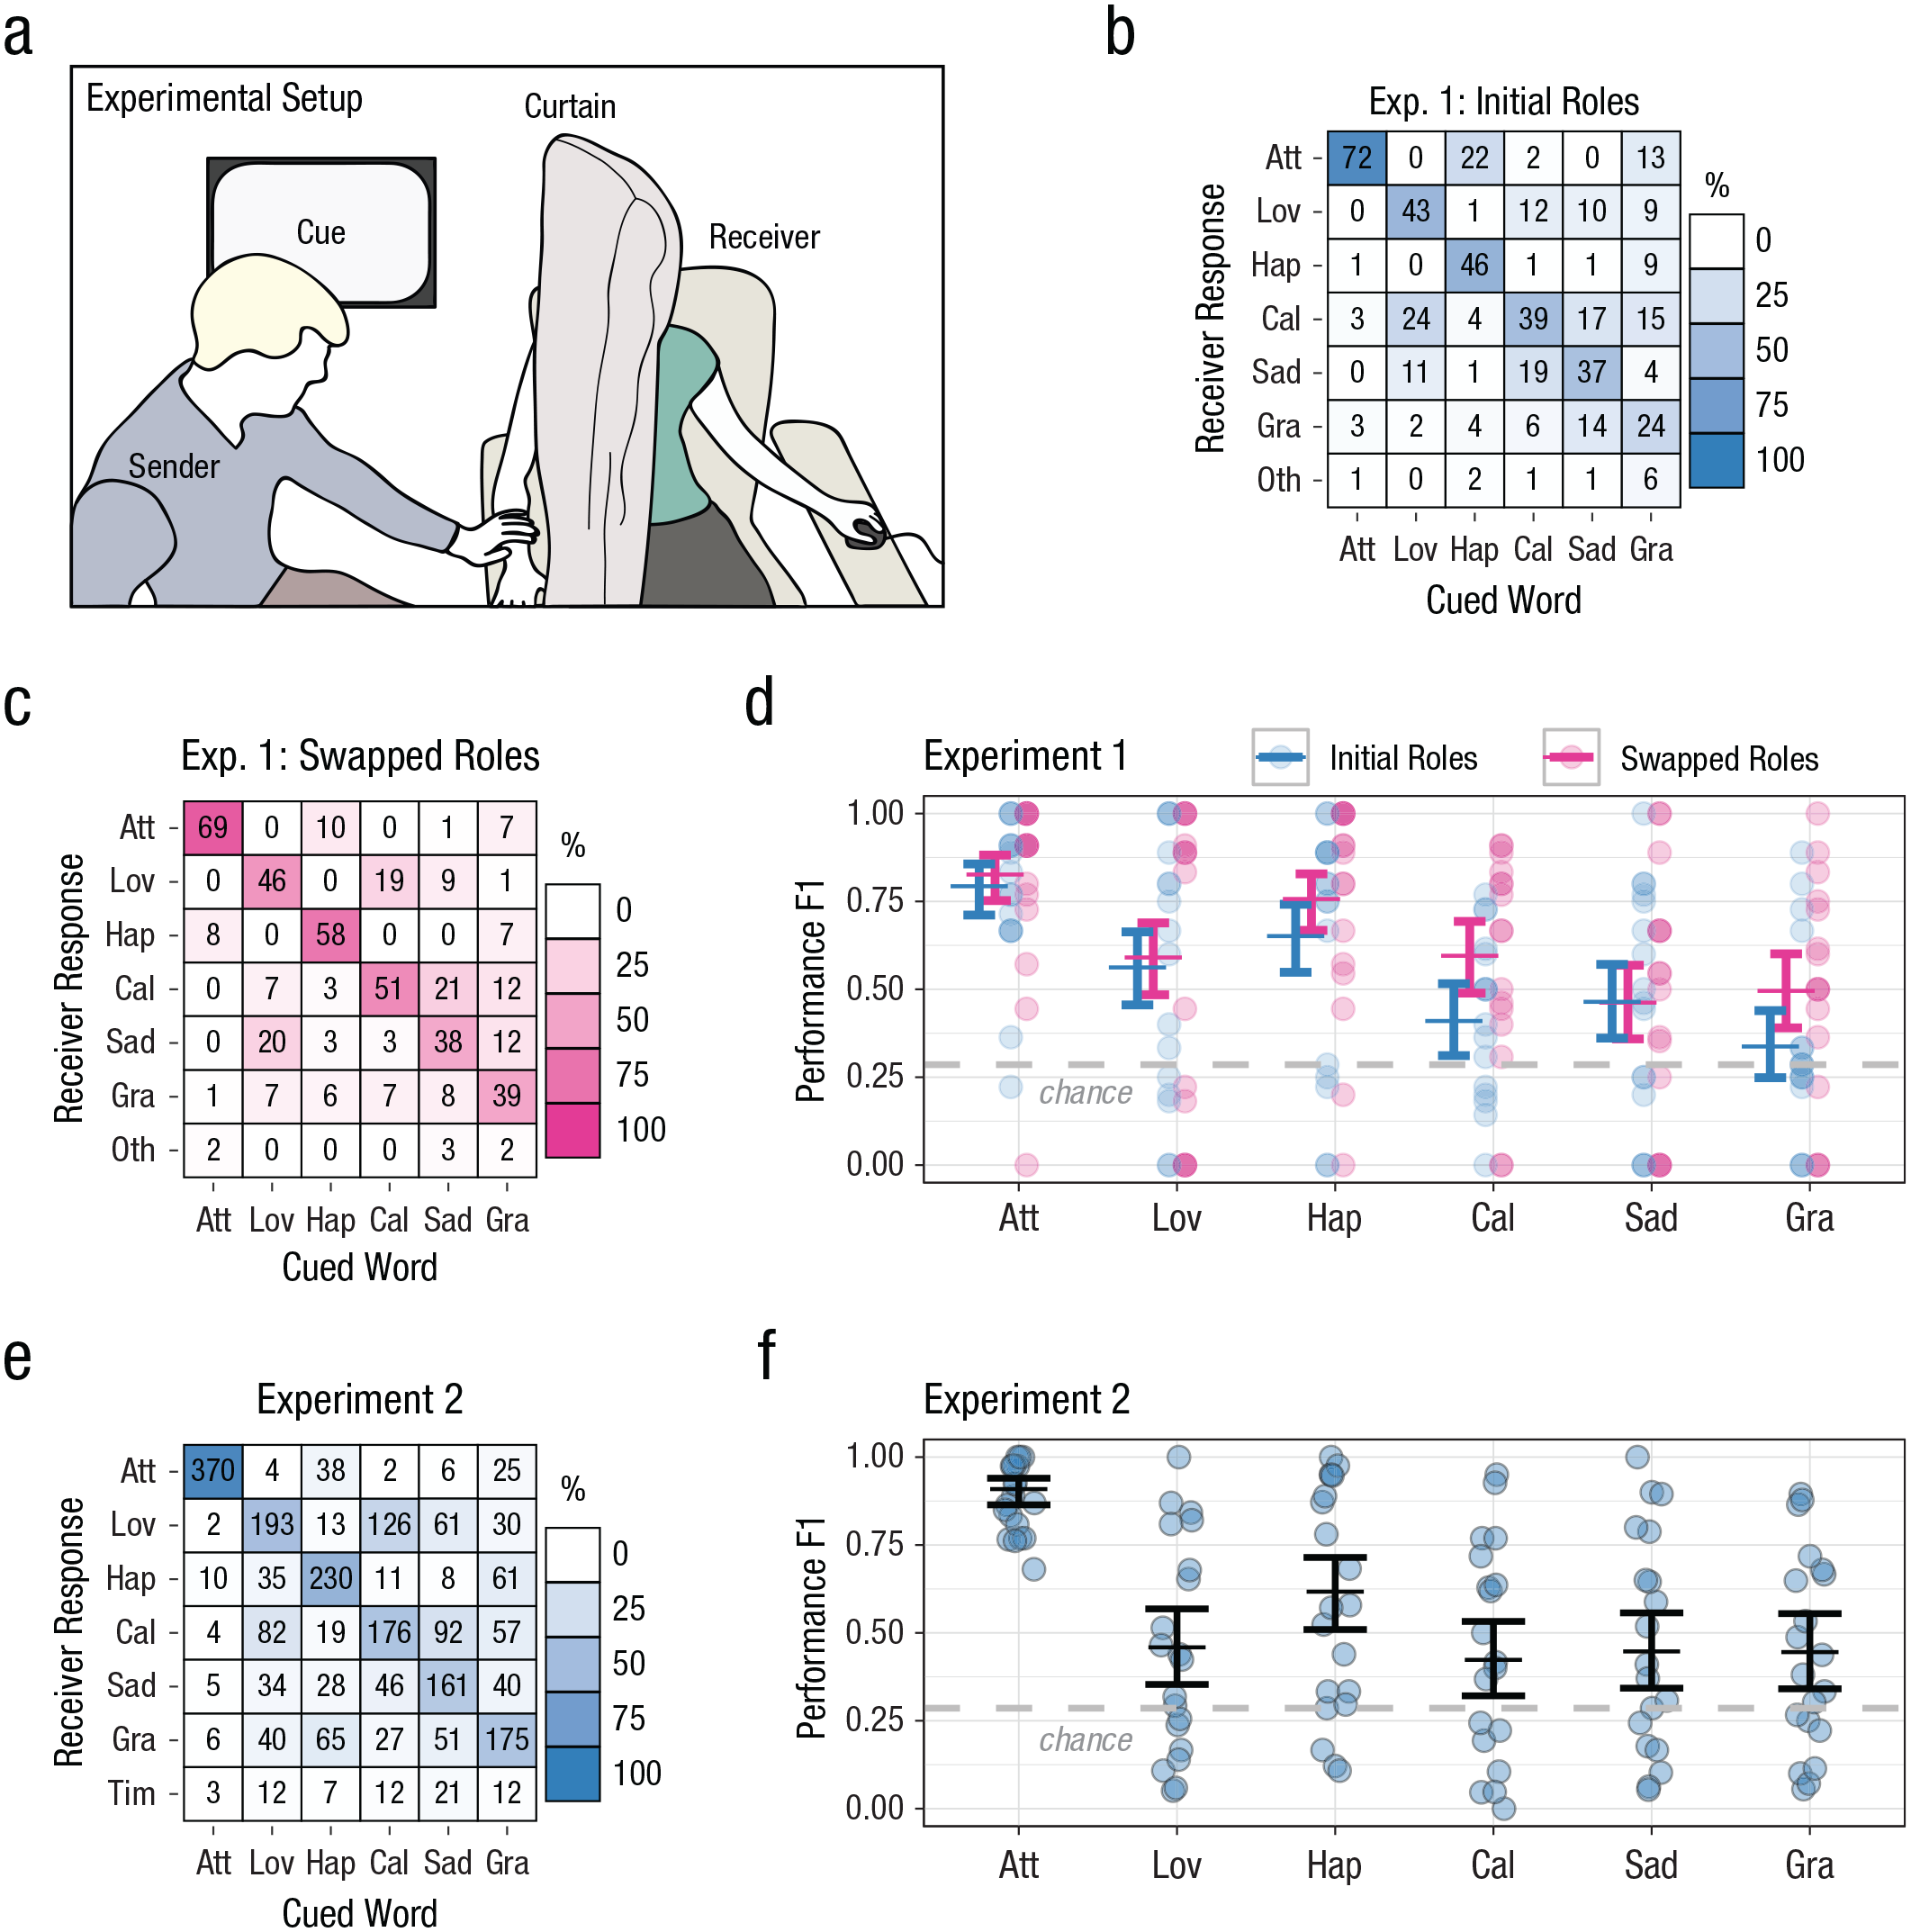
Touch communication between people in a close relationship (intuitive touch). The experimental setup is illustrated in (a). The sender was presented with a cue and then touched the receiver to communicate the message. The receiver used a separate interface to record the message they thought their partner was sending. Participants could not see each other’s monitors or faces. Group-level confusion matrixes for Experiment 1 are shown separately for trials (b) in which participants within pairs were in their initially assigned roles (sender and receiver) and (c) after the participants swapped roles. Each square represents a unique cue/response combination. The number in the square indicates the total number of times that unique combination occurred, pooled across participants. The shading indicates the percentage of occurrences that response was made out of the total number of times that cue was presented (columns sum to 100% shading). A dark diagonal indicates good performance on the communication task, and shading off the diagonal indicates consistent mistakes. F1 performance score (minimum = 0, maximum = 1; given by the harmonic mean of recall and precision) is shown (d) for each cue and role in Experiment 1. Circles show scores for each pair. Horizontal lines show model estimates (error bars indicate 95% confidence intervals). Chance-level performance (F1 = .29) is indicated by the dashed line. For Experiment 2, in which participants did not swap roles, the group-level confusion matrix (e) follows the same conventions used in (b) and (c), and the graph of F1 performance scores (f) follows the same conventions used in (d). Att = Attention, Lov = Love, Hap = Happiness, Cal = Calming, Sad = Sadness, Gra = Gratitude, Oth = Other, Tim = Time-out.
Participants
For the intuitive-touch experiments (Experiments 1 and 2), we recruited pairs of adult participants with a preexisting relationship in which they felt emotionally close and were comfortable touching each other in a normal social context. For the standardized-touch experiments (Experiments 3 and 4), we recruited participants individually. Table 1 provides a detailed description of our sample and an overview of the experiments. Participants were recruited from online and poster advertisements targeting the general community and the university community at Linköping University, Sweden. This is an international community, but we did not collect any data on the cultural background of our participants. All participants provided informed consent, and the study was conducted in accordance with the regulations of the regional ethics committee that approved the study. In addition to completing the touch-communication task, participants completed a number of questionnaires, detailed in the Supplemental Material available online.
In Experiments 1, 3, and 4, the target number of participants was 15 to 20, based on previous research (McIntyre et al., 2019) in which 95% confidence intervals (CIs) of approximately ±10% performance were achieved at the cue level. For Experiment 2, the target was set at 20 participants, the recommended minimal sample size for functional-imaging studies (Murphy & Garavan, 2004). The number of trials per participant was based on trying to maximize the number of trials while staying within an acceptable duration for the participants. This was smaller for Experiment 1 because of the time taken to apply facial EMG electrodes. For Experiment 2, we initially recruited 22 pairs, but one pair had to be excluded from the final analysis because they did not follow the task instructions. Another pair ended the experiment early because the person in the scanner felt claustrophobic. In Experiments 3 and 4, some trials were not performed because of experimenter or technical error. In Experiment 3, there were three participants for which only 70, 72, and 78 of the intended 90 trials were obtained; in Experiment 4, there were two participants for which only 118 of the intended 120 trials were obtained.
Intuitive-touch-communication task
We chose six messages to cue: attention, love, calming, happiness, sadness, and gratitude (see Table 2 for full-sentence cues). We included a mix of touch messages and required only that participants were sufficiently acquainted to be comfortable touching each other. Our goal was to try to capture a variety of different interpersonal touch interactions that may occur in natural settings. Some of the cues communicate the emotional state of the sender (happiness, sadness), some attempt to elicit a response from the receiver (attention, calming), and some refer to an existing social context (love, gratitude, calming). These are messages that people generally want to communicate using touch and were adapted from those used in a previous study (McIntyre et al., 2019) to reduce conceptual overlap between messages.
Cues for the Intuitive-Touch-Communication Task
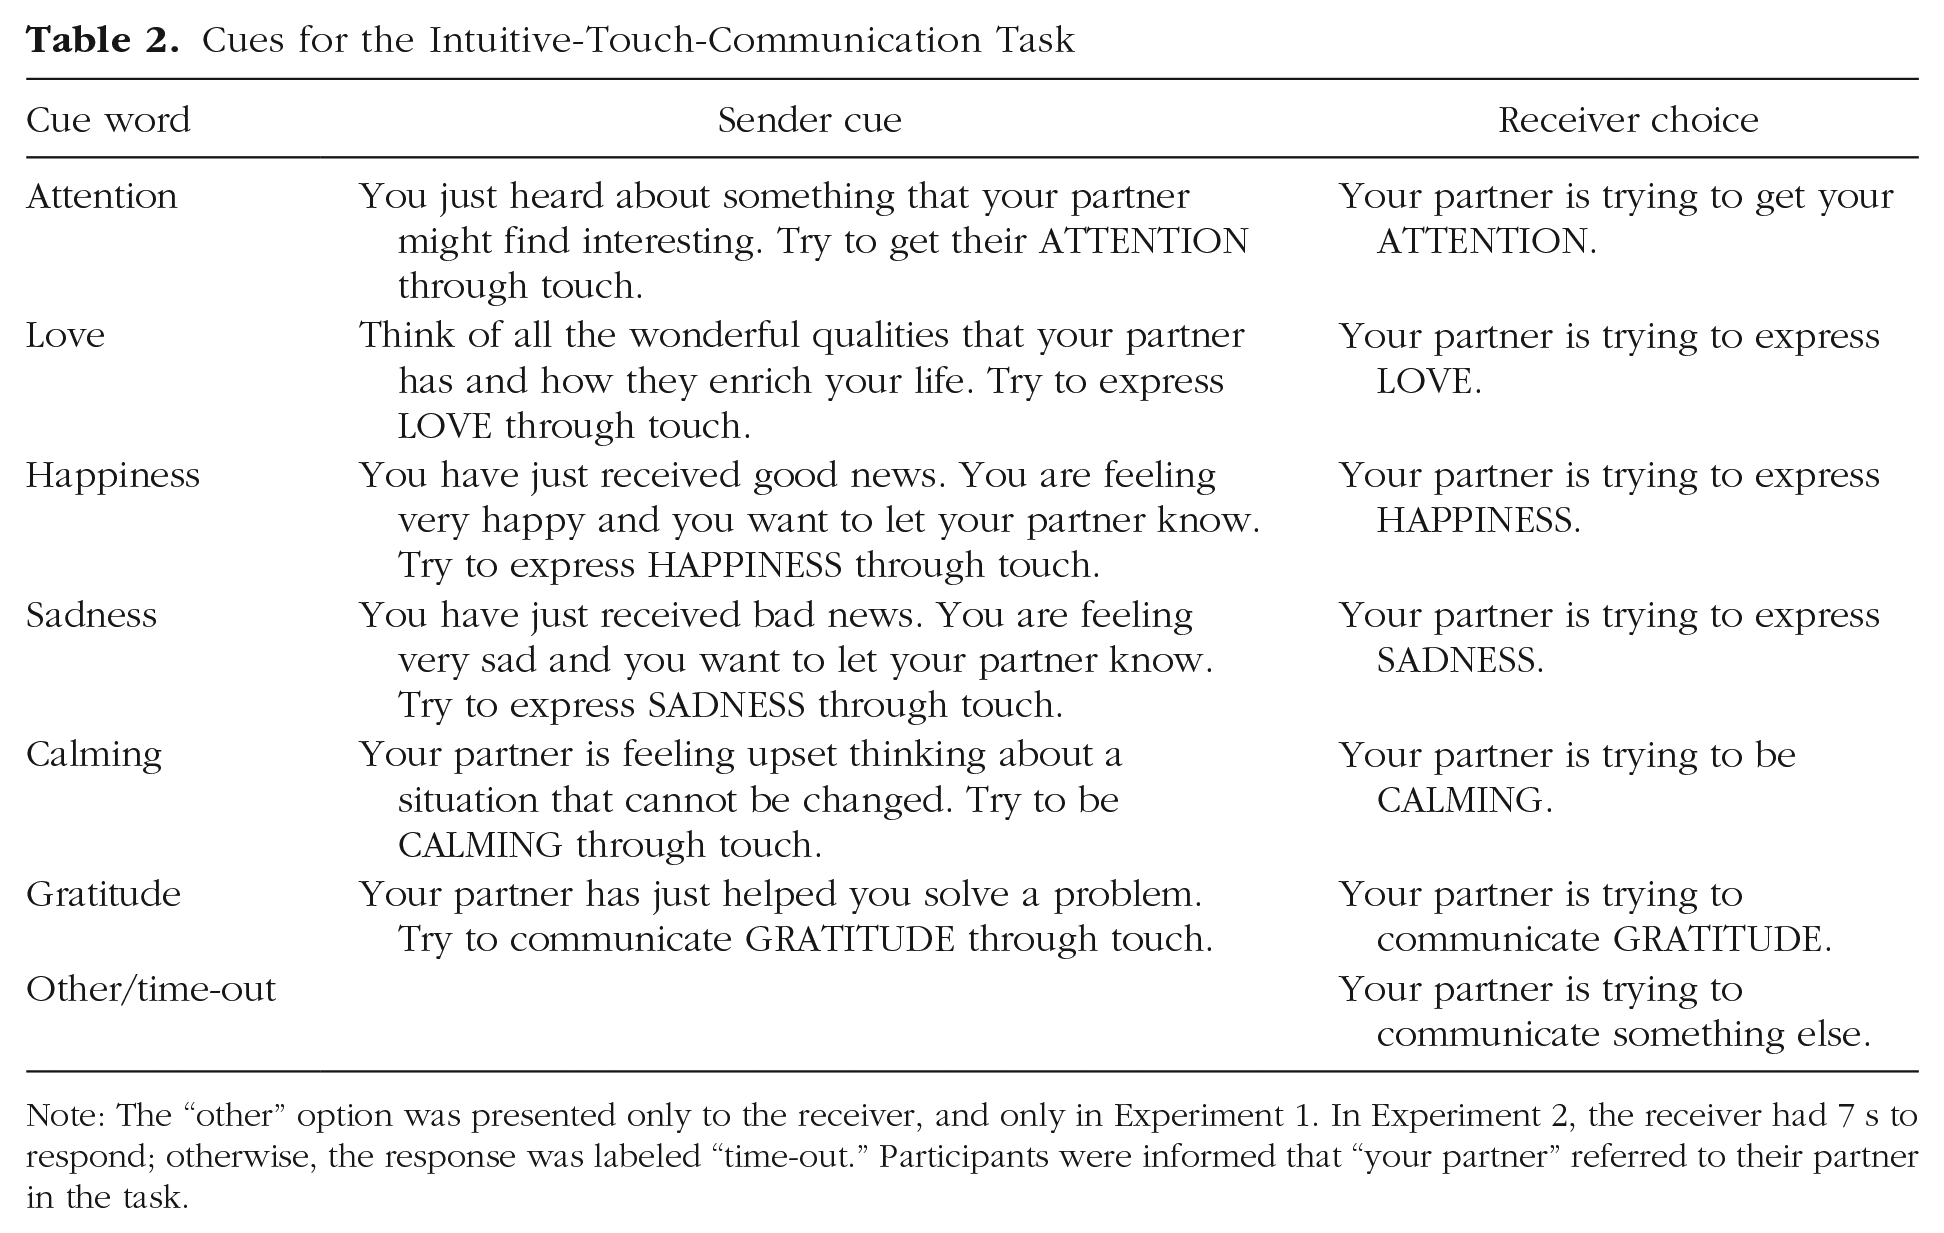
Note: The “other” option was presented only to the receiver, and only in Experiment 1. In Experiment 2, the receiver had 7 s to respond; otherwise, the response was labeled “time-out.” Participants were informed that “your partner” referred to their partner in the task.
Participants were assigned roles: one as the sender, the other as the receiver. The sender’s task was to send messages by touching the receiver’s arm. The receiver’s task was to guess what the message was. The receiver sat in a chair (Experiment 1) or lay in the MRI scanner (Experiment 2; MRI data will be presented in a separate article; Boehme et al., 2017) with one arm resting passively, accessible to the sender. The sender and receiver could not see each other’s faces, which were obscured by a curtain (Experiment 1) or the MRI scanner (Experiment 2). Participants were instructed to remain quiet throughout the touch-communication task, not talking or making any other noise such as laughing or sighing. The touch-communication task was guided by a custom Python script using PsychoPy (Version 1.83.04; Peirce, 2007). On each trial, the sender was presented with one of the sender cues shown in Table 2. The sender was told to touch only the forearm and that they could perform any kind of touch that they felt was appropriate. After each touch was performed, the receiver was presented with buttons on a screen labeled with all of the receiver response options shown in Table 2 and asked to select one to indicate what they thought the sender was communicating. The cues were presented in a pseudorandom order, and the locations of the buttons on the screen were shuffled on every trial. No feedback was provided.
There were some minor differences in how the task was conducted in Experiments 1 and 2. In Experiment 1, the sender could take as long as they wanted to perform the touch and controlled the pace of the experiment. After performing the touch-communication task, the participants switched roles so that the sender became the receiver and vice versa, and the touch-communication task was performed with the new roles. The experimental session consisted of two blocks, one for initial roles and one for swapped roles, of 30 trials each. Additionally, each cue was also presented once at the beginning of the first block (initial roles), in which the receivers could type in open-ended responses instead of being offered the forced-choice buttons. In addition to the touch-communication task, facial EMG responses of the participants were measured, and the touches were recorded on video (details below).
In Experiment 2, the task was conducted while the receiver was lying in an MRI scanner, and so the task was modified slightly. In addition to being given the instructions described above, the senders were told not to perform any shaking movements in order to avoid movement artifacts. Additionally, they were required to perform each touch for exactly 10 s to facilitate analysis of the functional MRI data. To control the timing of the experiment, we provided the sender with the single word cues (e.g., “attention”) via headphones, followed by a countdown to “go” and “stop” signals to start and stop touching. So the senders had time to consider how to perform the touch, as they did in Experiment 1, the senders were familiarized with the full cues (Table 1) before entering the scanner. The receiver was not given the “other” option, but if they failed to answer within 7 s, a “time-out” response was recorded and the next trial was presented. The participants did not swap roles. The experimental session consisted of two blocks of 60 trials each.
Standardized-touch-communication task
In the expert-touch experiments, the participant was always the receiver and a trained experimenter was the sender. On the basis of the video observations of the common physical features of touch-communication behavior between people in a close relationship (Experiment 1), we developed a set of 10-s standardized touch gestures for each of the six emotional messages (see Movies S1–S6 in the Supplemental Material). These standardized gestures were applied to the forearm by trained experimenters, who received spoken cues via headphones.
In Experiment 3, one trained experimenter performed all the gestures (Expert 1), and the experimental session consisted of one block of 90 trials. In Experiment 4, two different trained experimenters performed the gestures (Experts 2 and 3), and the experimental session consisted of two blocks of 60 trials each, usually with a different expert performing the touches in the two blocks. Because people tend to find touch from women more acceptable (Suvilehto et al., 2019), the trained experimenters were all female.
Data analysis for touch communication
To evaluate performance on the touch-communication task, we used F1 as the outcome measure. F1 is a measure of performance that is suited to classification tasks in which there are more than two categories and is appropriate when both misses and false alarms are equally undesirable. F1 is the harmonic mean of recall and precision, F1 = 2 × (precision × recall)/(precision + recall). Recall is the rate of cues correctly identified when present (also called hit rate), and precision is the rate of cues correctly identified when the receiver chose that cue. A separate set of analyses was also conducted using recall as the dependent variable, which yielded similar results and patterns of significance (not reported).
We conducted separate analyses for each experiment using a generalized linear mixed-effects model with a logit link function for F1 performance score as the dependent variable. For Experiment 1, we used fixed effects for cued word and roles (initial or swapped) and a random intercept term for participant. For Experiments 2 to 4, we used a fixed effect for cued word and a random intercept term for participant. When comparing intuitive and standardized touch, we used fixed effects for touch type (intuitive or expert) and cued word and a random intercept term for participant. To test for significance, we used parametric bootstrapping with 1,000 samples to produce likelihood ratios for full versus reduced models. Because we did not have the same number of judgments for receivers in different experiments, the weight term supplied to the model reflected the number of trials for each receiver–cue combination. Bonferroni-Holm correction was used for all post hoc tests comparing overall performance and performance of individual cues against chance, and for all post hoc pairwise comparisons, to obtain a familywise α of .05 separately for each model. Analyses were performed in the R programming environment (Version 4.0.3; R Core Team, 2018) using the package afex (Version 1.0-1; Singmann & Kellen, 2019), and figures were created using the packages ggplot2 (Version 3.3.3; Wickham, 2016) and patchwork (Version 1.1.1; Pedersen, 2017).
Facial EMG
In Experiment 1, emotional expression in the face during the touch-communication task was assessed by measuring corrugator and zygomatic reactivity in response to the touch associated with each cue from both participants using a dual wireless EMG system (Dual Wireless EMG BioNomadix Pair; Biopac Systems, Goleta, CA). The corrugator supercilii muscle, which furrows the eyebrows, is active during frowning; stimuli with negative valence increase its activity, whereas stimuli with positive valence decrease its activity (Larsen et al., 2003). The zygomaticus major muscle, which lifts the cheeks and lips, is active during smiling and is associated primarily with positive affect (Larsen et al., 2003) and particularly with high-arousal positive affect (Fujimura et al., 2010). Facial EMG of the corrugator and zygomatic muscles was measured in microvolts. EMG was measured over the left brow and cheek and a ground sensor on the forehead (Fridlund & Cacioppo, 1986) with 4-mm Ag/AgCl electrodes. Impedances were kept below 20 kΩ. EMG signals were amplified, band-pass filtered at 10 Hz to 500 Hz, digitized at 1,000 Hz, band-stop filtered at 50 Hz, rectified, and integrated over 20 ms by using EMG100C amplifiers and MP160 Data Acquisition System and AcqKnowledge software (Version 5.0.5; Biopac Systems, 2015). The script guiding the touch-communication task simultaneously delivered triggers to the EMG data-capture system via parallel port and played an audio signal that was captured by the video recording. This synchronizing signal was sent each time the sender pressed a button on the keyboard to indicate that they were about to start performing the touch. Research assistants then manually inspected the video recordings of every trial to find the frame following this signal on which the touch actually started. We then used the time delay from the synchronization signal to align the touch onset with the facial EMG recording. The video recordings were made at 25 frames per second, giving us a precision of 40 ms for identifying the onset of the touch (the audio was sampled at 44.1 kHz and the facial EMG at 1 kHz, meaning the visual onset of the touch had the lowest temporal resolution). The exact timing of the onset and offset for the touches was determined in this way for all participants, except for two blocks that lacked video data. In this case, the onset of touch was instead determined by the timing of the button press made by the sender to indicate they were about to start touching.
Data processing and analysis for facial EMG
For each trial, we extracted a 200-ms baseline preceding touch onset and a 4-s stimulation segment from touch onset. This time window was chosen on the basis of inspection of the data plotted over time (see Fig. S2 in the Supplemental Material), which revealed that this window was long enough for effects to stabilize while still allowing sufficient data from shorter trials to be included. For the attention cue, which provoked the shortest touch durations, 35% of trials lasted longer than 4 s. The baseline period was between 1,200 ms and 1,000 ms before touch onset. This was because the sender’s facial EMG responses had already started to change immediately before onset because they read the cue before starting to perform the touch (see Fig. S2). Automatic artifact rejection was applied to the data within the selected baseline and stimulus periods using a custom R script and based on a procedure previously validated in a large sample by comparison with manual inspection (Künecke et al., 2014). Data were flagged if the range within a sliding 50-ms window exceeded 3 times the standard deviation of the participant’s full data set. Data within the selected time window were down-sampled to 100-ms bins, and a bin was rejected if it contained any flagged data samples. Trials were included in the analysis if after artifact rejection they had at least 10 bins remaining (i.e., a total of 1 s), including at least one from the baseline period. Out of 971 trials recorded, the following number of trials remained in the analysis after artifact rejection: 939 trials for the zygomaticus activity of the sender (attention: 155, love: 162, happiness: 148, calming: 161, sadness: 158, gratitude: 155), 954 trials for the zygomaticus activity of the receiver (attention: 151, love: 158, happiness: 162, calming: 162, sadness: 161, gratitude: 160), 924 trials for the corrugator activity of the sender (attention: 152, love: 160, happiness: 150, calming: 156, sadness: 154, gratitude: 152), and 935 trials for the corrugator activity of the receiver (attention: 149, love: 160, happiness: 156, calming: 157, sadness: 158, gratitude: 155).
The data were z scored within each participant for each muscle separately across all trials, thus resulting in the standardized activity of zygomaticus and corrugator for every participant. For each trial, the mean z score during the baseline phase was subtracted from the mean z score during the touch phase to obtain the difference scores, reflecting the muscle activity in response to the touch relative to the baseline period preceding touch. We used a linear mixed model with difference score as the dependent variable, a fixed effect for cued word, and a random intercept term for participant. To test for significance, we used the Kenward-Roger approximation based on a modified F test (Singmann & Kellen, 2019).
For the machine-learning analysis, we used a random-forest classifier (Ho, 1995) with 1,000 estimators (decision trees) using the Scikit-learn package (Version 0.24.2; Pedregosa et al., 2011) with Python 2.7. The estimators are constructed in randomly selected subspaces defined by the input features (from the EMG recordings), and the classifier automatically finds the most important features for predicting the cue. As input to the classifier, six features were selected from the cleaned data set for each muscle, resulting in 12 features total for either sender or receiver. These six features were chosen as described by Jerritta et al. (2014) and Picard et al. (2001) and consist of the (a) mean of the raw signal, (b) standard deviation of the raw signal, (c) mean of the absolute values of the first differences of the raw signals, (d) mean of the absolute values of the first differences of the normalized signals, (e) mean of the absolute values of the second differences of the raw signals, and (f) mean of the absolute values of the second differences of the normalized signals. Tenfold cross-validation was performed to determine classifier accuracy and uncertainty and to prevent overfitting. Statistical analysis of classifier accuracy was performed (SciPy statistics package, Version 1.7.1; Virtanen et. al., 2020; Python 2.7). To determine whether classification accuracy was better than random, we compared the number of correct classifications for each cued emotion with a random classifier in a contingency table and then used a χ2 test of independence of variables to determine statistical significance.
Video recording
In Experiment 1, the touch-communication task was recorded on video so we could capture the features of touch, such as duration, speed, target area, intensity, and type. Care was taken to record a small area focused on the arm of the receiver to avoid recording the participants’ faces. On the rare occasion when a participant’s face entered the frame, this was edited to obscure the face, and the original recording was destroyed. Videos were coded by three research assistants who were unaware of the cue presented to the sender. The timing of each touch event was recorded, and they were coded for target location, intensity, and type.
The coding scheme was adapted from that reported by Hertenstein, Keltner, et al. (2006). Locations were categorized as the hand, wrist, lower forearm (distal), and upper forearm (proximal). Intensity was coded as light (skin indentation or arm movement minimal; e.g., slow stroking, holding), moderate (moderate skin indentation or arm movement; e.g., fast stroking, squeezing), or strong (considerable skin indentation or arm movement; e.g., shaking). Touch type was selected from a long list of descriptors: holding, pressing, lifting, interlocking, hugging, tossing, pulling and pushing, stroking, squeezing, swinging and massaging, pinching, rubbing, tapping, shaking, patting, poking, hitting, picking, scratching, slapping, tickling, and trembling.
Data processing and analysis for video recordings
Video data were annotated with ELAN (Version 5.1; Max Planck Institute for Psycholinguistics, 2017). For two sessions (one half of the experiment for each of two different pairs), recordings were not made because of equipment failure. Annotation text was automatically matched in R against the keywords included in the coding scheme for touch type, location, and intensity. Trials with missing data were checked for typos and other labeling errors, which were manually corrected. Of the recorded sessions, 53 trials (2.5%) were excluded because of missing data, obscured touches, and rare touch events that did not fit the coding scheme. The touched locations were simplified for presentation in Figure 1. The wrist was included in the “distal arm” category, and the “whole arm” category included touches that covered at least two different location categories.
To determine the most effective touch strategies, we evaluated the type, location, and intensity of the touches with respect to performance on the touch-communication task, for every trial. The combination of type, location, and intensity gave the full description of each touch action. Some senders used multiple touch actions on a single trial, including in some cases swapping back and forth between different touch actions. For this reason, we did not want to simply count the number of times that a touch action appeared because these trials would mean that these repeated touch actions would be overrepresented. Furthermore, on some trials in which senders used multiple touch actions, one action appeared to be the dominant strategy, with more time spent on it than other actions. For this reason, we did not want to simply count whether a touch action appeared in a trial. We decided to capture how prominent a particular touch action was for a given trial by using the proportion of trial time spent on it. This also accounts for differences in trial duration.
To identify the best and worst touch actions for conveying each cued message, for each touch action, we calculated the difference between the proportion of time that action appeared in all correct trials and the proportion of time that it appeared in all incorrect trials for a given cue. This score was then used to rank the touch actions for each cue. We then selected the top four touch actions (or all actions that appeared more in correct than incorrect trials if there were fewer than four; i.e., with a positive score) and the bottom four touch actions (or all with a negative score if there were fewer than four).
Hand tracking
In Experiment 4, the physical attributes of standardized touch gestures from two expert senders were measured and characterized using a motion-tracking system (Hauser et al., 2019). Measurements were taken via custom software using a Leap Motion camera system (Leap Motion, San Francisco, CA) to track the sender’s hands and a Flock of Birds six-degrees-of-freedom sensor system (Trakstar and Model 800 sensors; Ascension, Shelburne, VT) to track the receiver’s forearm. Six contact metrics were considered: (a) velocity of the sender’s hand normal to the receiver’s arm, (b) velocity of the sender’s hand tangential to the receiver’s arm, (c) the total contact area between the sender’s hand and the receiver’s skin, (d) the percentage of the sender’s palm area contacting the receiver’s skin, (e) the number of the sender’s fingers contacting the receiver, and (f) the proportion of time in which the sender’s palm was in contact with the receiver. To compare across gestures, we normalized mean values between 0 and 1 for each contact metric on the basis of the population standard deviation.
Results
Touch communication within close relationships
In two experiments involving pairs in close relationships, we found that the participants assigned to the role of receiver were able to interpret the gestures on the basis of touch alone and select the correct message at well above the chance rate (Fig. 1), despite neither participant receiving any feedback or training. Additionally, the correct response was the most popular one, for every cue (Figs. 1b, 1c, and 1e), although this was not true for all individuals (see Fig. S1 in the Supplemental Material). This demonstrates that social touch messages are readily communicated within emotionally close pairs, consistent with previous reports (Hertenstein et al., 2009; Hertenstein, Keltner, et al., 2006; McIntyre et al., 2019).
To evaluate touch-communication performance, we used the F1 metric, which reflects performance that minimizes both misses and false positives. The chance rate was set at .29, which is the maximum possible F1 score for a single cue when giving identical answers on all trials (for further details, see Data Analysis for Touch Communication). In the first experiment (Figs. 1a–1d), overall performance was significantly better than chance (estimated marginal mean [EMM] F1 score = .59, 95% CI = [.49, .68], z = 18.00, p < .001), as was performance for every individual cue (Fig. 1d; all ps < .001, Bonferroni-Holm correction). Performance varied significantly by cue, χ2(5) = 432.02, p < .001 (mixed-effects model), was significantly better after swapping roles, χ2(1) = 39.64, p < .001, and varied with the cued word, χ2(5) = 24.20, p < .001. In this experiment only, the pairs swapped roles halfway through the testing session so that the sender became the receiver and vice versa. Swapping roles significantly improved identification of happiness, calming, and gratitude (attention: odds ratio [OR] = 0.81, 95% CI = [0.58, 1.12], z ratio = −1.32, p = .190; love: OR = 0.89, 95% CI = [0.68, 1.17], z = −0.84, p = .403; happiness: OR = 0.60, 95% CI = [0.45, 0.80], z ratio = −3.4, p < .001; calming: OR = 0.47, 95% CI = [0.36, 0.62], z ratio = −5.44, p < .001; sadness: OR = 1.01, 95% CI = [0.68, 1.17], z ratio = −0.836, p = .403; gratitude: OR = 0.52, 95% CI = [0.39, 0.68], z ratio = −4.7, p < .001; post hoc pairwise comparisons with Bonferroni-Holm correction).
In a second experiment (Figs. 1e and 1f), the communication task was performed with the receiver in an MRI scanner (data are presented in a separate article), and the pairs did not swap roles. Similar to Experiment 1, overall performance in Experiment 2 was significantly better than chance (EMM F1 score = .58, 95% CI = [.47, .68], z = 17.8, p < .001), as was performance for every individual cue (Fig. 1f; all ps < .001, Bonferroni-Holm correction).
Facial expressions accompanying touch communication
To measure facial expressions during touch communication within close relationships in Experiment 1, we recorded facial muscle activity in the zygomatic (smiling) and the corrugator (frowning) muscles, in both the sender and the receiver, using facial EMG (Fig. 2). For the outcome measure, we used the participant-level z score of the activity measured on each muscle and took the difference in z score measured during the first 4 s of touch relative to a baseline period preceding the touch (see the Method section and Fig. S2).
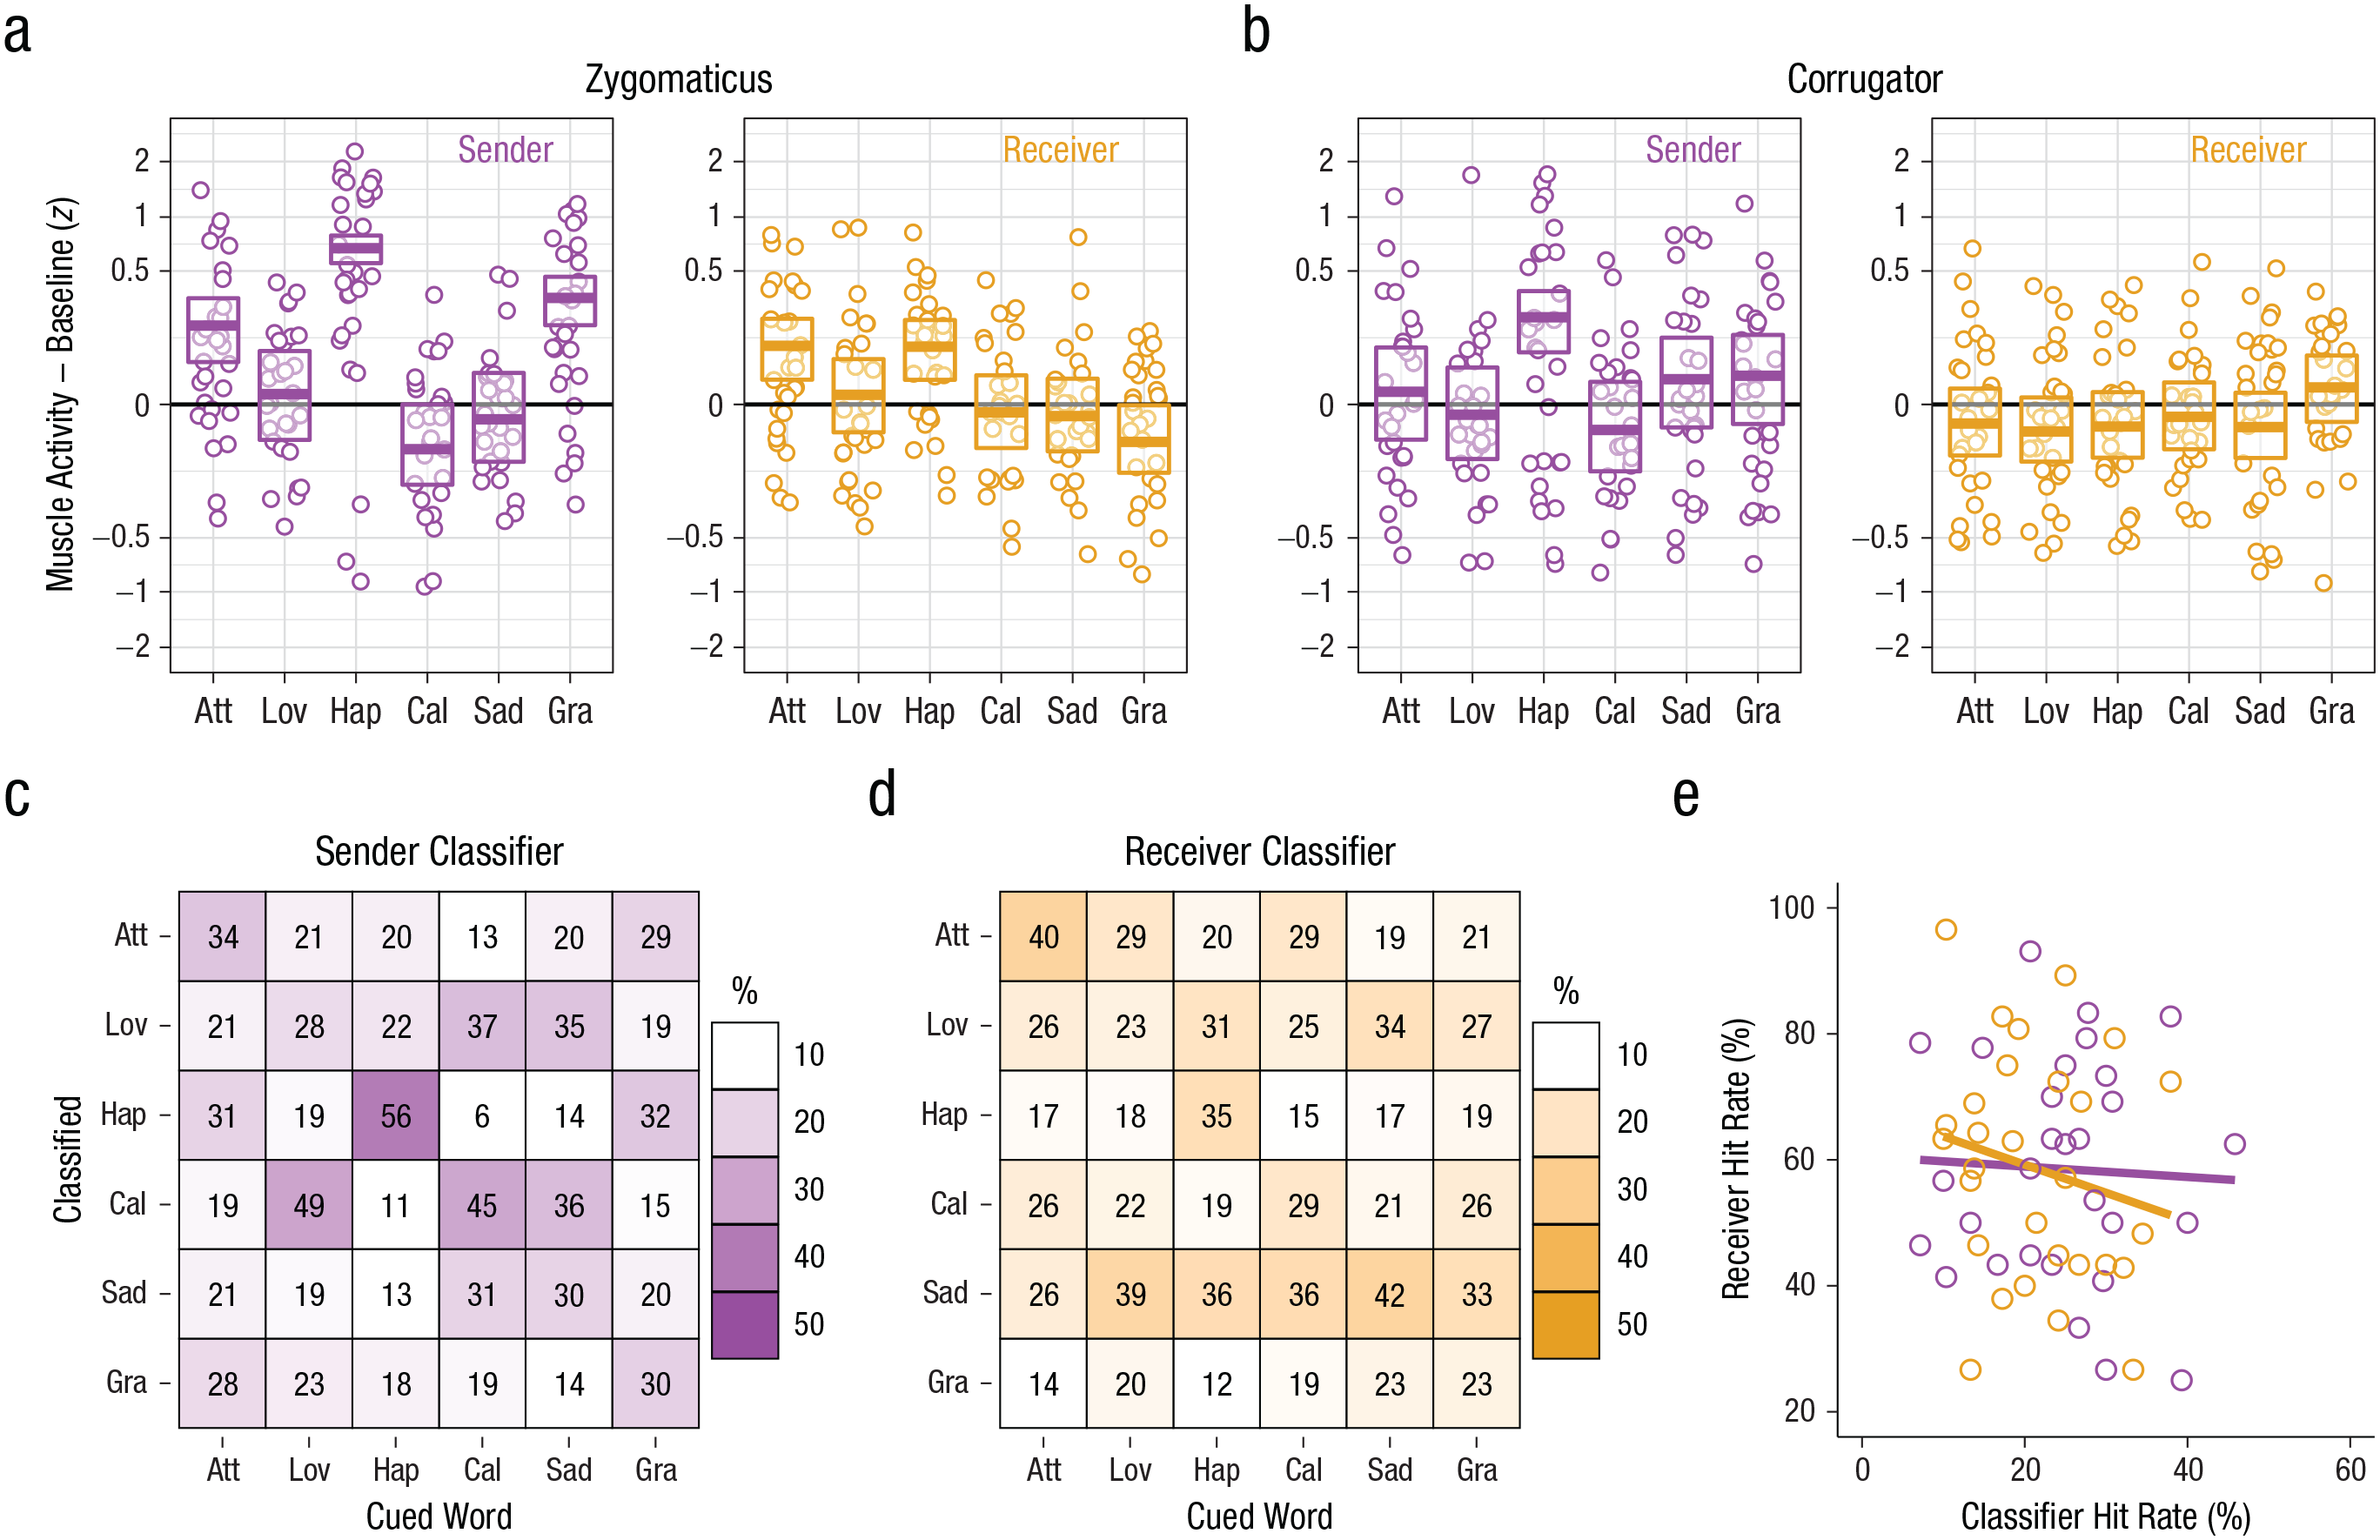
The role of facial expressions in touch communication in Experiment 1. Mean facial electromyography activity of the (a) zygomaticus muscle and (b) corrugator muscle during the first 4 s of touch during the touch-communication task is shown for each cued word, separately for senders and receivers. Values on the y-axis are participant-level z scores during touch relative to baseline (0). The y-axis is on a pseudo log scale to emphasize differences between the different cues rather than individual data points. Circles show the average for each participant–cue combination. Box plots give the estimated marginal mean (central horizontal line) and 95% confidence interval (top and bottom edge of box) for each participant role and cue. Data in (a) are from a total of 939 (sender) and 954 (receiver) trials after artifact rejection, and data in (b) are from a total of 924 (sender) and 935 (receiver) trials after artifact rejection (see the Method section). The matrixes show performance of a random-forest classifier on the facial muscle activity (from both muscles) of (c) the sender to predict the cue and (d) the receiver to predict the cue. Each square represents a unique cue/response combination. The number in the square indicates the total number of times that unique combination occurred, pooled across participants. The shading indicates the percentage of occurrences that response was made out of the total number of times that cue was presented (columns sum to 100% shading). A dark diagonal indicates good performance on the communication task, and shading off the diagonal indicates consistent mistakes. The scatterplot (e) shows the relation between the receivers’ accuracy in interpreting the messages as a function of the classifier’s accuracy in interpreting the messages, separately for senders (purple) and receivers (orange). Solid lines indicate best-fitting regressions. Att = Attention, Lov = Love, Hap = Happiness, Cal = Calming, Sad = Sadness, Gra = Gratitude, Oth = Other.
Although the senders and receivers could not see each other’s faces (Fig. 1a), we found that both the senders’ zygomatic and corrugator activity and the receivers’ zygomatic activity varied according to the cued message that was being communicated through touch.
Mixed-effects models revealed that the senders’ zygomatic activity during touch was significantly greater than baseline (EMM = .19, 95% CI = [.10, .28]), t(28) = 4.13, p < .001, and varied with the cue, F(5, 906) = 49.69, p < .001 (model estimates and CIs are shown in boxplots in Fig. 2a). The receivers’ zygomatic activity during touch was not overall significantly greater than baseline (EMM = .03, 95% CI = [−.03, .10]), t(28) = 1.02, p = .316, but did vary significantly with the cue, F(5, 920) = 7.04, p < .001 (Fig. 2a).
The senders’ overall corrugator activity was not significantly different during touch compared with baseline (EMM = .06, 95% CI = [−.04, .157]), t(28) = 1.14, p = .264, but did vary significantly with cue, F(5, 891) = 8.58, p < .001 (Fig. 2b). The receivers’ overall corrugator activity was not significantly different during touch compared with baseline (EMM = −.04, 95% CI = [−.10, .03]), t(28) = −1.15, p = .262, nor did it vary with cue, F(5, 901) = 1.50, p = .188 (Fig. 2b).
We predicted that if the variations in the senders’ facial expressions were related to their capacity to convey social messages, the facial muscle activity of the sender should be related to the successful communication of messages. Similarly, if the variations in the receivers’ facial expressions reflected their ability to decode the touch messages, their facial muscle activity would also be related to performance on the communication task. To test this, we applied machine-learning methods to train random-forest classifiers on the facial muscle activity of the senders and the receivers separately, to predict which message was cued (see the Method section). When the classifier was trained on either the senders’ or the receivers’ facial muscle activity, it could predict the cued message significantly better than chance (chance hit rate = 16.7%; sender: M = 24.8%, SD = 5.9% across the tenfold cross-validation procedure; p < .001, n = 914 trials with data available from both muscles; Fig. 2c; receiver: M = 21.0%, SD = 4.4%; p < .05, n = 931 trials; Fig. 2d). Contrary to our prediction, results showed that neither classifier’s performance was significantly correlated with performance on the touch-communication task—sender: r = −.05, 95% CI = [−.41, .33], t(27) = −0.24, p = .8153; receiver: r = −.19, 95% CI = [−.52, .19], t(27) = −1.02, p = .3166 (including only those individuals with classifier data for at least 10 trials; Fig. 2e).
Development of standardized touch gestures
To characterize the intuitive touch gestures, we video-recorded the touch-communication task in the same experiment in which we recorded facial EMG activity (Experiment 1). The touching activity was coded by research assistants for location, intensity, and type from a list of descriptors adapted from the work by Hertenstein, Keltner, et al. (2006). We found that successful strategies for touch communication in a close relationship shared common features across senders (Fig. 3). For attention, the best features were moderate tapping and shaking. For calming, it was light holding at multiple locations on the arm as well as moderately stroking the whole arm or lightly stroking part of the arm. Gratitude was associated with light stroking or holding, or squeezing the arm. Happiness was best conveyed by light tapping across the whole arm. Love was successfully signaled by light stroking across the whole arm. Successful communication of sadness was most strongly associated with lightly holding or stroking one part of the arm. Touching the hand and using high intensity were generally unsuccessful strategies.
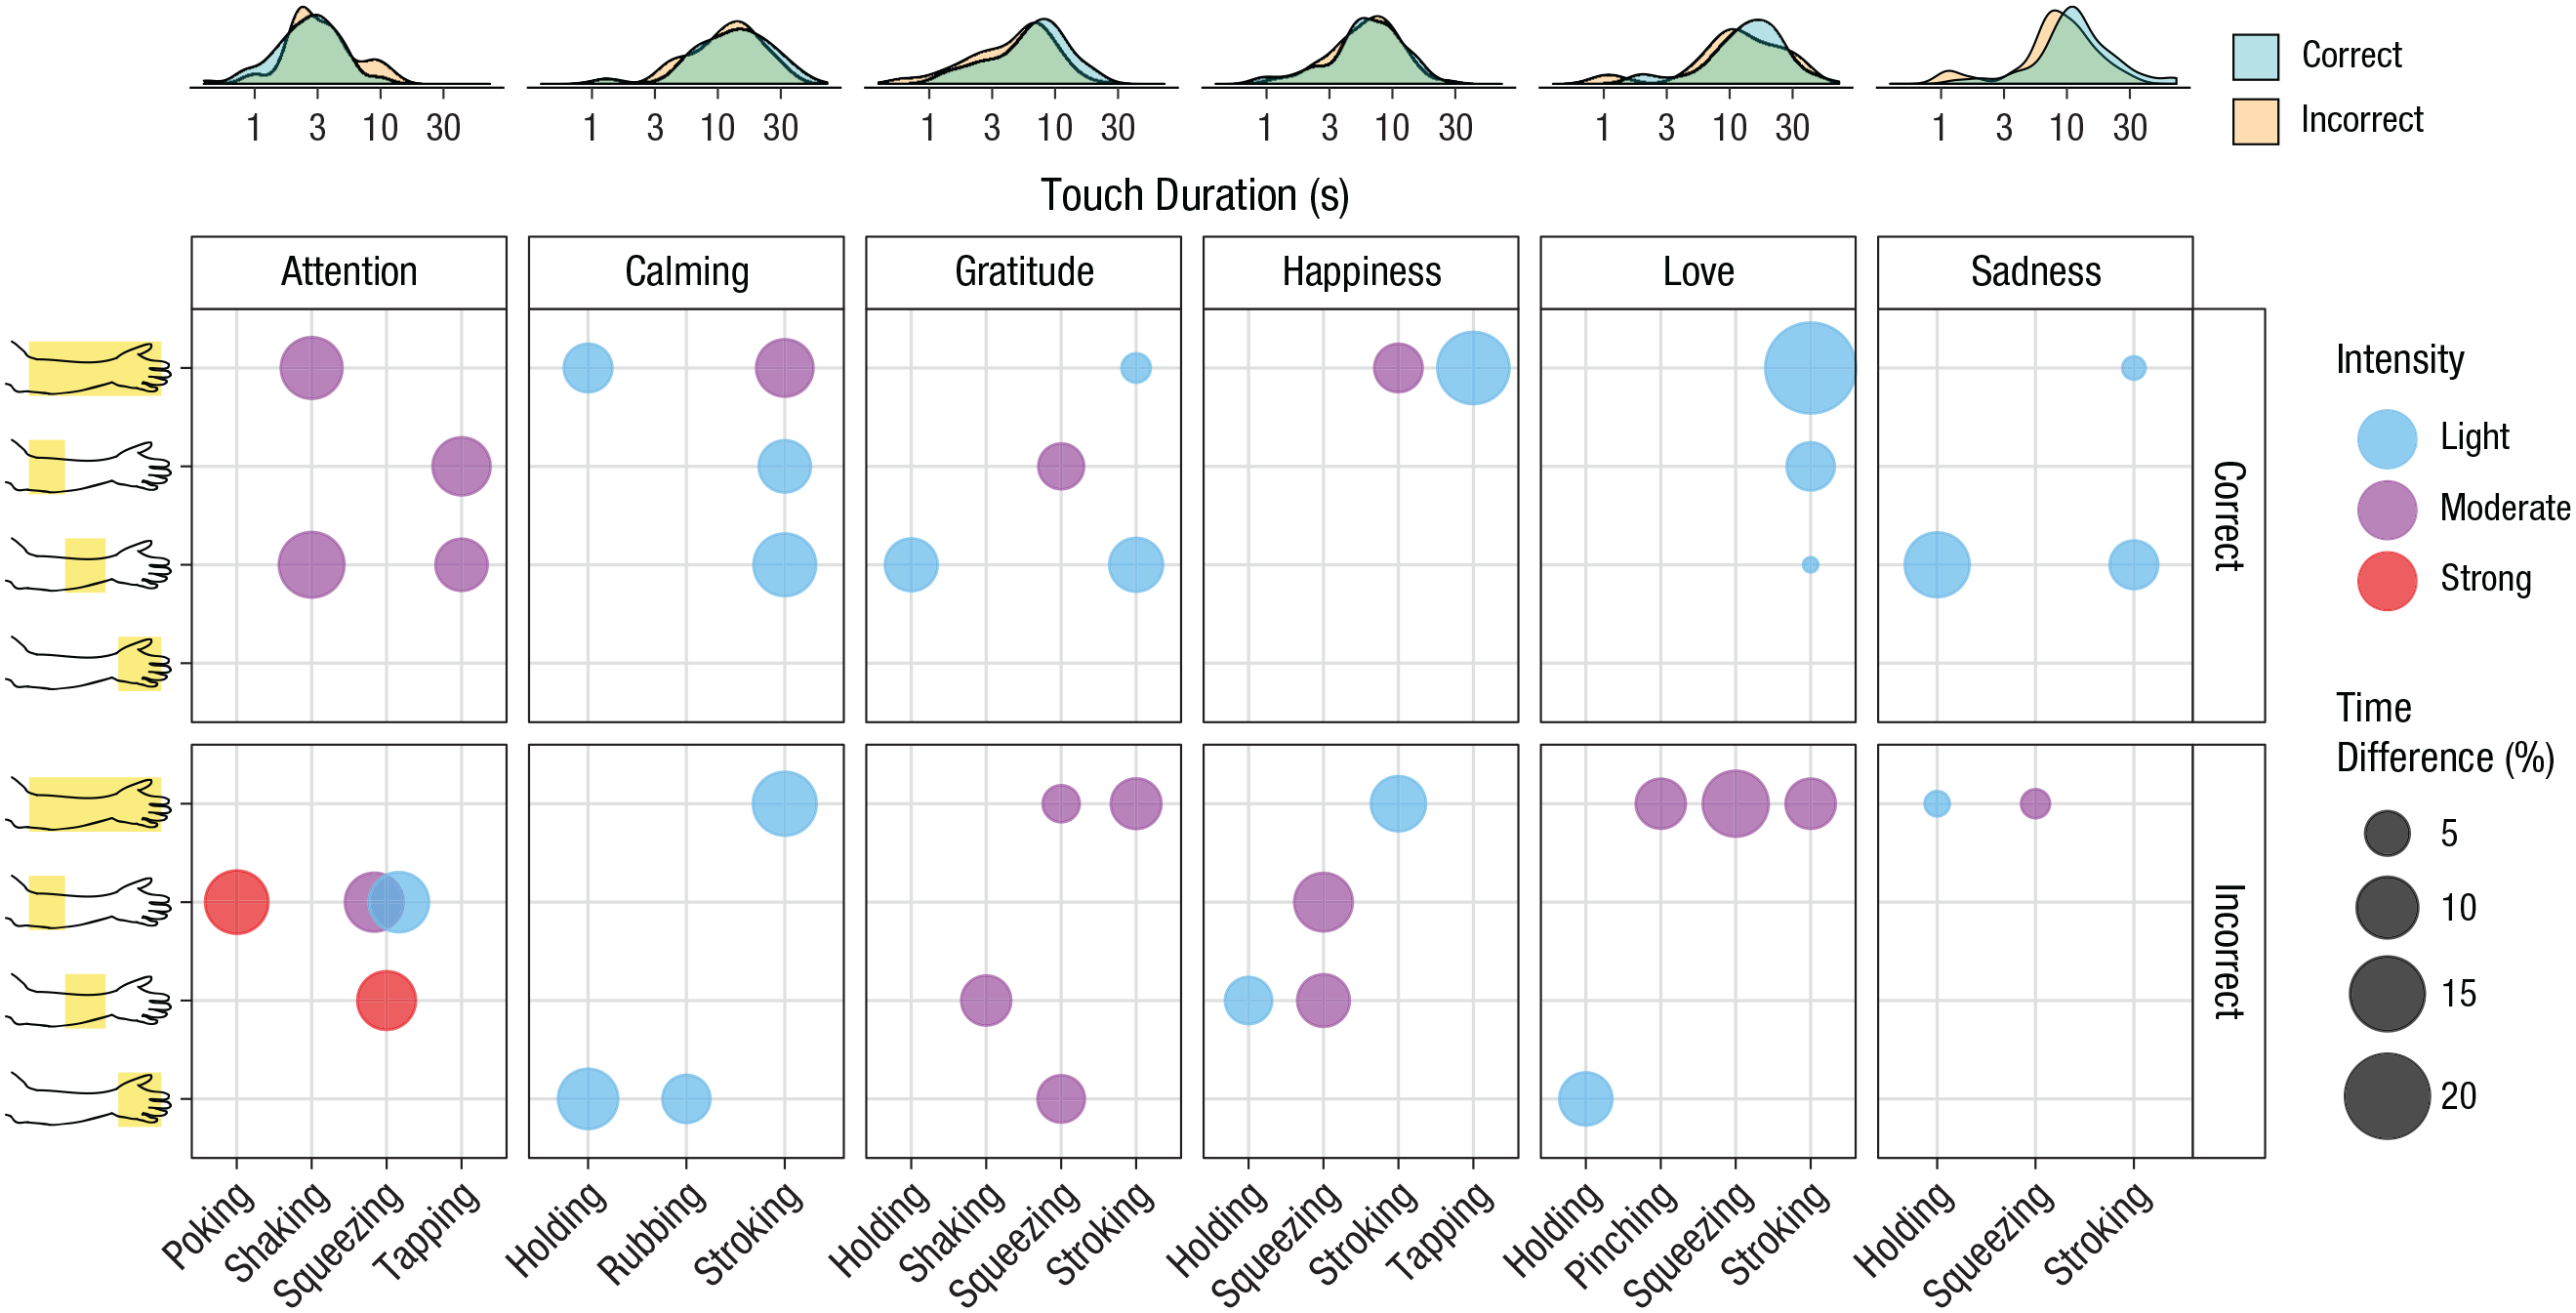
Location, intensity, and touch descriptors that best discriminated correct and incorrect interpretation of the messages in Experiment 1. Density plots of the touch durations for each cue are shown along the top of the figure, separately for correct and incorrect responses. Because the overall touch duration for different cues varied, time for each combination of features was calculated as a percentage of the total touching time for each cue (see the Method section). The top row of graphs shows the best combinations of touch features, up to four for each cue, that were observed most in trials with correct responses (time in correct trials minus time in incorrect trials). The bottom row shows the worst combinations that were observed most in trials with incorrect responses (time in incorrect trials minus time in correct trials). The size of each circle reflects the difference in touch duration between correct and incorrect trials. Intensity is visualized by color. The y-axis shows the touch locations (the top line in which the whole arm is shaded indicates touches that were applied to at least two individual locations).
To validate whether our characterizations of intuitive touch meaningfully reflect the features of touches that are important for communicating emotional cues, we developed standardized touch gestures (see Movies S1–S6). These were made up of the common features we observed in successful touch communication, and we avoided features found in unsuccessful communication (Fig. 3). When the touch expressions were delivered by three trained experimenters to strangers who were unacquainted with the experimenters (Fig. 4), overall identification of the touch messages was significantly better than chance (Experiment 3: EMM F1 score = .73, 95% CI = [.62, .81], z = 7.57, p < .001; Experiment 4: EMM F1 score = .65, 95% CI = [.59, .71], z = 19.20, p < .001), as was performance for every individual cue (Experiment 3: all ps < .001, Bonferroni-Holm correction; Experiment 4: all ps ≤ .02, Bonferroni-Holm correction). As in the intuitive-touch task, the correct response was generally the most popular one (except Experiment 4 gratitude, which was more often labeled calming), and individuals showed more variation (see Fig. S3 in the Supplemental Material).
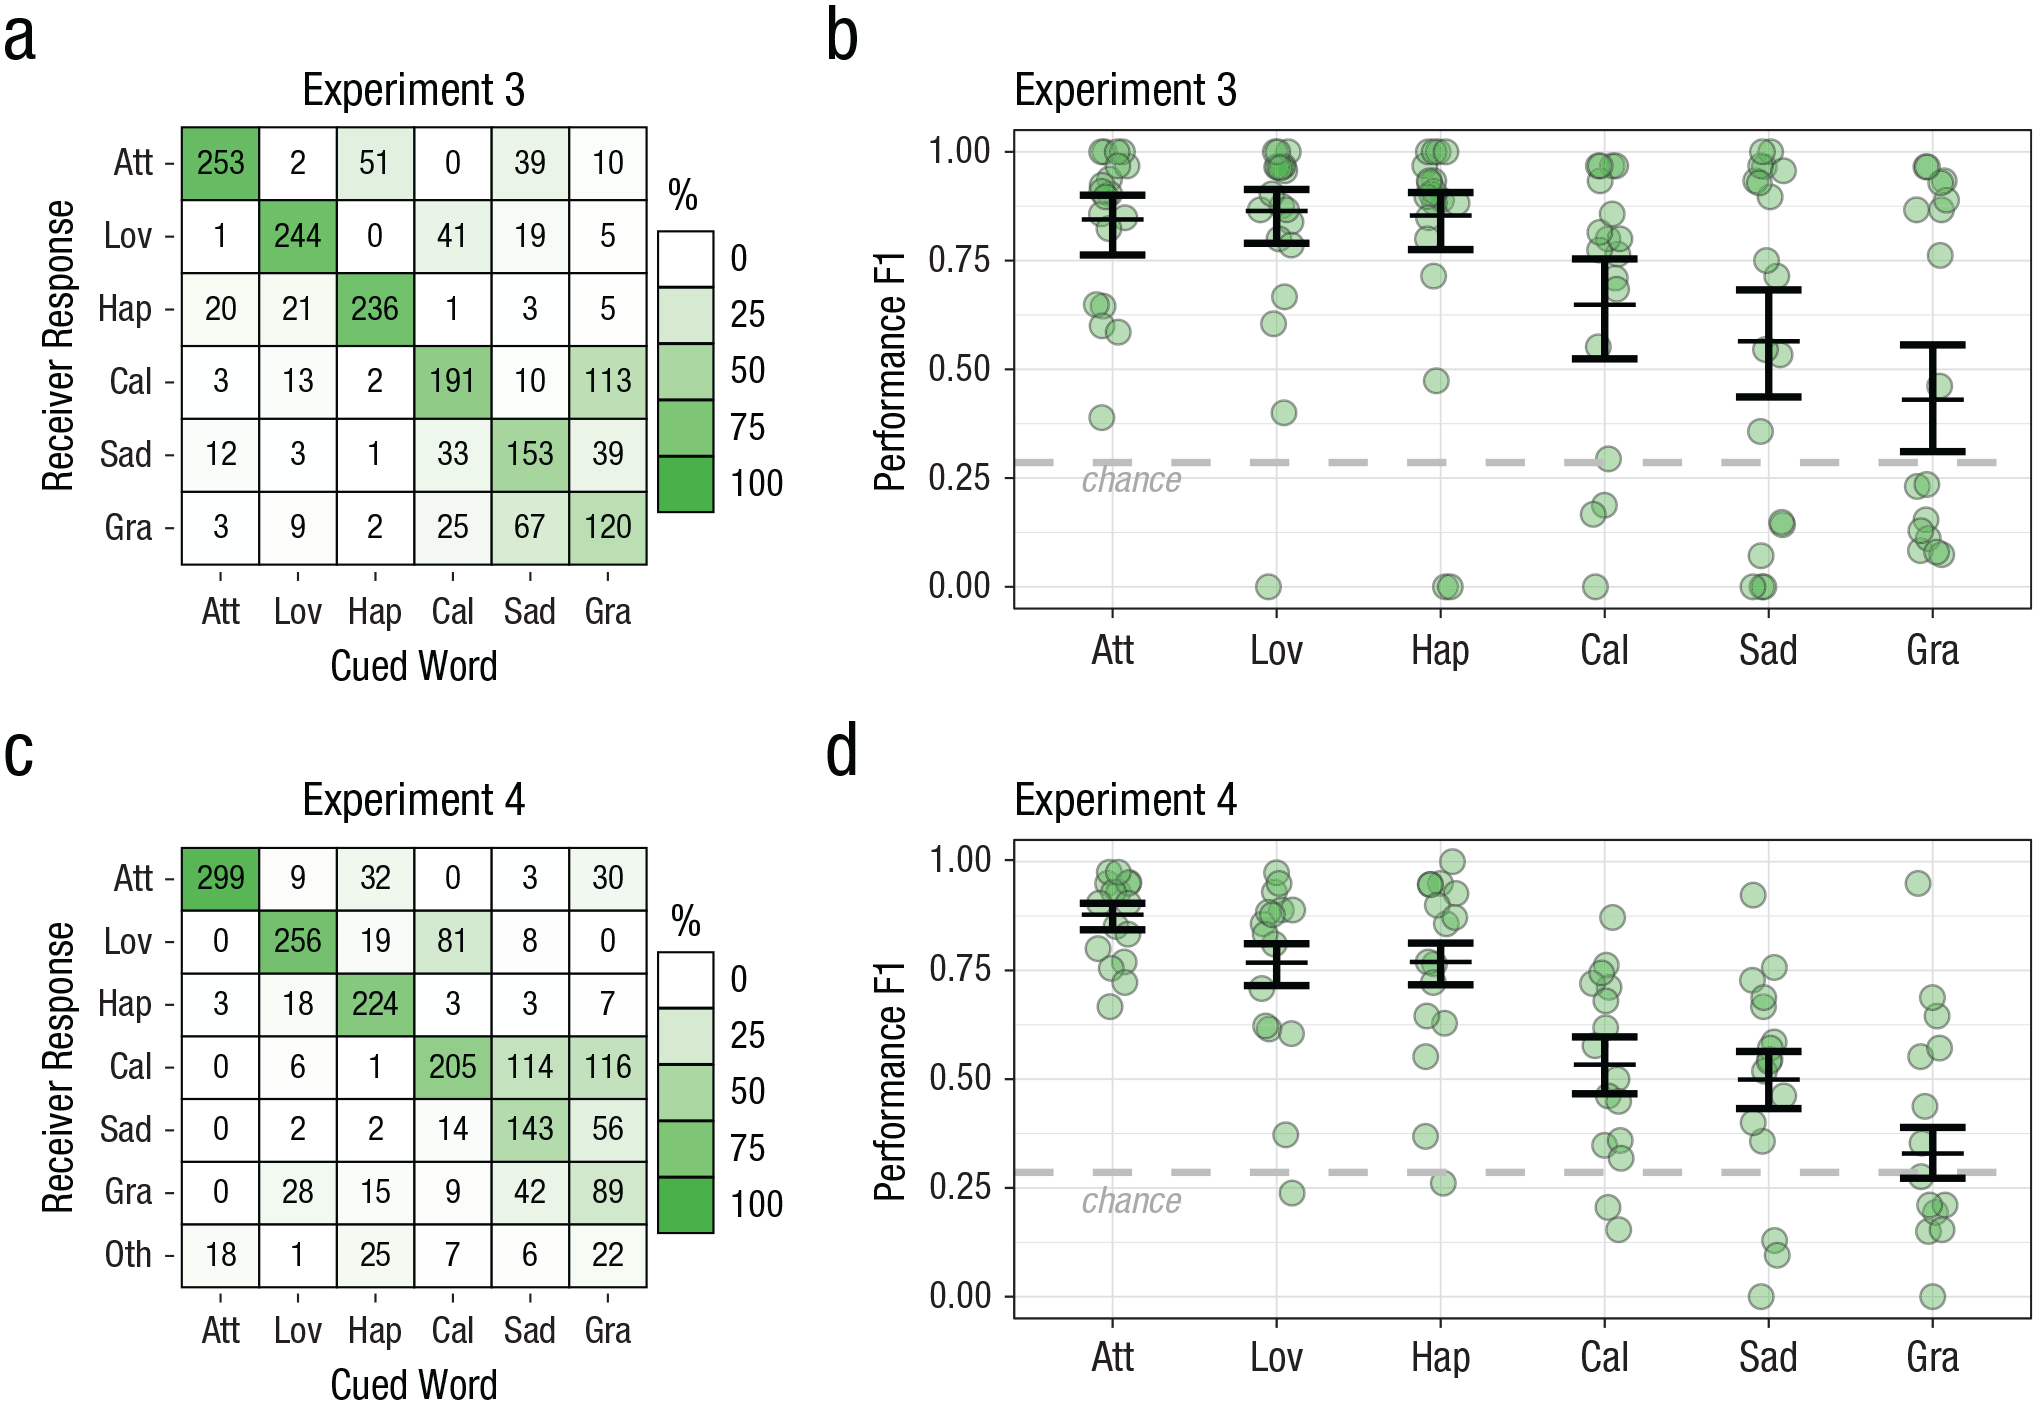
Touch communication between a trained expert sender and a receiver unacquainted with the sender (standardized touch). Group-level confusion matrixes show results for the communication task involving (a) Expert Sender 1 (Experiment 3) and (c) both Expert Senders 2 and 3 (Experiment 4). Each square represents a unique cue/response combination. The number in the square indicates the total number of times that unique combination occurred, pooled across participants. The shading indicates the percentage of occurrences that response was made out of the total number of times that cue was presented (columns sum to 100% shading). A dark diagonal indicates good performance on the communication task, and shading off the diagonal indicates consistent mistakes. F1 performance score (minimum = 0, maximum = 1) is shown for each cue in (b) for Experiment 3 and (d) Experiment 4. Circles show scores for each pair. Horizontal lines show model estimates (error bars indicate 95% confidence intervals). Chance-level performance (F1 = .29) is indicated by the dashed line. Att = Attention, Lov = Love, Hap = Happiness, Cal = Calming, Sad = Sadness, Gra = Gratitude, Oth = Other.
Hand tracking with a 3D motion-tracking system (Hauser et al., 2019) was used to characterize the different gestures in more detail, breaking them down into physical primitives (Fig. 5a; see Figs. S4 and S5 in the Supplemental Material). Both attention and happiness were characterized by high normal velocity, a small contact area, and a brief duration, but happiness had a high tangential velocity, whereas attention involved almost no lateral movement. Love and calming were both characterized by slow tangential movement, but compared with calming, love had a longer contact duration, a smaller overall contact area, and a higher ratio of finger to palm contact. Sadness was static with a large contact area and long contact duration. Gratitude involved slow normal and tangential movements with moderate contact area and duration.
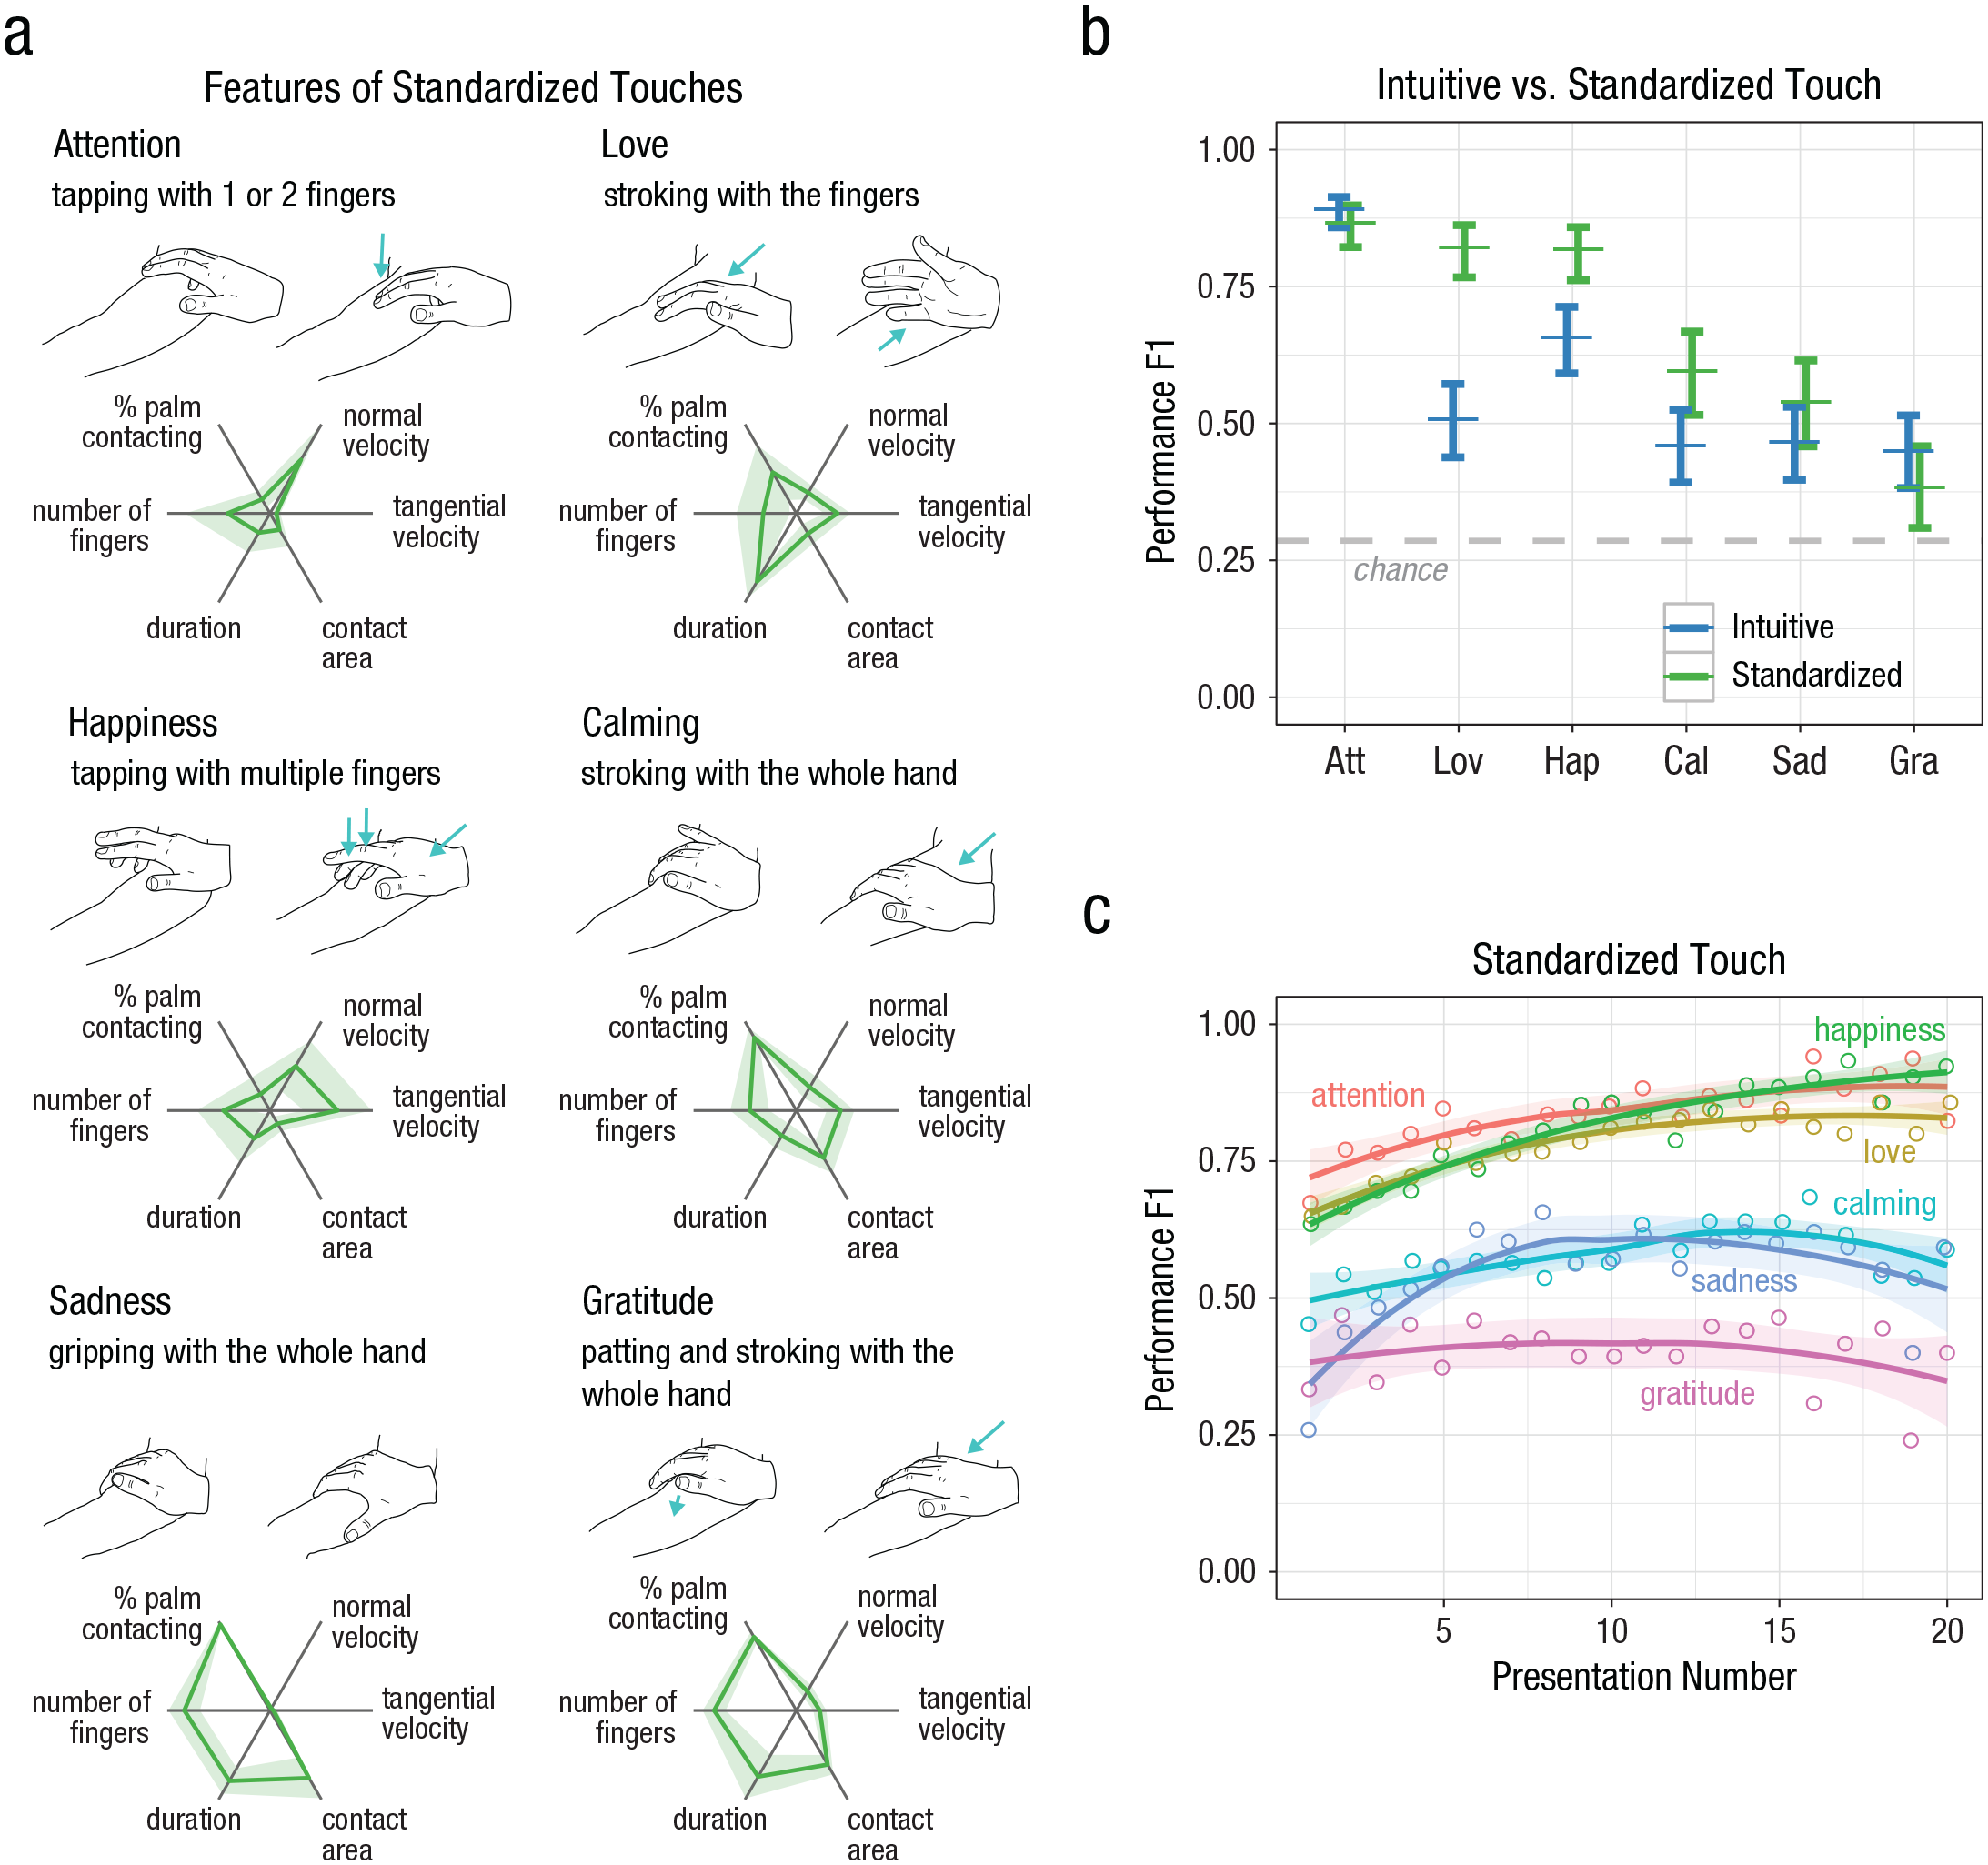
Characterization and evaluation of the standardized touches. Physical features of each standardized touch delivered by trained experimenters and measured using an automated hand-tracking system (Experiment 4, Experts 2 and 3) are shown in (a). Mean values for each contact metric (green lines) were normalized between 0 and 1 on the basis of the population standard deviation (shaded areas). Estimates of F1 performance score from a mixed-effects model comparing intuitive and standardized touch strategies are shown (b) for each cue type. Error bars show 95% confidence intervals. Chance-level performance (F1 = .29) is indicated by the dashed line. Estimates of F1 performance score are shown (c) for each number of presentation and standardized cue. The lines were fitted with a loess function with a span of 1; the shaded area is the 95% confidence interval based on the standard error (combined data from Experiments 3 and 4). Att = Attention, Lov = Love, Hap = Happiness, Cal = Calming, Sad = Sadness, Gra = Gratitude, Oth = Other.
We directly compared the standardized touches performed by experts with the intuitive touches performed by someone in a close relationship in a separate analysis (Fig. 5b). We found that identification of the standardized gestures was similar to or even slightly better than the intuitive touches, χ2(1, N = 1,000 bootstrapped samples) = 4.52, p = .027. Specifically, standardized touches produced significantly better recognition than intuitive touches for love, happiness, and calming (attention: OR = 0.80, 95% CI = [0.52, 1.22], z ratio = −1.04, p = .301; calming: OR = 1.73, 95% CI = [1.1, 2.6], z ratio = 2.58, p = .010; gratitude: OR = 0.76, 95% CI = [0.50, 1.15], z ratio = −1.288, p = .198; happiness: OR = 2.32, 95% CI = [1.53, 3.53], z ratio = 3.94, p < .001; love: OR = 4.44, 95% CI = [2.92, 6.76], z ratio = 6.97, p < .0001; sadness: OR = 1.35, 95% CI = [0.89, 2.04], z ratio = 1.40, p = .161; post hoc pairwise comparisons with Bonferroni-Holm correction). Furthermore, without feedback, the receivers were able to quickly learn the meaning of the gestures and reached a stable performance level after only 10 to 12 presentations (Fig. 5c).
Discussion
We identified touch expressions for which the social and emotional content are broadly understood between strangers, at least within one cultural context. Indeed, skillful strangers can communicate emotional touch messages as effectively or better than people in close relationships. We have ruled out a large role for an idiosyncratic touch language developed within couples or other close relationships in touch-communication efficacy. Communication performance without feedback was well above chance, and our standardized touch expressions reflected their basis in real interpersonal touch interactions and a common understanding. However, our study recruited adults living in Sweden, and an important open question is whether the standardized touch expressions are universally understood across cultural contexts.
That people can understand social and emotional touch messages confirms earlier reports (App et al., 2011; Hertenstein et al., 2009; Hertenstein, Keltner, et al., 2006; Kirsch et al., 2018). That strangers are as good as or better than people in a close relationship at communicating via touch provides an apparent contrast with earlier work showing that romantic couples communicate more effectively than stranger pairs (Thompson & Hampton, 2011). We reconcile this by considering that the earlier work used untrained strangers, whereas we trained our experimenters to use effective touch strategies with clear and distinct touch gestures. This training may compensate for a greater reluctance to touch a stranger compared with someone close (Suvilehto et al., 2015, 2019).
We went beyond the efforts used in previous studies (Gaus et al., 2015; Hertenstein et al., 2009; Hertenstein, Keltner, et al., 2006; Jung et al., 2015; Masson & Op de Beeck, 2018; Supratman et al., 2020) to characterize the physical features of touch communication. We did this by first evaluating their contribution to communication efficacy and then validating this by showing that standardized touch strategies based on the features identified as effective were indeed capable of conveying the intended message. Additionally, we used a 3D hand-tracking approach to obtain quantitative descriptors of the standardized touch expressions, including normal and tangential velocity, contact area and duration, and palm and finger contact.
A previous study evaluated the relationship between motion energy obtained from filmed interpersonal touch interactions and observers’ judgments of their valence and arousal (Masson & Op de Beeck, 2018). More positively viewed interactions tend to have lower motion energy, whereas more (emotionally) arousing interactions have higher motion energy. Our results are consistent with this finding. The highest measured velocities were observed in our attention and happiness expressions, which were likely to have relatively high arousal. Interestingly, these are the same two cues that in the receiver provoked a significant increase in zygomatic activity, which has been associated with high-arousal positive stimuli (Fujimura et al., 2010). Additionally, our sadness expression, being the only negative-valence message, had near-zero velocity.
Although measuring motion energy is quantitative and informative, we have shown that more detailed physical measurements can further discriminate specific touch messages; for example, happiness and attention had similar normal velocities but very different tangential velocities, whereas contact duration and area discriminated love and calming, which had similar tangential velocities. This is consistent with studies of human-delivered touch to pressure-sensor surfaces (Gaus et al., 2015; Supratman et al., 2020) and robot-delivered touch to humans (Teyssier et al., 2020) showing that a variety of contact area and motion-dynamics measures is required to distinguish different touch actions.
In our touch-communication task, the sender and receiver could not see each other’s expressions, but we asked whether either role’s facial expressions might interact with touch communication. The senders’ zygomatic and corrugator activity as well as the receivers’ zygomatic activity varied according to the touch message. However, when we looked for a relationship between facial muscle activity and communication success on an individual level, we did not find it. This suggests that the varying facial muscle activity may simply reflect the participants’ adoption of an existing set of strategies for communicating emotion that would normally involve both touch and facial expression. An alternative explanation for these findings is that some aspects of facial muscle activity that we did not measure are relevant to touch communication or that there is a weak relationship (small effect size) that we failed to detect.
The senders showed increased zygomatic activity when communicating attention, happiness, and gratitude, suggesting that expressing these messages may be accompanied by smiling. The sender also showed increased corrugator activity when communicating happiness, possibly because of high arousal produced by its high intensity (Fig. 3) and speed (Fig. 5). The receivers also showed increased zygomatic activity when feeling the touch expressions for attention and happiness, but not gratitude. The relatively high intensity and speed of the attention and happiness may have provoked a positive emotional response from the receiver (Fujimura et al., 2010). The result contrasts with previously observed increased zygomatic activity in response to a gentle stroking with a brush that most resembled our calming expression (Pawling et al., 2017). The touch evoked no significant changes in the corrugator activity of the receivers, in contrast to previous studies showing reduced corrugator activity (Mayo et al., 2018; Ree et al., 2020) in response to pleasant touch.
Our standardized touches closely resembled authentic interpersonal touch but were optimized for communicating specific messages. This is because they were developed on the basis of the successful communication strategies that people in close relationships used when given minimal instructions. Although we cued a specific message to communicate and limited the area of the body that could be touched, the participants were otherwise free to choose their own touch strategy. Some previous studies on touch communication systematically investigated different types of messages. For example, App et al. (2011) investigated which nonverbal communication channels are used for messages that correspond to different social functions (status conveying, survival focused, and intimacy focused). Kirsch et al. (2018) investigated how the same touches were interpreted differently if the receivers were given different tasks—interpreting either the emotion or the intention of the person performing the touches. In our study, we did not try to systematically vary details of the messages to be communicated because we did not have any specific hypotheses relating to them. Rather, our goal was simply to capture a variety of touch behaviors. Similarly, we did not control the exact type of relationship or demographics of our participants (Hertenstein et al., 2009; Hertenstein, Keltner, et al., 2006; Thompson & Hampton, 2011), the investigation of which would have required different sample-size considerations.
The interpretation of touch messages is likely to be influenced by a large number of contextual factors (Cekaite & Bergnehr, 2018; Weiss, 1986). We found that when pairs swapped roles, performance improved (Figs. 1b–1d). Experiencing multiple roles may have aided communication in a way that is similar to more interactive, natural contexts. One example of a real-world situation that has similar contextual information to our communication task is text communication. In principle, text alone can convey all information, analogous to speech. However, the widespread use of emojis to convey facial expressions illustrates that there is a clear desire to use analogs of nonverbal communication. Emojis rely on a preexisting broad consensus about the mapping between the visual elements of a facial expression and an emotional meaning. Similarly, our standardized touches did not require specific training or any feedback but were able to capitalize on a preexisting broad understanding, while also benefiting from additional contextual information.
Conclusions
When people in a close relationship engaged in emotional touch communication, the senders intuitively produced distinct gestures to effectively communicate different messages of attention, love, happiness, calming, sadness, and gratitude. The touch messages were associated with the senders’ facial expressions, but we found no evidence that this was related to the ability of the receivers to correctly interpret the touch message. In contrast, choosing the right touch strategies with appropriate physical features was sufficient for effective communication. We demonstrated this with our set of tactile standardized gestures delivered to strangers unacquainted with the senders: These gestures were identified even more successfully than the intuitive gestures delivered within the context of a close relationship. We have thus presented a lexicon of gestures, with distinct physical characteristics, that can be used for social communication to enrich emotional content. These findings inform the development and improvement of interpersonal communication mediated by haptic interfaces. It could also inform development of training for people in any context in which it is desirable that communication is enhanced and emotional touch communication is appropriate. It may also provide a useful tool for exploring social differences associated with psychiatric disorders.
Supplemental Material
sj-docx-1-pss-10.1177_09567976211059801 – Supplemental material for The Language of Social Touch Is Intuitive and Quantifiable
Supplemental material, sj-docx-1-pss-10.1177_09567976211059801 for The Language of Social Touch Is Intuitive and Quantifiable by Sarah McIntyre, Steven C. Hauser, Anikó Kusztor, Rebecca Boehme, Athanasia Moungou, Peder Mortvedt Isager, Lina Homman, Giovanni Novembre, Saad S. Nagi, Ali Israr, Ellen A. Lumpkin, Freddy Abnousi, Gregory J. Gerling and Håkan Olausson in Psychological Science
Footnotes
Acknowledgements
We thank Leah Mayo and Anna Asratian for advising us on facial electromyography methods, Juulia Suvilehto for suggesting the use of the F1 score, an anonymous reviewer for suggesting improvements to the analysis of the facial electromyography data, and India Morrison and Marcus Heilig for reading and giving feedback on an early version of the manuscript. The experiments were initiated and designed by researchers at Linköping University in Sweden as well as the University of Virginia and Columbia University in the United States. All experiments were carried out at Linköping University, Sweden.
Transparency
Action Editor: Steven W. Gangestad
Editor: Patricia J. Bauer
Author Contributions
S. McIntyre, R. Boehme, G. Novembre, S. S. Nagi, A. Israr, E. A. Lumpkin, F. Abnousi, G. J. Gerling, and H. Olausson conceptualized the study. S. McIntyre, S. C. Hauser, R. Boehme, A. Moungou, P. M. Isager, G. Novembre, G. J. Gerling, and H. Olausson designed the methodology. S. McIntyre, S. C. Hauser, A. Kusztor, and G. J. Gerling programmed the software. S. McIntyre, A. Kusztor, R. Boehme, A. Moungou, P. M. Isager, and L. Homman collected the data, and S. McIntyre, S. C. Hauser, A. Kusztor analyzed the data. S. McIntyre, R. Boehme, A. Moungou, and H. Olausson wrote the first draft of the manuscript, which was revised and edited by S. McIntyre, S. C. Hauser, A. Kusztor, R. Boehme, A. Moungou, P. M. Isager, L. Homman, G. Novembre, S. S. Nagi, A. Israr, E. A. Lumpkin, F. Abnousi, G. J. Gerling, and H. Olausson. All the authors approved the final manuscript for submission.
References
Supplementary Material
Please find the following supplemental material available below.
For Open Access articles published under a Creative Commons License, all supplemental material carries the same license as the article it is associated with.
For non-Open Access articles published, all supplemental material carries a non-exclusive license, and permission requests for re-use of supplemental material or any part of supplemental material shall be sent directly to the copyright owner as specified in the copyright notice associated with the article.