
Abstract
People make subjective judgments about the healthiness of different foods every day, and these judgments in turn influence their food choices and health outcomes. Despite the importance of such judgments, there are few quantitative theories about their psychological underpinnings. This article introduces a novel computational approach that can approximate people’s knowledge representations for thousands of common foods. We used these representations to predict how both lay decision-makers (the general population) and experts judge the healthiness of individual foods. We also applied our method to predict the impact of behavioral interventions, such as the provision of front-of-pack nutrient and calorie information. Across multiple studies with data from 846 adults, our models achieved very high accuracy rates (r2 = .65–.77) and significantly outperformed competing models based on factual nutritional content. These results illustrate how new computational methods applied to established psychological theory can be used to better predict, understand, and influence health behavior.
Keywords
Poor diet is one of the primary preventable causes of premature death in high-income countries (Bauer et al., 2014). Understandably, people want to consume healthy foods because they recognize the relationship between diet and health. However, people can make healthy food choices only to the extent that they can correctly judge a food’s healthiness. One obstacle to healthy eating is that there is no normative answer to the question, “What makes food healthy or unhealthy?” (Lobstein & Davies, 2008). Still, it is commonly believed that food-healthiness judgments are strongly linked to beliefs about the nutritional content of food products (Scarborough et al., 2007).
Indeed, health organizations worldwide routinely emphasize which nutrients people should consume less (saturated fat, total fat, sugars, salt) and which they should consume more of (protein, fiber; Lobstein & Davies, 2008). This is apparent in the design of numerous front-of-pack food-labeling formats, which are intended to simplify complex nutrient information for consumers. Such interventions highlight overall energy content and the presence of nutrients that are most associated with the rising rates of obesity and chronic diseases (Kanter et al., 2018). However, evidence about the effectiveness of such interventions is mixed (Sanjari et al., 2017).
The effectiveness of front-of-pack labeling rests on the assumption that people rely on energy and nutrient information to judge a food’s healthiness (Orquin, 2014). However, evidence suggests that healthiness judgments reflect preexisting knowledge that people associate with foods’ perceived naturalness (Siipi, 2012) and taste (Turnwald et al., 2017). These are further influenced by cultural traditions (Pieniak et al., 2009), previous eating experiences (Papies, 2013), media and advertisements (Whalen et al., 2018), background nutrition knowledge (Soederberg Miller & Cassady, 2015), choice context (Downs et al., 2015), product category (Plasek et al., 2020), packaging (Reutner et al., 2015), and health-halo effects of labels such as “organic” (Perkovic & Orquin, 2018; Schuldt & Schwarz, 2010).
These factors contribute to the diverse and multidimensional knowledge representations that decision-makers draw on when making food-related judgments and choices. Indeed, specific knowledge representations that are retrieved from memory (Scheibehenne et al., 2007) or explicitly provided to the decision-maker (Schulte-Mecklenbeck et al., 2013) can be used to make choices between food items using simple heuristics. Whereas knowledge representations may explain why people think some foods are healthier than others, they may be biased, causing systematic and predictable errors in healthiness perception. This could explain why people’s judgments of healthiness deviate from an estimate of healthiness based on the nutrient and energy values of the food (Orquin, 2014).
Researchers studying food judgment and choice typically rely on knowledge representations that are restricted to a predefined and limited set of factors and attributes (Steptoe et al., 1995). This also means that current approaches are not well suited for making generalizable predictions about judgments in the presence of interventions, such as different food-labeling strategies (Kanter et al., 2018). How can we identify and quantify knowledge representations that underpin people’s judgment of food healthiness? We propose a novel approach to overcome these challenges that relies on recent advances in computational linguistics. Unlike previous approaches, in which food representations were either manually specified by the researchers or based on self-reports, our approach establishes food representations using natural-language data. More specifically, we use word-distribution statistics in large text corpora to uncover quantitative representations for words and phrases that describe food items. The use of this type of data means that uncovered representations reflect information conveyed in language, which individuals may use to form beliefs, and may even guide everyday health judgment. We found support for this prediction by studying how knowledge representations retrieved from natural language can account for judgments of food healthiness across six studies. Our further analysis revealed that our models perform well because they capture associations related to naturalness or rawness of foods.
The knowledge representations used in our analysis are high-dimensional vectors for words (also known as word embeddings; Landauer & Dumais, 1997; Lenci, 2018; Mikolov et al., 2013). A useful property of word vectors is that the proximities between vectors measure the associations between individual words. These associations have been shown to correlate with human semantic, factual, probability, and social judgments (Bhatia, 2017; Caliskan et al., 2017; Pereira et al., 2016). Recently, researchers have shown that these word vectors can be used to quantify people’s knowledge about various natural entities by using them as inputs into regressions that predict more complex (and potentially nonassociative) judgments in other domains (Bhatia, 2019; Richie et al., 2019; Zou & Bhatia, 2021).
Statement of Relevance
Is granola healthy? What about steak? What type of knowledge do we use when judging the healthiness of different foods? To answer this question, we studied how different food names tend to co-occur with other words in large-scale language data. We used this information to predict people’s judgments of food healthiness and to uncover words and concepts that are more associated with healthy and unhealthy foods. Our results show that people’s judgments of food healthiness are largely explained by the strength of the association between individual food items and concepts pertaining to naturalness and rawness. In a series of studies, we demonstrated that these associations play a significant role in explaining judgments of healthiness even if people are shown front-of-pack nutrient and calorie information.
Our approach was as follows. First, we obtained high-dimensional vector representations for food items from popular word-embedding models trained on large-scale textual data sets. We hypothesized that these word vectors might serve as a good approximation of the knowledge representations that underpin judgments of food healthiness. These word vectors define 3 million English words (and phrases) in a 300-dimensional space where the location of words mimics how they are represented in the human mind and the distance between words captures their semantic similarity. To predict people’s ratings of diverse food items (in one dimension) from the food items’ word vectors (in 300 dimensions), we trained a penalized regression to find coefficients (i.e., a mapping) that measure how much each of the 300 dimensions contributes to health judgment. We then applied this mapping to food items outside of the training data to predict people’s judgments for these out-of-sample food items. Note that such a mapping identifies regions of the vector space implicitly associated with food healthiness and thus can be used to understand the conceptual and associative underpinnings of health judgment. We could also build this kind of mapping separately for different groups of people in order to predict judgments of both lay and expert judges as well as to predict differences in judgments between individuals exposed to different front-of-pack labeling strategies. Across six studies, we demonstrated the generalizability, accuracy, and power of our approach.
Studies 1a, 1b, and 1c
Our primary objective was to establish the feasibility of our computational approach in predicting people’s judgments of food healthiness. Therefore, we elicited judgments of healthiness for a wide range of food items (presented as food names) from the general population (Study 1a) and from a sample of registered dietitians (Study 1b). In Study 1c, we tested the performance of our models on healthiness judgments of foods’ names and images.
Method
Participants
Our approach did not rely on standard null-hypothesis testing but rather on maximizing out-of-sample predictions. Using previous work for guidance (Bhatia, 2019), we chose to obtain judgments for a diverse set of 172 foods and aimed to recruit at least 100 participants (with each participant judging each of the 172 food items). The only exception was in Study 1b, in which we prioritized how many responses we could obtain from nutritional experts in a 3-month window. Note that in all studies, the primary unit of analysis was the average healthiness rating, across all participants, for a given food item.
In all studies, only participants over 18 years of age were eligible to take part. Our only exclusion criterion was based on the correlation between each person’s food ratings and the grand mean of aggregate ratings for those foods within the sample. Prior to data analysis, we removed participants with a correlation lower than .4 with the grand mean of all ratings in a given study (on the basis of inspection of data from Study 1a). Although this exclusion criterion was intended to remove participants with very noisy ratings that would generate outlier responses, an analysis of the full sample shows that none of our results were affected by this exclusion criteria (see Section 1 in the Supplemental Material available online).
For Study 1a, 149 participants were recruited from Prolific Academic in return for a fixed payment of £1.30. Using the aforementioned criterion, we removed data from 15 respondents, leaving 134 participants as our final sample (age: 18–74 years, M = 29.57 years, SD = 8.86; 43% female; 84% had no dietary restrictions). For Study 1b, we contacted registered dietitians (whom we had been formally introduced to) by emailing them a request to take part in our study and forward the invitation to their colleagues. We also advertised the study on personal social media accounts. Participants were able to request a report of the main findings as an incentive. Nineteen registered dietitians took part in the study (none were excluded; age: 23–56 years, M = 35.84 years, SD = 10.36; 89% female; 68% had no dietary restrictions). One hundred participants recruited on Prolific Academic took part in Study 1c in return for a fixed payment of £1.90. We excluded one person using the same criterion as in Study 1a. This left 99 participants in our final sample (age: 18–69 years, M = 27.25 years, SD = 10.20; 44% female; 82% had no dietary restrictions). A detailed breakdown of participants’ characteristics is provided in the Supplemental Material (Section 2). This research was approved by the University of Warwick’s Biomedical and Scientific Research Ethics Sub-Committee (Approval No. REGO-2018-2268).
Design and procedure
In all studies, participants were asked to simply judge the healthiness of 172 foods on a scale ranging from −100 (extremely unhealthy) to +100 (extremely healthy). In Studies 1a and 1b, each food was described using its name only. In Study 1c, a generic image of the food item was presented directly below the food name. Responses were made using a slider; its starting position was always at zero by default (neither healthy nor unhealthy). This scale was chosen because it is fine grained (200 intervals) and balanced (symmetric around 0), offering nearly continuous data for predictive modeling (Bhatia, 2019). Participants had the option of selecting “don’t know” if they were unfamiliar with a food item, and those ratings were removed from the analysis. The order of the items was randomized for every participant, and only one item was visible at a time. The same generic task instruction—“Using the slider, please use your first impression to rate the following food item according to the scale below”—was displayed above all stimuli in every study condition. After rating all foods, participants were asked about their age, gender, and dietary restrictions. The options for the latter were “pescatarian (no meat, but eat fish and/or shellfish),” “vegetarian,” “vegan,” “other (please specify if you wish),” and “none of the above.” Our nutritional experts in Study 1b were also asked two additional demographic questions at the end of the survey (namely, “no. of years as a registered dietitian” and “area of specialism”).
Materials
We obtained a list of foods from the U.S. Department of Agriculture FoodData Central database (https://fdc.nal.usda.gov/index.html), which provides the most recent official nutrient information pertaining to over 3,102 unique food items. Only foods present in the vocabulary of the pretrained word2vec model were considered, leaving 571 food items (see the Computational Approach section for details). Two hundred food items, across all food categories (e.g., vegetables, meats, dishes), were manually chosen by coauthor W. Zou to ensure diversity in the stimuli set. Next, coauthors N. Gandhi and L. Walasek removed uncommon and ambiguous food items, such as squash (because of its additional meaning related to sports), resulting in the final list of 172 food items (for the full list, see the OSF repository associated with this project: https://osf.io/jys6u/). Note that the same list of 172 food items was used in all studies.
In Study 1c, 69 of the food images were directly sourced from an image database for experimental research (Blechert et al., 2019), and the remaining 103 images were obtained from online resources and standardized to match (white background, 600 × 450 pixels, jpg format).
Computational approach
We used three statistical models to predict subjective food-healthiness judgments. Our analysis relied on participants’ judgments at the aggregate level. We evaluated the accuracy of each of our three statistical models in predicting subjective food-healthiness judgments using leave-one-out cross-validation, which means that we trained our models on all but one aggregate judgment (training data) and used the trained model to predict the rating of the left-out food item (test data). We repeated this procedure 172 times so that each food item was in the test data once. Cross-validation ensured that our modeling avoided overfitting and that the performance of each model was evaluated on the basis of model generalizability.
In the first model, the nutrient model, we used nutrient-content information to predict healthiness judgments. This model was an ordinary least squares regression with main effects for food-calorie content, amounts of nutrients (total fat, saturated fat, sugar, salt, and protein) per 100 g, and the relative coding scheme based on the UK traffic-light labeling for total fat, saturated fat, sugar, and salt (green, amber, and red). Under the traffic-light labeling system, green signifies a healthier food choice to consumers, implying “go ahead”; amber indicates that the item contains moderate amounts of the negative nutrients; and red signals caution for overconsumption (Trudel et al., 2015). The model was fitted on the training data, and the best-fitting parameters of the model were applied to the nutrient information of the (out-of-sample) food in order to predict participant ratings. The nutrients and calorie information included in the nutrient model reflect the current European Union regulations concerning mandatory information for food-package labeling (Article 30, Regulation No. 1169/2011; European Commission, 2011). In the Supplemental Material (Section 3), we summarize tests of the robustness of our results using three extended versions of the nutrient model. First, we expanded the nutrient model to incorporate the potential role of 23 nutrients (e.g., fiber, calcium, and vitamin C). Second, we also tested a version of the model that used nutrient amounts per portion size, defined as the amount per 100 calories. We also combined these two extensions into our final, third model.
In our vector-representation model, we used vector representations from the word2vec model (Mikolov et al., 2013). This model was pretrained on a data set of Google News articles and has 300-dimensional vector representations for 3 million common words and phrases in the English language (see Mikolov et al., 2013, for details). In designing our studies, we considered only foods with names featured in the pretrained word2vec model. We also analyzed the predictions of other established pretrained word-vector models, which we discuss in the Supplemental Material (Section 4). In our main analysis, we used normalized word vectors, in which the magnitude of the vectors was scaled to be equal to 1. We regressed participants’ healthiness ratings on these vectors, which allowed the model to learn linear mapping from the semantic vector space to health judgments. This learned mapping was then applied to the vectors of other out-of-sample foods in order to predict participant ratings of those foods and measure the models’ predictive accuracy.
Because of the high number of predictor variables in this model (300), we applied a regularized regression technique known as ridge regression. Ridge regression allows high numbers of predictors to be considered and takes into account whether predictors are highly correlated. In previous and similar work, ridge regression was the best-fitting regression technique for mapping pretrained 300-dimensional vector representations to judgments and was consequently chosen for our analysis (Bhatia, 2019; Richie et al., 2019). We also tested other regression techniques, including lasso, support vector, and k-nearest neighbors, and we found that ridge regression was indeed the best-fitting regression. We discuss this robustness test in the Supplemental Material (Section 5).
Finally, our third combined model concatenated the 11-dimensional nutrient model with the 300-dimensional vector-representation model. Using ridge regression, we explored the extent to which both models can collectively explain people’s subjective food-healthiness judgments.
Results
We began by examining the distribution of aggregate healthiness ratings (see Fig. 1). Here, we observed that healthiness judgments varied greatly among food stimuli, both across and within food categories. Unsurprisingly, the foods with the healthiest ratings were all fruits and vegetables, and the top five mean ratings ranged between 77 and 82 for tomatoes, cucumber, apple, carrots, and broccoli, respectively. The five foods that received the least healthy ratings, ranging between −65 and −50, were cola, donuts, Skittles, cheeseburgers, and Kit Kats.
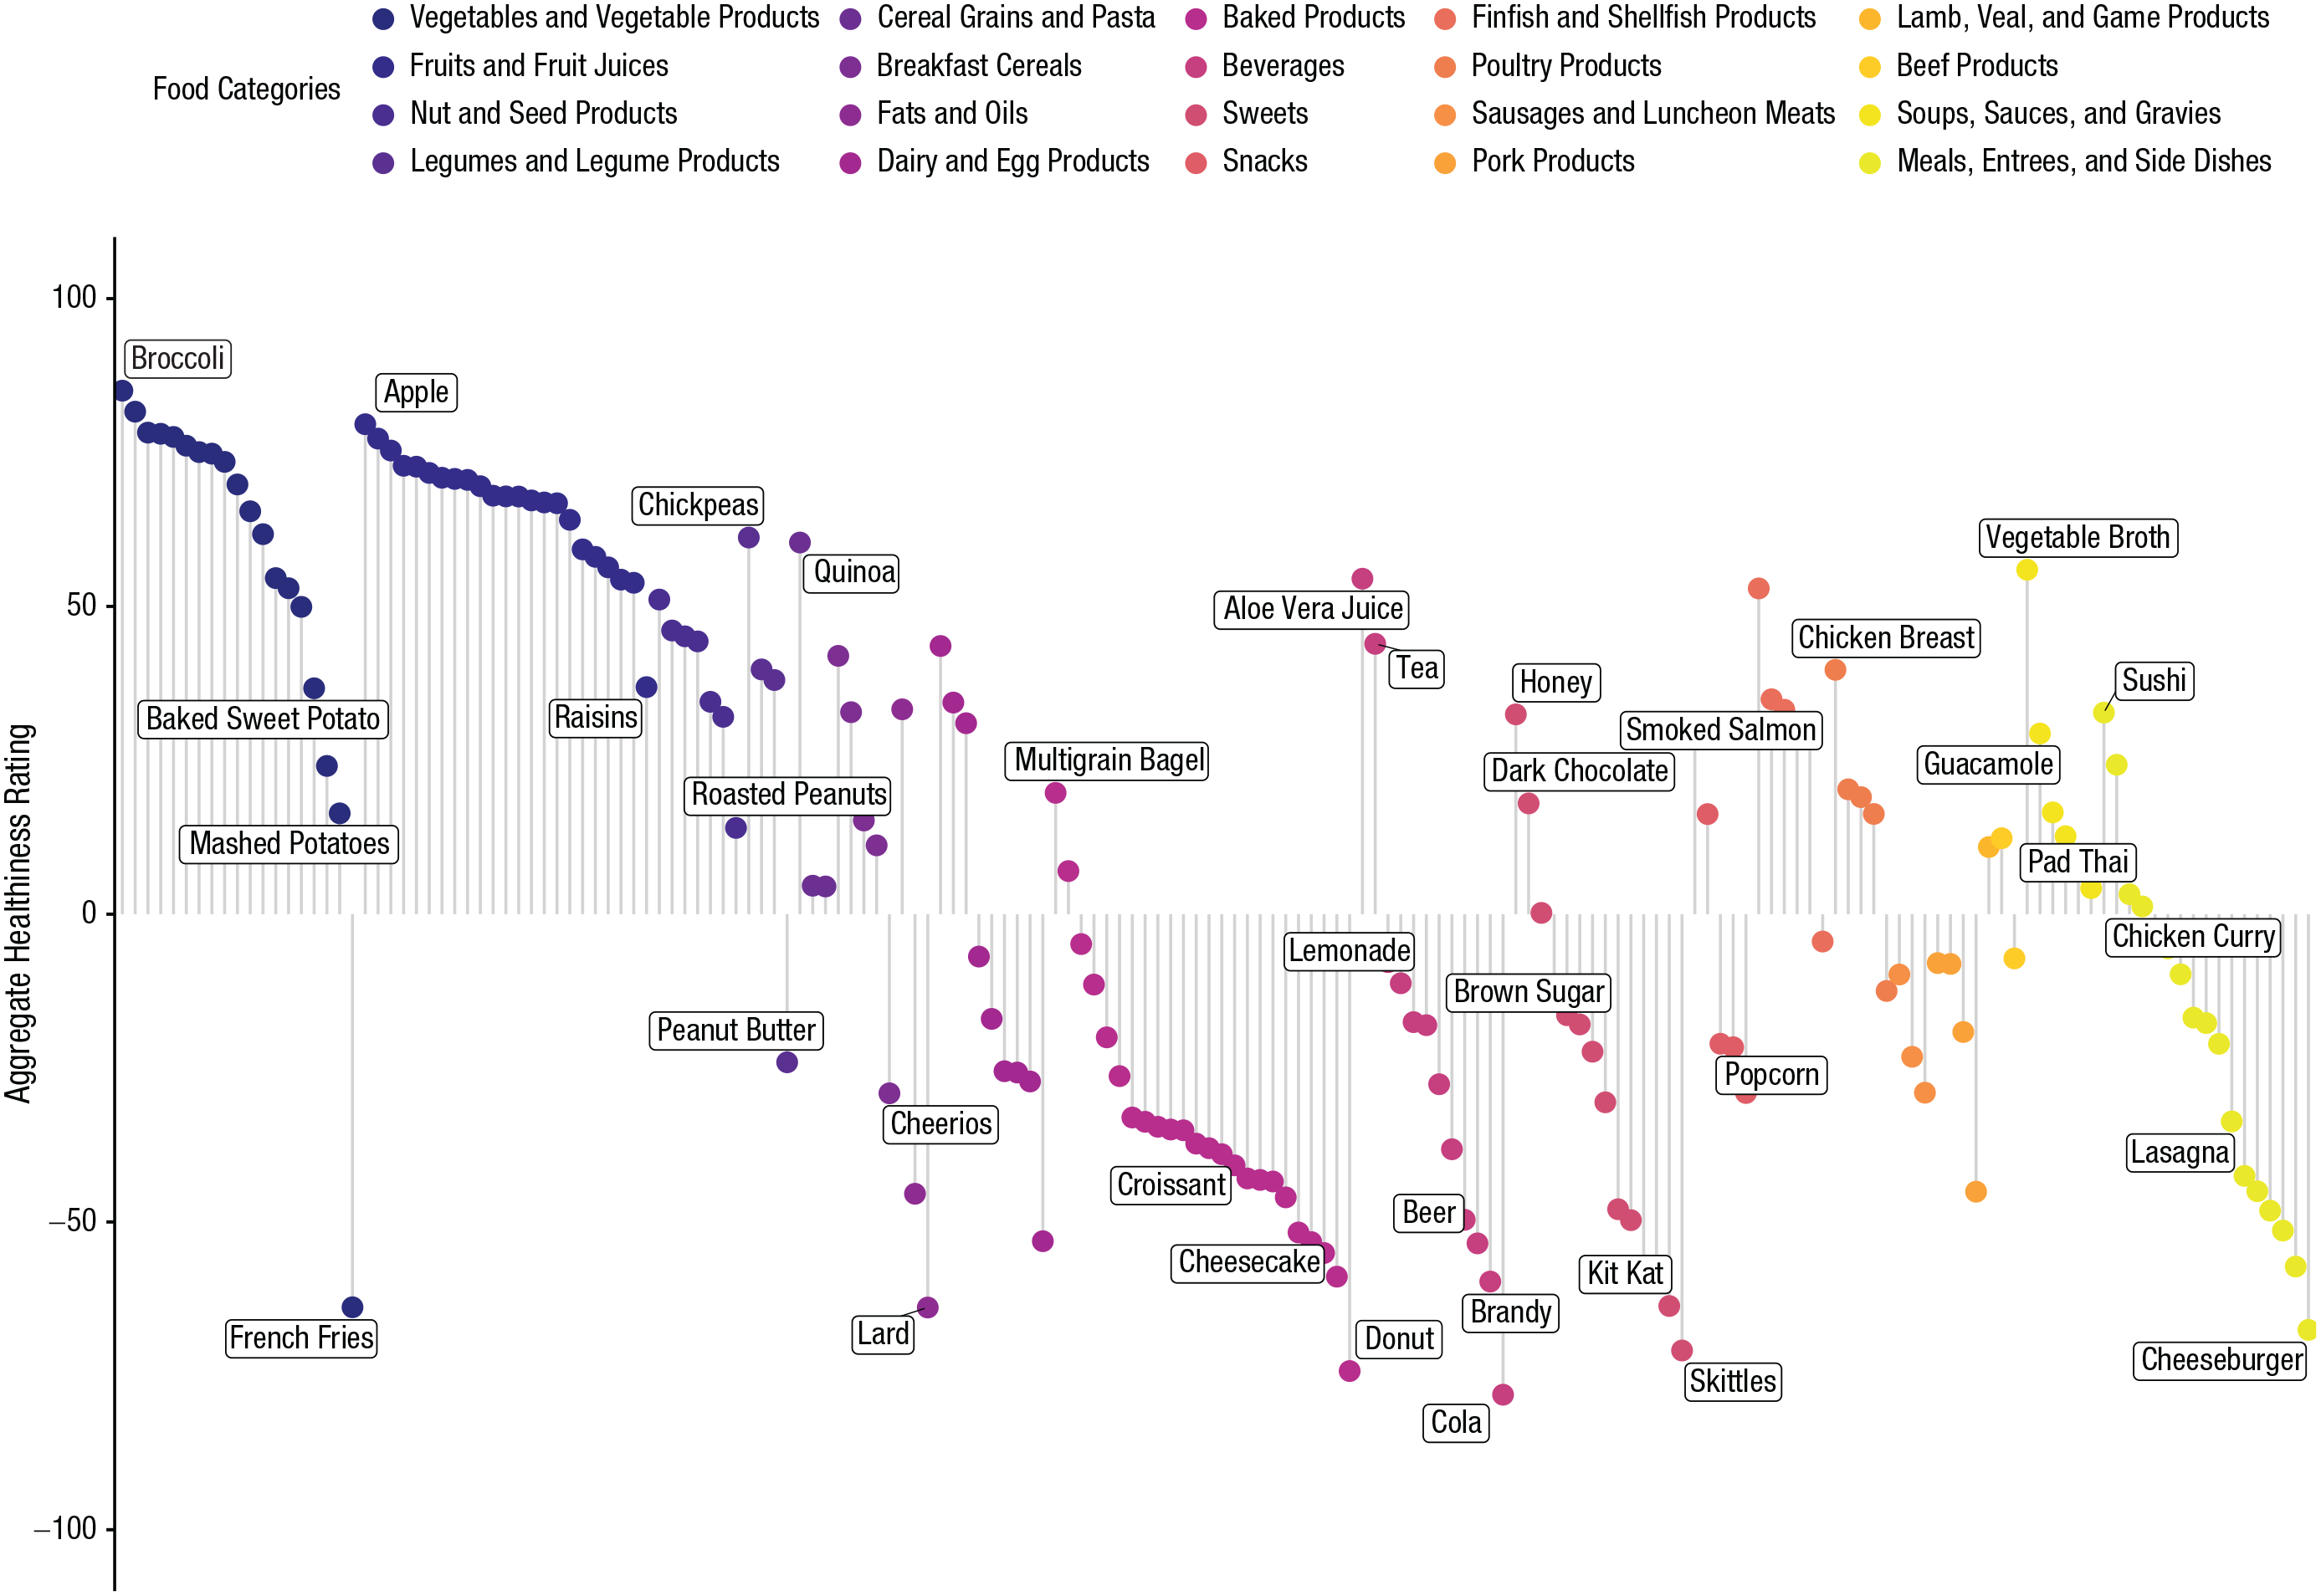
Distribution of aggregated food-healthiness ratings from Study 1a. For clarity, foods are separated by food category. Text labels indicate exemplar food items in each of the categories.
Figure 2 summarizes the accuracy rates of our three models in Studies 1a, 1b, and 1c. The dots within each scatterplot represent the relation between the out-of-sample predicted and actual (aggregated) healthiness ratings for the individual foods. Because we were using predictive modeling, the coefficient of determination (r2) reflects the performance of the model when making out-of-sample predictions.
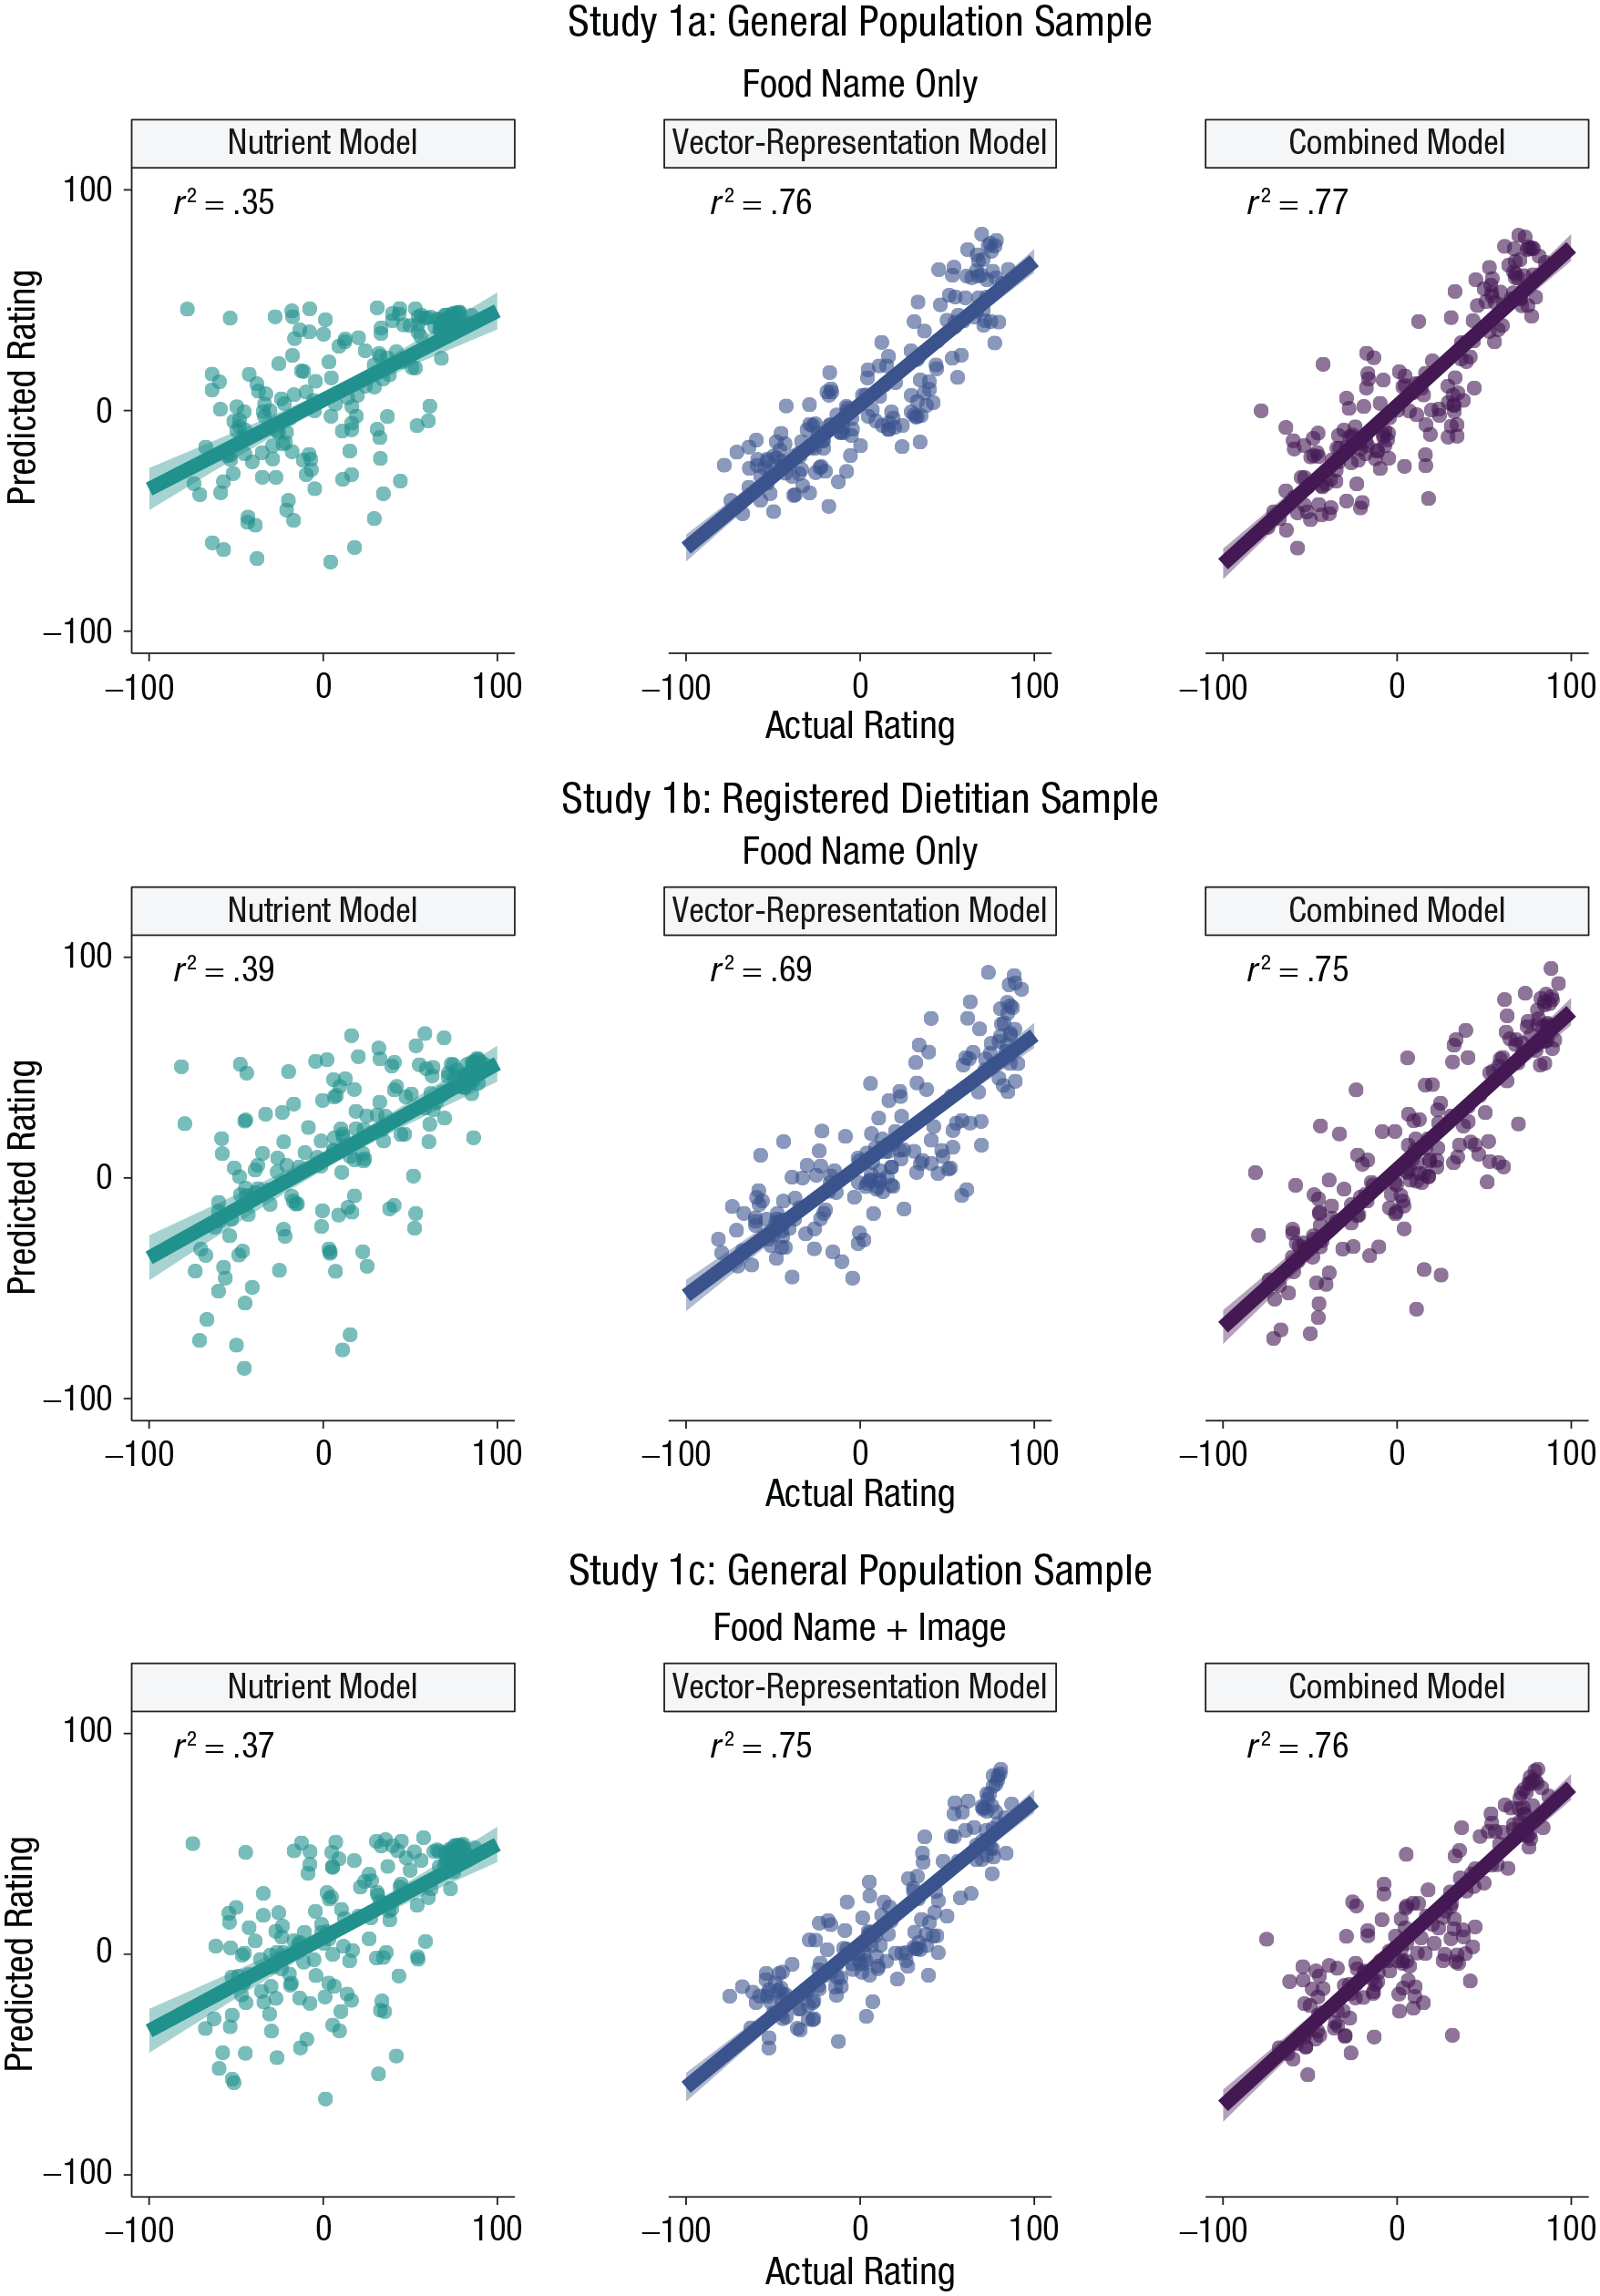
Scatterplots showing the relation between model-predicted ratings and actual (participant-provided) ratings in Studies 1a, 1b, and 1c. For each study, results are shown separately for models containing only nutrient content, only word-vector representations, or a combination of nutrient content and word-vector representations. Lines indicate best-fitting regressions, and error bands show standard errors. Studies 1a and 1c used general population samples, and Study 1b used an expert sample. Participants in Studies 1a and 1b saw food names only, whereas participants in Study 1c saw images along with food names.
As shown in Figure 2, the out-of-sample predictive accuracy of the vector-representation model was very high across all three studies: r2s ranged from .69 (95% confidence interval [CI] = [.63, .75]) to .76 (95% CI = [.71, .81]). By comparison, the predictive accuracy of the model based on the foods’ nutritional information was always lower: r2s ranged from .35 (95% CI = [.24, .46]) to .39 (95% CI = [.28, .50]). The combined model performed best, however, achieving marginally higher predictive accuracy than the vector-representation model in every study: r2s ranged from .75 (95% CI = [.70, .80]) to .77 (95% CI = [.72, .82]). Overall, these findings highlight that the performance of the vector-representation model is stable, even when we used ratings from participants with high nutritional expertise and when we used food images as stimuli.
We performed several robustness checks to assure the reliability of our findings. First, we ran separate paired-samples t tests to compare the squared errors from different models for each study (see Section 6 in the Supplemental Material). Across all studies, the mean squared errors from the vector-representation model and the combined model were significantly lower than those from the nutrient model (all ps < .01). We also repeated our analysis at the individual level, without aggregating healthiness ratings for each food. Results are presented in the Supplemental Material (Section 7) and show that our findings remain largely unchanged. Section 4 of the Supplemental Material summarizes associations (r2) for the vector-representation model on the basis of alternative word vectors obtained from fastText (Mikolov et al., 2018) and GloVe (Pennington et al., 2014). Finally, Section 5 in the Supplemental Material shows the results of different regression techniques, including lasso, support vector, and k-nearest neighbors. Once again, using alternative word vectors or regression techniques did not alter our results.
Returning to the results from the vector-representation model based on the ridge regression and word2vec vectors, we found that our approach was also able to capture qualitative trends in our data by correctly predicting the categories of foods judged as being high or low in healthiness. For example, both observed and predicted ratings were highest for categories such as fruits and fruit juices, vegetables and vegetable products, and nut and seed products. Likewise, both observed and predicted ratings were lowest for categories such as baked products, sweets, and fats and oils. In fact, when pooling the data by food category, we found the vector-representation model predicted average healthiness ratings for categories of foods (out-of-sample r2 = .83, 95% CI = [.79, .86]). The nutrient model, in contrast, achieved an r2 of only .31 (95% CI = [.20, .41]). It seems that healthiness judgments are sensitive to the category of the food item, a property easily captured by the vector-representation model but less so by the nutrient model (Orquin, 2014). Further details of this analysis are provided in Section 8 of the Supplemental Material.
The reason why the vector-representation model performs well is that it may capture the latent associations underpinning judgments of healthiness. To explore these associations, we applied a principal components analysis to the vector representations of the 172 food items. Projections for the first two components are shown in Figure 3. By inspecting Component 1, we can clearly see that negative values correspond mostly to heavily processed and junk foods (e.g., pepperoni pizza, bacon, onion rings), whereas positive values correspond mainly to organic and unprocessed vegetables and fruits (e.g., apple, mango, lettuce, beets). Component 2, on the other hand, appears to reflect the sweetness and sugariness of the food. The most positive-scoring foods on this component are sugary drinks (e.g., cola, lemonade) and sugary snacks (e.g., Kit Kat, dark chocolate). Among the negative scores for Component 2, we can see meats (e.g., roasted turkey) but also less sugary vegetables (e.g., brussels sprouts, asparagus).
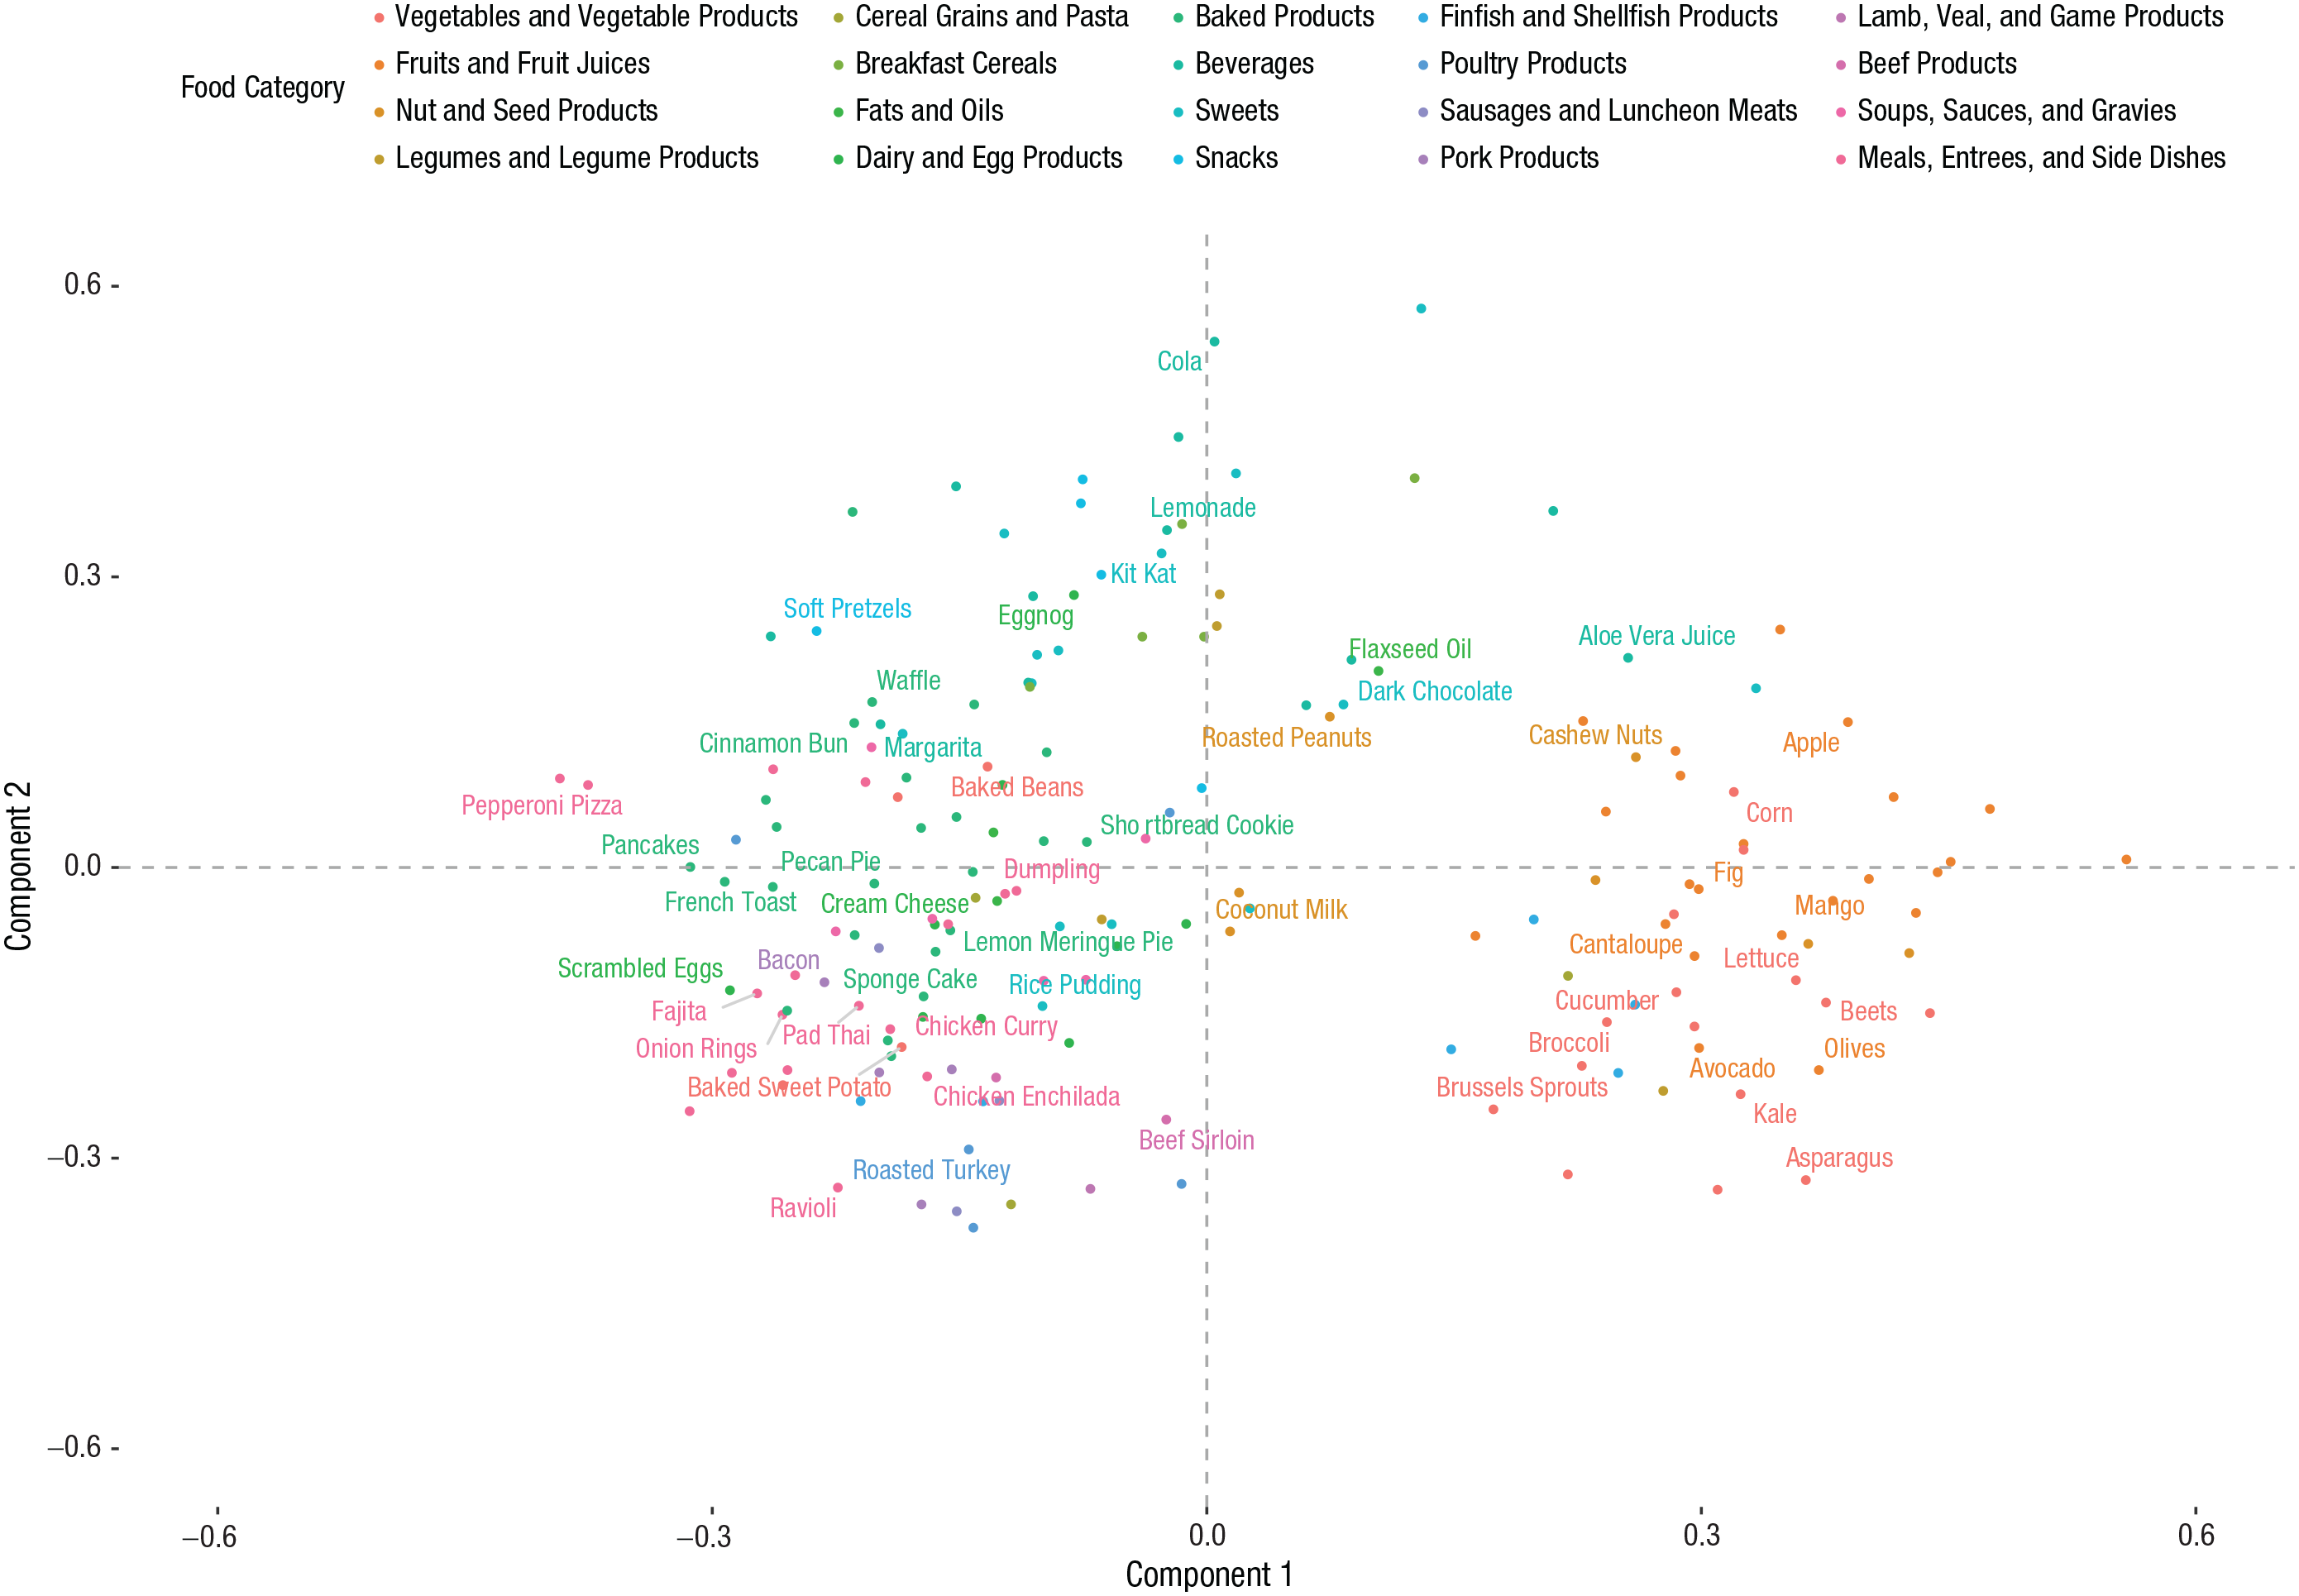
A 2D projection (based on principal components analysis) of vector representations for the 172 food names in Study 1a. For clarity, foods are separated by food category, but only a random subset of 50 names are labeled on the plot.
Another benefit of the vector-representation approach is that it can identify regions of the semantic space related to food healthiness. This can be done by passing the vector representations of common words (that are not necessarily food items) through a model trained on participants’ food-healthiness judgments. Words given high predictions would be those most associated with healthiness and would capture the conceptual underpinnings of health judgment. Figure 4 shows a word cloud of the 50 English-language words predicted to have the highest healthiness ratings, as derived with this approach. As can be seen, agriculture and nature-related words, such as crop, harvest, and leaf, make up the majority of this word cloud. Interestingly, the word healthy is also present in the word cloud even though our model was never explicitly trained on this concept. It seems that implicit in people’s judgments are associations between individual food items and concepts such as healthiness, as well as other concepts (e.g., naturalness, degree of processing, organic, appearance) identified by previous researchers as being psychological cues for food healthiness (Siipi, 2012). Our novel computational approach provides quantitative methods for uncovering these associations.
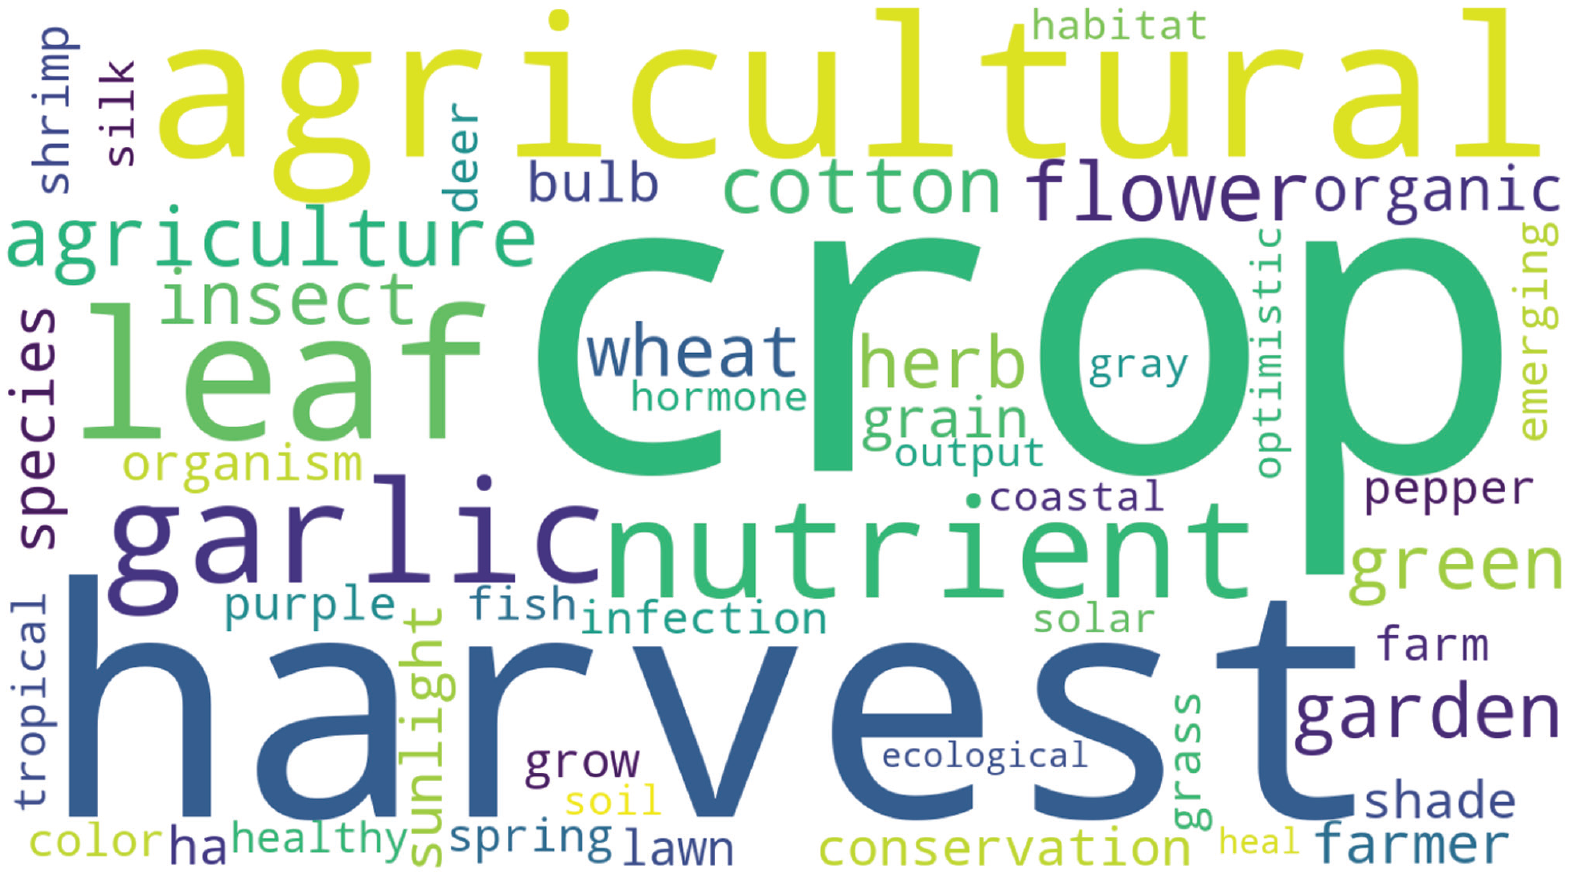
Word cloud of the 50 English-language words with the highest healthiness ratings, as predicted by the vector-representation model trained on healthiness judgments of laypeople in Study 1a. The size of the words indicates the strength of their association with healthiness (larger = greater association).
Studies 2a, 2b, and 2c
Studies 1a through 1c were based on judgments of food names and images. Yet when people evaluate foods, they are typically provided with additional nutritional information. Moreover, many food-labeling policies rest on the assumption that consumers make more informed decisions if nutritional information is prominently displayed on food packaging. The relatively poor performance of the nutrient model documented in Studies 1a, 1b, and 1c may reflect people’s lack of awareness (or memory) of the nutritional values of the individual food items. Accordingly, if the nutritional information was made more salient with the use of real food-labeling strategies, we might expect that the contribution of nutrients in the nutrient model would increase relative to the attributes captured by the vector-representation model. Finally, the results of Studies 1a through 1c uncovered underlying associations between foods and naturalness, or rawness, which underpin food-healthiness judgments. However, it is important to determine whether these associations continue to play a role even if foods’ nutritional values are made more salient.
We addressed these issues in Studies 2a, 2b, and 2c by eliciting food-healthiness judgments from participants who saw either food names alone (as in Study 1a) or food names along with the label highlighting various aspects of its nutrition. Again, we recruited adult participants for this series of studies. In Study 2a, we provided our treatment group with information about the calories per 100 g. The provision of calorie information to aid healthy eating is supported by qualitative research showing that consumers use energy content information (calories) as a proxy for the overall nutritional value of a product (van Kleef et al., 2008). In Studies 2b and 2c, we examined the effects of information about key nutrients (total fat, saturated fat, sugars, and salt). Under European Union rules, front-of-pack labeling of this kind is acceptable with either no color coding or with traffic-light-colored cues (i.e., red highlights represent high amounts of total fat, saturated fat, sugar, and salt; amber highlights represent medium amounts; and green highlights represent low amounts; European Commission, 2011). Although both strategies highlight individual nutrients, it is the color-coded format that also helps consumers judge whether a particular amount is high, medium, or low. In Study 2b, we gave the treatment group nutrient labels without color coding, and in Study 2c, we gave this group nutrient labels with color coding.
Method
Participants
There were 202 participants in Study 2a, and after the removal of five using our exclusion criteria, 197 participants were included in the final analysis (age: 18–71 years, M = 30.30 years, SD = 10.74; 52% female; 80% had no dietary restrictions). From the initial 199 participants who took part in Study 2b, four were excluded, leaving 195 participants (age: 18–65 years, M = 29.16 years, SD = 10.28; 48% female; 82% had no dietary restrictions). Finally, 202 participants took part in Study 2c (age: 18–78 years, M = 34.69 years, SD = 11.51; 70% female; 81% had no dietary restrictions). In all studies, only participants over 18 years of age were eligible to take part. Our exclusion criterion was the same as in Studies 1a, 1b, and 1c, although no participants were excluded from Study 2c because all responses fell above the threshold for removal. Only residents of the United Kingdom were allowed to participate in Study 2c to ensure knowledge and familiarity with the traffic-light food-labeling system. A detailed breakdown of participants’ characteristics is provided in the Supplemental Material (Section 2).
Design and procedure
We tested the role of food labeling on judgment, in which we gradually introduced more informative (and realistic) formats of food labeling across studies. All three studies used a between-subjects design. In half of the sample (control group) participants rated the healthiness of 172 foods in the same manner as in Study 1a and Study 1b. In the treatment groups, participants rated each of the food names presented alongside a nutrition label. In Study 2a, this was the energy (kilocalorie) amounts per 100 grams of the food. In Study 2b, we additionally included the absolute amount of total fat, saturated fat, sugars, and salts. Finally, in Study 2c, we used the same objective information as above but also added the traffic-light system used in the United Kingdom, which indicates the relative amount of different nutrients, categorizing them into green, amber, and red groups. Examples of the labeling used in each study are presented in Figure 5. Note that the same list of 172 food items was used in all studies.
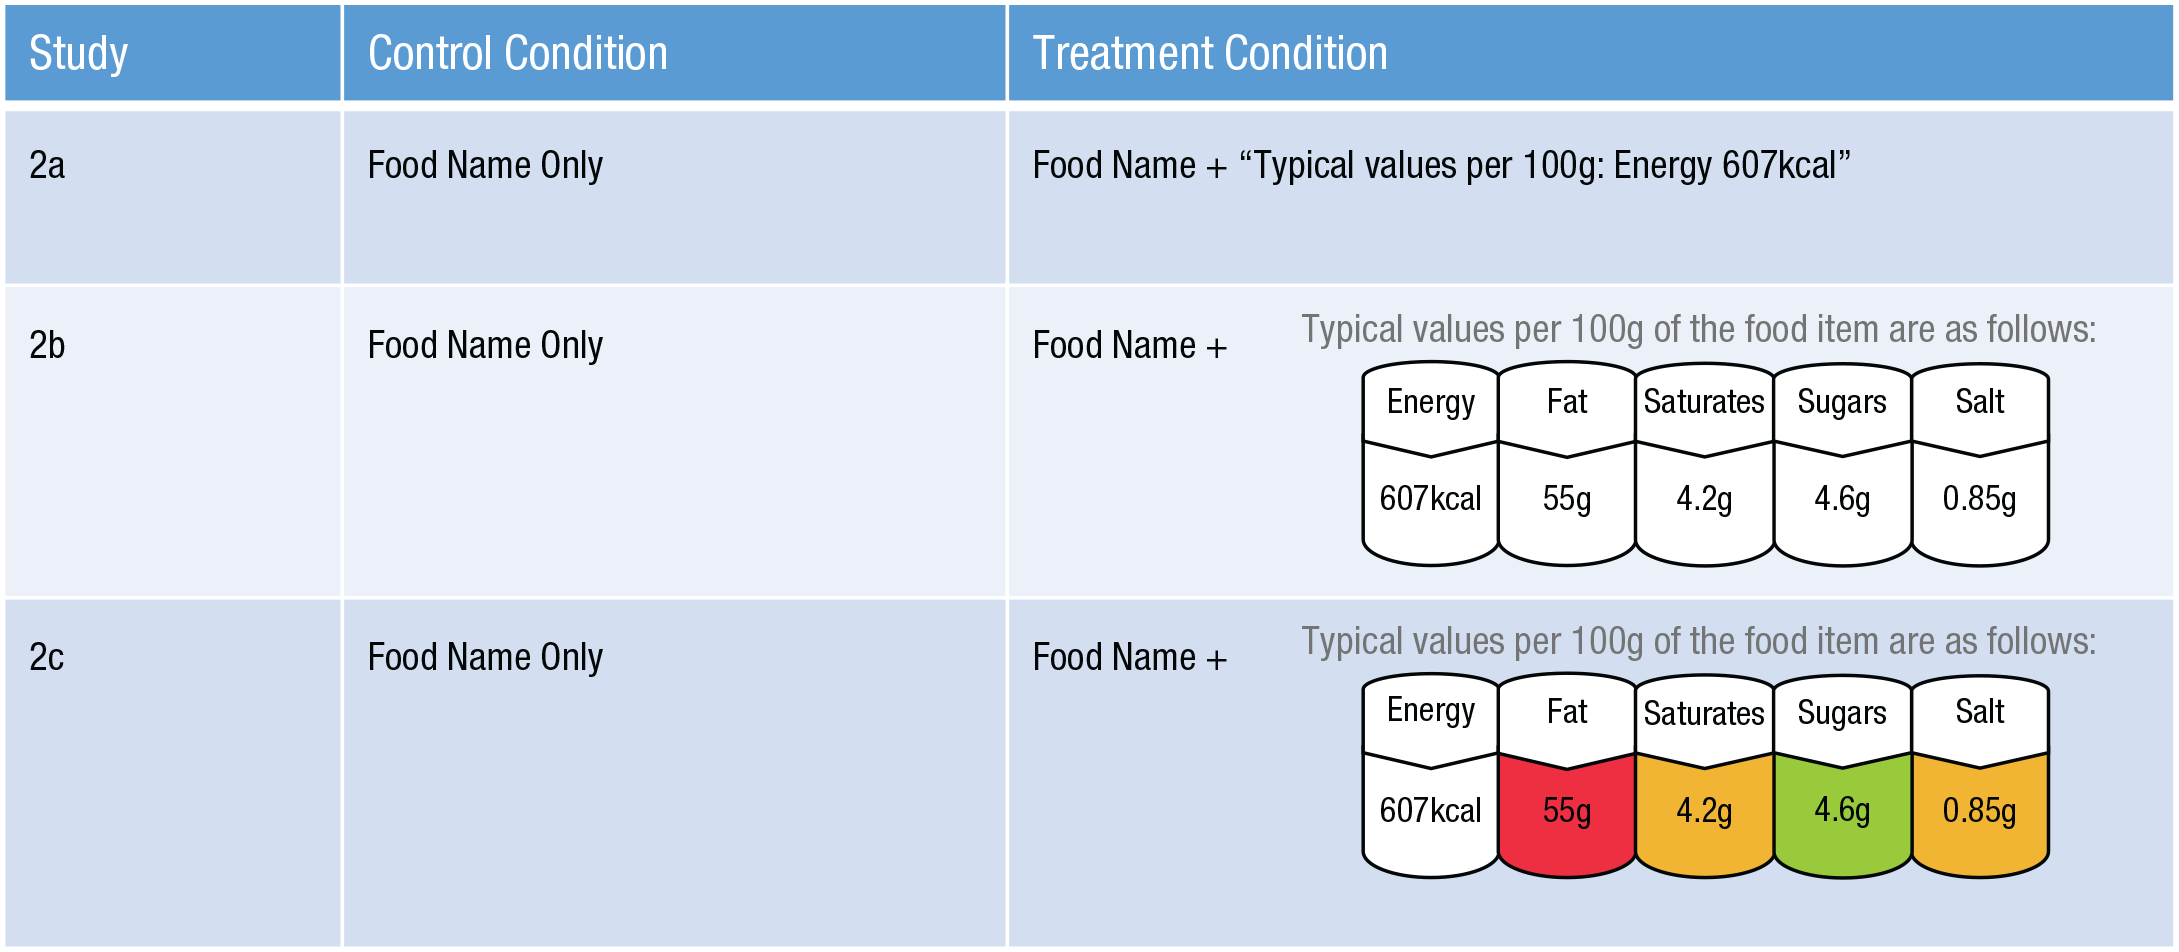
Examples of how food stimuli were presented to participants in Studies 2a, 2b, and 2c. All participants were from a general population sample and rated the healthiness of foods. In all control conditions, participants were given the foods’ name only. In the treatment groups, participants were shown each food’s name alongside a nutrition label. In Study 2a, a text label gave the energy amounts per 100 grams of the food. In Study 2b, we additionally included the absolute amount of total fat, saturated fat, sugars, and salts. In Study 2c, we used the same objective information as in Study 2b but added the traffic-light system used in the United Kingdom, which indicates the relative amount of different nutrients by categorizing them into green, amber, and red groups.
Results
As shown in Figure 6, the vector-representation model performed very well across all studies and conditions. In fact, the out-of-sample predictive accuracy of the vector-representation model was very high: r2s ranged from .65 (95% CI = [.59, .72]) to .77 (95% CI = [.72, .81]) in each study and condition. By comparison, the predictive accuracy of the models based on the foods’ nutritional information was lower but also much more variable: r2s ranged from .33 (95% CI = [.22, .44]) to .77 (95% CI = [.72, .83]). Figure 6 reveals a systematic pattern—the predictive accuracy of the nutrient model increased with the amount of the nutritional information presented alongside foods’ names. This is unsurprising, because it shows that people integrated label information into their judgments (González-Vallejo et al., 2016; Scarborough et al., 2007). Despite this, the vector-representation model still performed better than the nutrient model when participants saw only calorie information (Study 2a) and calorie information with front-of-pack nutrient labeling (Study 2b). Only in the most informative condition, traffic-light labeling (Study 2c), did the nutrient model outperform the vector-representation model. Figure 6 also shows that the accuracy of the vector-representation model was identical across the two conditions in Studies 2a and 2b, although it did drop slightly in Study 2c. This is not significant, as can be seen from the slight overlap in 95% CIs in the control condition (r2 = .76, 95% CI = [.71, .81]) and traffic-light-labeling condition (r2 = .65, 95% CI = [.59, .72]; see Fig. S3 in the Supplemental Material). In any case, these results show that associations with food names play an important role in people’s judgments of healthiness, often more than nutritional composition.
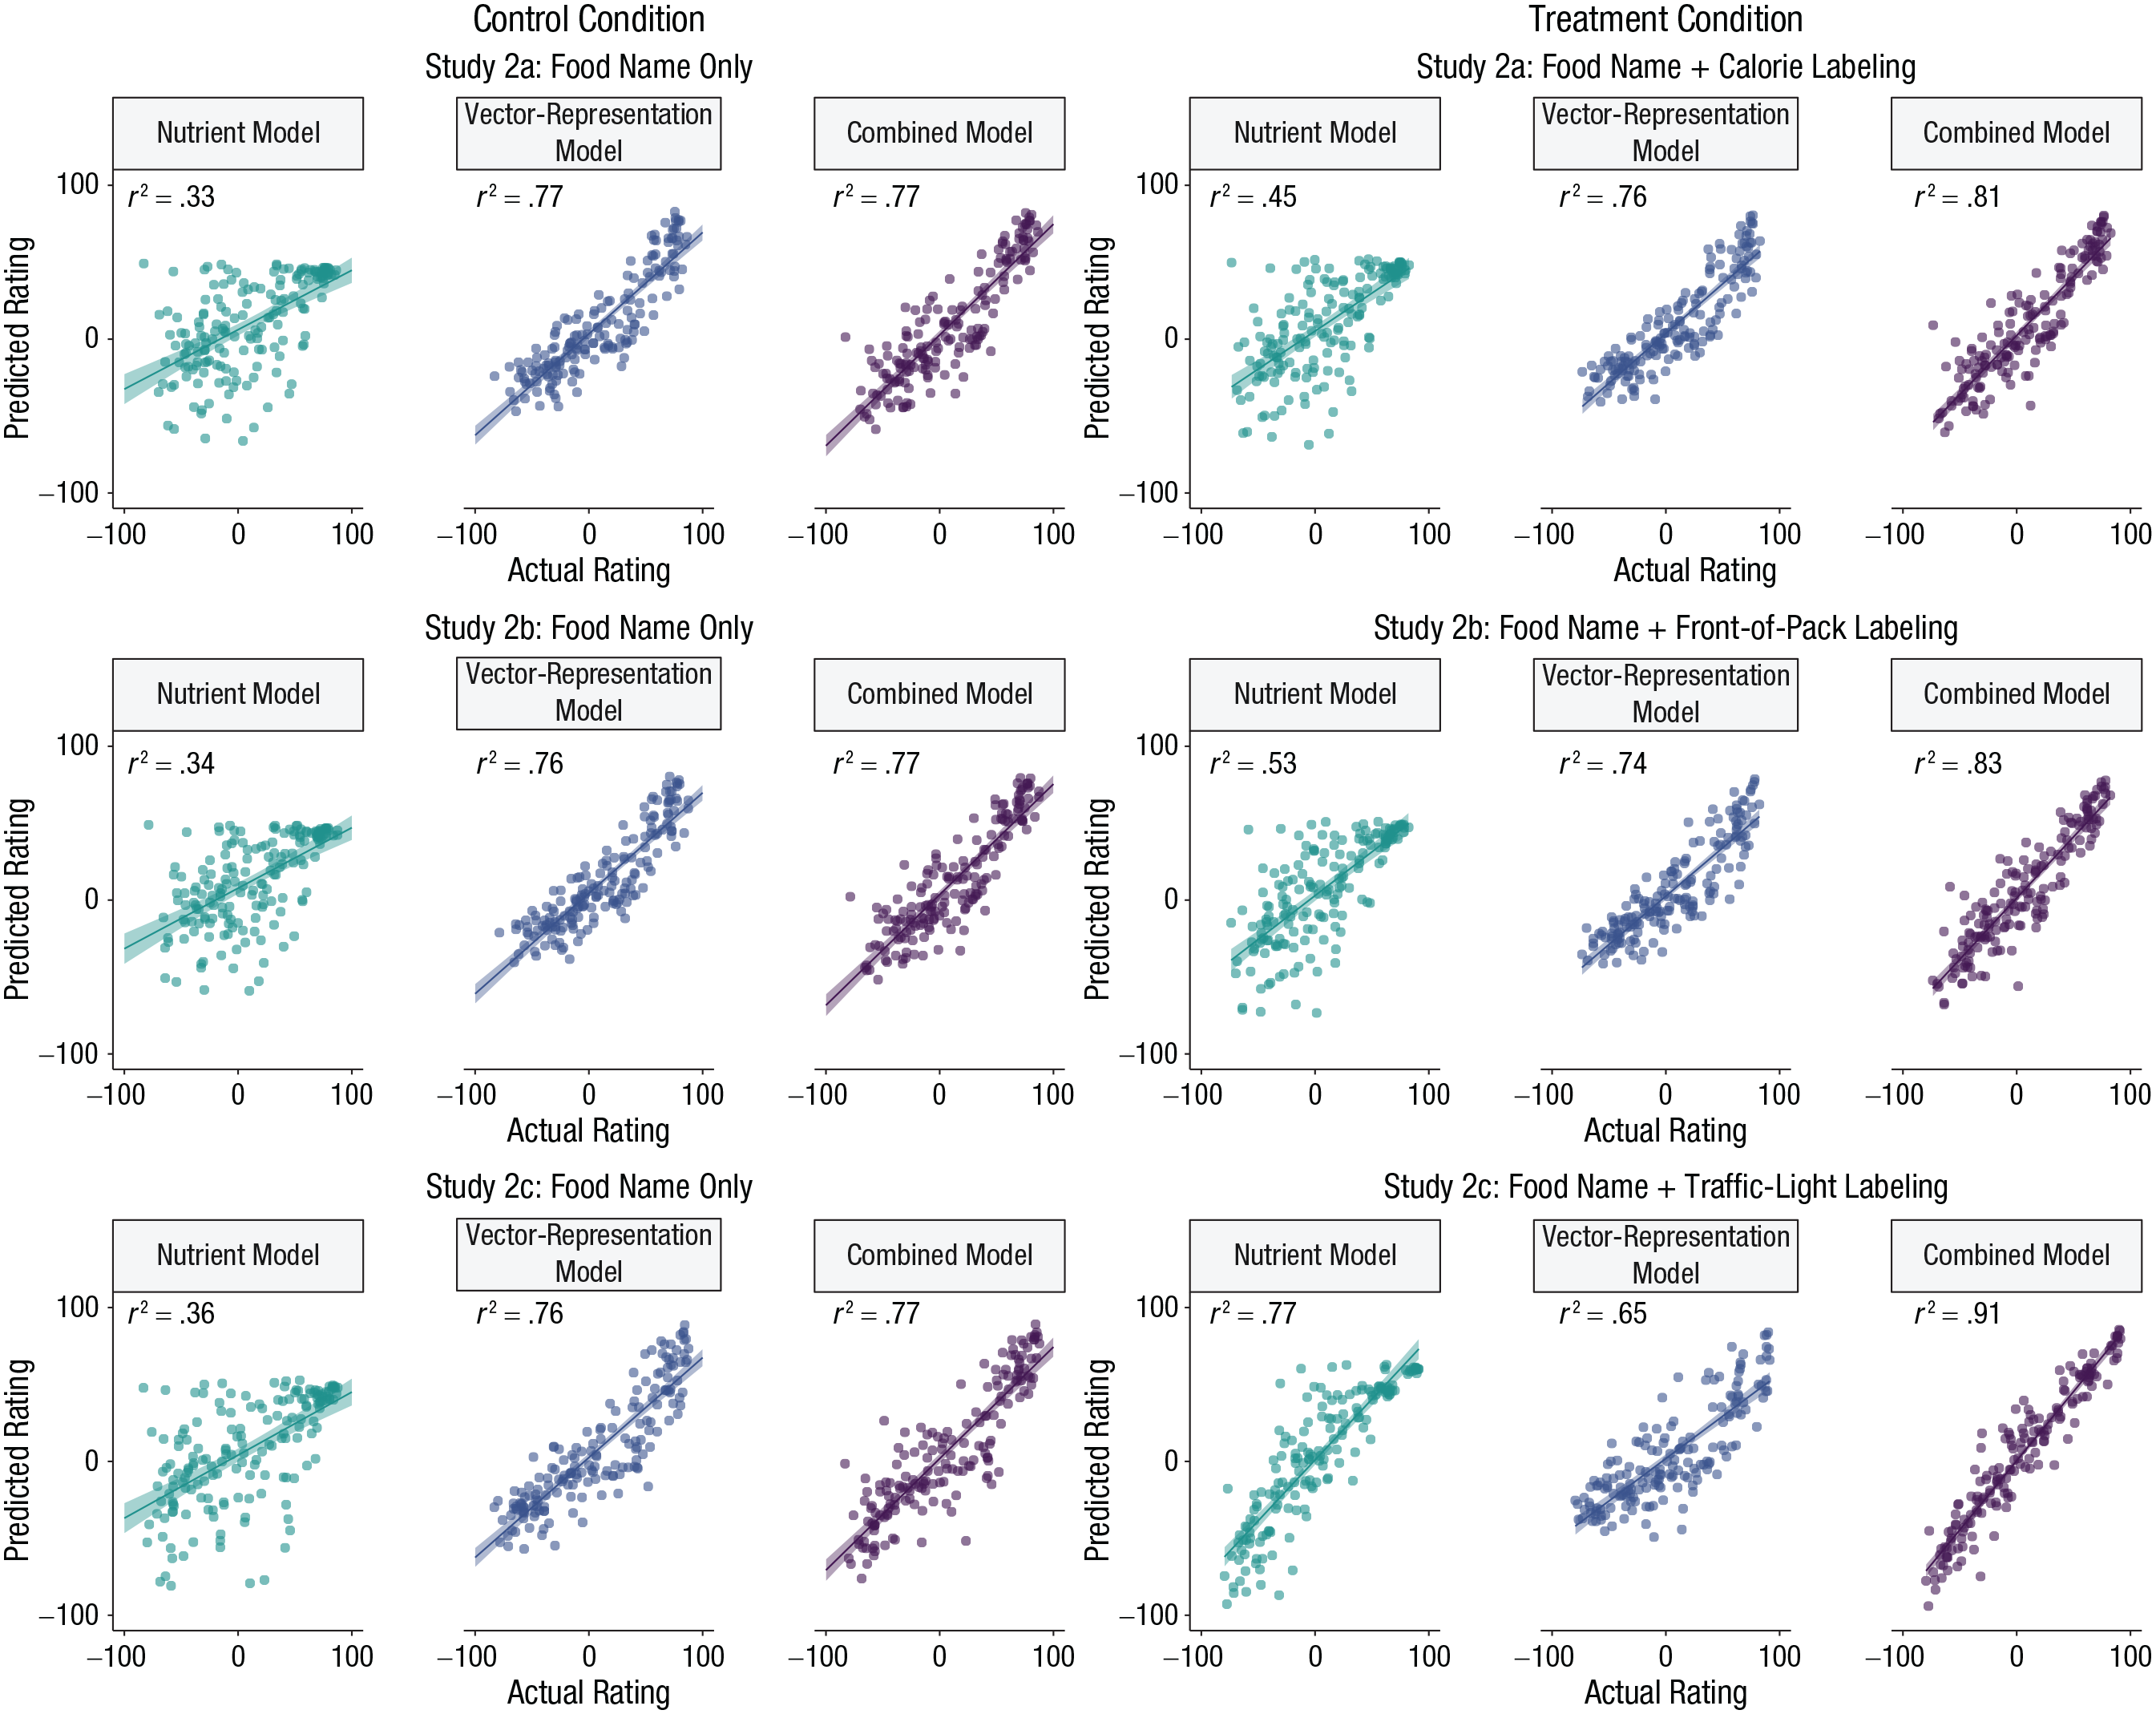
Scatterplots showing the relation between model-predicted ratings and actual (participant-provided) ratings in the treatment and control conditions of Studies 2a, 2b, and 2c. For each condition in each study, results are shown separately for models containing only nutrient content, only word-vector representations, or a combination of nutrient content and word-vector representations. Lines indicate best-fitting regressions, and error bands show standard errors. Observed ratings were all from a general population sample.
Figure 6 also summarizes the predictive accuracy of the combined model, which uses both the word vectors and nutritional information to predict people’s judgments. In five out of six cases, the combined model performed better than the individual models. The highest accuracy was achieved in the traffic-light-labeling condition (r2 = .91 (95% CI = [.89, .93]), which was markedly higher than the accuracy of the nutrient model (r2 = .77, 95% CI = [.72, .83]) and the vector-representation model (r2 = .65, 95% CI = [.59, .72]). These results support the interpretation that word vectors explain people’s judgments over and above the nutritional information of individual foods.
Do representations of foods change when nutrient information of foods is highlighted? In other words, do we observe a systematic shift in knowledge representations because of the various types of food labeling? To answer this question, we computed differences between aggregate ratings for each food in the condition with and without a food label. We then refitted our vector-representation model and combined model with these difference scores as a dependent variable. Figure 7 shows that the vector-representation model explains a nontrivial amount of variance in the difference between the conditions in all three studies. At the same time, the predictive accuracy of the combined model increased markedly from Study 2a through Study 2c, which confirms that people who saw additional nutritional information did in fact rely on it when making their judgments. This supports the interpretation that even if food labeling changes how people make judgments, the reliance on knowledge representations captured by the vector-representation model remains stable and influential. It also shows that word-vector representations can predict the idiosyncratic effects of nutrient labels on health judgments for different food items.
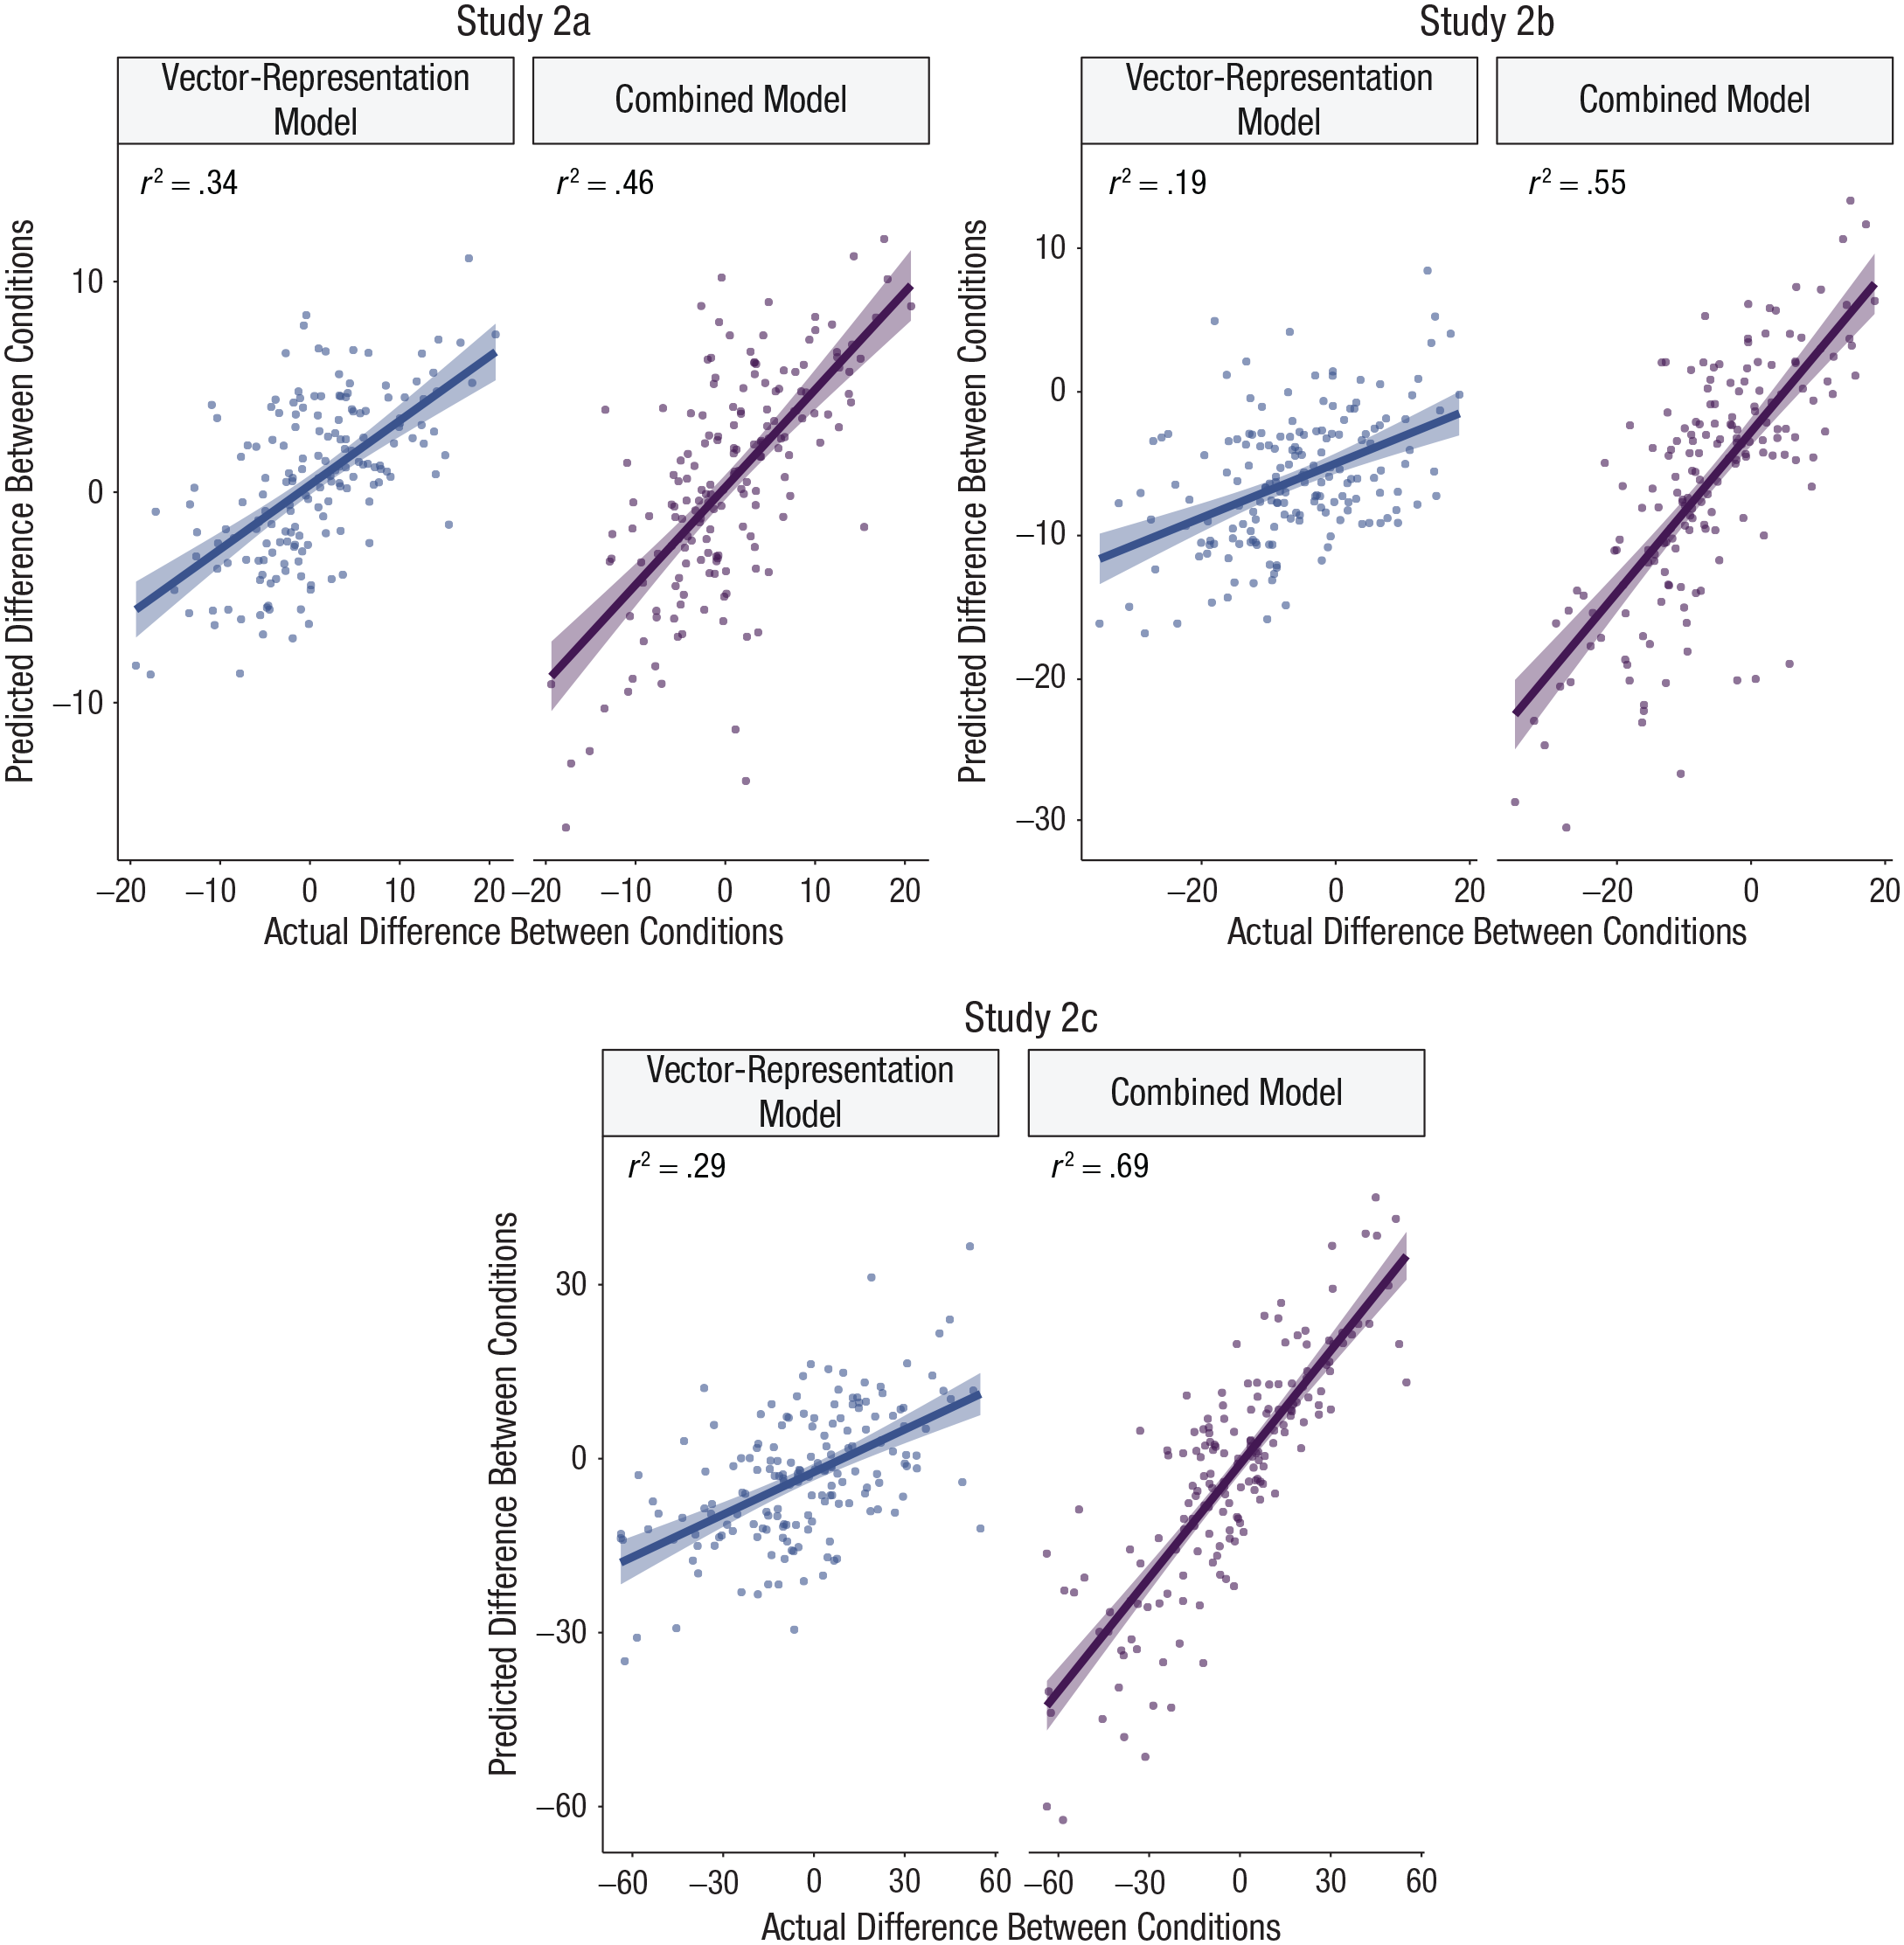
Leave-one-out cross-validation results showing the relation between the model-predicted difference between conditions and the actual difference between conditions (treatment – control), separately for the vector-representation model and combined model in Studies 2a, 2b, and 2c. Lines indicate best-fitting regressions, and error bands show standard errors.
General Discussion
Everyday dietary decisions are influenced by people’s subjective perceptions of food healthiness. Psychological explanations of this process are incomplete without an accurate model of the rich knowledge and diverse associations underpinning people’s judgments of what foods are healthy and what foods are not. In this article, we offer a novel method for uncovering these knowledge representations by combining insights from machine learning and computational linguistics. Using vector representations of food items derived from natural language, we found that it is possible to predict healthiness judgments highly accurately. We found that people’s judgments can be partly explained by the strength of association between individual food items and concepts pertaining to naturalness (e.g., harvest, leaf) and rawness (e.g., crop, organic). These associations play a role even when judgments are made in the presence of food images or are made by trained dietitians. In addition, high accuracy rates obtained by our combined model indicate that such knowledge representations in language do not merely reflect beliefs about nutritional composition; rather, they capture something unique about people’s associations with different foods. Thus, our models can help evaluate how different front-of-pack labeling strategies influence food-healthiness judgments.
Unlike previous approaches, our method does not require us to identify specific factors or attributes that we, as researchers, believe to be related to healthiness judgments. Instead, by using our best-fitting model to predict the healthiness of common words in the English language, we found that nature-related words such as crop, harvest, and agricultural were implicit in people’s judgments. This is consistent with the work of other researchers, who have found that naturalness and healthiness are often intertwined (Sanchez-Siles et al., 2019; Siipi, 2012; but see Fernbach et al., 2019). These results also align with the finding that rawness or the degree to which a food has been processed is a strong cue of healthiness in food choice (Scheibehenne et al., 2007; Schulte-Mecklenbeck et al., 2013). Notably, our results indicate that models based on these associations are accurate even if participants are explicitly told about the nutritional composition of foods.
Our approach offers a unique insight into the psychological basis of subjective food-healthiness judgments by exploring foods in their most abstract forms (name or image). That said, a model trained on written text is unlikely to accurately capture sensorimotor information about foods (e.g., smell, texture), which would also be relevant in real-world situations (De Deyne et al., 2016; Lynott et al., 2020; Papies et al., 2020). Hence, although our results are promising, they are only a first step in establishing a rich set of attributes and associations that people use in judging foods’ healthiness.
Neither explicit food labeling nor expert judgments reduced the contributions of the knowledge associations established by the vector-representation model. With respect to expert judgments, these findings are in line with research showing that nutritional expertise does not always translate into a higher reliance on nutritional information when people make healthiness judgments (Orquin, 2014). Our results also speak to the value of nutritional labeling more generally. Given that associations played a role in all studies, existing front-of-pack labeling can neither substitute nor correct for the associations that people rely on when judging foods’ healthiness.
There are many potentially useful applications of our computational approach. Future studies could test the predictive ability of this vector-representation model with and against other formats of nutrient labeling, such as France’s Nutri-Score label (which is color coded and has no numerical information). Thus, the use of this approach could be vital in determining a single internationally agreed-on nutrient-labeling system (Goiana-da-Silva et al., 2019), especially because it provides directly comparable results between labeling formats. However, further work is necessary to establish whether the accuracy of our models changes when participants are presented with other information on prepackaged foods, such as branding, health claims, and back-of-pack nutrition labeling.
An important outstanding question is whether our vector-representation model is generalizable to judgments of other foods than the 172 items tested in all six studies. In Section 10 of the Supplemental Material, we report the results of a new study in which we elicited judgments of 60 new foods from a sample of 97 participants. Instead of training a new model, we used the vector-representation model from Study 1a to derive predictions for our new foods. Our models performed very well—with our approach, we can predict healthiness judgments of new foods from a new group of participants with a high degree of accuracy. To assist future research, we have obtained predictions of our models for hundreds of novel food items and made these available via OSF (https://osf.io/jys6u/). These can be used to evaluate future interventions and to test alternative psychological mechanisms that underpin human judgments and choices of foods. Overall, our studies provide new insights into people’s food-healthiness judgments, and our methods offer an exciting new avenue to researchers and practitioners interested in designing interventions that encourage healthy eating.
Supplemental Material
sj-docx-1-pss-10.1177_09567976211043426 – Supplemental material for Computational Methods for Predicting and Understanding Food Judgment
Supplemental material, sj-docx-1-pss-10.1177_09567976211043426 for Computational Methods for Predicting and Understanding Food Judgment by Natasha Gandhi, Wanling Zou, Caroline Meyer, Sudeep Bhatia and Lukasz Walasek in Psychological Science
Footnotes
Transparency
Action Editor: Patricia J. Bauer
Editor: Patricia J. Bauer
Author Contributions
N. Gandhi and W. Zou share equal authorship. N. Gandhi and L. Walasek designed and ran the experiments. W. Zou and S. Bhatia analyzed the data. N. Gandhi, L. Walasek, and S. Bhatia wrote the manuscript in consultation with C. Meyer. W. Zou performed all the additional analyses reported in the Supplemental Material available online with input from S. Bhatia.
References
Supplementary Material
Please find the following supplemental material available below.
For Open Access articles published under a Creative Commons License, all supplemental material carries the same license as the article it is associated with.
For non-Open Access articles published, all supplemental material carries a non-exclusive license, and permission requests for re-use of supplemental material or any part of supplemental material shall be sent directly to the copyright owner as specified in the copyright notice associated with the article.