
Abstract
Representations held in working memory are crucial in guiding human attention in a goal-directed fashion. Currently, it is debated whether only a single representation or several of these representations can be active and bias behavior at any given moment. In the present study, 25 university students performed a behavioral dense-sampling experiment to produce an estimate of the temporal-activation patterns of two simultaneously held visual templates. We report two key novel results. First, performance related to both representations was not continuous but fluctuated rhythmically at 6 Hz. This corresponds to neural oscillations in the theta band, the functional importance of which in working memory is well established. Second, our findings suggest that two concurrently held representations may be prioritized in alternation, not simultaneously. Our data extend recent research on rhythmic sampling of external information by demonstrating an analogous mechanism in the cyclic activation of internal working memory representations.
Despite our subjective experience of a continuous external world, increasing evidence suggests that mechanisms underlying perception and attention sample environmental information in a relatively discrete fashion (Fiebelkorn & Kastner, 2019; Landau, 2018; VanRullen, 2016). In an early influential study, Busch et al. (2009) demonstrated that visual target-detection performance depends on the phase of electroencephalogram (EEG) alpha-band (8–13 Hz) oscillations prior to target onset, suggesting that human perception is subject to rhythmic fluctuations in neural excitability. Subsequent research has shown that when humans monitor several potentially relevant locations or objects simultaneously, attention seems to switch back and forth between them at a rate between 4 Hz and 10 Hz (Fiebelkorn et al., 2013; Landau & Fries, 2012; Re et al., 2019). For instance, Landau and Fries instructed their participants to simultaneously monitor two spatial locations for the occurrence of a visual target following a cue to one of the locations. By densely varying cue–target intervals across trials, they observed rhythmic fluctuations in target detection between 4 Hz and 10 Hz at each location. Importantly, the temporal-fluctuation profiles for the two locations were in antiphase, suggesting that attention samples them in alternation.
So far, rhythmic attentional sampling has been demonstrated only with regard to external stimuli. Attention, however, is often directed by internal representations—for instance, of task-relevant information held in visual working memory (Eimer, 2014; Olivers et al., 2011). These attentional templates are thought to consist of top-down preactivations of cortical areas that bias neural activity toward processing of input that shares features with the goal-relevant target stimulus (Bundesen et al., 2005; Desimone & Duncan, 1995; Duncan & Humphreys, 1989; Eimer, 2014). Hitherto, it was unknown whether these internal attentional templates bias sensory processing continuously over time or whether they fluctuate rhythmically, as has recently been shown for attention toward external stimuli. Because working memory can be conceived as a mechanism for prolonging a percept internally by means of attention, it is likely that the temporal-processing characteristics in working memory mimic those seen in perception to some extent.
Relatedly, there is a current debate regarding how many attentional templates can guide our behavior at a time (e.g., Frătescu et al., 2019). Although it is well established that multiple items can be held in visual working memory simultaneously (Cowan, 2001), some research suggests that only one of these items can be in an active, behaviorally relevant state at a time (Büsel et al., 2019; Houtkamp & Roelfsema, 2009; Oberauer, 2002; Olivers et al., 2011). For instance, Houtkamp and Roelfsema (2009) had participants search for either a single target or two targets simultaneously during a rapid serial visual presentation task. They found that performance in the two-target condition was not worse than in the single-target condition but was worse than predicted by two parallel template-matching processes, suggesting that only a single template biased attention at a time. In contrast, a number of studies have provided evidence for attentional guidance by several templates simultaneously (Beck et al., 2012; Beck & Hollingworth, 2017; Kerzel & Witzel, 2019; Kristjánsson & Kristjánsson, 2018). In support of this account, Kerzel and Witzel observed comparable attention-capture effects by target-similar distractors presented prior to a visual search display, regardless of whether participants were searching for one or two target colors. This suggests that two internal templates can actively bias attention to different features at the same time.
In the present experiment, we addressed this current discrepancy between empirical findings. Given the evidence for external attentional sampling reviewed above, we hypothesized that internal templates might also alternate rhythmically (Fig. 1a). On each trial, participants memorized two subsequent template stimuli (templates A and B) and were then shown a target matching template A, template B, or neither. The stimulus-onset asynchrony (SOA) between template B and the target was varied randomly between 250 and 1,060 ms. By analyzing hit rate as a function of SOA, we observed rhythmic fluctuations of performance at 6 Hz and, less robustly, at 10 Hz. Importantly, performance fluctuations for targets matching template A or B exhibited significantly different phase angles, suggesting that one attentional template is prioritized over the other at any given moment.
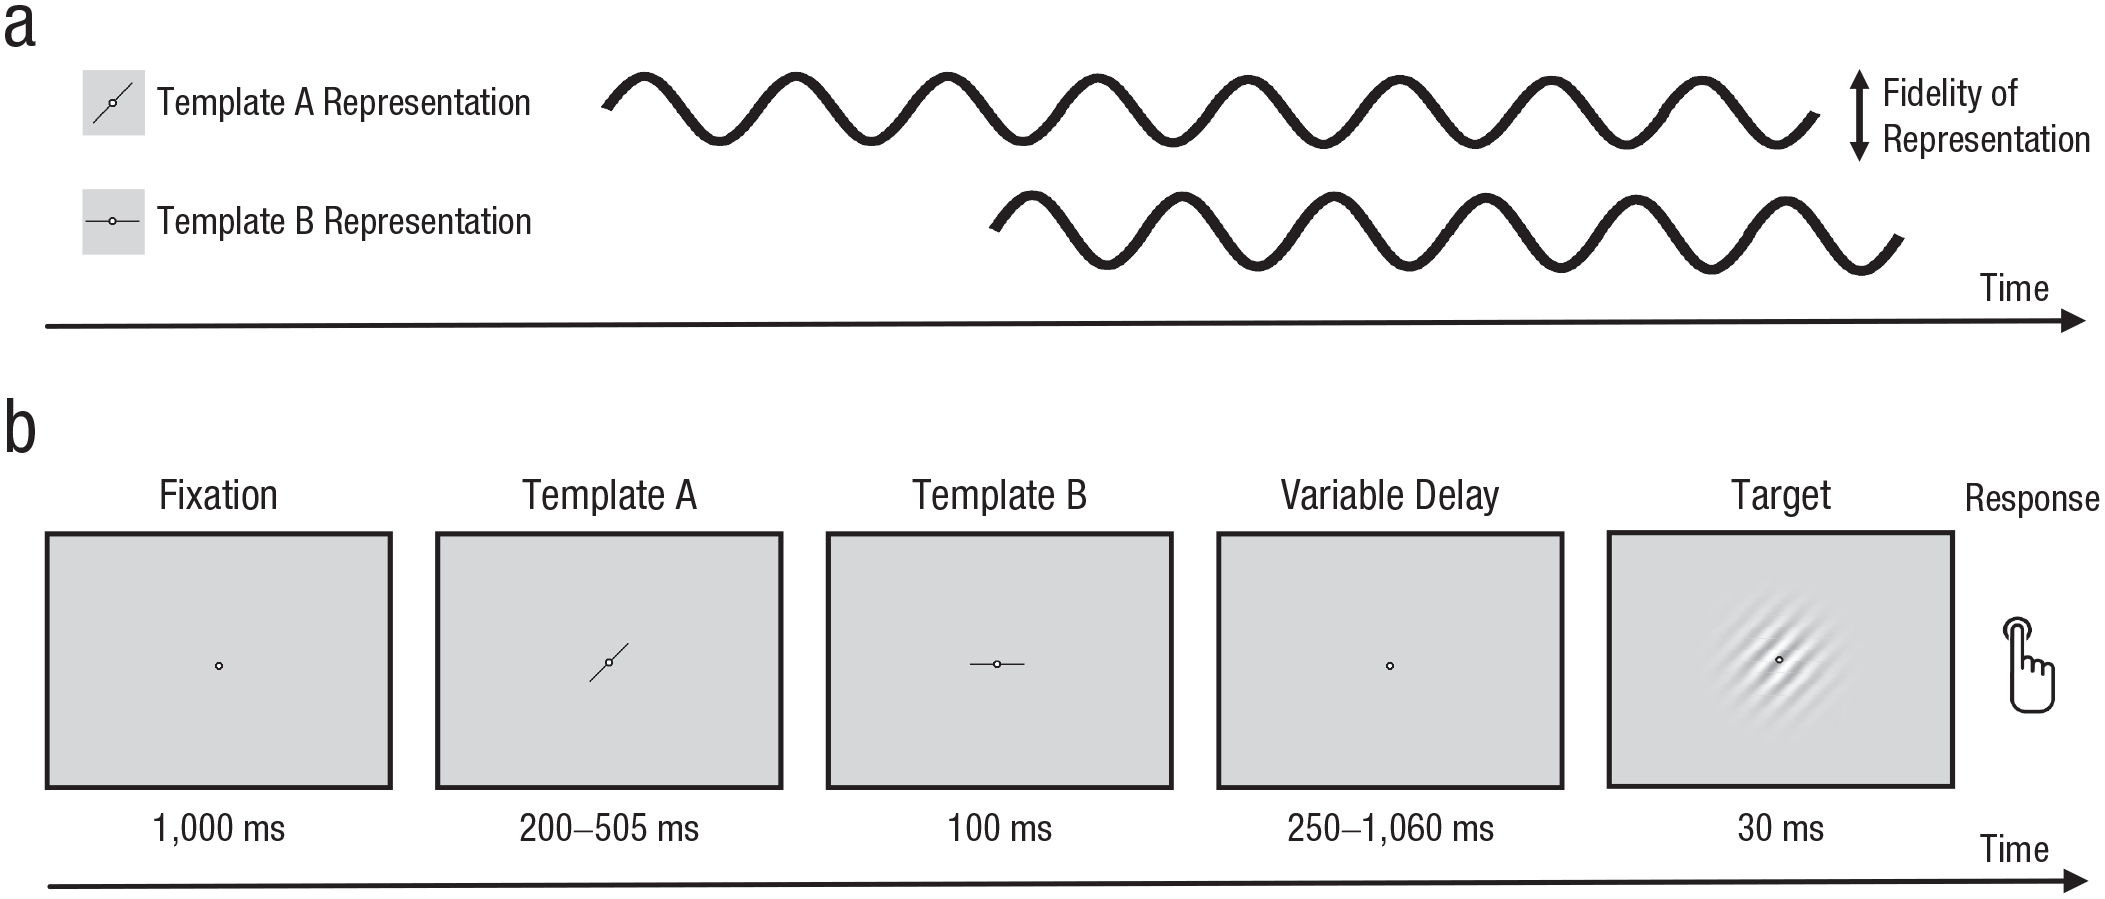
Hypothesis and experimental design. We hypothesized (a) that the fidelity of the internal template representations in visual working memory would fluctuate over time. Specifically, we expected that the representation of template B would start at the opposite phase of that of template A, so that, at any time, one template representation would be prioritized over the other in an alternating fashion. In each trial (an example of which is shown in b), participants were shown two successive visual templates indicating the designated target orientations. Following a variable delay, a target Gabor patch was presented. If the orientation of the Gabor patch matched either the first or second template, participants responded by pressing a button.
Method
Participants
Thirty university students participated in exchange for either course credits or monetary compensation. Prior to data analysis, we determined that only participants with false-alarm rates below 20% would be included. On the basis of this criterion, we excluded five participants. Our sample size was based on those used in previous attentional-sampling studies, which commonly incorporated between 15 and 25 participants (e.g., Fiebelkorn et al., 2013; Han & VanRullen, 2017; Ho et al., 2017; Landau & Fries, 2012; Nakayama & Motoyoshi, 2019; Re et al., 2019), as well as a pilot experiment replicating the results of Fiebelkorn et al. (2013) on spatial-attentional sampling.
Statement of Relevance
Visual working memory is a core cognitive function that allows us to temporarily maintain limited amounts of information. The present study provides novel experimental evidence indicating that information in visual working memory is not represented in a continuous fashion over time. Rather, its quality rhythmically fluctuates around six times per second, switching between moments at which it is more or less readily available to us. Moreover, our findings suggest that two simultaneously memorized visual items are prioritized in alternation, so that one of them dominates the guidance of behavior at any time. These results are likely caused by rhythmic electrical activity in the brain and have implications for our understanding of working memory, attention, and visual search. For instance, they suggest that when we search for the faces of two friends in a crowd, our brain alternately prioritizes one of them over the other rather than searching for both simultaneously.
The remaining 25 participants (nine men; mean age = 25.8 years, range = 21–35) had normal or corrected-to-normal vision and were naive to the purpose of the experiment. All gave written informed consent, and the study was conducted in accordance with the standards of the Declaration of Helsinki. We further followed the Austrian Universities Act of 2002, which states that only medical universities or studies conducting applied medical research are required to obtain additional approval by an ethics committee. Therefore, no additional ethical approval was required for our study.
Experimental setup and task
Stimuli were presented on a 19-in. CRT monitor with a resolution of 1,024 × 768 pixels and a refresh rate of 85 Hz. The experiment was presented via OpenSesame (Version 3.2.8; Mathôt et al., 2012) on a PC running Windows 7. Participants sat in a dimly lit room 64 cm away from the screen; their heads were supported by a chin rest and forehead rest. Visual stimuli were presented against a gray background (luminance: 12.7 cd/m2). A central fixation dot (0.18° diameter) was presented throughout the experiment.
Figure 1b illustrates the experimental paradigm. Each trial started with a 1-s fixation period. Next, two visual template stimuli were presented sequentially. Each template consisted of a central line segment (1.25° in length) with an orientation of 0°, 45°, 90°, or 135° of visual angle. The two templates always had different orientations and were never perpendicular to each other. The first template (template A) was presented for a randomly varying time of between 200 and 505 ms (in steps of 11.7 ms). Immediately following template A, the second template (template B) was presented for 100 ms. Importantly, we used randomly varying SOAs between templates A and B to avoid any regularities in our stimulus presentation, which otherwise might have led to artificial temporal rhythms in our behavioral results (Re et al., 2019). Note that in further accordance with the procedure of Re et al., who observed rhythmic fluctuations of feature-based attention toward two external stimuli, this resulted in overall longer presentation times for template A than for template B. Following the offset of template B as a resetting signal (cf. Re et al., 2019), the target stimulus was presented for 30 ms at one of 70 possible time points from 250 to 1,060 ms (in steps of 11.7 ms). This manipulation allowed us to estimate periodic fluctuations in performance with high temporal resolution. The target consisted of a black and white Gabor patch (spatial frequency: 6.9 cycles per degree; diameter: 21.35°; Gaussian SD: 2.16°) with an orientation of either 0°, 45°, 90°, or 135°.
The participant’s task was to press the down arrow on a keyboard, using their right index finger, if the orientation of the target matched the orientation of either template A or template B. Conversely, the response had to be withheld if the target matched neither template A nor template B. Thus, participants had to maintain a representation of two template orientations in working memory during the delay interval. Importantly, by using templates of a small size and short template-presentation times, as well as by using different stimuli as templates and targets (lines vs. Gabor patches), we minimized the potential impact of afterimages. Following most previous studies on external attentional sampling (e.g., Fiebelkorn et al., 2013; Helfrich et al., 2018; Landau & Fries, 2012), we titrated the hit rate to about 66% to keep the task challenging and ensure performance variability. This was done by adaptively increasing or decreasing the contrast of the target Gabor patch every nine trials. Responses could be given within 800 ms following target offset. After each trial, participants received auditory feedback on whether their response (or lack thereof) was correct or not.
Each participant completed two experimental sessions on separate days. The sessions consisted of 460 trials each, split into 10 blocks with sufficient breaks in between. To estimate a false-alarm rate, we made sure that 24% of all trials did not contain a target. Out of the remaining 700 trials, the target orientation in 50% of them matched template A, and the target orientation in the other 50% matched template B. Given the 70 possible intervals between template B and the target, five trials were presented for each combination of interval and template–target matching condition. Prior to the main experiment, each participant completed a short training block. Participants were instructed to keep false alarms at a minimum and respond only when they were certain that a target had been presented.
Data analysis
All analyses were performed using MATLAB (Version 2018; The MathWorks, Natick, MA) and the CircStat toolbox (Version 1.21; Berens, 2009). For a general analysis, we removed outlier trials in which reaction times were more than 2.5 standard deviations from the mean, separately for each participant and condition. We then computed mean hit rates (percentage of correct responses) and reaction times (for trials with correct responses only), separately for targets matching template A (the TMT A condition) and targets matching template B (the TMT B condition), and compared them using paired-samples t tests.
To estimate the representation fidelity of both templates over time, we investigated the time course of hit rates as a function of template-to-target interval (measured from the onset of the template) separately for the TMT A and TMT B conditions. Thus, for each participant, we first sorted all trials according to the duration of the delay period. Using a moving-window approach with an 11.7-ms step size, we then computed the average hit rate within bins of five consecutive delay-period intervals (i.e., within 58.5 ms) separately for the TMT A and TMT B conditions. In other words, we first computed the hit rate for trials with delay-period windows of between 250 and 308.5 ms. Then we shifted the bin by 11.7 ms and computed hit rates for trials with delay-period windows of between 261.7 and 320.2 ms. This procedure was performed throughout the duration of the delay period. (Notably, additional tests showed that the present results do not depend on the specific length of the averaging window: Our analysis yielded conceptually similar results with a window size of four, five, and six consecutive delay-period intervals.) Next, we detrended the resulting hit-rate time courses by subtracting the second-order polynomial fit and performed fast Fourier transform to estimate their spectral composition. This yielded both power and phase values of 18 frequency bins from 0 Hz to 20.6 Hz. Because virtually all previous studies of behavioral attentional sampling have found performance fluctuations in the theta and low-alpha range (e.g., Fiebelkorn et al., 2013; Ho et al., 2017; Landau & Fries, 2012; Re et al., 2019), we limited our frequencies of interest to 2 Hz to 12 Hz, in order to reduce the total number of statistical tests performed.
To statistically assess the presence or absence of a significant temporal pattern in our hit-rate time course (i.e., peaks in its power spectrum), we applied a nonparametric resampling procedure. To this end, we randomly reshuffled hits and misses across all delay-period intervals within each participant and separately for the TMT A and TMT B conditions. We then performed the same analysis steps on the reshuffled data as described above for the observed data and repeated this procedure 10,000 times. This created a distribution of 10,000 power values for each frequency bin, from which we determined the statistical thresholds (p = .005; i.e., Bonferroni corrected for tests in 10 frequency bins). In other words, only observed spectral peaks exceeding 99.5% of the surrogate peaks were deemed significant. Further, we were interested in the phase relationship between potential temporal fluctuations of hit rates in the TMT A and TMT B conditions. For significant peaks in the power spectrum, determined as described above, we compared the corresponding phase angles between the TMT A and TMT B conditions using a parametric Watson-Williams two-sample test (Berens, 2009). Again, this test was conducted both on the observed data and the 10,000 surrogate data sets. Statistical significance was assumed if the p value from the observed data exceeded 99.5% of p values in the surrogate data. Last, to further validate our results, we also performed a more traditional data analysis via a repeated measures analysis of variance (ANOVA) using the variables target type (matching template A vs. template B) and time (all 70 SOAs from 250 to 1,060 ms).
Results
Overall, participants were significantly more accurate on TMT B trials (hit rate: M = 72.5%) than on TMT A trials (hit rate: M = 52.1%), t(24) = −6.94, p < .001, d = 1.33, and also significantly faster on TMT B trials (reaction time: M = 490.4 ms) than on TMT A trials (reaction time: M = 552.2 ms), t(24) = 8.47, p < .001, d = −1.59 (Fig. 2).
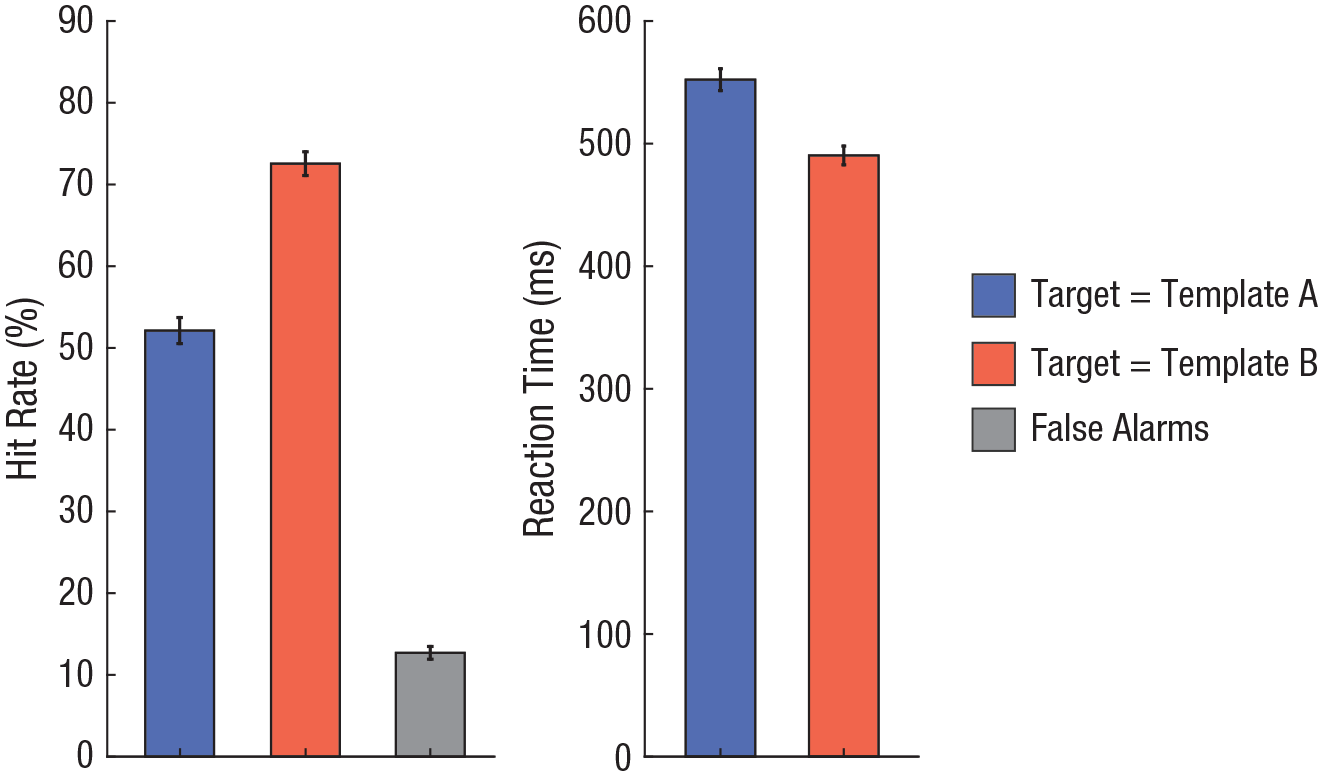
Overall behavioral results. The mean percentage of correct responses for targets matching template A and template B, as well as false-alarm rates, is shown on the left. The mean reaction time of correct responses for targets matching template A and template B is shown on the right. Error bars indicate standard errors of the mean.
Figure 3 illustrates the grand-average time course of hit rates. Because the SOA between templates A and B varied randomly from 200 ms to 505 ms on each trial, the fluctuation of hit rates can be plotted time-locked to either template A or B (Fig. 3). Relative to the onset of template A, performance fluctuations in TMT A and TMT B trials were largely overlapping (Fig. 3, left). However, relative to the onset of template B, the fluctuations in performance appeared to be in counterphase; increased performance in TMT A trials co-occurred with decreased performance in TMT B trials, and vice versa (Fig. 3, right).
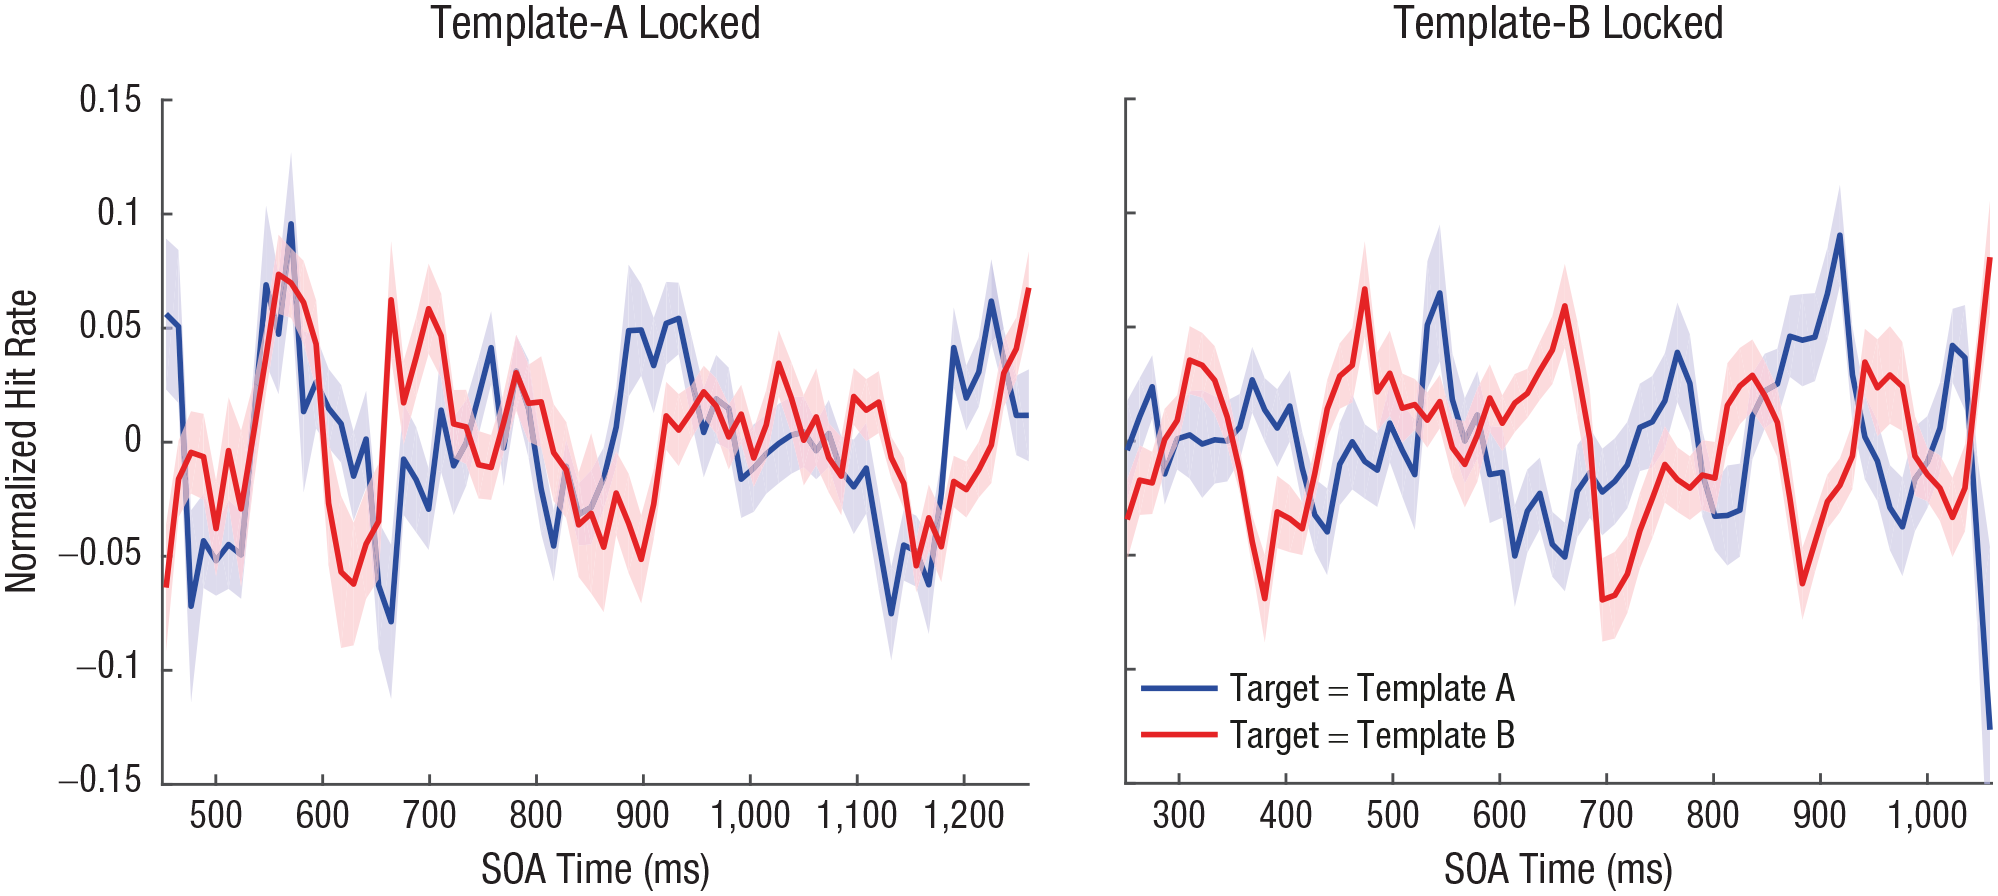
Time course of visual target detection. Grand-average hit rate for targets matching template A and template B is shown across all stimulus-onset asynchronies (SOAs), time-locked to the onset of both template A (left) and template B (right). Shaded areas indicate standard errors of the mean. Because the SOA between templates A and B varied randomly from 200 ms to 505 ms on each trial, the shape of the hit-rate time course depends on whether it is plotted time-locked to the onset of template A or template B.
Spectrally, these fluctuations were evident as peaks at 6 Hz for both the TMT A and TMT B conditions (Fig. 4). Specifically, 6-Hz fluctuations for TMT A trials time-locked to template A were significantly larger than the power observed in our distribution of surrogate data (Fig. 4, left; p = .002, d = 0.07). The same was true for 6-Hz fluctuations for TMT B trials time-locked to template B (Fig. 4, right; p < .001, d = 0.38). In addition, we observed a significant peak at 9.7 Hz for TMT B trials if time-locked to template B (p < .001, d = 0.39).
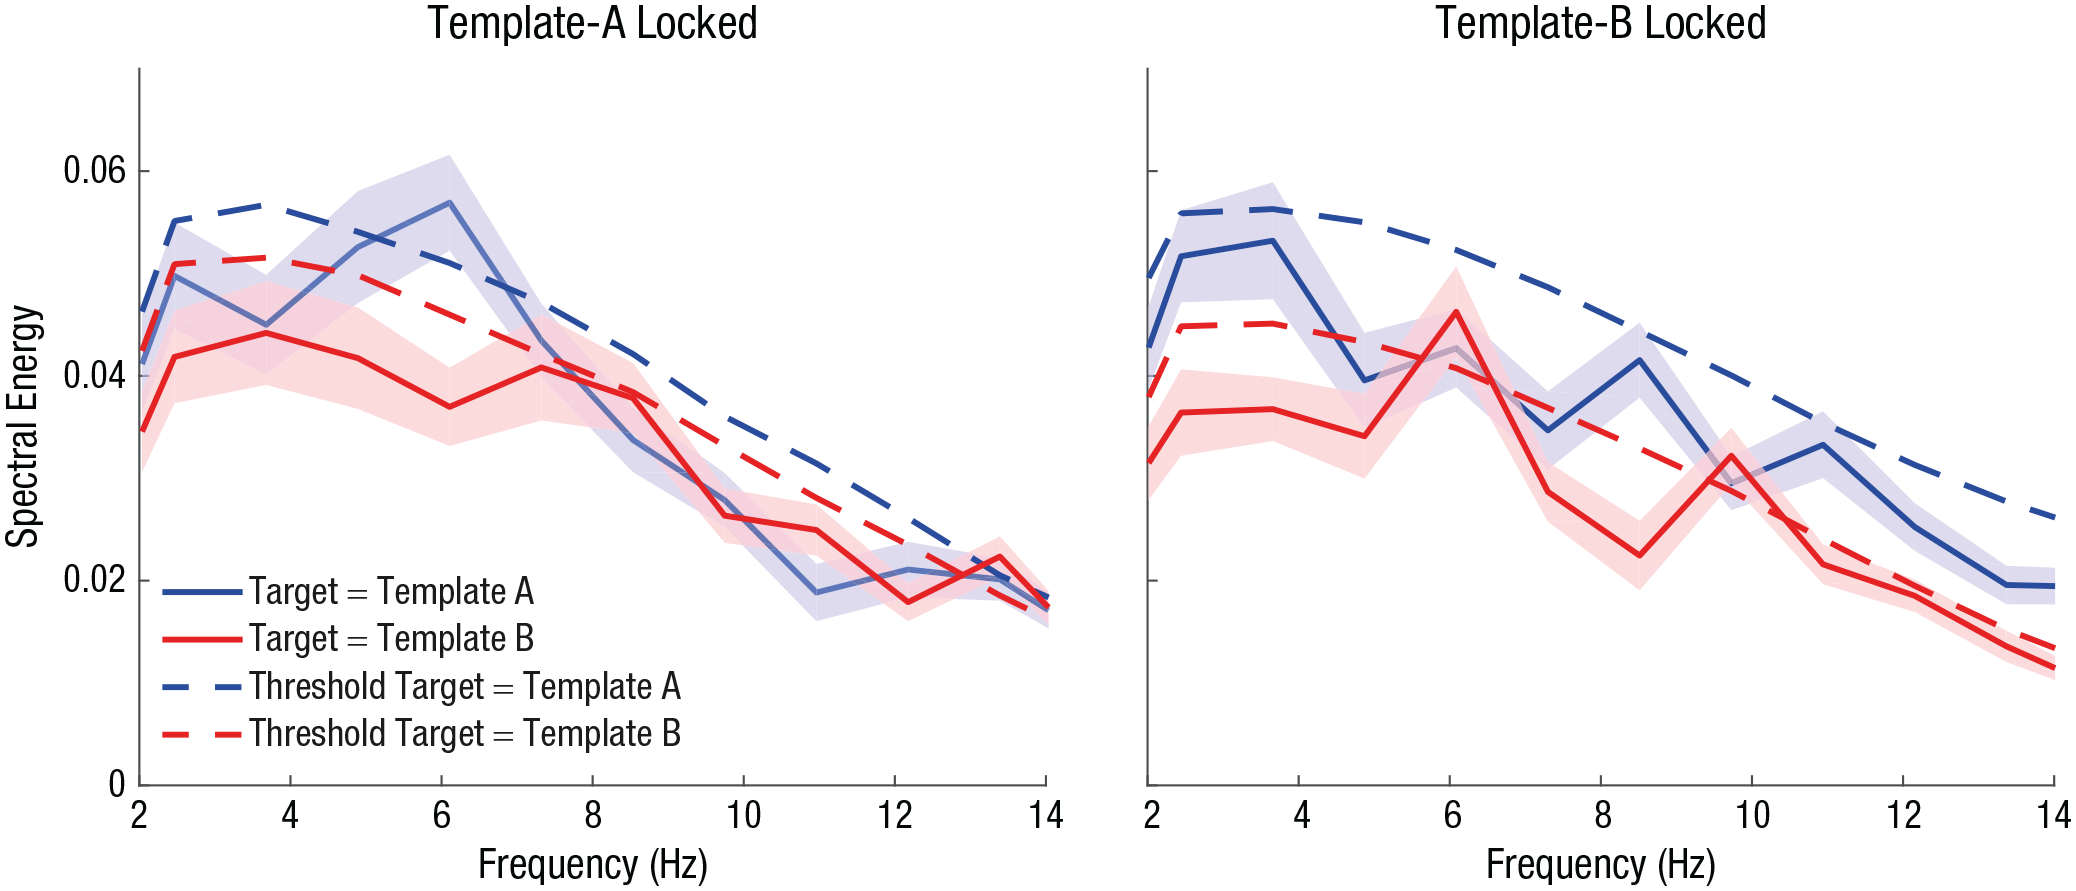
Spectral-energy representation of hit rates for targets matching template A and template B across various frequencies, time-locked to the onset of both template A (left) and template B (right). Solid lines represent empirical data, and dashed lines represent resampled surrogate data. Shaded areas indicate standard errors of the mean.
Finally, we investigated the phase relationship between TMT A and TMT B time courses at 6 Hz. Note that we performed this analysis despite the lack of significant oscillations at 6 Hz for TMT B trials time-locked to template A or TMT A trials time-locked to template B; however, average peaks close to 6 Hz for TMT A and TMT B time courses relative to template B were further observed in our control analysis using an irregular resampling approach (Helfrich et al., 2018; Wen & Liu, 2016; see the Supplemental Material available online). For data time-locked to template A (Fig. 5, left), mean phase angles were highly similar, and the Watson-Williams test yielded no significant difference, F(1, 48) = 0.46, p = .499. Conversely, for data time-locked to template B (Fig. 5, right), mean phase angles for TMT A trials and TMT B trials were almost in opposite directions. This phase difference was significant, F(1, 48) = 36.35, p < .001, and further exceeded the significance threshold derived from our surrogate data (p < .001).
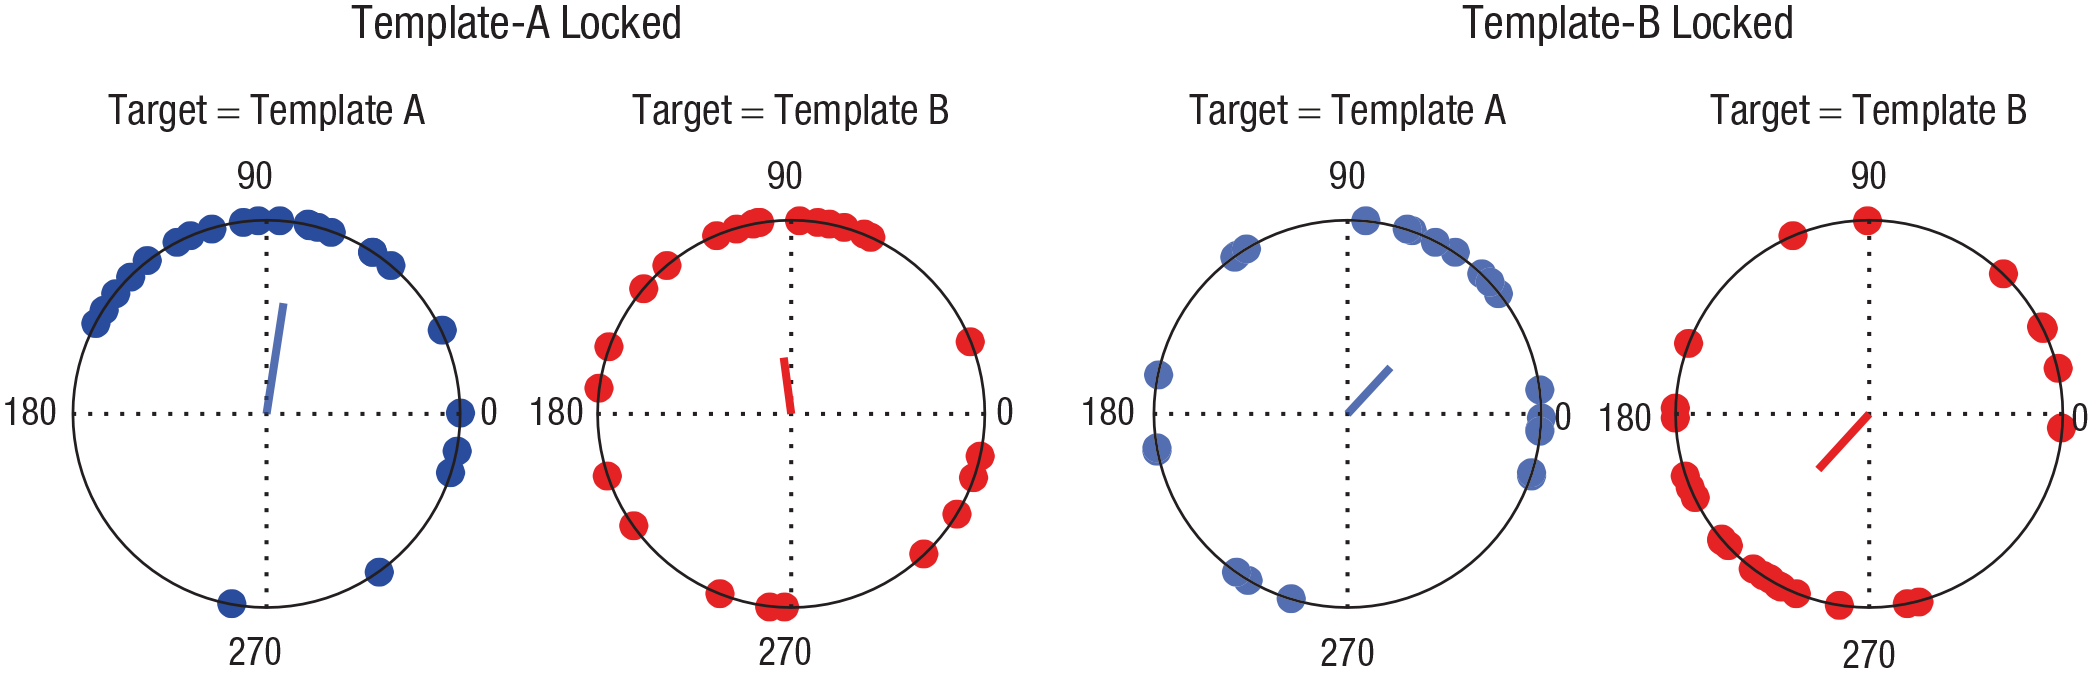
Phase angles of hit rate for targets matching template A and template B at 6 Hz, time-locked to the onset of both template A (left) and template B (right). Blue and red dots indicate individual participants’ phase angles for targets matching template A and template B, respectively. Vectors represent the mean phase across subjects.
The above results were additionally supported by a more traditional analysis using an ANOVA. For data relative to both template A and template B, we observed a significant main effect of time, F(69, 1656) = 3.80, p < .001, η p 2 = .14, and F(69, 1656) = 1.46, p = .009, η p 2 = .06, respectively, as well as a significant interaction between time and target type, F(69, 1656) = 2.49, p < .001, η p 2 = .13, and F(69, 1656) = 4.15, p < .001, η p 2 = .16, respectively. Importantly, the latter reflected different temporal performance profiles for TMT A trials than for TMT B trials.
Discussion
Rhythmic fluctuations in template-guided performance
Both for TMT A trials relative to the onset of template A and for TMT B trials relative to the onset of template B, we observed significant rhythmic fluctuations in performance at 6 Hz. This suggests that the presentation of each template induced an oscillation of its internal neural representation. Our results thus tie in with recent findings on rhythmic processing of external stimuli. For instance, performance has been shown to fluctuate at between 4 Hz and 10 Hz during spatial-attention tasks (Fiebelkorn et al., 2013; Landau & Fries, 2012; VanRullen et al., 2007), at around 4 Hz during object-based attention (Fiebelkorn et al., 2013, 2018; Helfrich et al., 2018), and at 4 Hz during feature-based attention (Re et al., 2019). Beyond visual perception and attention, other work has demonstrated similar phenomena during auditory attention (Ho et al., 2017, 2019), during the impact of top-down predictions on luminance perception (Han & VanRullen, 2017), and during visual-feature binding (Nakayama & Motoyoshi, 2019).
Why would template-related performance fluctuate at 6 Hz specifically? On the one hand, attentional templates held in sensory regions might be cyclically reactivated via top-down directed theta oscillations (4–7 Hz), originating in frontal working memory control areas (Albouy et al., 2017; Daume et al., 2017). In other words, the fidelity of the templates themselves fluctuates. Recent evidence for a similar mechanism during rhythmic sampling of external stimuli comes from electrophysiological studies in both humans and monkeys (Fiebelkorn et al., 2018; Helfrich et al., 2018; discussed below). Accordingly, theta may represent a universal sampling frequency associated with attention-related sampling and exploratory movements, regardless of the number of potential target locations (Fiebelkorn & Kastner, 2019). Alternatively, it is possible that our observed effect corresponds to local alpha-band (8–13 Hz) oscillations in visual areas, related to attentional sampling of the external environment (Busch et al., 2009; Samaha & Postle, 2015). Although the internal template representations might be relatively stable over time, the external stimulus can be matched with a template only at the rate of the sensory sampling (i.e., 8–12 Hz). On each cycle of the alpha rhythm, the visual input (i.e., the target) is matched with a potentially task-relevant template stored in working memory. Given that two templates need to be matched with the input in the present task, the effective performance fluctuates at half the alpha frequency, that is, 6 Hz. Indeed, studies on attentional sampling have observed a proportionate drop in the frequency of rhythmic performance fluctuations when two or three stimuli, rather than one stimulus, had to be monitored simultaneously (Holcombe & Chen, 2013; Re et al., 2019). Notably, we observed an additional rhythmic component at 9.7 Hz only for the TMT B performance time course relative to template B. This might have originated in trials in which participants forgot about the initial template A and memorized only template B, which would also explain the significantly higher hit rate for TMT B trials than for TMT A trials. Several recent studies have reported behavioral oscillations in both the theta- and the alpha-frequency range (Fiebelkorn et al., 2013, 2018; Landau & Fries, 2012; Song et al., 2014), suggesting that multiple attentional and perceptual rhythms can coexist simultaneously (VanRullen, 2016). In the light of these previous reports, we cannot fully rule out an influence of similar fluctuations in target perception or external spatial attention, in addition to the presumed fluctuations of internal working memory representations. However, the present stimuli were all presented at a single spatial location at the center of fixation, and we observed significant differences in phase angles between TMT A and TMT B time courses relative to template B (see discussion below). This suggests that only a representation based on both of these templates could be the origin of the rhythmic fluctuations in the present study.
Regardless of the specific underlying mechanism, our data suggest that information held in working memory seems to bias attention not continuously but in a rhythmically fluctuating fashion. Interestingly, despite the occurrence of template B after a variable delay, we observed sustained TMT A fluctuations time-locked to template A. This suggests that TMT A performance fluctuations at 6 Hz were likely not in all trials reset by template B, the final stimulus prior to the target. In some trials, template A fluctuations remained temporally consistent with their initial reset via template A, resulting in evidence for both template onsets to affect the fluctuations in template A representations. One previous study on attentional sampling that also presented two individual cues prior to target onset found somewhat different results (Re et al., 2019). In that study, participants simultaneously monitored two colors for a slight luminance change in one color. Rhythmic fluctuations of target detection in both colors were jointly induced by the second and final cue prior to the target. It is possible that such a joint reset by a single cue is tied to the continuous presence of external stimuli, as was the case in previous studies on attentional sampling (e.g., Fiebelkorn et al., 2013; Re et al., 2019; VanRullen et al., 2007). In our present study, with attention alternating between internal working memory representations, the rhythmic fluctuation of templates might be more independent of—and only partially reset by—the onset of subsequent external events.
Performance for two templates fluctuates at different phase angles
Crucially, we observed a significant difference in phase angle between 6-Hz performance fluctuations of TMT A trials and TMT B trials relative to template B. This supports our hypothesis that two items concurrently held in working memory are prioritized in alternation, not simultaneously. We did not find such an antiphase relationship for performance fluctuations relative to template A. This is not surprising, as the delay between the two templates varied on a trial-by-trial basis. Thus, when template A was presented, the brain could not predict when template B was going to appear, making an antiphase relationship relative to template A unlikely.
Although we found a highly significant antiphase relationship between the performance time courses for TMT A trials and TMT B trials relative to template B, only the former exhibited significant fluctuations at 6 Hz, as determined via permutation statistics (see Donoghue et al., 2021, for a current discussion of this issue for the analysis of phase angles). In other words, although we found a significant oscillatory component in performance for TMT B trials, such a component was missing for TMT A trials (Fig. 4, right side, blue line). Theoretically, the signal-to-noise ratio might not have been sufficient for this pattern to emerge on TMT A trials. However, the presence of 6-Hz fluctuations in TMT A trials relative to template A argues against this and suggests an inconsistent (i.e., not occurring in all trials) phase reset by the presentation of template B, causing the two representations to fluctuate at different phases. Considering the overall higher performance for TMT B trials, the results might indicate that template B benefited from a recency effect (see Fig. 2; cf. Vergauwe et al., 2016) and that template A required phase-adjusted attentional refreshment to compensate for retroactive interference exerted by template B. Note, however, that it is also possible that the permutation approach we applied lacked the statistical power to detect peaks in both conditions. In line with this possibility, results showed that comparing the individual participant’s peaks with the estimated 1/f noise in the data (cf. Helfrich et al., 2018) yielded a significant mean frequency of 6.56 Hz for fluctuations on both TMT A trials and TMT B trials (see the Supplemental Material for details).
Although there is little doubt that humans can temporally store several items in visual working memory (Cowan, 2001), our data, taken together, suggest that these items are cyclically prioritized via an ongoing theta oscillation. Because the present study provides only correlational evidence for such a limited-resource distribution, however, it is theoretically possible that the two templates fluctuate independently of each other. In any case, temporal multiplexing of information via neural oscillations might be a general mechanism for the distribution of limited cognitive resources (Lisman & Jensen, 2013; VanRullen, 2018).
As discussed above, the specific process underlying the currently observed oscillations is likely related either to a cyclic top-down reactivation of the internal representations per se or to alpha-rhythmic matching between sensory input and working memory contents. Recently, Fiebelkorn et al. (2018, 2019; see also Fiebelkorn & Kastner, 2019) proposed a model in which a dynamic network between the frontal eye field, the lateral intraparietal area, and the pulvinar organizes a theta-rhythmic switch between two attentional states. One causes active sampling of information from the current locus of attention, accompanied by increased beta- and gamma-band (> 15 Hz) activity in cortical areas. The other promotes a switch of attention toward other potentially relevant stimuli, with cortical areas exhibiting higher levels of alpha-band activity. Although this particular model is based on the monitoring of several external spatial locations, a conceptually similar mechanism might govern the cyclic prioritization of working memory templates in visual cortex controlled via prefrontal areas (Barrouillet et al., 2004; Daume et al., 2017).
Conclusions
In summary, our data provide novel evidence that internal task-relevant information in the brain is represented in a rhythmically fluctuating rather than in a continuous fashion. In particular, attention-related performance oscillated at the neural theta-band frequency (6 Hz), the functional importance of which in working memory and top-down cognitive control is well established. This mechanism complements previous reports of fluctuations of attention toward external stimuli. Crucially, our findings are consistent with the idea of two concurrently held representations being prioritized in an alternating fashion, possibly suggesting that a single template predominantly guides attention at any time. Although our current results concern internal representations of orientation, future studies need to establish whether similar cyclic working memory activation also holds for other features such as color, or more complex stimuli, such as faces. Further, because we provide only correlational behavioral evidence for such a limited-resource distribution via antiphasic fluctuations, more causal inferences regarding this process and its underlying neural mechanisms have yet to be established. Following previous research, we propose that oscillatory multiplexing of information is one of the brain’s key mechanisms in dealing with limited processing resources, such as during off-line maintenance of task-relevant visual information.
Supplemental Material
sj-docx-1-pss-10.1177_09567976211013045 – Supplemental material for Theta-Rhythmic Oscillation of Working Memory Performance
Supplemental material, sj-docx-1-pss-10.1177_09567976211013045 for Theta-Rhythmic Oscillation of Working Memory Performance by Ulrich Pomper and Ulrich Ansorge in Psychological Science
Footnotes
Transparency
Action Editor: Barbara Knowlton
Editor: Patricia J. Bauer
Author Contributions
U. Pomper and U. Ansorge designed the study. U. Pomper performed the research and analyzed the data. Both the authors wrote the manuscript and approved the final version for submission.
References
Supplementary Material
Please find the following supplemental material available below.
For Open Access articles published under a Creative Commons License, all supplemental material carries the same license as the article it is associated with.
For non-Open Access articles published, all supplemental material carries a non-exclusive license, and permission requests for re-use of supplemental material or any part of supplemental material shall be sent directly to the copyright owner as specified in the copyright notice associated with the article.