
Abstract
When moving to a new country or living in that country as ethnic-minority-group members, individuals have to relate to different cultural spheres. Scholars and practitioners commonly agree that how people acculturate influences their psychological and sociocultural adaptation. Integration (or biculturalism), which involves engagement in both one’s heritage culture and the dominant mainstream culture, is considered the most beneficial acculturation strategy. But how robust is the evidence for the role of acculturation in adaptation? Here, we present a reanalysis of a previous meta-analysis of mostly correlational studies (k = 83, N = 23,197) and a new meta-analysis of exclusively longitudinal studies (k = 19, N = 6,791). Results show that the correlational link between acculturation and adaptation is much weaker than previously assumed and that longitudinal evidence is minuscule at best. Our findings suggest that empirical support is still lacking for the most basic premises of acculturation theory.
The number of people living outside their country of birth is at an all-time high of 243 million (McAuliffe & Ruhs, 2019). When moving to a new country or living in that country as a later-generation ethnic-minority-group member or otherwise bicultural person (e.g., with parents from two cultures), individuals face the question of how to relate to different cultural spheres such as their ethnic heritage culture and the mainstream culture of the society they live in. Following the most influential model of acculturation introduced by Berry (1997), we can broadly categorize minority-group members’ cultural styles into four acculturation strategies. Individuals who adopt the mainstream culture while giving up their heritage culture follow the assimilation strategy. Those who maintain their heritage culture but do not adopt the mainstream culture follow the separation strategy. Individuals who both maintain their heritage culture and adopt the mainstream culture follow the integration strategy (or biculturalism). Finally, individuals who neither maintain their heritage culture nor adopt the mainstream culture follow the marginalization strategy.
Minority-group members’ acculturation strategy is commonly assumed to have systematic consequences for their adaptation (Sam & Berry, 2010). The integration hypothesis (Berry, 2013) regards integration as the strategy that provides minority-group members with the best adaptation, both psychologically (e.g., better psychological health) and socioculturally (e.g., higher cultural competency; Ward & Kennedy, 1994). Indeed, a frequently cited meta-analysis seems to support the integration hypothesis (Nguyen & Benet-Martínez, 2013), and counselors are often instructed to help immigrants optimally acculturate by following the integration strategy (Johnson & Sandhu, 2007). Yet some researchers have criticized Berry’s fourfold model conceptually and statistically (e.g., Rudmin, 2003) and recommend treating the two dimensions of heritage-culture maintenance and mainstream-culture adoption separately instead of calculating the four acculturation strategies (Arends-Toth & van de Vijver, 2006; Nguyen & Benet-Martínez, 2007). As empirically demonstrated by Berry et al. (2006), who in some analyses treated these dimensions separately, a combination of high heritage-culture maintenance and high mainstream-culture adoption (resembling the integration strategy) seemed most adaptive.
In sum, acculturation is considered a decisive factor in how well immigrants and minority-group members fare in society, and integration is seen as the most adaptive strategy. However, the existing evidence for these predictions may be weaker than previously assumed. Through a reanalysis of a previous, mostly correlational meta-analysis using state-of-the-art methods and a new meta-analysis of exclusively longitudinal studies, we here aimed to provide a more robust test of whether and to what extent acculturation, including the integration strategy, plays a role in adaptation.
Limitations of the Existing Evidence
Summarizing the evidence at the time, Berry (1997) published the most influential early formulation of the integration hypothesis. In his groundbreaking article, Berry concluded, on the basis of then-available studies, that both psychological and sociocultural adaptation “are usually predicted by the successful pursuit of the integration acculturation strategy” (p. 21). This apparent effect was later attributed to integrated individuals receiving social support from both the minority and majority groups (Berry, 2005).
However, the integration hypothesis did not remain unchallenged. In his review, Rudmin (2003) methodologically and empirically criticized the fourfold conceptualization of acculturation strategies. Empirically addressing this critique 3 years later, Berry et al. (2006) published the most comprehensive acculturation study to date (the International Comparative Study of Ethnocultural Youth [ICSEY] project), which included more than 5,000 participants from 13 countries of settlement and more than 30 immigrant groups. In this correlational research, the acculturation strategy of integration was again positively related to adaptation and outperformed the other acculturation strategies. Moreover, when analyzing the mainstream and heritage orientations as separate dimensions instead of calculating acculturation strategies, Berry et al. found that individuals who maintained their heritage culture showed higher psychological and sociocultural adaptation, whereas those who adopted the mainstream culture showed higher sociocultural adaptation (note that the evidence for these systematic associations varies between studies; e.g., cf. Ryder et al., 2000). Hence, this evidence seemed to corroborate that scoring high on both dimensions (i.e., integration) is overall most adaptive for migrants. More recently, Nguyen and Benet-Martínez (2013) seemed to settle the debate with a comprehensive meta-analysis, showing that integration was related to better adaptation across 83 studies and 23,197 participants (for converging results, see Abu-Rayya & Sam, 2017; Yoon et al., 2013).
Statement of Relevance
Because of globalization and unprecedented immigration rates worldwide, virtually every modern society has become ethnically or racially diverse. Living as minority-group members in such diverse societies, immigrants and their descendants are typically confronted with the question of how they want to relate to their heritage culture and the dominant mainstream culture. A large body of interdisciplinary psychological research suggests that such acculturation strategies predict minority-group members’ psychological well-being and sociocultural functioning. Maintaining one’s heritage culture while also adopting the mainstream culture (commonly referred to as integration or biculturalism) has been regarded as particularly beneficial, informing the work of practitioners and policymakers alike. Yet, as we demonstrated in two meta-analyses, the direct influence of acculturation on adaptation seems to be very limited at best. Thus, to improve the adaptation of immigrants, it may be more meaningful to focus on established contextual factors (e.g., discrimination) than on immigrants’ individual cultural styles.
Thus, the current research suggests that how individuals acculturate is decisive for how well they fare psychologically and socioculturally. Yet we believe that this conclusion is based on uncertain grounds. First, the vast majority of studies supporting the integration hypothesis is correlational, which is symptomatic for the whole field of acculturation. Indeed, of the studies included in Nguyen and Benet-Martínez’s (2013) meta-analysis, 94% were based on correlational data, leaving room for various alternative interpretations. For instance, research suggests that complex social categorizations are effortful to sustain (Crisp & Hewstone, 2007). Hence, it is possible that people who show positive adaptation are those who have the necessary cognitive resources to integrate two more or less compatible cultural identities into their self-concept. Alternatively, it is also possible that adaptation and integration co-occur and are explained by some other underlying construct. For instance, the personality trait neuroticism predicts both lower heritage-culture maintenance and mainstream-culture adoption (hence, mirroring lower integration or more marginalization; Ryder et al., 2000) as well as worse adaptation (Jeronimus et al., 2016).
Next, Nguyen and Benet-Martínez’s (2013) meta-analysis is based on the rather uncommon Rosenthal approach to random effects (Rosenthal, 1995; Rosenthal & DiMatteo, 2001; Rosenthal & Rubin, 1994), which we consider prone to misinterpretation. Although Rosenthal’s work on fixed effects built the foundation for contemporary meta-analytic methods, his approach to random effects is less well known (e.g., it is not mentioned in some of the main textbooks on meta-analytical methods; Card, 2015). Rosenthal’s method is unusual because it estimates random effects as counternull values of fixed effects, provided that “the counternull value of an obtained effect size is that nonnull magnitude of effect size that is supported by exactly the same amount of evidence as is the null value of the effect size” (Rosenthal & Rubin, 1994, p. 329). For example, for a nonsignificant r of .10, a counternull of .20 would indicate that the true value of r could as easily be .20 as it could be 0 (Rosenthal & DiMatteo, 2001; Rosenthal & Rubin, 1994).
In other words, random effects from Nguyen and Benet-Martínez (2013) obtained using the counternull approach cannot be interpreted in the same way as random effects obtained using the more common Hedges and Olkin (1985) method, which simply uses a weighted mean of effects from primary studies. The counternull value is typically considerably larger than this weighted mean (e.g., twice as large for symmetric distributions; Rosenthal & Rubin, 1994). In fact, the random effects reported by Nguyen and Benet-Martínez are much larger than the values reported as fixed effects (e.g., r = .50 compared with r = .10 for biculturalism and integration). Yet a reader unfamiliar with Rosenthal’s counternull may misinterpret these values as a simple average of effects from primary studies, and this potential confusion seems to add to the uncertainty around the link between acculturation and adaptation. For instance, Nguyen and Benet-Martínez repeatedly state that this link is “strong”—a conclusion that may not be warranted by the data.
The Current Research
Against this background of inconsistent findings and their limited causal value, the question of whether acculturation predicts adaptation remains open. We aimed to address this question in two ways. First, we provide a reanalysis of the meta-analysis by Nguyen and Benet-Martínez (2013). Importantly, instead of Rosenthal’s counternull approach, we used the more common weighted-mean approach to random effects based on the work of Hedges and colleagues (Hedges & Olkin, 1985; Hedges et al., 2010). Although this does not address the most substantial limitation of the existing meta-analytic evidence, which is reliance on correlational data, it provides more intuitive estimates of overall correlational effects. Second, and most importantly, we provide a new meta-analysis of 19 longitudinal studies (N = 6,791) estimating the cross-lagged effects of acculturation on adaptation over time.
Study 1: Reanalysis of Nguyen and Benet-Martínez’s (2013) Data
Method
Inclusion criteria
Effects were obtained from two sources. First, from Nguyen and Benet-Martínez’s (2013) article, we obtained 67 correlations between integration and adaptation from Appendix B, 49 correlations between mainstream-culture orientation and adaptation from Appendix C, and 53 correlations between heritage-culture orientation and adaptation from Appendix D. Although in these appendices only average effects are reported per included study (e.g., if a primary study included five effects, only one average of these five effects was presented), we also had access to all individual effects from primary articles with more than one study (but not individual effects from single-study articles). Thus, our final data (reported in Table S1 in the Supplemental Material available online) included all averaged effects as well as the individual effects provided by Nguyen and Benet-Martínez, totaling 142 effects (including 44.1% of all individual effects) from 83 studies and 23,197 participants for integration, 110 effects (including 42% of all individual effects) from 64 studies and 18,406 participants for mainstream-culture orientation, and 135 effects (including 38.5% of all individual effects) from 71 studies and 20,082 participants for heritage-culture orientation. To assess the influence of within-study dependency between effects, we used moderation analyses, testing whether results changed depending on whether or not this dependency was controlled for. Finally, to test for the influence of the way acculturation was measured, we extracted information from Appendix B of Nguyen and Benet-Martínez’s article about the type of acculturation measure each study used: unilinear (heritage and mainstream orientations were measured as the extremes of the same dimension), bilinear (heritage and mainstream orientations were measured as two separate dimensions), or typological (the four acculturation strategies were measured as four separate dimensions). This information was available for all but five articles.
Analytic procedure
Nguyen and Benet-Martínez (personal communication, September 14, 2018) provided us with the formulas originally used in their analyses. In Rosenthal’s approach (Rosenthal, 1995; Rosenthal & DiMatteo, 2001; Rosenthal & Rubin, 1994), which was used by Nguyen and Benet-Martínez (2013), r coefficients from the primary studies are first transformed to z scores and then averaged (fixed effect). A t value and the corresponding p value are then calculated on the basis of this average using the one-sample t-test formula:

The t value is then transformed to r to obtain a meta-analytic effect size representing the counternull of the fixed effect (referred to by Nguyen & Benet-Martínez, 2013, as the random effect). Rosenthal proposed that “counternull values can be especially useful in meta-analyses for evaluating the importance of summarized effects” (Rosenthal & Rubin, 1994, p. 330) and noted that the counternull should be interpreted in terms of its discrepancy with other measures of central tendency (i.e., weighted and unweighted mean and median of primary effects) rather than as a stand-alone point estimate (Rosenthal & DiMatteo, 2001).
By contrast, Hedges and Olkin’s (1985) approach provides a readily interpretable point estimate. In this approach, the primary effect sizes transformed to z are weighted by the sum of reverse within-study variance and between-study variance (τ2). Then the random effect is calculated as a weighted mean and transformed back to r. Additionally, if the primary effects are clustered (e.g., multiple effects from one study, which applies to the present data), their interdependency may be dealt with by computing efficient weights and robust standard errors that take within-cluster correlation ρ into account (i.e., robust variance estimation; Hedges et al., 2010).
Thus, we used the robumeta package (Version 2.0; Fisher et al., 2017) for R (Version 4.0.2; R Core Team, 2020) to assess robust random effects. The role of within-study effect interdependency was estimated by testing whether the size of the meta-analytical effect differed depending on the type of data available to us for a given study (dummy-coded: 1 = all raw effects made available by Nguyen and Benet-Martínez; 0 = only averaged effects available from Appendixes A, B, and C of Nguyen & Benet-Martínez, 2013). Additionally, we tested for moderation by the type of acculturation measure used in the primary studies (i.e., unilinear, bilinear, typological; dummy-coded). We used the precision-effect test and precision-effect estimate with standard errors (PET-PEESE) method (the sample-size-based variant, as proposed by Pustejovsky & Rodgers, 2019) and p-curve analyses (Simonsohn et al., 2015) to assess publication bias. These two sets of methods, although state of the art, may underperform under certain conditions (e.g., high heterogeneity, which is a problem for most methods assessing publication bias; see Stanley, 2017). Thus, converging results from both methods may increase the reliability of conclusions about the presence or absence of publication bias. Finally, because Nguyen and Benet-Martínez (2013) obtained their main effects using averaged correlations as reported in their Appendixes A, B, and C, we also reconducted the analysis on the same averages to rule out the possibility that differences in our results may simply be due to the inclusion of a greater number of clustered effects (see Table S2 in the Supplemental Material).
Results
Table 1 presents the results of our reanalyses. Robust random effects indicated that integration, mainstream-culture orientation, and heritage-culture orientation were correlated only weakly with adaptation. Moreover, significant Q statistics and high I2 values indicated considerable heterogeneity across the primary studies. This heterogeneity was especially high for integration and heritage-culture orientation. Sensitivity analyses indicated that all meta-analytical effects remained the same under different assumed strengths of within-cluster correlation ρ (i.e., ρ = .02, ρ = .04, ρ = .06, ρ = .08, and ρ = 1; see Table S3 in the Supplemental Material). Meta-regressions showed that the size of the effect did not differ significantly between studies for which all primary effects were available and studies for which only averaged effects were available. The effect also did not differ significantly depending on the types of acculturation measures the studies used. Finally, supplementary analyses showed that effects were close to identical when only the aggregated effects reported by Nguyen and Benet-Martínez (2013) were considered (see Table S2).
Associations Between Acculturation and Adaptation: Results From Reanalyses of the Correlational Meta-Analysis in Study 1 Using Robust Variance Estimation
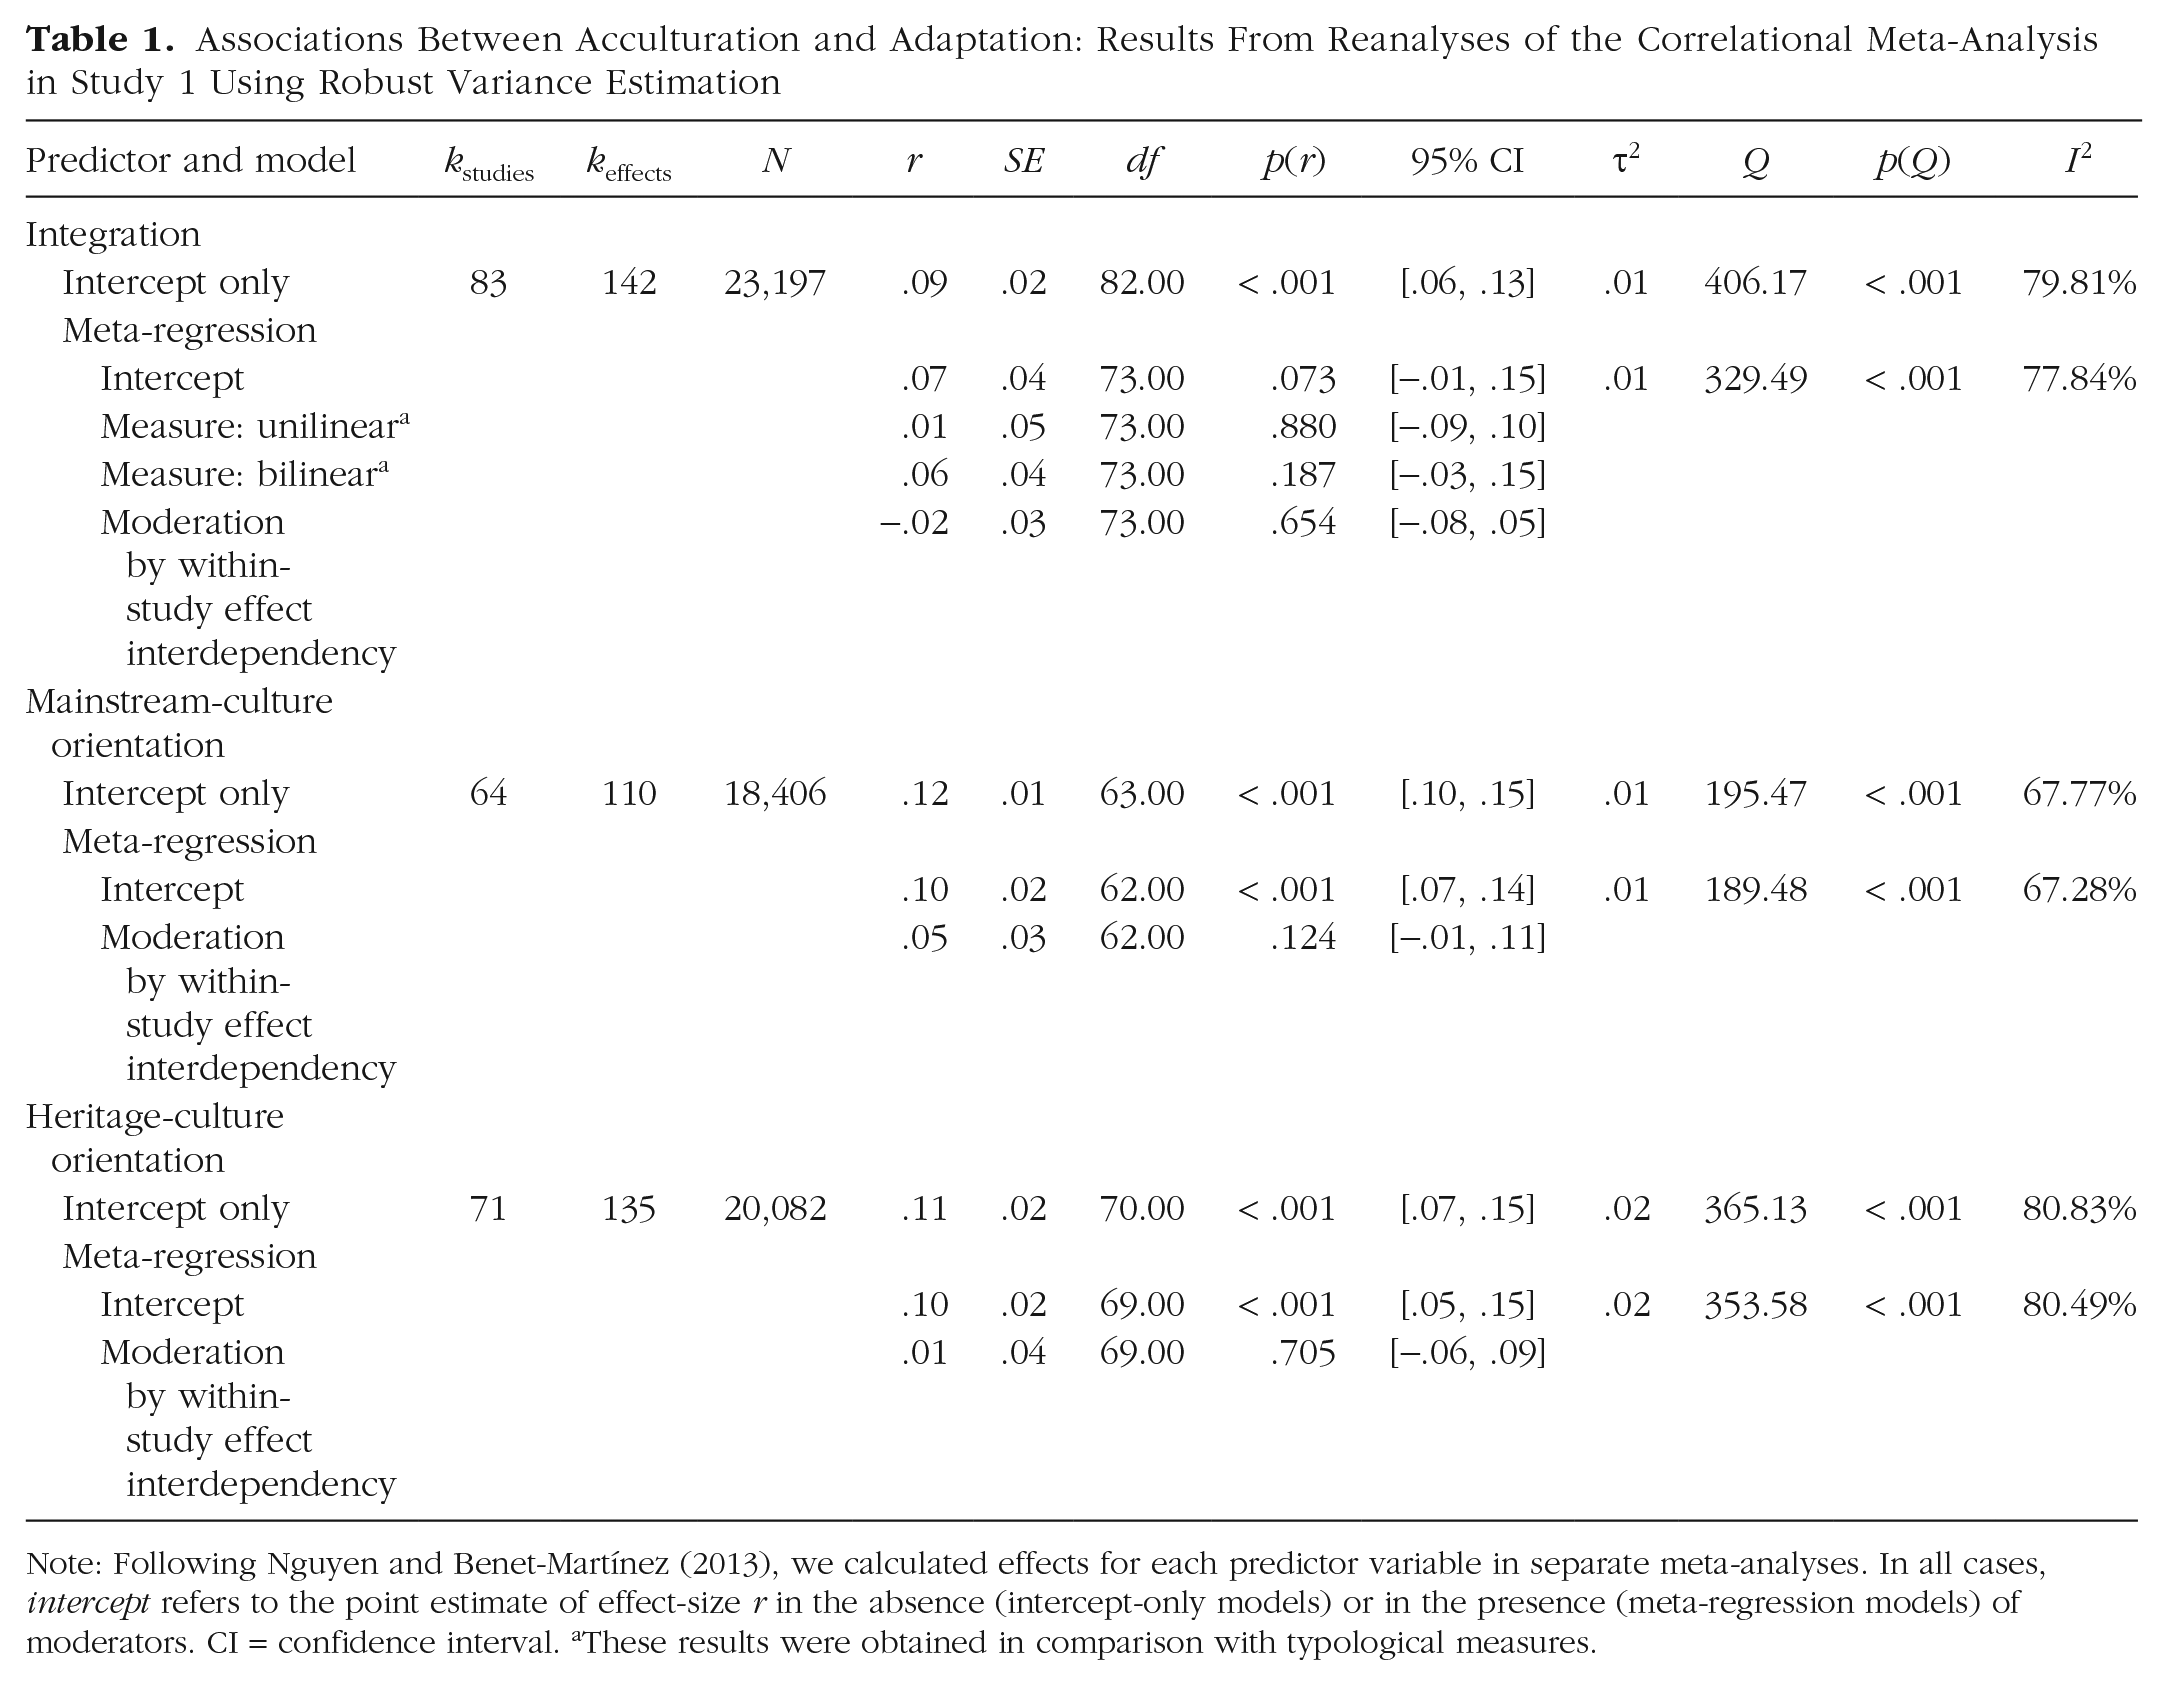
Note: Following Nguyen and Benet-Martínez (2013), we calculated effects for each predictor variable in separate meta-analyses. In all cases, intercept refers to the point estimate of effect-size r in the absence (intercept-only models) or in the presence (meta-regression models) of moderators. CI = confidence interval. aThese results were obtained in comparison with typological measures.
Table 2 reports PET-PEESE estimates of unbiased effects and publication bias (Pustejovsky & Rodgers, 2019). If the unbiased effect (i.e., intercept) in the PET test is nonsignificant at an α of .10, PET results should be interpreted; if the unbiased effect in the PET test is significant, PEESE results should be interpreted (Stanley & Doucouliagos, 2014). In the present case, PET estimates of unbiased effects of integration and heritage-culture orientation on adaptation were nonsignificant, indicating that the true effects may be equal to zero. By contrast, the PET and PEESE estimates of the effect of mainstream-culture orientation on adaptation were significant at an α of .10, suggesting that the true effect is greater than zero. However, it is important to note that the results for integration and heritage-culture orientation should be interpreted with caution, as in both cases heterogeneity of effects was about 80%, which is the cutoff value above which PET-PEESE tests cease to be reliable (Stanley, 2017).
PET-PEESE Estimates for the Correlational Meta-Analysis in Study 1
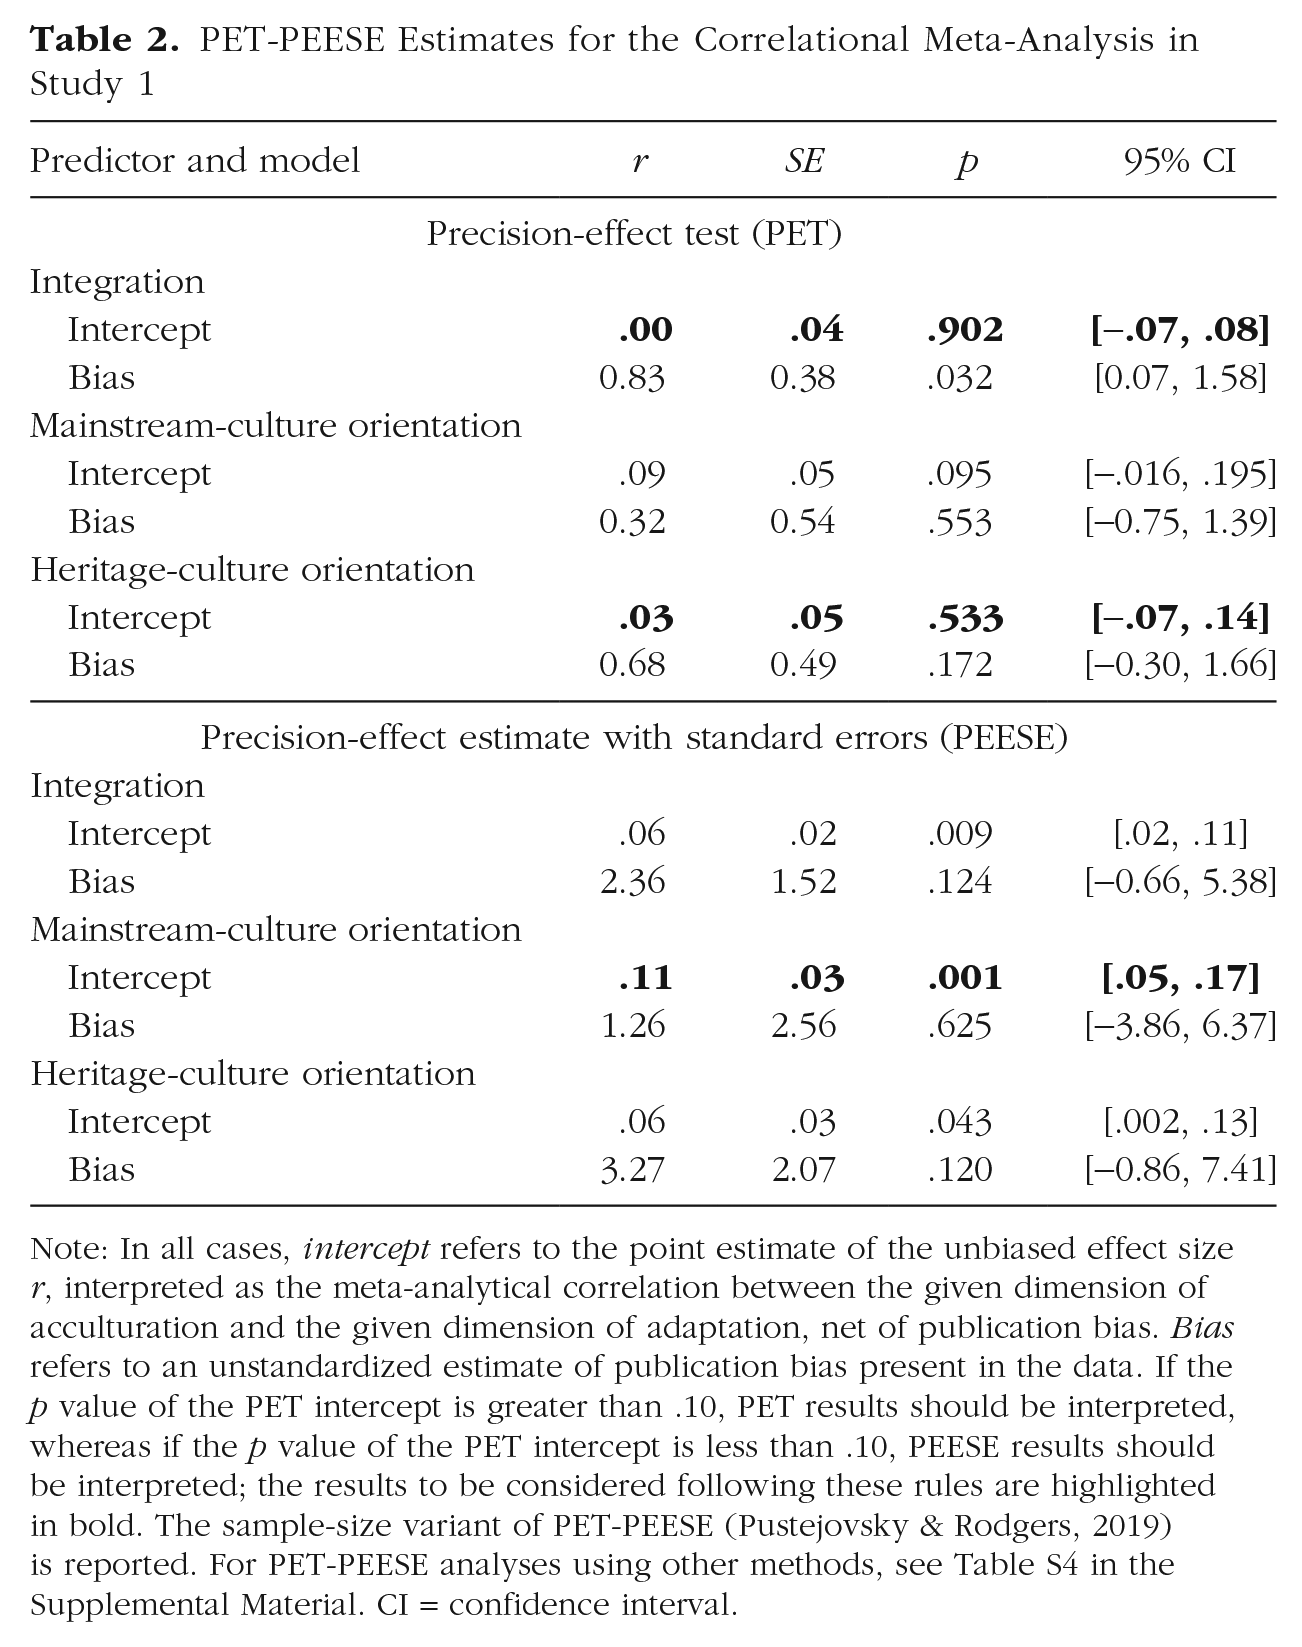
Note: In all cases, intercept refers to the point estimate of the unbiased effect size r, interpreted as the meta-analytical correlation between the given dimension of acculturation and the given dimension of adaptation, net of publication bias. Bias refers to an unstandardized estimate of publication bias present in the data. If the p value of the PET intercept is greater than .10, PET results should be interpreted, whereas if the p value of the PET intercept is less than .10, PEESE results should be interpreted; the results to be considered following these rules are highlighted in bold. The sample-size variant of PET-PEESE (Pustejovsky & Rodgers, 2019) is reported. For PET-PEESE analyses using other methods, see Table S4 in the Supplemental Material. CI = confidence interval.
We therefore cross-validated the role of publication bias through p-curve analyses (Simonsohn et al., 2015). For each p-curve, both half and full p-curve tests indicated right-skewness with p less than .001, supporting the evidential value of the data (see Fig. S1 in the Supplemental Material for full results). Thus, for integration and heritage-culture orientation, PET-PEESE and p-curves showed divergent results, and the reliability of both approaches could be limited because of high heterogeneity of effects (Stanley, 2017). Accordingly, we considered the results regarding publication bias inconclusive for integration and heritage-culture orientation. For mainstream-culture orientation, however, heterogeneity was below the cutoff value of 80%, and both PET-PEESE and p-curves indicated the absence of publication bias.
Discussion
Only 0.8% to 1.4% of the variance in adaptation was explained by acculturation, and the heterogeneity of these effects suggested that they were not only weak but also highly unstable. Whereas p-curve analyses indicated absence of publication bias, PET-PEESE results suggested that the true, unbiased effect of integration and heritage-culture orientation may not differ from zero.
Although our reanalyses suggested that acculturation has a very limited association with adaptation, they left the main limitation of the existing evidence unaddressed, namely, the reliance on correlational data. Therefore, we next present a new meta-analysis of exclusively longitudinal studies. To gather nuanced insights, we tested the role of all four acculturation strategies as well as the heritage- and mainstream-culture orientations, treated separately.
Study 2: Longitudinal Meta-Analysis
Method
Inclusion criteria
To be included, a study had to be available in English and use a migrant, ethnic/racial minority, or sojourner sample. In addition, studies had to report at least one effect over time between at least one measure of acculturation and at least one measure of either psychological or sociocultural adaptation. If such effects were not reported explicitly, studies had to provide enough statistical information to estimate such an effect. In addition to common measures of acculturation (e.g., the Vancouver Index of Acculturation; Ryder et al., 2000), we accepted measures, such as heritage-culture identification and contact with members of the mainstream culture, that are often used to assess acculturation (Schwartz et al., 2010). Moreover, in addition to direct measures of adaptation and other measures commonly used in the field (e.g., problem behaviors for sociocultural adaptation; stress, anxiety, depression, self-esteem, life satisfaction, and mood for psychological adaptation), we accepted proxies such as domain-specific well-being (e.g., in school) and somatic health for psychological adaptation or school grades and dropout intention for sociocultural adaptation.
Search procedures
Figure 1 outlines the literature-search procedures used in this study; these procedures are in line with the Preferred Reporting Items for Systematic Reviews and Meta-Analyses (PRISMA) guidelines (Moher et al., 2009). The literature search was performed in spring and summer 2018. Initially, two research assistants searched for the relevant studies using three strategies: (a) screening the reference lists of the Nguyen and Benet-Martínez (2013) meta-analysis, (b) searching a database of studies on cross-cultural adaptation previously assembled by Bierwiaczonek and Waldzus (2016), and (c) conducting an online search with the EBSCO host integrated-search functionality using all available databases. EBSCO integrated search allowed us to simultaneously search all databases hosted by EBSCO under the Academic Search Premier indexing service (https://www.ebsco.com/products/research-databases/academic-search-premier). Example databases included all American Psychological Association databases (including PsycInfo, PsycArticles, and Social Sciences Abstracts) as well as other electronic resources (e.g., Web of Science; see “Search Procedures” in the Supplemental Material for more details regarding the resources covered by the search). Because we aimed to conduct a highly inclusive search, we used one broad search string: “acculturation AND longitudinal” to search abstracts of all databases covered by EBSCO integrated search. These three strategies revealed 1,329 potentially relevant studies.
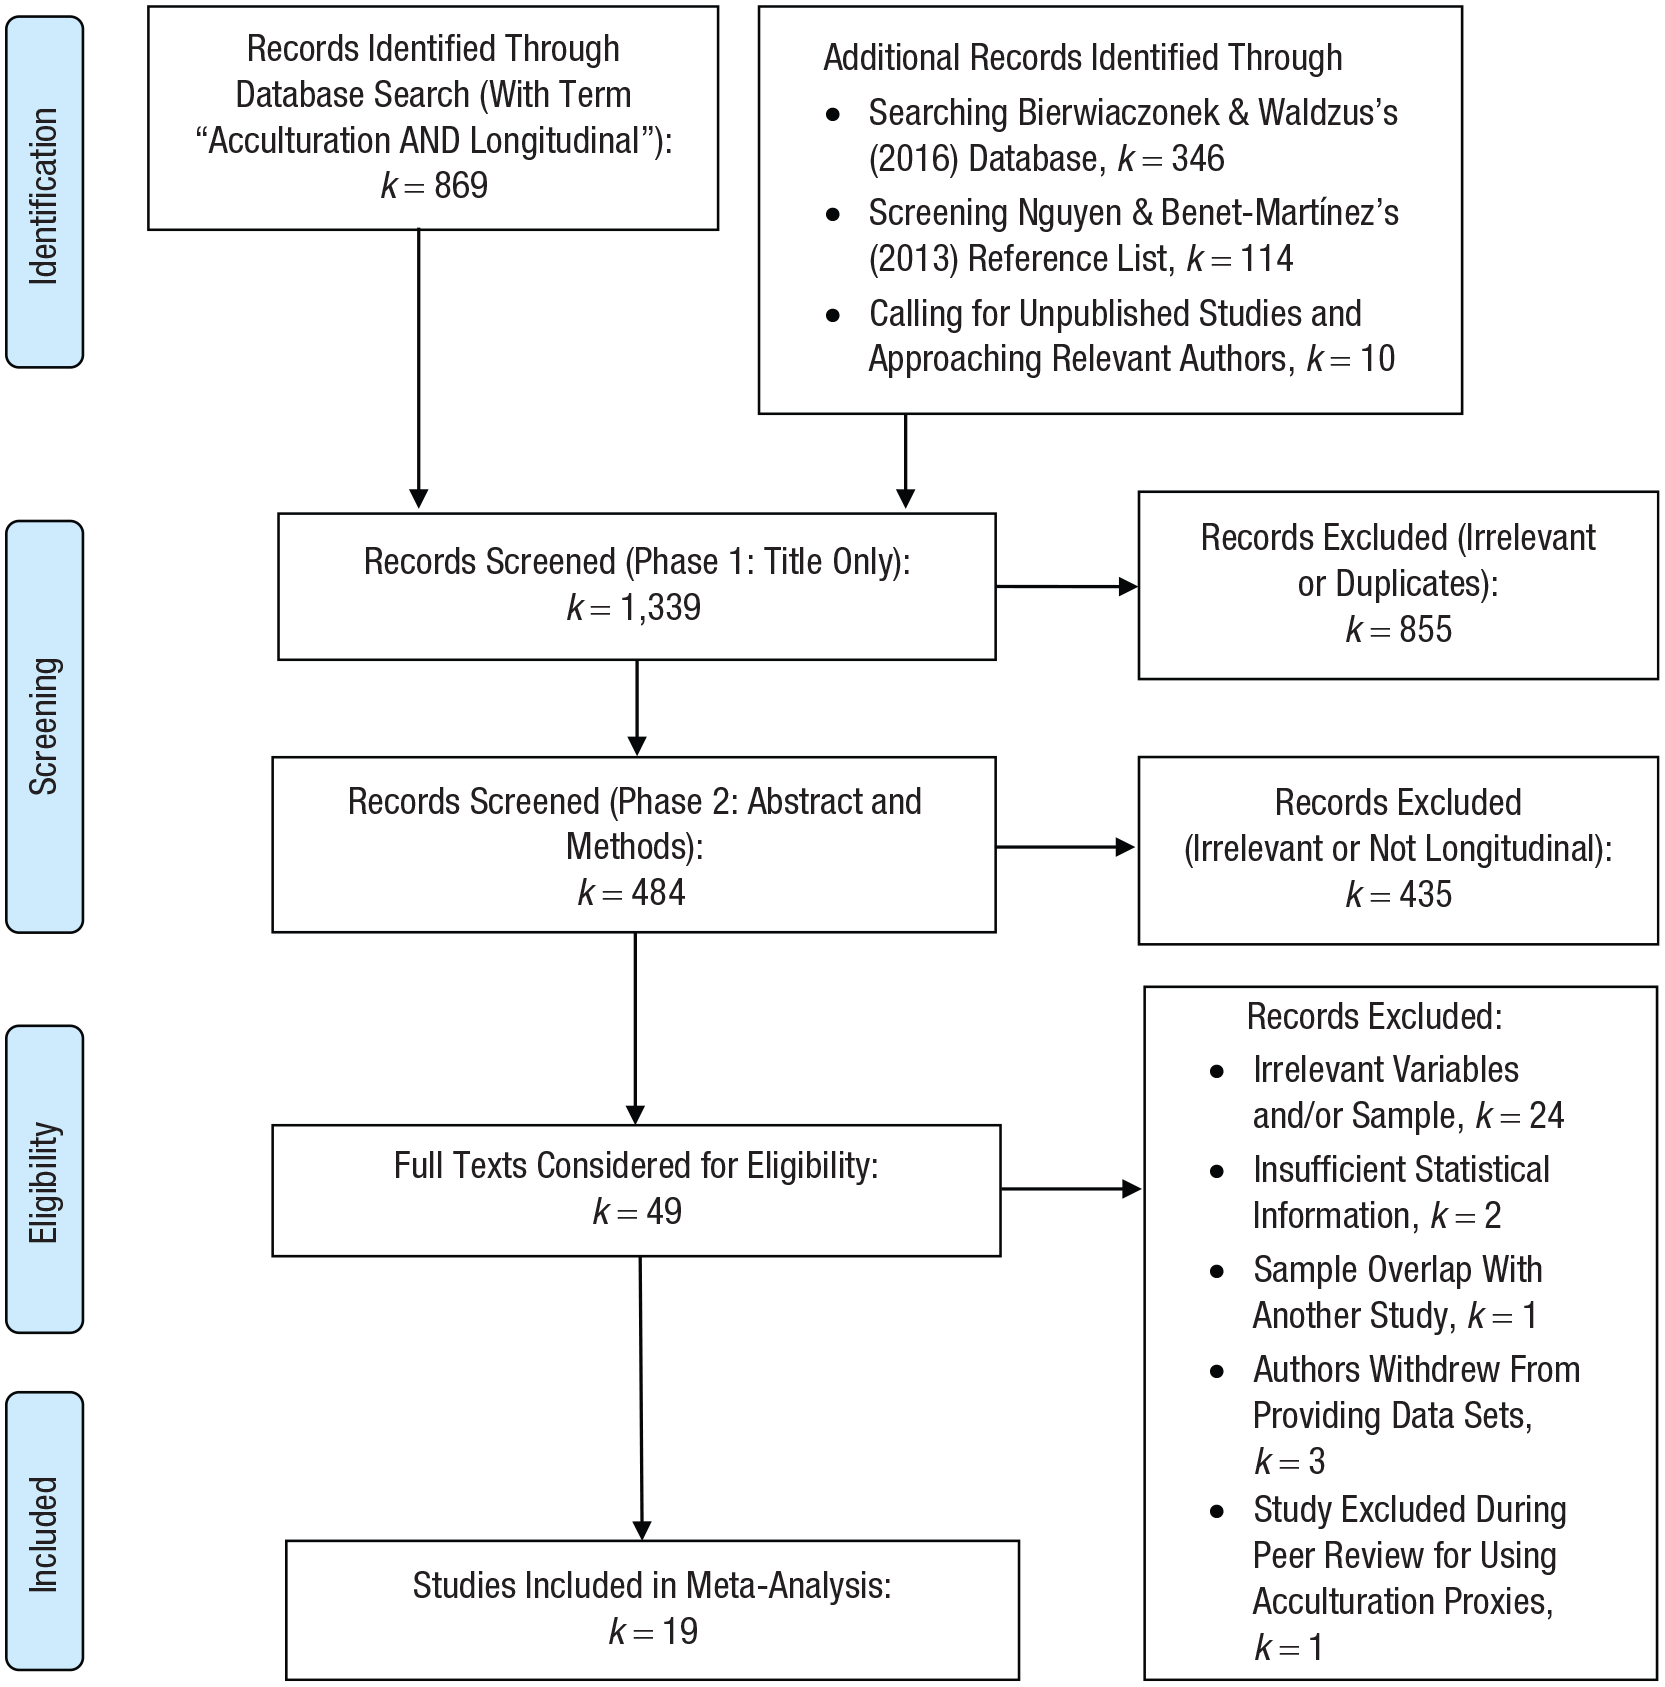
Preferred Reporting Items for Systematic Reviews and Meta-Analyses (PRISMA) diagram illustrating the search strategies and inclusion criteria used in Study 2. The number reported for additional records identified through contacting relevant authors includes only new records obtained from authors; it does not include data sets or results from previously identified studies (e.g., through database search) that we obtained by requesting them from the authors directly (n = 6). When considering full text for eligibility, we excluded studies based on the same data sets (see “Details of Excluded Studies” in the Supplemental Material for details).
After removing irrelevant and duplicate results, we carefully screened the abstracts and method sections of the retained articles. To ensure high reliability of this process, two independent coders screened 50 abstracts twice. The coders showed a high degree of agreement in their decisions to retain or exclude articles (Cohen’s κ = .77). In case of differences, abstracts were submitted to further examination.
We further extended our search strategy in two ways. First, we sent out calls for unpublished studies to several scientific organizations in the field of social and cross-cultural psychology, out of which four (International Association for Cross-Cultural Psychology, European Association of Social Psychology, Society for Personality and Social Psychology, International Academy for Intercultural Research) confirmed having forwarded our call to their members. We received five replies to this call; four of them indicated relevant studies, three of which were eventually included in the meta-analysis. Second, we targeted a number of scholars likely to be in possession of relevant data (e.g., authors of the articles identified by our initial literature search and scholars active in the field of acculturation) and contacted them by email and/or in person at relevant scientific conferences. Three authors calculated the necessary estimates following our guidelines and provided them to us, and nine authors provided us with a total of 10 data sets. Whenever our attempts to contact the authors of previously identified articles were not successful, we kept the article in our database and attempted to extract any information that could still be used (e.g., correlations between adaptation and either heritage-culture orientation or mainstream-culture orientation). Note, however, that in many cases the available information was insufficient (see “Details of Excluded Studies” in the Supplemental Material for reasons that led to the exclusion of specific studies). Consequently, this meta-analysis relied largely on studies by those authors who were available to share their data.
In sum, our analyses included 19 longitudinal studies (see Table 3 for study characteristics; further details, including all effects, are provided in Table S5 in the Supplemental Material). For 13 of the included studies, we obtained the respective data sets or results directly from the authors and therefore had access to all required information. Note that although 10 of these 13 studies had already been published, most values used here were calculated merely for the purpose of this meta-analysis and cannot be found in the published articles. As for the six remaining studies, our attempts to contact the authors were unsuccessful, and we relied on the published articles, which reported some but not all of the required results (e.g., correlations between one, but not necessarily both, acculturation orientations and adaptation; correlations between two different measurement waves, but not necessarily all waves and not necessarily within waves).
Main Characteristics of Studies Included in the Meta-Analysis of Study 2
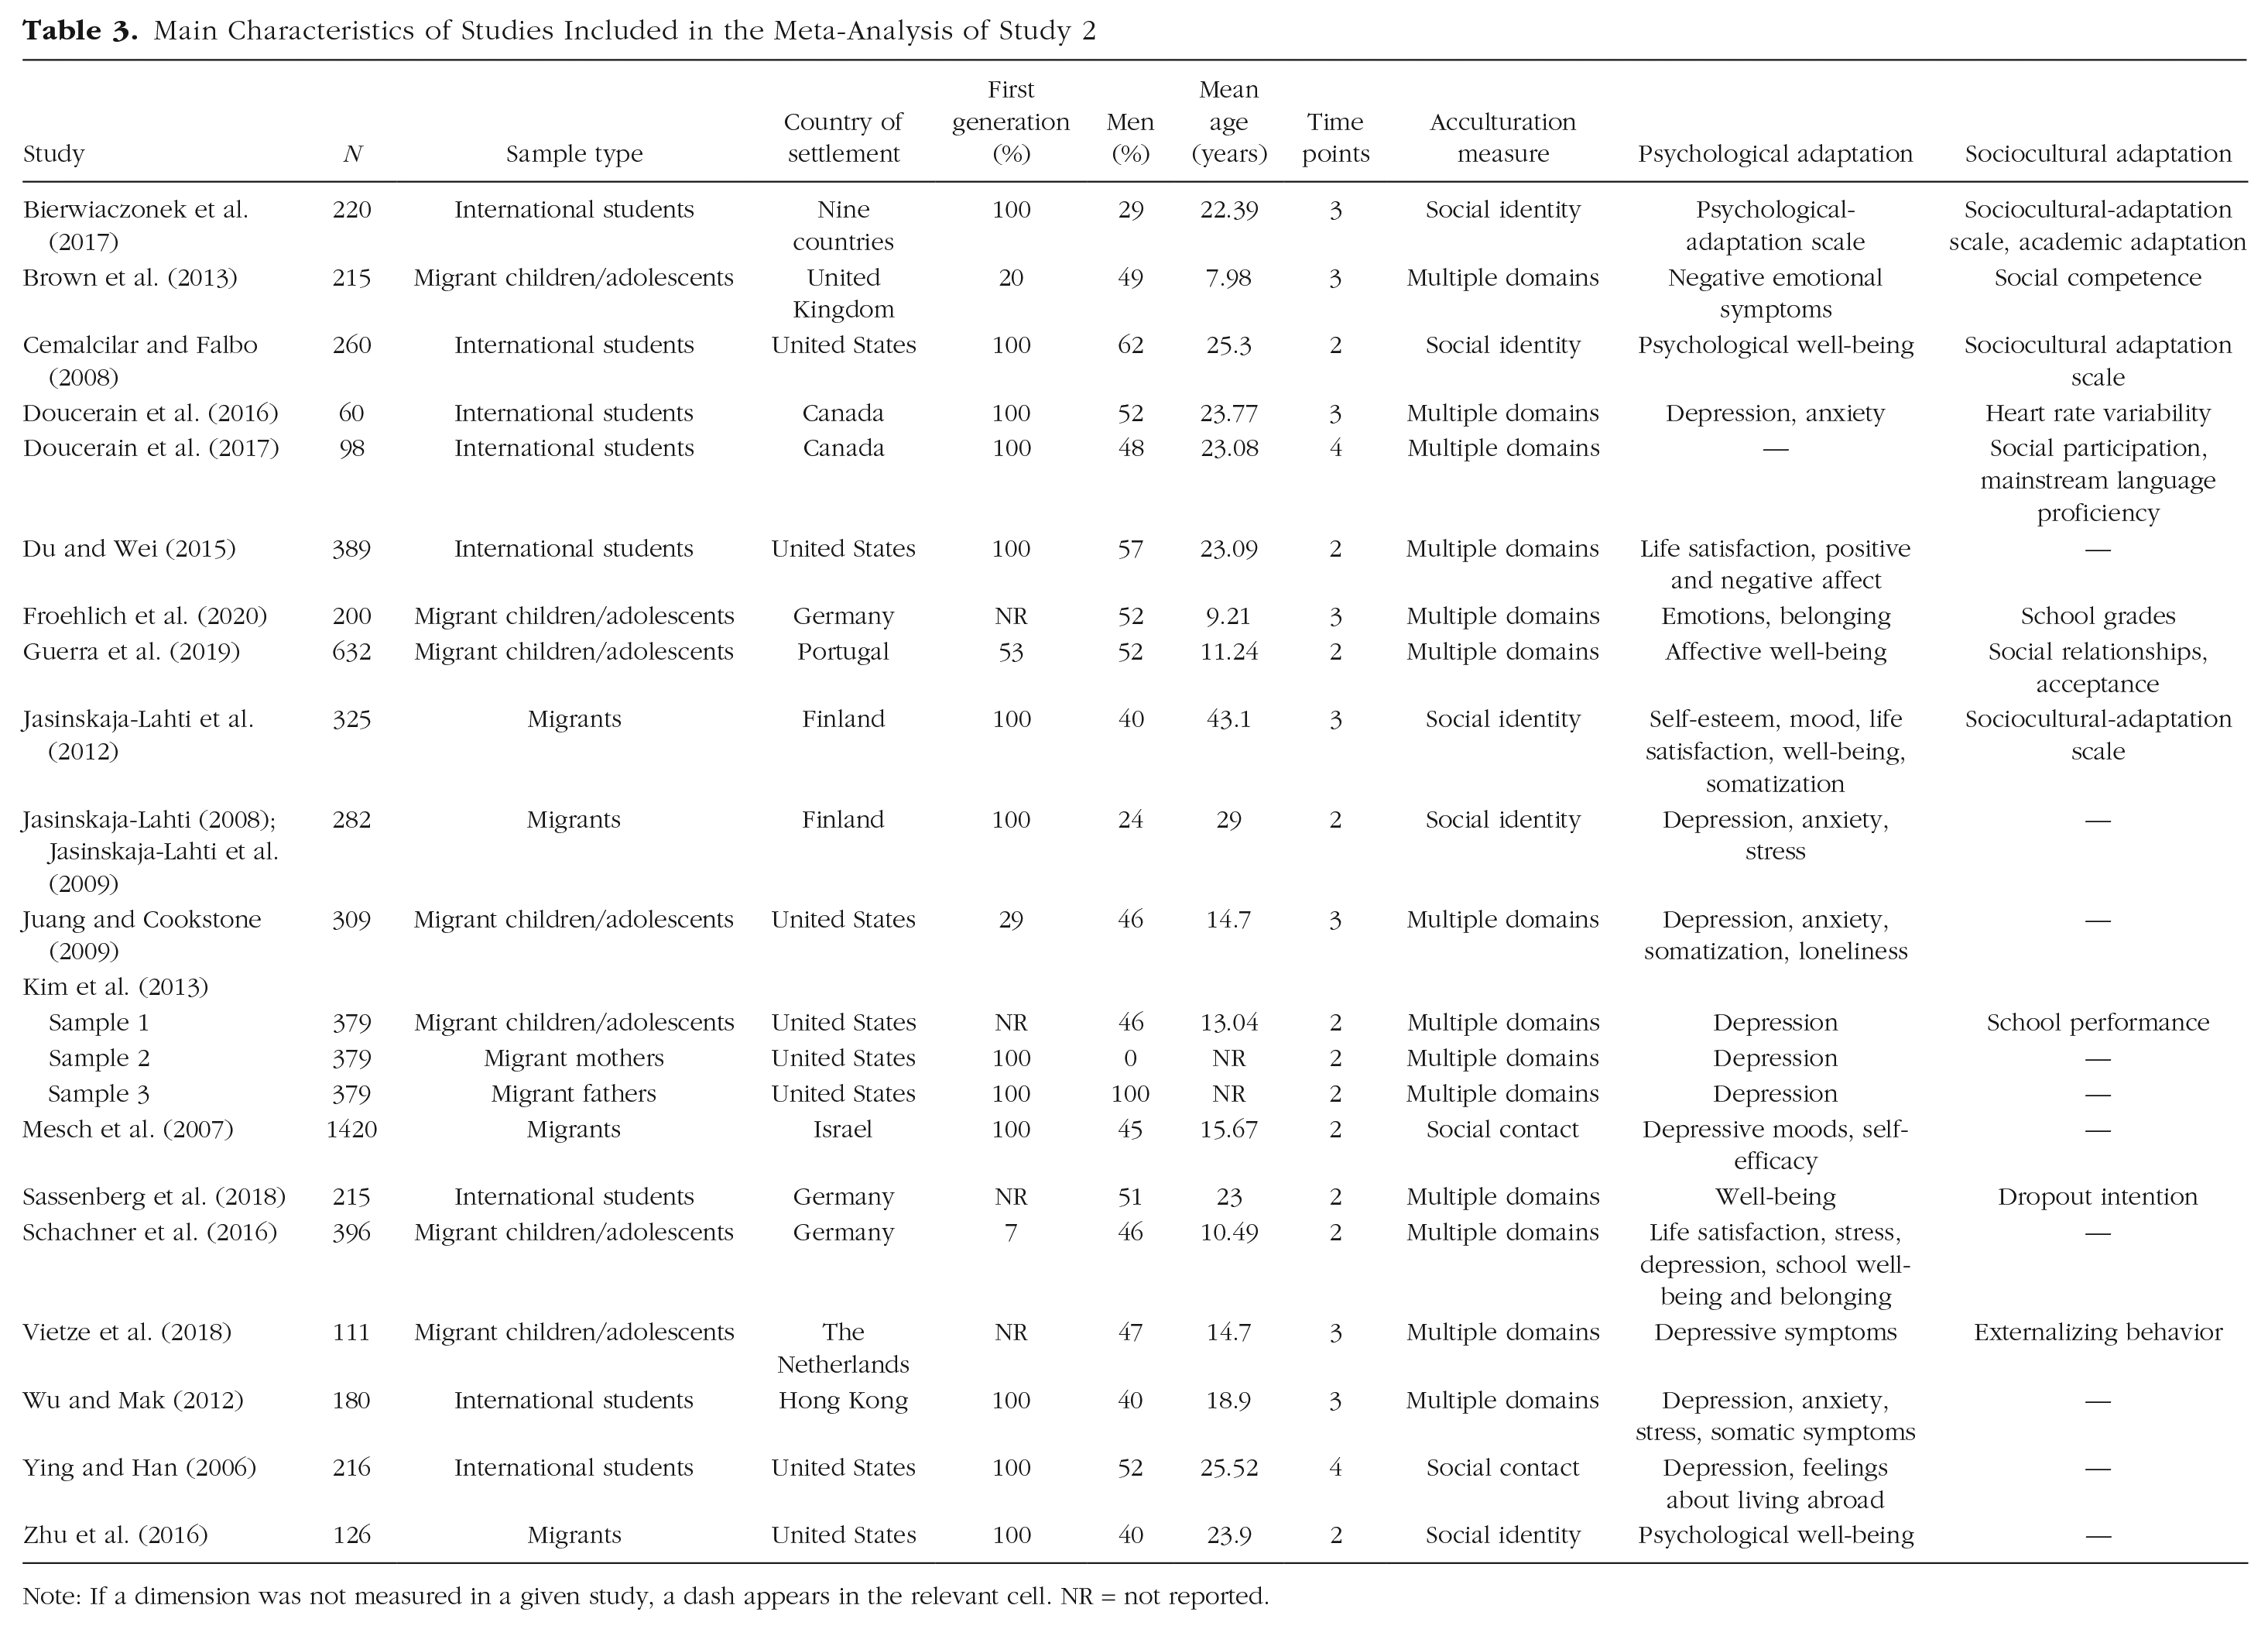
Note: If a dimension was not measured in a given study, a dash appears in the relevant cell. NR = not reported.
Sample descriptive statistics
Our study pool consisted of nine samples of international students, seven samples of migrant children and adolescents, and three samples of adult migrants (see Table 3). The average age of participants ranged from 7.98 to 43.10 years (M = 19.90, SD = 8.46), and the average percentage of male participants in the primary samples was 46.52% (SD = 17.97). As to participants’ heritage culture, nine studies used samples of mixed origins, five studies focused on participants from China and Taiwan, three studies focused on participants from the former Soviet Union, and one study focused on Moroccans. (Further details can be found in Table S5 in the Supplemental Material). As to the country of settlement, nine studies focused on North America (United States: k = 6, Canada: k = 2), eight studies on Europe (Germany: k = 3, Finland: k = 2, Portugal: k = 1, The Netherlands: k = 1, United Kingdom: k = 1, mixed European countries: k = 1), and two on Asia (Israel: k = 1, Hong Kong: k = 1).
Data preparation
Prior to coding, we calculated the statistics of interest from the retrieved data sets. As stated earlier, our aims were to analyze the longitudinal effects of (a) the four acculturation strategies and (b) the heritage- and mainstream-culture orientations, treated separately, on adaptation. For the first aim, some data preparation was necessary. Only one data set included a fourfold continuous measure of acculturation, readily offering scores for the four acculturation strategies. For the remaining data sets, we calculated the four acculturation strategies by dichotomizing the scores on heritage and mainstream orientation and then combining the resulting groups. Importantly, moderation analyses in Study 1 showed no differences between dichotomized bilinear measures and other measures of acculturation, indicating that dichotomization does not significantly influence the strength of correlations between acculturation and adaptation. Here, we opted for using the midpoint-split procedure for dichotomization (see Arends-Toth & van de Vijver, 2006). This procedure uses the respective scale midpoints to divide participants into groups that score high or low on heritage-culture maintenance and mainstream-culture adoption. These scores are then used to categorize people into the four acculturation strategies. Because the midpoint split is based on a meaningful middle point of the scale rather than on relative cutoff values such as the median, it is considered conceptually less problematic, especially when research includes samples from different countries and populations (Arends-Toth & van de Vijver, 2006). It should be noted that the midpoint-split procedure tends to result in groups of unequal sizes (e.g., integration and assimilation may be more frequent than separation and marginalization). Whereas this may be problematic in a primary study, it is of less concern in a meta-analysis that typically includes a larger number of cases. Moreover, this method of allocation to the four acculturation strategies is the least dependent on the specificity of each primary sample, making the strategies comparable between the meta-analyzed studies.
By applying the midpoint split and combining the resulting groups, we obtained four dummy variables: integration (1) versus the remaining strategies (0), assimilation (1) versus the remaining strategies (0), separation (1) versus the remaining strategies (0), and marginalization (1) versus the remaining strategies (0). We then computed the correlations of these four dummies with adaptation measures within and between waves, after which we proceeded with the coding. Moreover, given criticism related to the use of acculturation strategies (Rudmin, 2003), we also present results for heritage and mainstream orientations assessed using continuous measures.
Coding
To ensure high reliability, two independent coders extracted data from all studies. The coders extracted the following information: sample size, sample type (migrants, migrant children/adolescents, international students), percentage of first-generation migrants in the sample, heritage country, country of settlement, percentage of men in the sample, average age of the sample at Time 1, number of measurement waves, lags between measurements, name and reliability of the scales used to measure acculturation, name and reliability of the scales used to measure adaptation, and percentage of participants allocated to each acculturation strategy. Next, all available correlations of interest were extracted. These included correlations between each acculturation strategy and/or orientation between and within each measurement wave with each relevant indicator of adaptation (e.g., Time 1 acculturation and Time 1 adaptation, Time 1 acculturation and Time 2 adaptation, Time 2 acculturation and Time 1 adaptation, Time 2 acculturation and Time 2 adaptation). Two articles reported only standardized regression coefficients. In these cases, the approximate r values were calculated using the formula by Peterson and Brown (2005):

where


The two coders’ categorizations of the included measures showed substantial agreement (Cohen’s κ = .61). All discrepancies were discussed and resolved by the authors of the current article. Additionally, to identify any human error in coding, we used automated functions of Microsoft Excel to compare all the effect sizes and other values extracted by the two coders, and we carefully checked and corrected any discrepancies.
Analytic procedure
Analyses were conducted and reported in two steps. In the first step, we pooled the effect sizes of interest in the robumeta package (Version 2.0; Fisher et al., 2017) for R (Version 4.0.2; R Core Team, 2020), using robust variance estimation as in Study 1. We did so separately for each of the two dimensions of cross-cultural adaptation (i.e., sociocultural and psychological) combined with each of the four acculturation strategies and each of the two acculturation orientations. Importantly, this was done within and between all waves (e.g., Time 1 predictor with Time 1 outcome, Time 1 predictor with Time 2 outcome, Time 1 predictor with Time 3 outcome, Time 2 predictor with Time 1 outcome, Time 2 predictor with Time 3 outcome). Because the results are comprehensive, only a summary is presented in the Results section below (full results can be found in Table S6 in the Supplemental Material).
As in Study 1, we used PET-PEESE and p-curve methods to assess publication bias. Because all pooled effects for each acculturation strategy and each orientation were retrieved from the same set of studies bearing the same amount of bias regardless of which time points were considered, these methods were applied only to cross-sectional correlations within the first time point (i.e., Time 1 acculturation with Time 1 adaptation). Additionally, as part of the first step, we tested moderation effects in a series of meta-regressions. This was done only for integration, heritage-culture orientation, and mainstream-culture orientation because acculturation theory has specified clear predictions as to how these constructs should be related to adaptation (Berry, 2005; Berry & Sam, 1997; Sam & Berry, 2010), and moderation analyses could explain why these relations empirically tend to be weaker than expected. The tested moderators were country of settlement (dummy-coded: traditional settler society, such as the United States or Canada = 1; nonsettler society, such as Germany or Portugal = 0), average age of the sample, percentage of male participants in the sample, percentage of first-generation migrants in the sample, and type of acculturating group (dummy-coded: migrants = 1, sojourners = 0). Each of these moderators was entered separately.
In the second step, which formed the core analysis of this study, we utilized the longitudinal aspect of the data. To do so, we used the metaSEM package (Version 1.2.4; Cheung, 2015) for R to specify meta-analytic cross-lagged panel models (Selig & Preacher, 2009), including all correlations between acculturation at Time 1, Time 2, and Time 3 and adaptation at Time 1, Time 2, and Time 3. Although widely used in longitudinal studies, traditional cross-lagged panel models have been criticized for confounding individual-level change with between-person change, which may lead to inflated cross-lagged coefficients. One solution to this issue consists of using a variant of the cross-lagged panel model including random intercepts (i.e., random-intercept cross-lagged panel model [RI-CLPM]; Hamaker et al., 2015). However, because of its complexity, the RI-CLPM is plagued by problems of identification and convergence (see, e.g., Golec de Zavala et al., 2020). Also, in our case, attempts to reestimate our models as RI-CLPMs failed because of convergence issues. We therefore used the traditional form of the cross-lagged panel model, keeping in mind that the obtained effects over time might be inflated.
Typically, pooled correlations used in multivariate meta-analyses are based on different numbers of studies because of missing data. The two-stage method we used here takes such differences into account so that they do not bias the results (see Cheung, 2015, for technical details). Therefore, missing data in our study were not problematic from an analytic point of view. Still, it is important to note that coefficients for paths from Time 1 to Time 2 of our cross-lagged models tended to have higher precision because more articles reported all study variables at Time 1 and Time 2 than at Time 3 (see Table 4 for an overview and Table S6 for exact ks).
Ranges of Pooled Correlational Effects in Study 2
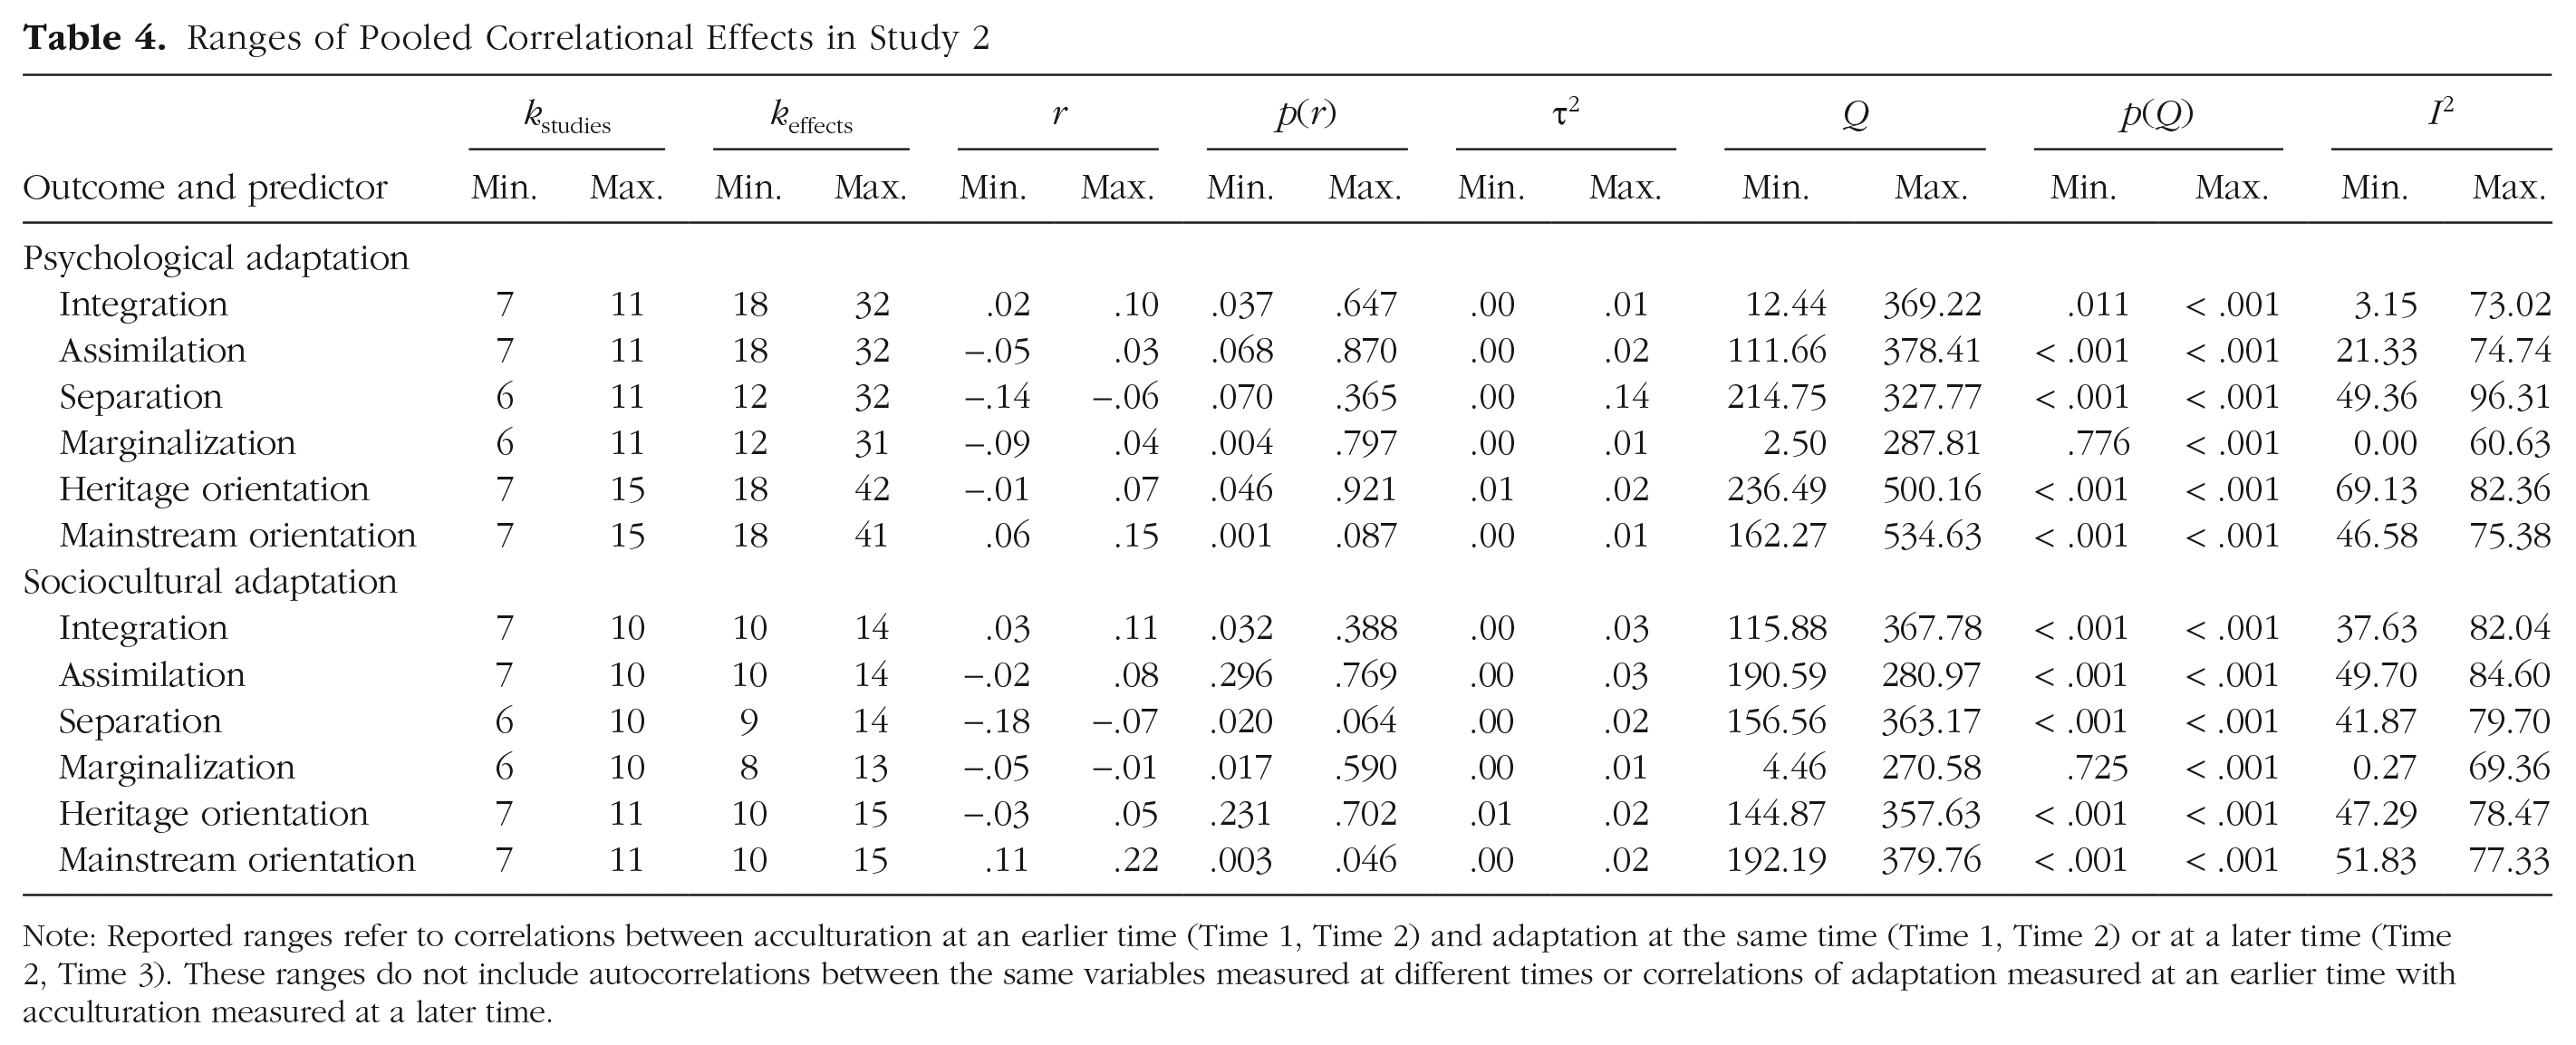
Note: Reported ranges refer to correlations between acculturation at an earlier time (Time 1, Time 2) and adaptation at the same time (Time 1, Time 2) or at a later time (Time 2, Time 3). These ranges do not include autocorrelations between the same variables measured at different times or correlations of adaptation measured at an earlier time with acculturation measured at a later time.
Results
Cross-sectional results
Across those samples for which we could obtain information on acculturation strategies, 69.45% of the participants were categorized as integrated, 9.60% as assimilated, 17.18% as separated, and 3.73% as marginalized. Consistent with the correlations found in Study 1, all pooled correlations between acculturation (strategies and orientations) and adaptation obtained in this analysis were weak (Table 4). Most correlations were in the direction predicted by acculturation theory. For instance, integration and mainstream-culture orientation were positively but weakly correlated with both dimensions of adaptation, and most correlations of heritage-culture orientation with psychological adaptation were positive (except for two rs = −.01). Additionally, separation was consistently negatively and weakly associated with both dimensions of adaptation, whereas for assimilation and marginalization, we found both positive and negative weak correlations. Sensitivity analyses showed that pooled effects remained stable under different assumed strengths of within-cluster effect correlation ρ (i.e., ρ = .02, ρ = .04, ρ = .06, ρ = .08, and ρ = 1; see Table S7 in the Supplemental Material).
In the 12 PET-PEESE analyses, all PET intercepts were nonsignificant at an α of .10, indicating that the true unbiased effects of the four acculturation strategies and the two acculturation orientations on adaptation may not be different from zero. Because PET-PEESE analyses are known to underperform when there is substantial between-studies heterogeneity (in our case, I2 > 50% in 10 out of 12 analyses) and k < 20 (Stanley, 2017), we decided to use the uncorrected estimates for further analyses. Except for the following two tests, p-curve analyses indicated evidential value (see Fig. S2): the association of separation with sociocultural adaptation (power of .08) and the association of marginalization with psychological adaptation (power of .23). Because of the low power of these two p-curves, we refrained from interpreting the respective results. Note as well that p-curve analyses could not be conducted for the associations of marginalization with sociocultural adaptation and the associations of heritage orientation with sociocultural adaptation because, in each of these cases, the data set included only two statistically significant effects. (For detailed PET-PEESE and p-curve analyses, see Table S8 and Figure S2 in the Supplemental Material.)
We next tested for moderation. Several moderation effects were significant according to p values. However, none of them were consistent across waves, and in all cases, their confidence intervals (CIs) had at least one boundary very close to zero, suggesting that these effects should be interpreted with caution. For example, representative of this inconsistency, the greater the percentage of male participants in a sample, the weaker the positive effect of mainstream-culture orientation at Time 1 on psychological (β = −0.01, p = .030, 95% CI = [−0.017, −0.001]) and sociocultural (β = −0.01, p = .029, 95% CI = [−0.020, −0.002]) adaptation at Time 3. However, this effect was found only between Time 1 and Time 3 and not between the remaining measurement waves. Because moderation results generally were inconclusive, they are presented in Table S9 in the Supplemental Material.
Cross-lagged results
Finally, we conducted cross-lagged meta-analyses, controlling for autoregressions. Twelve different models were specified, in which each of the two dimensions of cross-cultural adaptation (sociocultural and psychological) were considered separately, combined with each of the four acculturation strategies and each of the two acculturation orientations. Figures 2 and 3 illustrate the main results (further details can be found in Table S10 in the Supplemental Material). Most lagged associations found in these analyses were weak or very weak. Integration and marginalization had inconsistent effects on adaptation between waves (i.e., positive from Time 1 to Time 2, negative from Time 2 to Time 3, negative at both lags for integration and psychological adaptation), but these effects were close to zero, so any change of sign might be considered irrelevant. Assimilation predicted adaptation positively, whereas separation predicted adaptation negatively. In particular, although weak by conventional standards, the effect of Time 1 separation on Time 2 sociocultural adaptation (β = −0.13) was the strongest lagged effect found in this analysis. Heritage-country orientation had negative associations and mainstream-culture orientation positive associations with adaptation over time; however, most of these associations approached zero, except for the effect of mainstream-culture orientation at Time 2 on sociocultural adaptation at Time 3 (β = 0.09), the second-strongest lagged effect in this analysis.
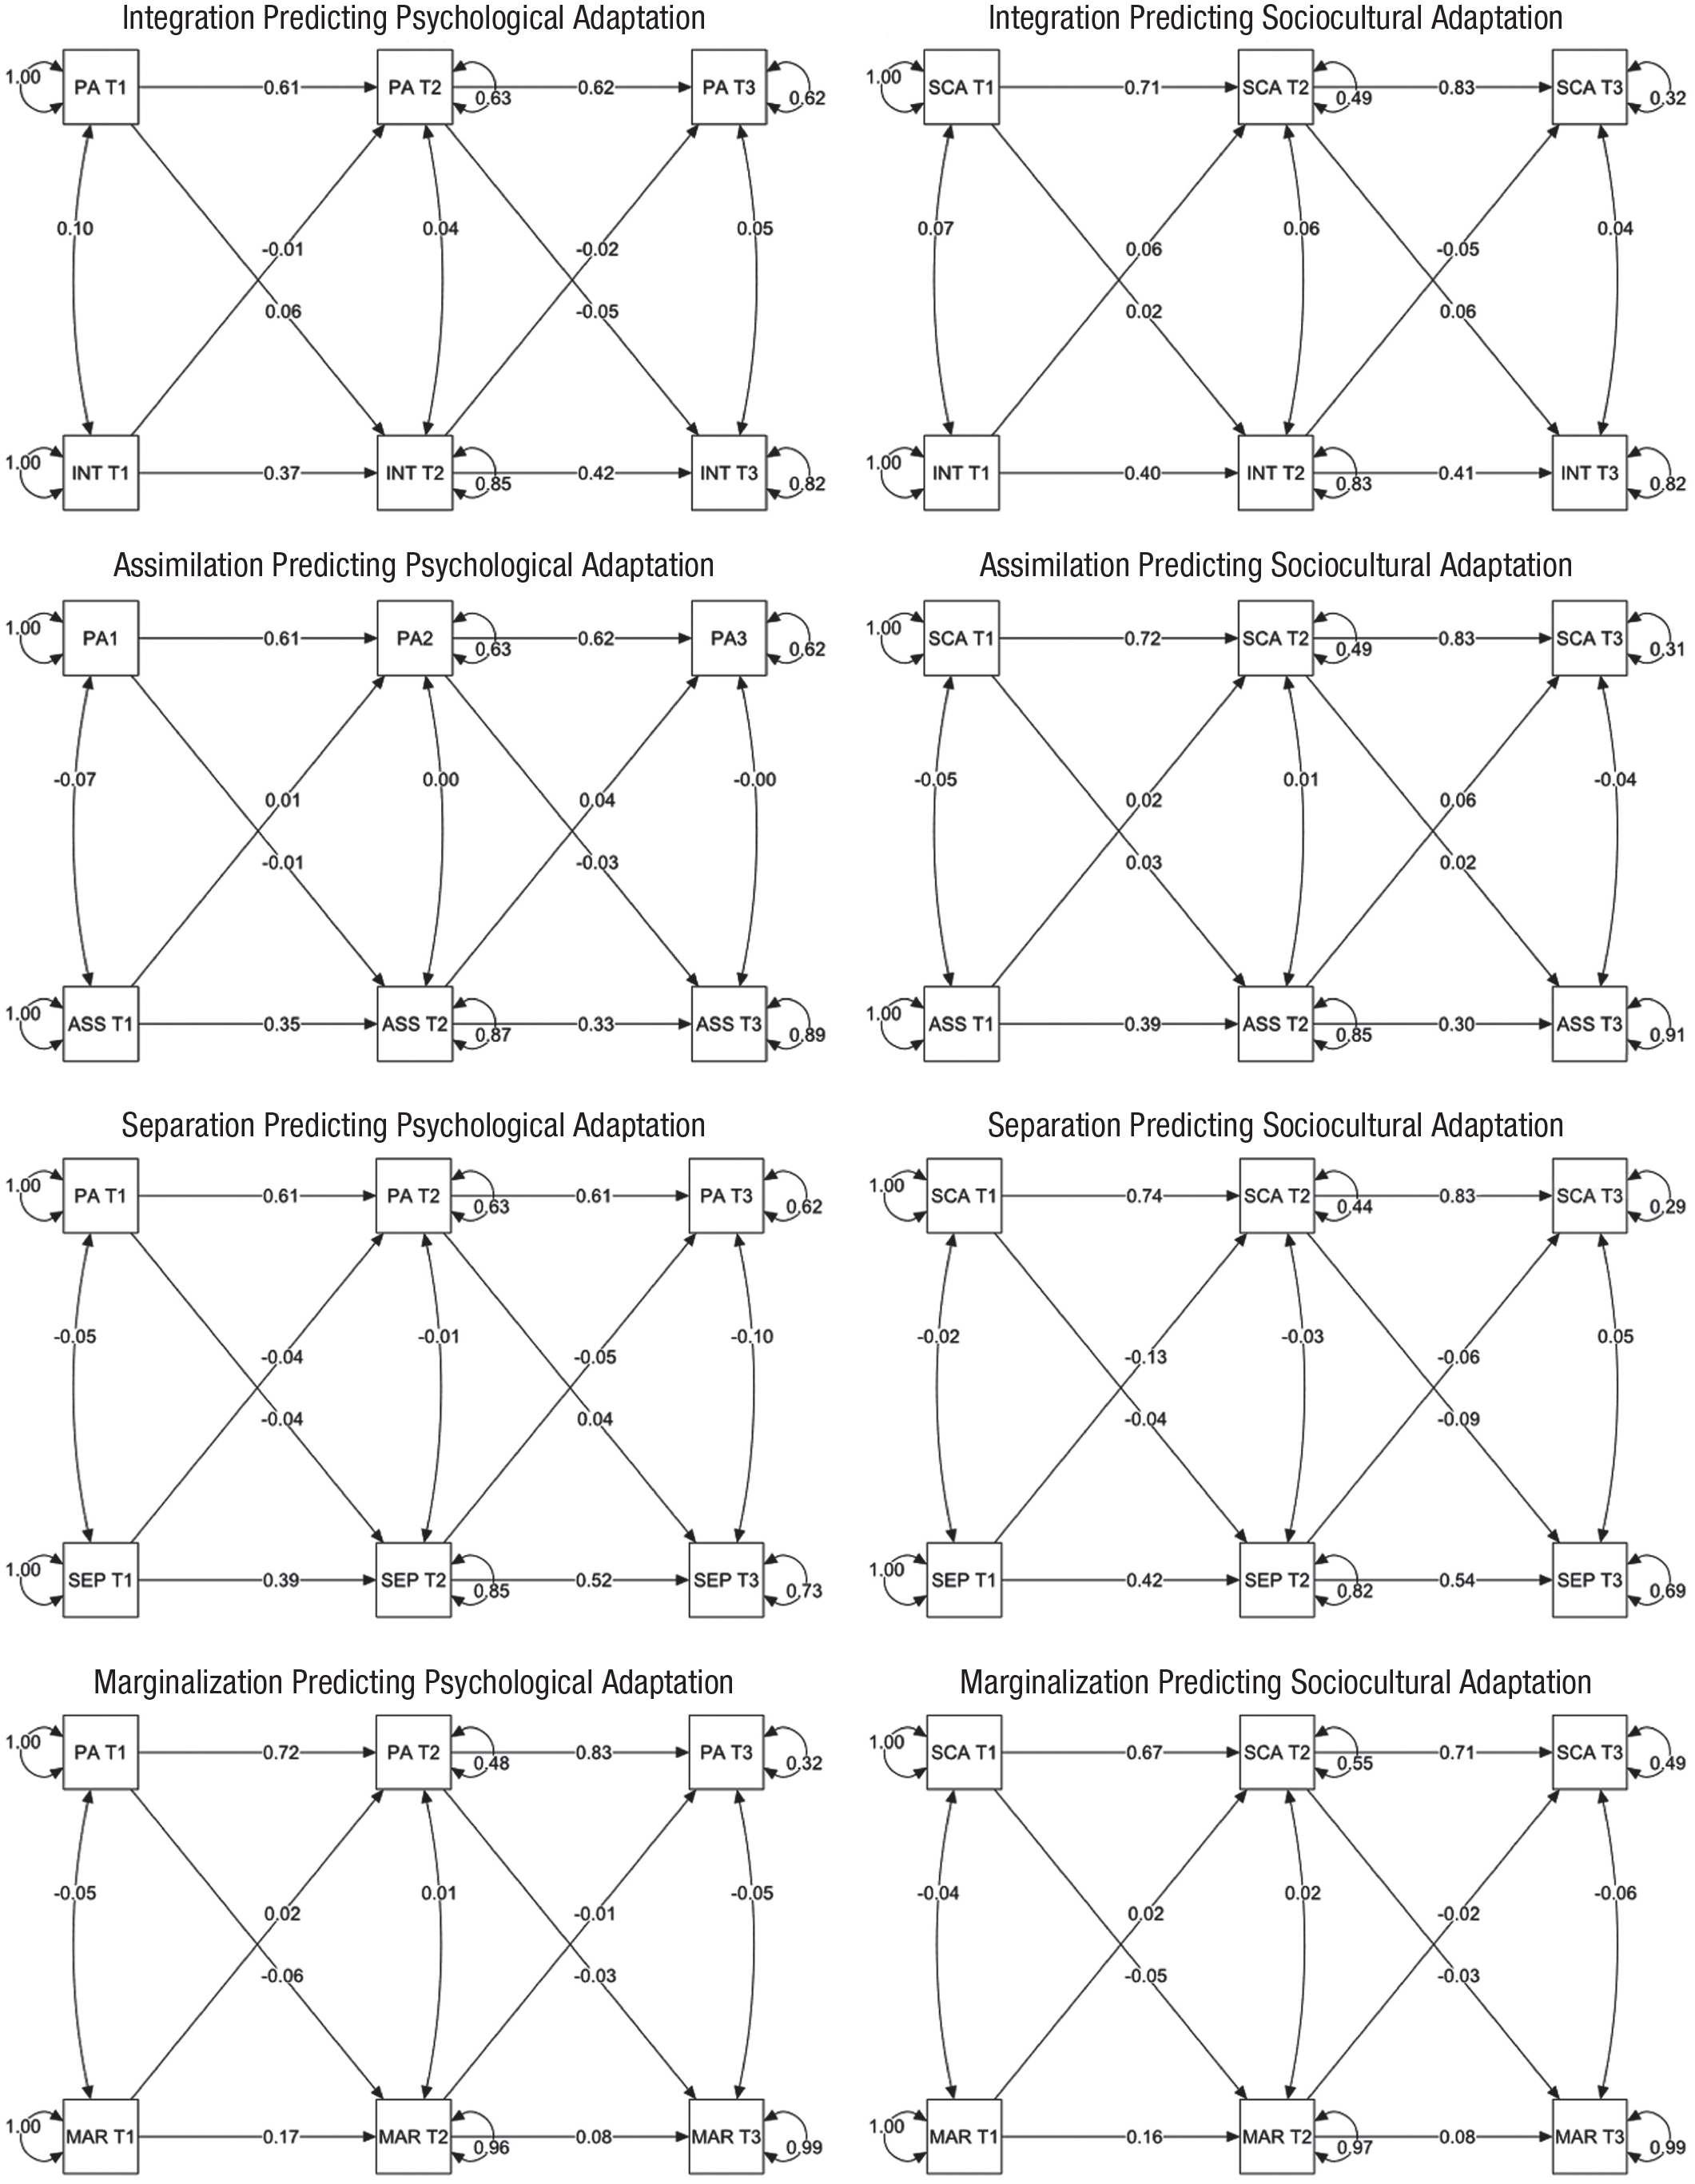
Results from cross-lagged panel models showing longitudinal effects of acculturation strategies in Study 2. Each model shows associations between a single strategy and either psychological adaptation (PA; left column) or sociocultural adaptation (SCA; right column) both between and within each time point (T). The four strategies are integration (INT), assimilation (ASS), separation (SEP), and marginalization (MAR). Double-headed arrows pointing toward two different variables refer to correlation (at Time 1) or residual correlation (at Time 2 and Time 3). Double-headed arrows pointing toward the same variable refer to variances (at Time 1) or residual variances (at Time 2 and Time 3). Single-headed arrows refer to directional effects of a variable measured at an earlier time on a variable measured at a later time.
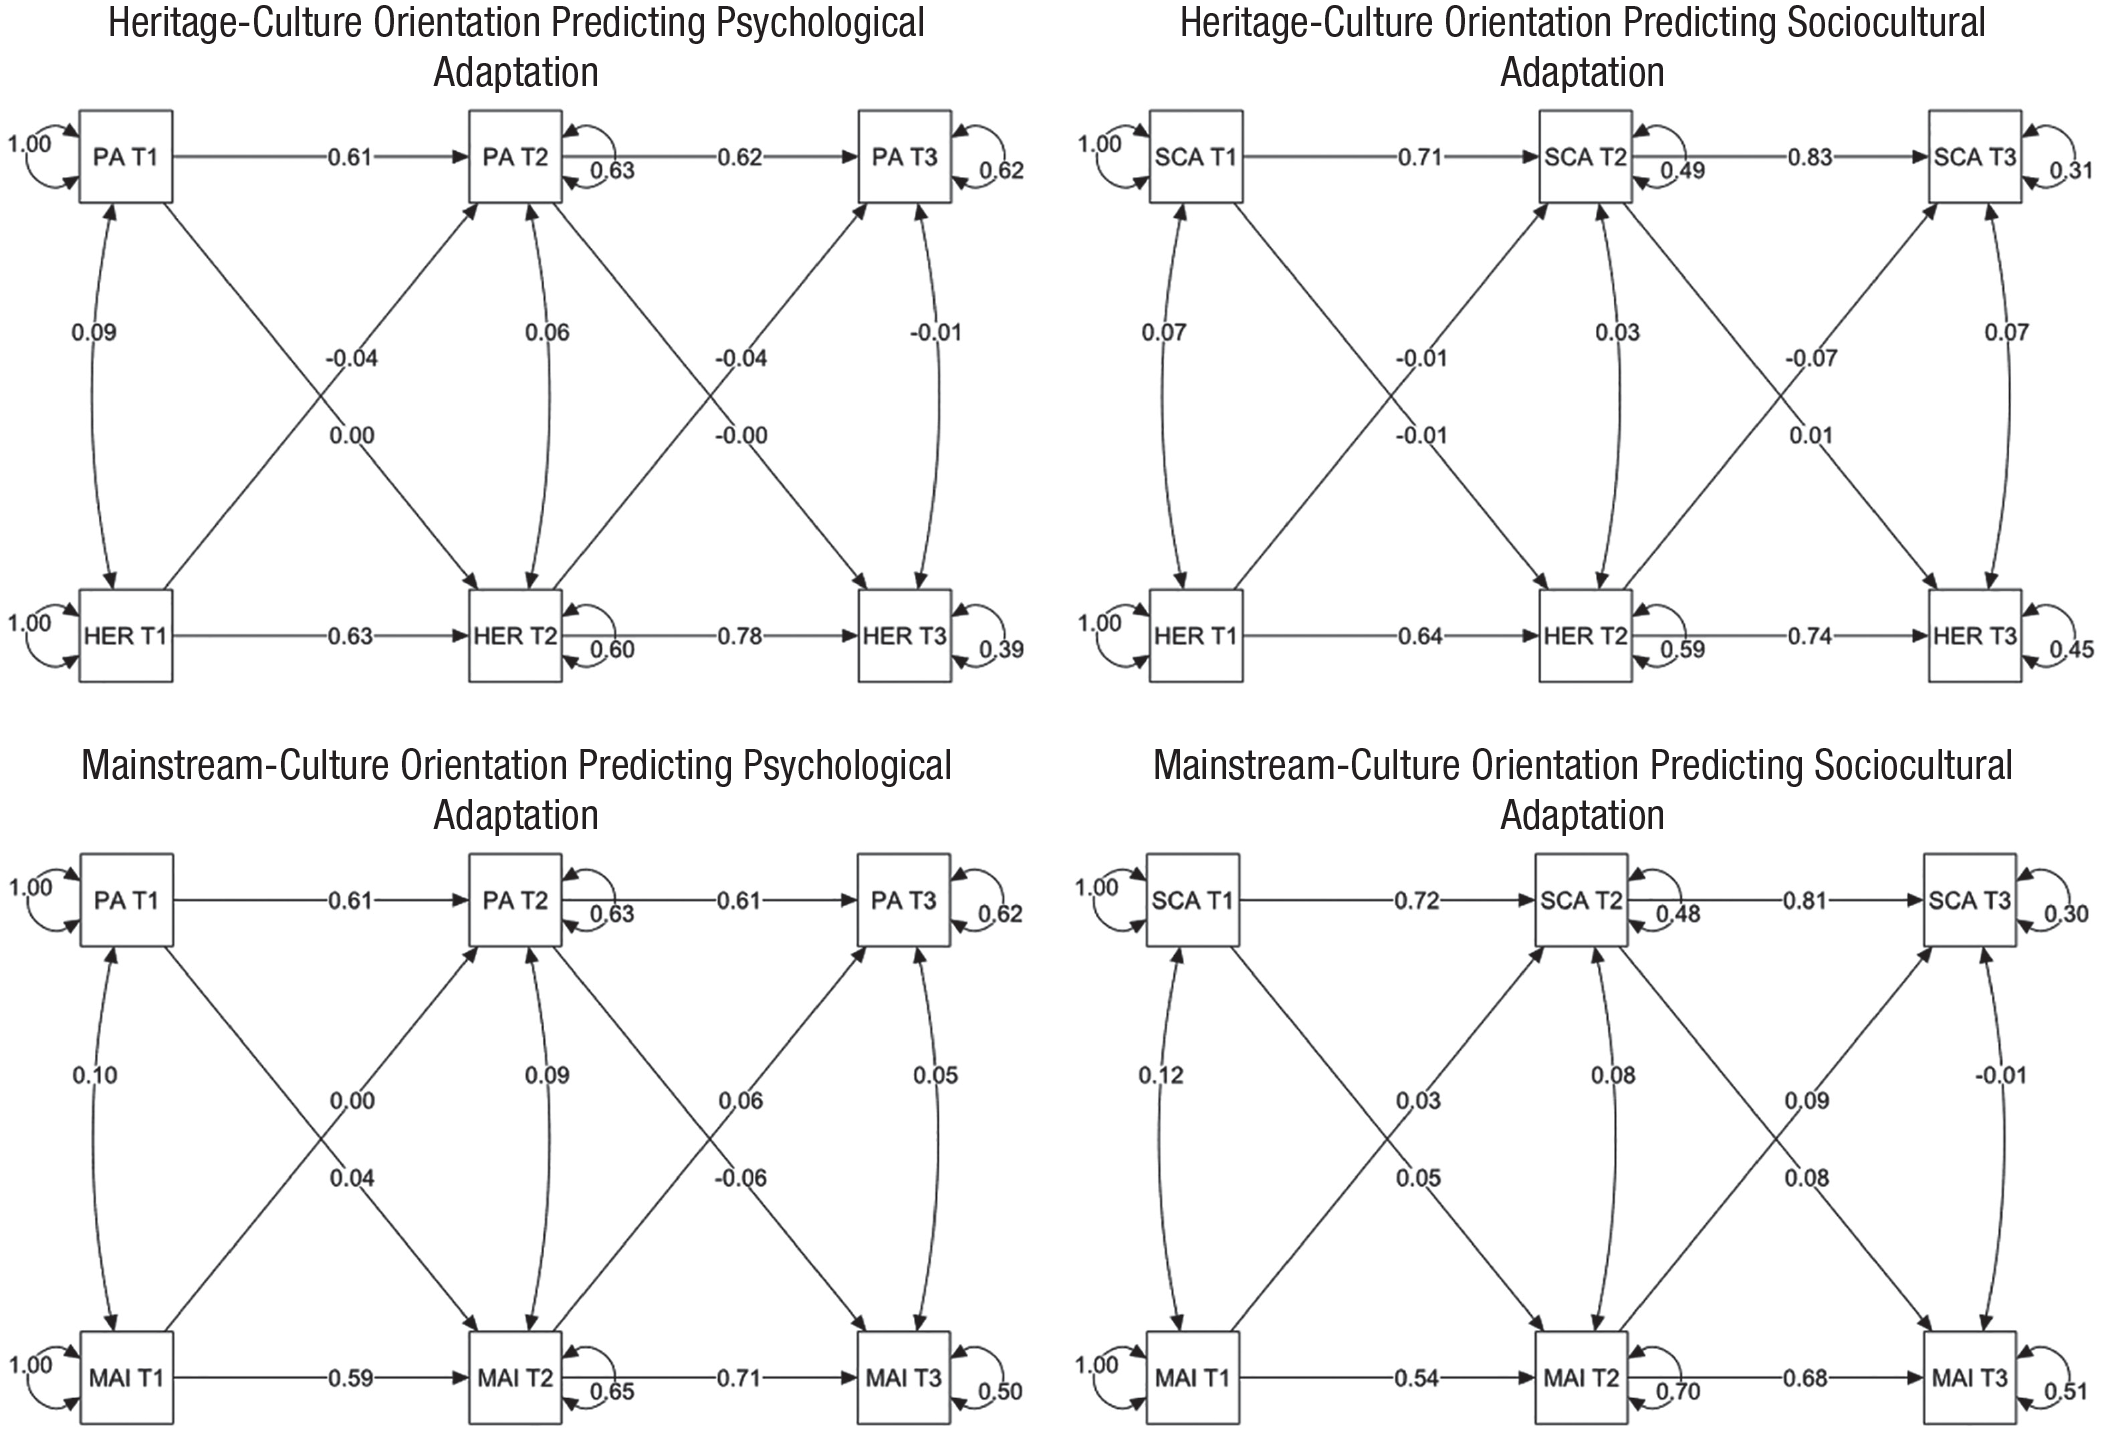
Results from cross-lagged panel models showing longitudinal effects of acculturation orientations in Study 2. Each model shows associations between a single orientation and either psychological adaptation (PA; left column) or sociocultural adaptation (SCA; right column) both between and within each time point (T). The two orientations are heritage-culture orientation (HER) and mainstream-culture orientation (MAI). Double-headed arrows pointing toward two different variables refer to correlation (at Time 1) or residual correlation (at Time 2 and Time 3). Double-headed arrows pointing toward the same variable refer to variances (at Time 1) or residual variances (at Time 2 and Time 3). Single-headed arrows refer to directional effects of a variable measured at an earlier time on a variable measured at a later time.
Discussion
As in Study 1, cross-sectional results suggested weak and mostly heterogenous but relatively consistent relationships between acculturation and adaptation. Yet in cross-lagged analyses, most of these effects became inconsistent and approached zero. For instance, integration sometimes had a very weak positive effect on adaptation and at other times a very weak negative effect on adaptation. Only two effects seemed noteworthy, judging by their effect size: Separation seemed to be socioculturally maladaptive, whereas higher mainstream-culture orientation seemed to be socioculturally adaptive. Yet it is important to keep in mind that the variance in sociocultural adaptation explained by these variables was less than 1.7% and 0.8%, respectively, and that cross-lagged designs tend to inflate such effects (Hamaker et al., 2015).
It should be noted that given the general reliance on correlational data in the study of acculturation, our longitudinal meta-analysis was based on a limited number of studies, and there was an overrepresentation of migrant children and adolescents as well as international students. In moderation analyses, the results were relatively consistent across sample age, population types (sojourners, migrants), and immigrant generations. Still, these variables offer only approximate insights into participants’ stage of migration, and it is possible that more fine-grained assessments would have provided different insights. For instance, one could argue that acculturation may play more of a role at the early stages of migration and may become less relevant for adaptation at later stages when other factors exert more of an influence (e.g., after migrants have already learned the mainstream language and established their social networks).
General Discussion
How immigrants and minority-group members acculturate has commonly been assumed to influence how well they do psychologically and socioculturally (Berry & Sam, 1997; Sam & Berry, 2006, 2010). Integration in particular is regarded as an adaptive strategy (Berry, 1997). Yet our reanalysis of a previous, primarily correlational meta-analysis and a new longitudinal meta-analysis suggest that the role of acculturation for adaptation may be limited at best.
In a world in which virtually every modern society is culturally diverse, our findings have considerable implications. Given the limited evidence that individual acculturation styles directly influence adaptation, it may be more productive for policymakers, practitioners, and scholars to understand and approach minority-group members’ adaptation in terms of well-established contextual factors such as discrimination, language barriers, and social support than in terms of individual acculturation orientations and strategies. This generally puts more of the burden of successful adaptation on the receiving societies than on migrants themselves. Future studies could directly compare the strength of contextual and individual causal effects. More importantly, given that different types of acculturation strategies (including integration) may elicit negative responses by majority-group members (e.g., Kunst et al., 2019; Piontkowski et al., 2002) and the presence of high heterogeneity in both studies, systematic investigations of how contextual factors in interaction with individual acculturation styles causally predict adaptation may still offer valuable insights. The contribution of further correlational research to this endeavor can be regarded as small. The field of acculturation should move on to primarily relying on investigations that utilize experiments as well as rigorous longitudinal methods. As this research demonstrates, such studies are needed to validate even the most basic premises of acculturation theory that are commonly taken for granted.
Footnotes
Transparency
Action Editor: Kate Ratliff
Editor: Patricia J. Bauer
Author Contributions
The two authors share joint first authorship. K. Bierwiaczonek and J. R. Kunst collected the data. K. Bierwiaczonek conducted the analyses, and J. R. Kunst provided critical feedback. J. R. Kunst drafted the introduction and Discussion sections. K. Bierwiaczonek drafted the Method and Results sections. Both authors revised the manuscript and approved the final version for submission.
References
Supplementary Material
Please find the following supplemental material available below.
For Open Access articles published under a Creative Commons License, all supplemental material carries the same license as the article it is associated with.
For non-Open Access articles published, all supplemental material carries a non-exclusive license, and permission requests for re-use of supplemental material or any part of supplemental material shall be sent directly to the copyright owner as specified in the copyright notice associated with the article.