
Abstract

In our current efforts to understand how psychological phenomena arise from brain activity, neural oscillations have taken center stage. A wide range of findings has linked modulations of oscillatory power, phase, and frequency to various cognitive functions, such as attention, language, and memory (Wang, 2010). Exciting new research has recently focused on the developmental origins and trajectories of neural oscillations—how does the neural oscillatory landscape emerge over development (Schaworonkow & Voytek, 2021), and how do the relationships between oscillations and cognitive function in the adult brain come about?
A recent study published in this journal by Köster et al. (2019) has provided a transformative investigation into a core question—whether infant brain “proto-rhythms” already serve a function similar to those of their adult counterparts. The authors built on findings that increased theta power (~4–8 Hz) and decreased alpha power (~8–13 Hz) accompanies the processing of novelty, or “unexpectedness,” in the adult brain. They recorded 38 infant electroencephalograms (EEGs) with the aim of studying whether infant theta rhythms (~4 Hz) and alpha rhythms (~6 Hz) similarly signal the detection of unexpected events.
Infants watched image sequences of actions that concluded with either an expected or an unexpected outcome. EEG spectral analysis provided partial support for a similar sensitivity of infant and adult brain rhythms to unexpected outcomes: Köster et al. reported a 4-Hz (infant theta) power increase in response to unexpected outcomes. This effect mirrored the findings from adult EEG recordings, although no effect was found for 6-Hz (infant alpha) power. 1
Köster et al. used frequency tagging to drive periodic brain responses (e.g., Baldauf & Desimone, 2014), generating frequencies in the infants’ theta and alpha frequency ranges by flickering the image sequences at either 4 Hz or 6 Hz. They assumed that the rhythmic visual stimulation (“flicker”) entrained endogenous neural theta and alpha oscillations. Critically, this assumption underlay their interpretation of the band-limited difference between the responses to expected and unexpected outcomes: Given that theta entrainment took place, the observed difference in oscillatory power must have reflected an effect on infant theta oscillations, in line with theta’s postulated sensitivity to violations of expectations.
Here, we argue that both the assumption of entrainment in the first place and the consequent interpretation of band-limited power differences as modulations of entrained oscillations could be versions of the Fourier fallacy (Jasper, 1948), that is, premature interpretations of frequency-domain effects in terms of oscillatory activity.
Rhythmic visual stimulation leads to a continuous series of cortical responses. These steady-state visual evoked potentials (SSVEPs; Norcia et al., 2015) could stem from either a genuine entrainment of endogenous oscillations (Thut et al., 2011) or a cortical “tracking” of stimulus dynamics that does not involve endogenous oscillations (Capilla et al., 2011). Crucially, a spectral analysis of the neural signal is fundamentally limited in making this distinction (Obleser & Kayser, 2019; see, e.g., Thut et al., 2011, for additional approaches to distinguish these accounts). Although the distinction seems subtle, it is critical from a mechanistic perspective: We cannot readily ascribe the functional aspects of infant theta-band oscillations to a 4-Hz SSVEP only because the two coincide spectrally, as we have no way of knowing whether theta-band neural oscillations contributed to the observed signal.
Additionally, impulse-like event-related potentials (ERPs) manifest as low-frequency EEG power transients, despite arising from signals that may or may not be related to neural oscillations (Herrmann et al., 2005). In the present context, unexpected stimuli elicit a more pronounced ERP—termed “Nc”—than expected stimuli in infant EEGs (Kayhan et al., 2019; Kopp & Lindenberger, 2011; Monroy et al., 2019). The Nc, a negative deflection peaking at frontocentral scalp sites roughly 500 ms after stimulus presentation, is likely to have a low-frequency spectral signature and could thus be interpreted as an oscillation.
The goal of this Commentary is thus to provide a concrete example of the Fourier fallacy using a simple numerical simulation. Simulation is a powerful tool; it allows full control over the input to the spectral analysis, so we can test our intuitions about what ground-truth mechanism could have generated a given pattern of results. Here, we asked whether the superposition of the SSVEP with a fundamentally nonoscillatory brain signal, the Nc, might still manifest as a band-limited effect observable only under the theta- but not alpha-stimulation conditions.
In brief, we added a simplified Nc-like component to equally simplified SSVEP-like signals that faithfully represented the stimulus rhythm (flicker) in the 4-Hz and 6-Hz stimulation conditions (see Method). At no point was the power of an “oscillation” manipulated. We then tested how the larger visual evoked response following unexpected outcomes than expected outcomes translated to the time-frequency domain using the analysis pipeline of Köster et al. We expected that the Nc effect would be expressed as a greater modulation of theta- than alpha-band activity.
Although our simulation did not involve modulating oscillatory (SSVEP) power, our results bear close qualitative similarity with the effects reported by Köster et al. For unexpected outcomes, we observed a frequency-selective theta-power increase during theta stimulation but not alpha stimulation (Fig. 1). Our simulation is agnostic to whether the SSVEP more generally reflects stimulus-driven tracking responses or entrained endogenous oscillations. However, its results call into question whether theta-range SSVEPs need necessarily be sensitive to violations of expectations, as would be expected if they were entrained endogenous theta oscillations. We can therefore provide a potential alternative explanation for Köster et al.’s results that does not require entrainment.
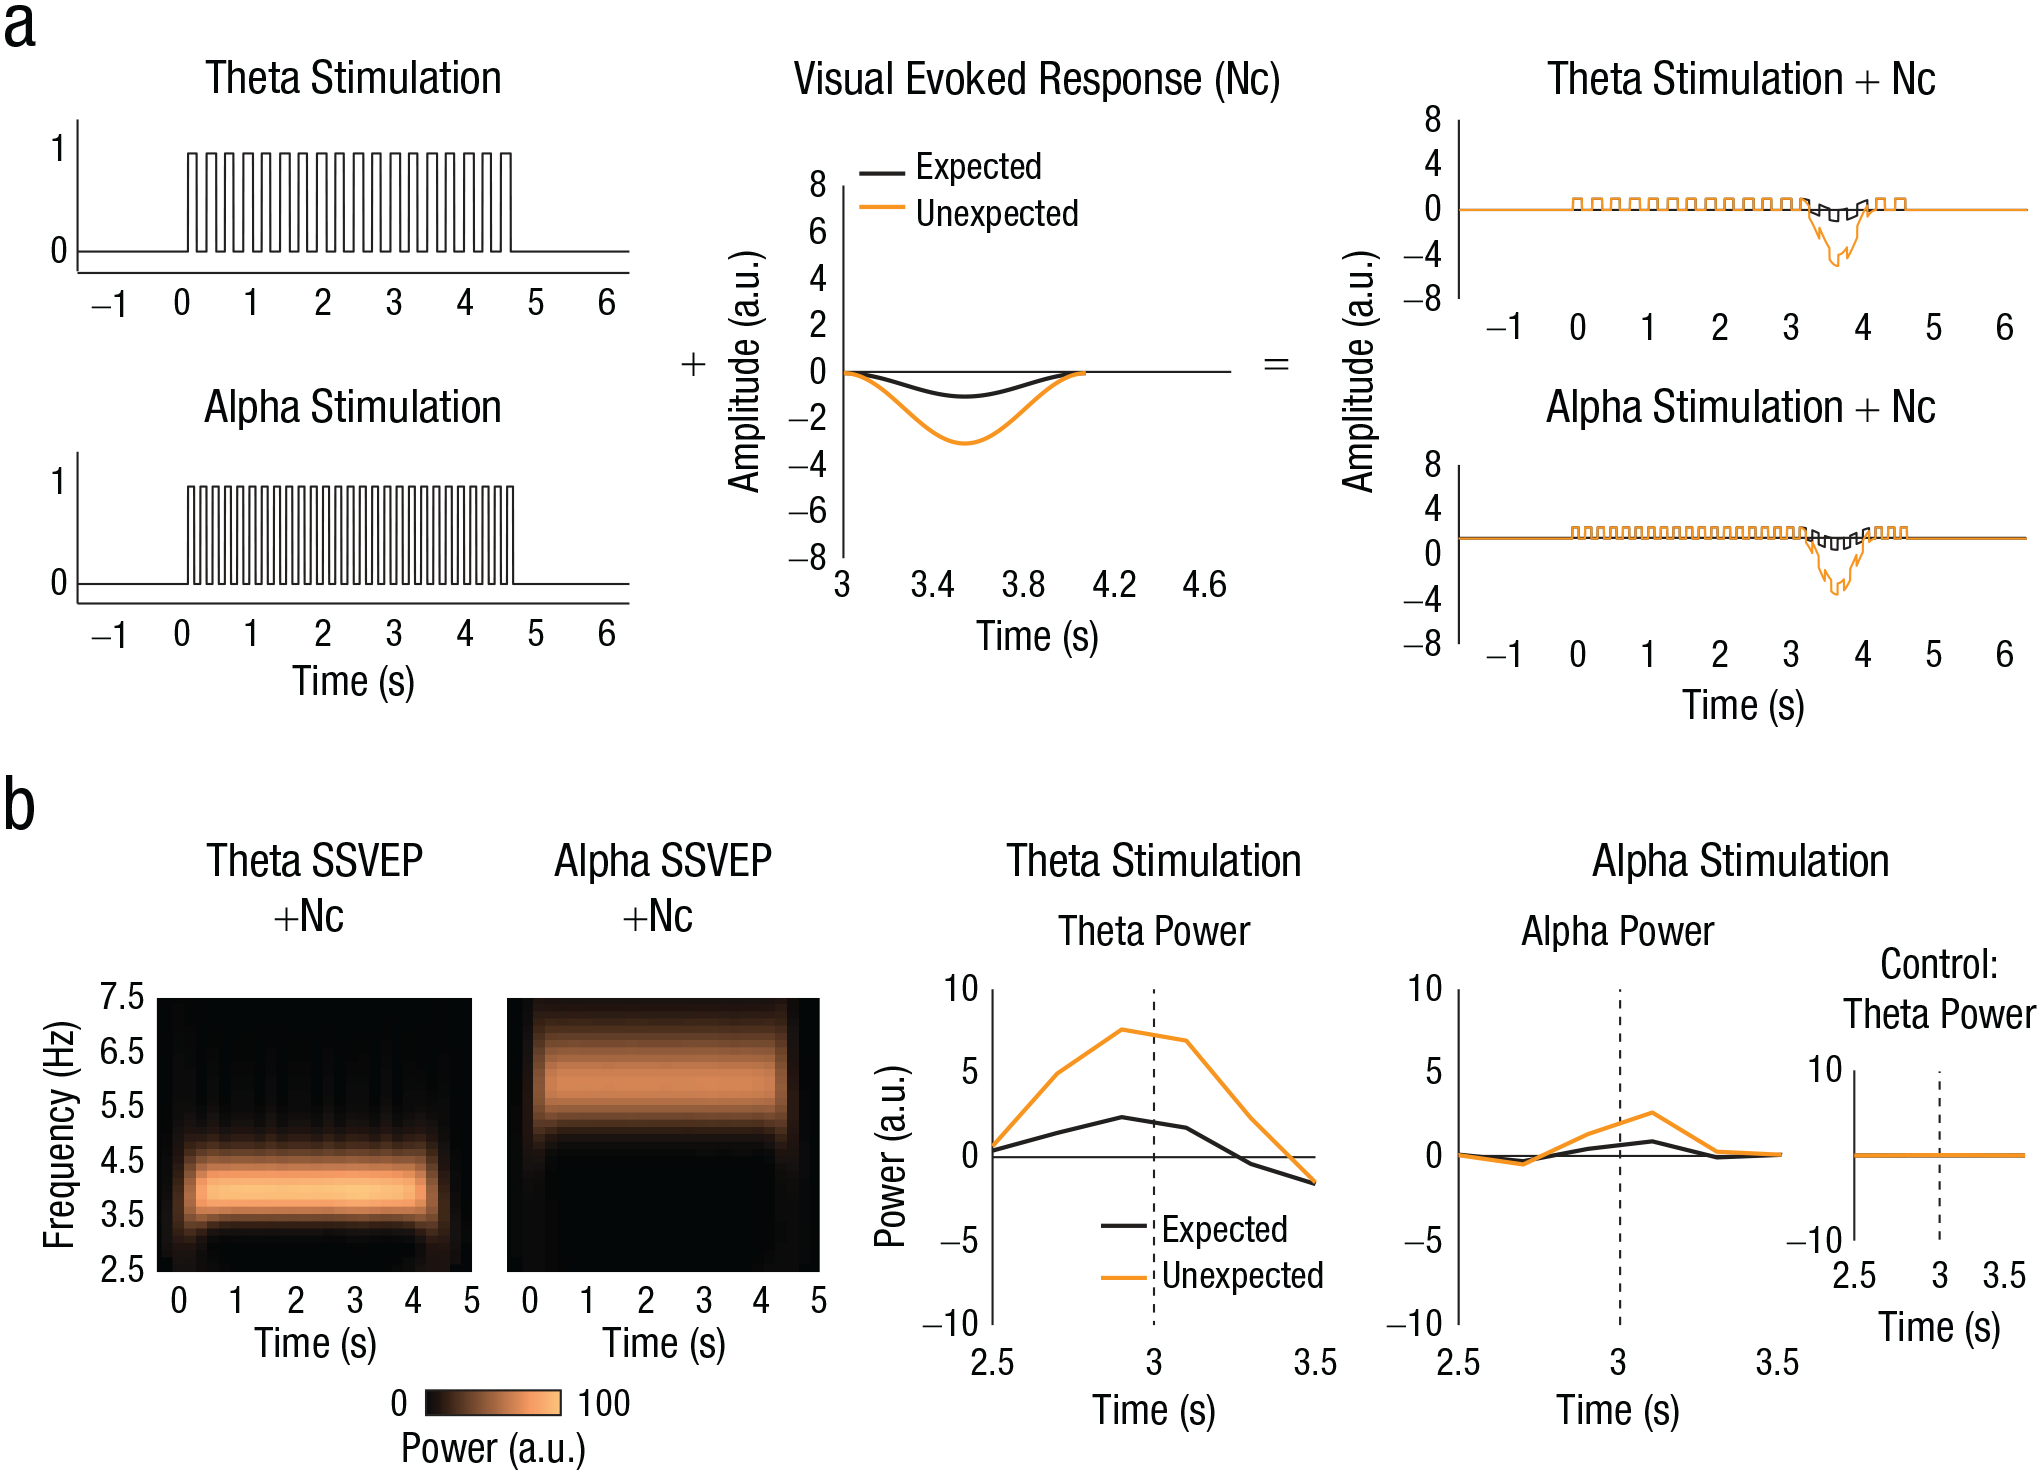
Methodology (a) and (b) results of the current study. Our model is shown in (a). We first generated a signal that had the identical temporal structure as the visual stimulation in the 4-Hz theta-stimulation (top left) and 6-Hz alpha-stimulation (bottom left) conditions (“on” periods as 1s and “off” periods as 0s). This representation is agnostic to whether a “neural” signal would be entrained or instead simply track the stimulus rhythm. We then simulated a very simple prototype visual evoked response (Nc) modeled after what has previously been observed in infants (middle, where the graph shows waveforms in response to both expected and unexpected stimuli). We assumed a larger response to unexpected than to expected outcomes. We added the two signals together (right). This additive model does not assume any modulation of oscillatory power or interaction between the two signals (steady-state visual evoked potential [SSVEP] and Nc), and results in similar amplitudes for the theta- and alpha-stimulation conditions. Applications of this model to the data of Köster et al. (2019) are shown in (b). The time-frequency plots (left) show power in the alpha and theta frequency bands, respectively, for our additive model when the analysis from Köster et al. (2019) is applied. The graphs (right) show power in response to the expected and unexpected outcomes, separately for the alpha- and theta-stimulation conditions. The inset shows results from the same theta-power control analysis as run by Köster et al. a.u. = arbitrary units.
We wholeheartedly agree with Köster et al. that oscillatory aspects of neurodevelopment are an exciting research avenue. We do not dispute that entrainment of endogenous oscillations remains a viable explanation for the observed time-frequency results here and in other studies using frequency tagging. However, we issue a word of caution on overconfidently interpreting these and similar results as reflecting modulation of entrained endogenous brain rhythms. Researchers who study infants and adults alike may find it worth considering the more mundane alternative of a stimulus-evoked tracking response absent any involvement of neural oscillations.
Method
A simple numerical simulation helped us to illustrate our perspective on Köster et al.’s data. We emphasize that it was not the purpose of the simulation to reproduce the original EEG data, although we purposefully modeled our figure after Köster et al.’s Figure 2 in order to facilitate a qualitative comparison of our simulated results with their findings.
The simulation code, written in MATLAB (The MathWorks, Natick, MA), is publicly available on OSF at https://osf.io/c9urf and can be used to explore the parameter space further. For implementing the data-analysis pipeline, we made use of the FieldTrip toolbox (Oostenveld et al., 2011).
First, we created two surrogate “EEG” time courses that strictly reflected the periodicity of the visual stimulation. We assumed the simplest case (i.e., the time course of the stimulation itself) and modeled responses to stimulus “on” periods as 1s and “off” periods as 0s. We did this separately for the theta-stimulation (4 Hz) and alpha-stimulation (6 Hz) conditions. This construction was agnostic to whether visual stimulation entrained endogenous neural oscillations or drove evoked tracking activity. Our simulation was highly artificial in the sense that the brain response will obviously not resemble a square wave. In fact, SSVEPs can approach a sinusoidal waveform, depending on physical properties of the stimulation (Norcia et al., 2015). However, for the present simulation, the waveform shape is irrelevant because any waveform with a periodicity at x Hz in the time domain will produce a peak at x Hz in the spectral domain. Thus, here we chose to simply mimic the exact time course of the stimulation itself without making assumptions about how the infant brain response might look.
Next, we simulated transient visual evoked responses to expected and unexpected stimuli. The component of the evoked response that is most commonly related to the unexpectedness of a visual stimulus is known as Nc (Kayhan et al., 2019; Kopp & Lindenberger, 2011; Monroy et al., 2019). We simulated a prototypical slow ERP component (Nc) in the most assumption-free way we could imagine, as a Hann window with a total duration of 1 s. We used exactly the same response time course for the expected and unexpected “outcomes” but increased the amplitude of the unexpected response to be three times larger than that to the expected response (the most extreme amplitudes for Ncs for the expected and unexpected outcomes were −1 and −3, respectively). Note that the typical amplitude difference between the two responses would be around 50%. We chose this exaggerated effect for emphasis in visualizations. The exact value of the modulation is of no consequence for the simulation because identical Ncs (including identical modulations) were used in simulating responses to the theta- and alpha-stimulation conditions.
We then produced four additive time courses in total, reflecting the original design of the experiment: We added the Nc-like evoked response to expected events to 4-Hz and 6-Hz tracking signals, separately, and repeated this procedure for the evoked response to unexpected events. This additive model does not assume any enhancement of oscillations at any particular frequency but yields time courses with equivalent amplitudes for the theta- and alpha-stimulation conditions (Fig. 1a). It is worth pointing out that the additive nature of the model precludes any nonlinear interaction between SSVEPs and Ncs in our simulation.
We submitted the added time courses to a time-frequency analysis using the parameters provided by Köster et al. (apart from the time resolution, for which there was no information in their Method section; we used 200 ms). We then created time-frequency plots (averaged over the expected and unexpected conditions), as well as summary plots showing theta and alpha time courses separately for the expected- and unexpected-outcome conditions (baseline corrected as in the original study by subtracting the average power between 1.5 s and 2.5 s with respect to the onset of the flicker stimulus), as in Köster et al. (Fig. 1b).
We note that our “toy” example has only a few free parameters: magnitude of the SSVEP and (absolute and relative) magnitudes of the Ncs. The temporal properties of our simulated SSVEPs were fixed by the design of Köster et. al.’s study. The morphology of the Nc was chosen on the basis of previous literature (Webb et al., 2005) and intended to minimize assumptions. Because of the additive nature of our approach, changing any of these parameters within reason will not lead to qualitatively different results. In fact, in the publicly available code (and Fig. S1 at https://osf.io/nwkj3), we provide the option to test an example case of a differently modeled (and somewhat more complex) Nc, which produces the same results. Corresponding documentation and materials can be found on OSF (https://osf.io/c9urf).
Results
Modeling
Our “toy” model makes a minimal number of assumptions but qualitatively reproduces the main findings from Köster et al. Most importantly, our model does not incorporate any modulation of band-limited theta (or alpha) power. Here, we explain in more detail how we arrive at similar conclusions nonetheless. Essentially, we show that our observed pattern of results arises from constructive or destructive wave interference between SSVEP and Nc, with a crucial role for the Nc amplitude difference between presentations of the expected- and unexpected-outcome stimuli.
Köster et al. report a theta-power increase during 4-Hz stimulation (infant theta range), whereas a similar effect on theta power was absent during 6-Hz stimulation (alpha range) in a control analysis. Our simulation found that both effects also arose in the spectral representation of the linear summation of 4-Hz or 6-Hz SSVEPs and the Nc, respectively.
First, note that the Nc has a higher spectral energy at 4 Hz than at 6 Hz, meaning that it bears more resemblance to a (partial) 4-Hz than a 6-Hz wave at the time of its occurrence (see Fig. S2 at https://osf.io/nwkj3). In the case of 4-Hz stimulation, Nc and SSVEP superpose optimally, giving the unexpected-outcome condition a boost because it produces a greater Nc than the expected-outcome condition.
Second, note that the control result—the absence of a theta-power (4-Hz) increase during 6-Hz stimulation—stems from a special case. In contrast to the two main analyses—theta power during theta-range stimulation and alpha power during alpha-range stimulation—the control analysis looks into one frequency range (theta) whereas the 6-Hz stimulation drives an SSVEP in the other (alpha). Because the spectro-temporal decomposition separates SSVEP and Nc in the frequency domain, we see only the spectral representation of the Nc in the theta range. This spectral separation blinds us to the effects of wave interference between SSVEP and Nc that take place in the alpha range.
Model limitations
Our results depend on the Nc effect being modeled in terms of the unexpected outcome being larger than the expected outcome, as reported by Webb et al. (2005), Kayhan et al. (2019), Kopp and Lindenberger (2011), and Monroy et al. (2019). Yet findings regarding Nc modulation remain equivocal, with some studies showing the opposite effect (Reid et al., 2009). However, polarity, and thereby whether a perturbation manifests as an enhancement or a suppression in the time-frequency domain, is influenced by the choice of reference as well as the choice of baseline in EEG analysis. Moreover, polarity of some important ERP components has been shown to reverse during development (Ruhnau et al., 2013). Thus, we would exercise caution in overpredicting the exact relationship between the direction of the ERP effect and the direction of the time-frequency-domain effect.
Also note that the results of our simulation derive from the spectral properties of our simplistic Nc model. This model does not fully take into consideration the more complex morphology of the real-world stimulus-evoked response that includes the Nc as one component (Webb et al., 2005). Other waveform aspects not explored here may provide alternative accounts with similar results. In a similar vein, our model does not take into account the actual occurrence of truly endogenous, not necessarily entrained theta-band oscillations. Nevertheless, our central argument remains that effects observed by Köster et al. could be understood as a result of differences in the spectral representation of stimulus-evoked activity absent an involvement of endogenous oscillations.
Footnotes
Transparency
Action Editor: Patricia J. Bauer
Editor: Patricia J. Bauer
Author Contributions
The hypotheses and goals of this study were conceptualized by C. Keitel, J. Obleser, S. Jessen, and M. J. Henry. Data were analyzed by M. J. Henry. The methodology was developed by J. Obleser, S. Jessen, and M. J. Henry. Project administration (research planning and execution) was performed by C. Keitel. Software was programmed by M. J. Henry. The research was supervised by J. Obleser and S. Jessen. All of the authors verified the accuracy of the results. The figures were created by M. J. Henry. C. Keitel and M. J. Henry drafted the manuscript, and all of the authors reviewed, edited, and approved the final manuscript for submission.