
Abstract
When you walk into a large room, you perceive visual information that is both close to you in depth and farther in the background. Here, we investigated how initial scene representations are affected by information across depth. We examined the role of background and foreground information on scene gist by using chimera scenes (images with a foreground and background from different scene categories). Across three experiments, we found a foreground bias: Information in the foreground initially had a strong influence on the interpretation of the scene. This bias persisted when the initial fixation position was on the scene background and when the task was changed to emphasize scene information. We concluded that the foreground bias arises from initial processing of scenes for understanding and suggests that scene information closer to the observer is initially prioritized. We discuss the implications for theories of scene and depth perception.
Imagine walking into a room for the first time. Rapidly, you understand the size and shape of the space, different objects, and other visual features. Researchers have known for decades that the overall meaning of a scene is quickly extracted (Castelhano & Henderson, 2008; Potter, 1975; Williams & Castelhano, 2019). In a seminal study, Potter (1975) first demonstrated that humans were able to ascertain a scene’s general meaning (scene gist) with as little as 113 ms of exposure. Since then, other researchers have shown that people understand scenes after even briefer presentations (e.g., 20–40 ms; Thorpe et al., 1996). Subsequent studies on scene gist have explored how different sources of information contribute to rapid scene understanding.
Scene-Gist Processing
In studies examining rapid scene understanding, researchers have parsed visual information in various ways. For instance, Schyns and Oliva (1994) posited that visual information is extracted from a coarse-to-fine gradient. They presented participants with hybrid images composed of low-pass and high-pass information from separate images. When briefly presented, scenes were categorized according to low-frequency information, but when presented for additional time, they were categorized according to high-frequency information.
Researchers have also contrasted global scene structure with local visual details. Global information is defined as the overall shape of the scene background (Greene & Oliva, 2009; Munneke et al., 2013), whereas local visual details are often defined as the movable objects (Henderson & Hollingworth, 1999; Pereira & Castelhano, 2014; Williams, 2010). Although both influences affect scene interpretation, the consensus is that scene gist is largely derived from the global structure. However, despite years of research on how scenes are processed, it is not yet clear how information across depth is initially perceived.
Information Across Depth
Studies of depth perception have traditionally examined how information across distance is processed: from peripersonal to vista space (Costantini et al., 2011; Cutting & Vishton, 1995; Nagata, 1991). However, recent studies have shown that observers process space closer to them in a qualitatively different manner than space farther from them (Bonner & Epstein, 2017, 2018; Josephs & Konkle, 2019). For example, Josephs and Konkle (2019) found that scene representations of reachable spaces are qualitatively different from representations of close-up objects or larger scene spaces. Given qualitative differences in processing across depth, it stands to reason that information closer in depth may have different utility and, thus, influence initial scene processing. Notably, this contrasts with studies suggesting a primary role of global scene structure in scene-gist understanding. The present study examined whether information presented at different depths (foreground and background) affected initial interpretation of scenes.
Foreground and Background
In the current study, scene information across depth was manipulated so that information in the foreground and background contained content from different scene categories (i.e., chimera scenes; see Fig. 1; Castelhano et al., 2019). We defined the background as the large boundary defining elements such as walls, floors, and ceilings and the foreground as the content objects closer to the observer. We operationalized the distinction by manipulating the information within scene categories (e.g., kitchen, office) at roughly 50% of the overall room depth (foreground in front half and background in back half; see the Method section). With this distinction, we examined how scene-gist perception is influenced by the background and foreground when each have different interpretations.
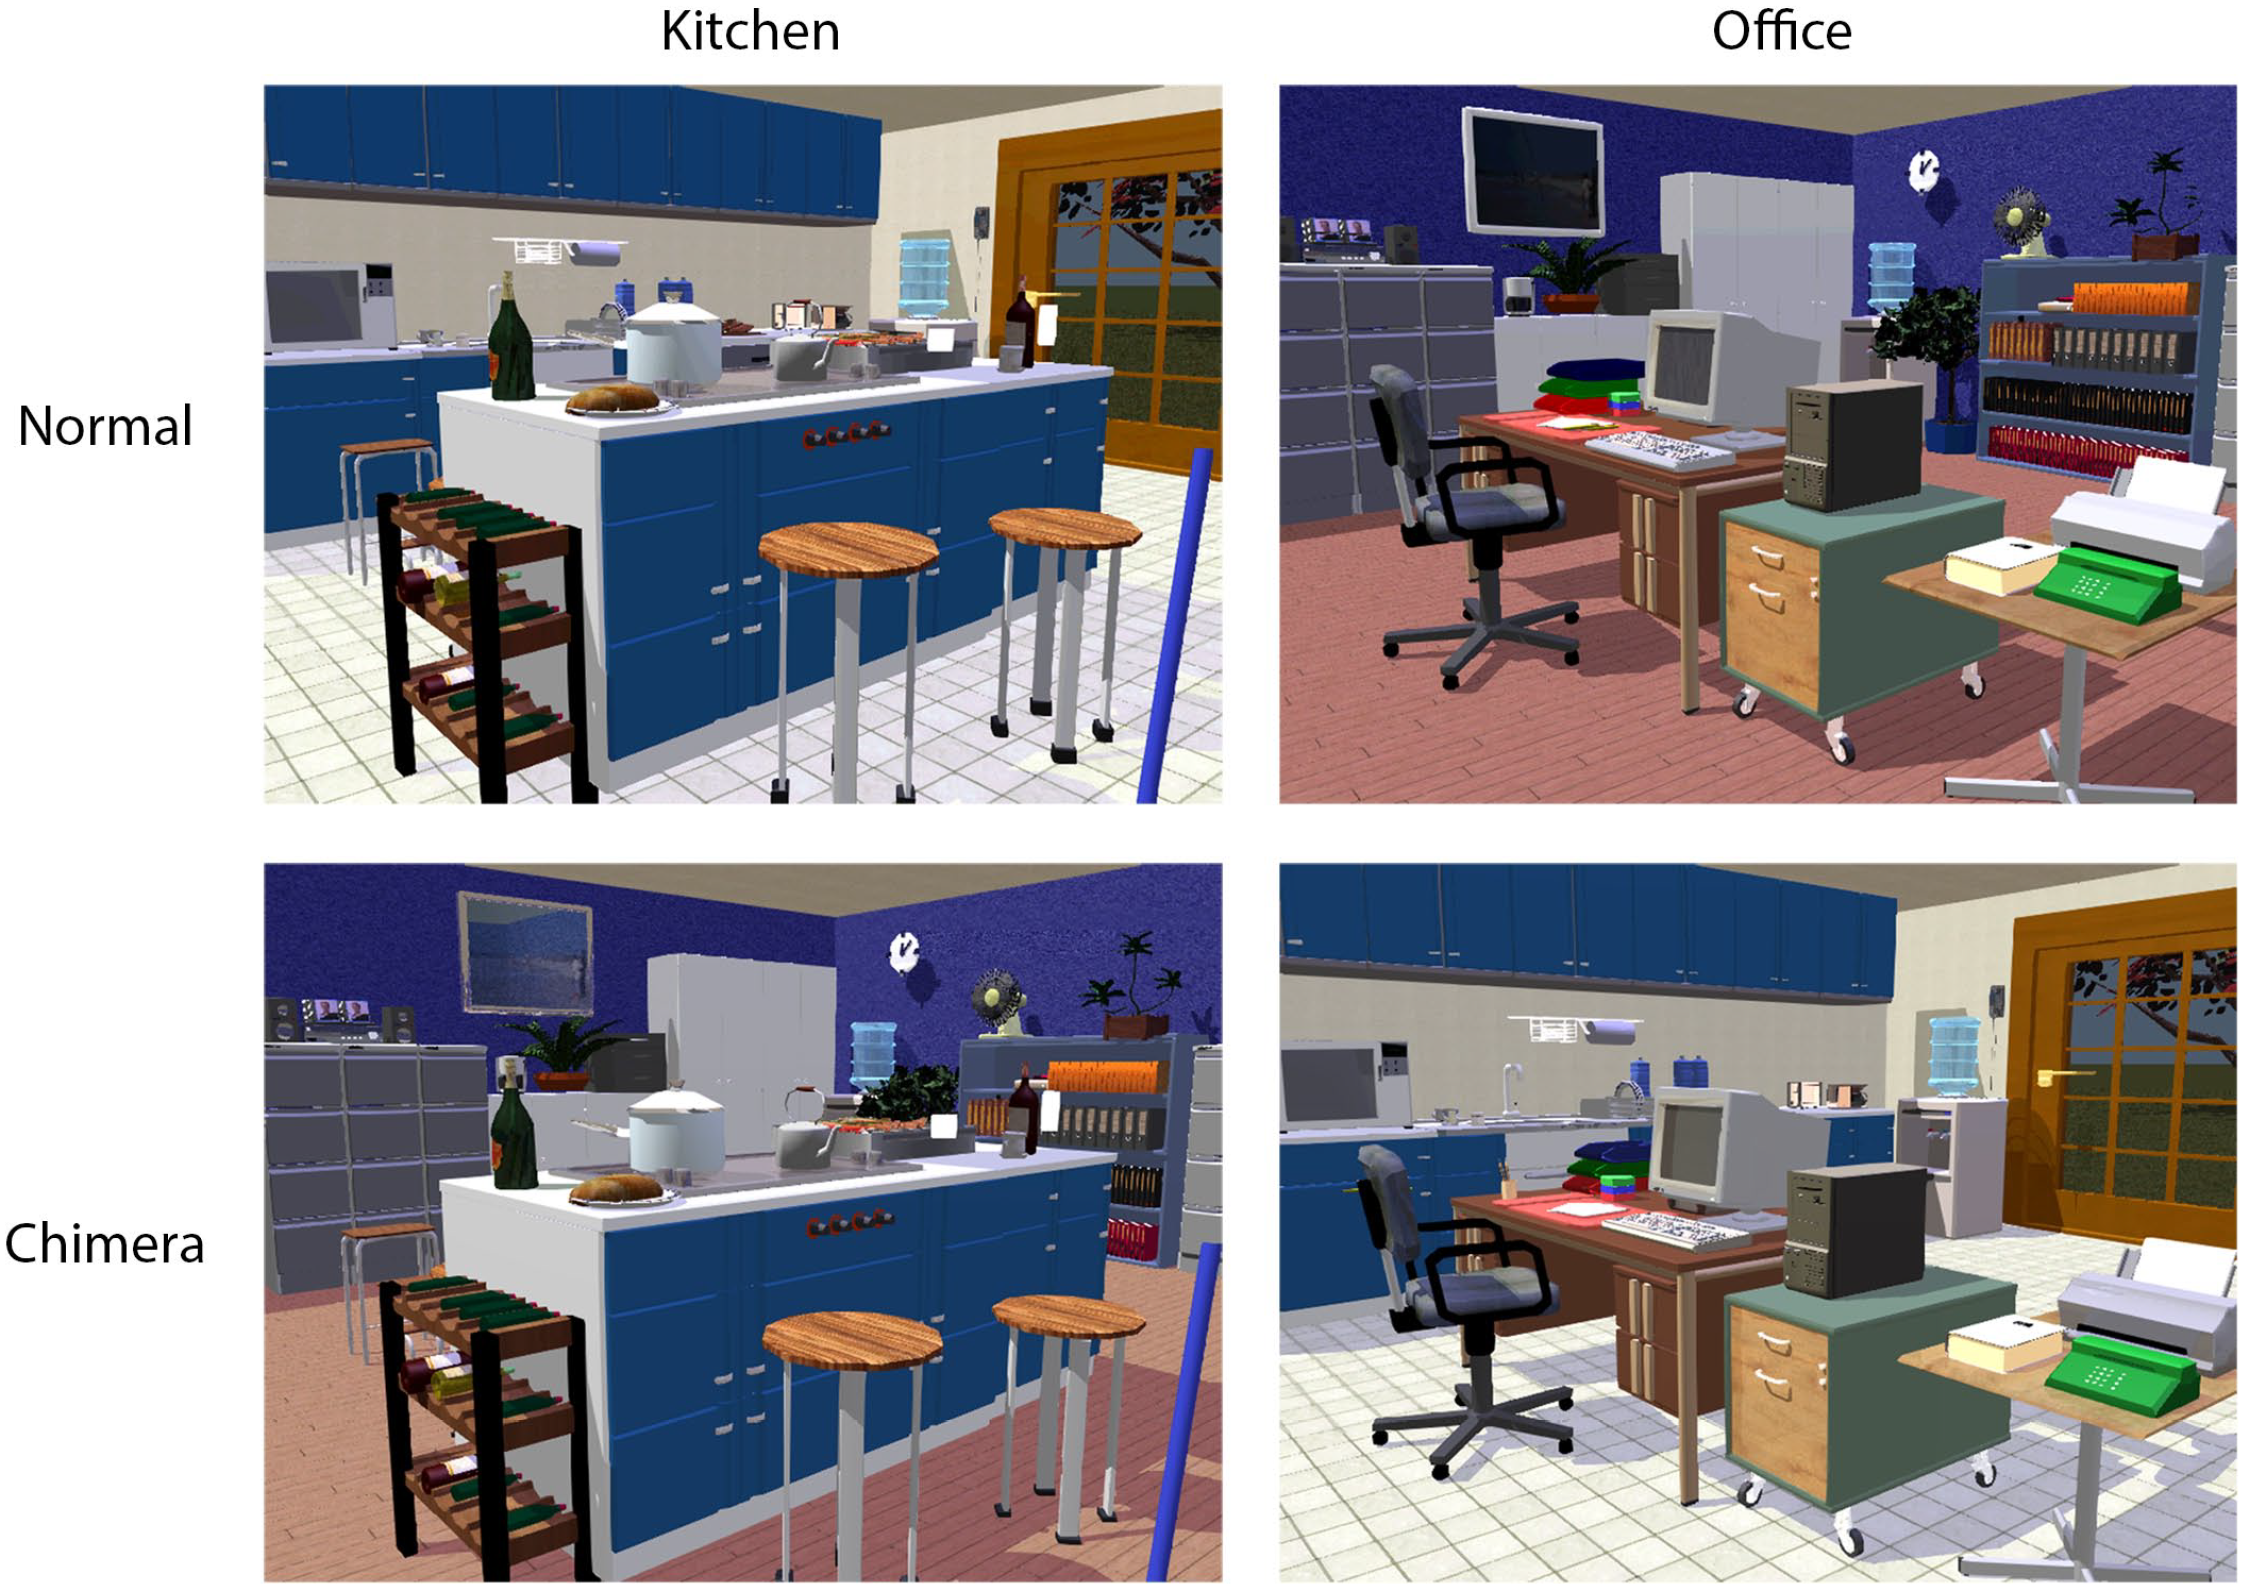
Example stimuli from two indoor-scene categories. The top row shows the normal versions of a kitchen and an office scene, and the bottom row shows the chimera versions of the scenes. The chimera versions were created by matching two images from separate categories and then swapping the foreground objects.
The Present Study
Across three experiments, scene images had foregrounds and backgrounds that were semantically either matched (normal scenes) or mismatched (chimera scenes). To examine the interpretation of these scenes, we used the contextual-bias paradigm (Castelhano & Henderson, 2008), which allowed us to measure scene understanding without relying on judgments of scene-category names. The contextual-bias paradigm reflects scene-gist understanding using the participant’s bias to confirm consistent target objects and to disconfirm inconsistent targets.
In each experiment, we examined shorter (50 ms or 100 ms) and longer (250 ms or 330 ms) exposure durations in two subexperiments. Experiment 1 examined performance when scenes were viewed from the image center. Experiment 2 investigated whether initial perception was influenced by fixation position. For each image, participants fixated on scenes’ foreground or background. Experiment 3 examined the effect of task and had participants respond to scene-category names. Across all experiments, we found that, initially, participants were strongly influenced by the scene foreground.
Experiment 1
Method
Participants
Two groups of 36 participants took part in Experiments 1a and 1b. They were compensated with either course credit or an honorarium at the rate of $10 per hour. All participants had normal or corrected-to-normal vision. This study was approved by Queen’s University’s General Research Ethics Board. Sample size was determined on the basis of the effect size for the contrast between the consistent and inconsistent target responses for 50-ms presentations (Castelhano & Henderson, 2008), which showed a medium to large effect size (d = 0.6–2.7) depending on condition. Because we were interested in determining how manipulated scenes would affect interpretation, we used a conservative effect size (d) of 0.5, an alpha of .05, and power of .8 for our sample-size computation (G*Power Version 3.1.9.2; Faul et al., 2007). The estimated sample size was 34 participants, but we used 36 to fit the counterbalancing (six conditions), which yielded a power estimate of .83.
Materials and apparatus
Using Complete Home Designer (Version 5.0; Data Becker, 2003), we created computer-generated colored images consisting of both indoor and outdoor scene categories (for example scenes, see Fig. 1). All scenes were created using the same template; they were built into the corner with two adjoining walls providing the main definition of the space and depth of the scene. Thus, indoor and outdoor scenes had a similar shape and depth. Each image’s background and foreground areas were then identified and partitioned. 1 The depth of the foreground information (from the camera position to the back wall) occupied, on average, 52% (SD = 13%) of the distance. When images were rendered as 2D, the pixel content for the foreground versus background was roughly equated (51% foreground, 49% background).
To create the chimera scenes, we matched two images from separate scene categories and then paired the foreground of one image with the semantically different background of the other image. The experimental stimuli consisted of 48 scenes, each with a normal and chimera version, for a total of 96 images. The study was run using MATLAB R2014a (Version 8.3; The MathWorks, Natick, MA) and the Psychophysics Toolbox (Version 3; Brainard, 1997) on a 21-in. CRT monitor with a refresh rate of 100 Hz, a resolution of 800 × 600 pixels. Stimuli subtended 38.1° × 26.6°. Head position was restricted with a chin rest located approximately 60 cm from the monitor.
Design
For each experiment, a 2 (presentation duration) × 2 (scene type: normal, chimera) × 3 (target condition: foreground, background, inconsistent control) within-subjects design was used. The presentation duration was 50 ms and 100 ms for Experiment 1a and 250 ms and 330 ms for Experiment 1b. Participants saw a total of 48 images divided into an equal number of different scene types (24 normal scenes and 24 chimera scenes). The target word belonged to one of three conditions: (a) consistent with the background scene category (background condition), (b) consistent with the foreground scene category (foreground condition), or (c) inconsistent with both the background and the foreground scene category (inconsistent control condition). Target objects were never present in the image.
Procedure
The procedure followed the contextual-bias paradigm (Castelhano & Henderson, 2008). Prior to beginning the experiment, participants provided written informed consent. Across conditions, participants were each tested individually. Participants were instructed to view briefly presented images and, on the following query screen, make a response regarding whether the named target object seemed appropriate in the context of the scene. There were no practice trials. Participants’ heads were not restrained, but they sat approximately 60 cm from the monitor.
On each trial, participants were presented with a black fixation dot centered on a gray screen. An image then appeared on the screen for the duration corresponding with the duration condition. This was followed by a mask image for 50 ms. The mask image was made of individual sections of different scene images to provide a wide range of visual features. The target-object word then appeared, and participants indicated via a response box whether that target object was likely to be found in the image (yes/no). The target names were manipulated such that the object was consistent with either the foreground or the background exclusively or was inconsistent with both scene contexts. Each target-object type was presented with equal frequency across trials. Importantly, as noted above, the queried target objects were never present in the scenes. Thus, the response did not reflect detection of the object but, rather, the response bias of how likely the object was to appear in the scene. The logic was that if the foreground (or background) was perceived, then responding “yes” was more likely when the object was consistent with the scene and more unlikely when the target was inconsistent with the scene. Thus, responses were driven by the interpretation of the scene gist, so gist perception was measured indirectly by examining the difference between the consistent and inconsistent responses.
All images and conditions were counterbalanced across participants and were randomly intermixed throughout the experiment. Importantly, participants saw each scene only once. For the scene images and the different target names, see the Supplemental Material available online. The experimental session lasted approximately 15 to 20 min.
Results
To determine how participants attended to the foreground and the background of a scene, we calculated the mean proportion of times the participants responded “yes” to the target object. This was used as the dependent variable for all reported analyses. Because data from each group of participants were collected at different times, the analyses for Experiments 1a and 1b were conducted separately; however, exploratory analysis across both experiments can be found in the Supplemental Material.
The main a priori analyses focused on how interpretation of the chimera scenes changed over time. To this end, we conducted planned comparisons contrasting the responses in the foreground and background conditions with responses in the control condition (inconsistent target) at each exposure duration. We also planned contrasts between the responses for the foreground and background scenes to examine whether they differed at each duration. This is interesting because in reality, both of these interpretations of the scene are legitimate. However, responses that favor one over another would allow us to examine whether one source of information was privileged over the other. Thus, for each duration condition, we conducted three a priori comparisons: foreground versus inconsistent control, background versus inconsistent control, and foreground versus background. For all planned comparisons, alpha was adjusted such that the familywise error did not exceed .05. The specific alpha used is reported below prior to the report of the tests. 2
We performed the analyses on the normal-scene condition (α = .004) as a manipulation check. As might be expected, we found that responses in both the foreground and background conditions were significantly different from responses in the inconsistent condition for both the 50-ms duration—foreground: t(35) = 7.66, p < .001, d = 1.81; background: t(35) = 7.76, p < .001, d = 1.72—and the 100-ms duration—foreground: t(35) = 20.92, p < .001, d = 3.76; background: t(35) = 13.44, p < .001, d = 3.31. This pattern, which showed that participants were engaged and able to complete the task, replicated previous results (Castelhano & Henderson, 2008).
Accordingly, we found no difference in responses between the foreground and background targets for either the 50-ms duration, t(35) = 0.40, p = .692, d = 0.07, or the 100-ms duration, t(35) = 1.21, p = .233, d = 0.25. This was expected because regardless of whether the foreground or background was initially used for the interpretation, the response would be the same. Thus, because the normal condition was not of theoretical interest, it will not be discussed or reported further; however, means are included in all graphs for completeness.
The mean proportion of “yes” responses across the scene-type and target conditions in Experiment 1a are shown in the top row of Figure 2. As mentioned above, planned comparisons were done on the chimera scenes because these images contained the theoretically interesting contrast between scene categories within a single image (six comparisons, α = .00833). When we compared the foreground and background conditions with the inconsistent control condition, we found that at 50 ms, participants responded “yes” in the foreground condition more than in the control condition, t(35) = 4.40, p < .001, d = 1.10, but interestingly, we did not see a significant difference in responses between the background and control conditions, t(35) = −1.28, p = .21, d = −0.23. The pattern persisted in the 100-ms duration condition; participants responded “yes” significantly more often in the foreground condition than in the control condition, t(35) = 15.26, p < .001, d = 3.06, but not in the background condition, t(35) = 0.71, p = .48, d = 0.15. To assess the bias directly, we compared the foreground and background conditions directly and found a significantly greater proportion of “yes” responses for the foreground than the background for both the 50-ms duration, t(35) = 6.15, p < .001, d = 1.35, and the 100-ms duration, t(35) = 12.35, p < .001, d = 3.03.
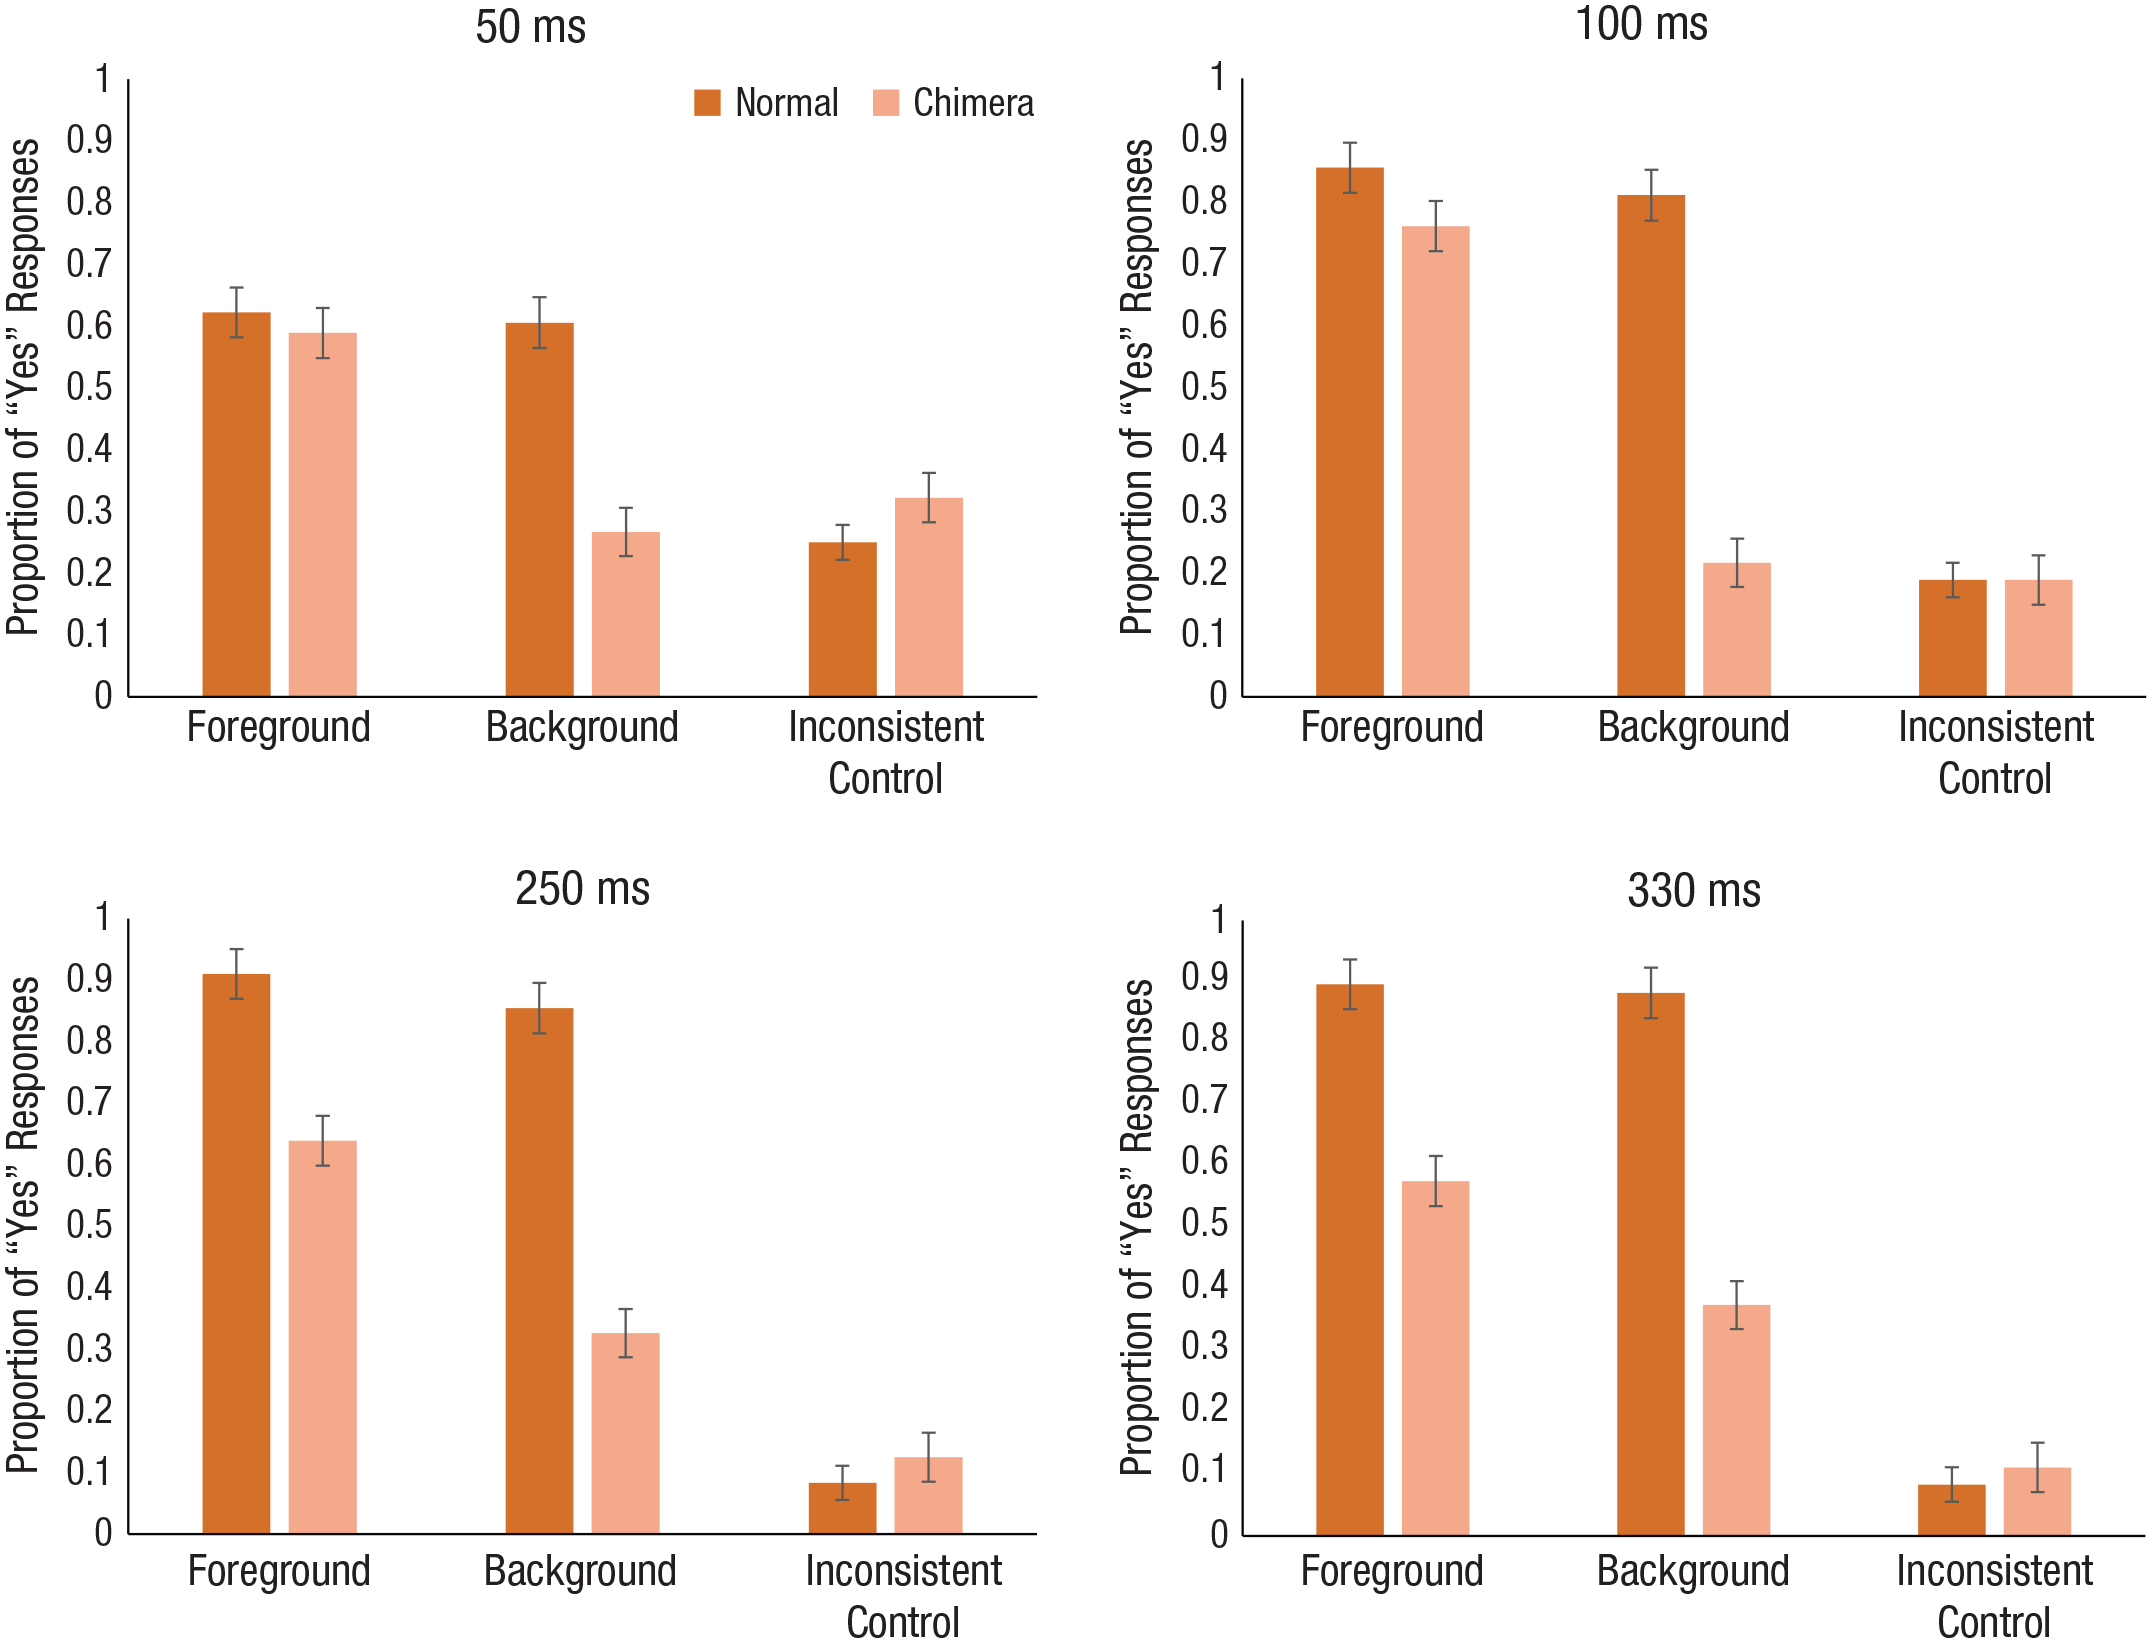
Mean proportion of “yes” responses for normal and chimera scenes for each of the target conditions in Experiment 1a (top row) and Experiment 1b (bottom row). Results are shown separately for each of the four exposure durations. Error bars represent standard errors of the mean.
The mean proportion of “yes” responses across the scene-type and target conditions in Experiment 1b are shown in the bottom row of Figure 2. As above, we conducted planned comparisons across target conditions at each duration condition (250 ms and 330 ms) for the chimera scenes (six comparisons, α = .00833). Participants were able to distinguish the foreground target from the inconsistent control target in both the 250-ms duration condition, t(35) = 8.49, p < .001, d = 2.33, and the 330-ms duration condition, t(35) = 10.41, p < .001, d = 2.63. Additionally, participants were able to distinguish the background target from the inconsistent control target in both the 250-ms duration condition, t(35) = 3.70, p = .001, d = 1.00, and the 330-ms duration condition, t(35) = 5.01, p < .001, d = 1.36, in contrast to the results of Experiment 1a. When the foreground and background conditions were contrasted directly, results showed that participants remained significantly biased toward the foreground in both the 250-ms duration condition, t(35) = 5.07, p < .001, d = 1.21, and the 330-ms duration condition, t(35) = 4.23, p < .001, d = 0.87.
Experiment 2
When we examined the position of the fixation cross (prior to the presentation of the image), we found that this central position often overlapped with the foreground scene region (78%). Thus, information at fixation could explain the results of Experiment 1. In Experiment 2, we manipulated where the participants were looking when the scene was presented by changing the position of the initial fixation prior to image presentation.
Method
Participants
Two groups of 48 participants each took part in Experiments 2a and 2b for course credit or were paid $10 per hour. All participants had normal or corrected-to-normal vision, and none had participated in the previous experiment. Sample size was determined using the effect size for the contrast between the foreground and background conditions from Experiment 1, which was large (d = 0.87–3.30) across duration conditions. Because we were interested in determining the effects of fixation position on interpretation, we used a medium effect size (d) of 0.6, an alpha of .004 (Bonferroni corrected for the current study), and power of .8 for our sample-size computation (G*Power Version 3.1.9.2; Faul et al., 2007). The estimated sample size was 33 participants, but to fit the counterbalancing, we recruited 48, which yielded a power estimate of .86.
Design
A two-level factor manipulating fixation placement was added to create a 2 (initial fixation position: background, foreground) × 2 (presentation duration) × 2 (scene type: normal, chimera) × 3 (target condition: foreground, background, inconsistent control) within-subjects design. 3 The presentation duration was 50 ms and 100 ms for Experiment 2a and 250 ms and 330 ms for Experiment 2b.
Procedure
The procedure was identical to that in Experiment 1, with the exception of the placement of the fixation cue. The fixation cue was placed in either the foreground or the general background region of the scene. The location was predetermined for each scene individually.
Results
Again, the mean proportion of times that participants indicated “yes” to the match between the target word and the scene was calculated and used as the dependent variable in all analyses. For all planned comparisons, alpha was adjusted such that the familywise error did not exceed .05. The specific alpha used is reported below prior to the report of the tests. Because data from each group of participants were collected at different times, analyses for Experiments 2a and 2b were conducted separately; however, an exploratory analysis across both experiments can be found in the Supplemental Material.
The mean proportion of “yes” responses across the scene-type, target, and fixation conditions in Experiment 2a are shown in the top row of Figure 3. To examine effects on response bias, we conducted planned comparisons of the foreground and background conditions with the inconsistent control condition for each duration condition at each fixation position (12 comparisons, α = .004167). As might be expected, when the fixation dot was positioned on the foreground, the pattern of responses did not change from the first experiment. For both the 50-ms and 100-ms duration conditions, participants responded “yes” to the foreground condition, t(47) = 4.69, p < .001, d = 0.91, more than the control condition, t(47) = 5.51, p < .001, d = 1.05. Interestingly, they did not show a significant difference in responses between the background and control conditions for 50-ms durations, t(47) = 1.46, p = .15, d = 0.27, but did show a significant difference (yielding a medium-size effect) in the 100-ms condition, t(47) = 3.10, p = .003, d = 0.57. When we compared the responses from the foreground and background conditions directly, we found that participants had a significant bias toward the foreground targets for the 50-ms duration, t(47) = 3.00, p = .004, d = 0.60, but there was no significant difference for the 100-ms duration, t(47) = 1.91, p = .063, d = 0.36. Thus, compared with the effect in the previous experiment, the effect here persisted but was diminished.
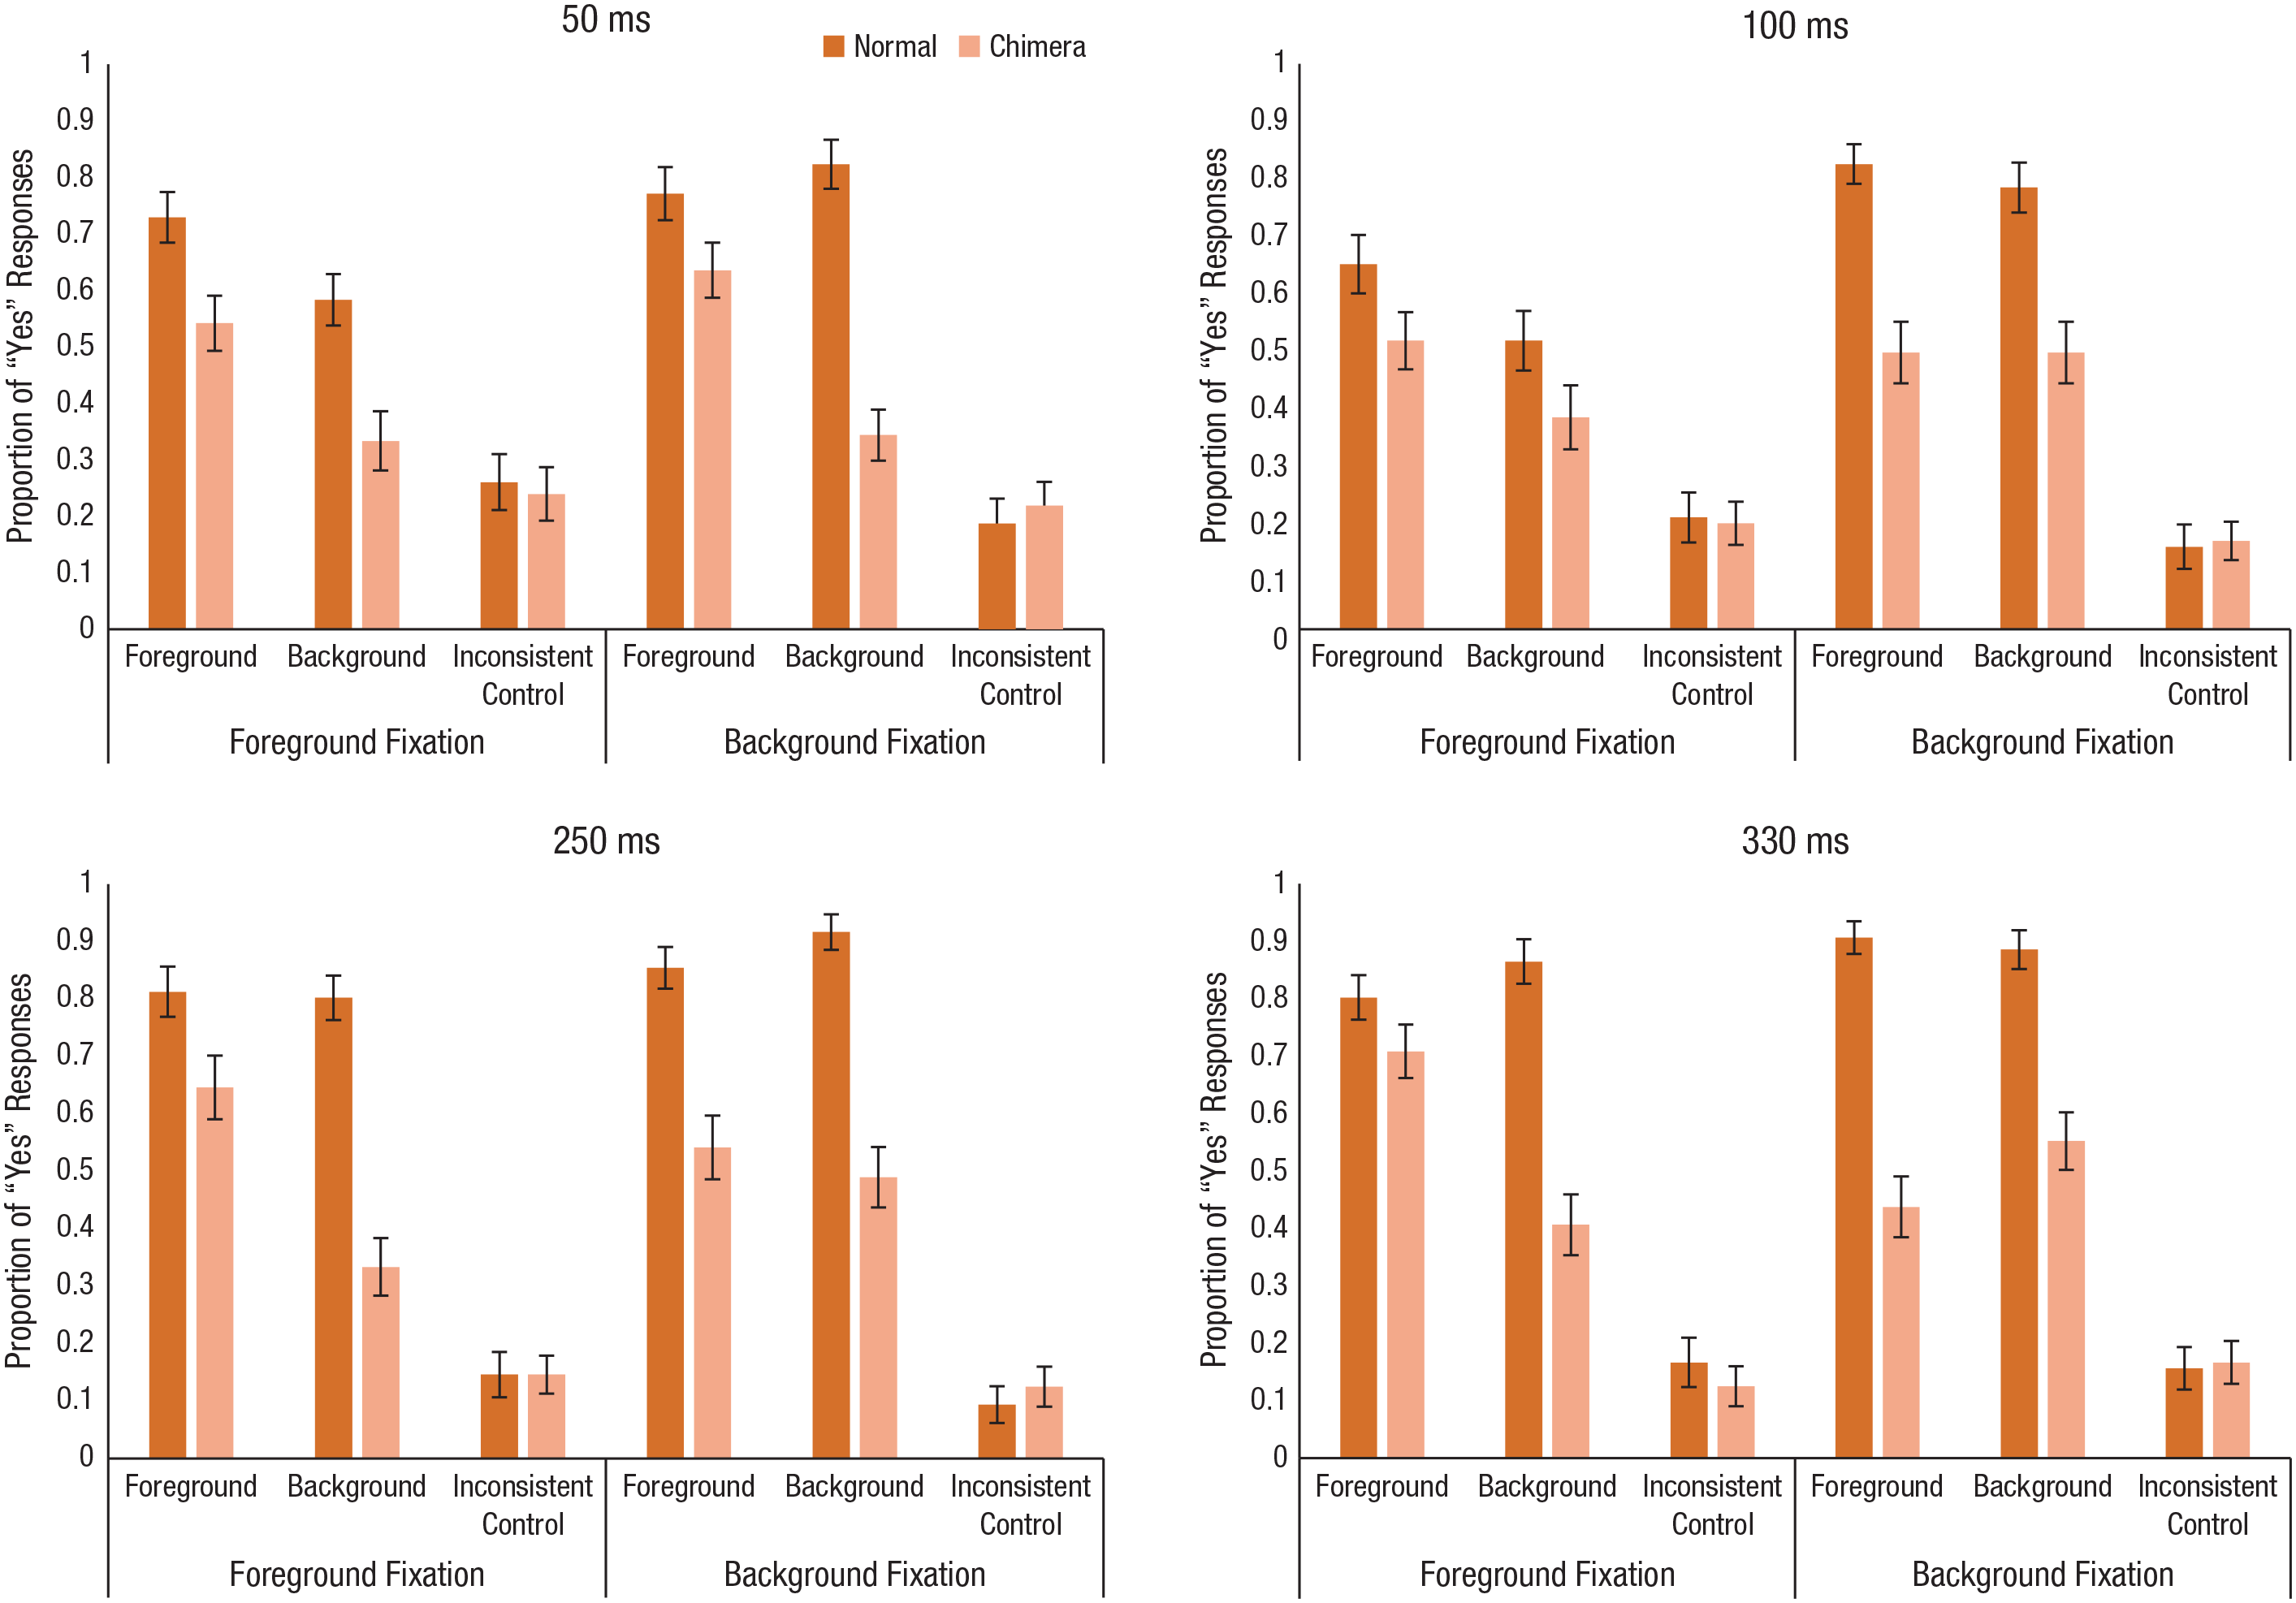
Mean proportion of “yes” responses for normal and chimera scenes for each of the target and fixation conditions in Experiment 2a (top row) and Experiment 2b (bottom row). Results are shown separately for each of the four exposure durations. Error bars represent standard errors of the mean.
Surprisingly, when the fixation dot was in the background, we found that participants continued to show the foreground bias. Participants responded “yes” in the foreground condition more than the inconsistent control condition—50 ms: t(47) = 6.93, p < .001, d = 1.32; 100 ms: t(47) = 4.85, p < .001, d = 1.09—but their responses in the background and inconsistent control conditions were not significantly different for 50-ms durations, t(47) = 1.95, p = .057, d = 0.42. However, there was a significant difference in the 100-ms condition, t(47) = 5.38, p < .001, d = 1.09.
When we compared the responses from the foreground and background conditions directly, we found that participants showed a significant bias for the foreground targets at the 50-ms duration, t(47) = 4.64, p < .001, d = 0.90, but not at the 100-ms duration, in which the means were almost identical, t(47) < 1. Therefore, these results showed that a strong bias toward the foreground remained early on, even when the fixation position varied. Although it was not surprising that there was a foreground bias when the fixation location was in the foreground, the bias never reversed to the background of a scene when the background was fixated directly. Instead, the foreground bias was present with short exposures (50 ms), and then, with increased exposure, responses were equally likely between the foreground and background conditions. To further assess the effects of fixation location and to see whether the effect would eventually reverse, we conducted another experiment with longer exposure durations: 250 ms and 330 ms.
The mean proportion of “yes” responses across the scene-type, target, and fixation conditions in Experiment 2b are shown in the bottom row of Figure 3. To assess whether the bias toward the foreground of scenes continued with longer presentation times, we conducted the three planned comparisons contrasting the foreground and background conditions as before for each duration condition at each fixation location (12 comparisons, α = .004167). When the fixation dot was positioned on the foreground, participants responded “yes” in the foreground condition more than the control condition—250 ms: t(47) = 7.51, p < .001, d = 1.63; 330 ms: t(47) = 10.01, p < .001, d = 2.06—and to the background condition more than the control condition—250 ms: t(47) = 3.00, p = .004, d = 0.65; 330 ms: t(47) = 4.23, p < .001, d = 0.92. Additionally, when we compared the responses from the foreground and the background conditions directly, we found that participants still had a significant bias toward foreground targets for both presentation durations—250 ms: t(47) = 4.15, p < .001, d = 0.85; 330 ms: t(47) = 4.46, p < .001, d = 0.85.
The pattern was somewhat different when the fixation dot was in the background. We found that participants responded “yes” in the foreground condition more than in the control condition—250 ms: t(47) = 6.37, p < .001, d = 1.33; 330 ms: t(47) = 3.97, p < .001, d = 0.87—and in the background condition more than in the control condition—250 ms: t(47) = 6.38, p < .001, d = 1.20; 330 ms: t(47) = 5.90, p < .001, d = 1.27. When we compared directly, we found that in neither duration condition did participants show a significant bias for foreground targets—250 ms: t(47) = 0.636, p = .528, d = 0.14; 330 ms: t(47) = −1.50, p = .14, d = −0.32. Instead, it seems that participants were responding to the foreground and background targets in equal measure. Interestingly, although background fixation did eliminate the foreground bias at longer exposure durations, it was never reversed such that background information was favored significantly over foreground information. This suggests that processing of the foreground is mitigated by fixation position but also that even when the background information is fixated, the foreground continues to exert a strong influence on scene understanding.
Experiment 3
Although the foreground bias seems to be quite robust, the previous experiments required participants to respond to queries about the presence of objects, which may have inadvertently encouraged participants to strategically focus on the foreground. To examine whether the foreground bias resulted from the task, we conducted a third experiment examining participants’ responses to the scene-category name.
Method
Participants
Two groups of 36 participants each provided informed consent and took part in Experiment 3 for course credit or were given $10 per hour for their time. All participants had normal or corrected-to-normal vision, and none had participated in the previous experiments. The sample size was based on the calculations used in Experiment 1, given that the design and effects of interest were identical.
Design
Similar to Experiment 1, Experiment 3 had a 2 (presentation duration) × 2 (scene type: normal, chimera) × 3 (target condition: foreground, background, inconsistent control) within-subjects design. As in Experiment 1, scenes in Experiment 3a were presented for 50 ms or 100 ms, and scenes in Experiment 3b were presented for 250 ms or 330 ms.
Procedure
The procedure was identical to that in Experiments 1 and 2, with the exception of the query: Instead of a target-object word appearing after the scene, a scene-category name was presented. The scene query belonged to one of three conditions: (a) background scene category, (b) foreground scene category, or (c) inconsistent (with either the background or the foreground scene category). The participants’ task was to indicate whether the scene-category word matched the image by pressing a button for yes or a button for no.
Results
The mean proportion of times that a participant indicated “yes” that the scene category matched the scene was calculated and used as the dependent variable for all analyses. Because data from each group of participants were collected at different times, analyses for Experiments 3a and 3b were conducted separately; however, exploratory analysis across both experiments can be found in the Supplemental Material.
The mean proportion of “yes” responses across the scene-type and scene conditions in Experiment 3a are shown in the top row of Figure 4. Planned comparisons using paired-samples t tests showed that when participants responded to scene-category names, the patterns of response were similar to those in Experiment 1 (six comparisons, α = .00833). When we compared the foreground and background conditions with the inconsistent condition, we found that at 50 ms, participants responded “yes” to the foreground condition more than the control condition, t(35) = 5.93, p < .001, d = 1.47, but interestingly, we did not see a significant difference in responses between the background and control conditions, t(35) = 1.30, p = .20, d = 0.29. Interestingly, the pattern for 100 ms changed; there were significantly more “yes” responses in both the foreground and background conditions than in the control condition, t(35) = 11.07, p < .001, d = 2.94, and t(35) = 5.073, p < .001, d = 0.95, respectively. To assess the foreground bias, we compared responses to foreground and background conditions and found a significantly greater proportion of responses for the foreground than the background condition for both the 50-ms duration, t(35) = 4.78, p < .001, d = 1.24, and the 100-ms duration, t(35) = 5.67, p < .001, d = 1.53. Thus, even when the judgment was about the scene, the foreground bias persisted. To determine whether this bias would be affected by longer exposure, we showed scenes for 250 ms and 330 ms.
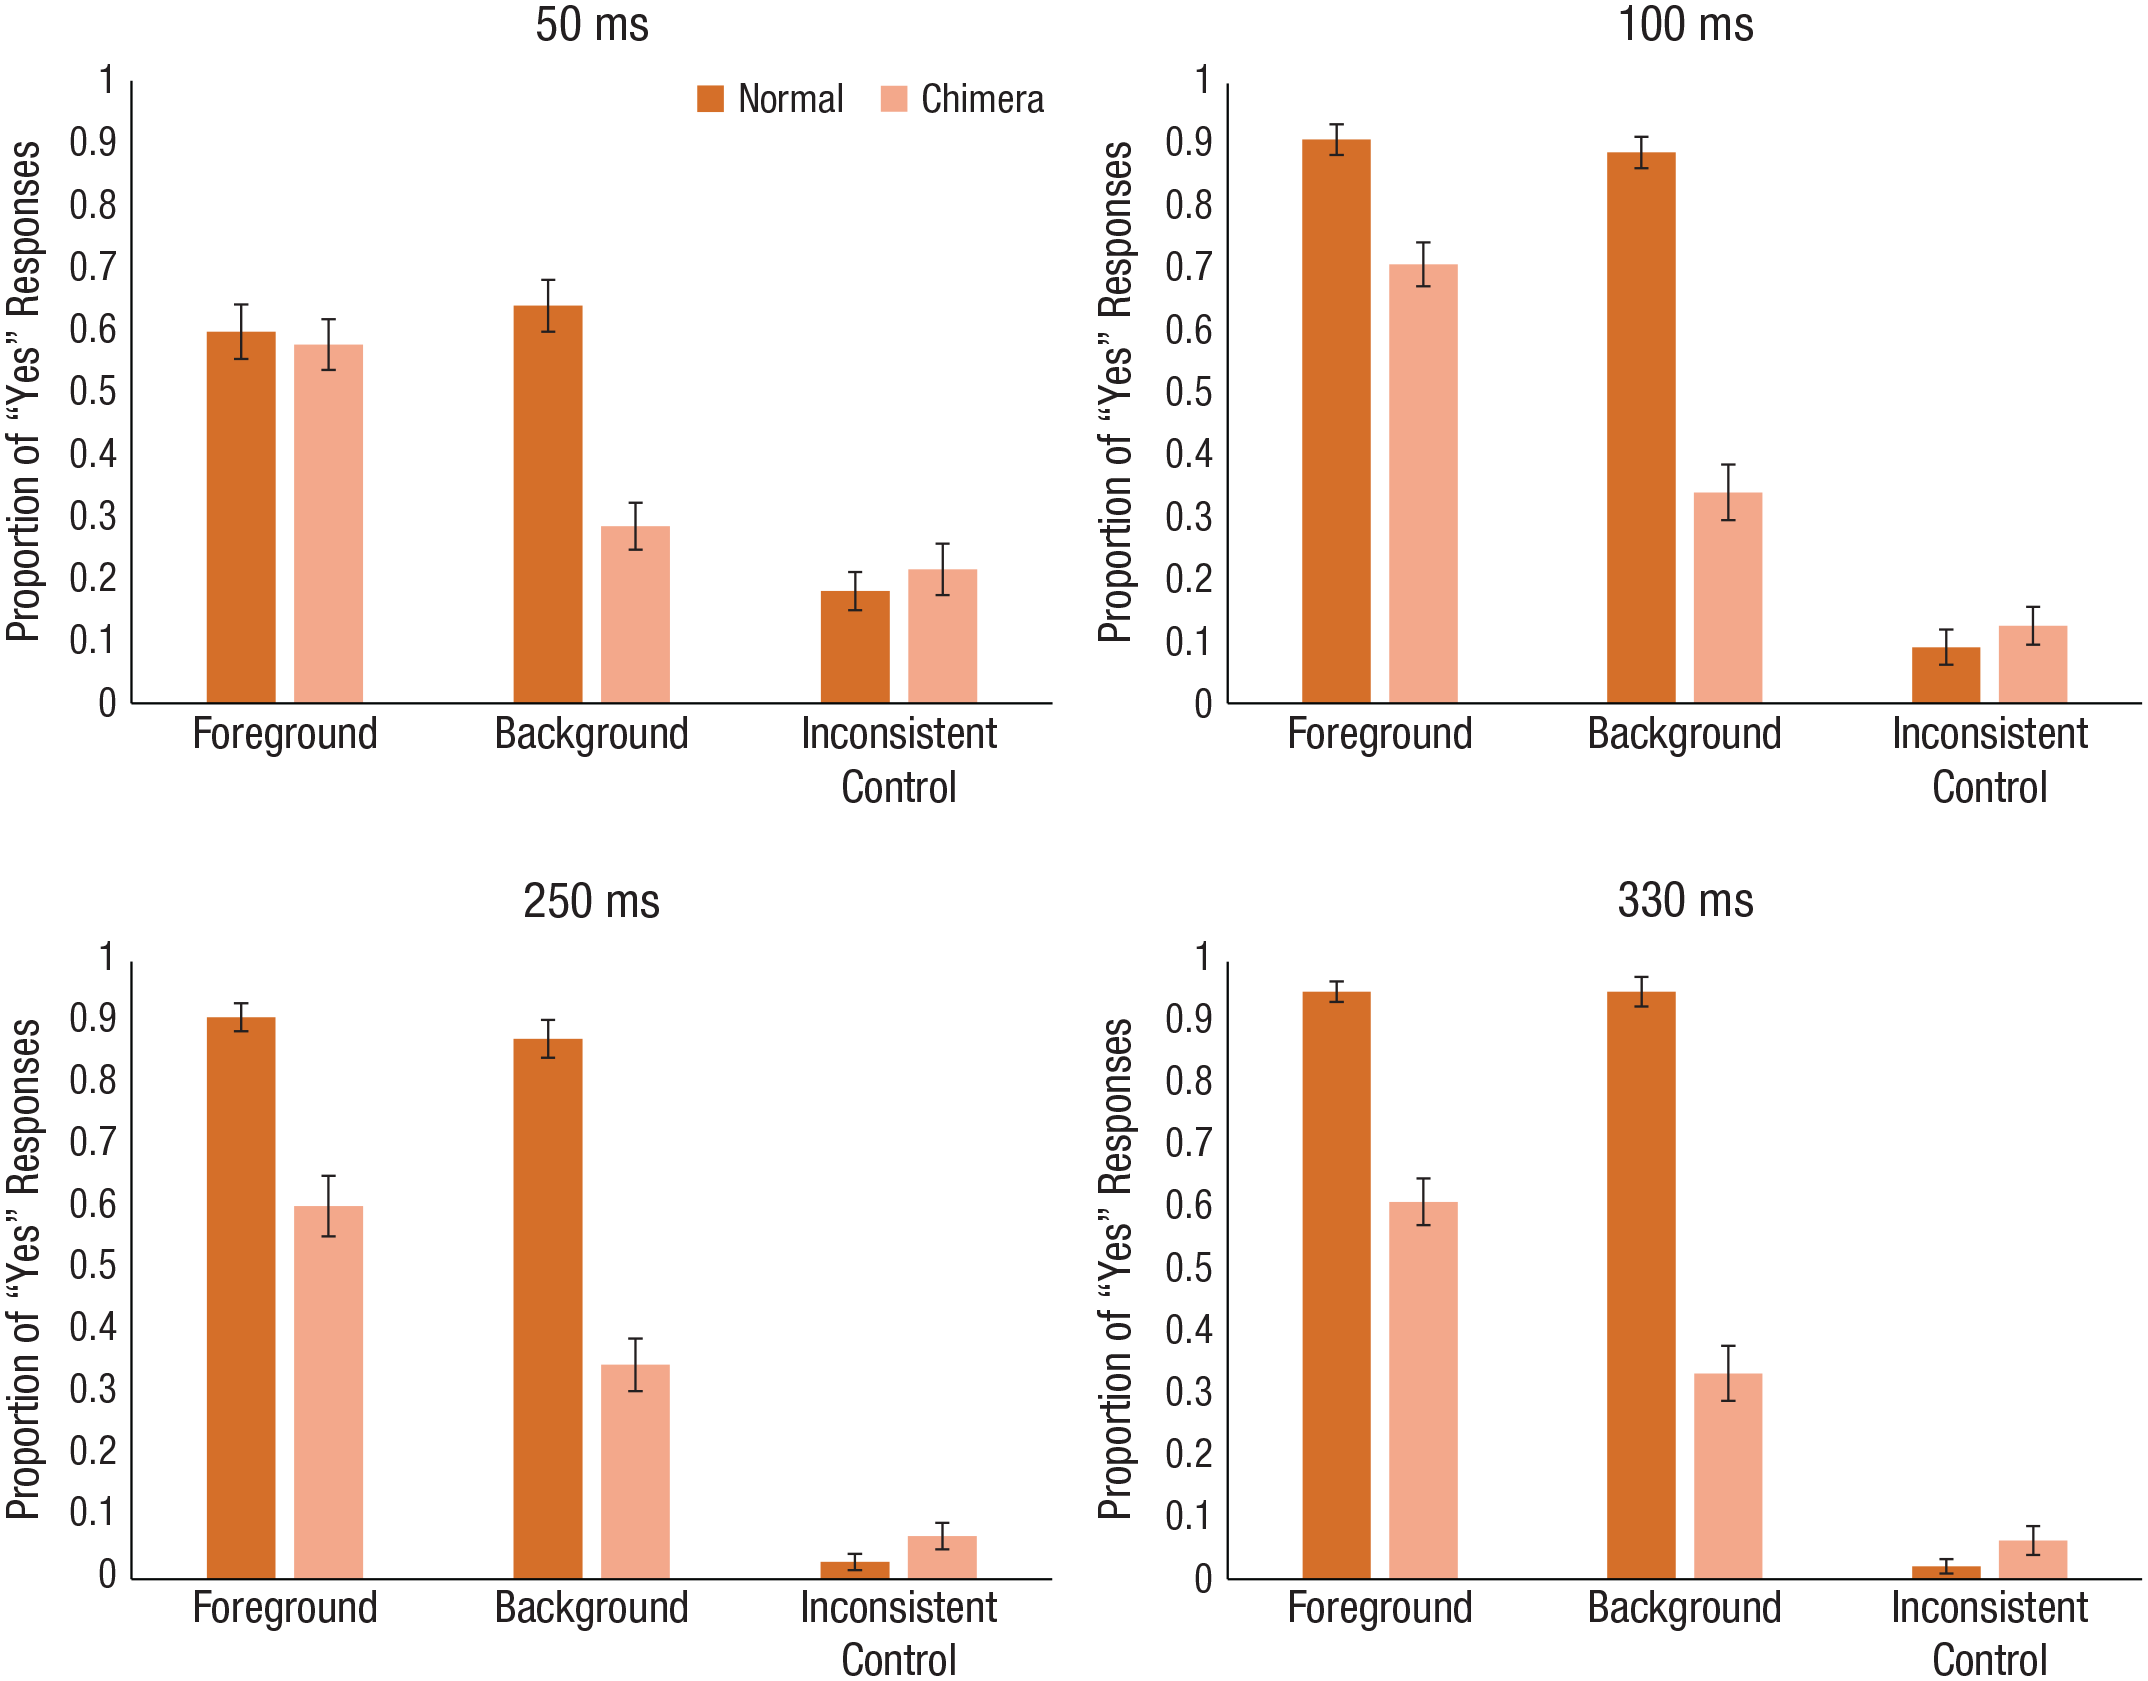
Mean proportion of “yes” responses for normal and chimera scenes for each of the target conditions in Experiment 3 a (top row) and Experiment 3b (bottom row). Results are shown separately for each of the four exposure durations. Error bars represent standard errors of the mean.
The mean proportion of “yes” responses across the scene-type and scene conditions in Experiment 3b are shown in the bottom row of Figure 4. When scenes were shown for 250 ms and 330 ms, planned comparisons using paired-samples t tests (six comparisons, α = .00833) showed a similar pattern of results as in the 100-ms duration condition. When we compared responses in the foreground and background conditions with responses in the inconsistent condition for the 250-ms duration condition, we found significantly more “yes” responses for both the foreground condition, t(35) = 10.70, p < .001, d = 2.35, and the background condition, t(35) = 5.72, p < .001, d = 1.37. The same pattern was found for the 330-ms duration—foreground: t(35) = 14.82, p < .001, d = 2.92; background: t(35) = 6.52, p < .001, d = 1.27. To assess the foreground bias, we compared responses to foreground and background conditions and found a significantly greater proportion of responses for the foreground than the background conditions for both the 250-ms duration, t(35) = 3.50, p < .002, d = 1.24, and the 330-ms duration, t(35) = 4.66, p < .001, d = 0.93. Thus, even with longer presentation durations and when the scene category was judged, the foreground bias persisted.
General Discussion
Across three experiments, we found that when given conflicting scene information across depth, participants were initially more influenced by the foreground than background of a scene. Experiment 1 showed that the foreground bias was present for 50-ms and 100-ms exposure durations but dissipated at longer durations. In Experiment 2, when the fixation position overlapped with a scene’s background, the foreground bias persisted at brief exposure durations (50 ms), but with longer presentation durations, it was weak (100 ms) or absent (250 ms and 330 ms). It is interesting to note that we never saw participants show a preference for the background, even when they fixated it directly. In Experiment 3, we modified the task to encourage focus on the whole scene and found that the task only slightly modified the pattern of results. The foreground bias remained, but the background was also correctly interpreted when the image was shown for a longer duration (100 ms). Interestingly, across experiments, we never saw a reverse effect favoring background information, suggesting that the foreground bias was robust.
Central bias versus foreground bias
The central bias reflects the tendency to direct fixations to the center of an image (Bindemann, 2010; Tatler, 2007). Researchers have posited that there are two potential sources (Bindemann, 2010). First, the central position allows for the maximal perception of information across the whole scene and, thus, represents an optimal viewing position (e.g., McConkie et al., 1988). In Experiment 2, we examined the central bias on the basis of this optimal-viewing-position interpretation. If central bias accounts for the effect because the foreground overlapped with the center, then we would expect the foreground bias to disappear (and be dominated by the information at the fixation position). On the other hand, if the central bias were orthogonal to the foreground bias and both have an effect, then we would expect processing differences between the foreground and background of scenes to persist. Our results are consistent with the latter. Although we do not dispute that the central bias may play a role, the findings show that the foreground bias is an important separate effect.
The central bias has also been described as an inherent property of the scene itself, where information at the center is driving the effect (Bindemann, 2010; Tatler, 2007). For instance, semantically important information is often centered in photographic images (Rensink et al., 1997). To test this directly would require a change in the contents of each scene so that no foreground information is in the center (e.g., by changing viewpoints; Castelhano & Pollatsek, 2010; Castelhano et al., 2009). Although we did not have this manipulation, we did a further post hoc examination of the Experiment 1a data with scenes in which the foreground was not in the center. We found that the pattern of the means was consistent with the results across all experiments, although fewer data points meant that the pattern of results was more uneven (for the analyses, see the Supplemental Material). For instance, for 100-ms scene durations, we found a significant difference between responses in the foreground-target condition and control condition and between the foreground- and background-target conditions, but not between the background-target condition and the control condition. Although post hoc analyses suggest that the foreground bias is robust, further investigation is necessary.
Attention allocation and scene-gist perception
Many previous studies have shown that the focus of attention is initially diffuse and becomes more focused with time (Castelhano & Henderson, 2003, 2007; Henderson et al., 2003; Schyns & Oliva, 1994). When one considers Experiment 2, one interpretation of the pattern across duration conditions is that processing is influenced by information at fixation over time. Alternatively, one could interpret the same pattern as the ever-increasing influence of background information because more processing time is possible. For instance, the pattern shows a decrease in responses to the foreground target as more time for processing is allowed, presumably incorporating the contradiction between the foreground and the background. Research on how information prioritization across depth changes over time would be needed to delineate how this bias and attentional processes interact.
Spatial-information processing in scenes
The current study is a first step in examining how the z-axis of scenes impacts initial processing. Researchers have begun to examine information across different depths in scenes (Bonner & Epstein, 2017, 2018; Josephs & Konkle, 2019). Taken together with current findings, it seems that the immediately surrounding scene space within which we can plan and execute actions (actionable space) may be prioritized early on and processed differently from more distant scene regions.
In the depth-perception literature, many researchers categorize the information available at different depths, linking distance to specific types of processing (Armbrüster et al., 2008; Costantini et al., 2011; Cutting & Vishton, 1995; Previc, 1998). For instance, by dividing space into peripersonal, actionable, and vista spaces (Costantini et al., 2011; Cutting & Vishton, 1995), researchers have found that different cues are extracted with increasing depth, such as motion perspective (i.e., motion parallax), height (i.e., in the field), and relative density (i.e., texture gradient). Thus, there are functionally different types of information available across depth. Furthermore, this categorization of spatial proximity introduces an interesting framework from which to consider the nexus of processing scene context, objects, and actions (e.g., Bonner & Epstein, 2017; Castelhano & Pereira, 2018; Castelhano & Witherspoon, 2016; Josephs et al., 2016).
Influence of the foreground
The current study suggests that the foreground bias may extend to later processing. Although the response bias for the foreground dissipated with increased exposure, it was never reversed, even when the background was directly fixated or when the task changed to focus on the scene as a whole. Thus, it seems that the influence of the foreground continued. This is consistent with the few studies examining foreground and background processing in other tasks. For instance, Mazza et al. (2005) found in a change-detection task that changes were detected more quickly in the scene foreground than the scene background. More recently, we found that during visual search, target objects were found faster when they were located in the foreground than in the background (even when object size was controlled; Man et al., 2019). Together, these studies suggest that prioritizing the foreground may continue to exert influence in later processing, but further research is needed to delineate its extent.
Conclusion
The current results have implications for models of scene representations and the representations of an observer’s immediate surrounding space. The present study suggests that consideration of different categories of space across depth offers a framework within which different types of scene processing can be understood. With increased accessibility to techniques such as virtual reality environments, we believe that this theoretical approach could offer new insights into exploring visual processing in the real world and processing differences across the z-axis of scenes.
Supplemental Material
sj-pdf-1-pss-10.1177_0956797620984464 – Supplemental material for The Foreground Bias: Initial Scene Representations Across the Depth Plane
Supplemental material, sj-pdf-1-pss-10.1177_0956797620984464 for The Foreground Bias: Initial Scene Representations Across the Depth Plane by Suzette Fernandes and Monica S. Castelhano in Psychological Science
Footnotes
Acknowledgements
We thank Ellen O’Donoghue, Louisa Man, Morgan Vallati, Elysée Kukwabantu, and Shane Kennedy for their help with data collection.
Transparency
Action Editor: Patricia J. Bauer
Editor: Patricia J. Bauer
Author Contributions
M. S. Castelhano conceived and designed the study. S. Fernandes analyzed and interpreted the data under the supervision of M. S. Castelhano. S. Fernandes drafted the manuscript, and M. S. Castelhano provided critical revisions. Both authors approved the final manuscript for submission.
Notes
References
Supplementary Material
Please find the following supplemental material available below.
For Open Access articles published under a Creative Commons License, all supplemental material carries the same license as the article it is associated with.
For non-Open Access articles published, all supplemental material carries a non-exclusive license, and permission requests for re-use of supplemental material or any part of supplemental material shall be sent directly to the copyright owner as specified in the copyright notice associated with the article.