
Abstract
In this study, we investigated whether alertness training in healthy older adults increases visual processing speed (VPS) and whether functional connectivity in the cingulo-opercular network predicts training gain. Using the theory of visual attention, we derived quantitative estimates of VPS before and after training. In Study 1, 75 healthy older adults participated in alertness training, active-control training, or no training (n = 25 each). A significant Group × Session interaction indicated an increase in VPS in the alertness-training group but not in the control group, despite VPS not differing significantly between groups before training. In Study 2, 29 healthy older adults underwent resting-state functional MRI and then participated in alertness training. Pretraining functional connectivity in the cingulo-opercular network correlated with the individual training-induced change in VPS. In conclusion, results indicate that alertness training improves visual processing in older adults and that functional connectivity in the cingulo-opercular network provides a neural marker for predicting individual training gain.
Keywords
Age increases the risk for cognitive decline and dementia (Park & Reuter-Lorenz, 2009). Visual processing speed (VPS) decreases with aging (McAvinue, Habekost, et al., 2012; Ruiz-Rizzo et al., 2019), especially in individuals at risk for dementia (Ruiz-Rizzo et al., 2017). VPS is essential for all tasks involving visual information processing (for a review, see Habekost, 2015) and, hence, influences global cognitive performance (Deary, Johnson, & Starr, 2010; Park & Reuter-Lorenz, 2009) and the performance of daily-living activities. Accordingly, identifying effective means to counteract VPS decline is crucial for prolonging older adults’ functional independence.
Quantification of VPS and evaluation of treatment effectiveness is possible using the computational theory of visual attention (TVA; Bundesen, 1990). In TVA-based psychophysical paradigms, participants are briefly presented with letter arrays and instructed to report either all or only specific letters (whole and partial report, respectively). By modeling report accuracy as a function of effective exposure time, researchers can estimate core visual attention parameters (i.e., VPS, visual short-term memory [VSTM] capacity, visual threshold, and top-down control) mathematically independently from each other. Empirical investigations (e.g., Finke et al., 2005; Habekost, 2015) support the assumption that the parameters obtained represent relatively dissociable processes. Because the report is verbal without speed stress, performance is determined by perceptual, rather than motor, capabilities.
The TVA posits a direct influence of alertness, that is, the brain’s arousal or “readiness” state (Posner, 2008), on VPS but not on other TVA parameters (Bundesen, 1990; Bundesen, Vangkilde, & Habekost, 2015). It assumes that multiple objects in the visual scene compete for selection into a VSTM store of limited capacity, where the processing rate of a given object is determined by the number and activity of the neurons coding this object. Summing the processing rates across all objects gives an observer’s total VPS (in elements per second). Alertness is assumed to enhance the activity of object-coding neurons (see Section 1 in the Supplemental Material available online). Thus, when all stimuli are task relevant, as in whole-report paradigms, increased alertness will boost all processing rates, resulting in a proportional increase in VPS. Consistent with this, other findings have shown that VPS increases following psychostimulant intake (Finke et al., 2010) and phasic alerting cues (Haupt, Ruiz-Rizzo, Sorg, & Finke, 2020), in which alerting-cue intensity monotonically increased only the VPS parameter C and not other TVA parameters (Petersen, Petersen, Bundesen, Vangkilde, & Habekost, 2017). Thus, we hypothesized that targeted, computerized tonic-alertness training would also increase VPS in healthy older adults.
Older adults benefit from computerized cognitive training (Anguera et al., 2013; Ball, Edwards, & Ross, 2007; Kueider, Parisi, Gross, & Rebok, 2012). However, individual training responses show substantial variability (Guye, De Simoni, & von Bastian, 2017). Arguably, training procedures are effective only when applied to individuals who actually profit. Thus, identification of a neural marker for the degree of training-induced VPS change could help predict an individual’s training benefit (Zokaei, MacKellar, Čepukaitytė, Patai, & Nobre, 2017).
Resting-state functional MRI (fMRI) studies have linked tonic alertness to ongoing activity (Sadaghiani et al., 2010) of the cingulo-opercular network (CON), 1 which includes anterior cingulate cortex, insula, frontal operculum, and thalamus (Dosenbach et al., 2006; Seeley et al., 2007). Resting-state fMRI permits analysis of functional connectivity, that is, the temporal correlation of spontaneous blood-oxygen-level-dependent fMRI fluctuations among brain regions, at a frequency of less than 0.1 Hz (Fox & Raichle, 2007). Previous work has revealed that age-related decreases in VPS parameter C are related to decreased functional connectivity in the CON (Ruiz-Rizzo et al., 2019). Accordingly, we hypothesized that individual CON functional connectivity measured prior to alertness training would also predict the individual training benefit in VPS parameter C in older adults.
Statement of Relevance
How fast we process visual information is essential for everyday activities. Because this ability declines with age, investigating how to counteract this decrease is critical. Using a computerized task and mathematical modeling of performance, we can measure the speed of visual information processing. In two studies, we assessed whether alertness training can increase visual processing speed and whether this increase relates to brain connectivity measured with resting-state functional MRI before training. As expected, older adults participating in alertness training increased their visual processing speed compared with those participating in control or no training. Moreover, participants with higher connectivity between frontal and insular brain regions before alertness training also increased their visual processing speed more after training. These results are important because they reveal a noninvasive, economic, and effective means to counteract the slowing of visual processing that comes with aging. Furthermore, we identified a brain marker that could, in the future, help predict who can profit from alertness training on an individual basis.
In Study 1, we tested whether an adaptive, tonic alertness training (CogniPlus; Sturm, 2007) would increase VPS parameter C in 25 healthy older adults. This training is specifically designed to enhance intrinsic alertness (Sturm, 2007), activates alertness regions (including insula and anterior cingulate cortex; Clemens et al., 2013), and is effective in patients with brain damage (Thimm, Fink, Küst, Karbe, & Sturm, 2006). To control for retest effects, we included a passive-control group (n = 25). To control for nonspecific factors, such as placebo effects, computer use, and social interactions, we also included an active-control group (n = 25), who performed an n-back updating task (Buschkuehl, Jaeggi, Kobel, & Perrig, 2007) of identical duration and intensity as the specific alertness training. To verify that the alertness-training effects are interpretable as an increase in the targeted VPS parameter C, we assessed whether potential effects on whole-report performance could alternatively result from changes in attentional parameters that, although not thought to rely on alertness (cf. Bundesen et al., 2015), might nevertheless influence the reportability of briefly presented stimuli, namely, visual threshold, VSTM capacity, and top-down control.
In Study 2, we aimed to identify a neural marker for individual alertness-training gain. On the basis of previous work (Ruiz-Rizzo et al., 2019), we hypothesized that individual variability in CON functional connectivity prior to training would predict VPS increase variability. We applied resting-state fMRI and TVA-based assessment in an independent sample of 29 older adults. We examined the association between functional connectivity and VPS change. In control analyses, we tested the specificity of the relationship between CON functional connectivity and VPS, first, by examining the association between VPS change and functional connectivity in other brain networks not previously linked to VPS (visual, dorsal-attention, right-frontoparietal, and default-mode networks) but to other visual attention functions (Ruiz-Rizzo, Neitzel, Müller, Sorg, & Finke, 2018) or aging (Ferreira & Busatto, 2013). Second, we tested this relationship by examining the association between CON functional connectivity and changes in other TVA parameters (visual threshold, VSTM capacity, and top-down control).
Method
Participants
In Study 1, 75 healthy older participants took part in alertness training (n = 25; age: M = 69.1 years, SD = 6.6), active-control training (n-back task; n = 25; age: M = 68.0 years, SD = 6.1), or no training (passive-control group; n = 25; age: M = 68.8 years, SD = 5.4; Table 1). Sample sizes were based on power analyses following Finke et al. (2010; Study 1) and Ruiz-Rizzo et al. (2018; Study 2). Participants in the specific alertness-training and active-control groups were blinded to whether they underwent the intervention of interest or the control intervention. Twenty-nine participants took part in Study 2 (age: M = 69.8 years, SD = 4.4). Initially, we tested 82 participants in Study 1 and 40 in Study 2. In each study, some participants were excluded because of health, motivational, or technical issues (Study 1: two participants in the alertness training, one in the active-control group, and four in the passive-control group; Study 2: 11 participants; for details, see Section 2 in the Supplemental Material). Participants were recruited through flyers and tested at Ludwig-Maximilians-Universität München (Studies 1 and 2) and Humboldt-Universität zu Berlin (Study 1).
Demographic Data and Questionnaire Scores for All Participant Groups
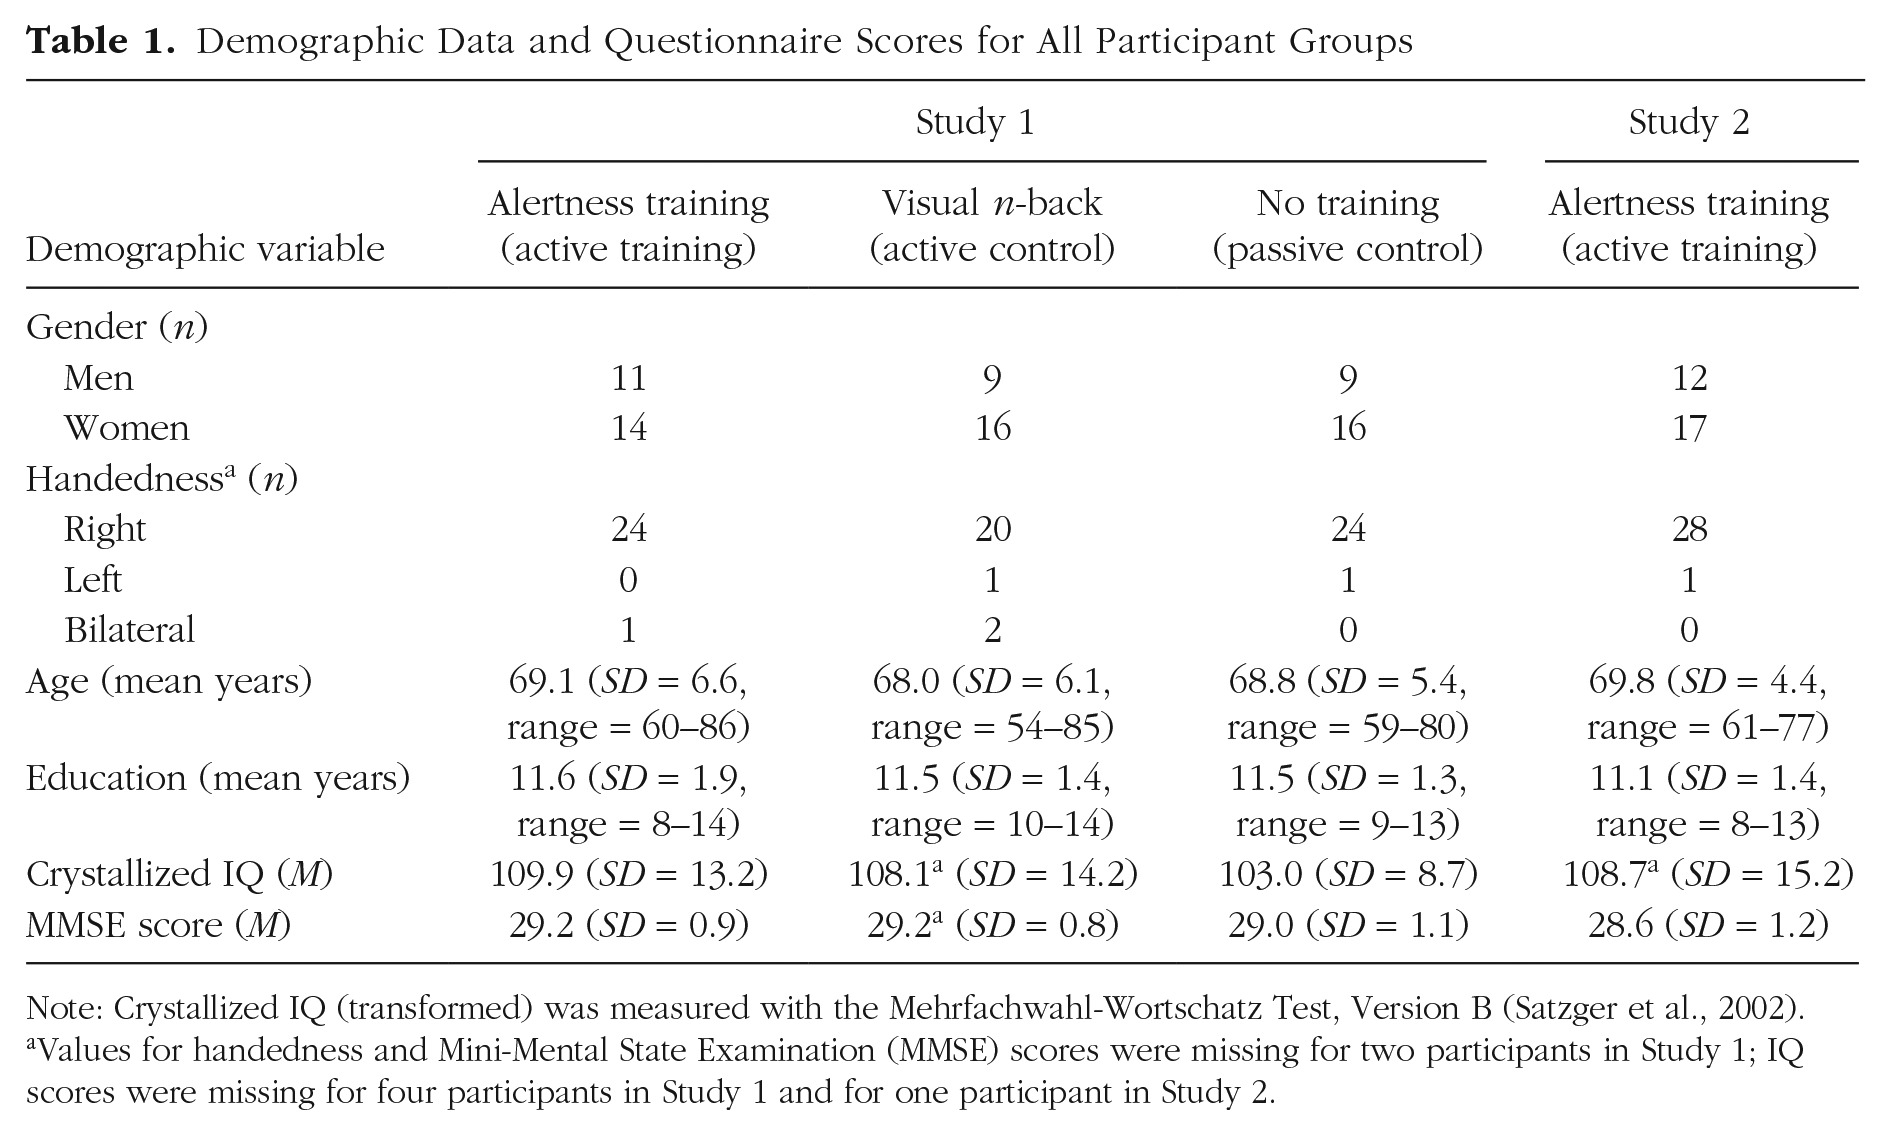
Note: Crystallized IQ (transformed) was measured with the Mehrfachwahl-Wortschatz Test, Version B (Satzger et al., 2002).
Values for handedness and Mini-Mental State Examination (MMSE) scores were missing for two participants in Study 1; IQ scores were missing for four participants in Study 1 and for one participant in Study 2.
All participants had normal or corrected-to-normal vision; were not color-blind; and had no neurological, psychiatric, or systemic diseases (e.g., depression, stroke, diabetes) or signs of dementia (Mini-Mental State Examination, MMSE ≥ 27; Folstein, Folstein, & McHugh, 1975). No participant in Study 2 had MRI contraindications or clinically relevant vascular or white-matter lesions, judged by a neuroradiologist. Crystallized intelligence was measured with the Mehrfachwahl-Wortschatz Intelligence Test (Lehrl, 1999). In Study 1, the groups did not differ significantly in gender, handedness, age, IQ, MMSE score, or education (ps > .128; Table 1). All participants gave informed written consent according to the Declaration of Helsinki II. The studies were approved by the ethics committees of Ludwig-Maximilians-Universität München (02_Finke_b), Klinikum Rechts der Isar of the Technische Universität München (436/14), and Humboldt-Universität zu Berlin (2012-34-R). Participants were paid for taking part.
General procedure
Participants performed a short familiarization session and, on another day, the complete whole- and partial-report pretest (Fig. 1a). For 5 to 6 weeks, the alertness-training and the active-control groups participated in 16 training sessions lasting 45 min each. The training of interest consisted of an alertness task, whereas the active-control training involved a visual n-back task. All participants who started training completed all sessions. The passive-control group did not participate in any training. After the 5- to 6-week period, all participants completed a whole- and partial-report posttest session. In Study 2, participants underwent resting-state fMRI before behavioral testing and alertness training.
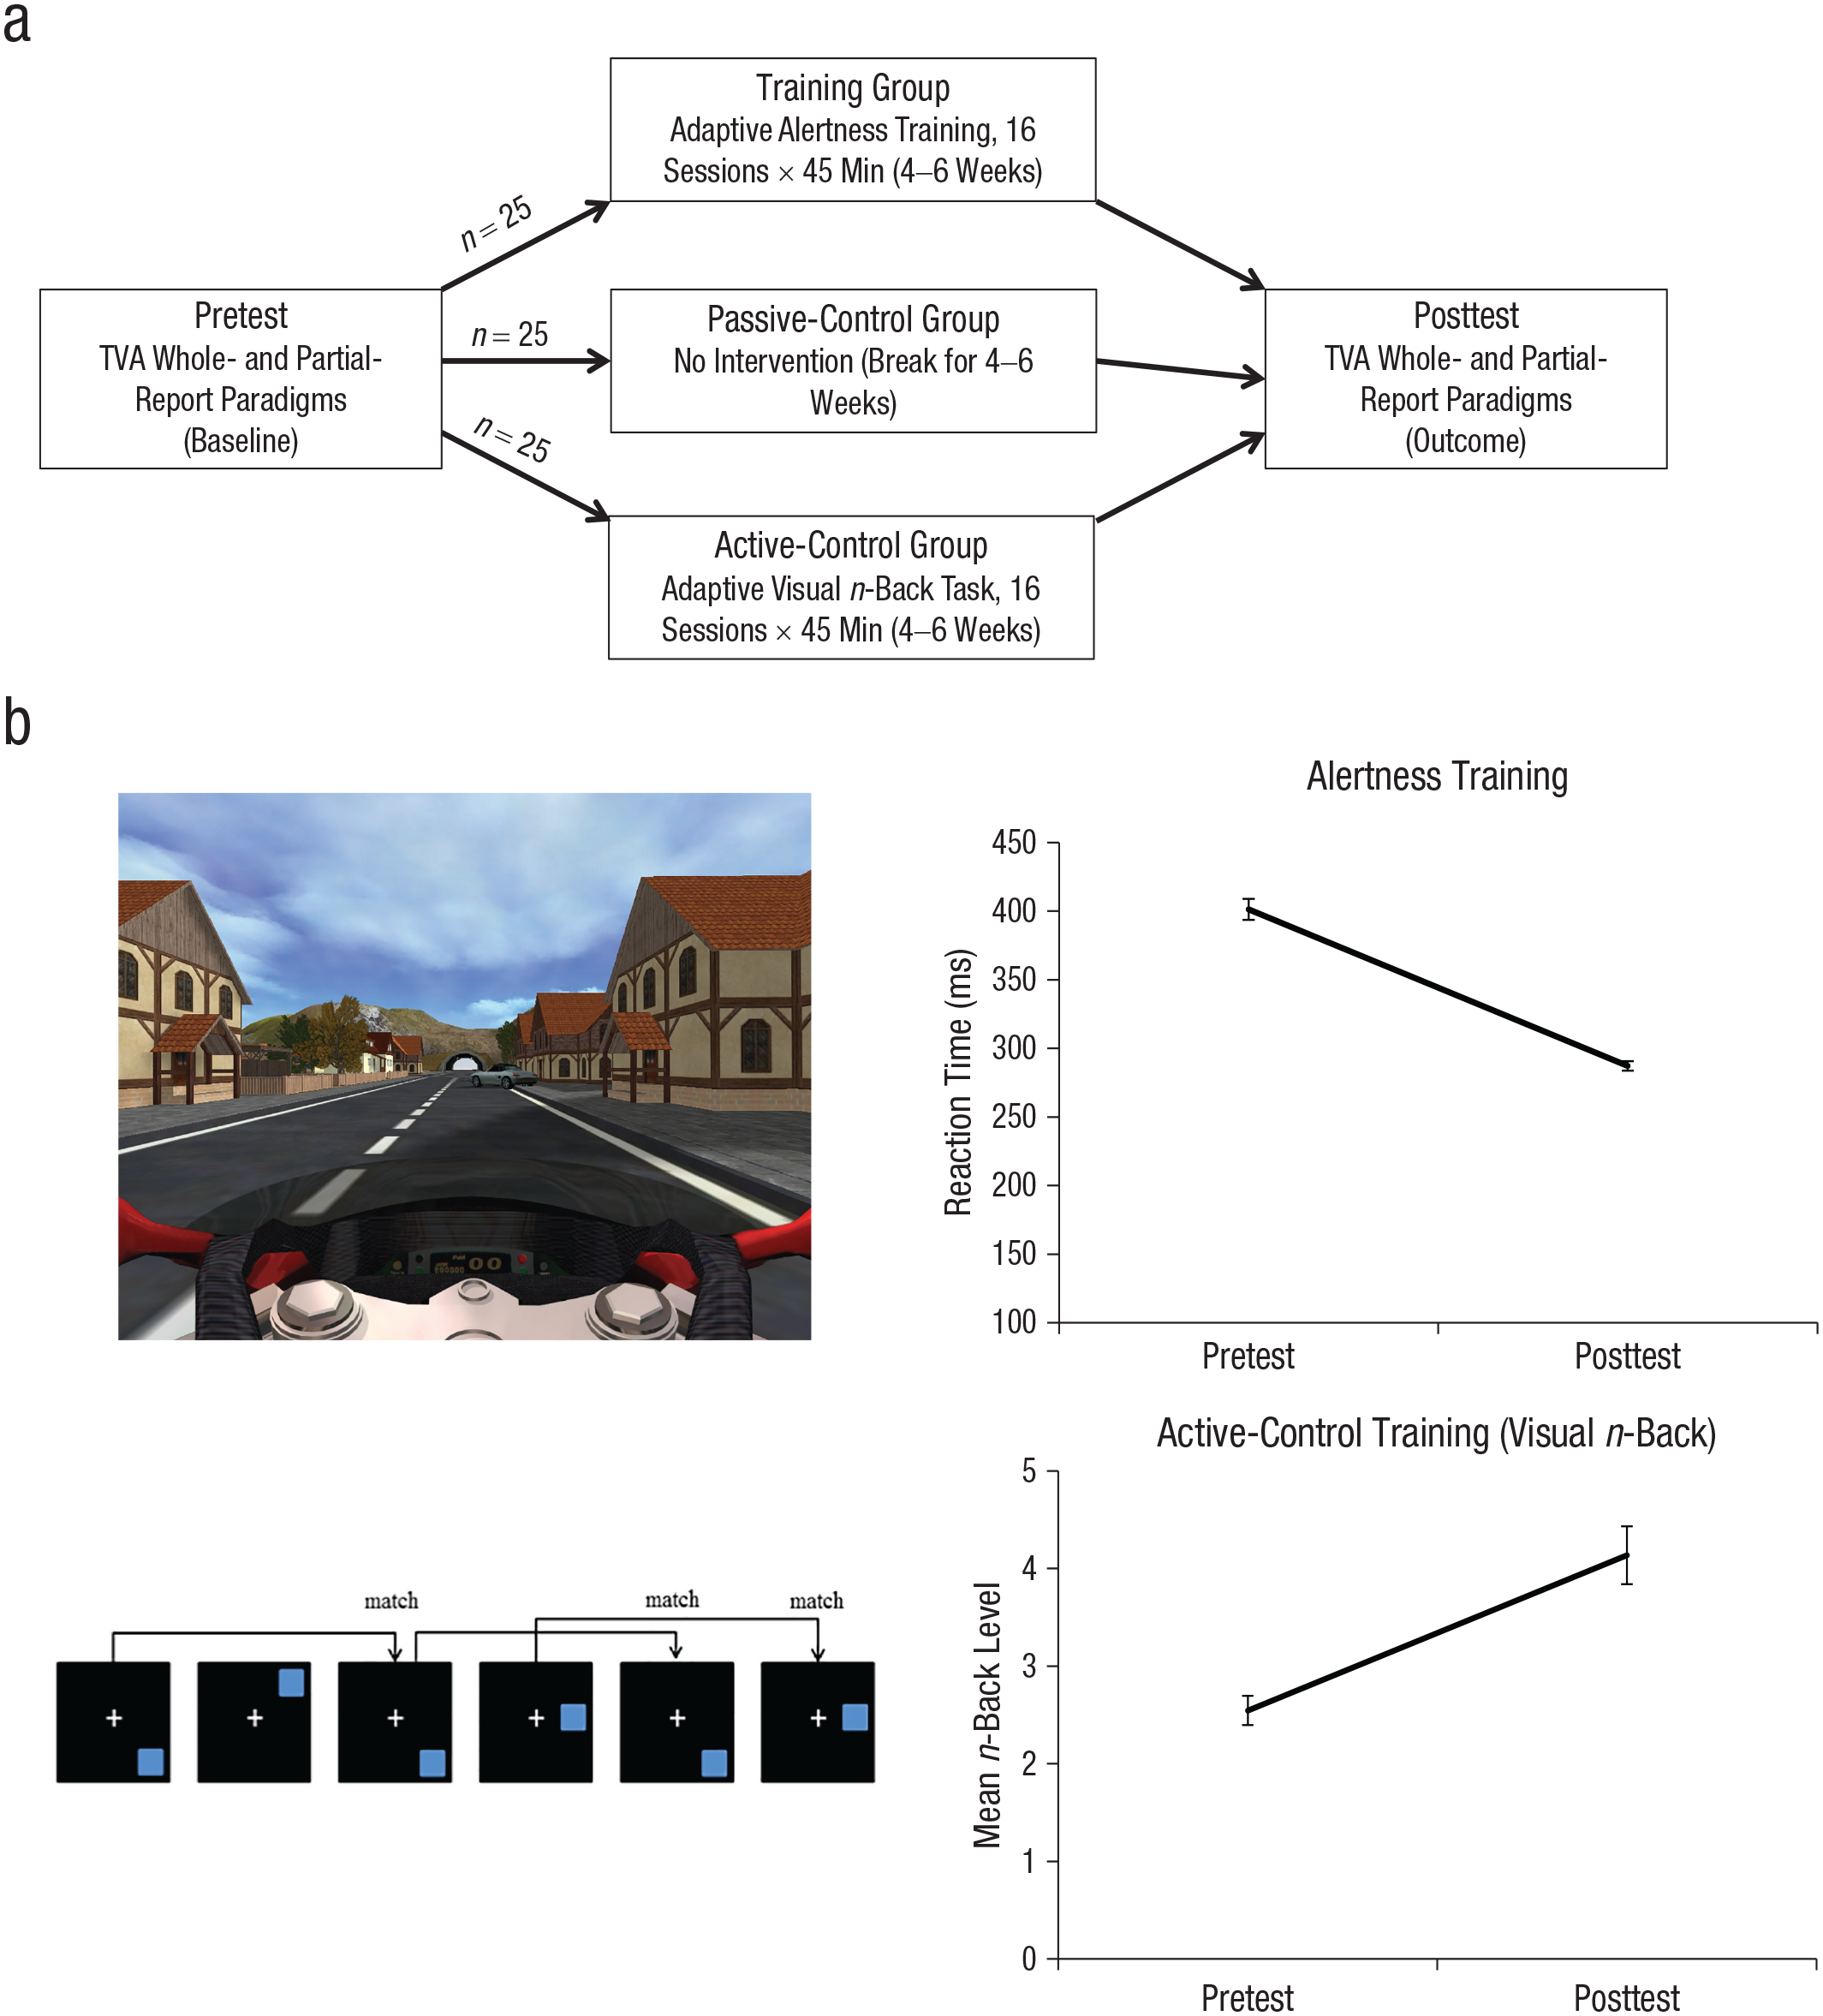
Study design and task performance. The study sequence for each of the three groups in Study 1 is shown in (a). In the alertness-training task (b, top left), participants had to react to obstacles (a crossing car in this example) by pressing the Enter key as fast as possible. In the actual displays, the scene was darker and foggier (Studies 1 and 2). In the two-back version of the visual n-back control training (b, bottom left), participants had to press “A” when the current square position matched the square position two displays back. Participants’ performance in the alertness-training and active-control tasks (b, right top and right bottom, respectively) is shown for the first and the last training sessions in Study 1. Error bars indicate standard errors of the mean. TVA = theory of visual attention.
Alertness-training and active-control tasks
Within a given group (i.e., either alertness training or active control), several participants performed the computerized tasks simultaneously yet separated by two empty seats or nontransparent screens. Each session started at the easiest level, which was, thereafter, gradually adjusted to performance.
Alertness-training task
We used the CogniPlus ALERT S2 training of intrinsic alertness (Version 2.04; Sturm, 2007; Fig. 1b) as the specific training of interest. Participants saw a video-game-like colored simulated motorcycle ride from the driver’s perspective (i.e., facing the handlebar and the road ahead). Although the motorbike’s increasing speed was not under participants’ control, they needed to monitor the drive closely and constantly because objects that appeared at various locations along the road (e.g., deer, trees, parked cars, traffic lights) could turn into obstacles. When this happened, participants’ task was to simply press a key as fast as possible. As in typical intrinsic-alertness tasks, the critical stimuli were unpredictable and not preceded by warning cues.
If the response was made in time (classified as a hit), the motorcycle stopped, and the obstacle disappeared. If not, an emergency brake, a loud noise, and a yellow exclamation mark indicated a miss. Key presses in the absence of obstacles were counted as false alarms. The adaptive training involved 18 difficulty levels (see Section 3.1 in the Supplemental Material).
Active-control task
Placebo effects and potential differences in task motivation and expectations were controlled for by using a visual n-back task (Fig. 1b; Buschkuehl et al., 2007; Green et al., 2019), which is cognitively demanding but not designed to enhance alertness, VPS, or any other TVA parameters (including VSTM capacity; although n-back training is assumed to enhance higher order functions, such as working memory updating and fluid intelligence, it is not thought to increase passive short-term storage). Participants saw a series of trials consisting of a fixation cross continuously presented in the screen center and squares randomly presented for 3 s at diverse locations (Fig. 1b). When the current location of the square matched the location of the square n trials back, participants had to press a key. The adaptive task levels varied in the value of n (Buschkuehl et al., 2007; see Section 3.2 in the Supplemental Material).
TVA-based assessment of visual attention parameters
Study 1
Participants first completed the whole-report and then the partial-report paradigm within about 1 hr. All trials were presented on a PC monitor with a black background. Participants saw a central fixation cross (0.3°) for 300 ms, followed 100 ms later by briefly presented red or green letters (0.58° high × 0.48° wide; drawn from the set {ABEFHJKLMNPRSTWXYZ}). The same letter could appear only once per trial. Individual exposure durations were determined in pretest phases. Stimuli were either masked by a pattern for 500 ms after presentation (by squares of size 0.5° with an × and a + inside) or were unmasked. Participants reported verbally, in any order and without time pressure, the letters they were fairly certain they had recognized. The experimenter recorded the letters and started the next trial (see Section 4.1 in the Supplemental Material).
Whole report
On every trial, five equidistant red or green letters were presented in a column positioned 2.5° to the left or right of fixation (Fig. 2a) at three different exposure durations. The task was to report as many letters as possible. Half of the trials were masked. Because of visual persistence on unmasked trials, there were six different “effective” exposure durations. The test phase consisted of 192 trials with randomized and equal frequency of the 12 different conditions (2 hemifields × 2 masking conditions × 3 exposure durations) in each of four blocks. Performance accuracy (number of letters reported correctly) was measured as a function of (effective) exposure duration (Fig. 2a).
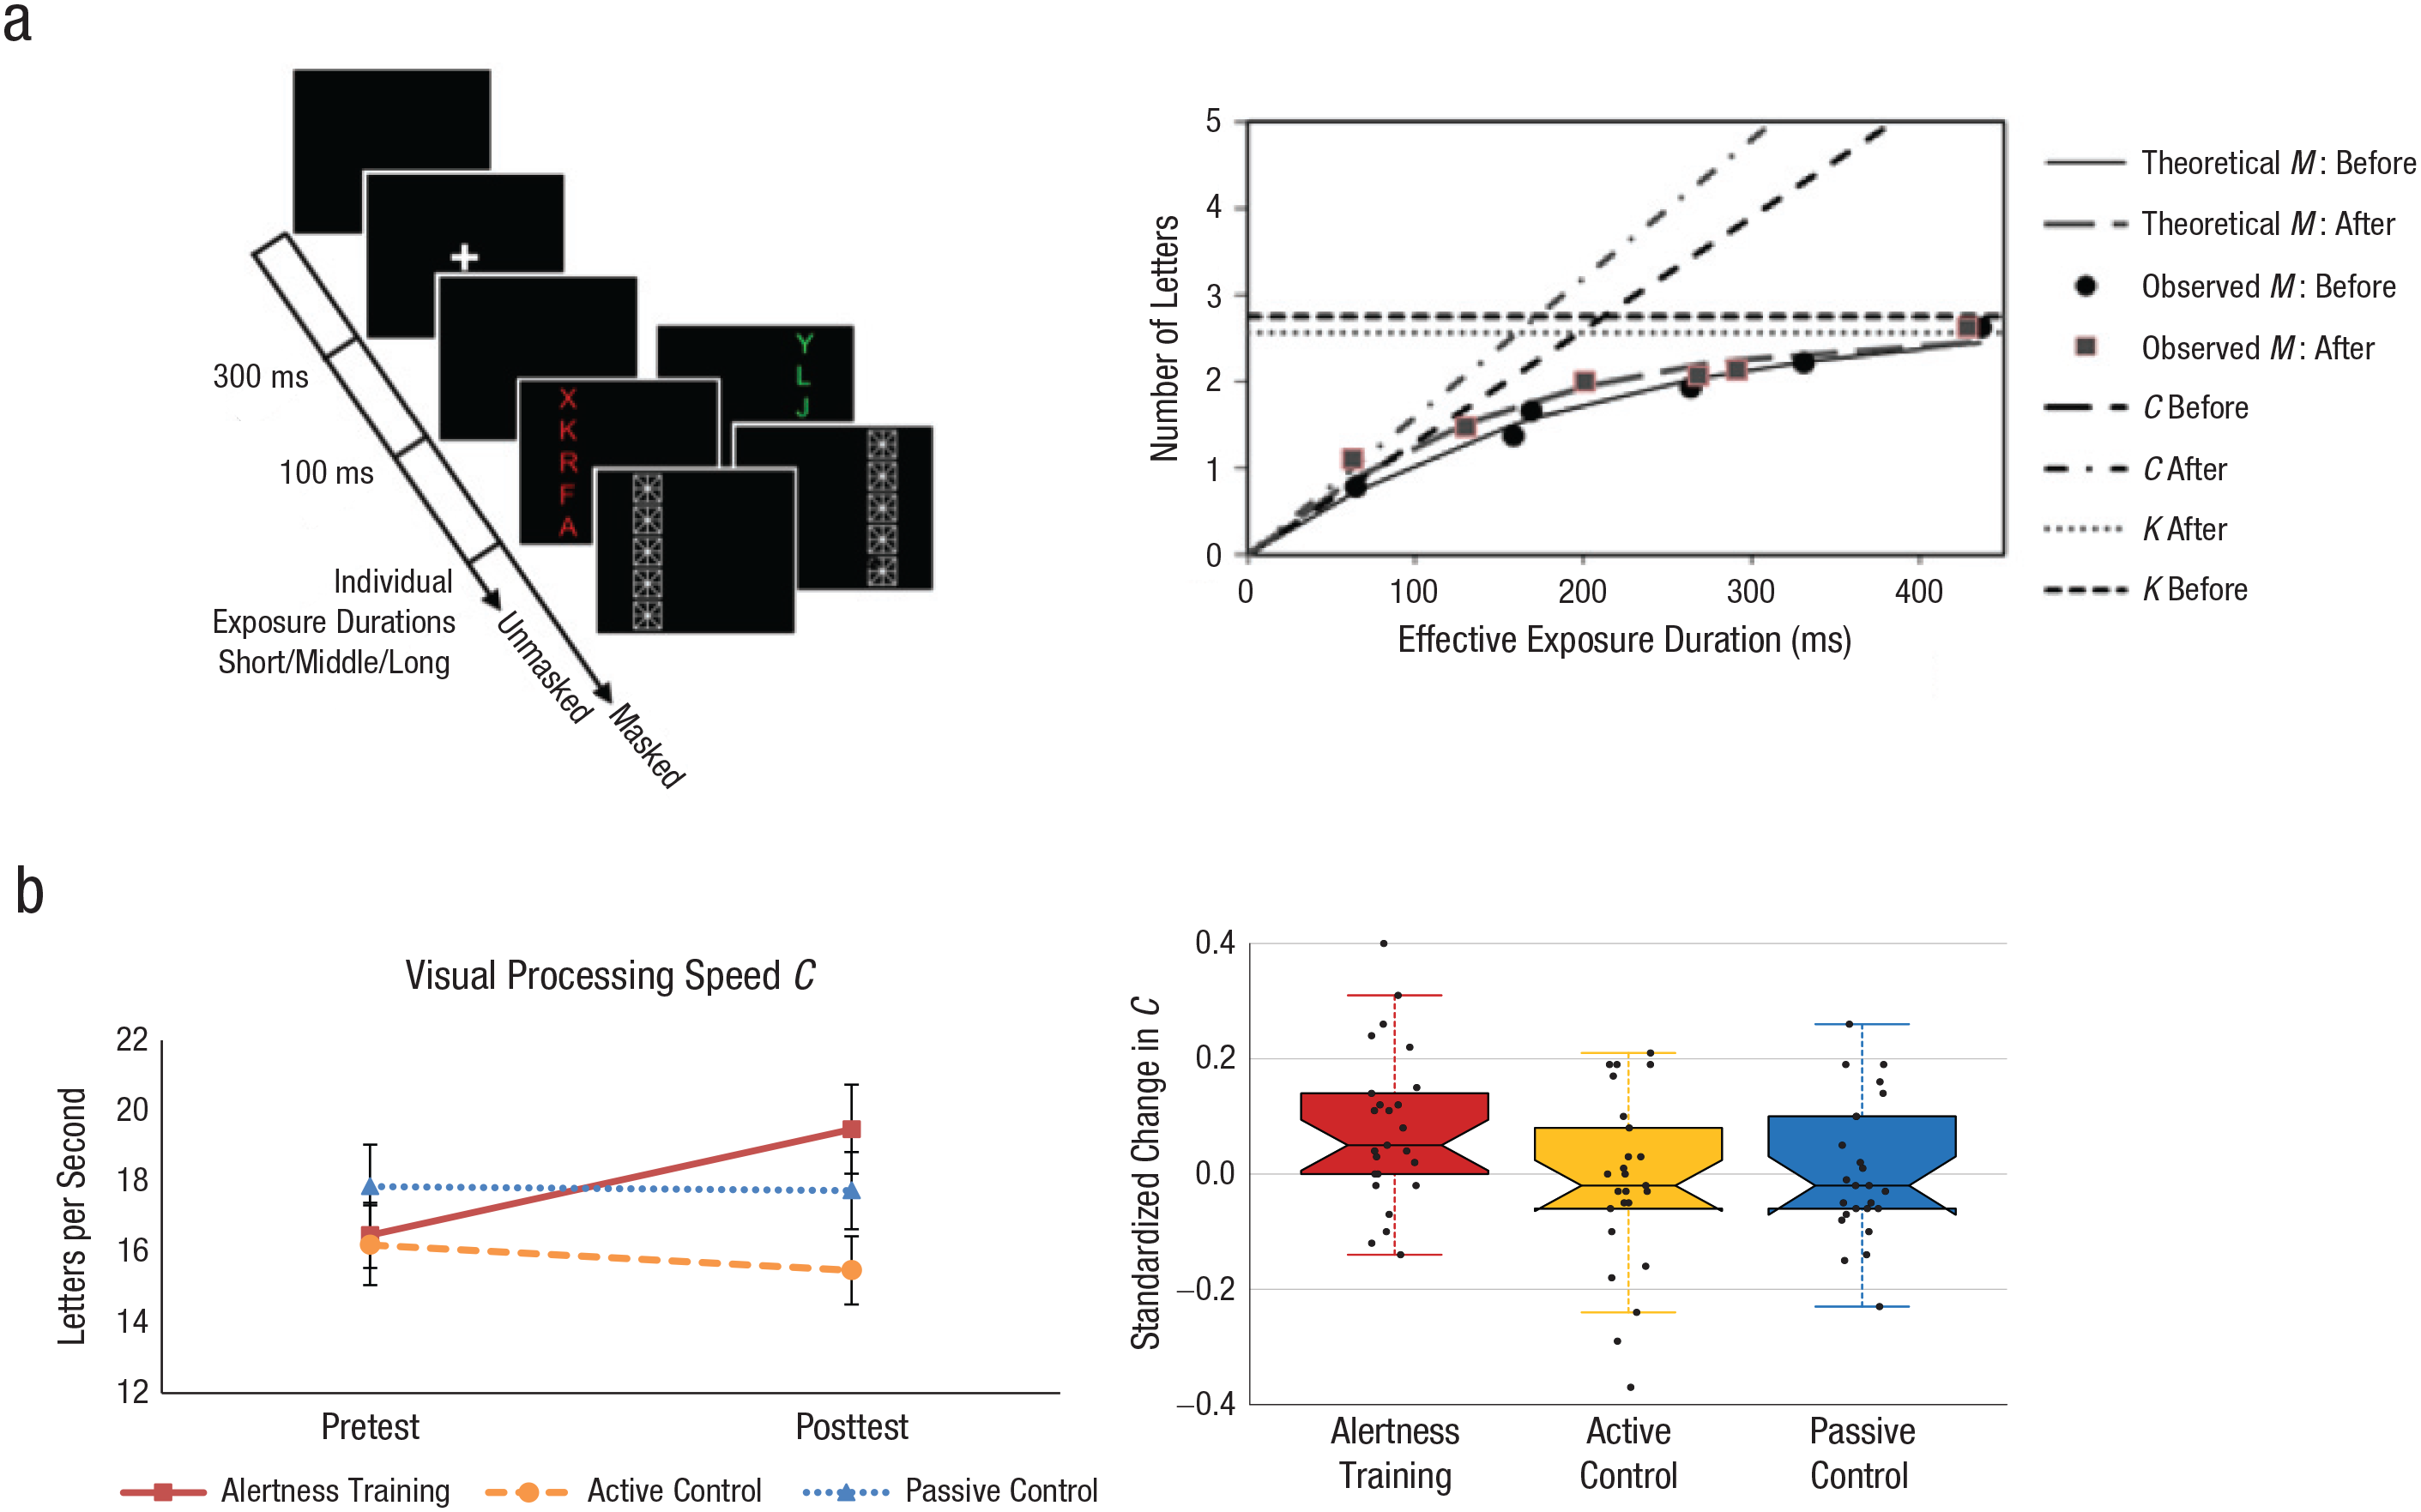
Visual processing speed parameter—assessment, modeling, and results in Study 1. Example displays and trial sequence (a, left) are shown for the whole-report paradigm, in which participants had to report as many letters as possible. The letters were either all red or all green, and they were masked after participants briefly viewed them. Whole-report performance for a representative participant of the experimental training group (a, right) is shown at pretest and posttest. The mean number of correctly identified letters is graphed as a function of effective exposure duration. The functions’ slopes at their origin correspond to visual processing speed C, and their asymptotes correspond to visual short-term-memory storage capacity K; the estimated C and K parameters (before and after training) are depicted as rising and horizontal lines, respectively. The graphs (b) show visual processing speed C measured in (left) letters per second at pretest and posttest and (right) standardized change, (Cafter – Cbefore)/(Cafter + Cbefore), for each of the three participant groups. In the left-hand graph, error bars indicate standard errors of the mean. In the righthand graph, horizontal lines indicate medians, dots indicate individual data points, whiskers mark 1.5 times the interquartile range, and the hinges below and above the median correspond to the first and third quartiles.
Partial report
On each trial, a (red) single target letter, a target plus a (green) distractor letter, or two targets appeared in the corners of a virtual (5° × 5°) square in the screen center. All stimuli were masked. The task was to report targets while ignoring distractors. The test phase consisted of 288 trials across 16 different conditions (four single target, eight target plus distractor, four dual target) appearing in random order and equally frequently within each of six blocks.
Study 2
The Study 2 paradigms were slightly different from those in Study 1 (Fig. 3a; see Section 4.2 in the Supplemental Material). Both versions permitted TVA parameter estimation. However, because physical stimulus characteristics were changed, absolute visual threshold and processing speed could be compared only between participants within, but not across, studies.
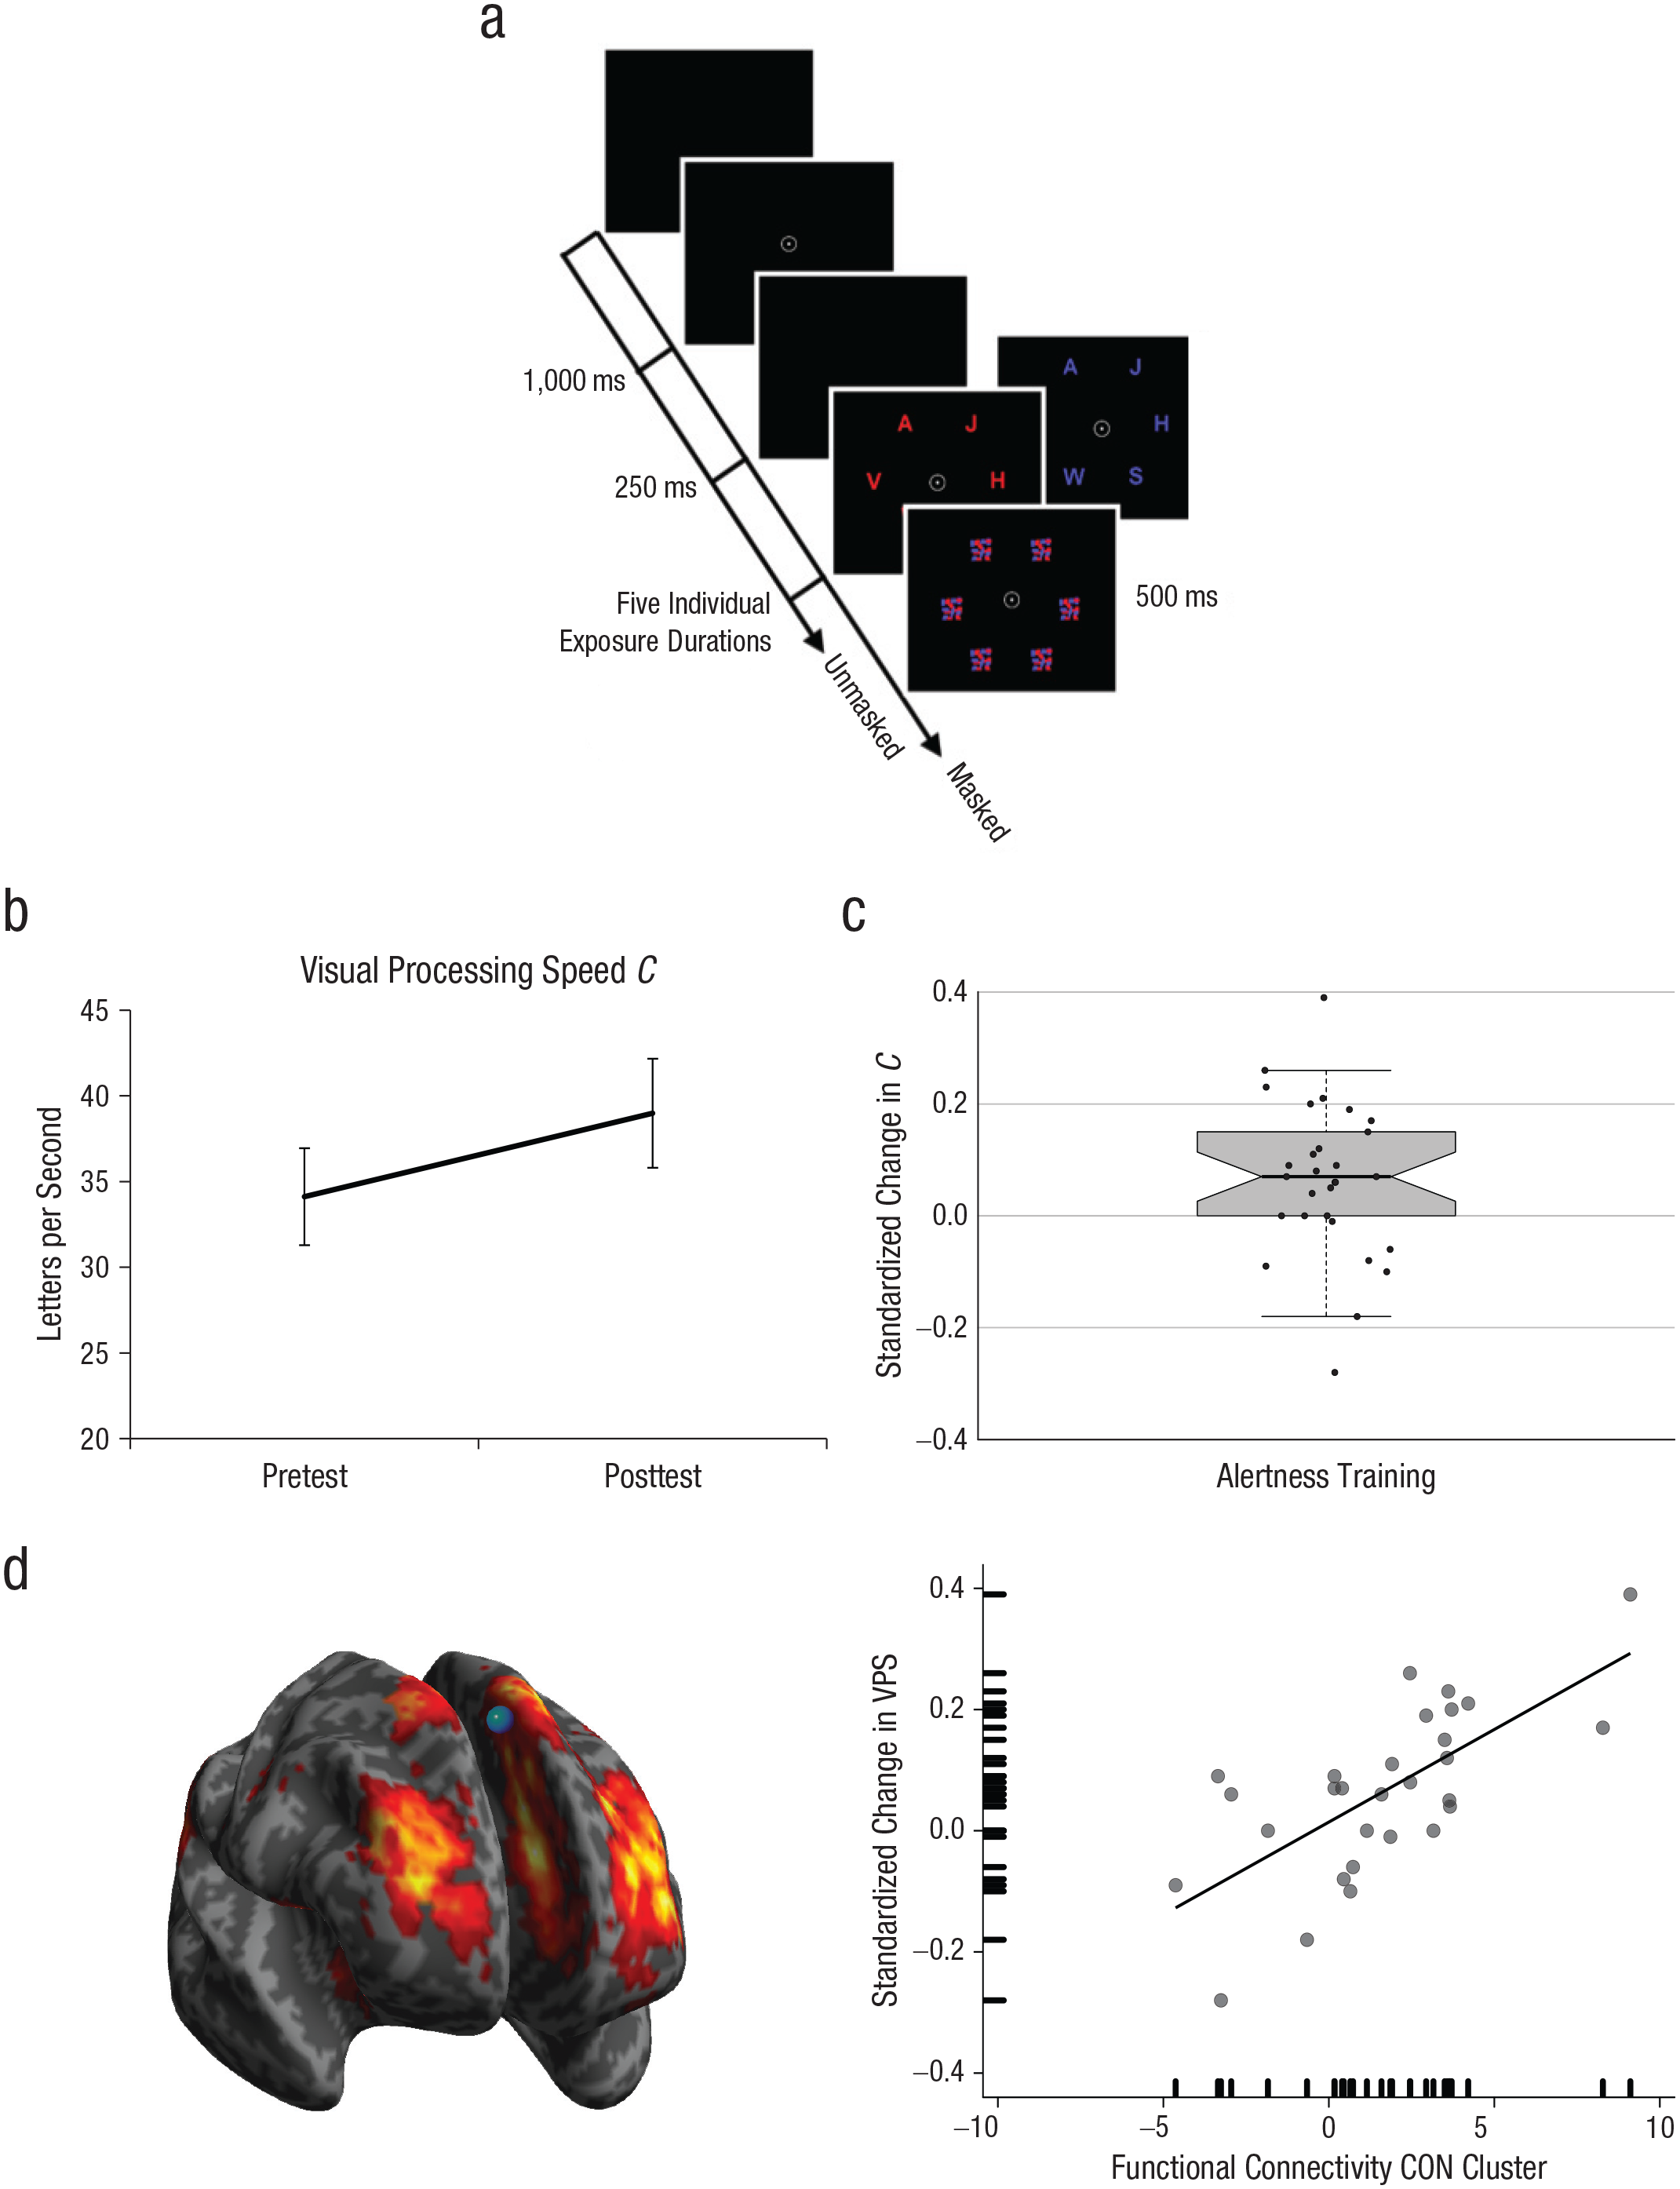
Example of the whole-report paradigm and related results in Study 2. Example displays and trial sequence (a) are shown for the whole-report paradigm, in which participants had to report as many letters as possible. The letters were either all red or all blue, and they were masked after participants briefly viewed them. Visual processing speed (VPS) C in letters per second at pretest and posttest (b) and standardized change in C (c), (Cafter – Cbefore)/(Cafter + Cbefore), are shown for the alertness-training group. Error bars indicate standard errors of the mean. In (c), the horizontal line indicates the median, dots indicate individual data points, whiskers mark 1.5 times the interquartile range, and the hinges below and above the median correspond to the first and third quartiles. The brain image (d, left) shows functional connectivity in the medial superior frontal gyrus cluster (blue point; Montreal Neurological Institute peak coordinates: x = 0, y = 30, z = 60) of the cingulo-opercular network (CON; in warm colors) before alertness training. The scatterplot (d, right) illustrates the relationship between CON functional connectivity and standardized change in VPS. The solid line indicates the best-fitting regression. The marks along the axes show the data distribution for each variable.
TVA parameter estimates
The TVA parameters were estimated by modeling participants’ performance in the whole- and partial-report paradigms (Kyllingsbæk, 2006).
Whole report
The probability of identifying stimuli depending on their effective exposure duration was modeled by an exponential growth function. The function’s slope at its origin gives the number of elements that can be processed per second (VPS C). The asymptote indicates the maximum number of stimuli that are stored in VSTM (storage capacity K). The coordinate (t0, 0) sets the time below which report probability is zero (visual threshold t0, in ms). Goodness-of-fit values quantifying how well the model parameters fitted the observed data did not significantly differ between pretest and posttest in any of the groups in Studies 1 or 2 (see Table S1 in the Supplemental Material).
Partial report
From partial-report performance, the efficiency in prioritizing targets over distractors, top-down control α, can be estimated. Parameter α is defined as the ratio of attentional distractor weights wD to target weights wT, with lower αs indicating better top-down control.
Behavioral data analyses
To ascertain performance improvement in the trained tasks, we compared the first and last sessions (i.e., reaction times in the alertness-training condition and n-back level in the active-control condition) using paired-samples t tests (Fig. 1b). Training gains in VPS were analyzed with a mixed analysis of variance (ANOVA) with the factors group (alertness training vs. active control vs. passive control) and session (pretest vs. posttest). To test the specificity of the alertness-training and VPS relationship, we examined for training effects on other TVA parameters not associated with alertness, using mixed ANOVAs (Study 1) and paired-samples t tests (Study 2). The significance level was p < .05 (two-tailed). To compare the results of both studies, we calculated the standardized individual VPS parameter C change after alertness training: (Cafter – Cbefore)/(Cafter + Cbefore).
Neuroimaging data
MRI data were acquired on a Philips Ingenia 3T system, using a 32-channel SENSE head coil. We collected fMRI T2*-weighted data for 12.5 min during resting state with eyes closed, using a multiband echoplanar imaging sequence (600 volumes, repetition time = 1,250 ms, echo time = 30 ms, flip angle = 70º, matrix size = 64 × 64, 40 slices, voxel size = 3 × 3 × 3.29 mm3). A high-resolution T1-weighted anatomical image was acquired using a 3D magnetization-prepared rapid-acquisition gradient-echo sequence (repetition time = 9 ms, echo time = 4 ms, flip angle = 8º, 170 slices, field of view = 240 × 240 mm2, voxel size = 1 mm3). Individuals’ resting-state fMRI volumes were slice-timing corrected, realigned, coregistered to the individual anatomical volume, segmented, normalized, smoothed, and band-pass filtered (0.01–0.1 Hz). Nuisance covariates (e.g., head-motion parameters and global signal) were regressed out from the data.
After preprocessing, we performed independent component analysis with 20 dimensions (FMRIB Software Library 5.0.9 tool MELODIC; Version 3.14; Smith et al., 2004) and dual regression. On the basis of the spatial similarity with known resting-state networks (see Section 5 in the Supplemental Material), we selected the components representing the CON as the network of interest and those representing the default-mode, dorsal-attention, right-frontoparietal, and visual networks as control networks.
We investigated the association of CON functional connectivity before alertness training with the VPS training benefit by voxelwise regression (SPM12; https://www.fil.ion.ucl.ac.uk/spm/software/spm12/). On the basis of the general linear model, we predicted the functional-connectivity level in the CON voxels from the standardized individual alertness-training-induced change in parameter C. We controlled for age, education, sex, and framewise displacement. To test the specificity of the predicted relation between CON and VPS change, we (a) used the same model to predict functional connectivity in the control networks not thought to be related to alertness and VPS and (b) separately used standardized changes in other parameters not related to alertness according to TVA (K, α, and t0) as predictors for CON functional connectivity. Results were considered significant at p < .05 family-wise-error (cluster-level) corrected (height whole-brain threshold p < .001 uncorrected).
Results
Training effects
Both alertness-training groups showed significant reaction time reductions—Study 1: t(24) = −17.52, p < .001, 95% confidence interval (CI) for the difference between means = [−127.5 ms, −100.6 ms], Cohen’s d = −3.48; Study 2: t(28) = −12.14, p < .001, 95% CI for the mean difference = [−139.4 ms, −99.1 ms], d = −1.96. In addition, the active-control group showed a significant n-back level increase, t(24) = 5.78, p < .001, 95% CI = [1.0, 2.2], d = 1.28 (Table 2).
Means for Trained Measures and Theory of Visual Attention (TVA)-Based Parameters
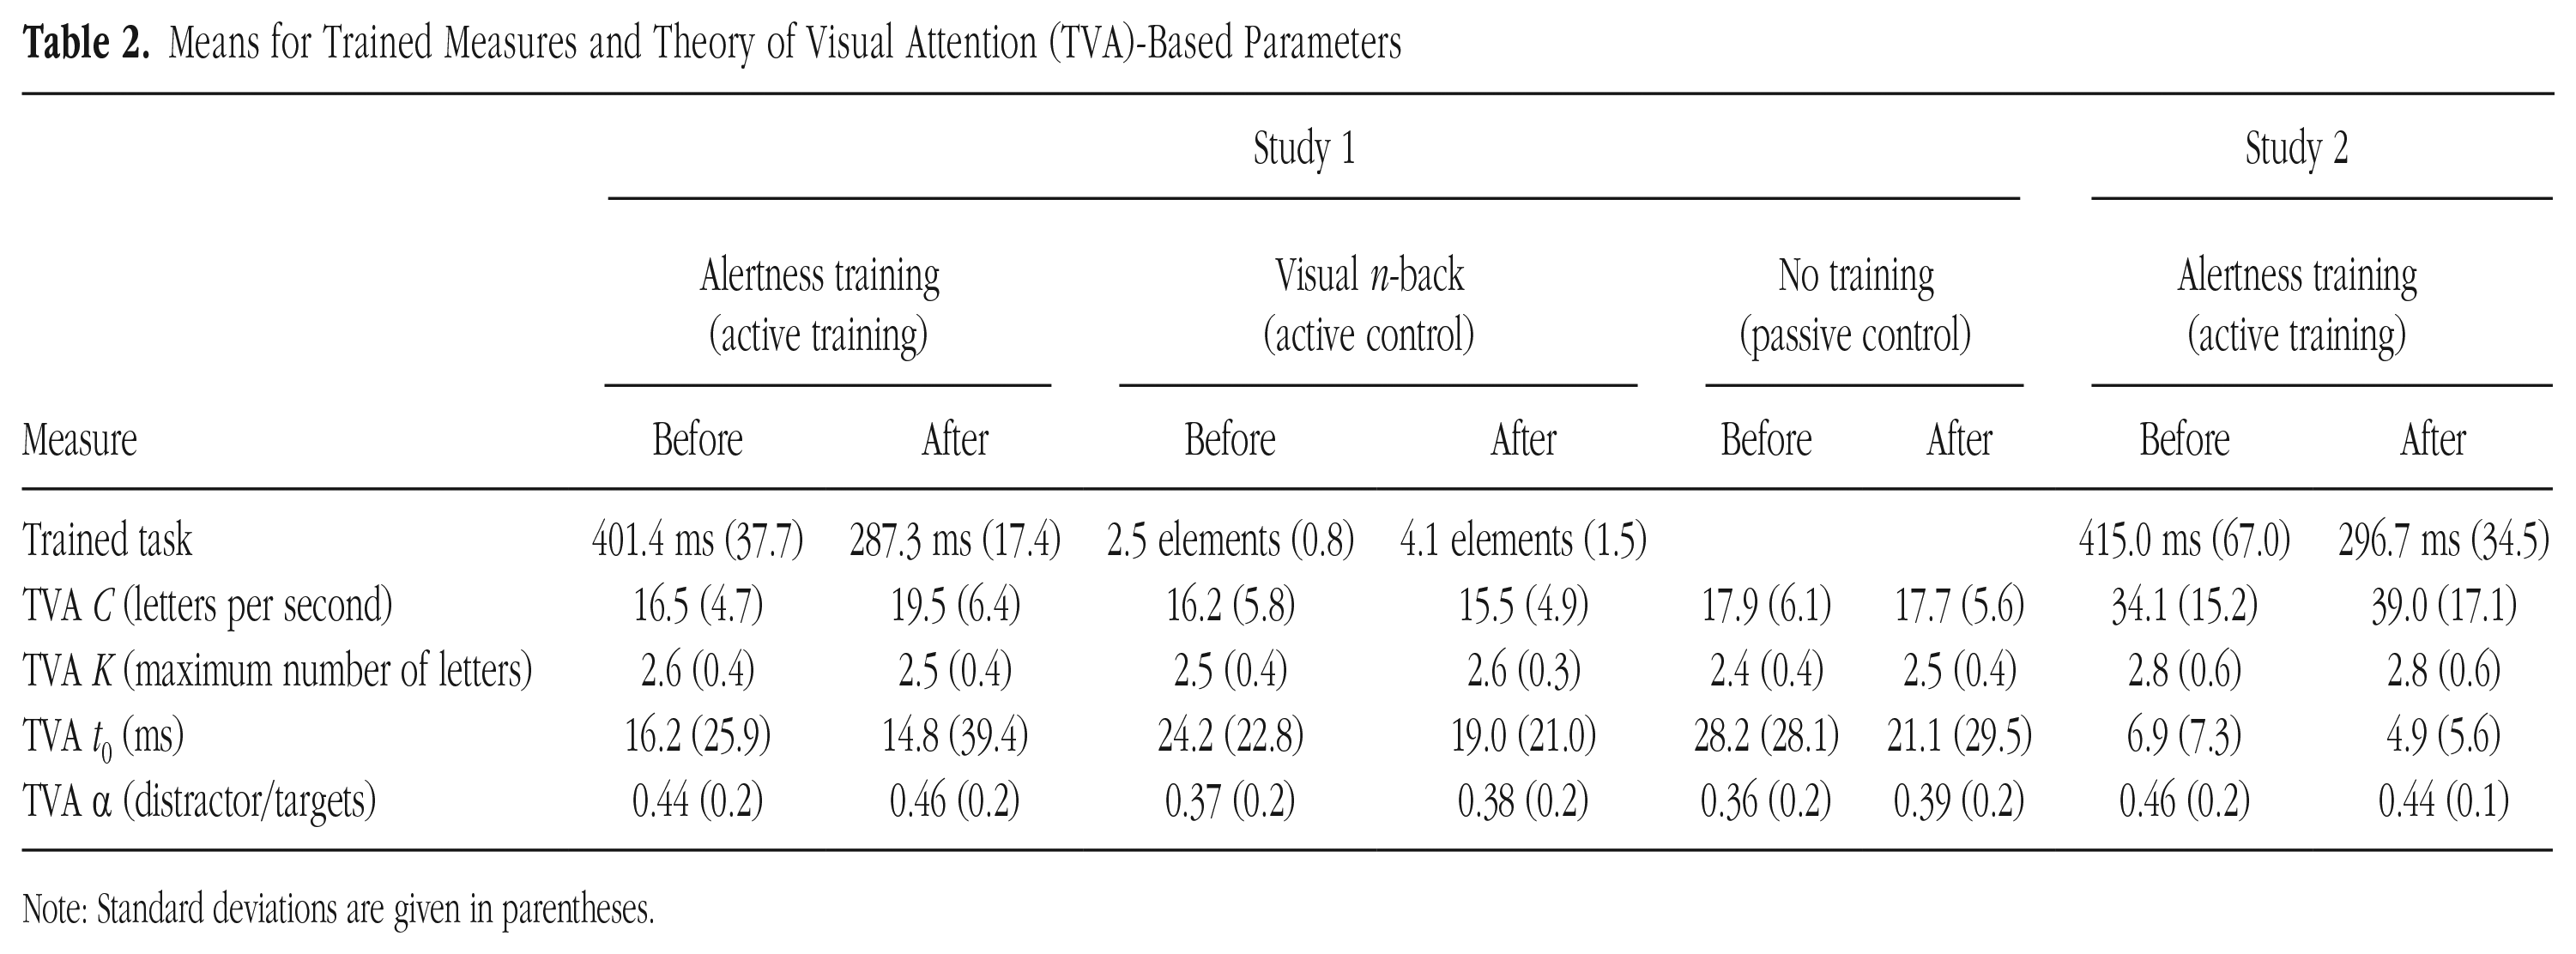
Note: Standard deviations are given in parentheses.
Effects on VPS parameter C
In Study 1, the ANOVA on VPS parameter C revealed nonsignificant main effects—session: F(1, 72) = 1.50, p = .225, η p 2 = .02; group: F(2, 72) = 1.42, p = .249, η p 2 = .04. As hypothesized, the Group × Session interaction was significant, F(2, 72) = 3.82, p = .026, η p 2 = .10 (Fig. 2b). Post hoc pairwise t tests revealed VPS to be significantly higher after training compared with before training in the alertness-training group, t(24) = 2.84, p = .009, 95% CI = [0.8, 5.2], d = 0.25, but not in the other groups (ps > .547; Fig. 2b). At pretest, the groups did not differ, F(2, 72) = 0.65, p = .526; η p 2 = .02, whereas they did differ at posttest, F(2, 72) = 3.13, p = .0497, η p 2 = .08. The significant increase in VPS following alertness training was replicated in Study 2, t(28) = 2.22, p = .035, 95% CI = [0.4, 9.3], d = 0.30 (Fig. 3b). Thus, alertness training can robustly boost VPS C; this effect is due neither to retesting nor to unspecific placebo effects, but it is clearly attributable to the specific alertness training (Table 2).
In Study 1, the standardized VPS change in the alertness-training group was significantly larger than in the other groups—alertness versus active-control groups: t(48) = 2.33, p = .024, 95% CI for the mean difference = [.01, .18], d = 0.66; alertness versus passive-control groups: t(48) = 2.10, p = .041, 95% CI for the mean difference = [.003, .15], d = 0.59 (Fig. 2b). Importantly, it was comparable with that in the alertness-training group in Study 2, t(52) = 0.40, p = .690, 95% CI for the mean difference = [−.06, .09], Cohen’s d = 0.11 (Figs. 2b and 3c).
Control analyses: effects on other attentional parameters
The control analyses revealed no respective Group × Session interaction or other indication of a specific benefit following alertness-training for any TVA control parameters (all ps > .134). Effect tendencies in Study 1 were as follows. For VSTM storage capacity K, the interaction approached significance, F(2, 72) = 2.88, p = .062, η p 2 = .07, indicating a slight increase in the passive-control group versus the other groups at posttest. For visual threshold t0, the main effect of session approached significance, F(1, 72) = 3.94, p = .051, η p 2 = .05. This effect was significant in Study 2, t(28) = −2.10, p = .045, 95% CI for the mean difference = [−3.9, −0.04], d = 0.29 (other parameters in Study 2: p > .352), indicating a modest general test-repetition effect across samples. Post hoc examination (based on standardized change values of C and t0, respectively, across both alertness-training groups) confirmed that the training-related increase in VPS was uncorrelated with the decrease in visual threshold (r = .06, p = .671, 95% CI = [−.21, .32]). These control analyses corroborate a specific training-induced improvement of VPS parameter C that is not alternatively explained by changes in (other) visual attention functions that, although not thought to rely on alertness, also influence the number of items that can be reported from briefly presented displays (Table 2).
CON functional connectivity before alertness training as a potential marker for individual training benefit
CON functional connectivity and training-induced VPS change
One cluster in the CON positively correlated with alertness-training-induced VPS change (Fig. 3d). In particular, higher individual functional connectivity in medial superior frontal gyrus (peak Montreal Neurological Institute coordinates: x = 0, y = 30, z = 60; k = 51 voxels; z = 4.57; family-wise-error-corrected cluster-level p value = .010) was associated with increased VPS benefit. Figure 3d depicts this cluster’s location overlaid on the CON (left), while also illustrating the individual values within this cluster and their relationship with VPS (right).
Control analyses: specificity of the relationship between CON functional connectivity and VPS C increase
As expected, our control analyses revealed no significant relations of the standardized VPS change with functional connectivity in networks not previously linked to alertness or VPS (visual, dorsal-attention, right-frontoparietal, and default-mode networks). Also as expected, CON functional connectivity was not related to other parameters not thought to rely on alertness (K, t0, and α). Accordingly, these analyses support the specificity of the association between CON functional connectivity and the alertness-training-induced increase in VPS.
Discussion
In two studies in healthy older adults, we found that targeted computerized tonic-alertness training can enhance VPS, a fundamental parameter affecting performance in diverse visual tasks. This enhancement was specific: It was not found in control groups, as evidenced by a significant interaction between group and session in Study 1, and there were no general improvements of other TVA parameters (visual threshold, VSTM capacity, top-down control), supporting TVA’s assumptions of a direct relation between alertness and VPS parameter C and of parameter independence. Furthermore, as predicted, we found that functional connectivity in the CON prior to alertness training in Study 2 predicted individual VPS training benefit. Control analyses revealed that this relationship was specific, that is, not found for functional connectivity in alternative networks or visual attention parameters not directly related to alertness.
Training studies should aim to identify targeted interventions (Zokaei et al., 2017). Our controlled design evaluated the effects of alertness training on a latent visual attention parameter proposed to be directly dependent on alertness (Bundesen et al., 2015). No increase was found in the passive- or active-control groups. Thus, as hypothesized, the cognitively demanding n-back active-control training, which is assumed to improve higher order working memory and fluid intelligence functions, does not appear to modify VPS or other basic TVA parameters. Notably, the n-back training did not enhance the more basic “capacity” component of working memory reflected in the TVA parameter VSTM. The alertness-training group outperformed the control groups (in terms of VPS) after training, so the enhancement cannot be attributed to retest or placebo effects. Hence, targeted alertness training can selectively increase VPS in healthy older adults.
The present findings substantiate that targeted training can increase the speed of information processing (Edwards, Fausto, Tetlow, Corona, & Valdés, 2018; Takeuchi & Kawashima, 2012). They also allow previously observed effects (e.g., in the useful-field-of-view task; Ball et al., 2007) to be interpreted mechanistically, grounded in a formal theory that links alertness and VPS (Bundesen et al., 2015; Noack, Lövdén, & Schmiedek, 2014). The gaming-like environment of this training could have stimulated additional visual attention functions, but our control analyses show that this was not the case: The training-induced improvement of (letter-report) performance was not attributable to alternative changes in parameters not assumed to rely on alertness (i.e., lowered visual threshold, increased VSTM capacity, or improved top-down control; Bundesen et al., 2015).
The enhancement of VPS as a basic, latent parameter suggests that the effects of alertness training do transfer across diverse task scenarios (from the trained task to the TVA-based letter-report task). This makes it likely that, following alertness training, performance on tasks relying on fast visual stimulus perception would also be improved in daily living. The successful replication of the alertness-training effects in Study 2 attests to their robustness. A previous two-session self-training in which healthy adults were instructed how to control their alertness levels was not similarly effective (McAvinue, Vangkilde, et al., 2012), perhaps owing to the lower intensity or adequacy of strategy-based approaches for enhancing VPS parameter C. Our relatively modest effect sizes (Cohen’s ds = 0.25 and 0.30) reflect the premise that participants do not profit uniformly from training interventions (e.g., Guye et al., 2017) and that only some may experience significant real-life benefits.
We found that higher CON functional connectivity prior to alertness training correlated with higher training-induced VPS gain, as hypothesized. In older adults, VPS can be preserved to a level commensurate with that of younger adults given comparable CON functional connectivity (Ruiz-Rizzo et al., 2019). According to the model of brain maintenance in aging, high functional connectivity might reflect youth-like brain functioning (Lindenberger, 2014; Nyberg, Lövdén, Riklund, Lindenberger, & Bäckman, 2012). The current results indicate that such youth-like CON functional connectivity reflects higher plasticity (Anguera et al., 2013; i.e., the potential to improve VPS with targeted stimulation). CON functional connectivity was not related to changes in parameters not directly relying on alertness. Given the specificity and robustness of the findings, we propose that CON functional connectivity can provide a useful marker of the individual response to alertness training in older age, thereby opening a path toward personalized training interventions. In the longer term, CON functional connectivity might help improve predictions about who will benefit from alertness training. For this, reliable effect-size estimates of this marker’s predictiveness, obtained from independent samples, are required (Reddan, Lindquist, & Wager, 2017; see also Section 5.4 in the Supplemental Material).
Our results support previous indications that CON functional connectivity is relevant for VPS in healthy older adults (Ruiz-Rizzo et al., 2019). The linkage identified between higher CON functional connectivity and higher VPS gain from a longer term intervention differs from functional connectivity–VPS benefit relationships established in previous studies on the effects of short-term auditory phasic-alertness cues. In these studies, higher cuing gains were found to be related to lower CON functional connectivity in younger adults and to lower functional connectivity in the right frontoparietal network in older adults (Haupt et al., 2020). The discrepancies between the current findings and these results might reflect differences in the brain systems underlying phasic and intrinsic alertness functions.
Among this study’s limitations, it is unclear whether the training has longer term effects or whether longer training duration induces greater benefits. Also, the possible impact on daily-living activities of the particular type or intensity of alertness training implemented here still needs to be ascertained. Finally, because we assessed functional connectivity prior to the training, potential changes in the CON brought about by the training are as yet unknown. These limitations should be addressed in future studies.
In conclusion, our results indicate that 10.5 hr of alertness training can reliably increase the latent parameter VPS in healthy older adults. The replication of this effect supports the TVA-based measurement as sensitive, reliable, and adequate to assess posttraining neurocognitive enhancement. These results also suggest that CON functional connectivity could serve as a neural marker for predicting individual training gain in future studies.
Supplemental Material
sj-pdf-1-pss-10.1177_0956797620965520 – Supplemental material for Alertness Training Increases Visual Processing Speed in Healthy Older Adults
Supplemental material, sj-pdf-1-pss-10.1177_0956797620965520 for Alertness Training Increases Visual Processing Speed in Healthy Older Adults by Melanie D. Penning, Adriana L. Ruiz- Rizzo, Petra Redel, Hermann J. Müller, Tiina Salminen, Tilo Strobach, Simone Behrens, Torsten Schubert, Christian Sorg and Kathrin Finke in Psychological Science
Footnotes
Acknowledgements
We thank the Zentrum Seniorenstudium München for their help with participant recruitment, and we thank our participants.
Transparency
Action Editor: Karen Rodrigue
Editor: Patricia J. Bauer
Author Contributions
M. D. Penning and A. L. Ruiz-Rizzo contributed equally to this work and share first authorship. M. D. Penning, A. L. Ruiz-Rizzo, P. Redel, H. J. Müller, C. Sorg, and K. Finke contributed to the design of the studies. M. D. Penning, P. Redel, T. Salminen, and S. Behrens collected the behavioral data. M. D. Penning and A. L. Ruiz-Rizzo collected the imaging data. M. D. Penning analyzed the behavioral data, and A. L. Ruiz-Rizzo analyzed the imaging data. M. D. Penning, A. L. Ruiz-Rizzo, and K. Finke wrote the manuscript. P. Redel, H. J. Müller, T. Salminen, T. Strobach, S. Behrens, T. Schubert, and C. Sorg contributed to the data discussion and reviewed the manuscript. All the authors approved the final manuscript for submission.
Notes
References
Supplementary Material
Please find the following supplemental material available below.
For Open Access articles published under a Creative Commons License, all supplemental material carries the same license as the article it is associated with.
For non-Open Access articles published, all supplemental material carries a non-exclusive license, and permission requests for re-use of supplemental material or any part of supplemental material shall be sent directly to the copyright owner as specified in the copyright notice associated with the article.