During the COVID-19 pandemic, online sexual health service delivery increased across Britain. We investigated inequalities in STI testing access and methods of access during the first year of the pandemic.
Methods
Natsal-COVID, an online-survey of people 18–59 years in Britain, explored sexual health experiences in the first year of the pandemic. We describe the socio-demographics of participants who used STI testing services and compare those who reported being “online service users”, defined as using services with no direct clinician interactions (regardless of whether they also used other methods), with those who were exclusively “other service users”, defined as face-to-face, telephone, or video calls.
Results
246/6,064 participants (4.2%) reported STI testing between 03/2020–03/2021. Of those, 35.8% (95%CI 29.2–42.8) used online services. Online service users (compared to other service users) were more often white (74.9% (62.2–84.4) versus 68.5% (59.4–76.3)), less often had anxiety (39.0% (28.4–50.9) versus 57.2% (48.4–65.6)) and less often had disabilities (25.8% (16.8–37.4) versus 48.1% (39.4–56.9)). Among women (only), online users were more often in good health (91.4% (81.3–96.2) versus 69.3% (57.4–79.2)).
Conclusions
More than one third of STI testers used online services during this period. Differences exist in the characteristics of people accessing online versus other testing services. These data suggest that online services were more likely to be accessed by groups with typically lower risk of poor sexual health (white and in good health). Further investigation is needed, especially if online services are the only option offered, as differences in ability to access services could widen inequalities.
Sexual health service users without complex needs are now routinely being directed to online care and remote management and, following the pandemic, online testing continues to be the only testing option available to asymptomatic patients in many services across Britain.1,2 This rapid growth in online sexual health services was seen prior to the pandemic, with internet based STI screening growing by 69% (from 248,184 to 419,046) between 2018 and 2019.3,4 During and following the pandemic, there was a substantial increase in total recorded consultations at sexual health services, which is primarily due to a 19% increase in online consultations from 513,613 in 2019 to around 1.2 million in 2020 and 1.7 million in 2022.2
The use of online testing options like online postal self-sampling (OPSS) has become embedded as part of routine access to STI testing in many areas within Britain.3,4 OPSS allows patients to order a kit online, take their own sample, mail their samples using pre-paid postage, and receive their results online and/or via text message.3
Evidence as to which groups benefit most from online testing options is lacking, although there is concern that it might systematically exclude some groups of service users, including, importantly, those unable or unwilling to engage with online care.3 Some patterns regarding which groups access online services more frequently have already emerged. For example, OPSS users tend to be more frequently female, of white ethnicity, and live in less deprived areas,3,5–7 despite these groups being less affected by STIs. The question of whether the shift to remote online care is affecting equitable access to sexual healthcare at a population level has not yet been fully answered. The pandemic heralded a significant shift to remote care, and therefore provides important data to inform this question.
In 2021, the Natsal-COVID study used a web panel survey to investigate, among other issues, patterns in sexual health service use during the COVID-19 pandemic.8 Here, we used data from Natsal-COVID to investigate the characteristics of those who accessed STI testing and how they accessed services during the first year of the COVID-19 pandemic.
Methods
Study design
Natsal-COVID Wave 2 was a cross-sectional, quasi-representative web-panel survey of sexual health across Britain.9,10 It was administered in March-April 2021, a year after the start of first UK lockdown, using a short (on average 13-minute) online questionnaire conducted by survey research company Ipsos.8 Recruitment methods are detailed elsewhere.9,10
Participants
Participants were members of a web panel, aged 18–59 years and resident in Britain. Quota-based sampling was used to achieve a quasi-representative sample of the general British population. Data were weighted to match general population distributions for gender, age, region, social grade, and sexual identity (Appendix 1).10 Participants who reported one or more sexual partners ever (hereon ‘sexually experienced participants’) were included in this analysis. Those reporting their most recent sexual partner as more than a year ago were included as they may still have required STI testing, for example, if they developed symptoms or received notification of an STI from a previous partner.
Variables of interest
Participants reported service use using a multiple answer question. The full questionnaire is published at: https://www.natsal.ac.uk/projects/natsal-covid/. The primary outcomes explored were: (1) the reported use of any STI testing service; and (2) the reported use of online STI testing services and other types of STI testing services, defined as follows:
1. Online service users: Those who reported using any form of STI testing services where users do not interact directly with clinicians live. These were described as ‘other online services’ in the survey, e.g., OPSS. This category excluded those who used video calls. Online service users could also report using other services.
2. Other service users: Those who only reported using services where users interact directly with clinicians and were not online services (for example, face-to-face consultations, telephone, or video calls). These services could be used in any combination.
Sociodemographic, relationship, employment, and health-related variables were assessed for their association with STI testing behaviours and methods of accessing STI testing.
Analysis
We conducted a descriptive analysis exploring use of STI testing among survey participants, using chi-square tests, according to participant characteristics. A logistic regression model was used to investigate the associations between each of these variables and STI testing uptake, and a multivariate logistic regression model was developed using variables that showed a statistically significant relationship (p < 0.05) with STI testing uptake in the crude logistic regression model.
In a descriptive analysis, using chi-square tests, we compared the characteristics of online service users and other service users. As a study of the general population, the sample of STI testing service users was not large enough to explore these associations through multivariable analysis.
Analyses were conducted using Stata version 17. Statistical significance was considered as p < 0.05. Due to differences in testing access patterns and STI risk behaviours by gender,3,9,11 all analyses were presented for all participants as well as stratified by gender for men (including trans men) and women (including trans women). Participants who identified in another way (n = 18) were included in estimates presented for all but not in gender stratified estimates.
All percentages and denominators reported in this paper have been weighted as previously described by Dema et al.10 Numerators reported in tables are unweighted.
Results
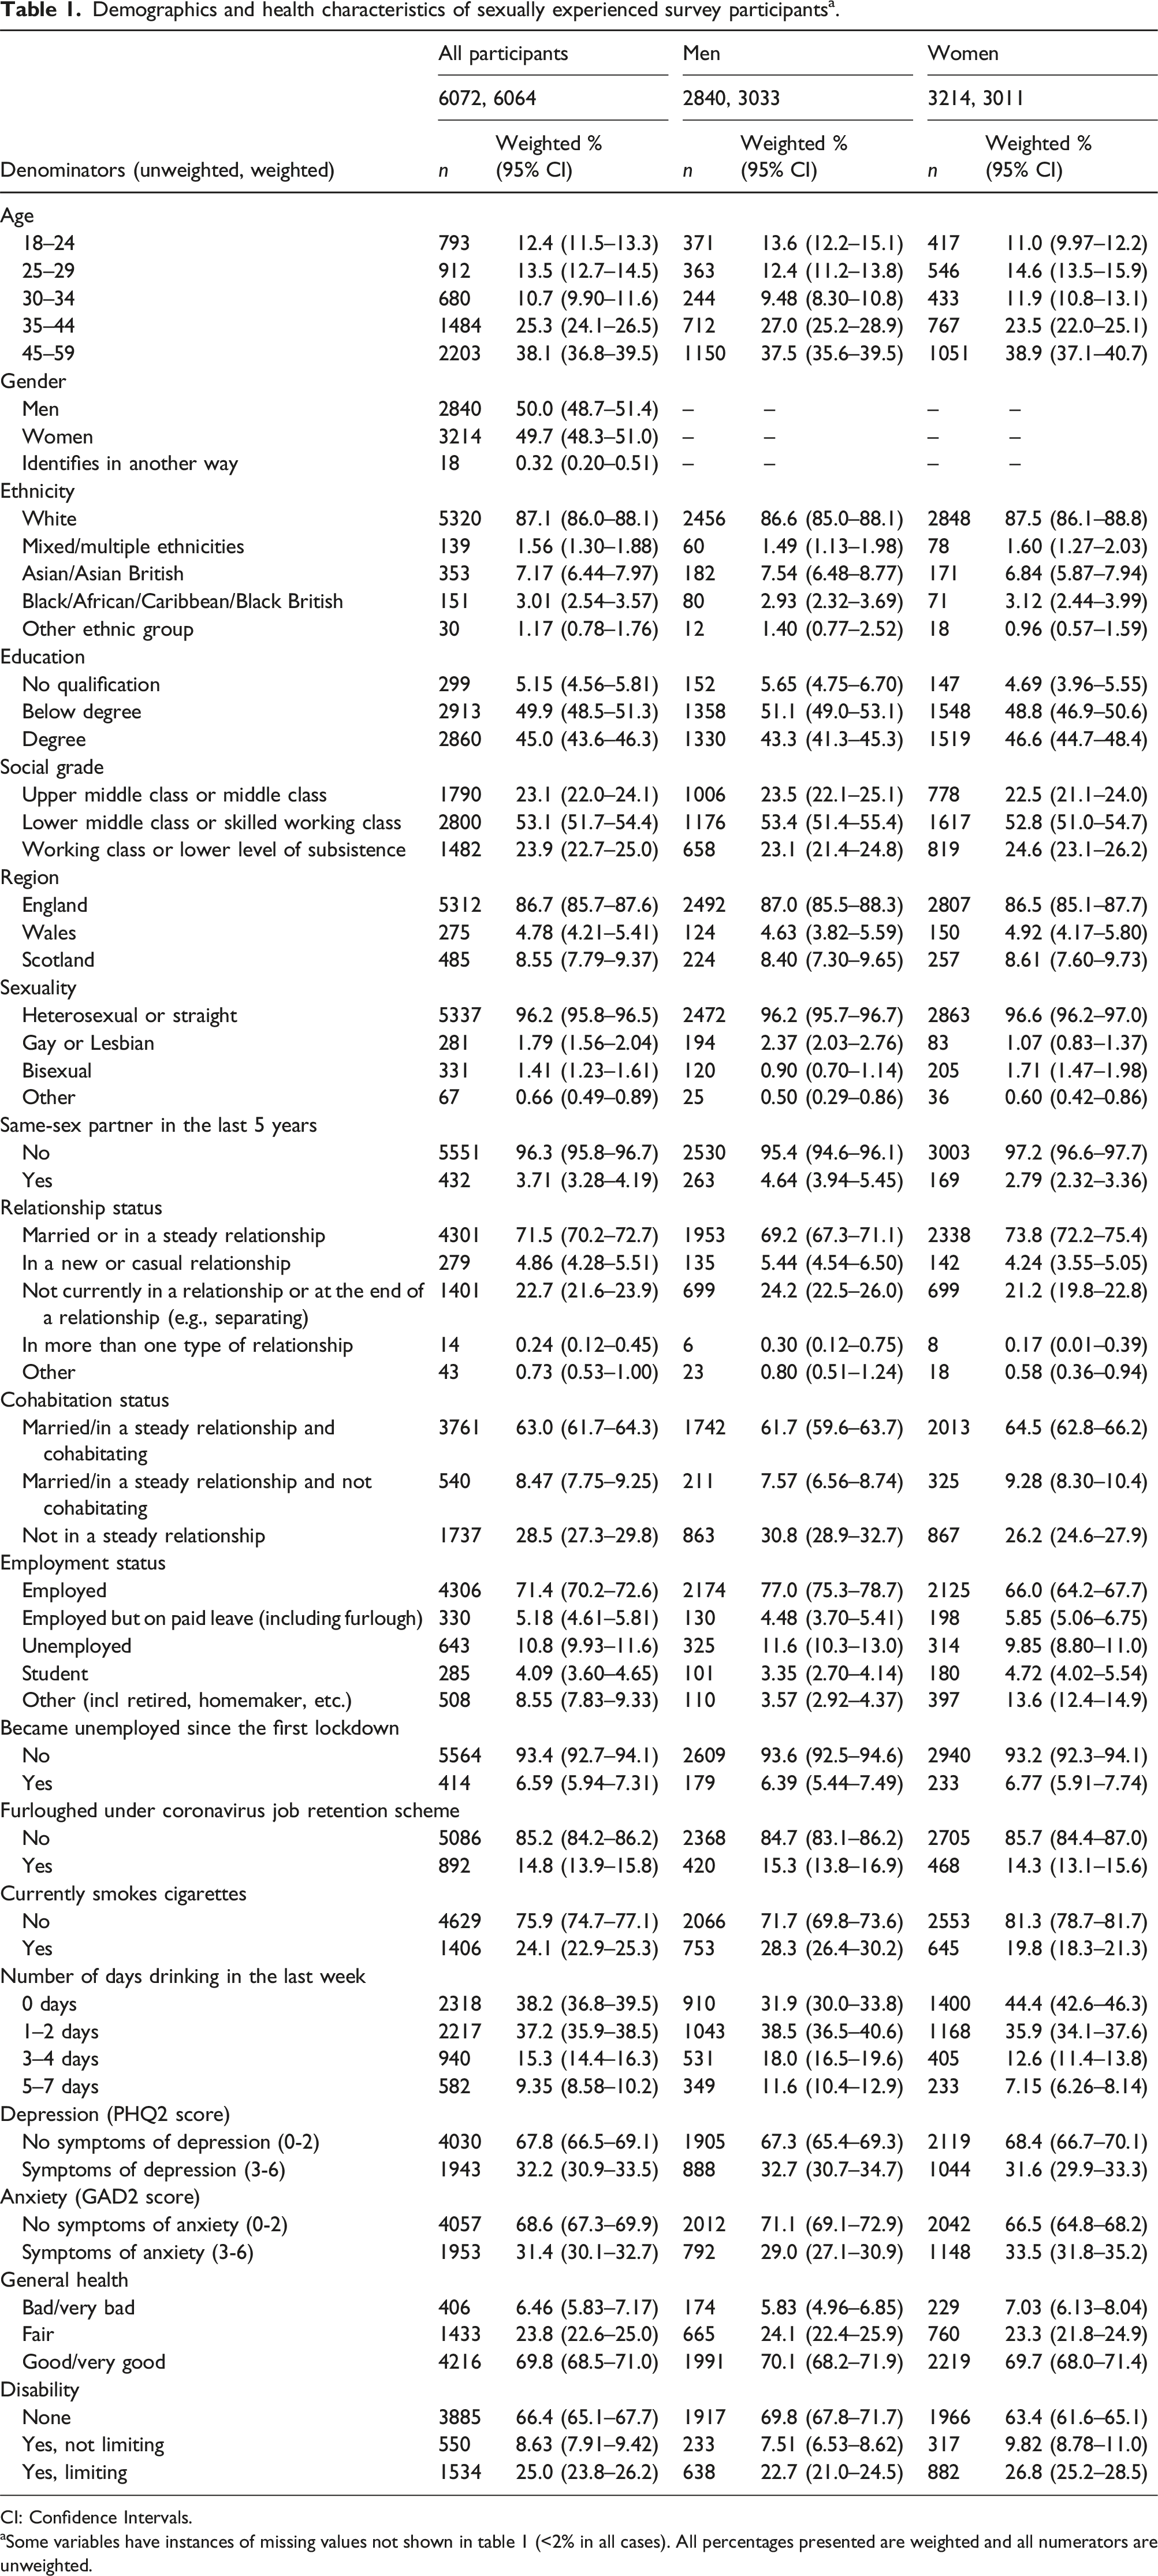
Among 6,658 participants, 91.1% (95% confidence interval 90.3–91.8) reported being sexually experienced and hence are the sample for this paper. After weighting, 49.7% (48.3–51.0) were women, 87.1% (86.0–88.1) were of white ethnicity, 12.4% (11.5–13.3) were aged under 25, 96.2% (95.8–96.5) identified as heterosexual and 53.1% (51.7–54.4) were lower middle class or skilled working class. Nearly 70% (68.5–71.0) reported being in good or very good health and 45.0% (43.6–46.3) were educated to degree level (Table 1).
Demographics and health characteristics of sexually experienced survey participantsa.
Denominators (unweighted, weighted)
All participants
Men
Women
6072, 6064
2840, 3033
3214, 3011
n
Weighted % (95% CI)
n
Weighted % (95% CI)
n
Weighted % (95% CI)
Age
18–24
793
12.4 (11.5–13.3)
371
13.6 (12.2–15.1)
417
11.0 (9.97–12.2)
25–29
912
13.5 (12.7–14.5)
363
12.4 (11.2–13.8)
546
14.6 (13.5–15.9)
30–34
680
10.7 (9.90–11.6)
244
9.48 (8.30–10.8)
433
11.9 (10.8–13.1)
35–44
1484
25.3 (24.1–26.5)
712
27.0 (25.2–28.9)
767
23.5 (22.0–25.1)
45–59
2203
38.1 (36.8–39.5)
1150
37.5 (35.6–39.5)
1051
38.9 (37.1–40.7)
Gender
Men
2840
50.0 (48.7–51.4)
–
–
–
–
Women
3214
49.7 (48.3–51.0)
–
–
–
–
Identifies in another way
18
0.32 (0.20–0.51)
–
–
–
–
Ethnicity
White
5320
87.1 (86.0–88.1)
2456
86.6 (85.0–88.1)
2848
87.5 (86.1–88.8)
Mixed/multiple ethnicities
139
1.56 (1.30–1.88)
60
1.49 (1.13–1.98)
78
1.60 (1.27–2.03)
Asian/Asian British
353
7.17 (6.44–7.97)
182
7.54 (6.48–8.77)
171
6.84 (5.87–7.94)
Black/African/Caribbean/Black British
151
3.01 (2.54–3.57)
80
2.93 (2.32–3.69)
71
3.12 (2.44–3.99)
Other ethnic group
30
1.17 (0.78–1.76)
12
1.40 (0.77–2.52)
18
0.96 (0.57–1.59)
Education
No qualification
299
5.15 (4.56–5.81)
152
5.65 (4.75–6.70)
147
4.69 (3.96–5.55)
Below degree
2913
49.9 (48.5–51.3)
1358
51.1 (49.0–53.1)
1548
48.8 (46.9–50.6)
Degree
2860
45.0 (43.6–46.3)
1330
43.3 (41.3–45.3)
1519
46.6 (44.7–48.4)
Social grade
Upper middle class or middle class
1790
23.1 (22.0–24.1)
1006
23.5 (22.1–25.1)
778
22.5 (21.1–24.0)
Lower middle class or skilled working class
2800
53.1 (51.7–54.4)
1176
53.4 (51.4–55.4)
1617
52.8 (51.0–54.7)
Working class or lower level of subsistence
1482
23.9 (22.7–25.0)
658
23.1 (21.4–24.8)
819
24.6 (23.1–26.2)
Region
England
5312
86.7 (85.7–87.6)
2492
87.0 (85.5–88.3)
2807
86.5 (85.1–87.7)
Wales
275
4.78 (4.21–5.41)
124
4.63 (3.82–5.59)
150
4.92 (4.17–5.80)
Scotland
485
8.55 (7.79–9.37)
224
8.40 (7.30–9.65)
257
8.61 (7.60–9.73)
Sexuality
Heterosexual or straight
5337
96.2 (95.8–96.5)
2472
96.2 (95.7–96.7)
2863
96.6 (96.2–97.0)
Gay or Lesbian
281
1.79 (1.56–2.04)
194
2.37 (2.03–2.76)
83
1.07 (0.83–1.37)
Bisexual
331
1.41 (1.23–1.61)
120
0.90 (0.70–1.14)
205
1.71 (1.47–1.98)
Other
67
0.66 (0.49–0.89)
25
0.50 (0.29–0.86)
36
0.60 (0.42–0.86)
Same-sex partner in the last 5 years
No
5551
96.3 (95.8–96.7)
2530
95.4 (94.6–96.1)
3003
97.2 (96.6–97.7)
Yes
432
3.71 (3.28–4.19)
263
4.64 (3.94–5.45)
169
2.79 (2.32–3.36)
Relationship status
Married or in a steady relationship
4301
71.5 (70.2–72.7)
1953
69.2 (67.3–71.1)
2338
73.8 (72.2–75.4)
In a new or casual relationship
279
4.86 (4.28–5.51)
135
5.44 (4.54–6.50)
142
4.24 (3.55–5.05)
Not currently in a relationship or at the end of a relationship (e.g., separating)
1401
22.7 (21.6–23.9)
699
24.2 (22.5–26.0)
699
21.2 (19.8–22.8)
In more than one type of relationship
14
0.24 (0.12–0.45)
6
0.30 (0.12–0.75)
8
0.17 (0.01–0.39)
Other
43
0.73 (0.53–1.00)
23
0.80 (0.51–1.24)
18
0.58 (0.36–0.94)
Cohabitation status
Married/in a steady relationship and cohabitating
3761
63.0 (61.7–64.3)
1742
61.7 (59.6–63.7)
2013
64.5 (62.8–66.2)
Married/in a steady relationship and not cohabitating
540
8.47 (7.75–9.25)
211
7.57 (6.56–8.74)
325
9.28 (8.30–10.4)
Not in a steady relationship
1737
28.5 (27.3–29.8)
863
30.8 (28.9–32.7)
867
26.2 (24.6–27.9)
Employment status
Employed
4306
71.4 (70.2–72.6)
2174
77.0 (75.3–78.7)
2125
66.0 (64.2–67.7)
Employed but on paid leave (including furlough)
330
5.18 (4.61–5.81)
130
4.48 (3.70–5.41)
198
5.85 (5.06–6.75)
Unemployed
643
10.8 (9.93–11.6)
325
11.6 (10.3–13.0)
314
9.85 (8.80–11.0)
Student
285
4.09 (3.60–4.65)
101
3.35 (2.70–4.14)
180
4.72 (4.02–5.54)
Other (incl retired, homemaker, etc.)
508
8.55 (7.83–9.33)
110
3.57 (2.92–4.37)
397
13.6 (12.4–14.9)
Became unemployed since the first lockdown
No
5564
93.4 (92.7–94.1)
2609
93.6 (92.5–94.6)
2940
93.2 (92.3–94.1)
Yes
414
6.59 (5.94–7.31)
179
6.39 (5.44–7.49)
233
6.77 (5.91–7.74)
Furloughed under coronavirus job retention scheme
No
5086
85.2 (84.2–86.2)
2368
84.7 (83.1–86.2)
2705
85.7 (84.4–87.0)
Yes
892
14.8 (13.9–15.8)
420
15.3 (13.8–16.9)
468
14.3 (13.1–15.6)
Currently smokes cigarettes
No
4629
75.9 (74.7–77.1)
2066
71.7 (69.8–73.6)
2553
81.3 (78.7–81.7)
Yes
1406
24.1 (22.9–25.3)
753
28.3 (26.4–30.2)
645
19.8 (18.3–21.3)
Number of days drinking in the last week
0 days
2318
38.2 (36.8–39.5)
910
31.9 (30.0–33.8)
1400
44.4 (42.6–46.3)
1–2 days
2217
37.2 (35.9–38.5)
1043
38.5 (36.5–40.6)
1168
35.9 (34.1–37.6)
3–4 days
940
15.3 (14.4–16.3)
531
18.0 (16.5–19.6)
405
12.6 (11.4–13.8)
5–7 days
582
9.35 (8.58–10.2)
349
11.6 (10.4–12.9)
233
7.15 (6.26–8.14)
Depression (PHQ2 score)
No symptoms of depression (0-2)
4030
67.8 (66.5–69.1)
1905
67.3 (65.4–69.3)
2119
68.4 (66.7–70.1)
Symptoms of depression (3-6)
1943
32.2 (30.9–33.5)
888
32.7 (30.7–34.7)
1044
31.6 (29.9–33.3)
Anxiety (GAD2 score)
No symptoms of anxiety (0-2)
4057
68.6 (67.3–69.9)
2012
71.1 (69.1–72.9)
2042
66.5 (64.8–68.2)
Symptoms of anxiety (3-6)
1953
31.4 (30.1–32.7)
792
29.0 (27.1–30.9)
1148
33.5 (31.8–35.2)
General health
Bad/very bad
406
6.46 (5.83–7.17)
174
5.83 (4.96–6.85)
229
7.03 (6.13–8.04)
Fair
1433
23.8 (22.6–25.0)
665
24.1 (22.4–25.9)
760
23.3 (21.8–24.9)
Good/very good
4216
69.8 (68.5–71.0)
1991
70.1 (68.2–71.9)
2219
69.7 (68.0–71.4)
Disability
None
3885
66.4 (65.1–67.7)
1917
69.8 (67.8–71.7)
1966
63.4 (61.6–65.1)
Yes, not limiting
550
8.63 (7.91–9.42)
233
7.51 (6.53–8.62)
317
9.82 (8.78–11.0)
Yes, limiting
1534
25.0 (23.8–26.2)
638
22.7 (21.0–24.5)
882
26.8 (25.2–28.5)
CI: Confidence Intervals.
aSome variables have instances of missing values not shown in table 1 (<2% in all cases). All percentages presented are weighted and all numerators are unweighted.
Use of STI testing services
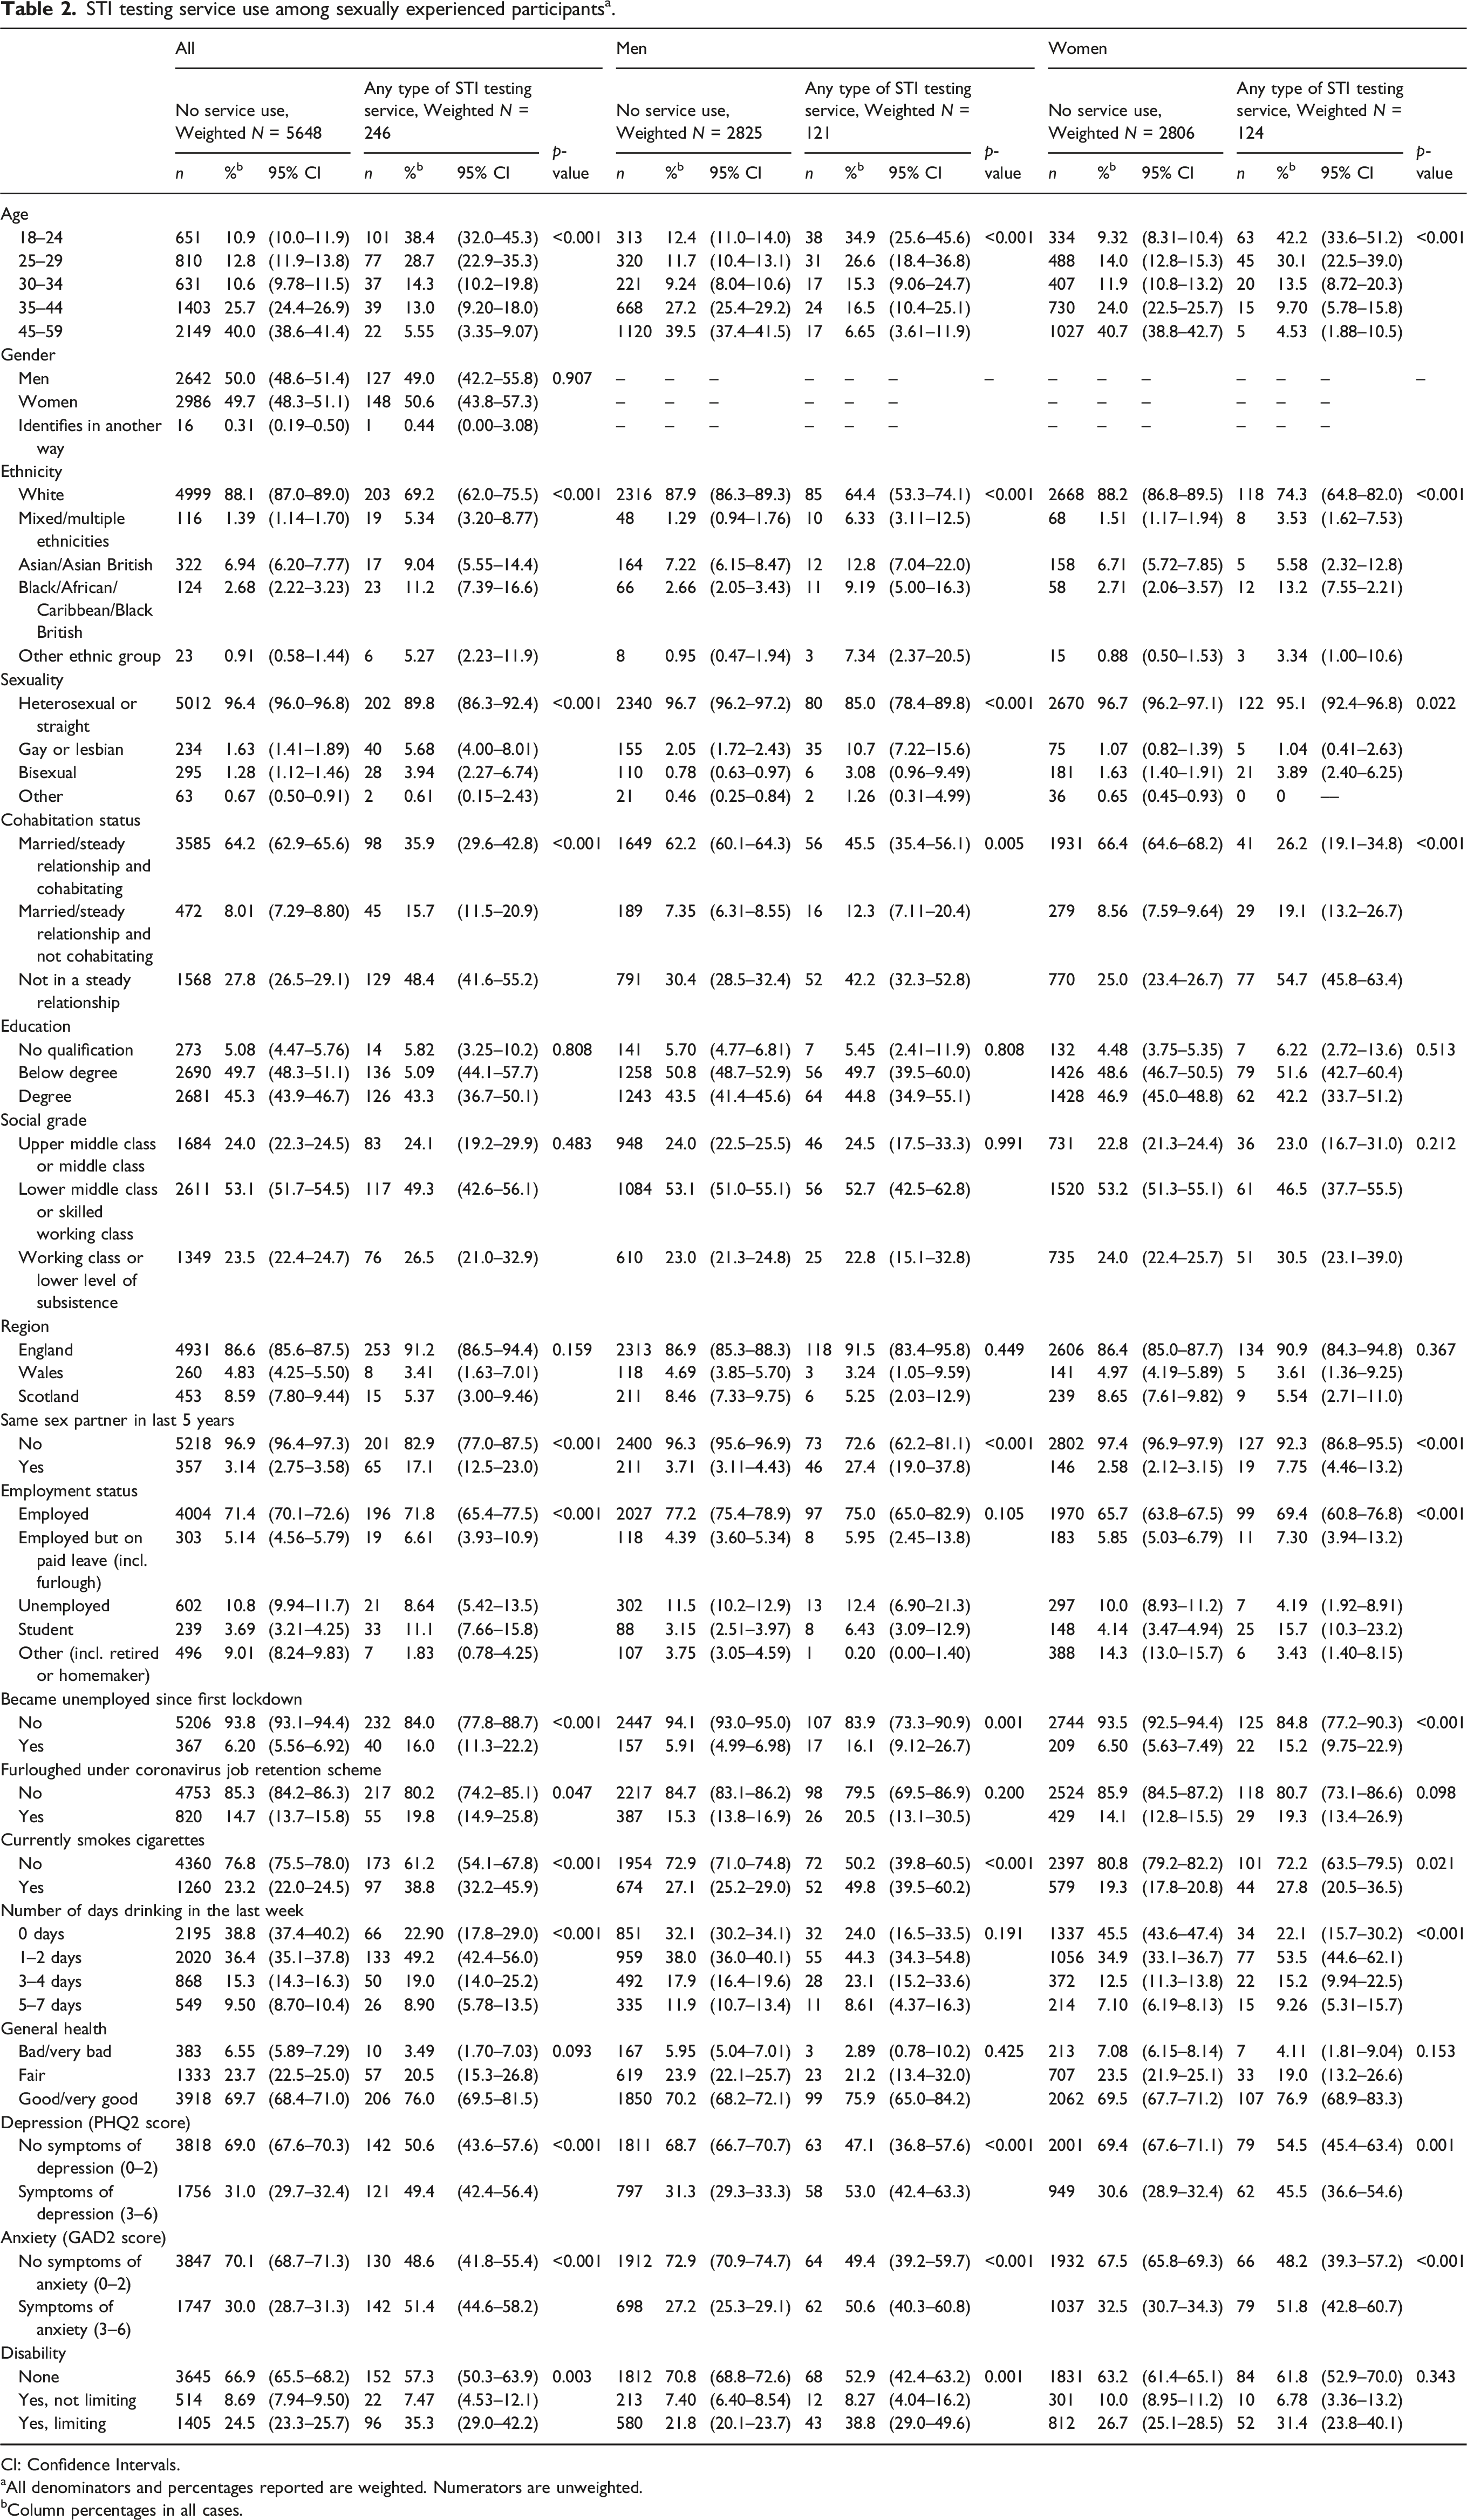
In total, a weighted prevalence of 4.2% (3.7–4.8) of participants reported using any STI testing service between March 2020 and March 2021 (Table 2).
STI testing service use among sexually experienced participantsa.
aAll denominators and percentages reported are weighted. Numerators are unweighted.
bColumn percentages in all cases.
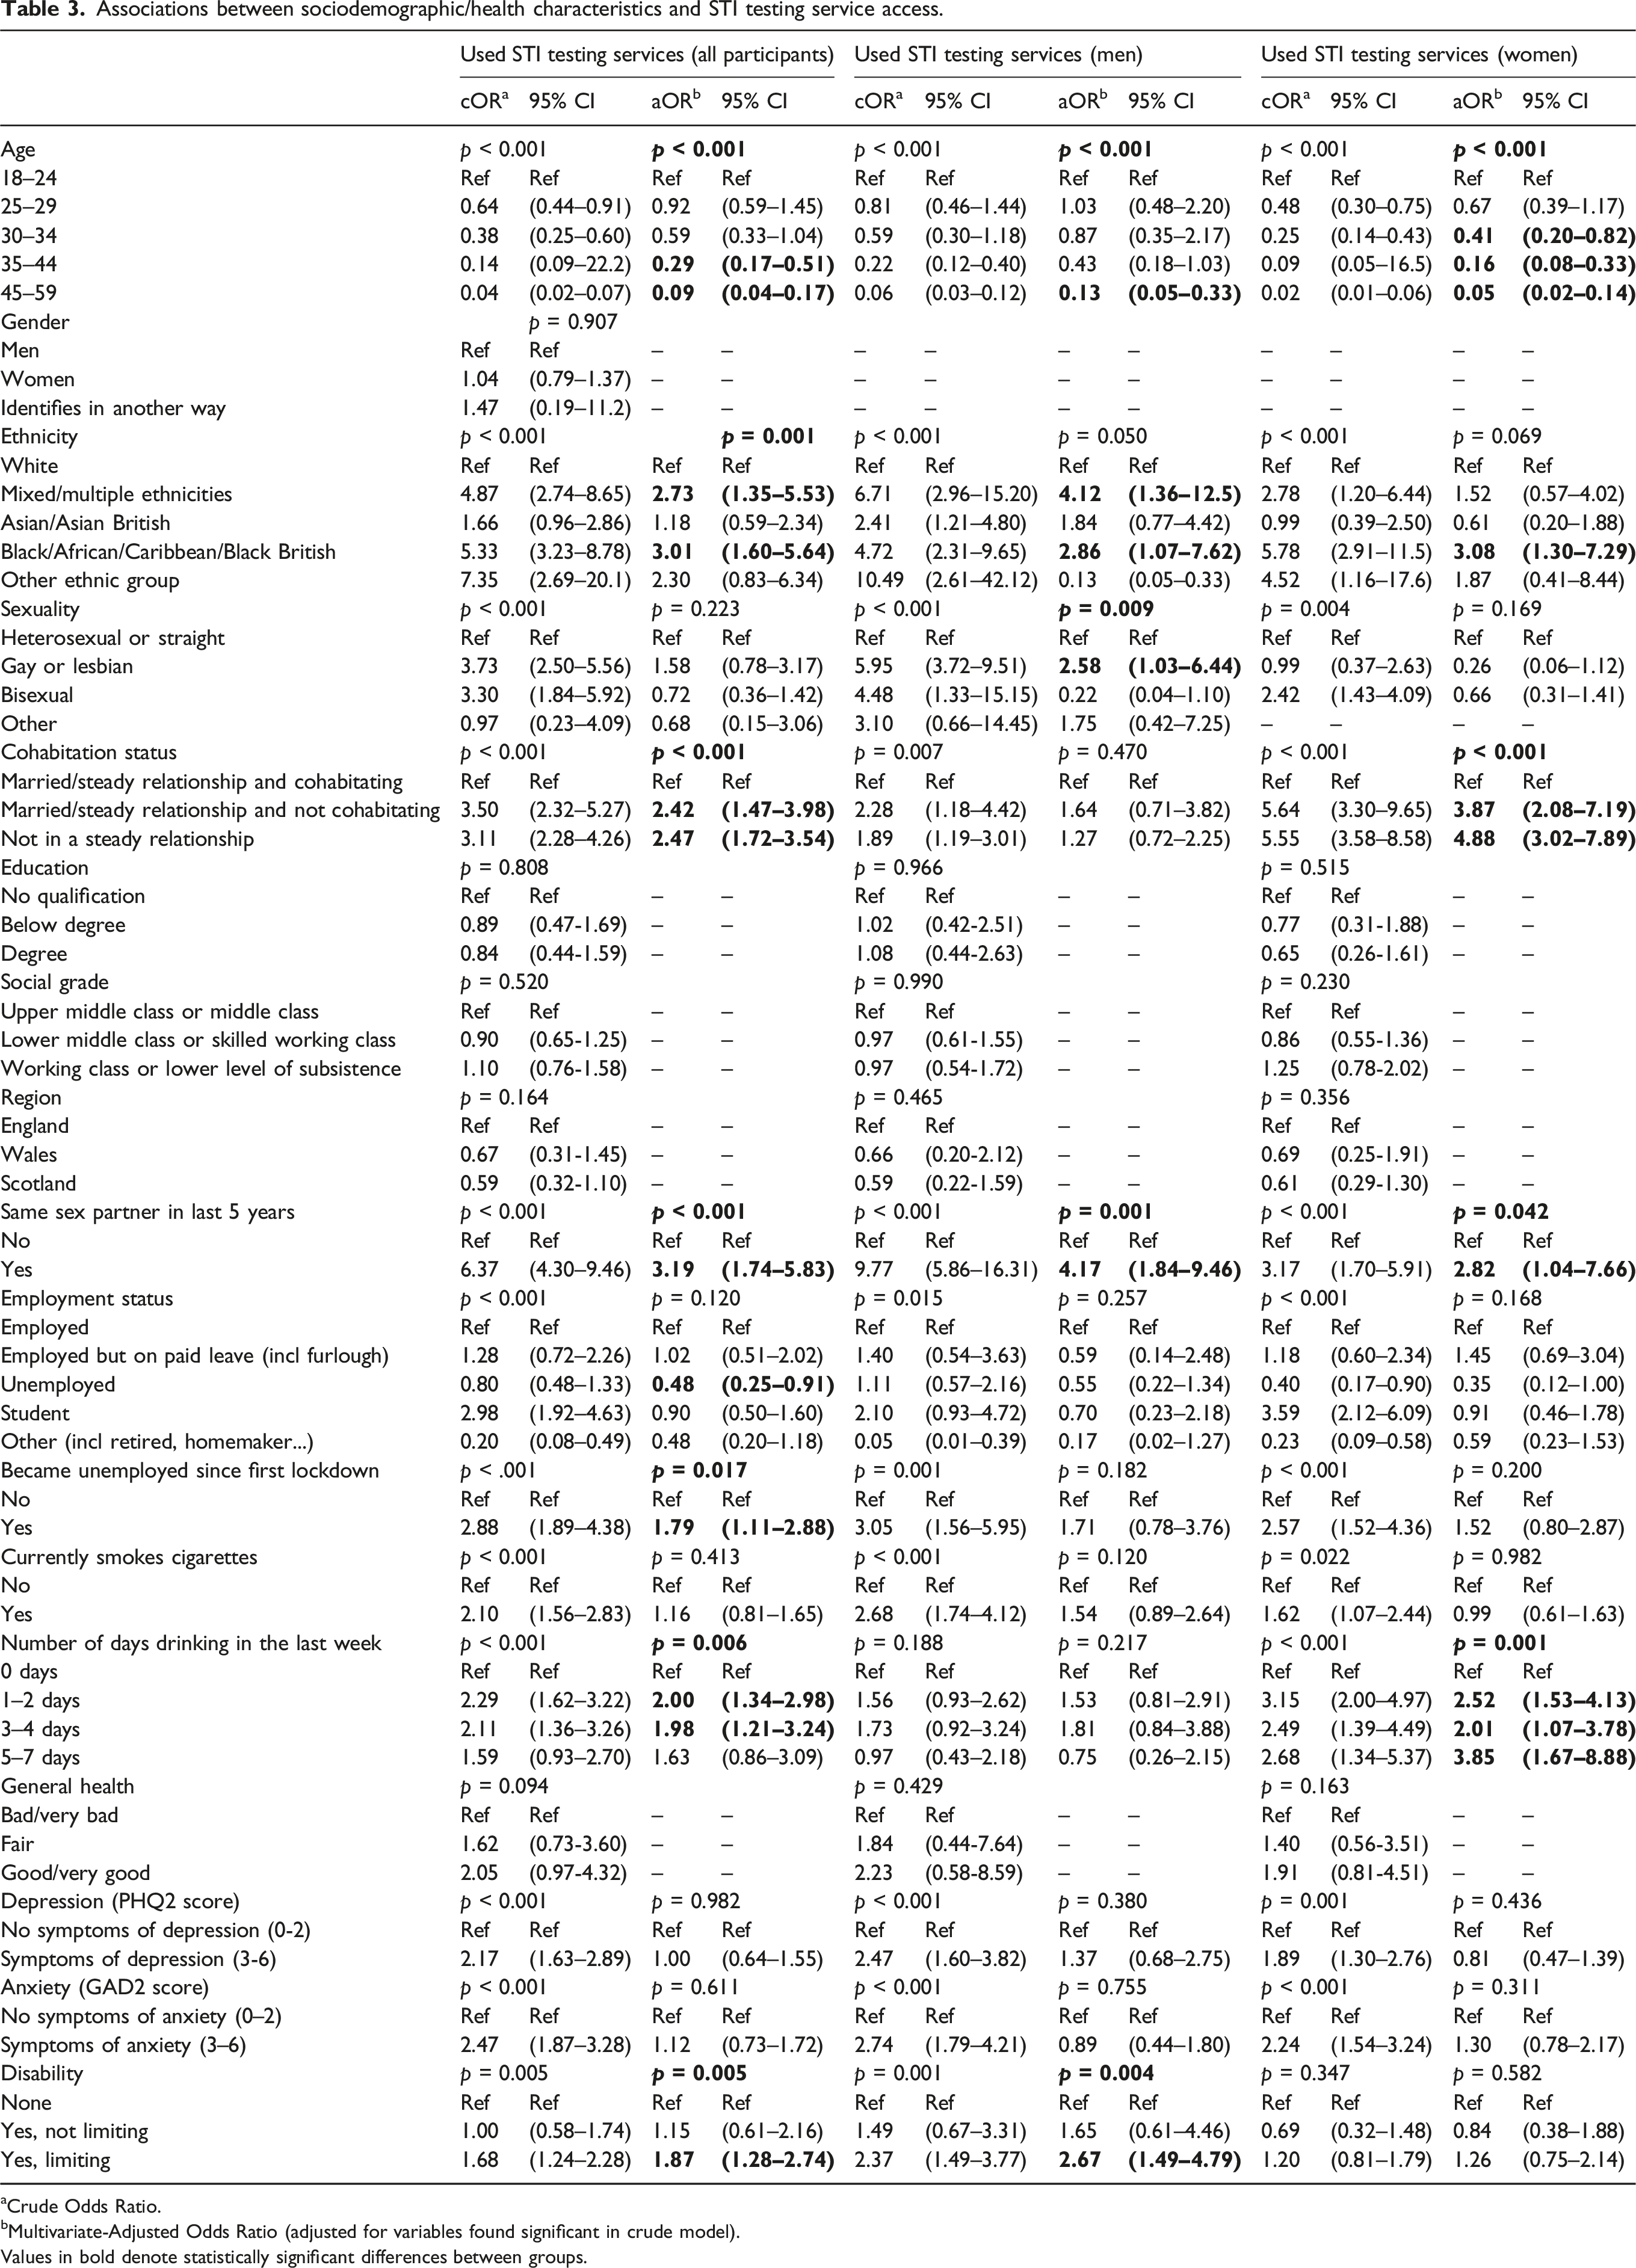
In the adjusted model (Table 3), older participants had lower odds of accessing STI testing. Compared to white participants, those from mixed/multiple ethnic backgrounds or Black/African/Caribbean/Black British backgrounds showed higher odds of accessing STI testing (aOR (95% confidence interval) = 2.73 (1.35–5.53) and aOR = 3.01 (1.60–5.64) respectively). Gay men had increased odds of having accessed STI testing compared to heterosexual/straight men (aOR = 2.58 (1.03–6.44)). Those who had a same sex partner in the previous 5 years had increased odds of having accessed STI testing (aOR among men = 4.17 (1.84–9.46), among women = 2.82 (1.04–7.66)). These participants may have had different-sex partners within the time frame, in addition to same sex partners.
Associations between sociodemographic/health characteristics and STI testing service access.
Multivariate-Adjusted Odds Ratio (adjusted for variables found significant in crude model).
Values in bold denote statistically significant differences between groups.
Those who were unemployed were less likely to have accessed STI testing (aOR = 0.48 (0.25–0.91)). However, those who had become unemployed since the start of the first lockdown had increased odds of having accessed STI testing (aOR = 1.79 (1.11–2.88)).
Among women, those who reported drinking at least once a week were more likely to have accessed STI testing compared to non-drinkers, with those who drank 5–7 days a week showing the strongest association with STI testing (aOR = 3.85 (1.67–8.88)). Among men, the association between drinking alcohol and STI testing was not statistically significant.
Finally, participants who reported having a limiting disability had higher odds of having accessed STI testing (aOR = 1.87 (1.28–2.74)) compared to those who did not report having a disability. In the gender disaggregated models, disability status was only significantly associated with STI testing among men (aOR = 2.67 (1.49–4.79)) and not among women.
Methods of accessing STI testing
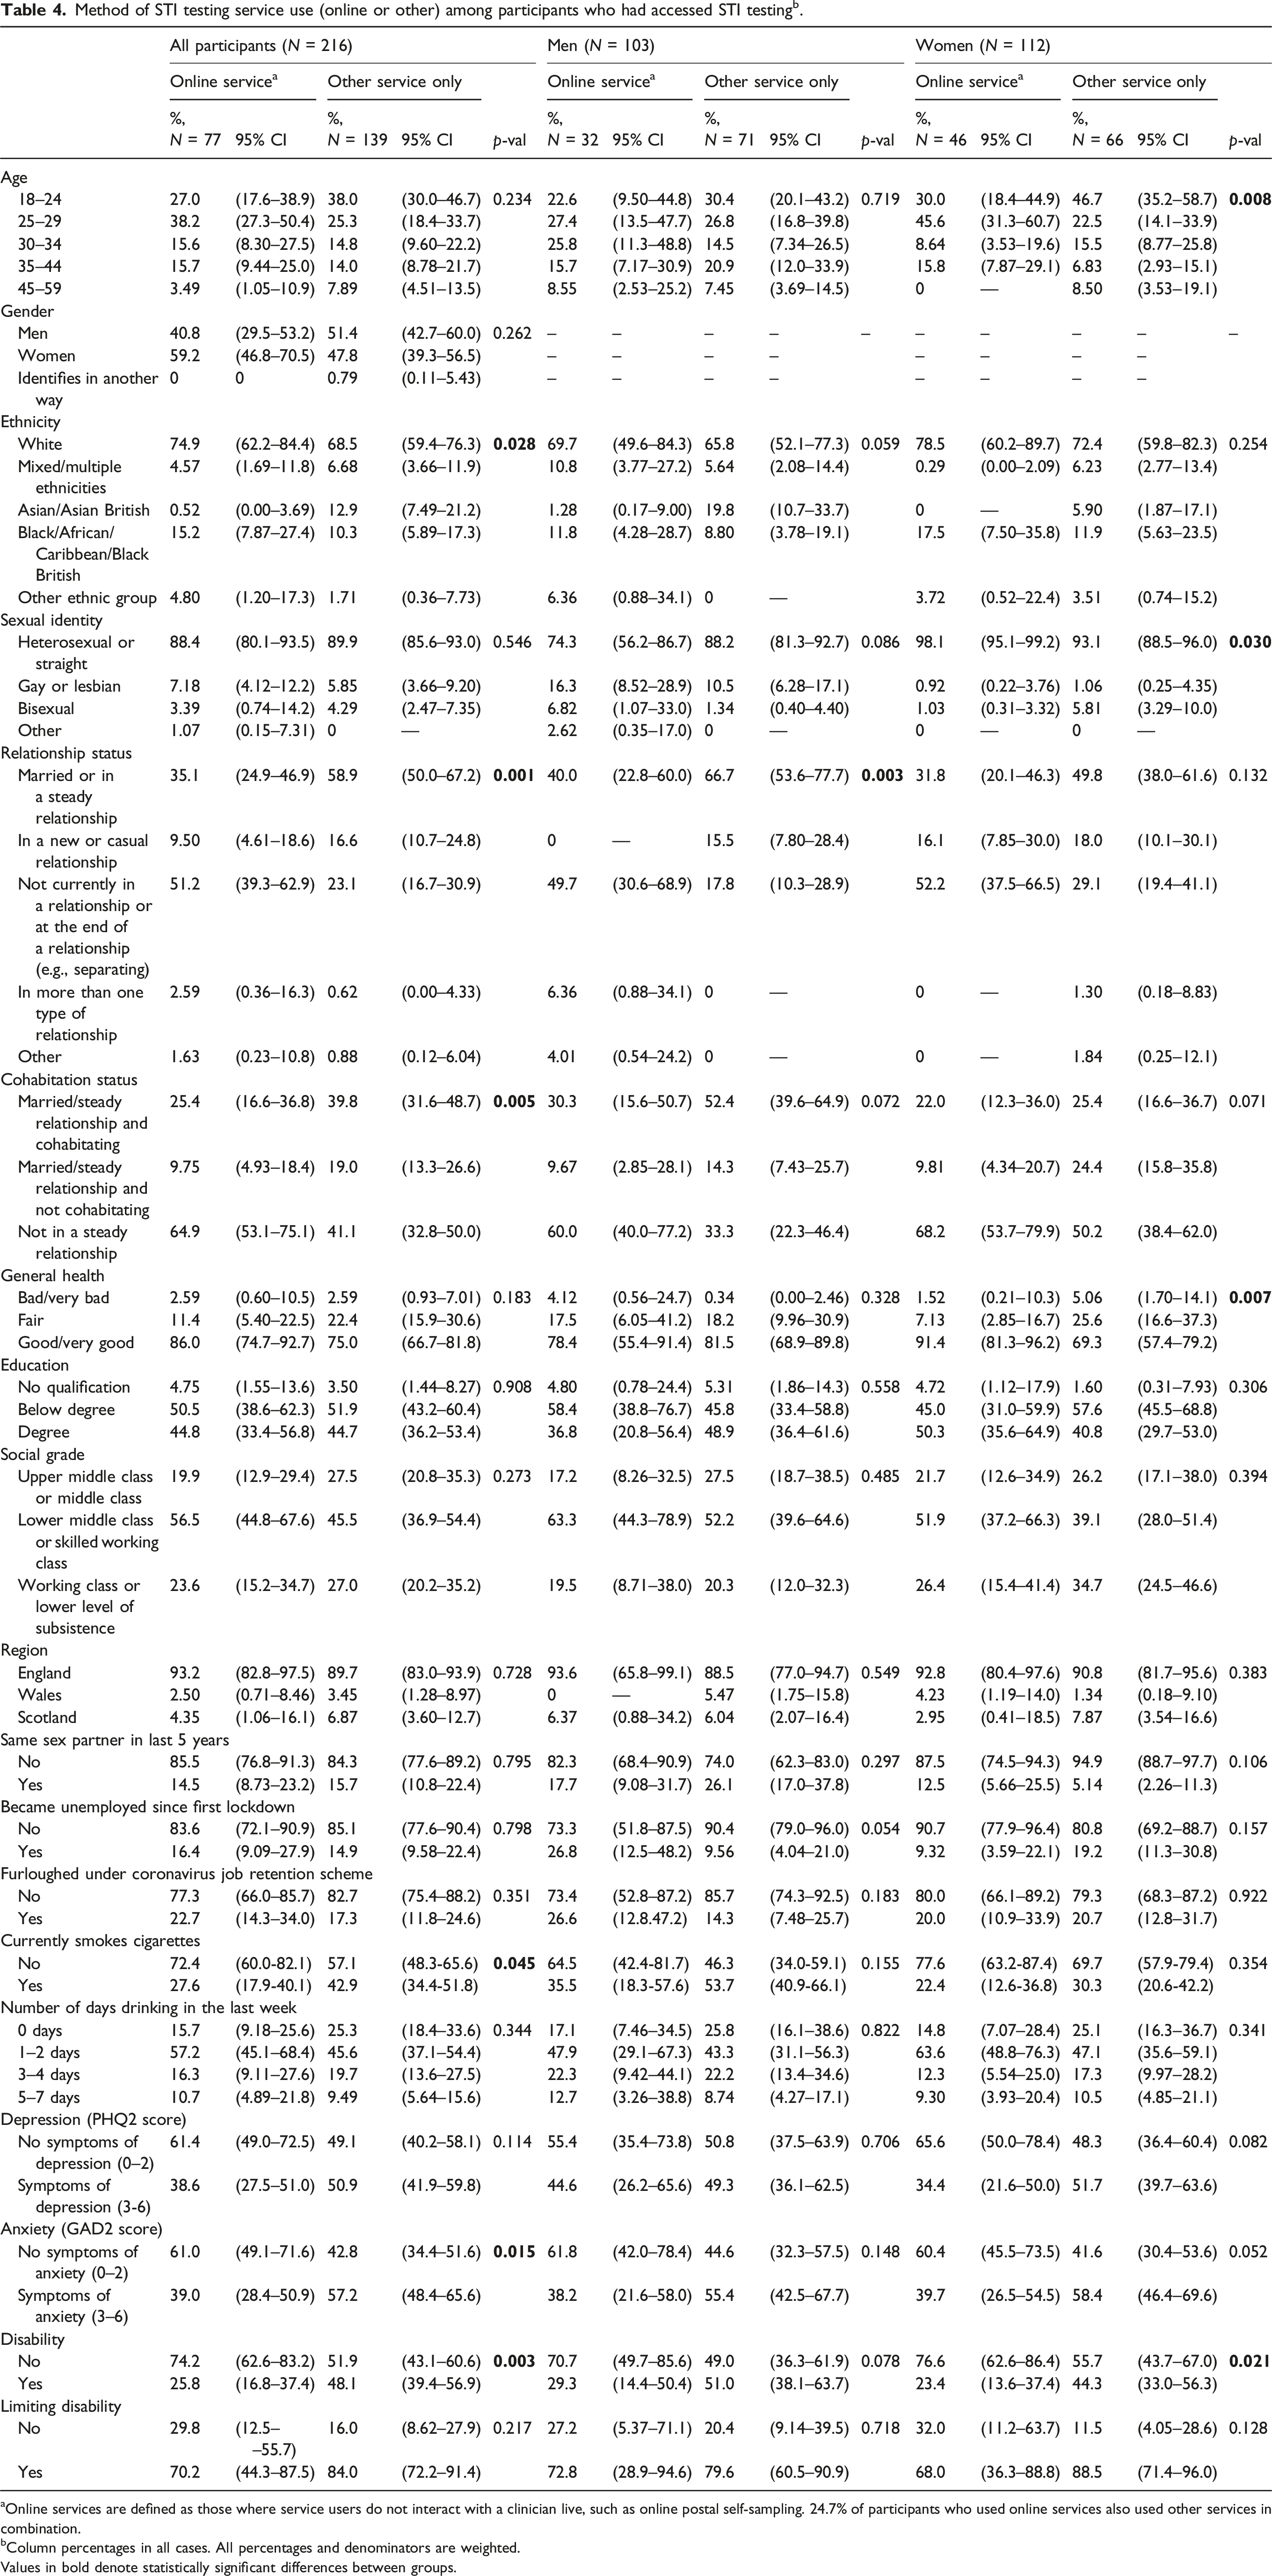
Among those who reported accessing STI testing in the past year (weighted N = 216, of which N = 103 men and N = 112 women), a weighted prevalence of 35.8% did so online and 64.3% reported using only services other than online. Among men, 30.6% were online service users, while among women 40.8% were online service users.
Of online service users, 24.7% had also used another service. The most common other service type was face-to-face (74.8%), followed by phone calls (54.0%) and video calls (19.4%). Compared to other service users, online service users more frequently identified as white (74.9% (62.2–84.4) vs. 68.5% (59.4–76.3)) (Table 4). Among women, online service users were more frequently aged 25–29 (45.6% (31.3–60.7) vs. 22.5% (14.1–33.9)) but less frequently aged below 25 (30.0% (18.4–44.9) vs. 46.7% (35.2–58.7)). There was no statistically significant association between age and mode of STI testing among men. Among men, online service users were more likely to be gay than other service users (16.3% (8.52–28.9) vs. 10.5% (6.28–17.1)). Among women, those who used online services were less frequently bisexual than those who used other services (1.03% (0.31–3.32) vs. 5.81% (3.29–10.0)).
Method of STI testing service use (online or other) among participants who had accessed STI testingb.
Not currently in a relationship or at the end of a relationship (e.g., separating)
51.2
(39.3–62.9)
23.1
(16.7–30.9)
49.7
(30.6–68.9)
17.8
(10.3–28.9)
52.2
(37.5–66.5)
29.1
(19.4–41.1)
In more than one type of relationship
2.59
(0.36–16.3)
0.62
(0.00–4.33)
6.36
(0.88–34.1)
0
––
0
––
1.30
(0.18–8.83)
Other
1.63
(0.23–10.8)
0.88
(0.12–6.04)
4.01
(0.54–24.2)
0
––
0
––
1.84
(0.25–12.1)
Cohabitation status
Married/steady relationship and cohabitating
25.4
(16.6–36.8)
39.8
(31.6–48.7)
0.005
30.3
(15.6–50.7)
52.4
(39.6–64.9)
0.072
22.0
(12.3–36.0)
25.4
(16.6–36.7)
0.071
Married/steady relationship and not cohabitating
9.75
(4.93–18.4)
19.0
(13.3–26.6)
9.67
(2.85–28.1)
14.3
(7.43–25.7)
9.81
(4.34–20.7)
24.4
(15.8–35.8)
Not in a steady relationship
64.9
(53.1–75.1)
41.1
(32.8–50.0)
60.0
(40.0–77.2)
33.3
(22.3–46.4)
68.2
(53.7–79.9)
50.2
(38.4–62.0)
General health
Bad/very bad
2.59
(0.60–10.5)
2.59
(0.93–7.01)
0.183
4.12
(0.56–24.7)
0.34
(0.00–2.46)
0.328
1.52
(0.21–10.3)
5.06
(1.70–14.1)
0.007
Fair
11.4
(5.40–22.5)
22.4
(15.9–30.6)
17.5
(6.05–41.2)
18.2
(9.96–30.9)
7.13
(2.85–16.7)
25.6
(16.6–37.3)
Good/very good
86.0
(74.7–92.7)
75.0
(66.7–81.8)
78.4
(55.4–91.4)
81.5
(68.9–89.8)
91.4
(81.3–96.2)
69.3
(57.4–79.2)
Education
No qualification
4.75
(1.55–13.6)
3.50
(1.44–8.27)
0.908
4.80
(0.78–24.4)
5.31
(1.86–14.3)
0.558
4.72
(1.12–17.9)
1.60
(0.31–7.93)
0.306
Below degree
50.5
(38.6–62.3)
51.9
(43.2–60.4)
58.4
(38.8–76.7)
45.8
(33.4–58.8)
45.0
(31.0–59.9)
57.6
(45.5–68.8)
Degree
44.8
(33.4–56.8)
44.7
(36.2–53.4)
36.8
(20.8–56.4)
48.9
(36.4–61.6)
50.3
(35.6–64.9)
40.8
(29.7–53.0)
Social grade
Upper middle class or middle class
19.9
(12.9–29.4)
27.5
(20.8–35.3)
0.273
17.2
(8.26–32.5)
27.5
(18.7–38.5)
0.485
21.7
(12.6–34.9)
26.2
(17.1–38.0)
0.394
Lower middle class or skilled working class
56.5
(44.8–67.6)
45.5
(36.9–54.4)
63.3
(44.3–78.9)
52.2
(39.6–64.6)
51.9
(37.2–66.3)
39.1
(28.0–51.4)
Working class or lower level of subsistence
23.6
(15.2–34.7)
27.0
(20.2–35.2)
19.5
(8.71–38.0)
20.3
(12.0–32.3)
26.4
(15.4–41.4)
34.7
(24.5–46.6)
Region
England
93.2
(82.8–97.5)
89.7
(83.0–93.9)
0.728
93.6
(65.8–99.1)
88.5
(77.0–94.7)
0.549
92.8
(80.4–97.6)
90.8
(81.7–95.6)
0.383
Wales
2.50
(0.71–8.46)
3.45
(1.28–8.97)
0
––
5.47
(1.75–15.8)
4.23
(1.19–14.0)
1.34
(0.18–9.10)
Scotland
4.35
(1.06–16.1)
6.87
(3.60–12.7)
6.37
(0.88–34.2)
6.04
(2.07–16.4)
2.95
(0.41–18.5)
7.87
(3.54–16.6)
Same sex partner in last 5 years
No
85.5
(76.8–91.3)
84.3
(77.6–89.2)
0.795
82.3
(68.4–90.9)
74.0
(62.3–83.0)
0.297
87.5
(74.5–94.3)
94.9
(88.7–97.7)
0.106
Yes
14.5
(8.73–23.2)
15.7
(10.8–22.4)
17.7
(9.08–31.7)
26.1
(17.0–37.8)
12.5
(5.66–25.5)
5.14
(2.26–11.3)
Became unemployed since first lockdown
No
83.6
(72.1–90.9)
85.1
(77.6–90.4)
0.798
73.3
(51.8–87.5)
90.4
(79.0–96.0)
0.054
90.7
(77.9–96.4)
80.8
(69.2–88.7)
0.157
Yes
16.4
(9.09–27.9)
14.9
(9.58–22.4)
26.8
(12.5–48.2)
9.56
(4.04–21.0)
9.32
(3.59–22.1)
19.2
(11.3–30.8)
Furloughed under coronavirus job retention scheme
No
77.3
(66.0–85.7)
82.7
(75.4–88.2)
0.351
73.4
(52.8–87.2)
85.7
(74.3–92.5)
0.183
80.0
(66.1–89.2)
79.3
(68.3–87.2)
0.922
Yes
22.7
(14.3–34.0)
17.3
(11.8–24.6)
26.6
(12.8.47.2)
14.3
(7.48–25.7)
20.0
(10.9–33.9)
20.7
(12.8–31.7)
Currently smokes cigarettes
No
72.4
(60.0-82.1)
57.1
(48.3-65.6)
0.045
64.5
(42.4-81.7)
46.3
(34.0-59.1)
0.155
77.6
(63.2-87.4)
69.7
(57.9-79.4)
0.354
Yes
27.6
(17.9-40.1)
42.9
(34.4-51.8)
35.5
(18.3-57.6)
53.7
(40.9-66.1)
22.4
(12.6-36.8)
30.3
(20.6-42.2)
Number of days drinking in the last week
0 days
15.7
(9.18–25.6)
25.3
(18.4–33.6)
0.344
17.1
(7.46–34.5)
25.8
(16.1–38.6)
0.822
14.8
(7.07–28.4)
25.1
(16.3–36.7)
0.341
1–2 days
57.2
(45.1–68.4)
45.6
(37.1–54.4)
47.9
(29.1–67.3)
43.3
(31.1–56.3)
63.6
(48.8–76.3)
47.1
(35.6–59.1)
3–4 days
16.3
(9.11–27.6)
19.7
(13.6–27.5)
22.3
(9.42–44.1)
22.2
(13.4–34.6)
12.3
(5.54–25.0)
17.3
(9.97–28.2)
5–7 days
10.7
(4.89–21.8)
9.49
(5.64–15.6)
12.7
(3.26–38.8)
8.74
(4.27–17.1)
9.30
(3.93–20.4)
10.5
(4.85–21.1)
Depression (PHQ2 score)
No symptoms of depression (0–2)
61.4
(49.0–72.5)
49.1
(40.2–58.1)
0.114
55.4
(35.4–73.8)
50.8
(37.5–63.9)
0.706
65.6
(50.0–78.4)
48.3
(36.4–60.4)
0.082
Symptoms of depression (3-6)
38.6
(27.5–51.0)
50.9
(41.9–59.8)
44.6
(26.2–65.6)
49.3
(36.1–62.5)
34.4
(21.6–50.0)
51.7
(39.7–63.6)
Anxiety (GAD2 score)
No symptoms of anxiety (0–2)
61.0
(49.1–71.6)
42.8
(34.4–51.6)
0.015
61.8
(42.0–78.4)
44.6
(32.3–57.5)
0.148
60.4
(45.5–73.5)
41.6
(30.4–53.6)
0.052
Symptoms of anxiety (3–6)
39.0
(28.4–50.9)
57.2
(48.4–65.6)
38.2
(21.6–58.0)
55.4
(42.5–67.7)
39.7
(26.5–54.5)
58.4
(46.4–69.6)
Disability
No
74.2
(62.6–83.2)
51.9
(43.1–60.6)
0.003
70.7
(49.7–85.6)
49.0
(36.3–61.9)
0.078
76.6
(62.6–86.4)
55.7
(43.7–67.0)
0.021
Yes
25.8
(16.8–37.4)
48.1
(39.4–56.9)
29.3
(14.4–50.4)
51.0
(38.1–63.7)
23.4
(13.6–37.4)
44.3
(33.0–56.3)
Limiting disability
No
29.8
(12.5––55.7)
16.0
(8.62–27.9)
0.217
27.2
(5.37–71.1)
20.4
(9.14–39.5)
0.718
32.0
(11.2–63.7)
11.5
(4.05–28.6)
0.128
Yes
70.2
(44.3–87.5)
84.0
(72.2–91.4)
72.8
(28.9–94.6)
79.6
(60.5–90.9)
68.0
(36.3–88.8)
88.5
(71.4–96.0)
aOnline services are defined as those where service users do not interact with a clinician live, such as online postal self-sampling. 24.7% of participants who used online services also used other services in combination.
bColumn percentages in all cases. All percentages and denominators are weighted.
Values in bold denote statistically significant differences between groups.
Among women, online service users more frequently reported being in good or very good health when compared to other service users (91.4% (81.3–96.2) vs. 69.3% (57.4–79.2)), but this was not the case among men. Online service users less frequently reported symptoms of anxiety (39.0% (28.4–50.9) vs. 57.2% (48.4–65.6)) and, among women, depression (34.4% (21.6–50.0) vs. 51.7% (39.7–63.6) than other service users. Similarly, online service users also less often reported having a disability than other service users (25.8% (16.8–37.4) vs. 48.1% (39.4–56.9)).
Discussion
Analyses of data collected from a survey of the British general population suggest that online service users were not typically in groups that experience the highest burden of poor sexual health. Those who were younger, from mixed ethnic backgrounds or from Black/African/Caribbean/Black British ethnic backgrounds showed higher odds of accessing STI testing generally. However, online service users were more often white, more often in good health, and less often reported symptoms of anxiety and depression when compared to other service users. These differences in users could be indicative of a wider gap in access if online services are ever the only option available to a group seeking STI testing, for example asymptomatic testers.
General patterns in STI testing uptake during the pandemic
In line with previous studies, participants who reported having used some form of STI testing were on average younger than non-testers. Similarly, STI testers who identified as men less often reported their sexual identity as heterosexual/straight than men who had not used STI testing services.2 In this survey, STI testers were less frequently white than non-testers. In Britain people from some Black ethnic backgrounds such as Black Caribbean heritage have a higher incidence of STI infections. This finding may indicate that their increased STI testing needs and demand are, at least to some degree, being met even in a pandemic setting.
STI testers more often reported experiencing symptoms of depression and anxiety. This relationship could in part be due to the negative effects that acquiring or being exposed to an STI may have on mental health.12 Furthermore, some studies have shown an association between adverse mental health conditions and STI risk behaviours like condomless sex.13 This is of particular relevance as the COVID-19 pandemic led to an increase in mental health disorders and reduced access to mental health support in many settings, and particularly among young people who are also most affected by STIs.14–17
Finally, STI testers more often reported having a disability than non-testers. The nature of these disabilities, for example whether they were physical, mental or cognitive, was not recorded in this survey. This, combined with the small sample size of participants who had accessed STI testing, largely limits the inferences that can be made. However, previous research has found that STIs are over-represented among people with learning disabilities.18
Patterns in method of accessing STI testing
Among STI testers, those who had accessed online services were less frequently aged below 25, but more frequently aged 25–29 when compared to other service users. This pattern is consistent with findings of other studies.5 Online services like OPSS often require that a user receive a self-sampling kit in the mail. During COVID-19 lockdowns, many young people lived with their families and may not have felt they had a private way to receive testing kits, potentially leading to lower uptake.19,20
As seen in previous studies,5 online service users more often identified as white than other service users. Further investigation is needed to determine if some ethnic groups are facing barriers in accessing online testing, particularly given that certain groups (including Black Caribbean and Black African) face a disproportionate burden of STIs.2
Online service users who were women (but not men) more frequently reported being in good health when compared to other service users. Similarly, online service users less frequently reported anxiety than other service users. This may be linked to experiencing symptoms of an STI,12 which would most likely result in referral to in-clinic testing rather than being offered online testing. Further research should explore whether those experiencing anxiety may face barriers in accessing online services, particularly given the adverse effects on mental health suffered by many during the COVID-19 pandemic.14–17 However, these health questions did not refer specifically to sexual health.
These results reflect that users in groups that experience the highest burden of adverse sexual health less frequently accessed online services than other groups. This includes, for example, those from minority ethnic groups like Black Caribbean communities and those with poorer physical and mental health. This could mean that these users prefer more traditional methods of care or may have more complex needs that require in-person examination. However, it could also indicate barriers in accessing online services. Furthermore, with asymptomatic care increasingly shifting online, if online services become the only way for users to seek STI testing this could become a source of widening health inequalities.
Strengths and limitations of the analysis
Participants included in this analysis after weighting were largely representative of the wider population in Britain with regard to ethnicity, age, gender, and rurality.11 Participants were less likely to be married or to report being in good health than the general population.21 The sample included in this analysis was also better educated but otherwise had a similar social grade structure to the general population.13–15
The target population for Natsal-COVID was the general population rather than, for example, a clinic population. Due to this it is more comprehensive, capturing both those who tried to access sexual health services as well as those who actually did so. Additionally, since recruitment for this study was not limited to a specific sexual health service, a wide view of sexual healthcare-seeking behaviours and experiences across all types of services and service users can be presented. However, as the target population is the general population, this study includes a relatively small number of participants reporting use of STI testing services and specifically online services. Thus, caution must be taken when interpreting the results. The small sample size limited our analysis of service type to descriptive level and meant that we lacked power to provide strong statistical evidence for differences throughout. Participants were recruited through a non-probability web-panel and the survey was administered online, likely introducing a selection bias in favour of more digitally literate participants. This is important given that the primary outcome of interest (access to online testing) is likely to be affected by a person’s digital literacy. Experiences among those who find online access most challenging may not have been captured. The findings are therefore likely to be a conservative estimate of the true differences between those engaging online and not engaging online.
Conclusions
This analysis shows a snapshot of STI testing access among sexual health service users during the first year of the COVID-19 pandemic. Within an increasingly digital healthcare landscape, the pandemic accelerated the roll-out of digital health solutions in sexual health services.22 Assessing who benefits from digital solutions and who may be excluded is crucial within this context. These data suggest that even in a pandemic context, where many people censored their health needs,23 the most at risk of adverse sexual health were less likely to access online care, potentially exacerbating existing inequalities. Ensuring that people with STI testing needs can easily and comfortably access their preferred method of testing should be prioritised by sexual healthcare providers.
Future work with a larger sample size of STI testers and online service users would allow a further exploration of the differences in access identified in this study. However, despite small numbers of online users in this study, there are signals that inequalities existed in regard to accessing services online. As this survey was administered online, future research reaching those unable or unwilling to engage online may reveal further gaps in access to online testing. Whether the existence of these inequalities is a COVID-specific finding or one that persists post-pandemic warrants further investigation as well. Further research is needed to know if those accessing online services less frequently simply prefer other types of services, or if they are facing barriers in accessing online STI testing. These differences in access patterns are particularly relevant as asymptomatic testing is increasingly offered online, and could cause inequalities in access to care if online testing is the only option offered to users. If differences in access patterns are found to be indicative of inequalities in access to care more broadly, mitigation strategies should be adopted by sexual health service providers.
Supplemental Material
Supplemental Material - Who accessed STI testing in Britain during the COVID-19 pandemic and how: Findings from Natsal-COVID, a cross-sectional quasi-representative survey
Supplemental Material for Who accessed STI testing in Britain during the COVID-19 pandemic and how: Findings from Natsal-COVID, a cross-sectional quasi-representative survey by Nuria Gallego Marquez, Alison R. Howarth, Emily Dema, Fiona Burns, Andrew J. Copas, Catherine H. Mercer, Pam Sonnenberg, Kirstin R. Mitchell, Nigel Field, Jo Gibbs in International Journal of STD & AIDS.
Footnotes
Author contributions
N.G.M., J.G., A.H., N.F., E.D. conceptualised the analysis. The analysis was carried out by N.G.M., with review and contributions to data interpretation from J.G., A.H., N.F., E.D., and A.C. N.G.M. wrote the first draft, with contributions from J.G. and A.H. E.D., F.B., A.C., C.H.M., P.S., K.M., and N.F. revised the manuscript. J.G. and F.B. are principal investigators on ASSIST, P.S. and C.H.M. are principal investigators on Natsal, and N.F. and K.M. are principal investigators on Natsal-COVID.
Declaration of conflicting interests
The authors declared no potential conflicts of interest with respect to the research, authorship, and/or publication of this article.
Funding
The ASSIST study is funded by the National Institute for Health Research (NIHR) Health and Social Care Delivery Research Programme (reference: NIHR129157). The views expressed are those of the authors and not necessarily those of the NIHR or the Department of Health and Social Care. This report is independent research supported by the National Institute for Health and Care Research ARC North Thames. Natsal is a collaboration between University College London (UCL), the London School of Hygiene and Tropical Medicine (LSHTM), the University of Glasgow, Örebro University Hospital, and NatCen Social Research. The Natsal Resource, which is supported by Wellcome (212931, ), with contributions from the Economic and Social Research Council (ESRC) and National Institute for Health Research (NIHR), supports the Natsal-COVID study in addition to funding from the UCL Coronavirus Response Fund and the MRC/CSO Social and Public Health Sciences Unit (Core funding, MC_UU_00022/3; SPHSU18). The funders had no role in study design, data collection and analysis, decision to publish, or preparation of the manuscript. K.M. is supported by the MRC/CSO Social and Public Health Sciences Unit (core funding, MC_UU_00022/3).
Ethical statement
ORCID iD
Nuria Gallego Marquez
Data Availability Statement
The data used in this study are available in a public, open access repository: .
Supplemental Material
Supplemental material for this article is available online.
SumrayKLloydKCEstcourtCS, et al.Access to, usage and clinic outcomes of, online postal sexually transmitted infection services: a scoping review. Sex Transm Infect2022; 98: 528–535. DOI: 10.1136/sextrans-2021-055376.
BanerjeePThorleyNRadcliffeK. A service evaluation comparing home-based testing to clinic-based testing for Chlamydia and gonorrhoea in Birmingham and Solihull. Int J STD AIDS2018; 29: 974–979. DOI: 10.1177/0956462418767180.
6.
BracebridgeSBachmannMORamkhelawonK, et al.Evaluation of a systematic postal screening and treatment service for genital Chlamydia trachomatis, with remote clinic access via the internet: a cross-sectional study, East of England. Sex Transm Infect2012; 88: 375–381. DOI: 10.1136/sextrans-2011-050267.
7.
ManaviKHodsonJ. Observational study of factors associated with return of home sampling kits for sexually transmitted infections requested online in the UK. BMJ Open2017; 7: e017978. DOI: 10.1136/bmjopen-2017-017978.
MitchellKRWillisMDemaE, et al.Sexual and reproductive health in Britain during the first year of the COVID-19 pandemic: cross-sectional population survey (Natsal-COVID-Wave 2) and national surveillance data. Sex Transm Infect2023; 99: 386–397. DOI: 10.1136/sextrans-2022-055680.
10.
DemaEConollyAWillisM, et al.Methodology of Natsal-COVID Wave 2: a large, quasi-representative, longitudinal survey measuring the impact of COVID-19 on sexual and reproductive health in Britain. Wellcome Open Res2022; 7: 166. DOI: 10.12688/wellcomeopenres.
11.
GearyRSCopasAJSonnenbergP, et al.Sexual mixing in opposite-sex partnerships in Britain and its implications for STI risk: findings from the third national survey of sexual Attitudes and Lifestyles (Natsal-3). Int J Epidemiol2019; 48: 228–242. DOI: 10.1093/ije/dyy237.
12.
National Institute for Health and Care Excellence. Reducing sexually transmitted infections (STIs): effectiveness, acceptability and cost-effectiveness of strategies to improve uptake of STI testing. London: National Institute for Health and Care Excellence (NICE), 2022.
13.
BASHH & Terrence Higgins Trust. The State of the Nation: sexually transmitted infections in England, vol. 93, 2014.
14.
DewaLHRobertsLChoongE, et al.The impact of COVID-19 on young people’s mental health, wellbeing and routine from a European perspective: a co-produced qualitative systematic review. PLoS One2024; 19: e0299547. DOI: 10.1371/journal.pone.0299547.
15.
Ludwig-WalzHDannheimIPfadenhauerLM, et al.Increase of depression among children and adolescents after the onset of the COVID-19 pandemic in Europe: a systematic review and meta-analysis. Child Adolesc Psychiatry Ment Health2022; 16: 109. DOI: 10.1186/s13034-022-00546-y.
16.
WangSChenLRanH, et al.Depression and anxiety among children and adolescents pre and post COVID-19: a comparative meta-analysis. Front Psychiatry2022; 13: 917552. DOI: 10.3389/fpsyt.2022.917552.
17.
GalanisPKatsiroumpaAVrakaI, et al.Post-COVID-19 syndrome and related Dysautonomia: reduced quality of life, increased anxiety and manifestation of depressive symptoms: evidence from Greece. Acta Med Litu2023; 30: 139–151. DOI: 10.15388/Amed.2023.30.2.6.
18.
MiddletonAPothoulakiMWoode OwusuM, et al.How can we make self-sampling packs for sexually transmitted infections and bloodborne viruses more inclusive? A qualitative study with people with mild learning disabilities and low health literacy. Sex Transm Infect2021; 97: 276–281. DOI: 10.1136/sextrans-2020-054869.
19.
SpenceTKanderIWalshJ, et al.Perceptions and experiences of internet-based testing for sexually transmitted infections: systematic review and synthesis of qualitative research. J Med Internet Res2020; 22: e17667. DOI: 10.2196/17667.
20.
StablerLCunninghamEMannayD, et al.I probably wouldn’t want to talk about anything too personal’: a qualitative exploration of how issues of privacy, confidentiality and surveillance in the home impact on access and engagement with online services and spaces for care-experienced young people. Adopt Foster2024; 47: 277–294. DOI: 10.1177/03085759231203019.
21.
DemaEConollyAWillisM, et al.Methodology of Natsal-COVID Wave 2: a large, quasi-representative, longitudinal survey measuring the impact of COVID-19 on sexual and reproductive health in Britain. Wellcome Open Res2022; 7: 166. DOI: 10.12688/wellcomeopenres.
Bosó PérezRReidDMaxwellKJ, et al.Access to and quality of sexual and reproductive health services in Britain during the early stages of the COVID-19 pandemic: a qualitative interview study of patient experiences. BMJ Sex Reprod Health2022; 49: 12–20. DOI: 10.1136/bmjsrh-2021-201413.
Supplementary Material
Please find the following supplemental material available below.
For Open Access articles published under a Creative Commons License, all supplemental material carries the same license as the article it is associated with.
For non-Open Access articles published, all supplemental material carries a non-exclusive license, and permission requests for re-use of supplemental material or any part of supplemental material shall be sent directly to the copyright owner as specified in the copyright notice associated with the article.