
Abstract
Background
It has been hypothesized that HIV-1 infection prematurely “ages” individuals phenotypically and immunologically. We measured phenotypic frailty and immune “aging” markers on T-cells of people living with HIV on long term, suppressive anti-retroviral therapy (ART) to determine if there is an association between frailty and immunosenescence.
Methods
Thirty-seven (37) community-dwelling people living with HIV were measured for frailty using a sensor-based frailty meter that quantifies weakness, slowness, rigidity, and exhaustion. An immunological profile of the patients’ CD4+ and CD8+ T-cell expression of cell surface proteins and cytokines was performed (n = 20).
Results
Phenotypic frailty prevalence was 19% (7/37) and correlated weakly with the number of past medical events accrued by the patient (r = 0.34,
Conclusion
Frailty in people living with HIV on long term, suppressive ART did not correlate with aging or T cell markers of exhaustion or immunosenescence.
Introduction
In the 1980s and ‘90s, the physical manifestations of untreated HIV-1 infection and the side effects of anti-retroviral therapy (ART) were common and obvious to all clinicians. For example, weight loss, cutaneous Kaposi’s sarcoma, lipodystrophy, and neuropathy were commonplace. 1 One hypothesis advanced to explain the physical deterioration in people living with HIV was that the HIV-1 virus aged the patient “with an earlier occurrence of a phenotype that resembles the phenotype of frailty in older adults without HIV infection”. 2 Another hypothesis claimed that HIV/AIDS “compress[ed] the aging process, perhaps accelerating comorbidities and frailty.” 3 The implication was that HIV-1 infection, particularly when untreated, leads to premature aging and frailty. This concept still has adherents today 4 although we have shown that ART actually reverses some of these processes. 5
It is a fact that untreated HIV-1 infection is associated with the onset of a frail phenotype in some individuals. In the current era when therapy is advocated for all patients, therefore, it is important to establish whether ART prevents, ameliorates, or reverses frailty and immunosenescence. The irreversible loss of physical function over time can be portrayed as a spiral of decreased mobility and activity leading to the pre-frail state and finally, frailty. 6 Untreated HIV-1 infection also leads to immunosenescence with the accumulation of CD8+ and CD4+ T-cell subsets associated with aging. For example, terminally differentiated CD28−/CD57+ bearing T-cells found in untreated HIV-positive patients are the hallmark of immunosenescence, whereas, the loss of naïve CD4+ and CD8+ T-cells demonstrates an ineffective response to the HIV-1 infection. 7 In aging uninfected individuals, there is a major decline in CD4+ and CD8+ cells expressing CD28, in itself an expression of immunosenescence. 8
In this work, we measure physical frailty as well as immunological markers of aging in a group of older, mostly men, on long-term, suppressive ART. Our goal was to determine if there is some association of frailty or immunosenescence in people living with HIV on long term ART. Several markers of inflammation have been studied with regard to their contribution to aging and frailty such as CRP and IL-6 9 and others have looked at socioeconomic factors. 10 However, we chose immunological markers of aging in people living with HIV, comparing markers in non-frail with frail individuals living with HIV. We wondered if frailty was correlated or perhaps, causally linked to immunosenescence. We found that prolonged, suppressive ART restores many immunological parameters previously damaged by HIV, even returning some immunological measurements to normal values. 11 Although HIV targets the immune system and clearly contributes to frailty, both processes, frailty and immunosenescence appear to be reversible.5,11
Methods
Demographics
Our large urban HIV clinic serves the surrounding metropolitan area of Tucson and southern Arizona (approximately 1800 patients). The same physician (SAK) has followed these patients for over 20 years and >91% are virally suppressed (meaning <200 copies of HIV-1 RNA 12 ). Some subjects participated in previous aging/frailty studies. For this study we recruited patients who were compliant with ART, of an older age, virally suppressed for years, and who consented to cell harvesting for our studies of immunological aging.11,13,14 Recruits were not chosen on the basis of frailty as that was measured later. It is important to note that frailty was determined within a year of cell surface analysis. 11 The study was approved by the Institutional Review Board of the University of Arizona, Tucson, Arizona. Informed consent was obtained from all participants, and the study performed in accordance with relevant guidelines and regulations approved by the University of Arizona Biosafety Committee. Baseline demographic and medical information was collected at the time of frailty measurement and included age, sex, occurrence of specific, past medical events (heart disease, lung disease, neurological disease, arthritis, cancer, and surgery) resulting in hospitalization for two or more days in the last year or at any time in the past, the last CD4+ count, last viral load value, and whether the patient had been previously diagnosed with AIDS. These data are available from a dedicated EMR system accessed by the investigators.
Frailty measurements
Measurements of frailty were performed using a sensor-based upper extremity method called Frailty Meter (FM) (Frailty MeterTM, Biosensics, Newton, MA).15,16 FM consists of one wrist-worn sensor and a wirelessly connected tablet. FM works by quantifying weakness, slowness, rigidity, and exhaustion during a 20-second repetitive elbow flexion/extension task using the wrist-worn sensor. The four scores indicate how different aspects of the patient’s performance contribute to their frailty and generate a frailty index score (FI) ranging from zero to one; higher values indicate progressively greater severity of frailty. Twenty (20) seconds was chosen from a prior study18,19 in which a 20-second repetitive elbow flexion/extension exercise was long enough to capture alterations in elbow angular velocity due to the presence of exhaustion phenotype (based upon the Fried Frailty Exhaustion phenotype 17 ), but not too long to observe a noticeable alteration in those without the presence of exhaustion phenotype. Using a machine learning model, the measured phenotypes are mapped into a continuous FI scale ranging from 0 to 1. This methodology has been validated 15 against Fried criteria 17 which serve as the “gold standard” of the phenotypic measurement of frailty and which we performed in all prior frailty investigations. The sensor is attached to a tablet which provides a rapid readout of the results. We measured the FI using the dominant and non-dominant hand as well as a dual task exercise which entailed counting backward from 100 in increments of three while performing the elbow flexion with the dominant hand. In a previous study, it was demonstrated that dual-task exercise allows distinguishing between older adults with and without cognitive impairment. 15 An FI over 0.27 indicates that the patient is frail.
Measurement of Depression
We measured all subjects for the presence of depression using the Center for Epidemiological Studies-Depression (CES-D) test. CES-D is a quick 20 question test developed to detect depression. 20 A score ≥22 indicates the possibility of major depression; scores between 15 and 21 suggests moderate to mild depression; score <15 indicates no depression present in the patient.
Immunology and other clinical data
Blood samples were drawn from patients following permission and processed at the University of Arizona Biorepository Laboratory. Peripheral blood mononuclear cells were cryopreserved for future analysis. A complete blood count was performed using an Ac-T 5diff CP machine (Beckman Coulter, Pasadena, CA). Cryopreserved PBMC (1–2x10⁶/sample) were stained with LIVE/DEAD Fixable Dead Cell Stain-AQUA (Invitrogen) and T cell markers in various combinations. 11 The following mAbs were used to differentiate T cell subsets: CD3—BV570 (BioLegend), CD4—APC (eBioscience), CD8β—ECD (Beckman Coulter), CD95—BV421 (BioLegend), CD28—PerCp/Cy5.5 (BioLegend), CCR7—FITC (BD Pharmogen), CD45RA—BV605 (BioLegend), CD57—BV570 (BioLegend), IFN-γ—APCe780 (eBioscience). Cells following various combination and incubations as described in our previous study, 11 were analyzed on the BD LSR II instrument using DiVa acquisition (BDIS, Mountain View, CA) and the FlowJo analysis software (TreeStar Inc., Ashland, OR).
Twenty (20) of 37 patients in this study completed the entire cell surface analysis.
Statistical analysis: frailty analysis
A Pearson’s correlation coefficient and corresponding p-value were constructed for FI and CES-D scores against each clinical factor: age, last CD4+ cell count, number of past medical events; binary variables were sex, past medical event, AIDS diagnosis, and if virally suppressed (<200 copies/mL). Correlations greater than 0.8 or less than −0.8 indicate a strong linear relationship between the outcome and predictor 21 and p-values less than 0.05 are considered statistically significant. All correlations and p-values were calculated in SAS version 9.4.
Immunologic analysis
Cell population totals were graphed using median values with 95% confidence intervals. An unpaired, non-parametric Mann–Whitney test was used to determine statistical significance between different populations. A linear regression model was used for all linear plots comparing a population of CD4 and CD8 T-cell counts and FI or age. Statistical significance was obtained by comparing the slope of the population to a slope of zero. In the event both linear regression slopes were significantly non-zero, the slopes were compared to each other to determine if they were significantly different. Software used was GraphPad Prism version 7. The following cells and surface markers were investigated: total CD4 and CD8 cell counts/percentages; CD4 CD28, CD4 CD57, CD4 CD28 CD57, and CD8 CD28, CD8 CD57, CD8 CD28 CD57, and CD4 and CD8 production of IFN-g (PHA-stimulated and unstimulated), and CD8 TNF-a (PHA-stimulated and unstimulated).
Results
Frailty measurements
Pertinent clinical factors for HIV-positive individuals in the study.
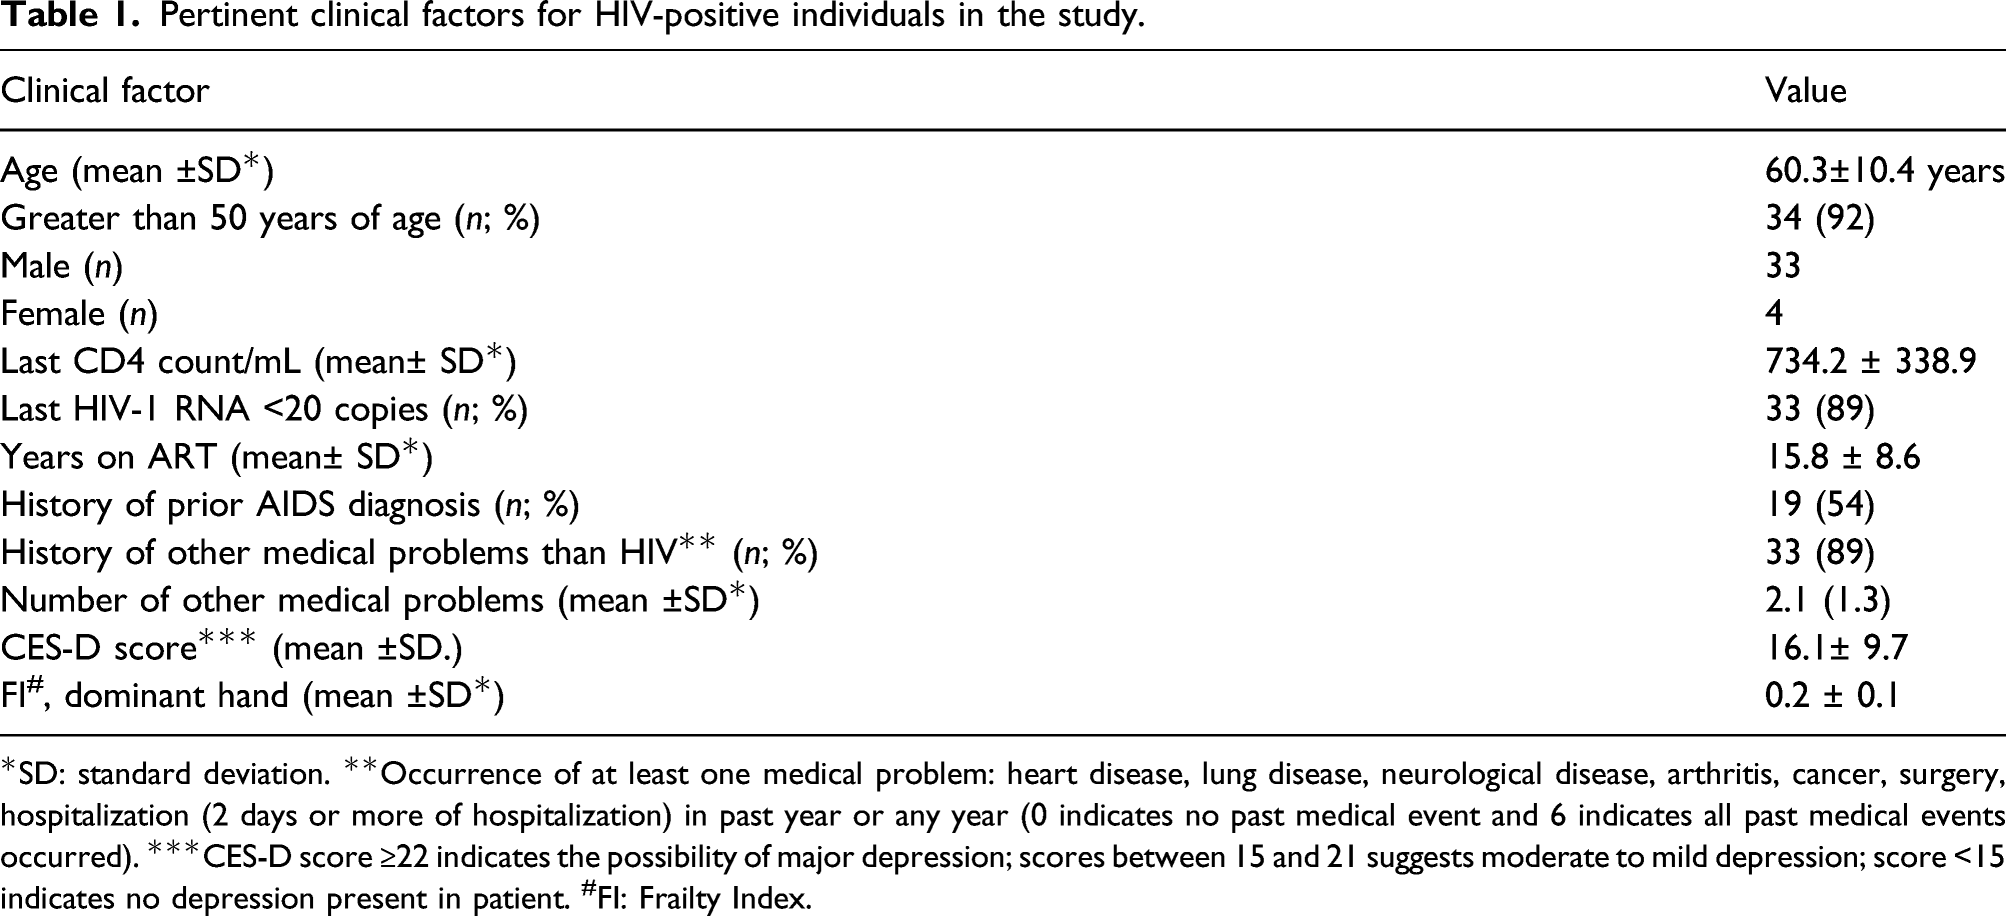
*SD: standard deviation. **Occurrence of at least one medical problem: heart disease, lung disease, neurological disease, arthritis, cancer, surgery, hospitalization (2 days or more of hospitalization) in past year or any year (0 indicates no past medical event and 6 indicates all past medical events occurred). ***CES-D score ≥22 indicates the possibility of major depression; scores between 15 and 21 suggests moderate to mild depression; score <15 indicates no depression present in patient. #FI: Frailty Index.
Correlation co-efficient between Frailty Index and clinical factors.
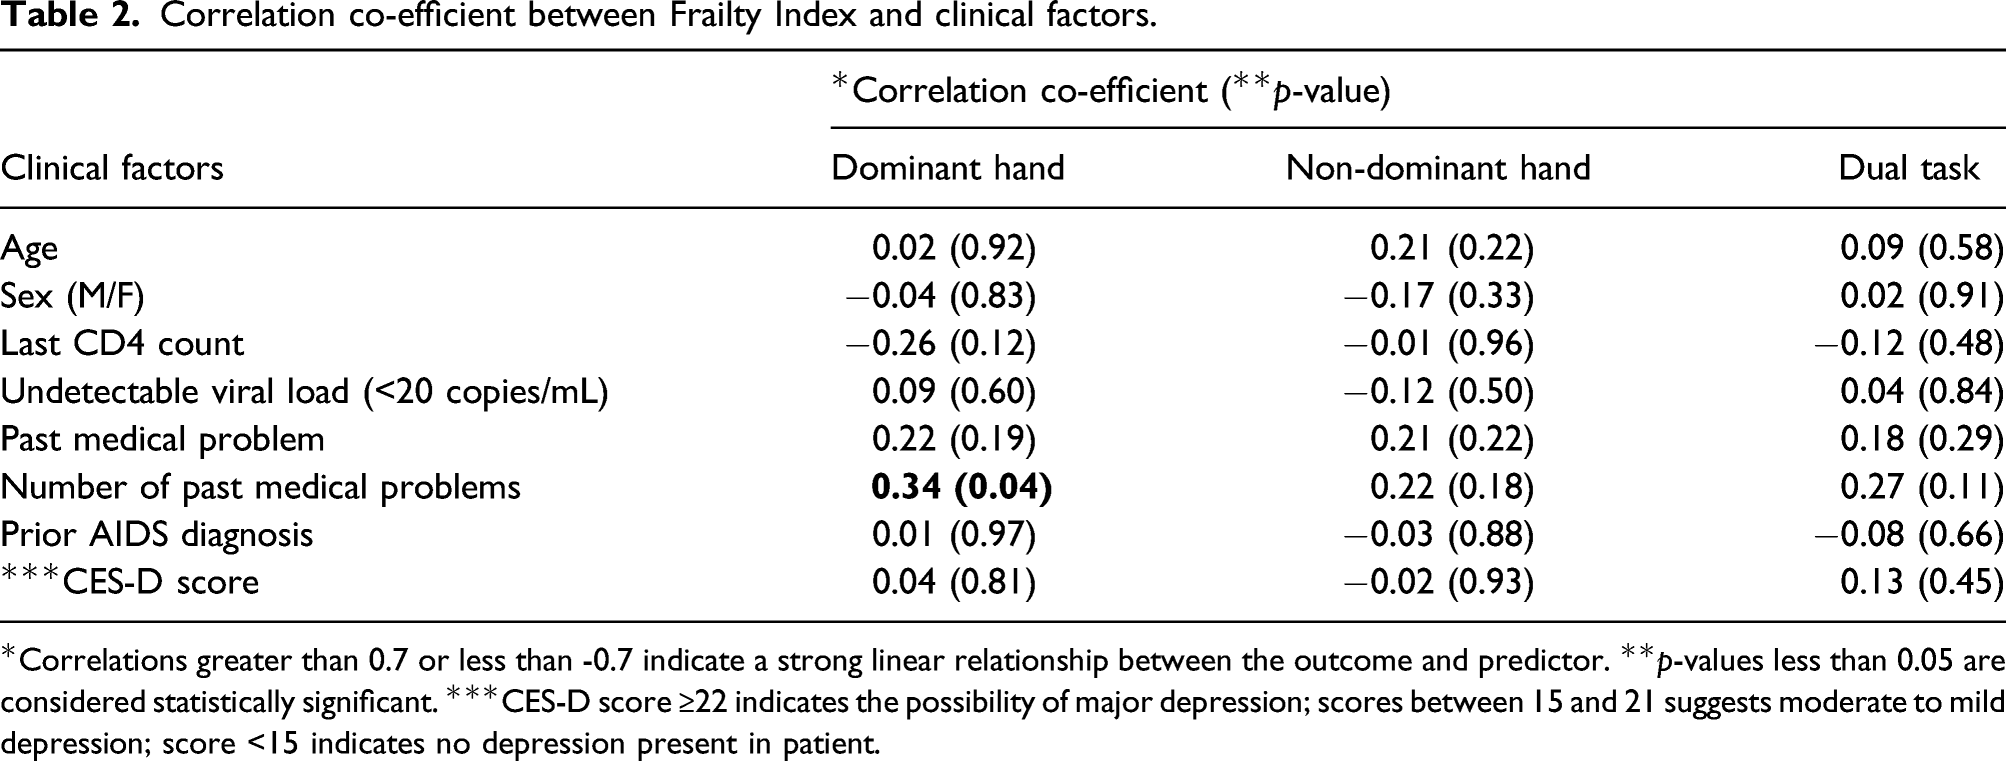
*Correlations greater than 0.7 or less than -0.7 indicate a strong linear relationship between the outcome and predictor. **p-values less than 0.05 are considered statistically significant. ***CES-D score ≥22 indicates the possibility of major depression; scores between 15 and 21 suggests moderate to mild depression; score <15 indicates no depression present in patient.
Correlation between CES-D score and clinical factors.
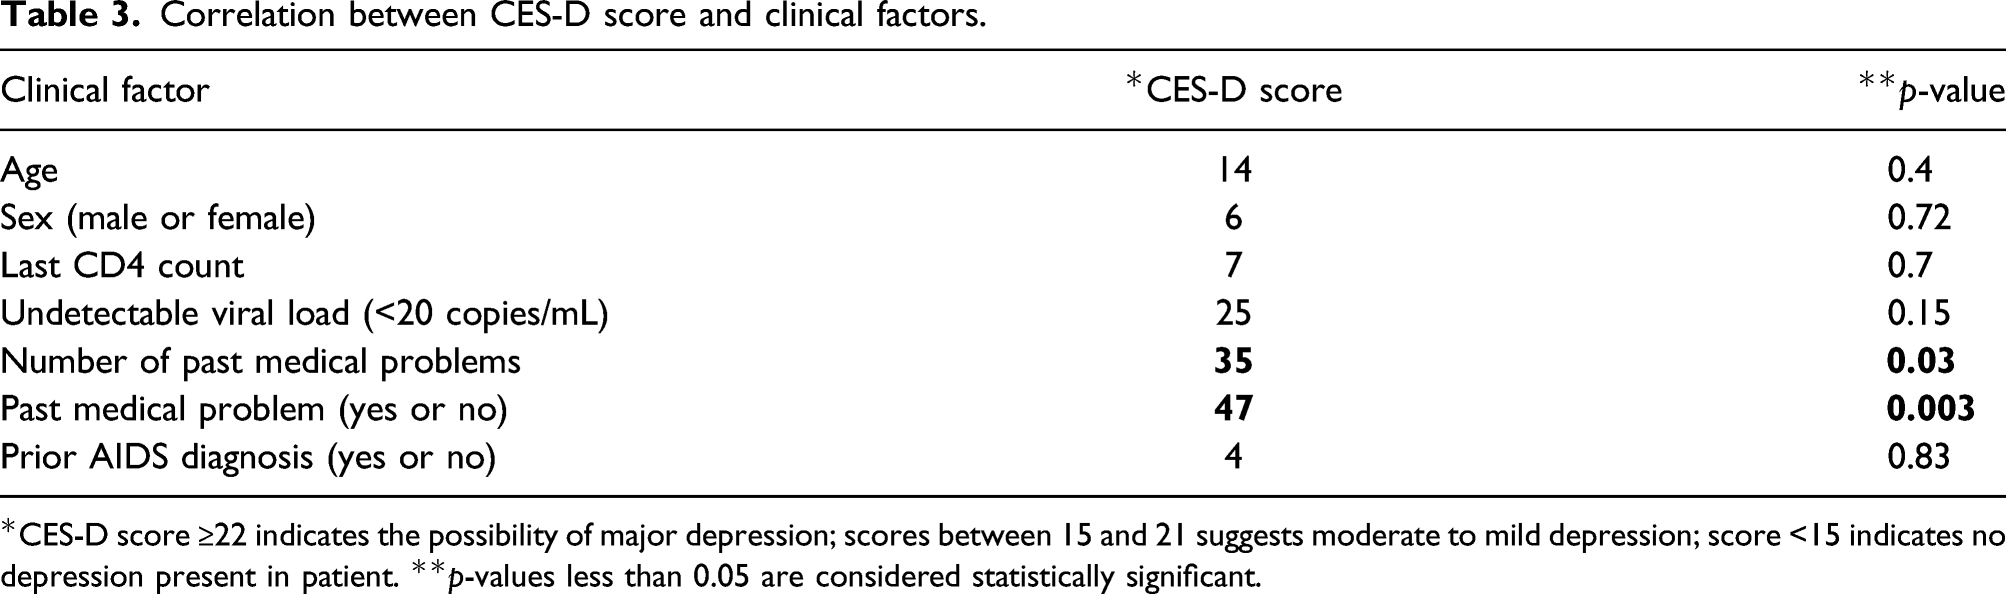
*CES-D score ≥22 indicates the possibility of major depression; scores between 15 and 21 suggests moderate to mild depression; score <15 indicates no depression present in patient. **p-values less than 0.05 are considered statistically significant.
Immunologic measurements
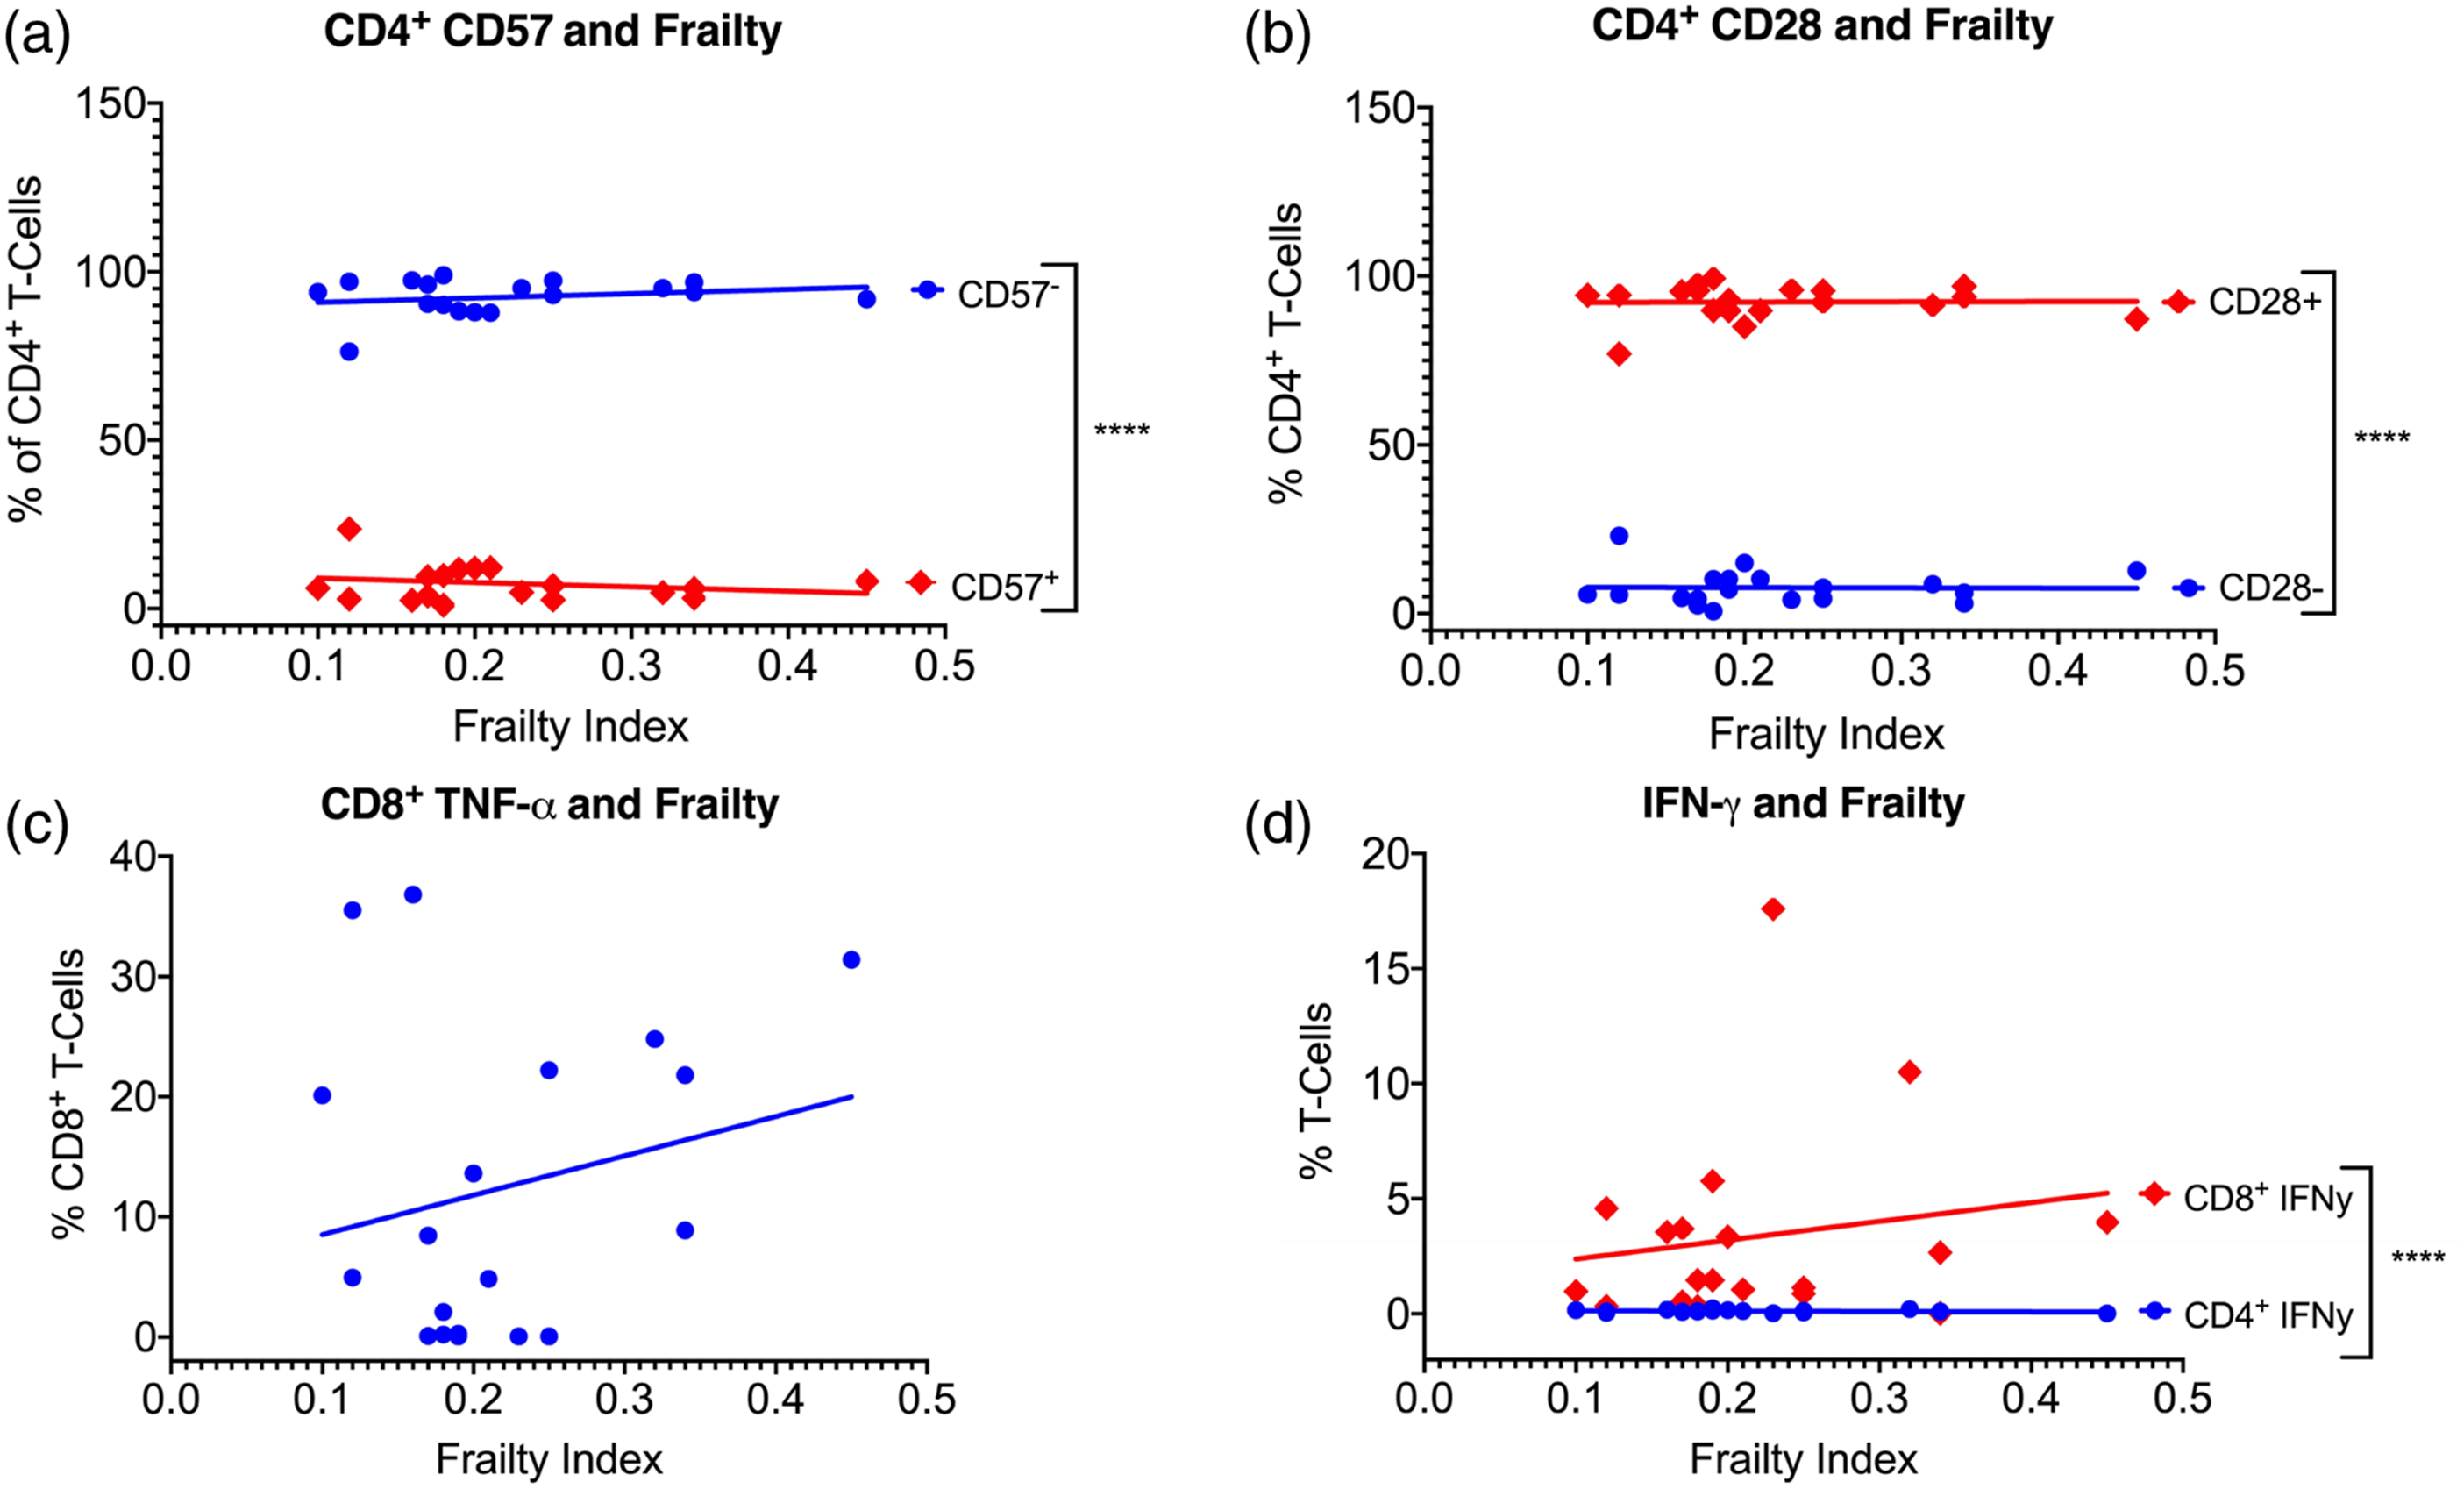
We measured the surface expression of various HIV-1 and immune aging/exhaustion markers on CD4+ and CD8+ T-cells of the participants. For these results, we used FI as measured using the dominant hand (since there was no difference between hands; see above). The participants had a mean CD4 cell count of 732 and all were virally suppressed (Table 1). Although the CD4+ and CD8+ T-cell counts were significantly different, there was no correlation between their numbers and the FI (Figure 1(a)). Likewise, there was no correlation of the FI with the following four cell populations: CD8+ CD28+/− (Figure 1(b)), CD8+ CD28+/− CD57+/− (Figure 1(c)), CD8 CD57+/− (Figure 1(d)), CD4 CD57+/− (Figure 2(a)), and CD4 CD28+/− (Figure 2(b) (a)CD4 and CD8 T-cell counts and the Frailty Index measuring the dominant hand. The difference in the two cell populations was not significant: (a). CD4+ CD57 cells and the Frailty Index measuring the dominant hand. ****The difference in the two cell populations was significant: 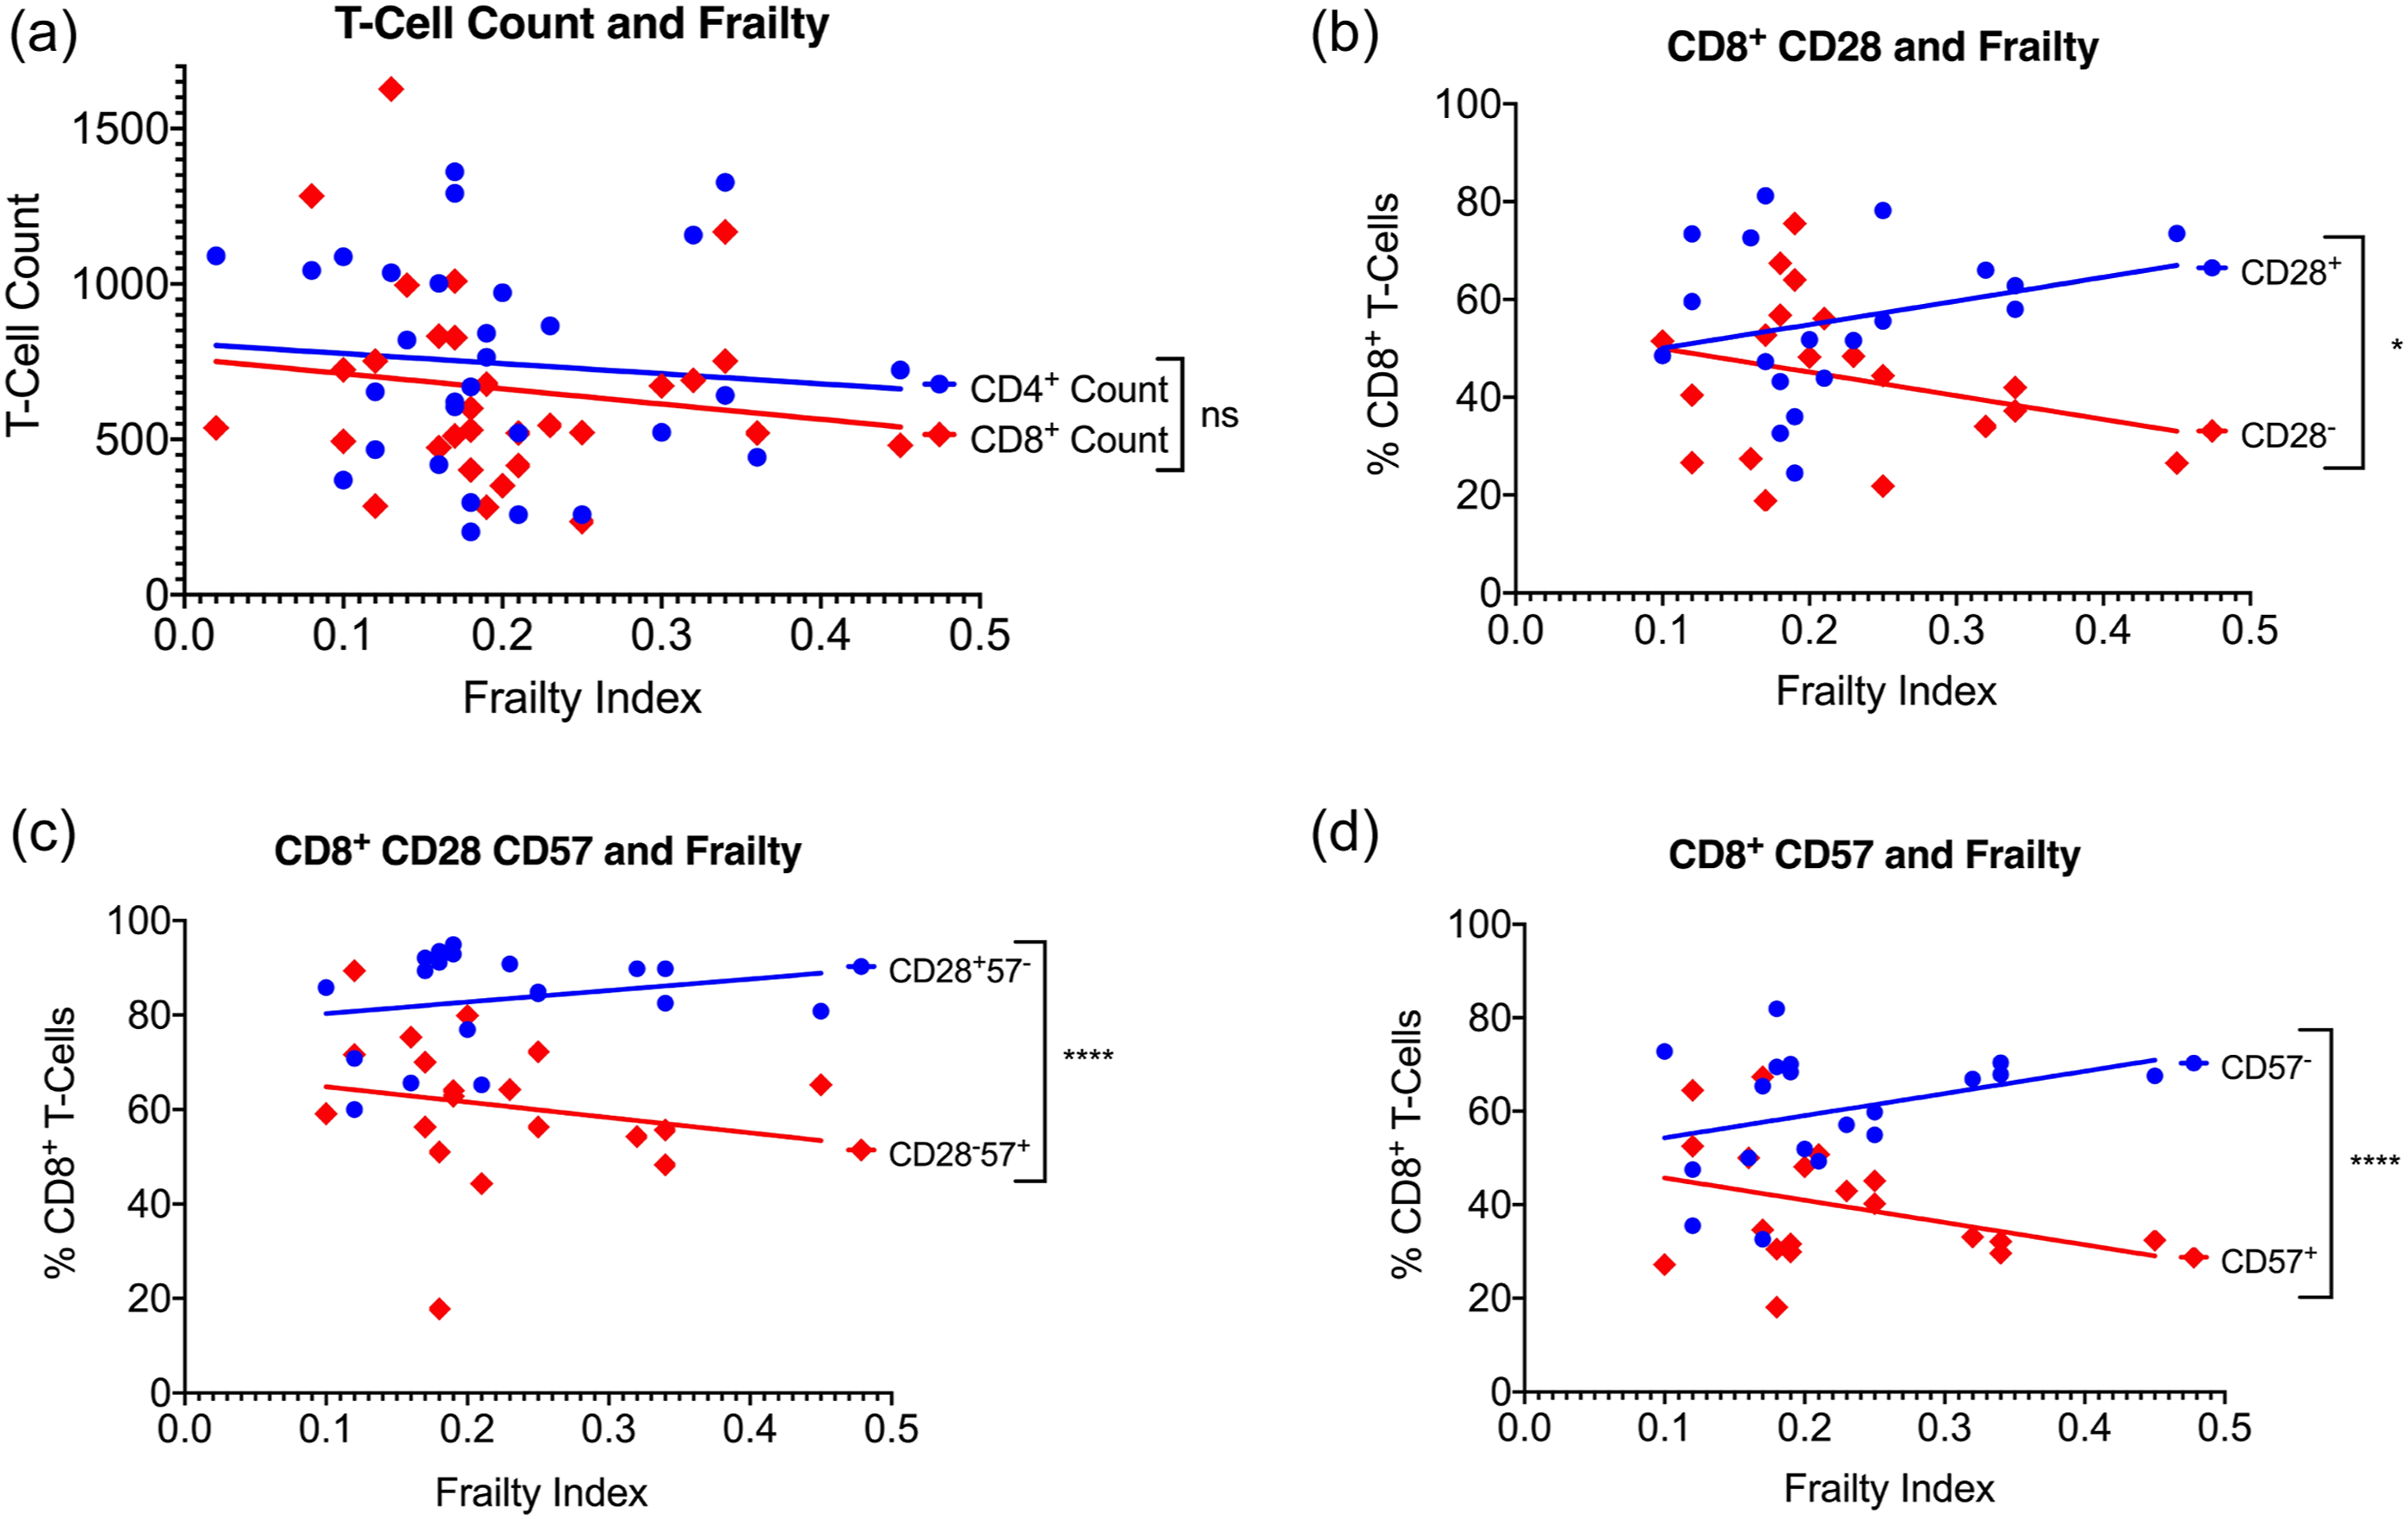
Discussion
We have been interested in the effect ART has upon “phenotypic or physical frailty” and “premature aging” of T-cells. One standard method of determining frailty measures physical parameters, 17 whereas, another approach adds up cumulative deficits to arrive at a frailty score. 22 We employed sensor-based technology to measure physical parameters of frailty. Although many investigators treat frailty occurring in the elderly and people living with HIV as identical processes, we believe “frailty” in these two populations is quite different. The characteristics of each cohort have been delineated. 23 For example, in the community-dwelling elderly, frailty is age-related but it is not in people living with HIV. 24 Prevalence of frailty in the community-dwelling elderly is ∼7%, whereas, it is much higher in people living with HIV, ∼ 20%, where it is often transient and reversible. 5 Sarcopenia is a defining feature of frailty in the elderly but is not as important in people living with HIV where depression is a common factor. 24 As mentioned above, frailty is often reversible in people living with HIV, 5 whereas, this rarely occurs in the frail elderly. 24 Following frail people living with HIV over time as we have done we find frailty to be highly fluid. Others have noted the same phenomenon. A recent study found that 36% of HIV-positive and age-matched uninfected control individuals changed frailty status between two consecutive visits. 25 Nevertheless, the prevalent view assumes that the frailty occurring in community-dwelling elderly and in people living with HIV are similar or identical processes. 26
Our study found results similar to those we have reported before.5,24 For example, seven of 37 HIV-positive subjects were frail, for a prevalence of 19% and the frailty status was not correlated with age, sex, the CD4+ cell count, being virally suppressed with ART, or whether they were diagnosed with AIDS in the past or were depressed (Table 2). The sole correlation with frailty we found was with the number of past medical problems (
It is claimed that immune aging or immunosenescence seen in HIV infection is similar to that which occurs in the uninfected elderly characterized by accumulation of highly differentiated immunocompetent cells with a concomitant reduction in hematopoietic progenitor and naïve cells. 27 In HIV-specific CD8+ T-cells, this population of highly differentiated cells expresses CD57 and loses their proliferative ability and undergoes apoptosis. 28 These CD8 T-cells fall into 4 separate populations: CD28+CD57−, CD28−CD57+, CD28−CD57−, and CD8+CD57+. 29 In our subjects, all of whom were virally suppressed, there was no correlation of the FI with any acknowledged T-cell marker of senescence including the absence of CD8+ CD28+ or CD8+ CD57+ cells. Although there was a residuum of TNF-α detected in some cells there was no correlation between TNF-α expression and the FI (Figure 2(d)). This residual TNF-α expression may occur in some of our treated patients with lower total CD4+ cell counts. 30 Our work has demonstrated that long-term ART with higher CD4+ T-cell numbers improved patients immunologically, reducing HIV-specific CD8+ T-cell responses compared to those with lower CD4+ T-cell counts. 11 In that same study, older people living with HIV exhibited decreasing levels of CD8+ T-cell responses with increasing age. 11 Moreover, virologic control of HIV-positive patients on long-term ART was associated with a significant reduction in terminally differentiated T-cells demonstrating decreased cell senescence and improvement in numbers of naïve to memory T-cells. 11 These studies showed a major improvement in the immunological markers associated with HIV-1 infection in older patients maintained on long-term ART.
Conclusion
We showed in this work that people living with HIV on long term, suppressive ART exhibit similar prevalence rates of frailty as our previous studies (i.e.,∼ 20%), but frailty did not correlate with age, sex, prior diagnosis of AIDS, or immunosenescence. Specifically, frailty did not correlate with any CD4+ or CD8+ T-cell surface proteins known to be associated with immunosenescence such as is seen in frail, community-dwelling elderly individuals. The physical and immunological characteristics of frail, virally suppressed people living with HIV differed from that of frail, community-dwelling elderly. Thus, it is likely that the etiology of frailty in these two populations is different.
Footnotes
Acknowledgments
The authors express their gratitude to the patients for their participation in this study. SAK, NB, BN, and NA designed the study; CE and SNS collected clinical data and measured frailty; ML and NB collected samples and performed the immunological studies; SAK and MM performed the statistics; ML made the figures and SAK wrote the draft; SAK, BN, and NA edited the final MS.
Declaration of conflicting interests
The author(s) declared no potential conflicts of interest with respect to the research, authorship, and/or publication of this article.
Funding
The author(s) disclosed receipt of the following financial support for the research, authorship, and/or publication of this article: This work was supported by intramural funds from the Petersen Clinic, University of Arizona and a grant to NA from the Arizona Biomedical Research Commission, Arizona Department of Health Services (ADHS14-082984).