
Abstract
Equitable access to green spaces is essential in cities, especially those with complex socio-economic challenges. This study considers how socio-economic characteristics influence traditional park access measures, using a geographically weighted regression (GWR) to analyse park access equity in Johannesburg. The use of a spatially sensitive statistical approach enables a more nuanced analysis of equity than previous studies have permitted in Johannesburg, thus empowering better park access planning. The method considers the number of parks and distance to the nearest park as important access measures. The study shows a complex relationship between different interpretations of park access relative to various socio-economic considerations, such as population density, unemployment rates and education levels, and that inequity in access to park space according to these measures varies across the city. The findings offer an opportunity for an improved understanding of local environmental justice and could potentially inform more equitable park planning and management policies in cities.
Keywords
I. Introduction
Environmental justice requires that environmental benefits and burdens be equitably distributed and that participation in reaching this objective be inclusive.(1) Related scholarship has primarily focused on the exposure of minorities and lower-income groups to environmental hazards such as toxic waste and pollution,(2) with limited research into their access to environmental benefits, such as those provided by parks. Accumulating evidence suggests that accessible parks contribute positively to urban liveability and improved quality of life.(3) Parks can increase property values(4) and provide a range of ecosystem services, including climate regulation, heat stress reduction, flood control, air purification and noise reduction.(5)
Studies also suggest that proximity to parks can promote participation in recreational activities, and encourage walking and other exercise, with a range of potential health benefits.(6) However, research also shows that there is unequal access to urban parks,(7) with the urban poor and minority groups being worse off.(8) The disproportionate proximity of these groups to environmental hazards compounds other socio-economic challenges.(9) Careful urban policy and planning thus play an essential role in countering this dynamic and ensuring equitable distribution of parks and their associated benefits.
Establishing accessibility standards is one way to support consistency in urban planning to reduce inequitable park distribution and access.(10) Equitable park access enables all urban residents to benefit from the ecosystem services associated with parks.(11) Nicholls(12) describes accessibility as “the ease with which a site or a service may be reached or obtained; it is thus said to measure the relative opportunity for interaction or contact with a given phenomenon such as a park”. Accessibility is the possibility of reaching the desired location over a certain distance.(13) “Physical indices such as distance and proximity, total park area, park area per capita, and the number of parks”(14) are widely used by urban planners as criteria for evaluating and planning park access.
Accessibility measures that increase the equitable distribution of parks have been critiqued, however, for neglecting multiple context-specific considerations that vary across temporal and spatial scales,(15) thus failing to reflect reality.(16) Scholars critique park access indices that simply count parks within a particular geographic unit as a basis for equity, as they do not consider how much park space is available to residents. Instead, they argue that park size should be used as a weighting variable.(17) Location-based measures, which consider the minimum distance to parks, have also been critiqued for incorrectly assuming that ecosystem services emanating from parks are shared equitably in the surrounding areas(18) or among different groups of people.(19) Studies also show that park users do not necessarily visit the park nearest to them and that park use can be constrained by a range of other factors. Miller(20) argues that accessibility should thus use utility-based measures(21) considering individuals’ travel impedance (influenced by transport and land-use characteristics),(22) individual socio-economic characteristics (for example, age, gender, socio-economic status, neighbourhood and subjective perceptions of safety) and social needs.(23) These considerations provide the basis for accessibility standards that measure equitable rather than universal park access.
“Equity” also has multiple interpretations,(24) as reflected in its usage. Distributional equity refers to the fair distribution of resources, i.e. who gets what.(25) Lucy (26) provides four additional equity typologies: equality, compensatory equity, demand and willingness to pay. Equality-based equity refers to the equal allocation of resources, regardless of socio-economic or geographic characteristics. Compensatory equity refers to more resources being allocated to previously disadvantaged groups. Demand-based equity is the provision of more resources to groups that demonstrate more interest in them. Market-based equity involves allocating resources based on variables such as willingness and ability to pay for these resources.(27) Empirical studies into inequality often focus on outcomes, processes, or recognition.(28) To determine whether interventions have enhanced justice, outcome-based studies consider the distribution of resources relative to surrounding communities’ socio-economic characteristics, or the differential access to resources that advantage one group over another.(29) Studies investigating processes focus on the participation and decision-making leading to particular decisions or plans, and emphasise the underlying structures driving the inequality.(30) Recognitional equity refers to the equal consideration of people or groups, regardless of characteristics such as race, age, gender, politics, or history.(31)
This paper leverages geographic information system (GIS) techniques – and geographically weighted regression (GWR) in particular – to interrogate park access in Johannesburg through an environmental justice lens, using a compensatory and outcome-based approach to equity. We assess whether the distribution of access to urban green space in Johannesburg redresses structural and historical disadvantages. We use GWR to examine park access in relation to four socio-economic characteristics. This paper focuses only on Municipality-owned parks, excluding other open and green spaces.
The remainder of this paper is structured into four sections. The next section (II) draws on existing literature on environmental justice and park access equity in the Johannesburg context and outlines previous park access studies in the city. Section III specifies the study area, data and methods employed in this study. Section IV discusses the study’s findings. The penultimate section (V) discusses the implications of the study for understanding park access as a component of environmental justice and the potential for the study’s findings to help address inequitable park access in Johannesburg.
II. Background: Park Access Equity and Environmental Justice
a. Environmental justice in South Africa
The distribution of green assets such as parks in South Africa is shaped by the legacies of apartheid and colonialism.(32) Draconian laws were used to segregate different races within South Africa. Various green assets (for example, national parks) were protected and kept in “pristine” condition, and in the process, thousands of black South Africans were forcibly removed from their homes to make tourist spaces.(33) Apartheid also regulated social interaction and the use of public spaces by certain race groups,(34) which manifested in perverse urban forms with relatively low population densities and abundant green space in central areas (where the white population resided) and high population densities with limited green space on the urban periphery (to where the black population was relegated).(35) Given black people’s role in providing labour, they were often located near mines, factories, as well as the associated waste dumps and other environmental hazards.
South Africa’s post-apartheid policies have aimed to enable sustainable development and improve living conditions, particularly for black South Africans.(36) South Africa’s Constitution states that everyone has a “right to an environment that is not harmful to their health or wellbeing” and “to have the environment protected, for the benefit of the present and future generations through reasonable legislative and other measures”.(37) Furthermore, the National Environmental Management Act(38) states that adverse environmental impacts should not be distributed in a way that unfairly discriminates against vulnerable members of society.
Environmental justice scholarship, advocacy and policy in South Africa focus primarily on two key issues. The first is the placement of people at the core of all interactions between environmental, social, political and economic processes, while existing injustices are redressed.(39) The second is the realisation that environmental justice cannot simply result from an equal and fair distribution of related benefits and costs of development, but that injustice can be reproduced or minimised by decision-making.(40) Despite the constitutional and legislative provisions, there is mounting evidence that minority groups continue to be marginalised(41) and that South Africa has not successfully overcome the spatial inequities of the colonial and apartheid eras.(42) The urban development footprint and the distribution of green assets are a case in point.(43) Both public and private green spaces are more abundant, accessible, better maintained, and more vegetated in high-income areas relative to low-income areas,(44) as demonstrated by Venter et al. for Cape Town and Johannesburg, where neighbourhoods are still racially determined. Other studies have found access to parks in Bloemfontein limited for pedestrians because of the surrounding street layout design.(45) Similarly, other South African studies have noted that safety(46) and a lack of essential park facilities(47) can act as further barriers to park access and usage in South Africa.
b. Park access equity in Johannesburg
Post-apartheid urban planning is characterised by ambitions of enhancing equity through the provision of basic infrastructure and services.(48) South African municipal governments faced serious infrastructure deficits in the wake of apartheid. Moreover, Johannesburg is a major economic node that has experienced fast population growth since 1990 due to in-migration in addition to natural population increase, which has placed further pressure on basic service provision. This rapid growth has led to a changing demographic profile and hence to changes in the basic service needs of residents. Spatial form has changed in response to this rapid urban growth, most notably the densification in central parts of the city, but also with some extensive growth on the periphery.(49)
Park location with respect to where people live is influenced by changing urban forms, the neighbourhoods in which population growth occurs, and the ability to protect or invest in park space over other priorities.(50) Park access planning in Johannesburg has been influenced by a range of varying local and international studies and standards. The World Health Organization (WHO), for example, suggests a minimum of 9.5 square metres (m2) of urban green space per person(51) and 400 metres as acceptable walking distance to parks. These standards have been applied in the United States, Canada and Australia.(52) The Economist Intelligence Unit and Siemens(53) established an Africa Green City Index, which stipulates an average of 74 m2 and a minimum of 60 m2 metres of green space per capita in African cities. This standard takes into account all green spaces, including ridges and waterways, hence the higher provisions for green spaces than the WHO stipulation. Locally, the Centre for Scientific and Industrial Research (CSIR)(54) has established the guideline of 0.2 hectares of park space per 1,000 people or 2 m2 per capita and a distance of 1 kilometre or a 20-minute walk to the nearest park. In Johannesburg, a standard of 4 hectares of green space per 1,000 individuals per ward has been established.(55) These standards are based on simple distance and park area calculations.
Schäffler et al.(56) found that while most people in the city are within 750 metres of a park, only a few central wards meet the city’s standard of 4 hectares of parks per 1,000 people.(57) A park accessibility index developed by the City of Johannesburg(58) in 2018 aims to better understand access to parks using the street network, and is modelled in 400-metre hexagons, while a study by Khanyile(59) investigates access using a park space per capita measurement and the small area layer (SAL) as a geographical unit. Both studies reveal a pattern of better access in the central parts of the city, reflecting the city’s investments in regenerating inner-city parks and open spaces.(60) This also highlights the spatial reproduction of past injustices, as these contemporary investments are located in previously advantaged areas. These studies into park access in Johannesburg are summarised in Table 1.
Recent studies assessing park access in Johannesburg
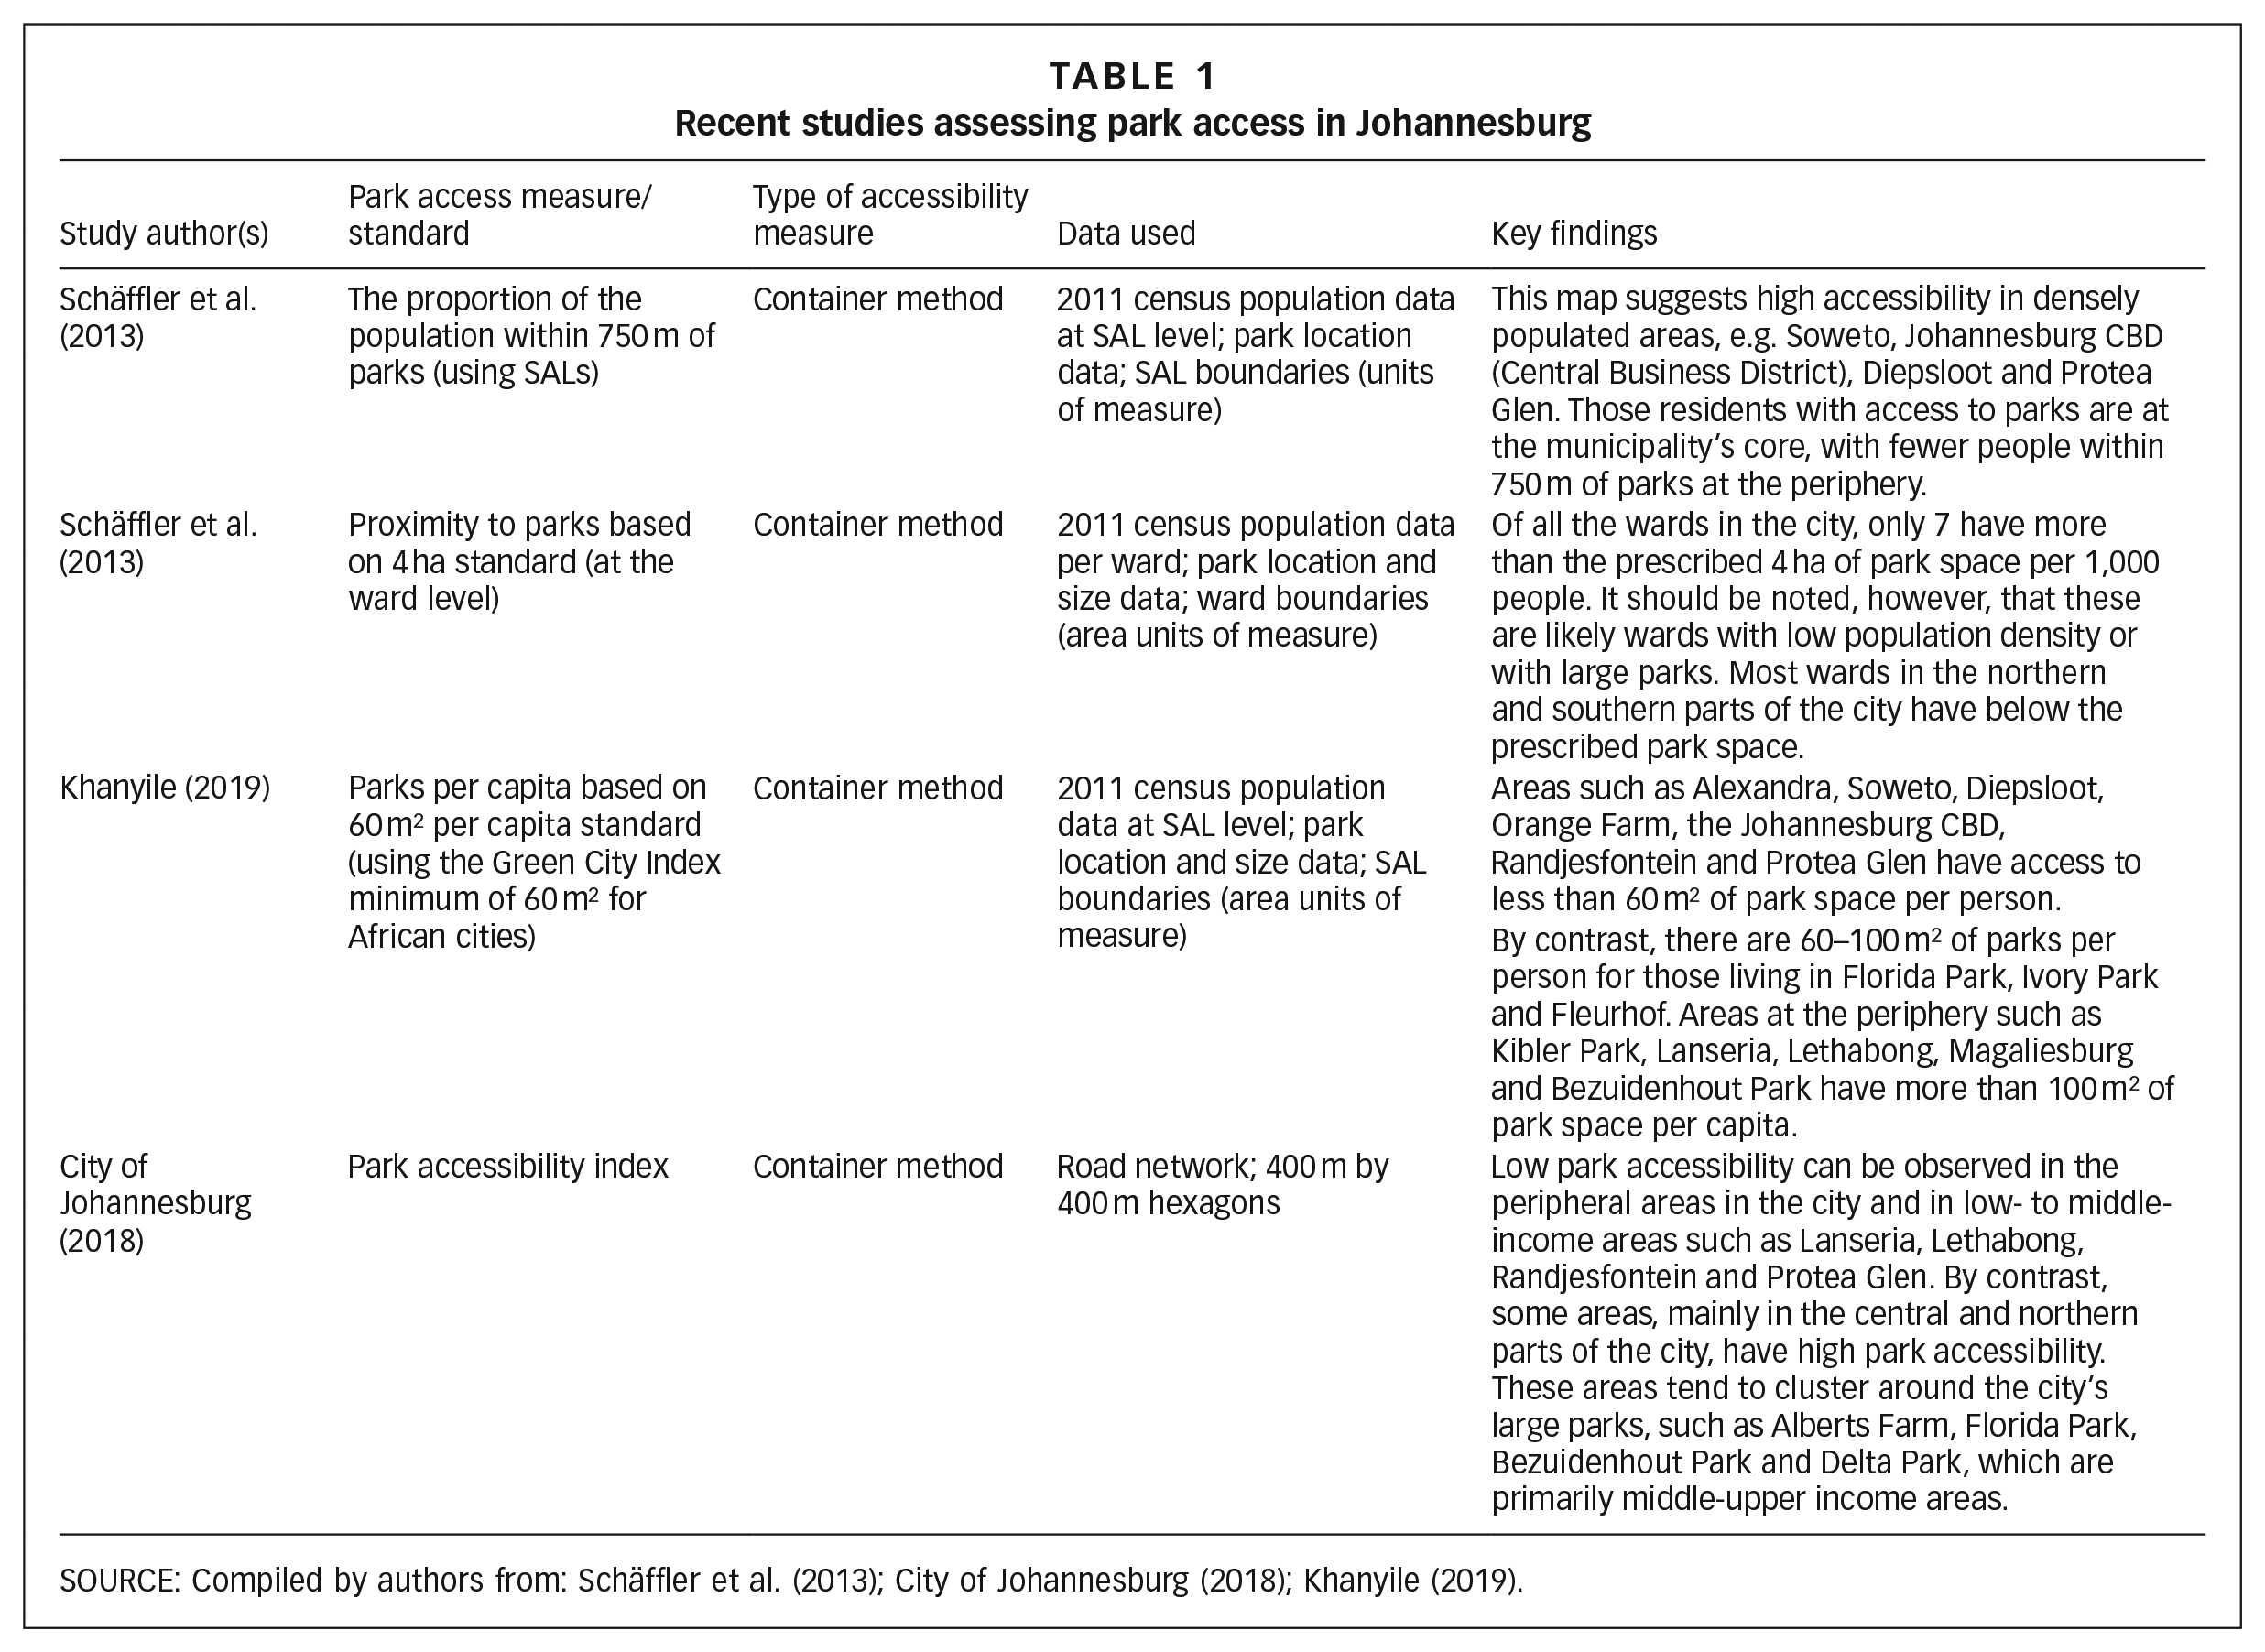
SOURCE: Compiled by authors from: Schäffler et al. (2013); City of Johannesburg (2018); Khanyile (2019).
Although these studies provide useful insights, they do not consider the underlying socio-economic characteristics of residents or the impact of these characteristics on equitable park access. Additionally, the standards guiding these studies have been critiqued for numerous reasons. First is the wide range of standards developed locally and internationally, with limited overlap in either measurement units or calculation methods. Second, the standards differ over spatial scales,(61) which means that a city as a whole may meet a standard, while areas within the city fall well below this standard or far exceed it. Third, some standards prioritise quantitative criteria, focusing only on physical accessibility or amount of green space available to a certain number of residents, while others focus on the quality of the available green space.
III. Study Area, Data and Methods
Johannesburg is situated at the heart of the Gauteng City-Region and is South Africa’s largest and most populous city (5.8 million in 2020). It is also characterised by rapid urbanisation and population growth,(62) with a 26 per cent population increase between 2001 and 2011.(63) In the city’s attempt to meet housing and service delivery needs, development has encroached on existing green spaces and important ecosystems such as wetlands, and has perpetuated urban sprawl, affecting ecosystem services such as water purification and flood control. Furthermore, the failure of service provision – such as wastewater treatment and waste collection – to keep pace with population growth has had environmental consequences. Many of the urban growth-related impacts are experienced unequally across the city, and exacerbate the challenge of redressing apartheid-era spatial planning.
Johannesburg has a network of parks and other green assets, and is well-known for its extensive tree coverage. The Johannesburg City Parks and Zoo (JCPZ), a municipal entity, was established in 2013 and is mandated to manage and maintain the city’s cemeteries, parks, designated public open spaces and trees, and ensure environmental and biodiversity conservation.(64) JCPZ manages 2,428 park or zoo facilities, 2,180 of which are parks (see Map 1). Of these parks, 532 are developed parks, 60 are flagship parks (which require payment for entry) and 1,588 are undeveloped parks.(65) These parks cover a total of 22,278 square kilometres. But although the city has an extensive system of parks and open spaces, these are unevenly distributed across the city, and some highly populated parts of the city have relatively few parks.(66)
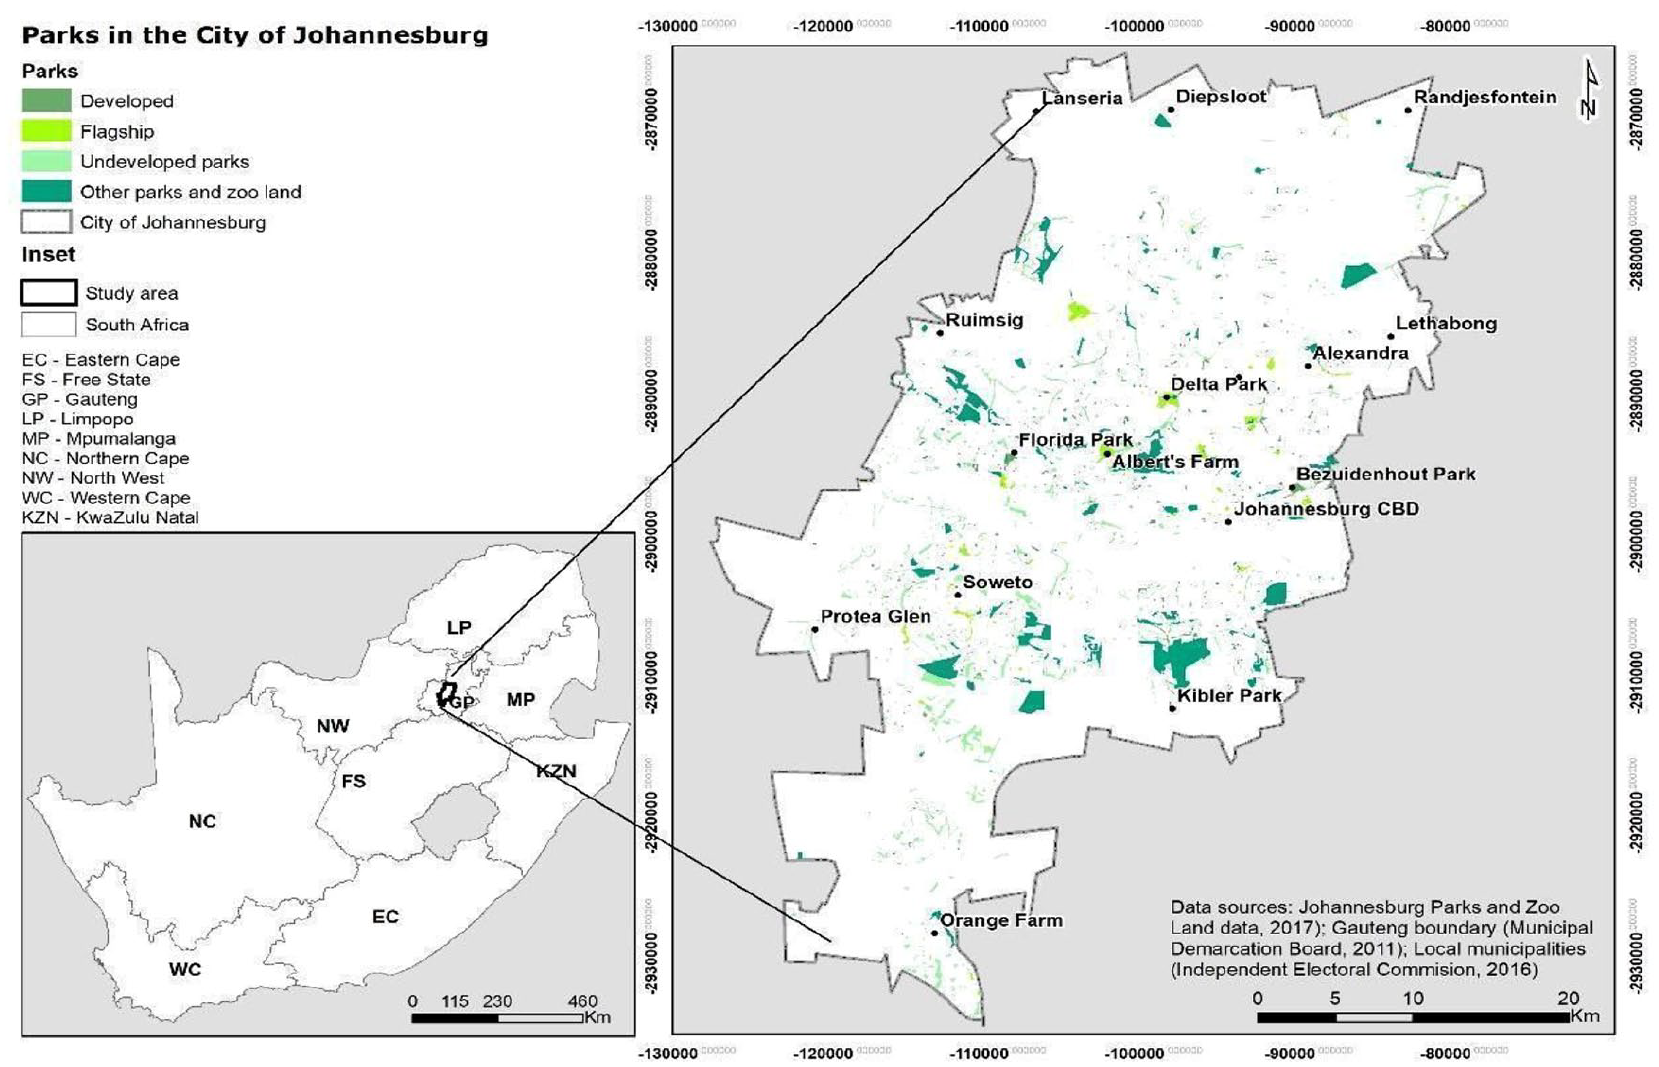
Map showing all parks and zoo land owned or managed by Johannesburg City Parks and Zoo
a. Data and definitions
This paper considers the equity of park access in Johannesburg in two ways:
a) the number of parks within each subplace (the second-lowest level in the place-name category, below the ward level);(67) and
b) the shortest distance from the centre of each subplace to the nearest park.
The first of these uses a container measure, which assumes that residents visit parks in the subplace where they live. The second measure assumes that residents use their nearest park facility. This model uses the centre of the subplace as the starting point for calculating distance to a park. This method provides a consistent approach for each subplace, but because subplaces are each uniquely shaped, the position of the centre point is randomised across subplaces to ensure statistical validity. However, as with any randomised method, there may be occasions where this method reports longer distances to the nearest park than might be the reality for some subplace residents. Studies such as Zhang et al.(68) argue that the expectation that residents will visit the nearest park based on spatial proximity is flawed, and rather multiple distance thresholds should be considered to account for different needs. These measures are refined using a number of socio-economic variables.
Given South Africa’s apartheid legacy, this study uses a compensatory and outcome-based definition of equity, based on the assumption that disadvantaged residents should be compensated with additional resources and that determinations of access should depend on the socio-economics of communities. While physical accessibility to parks is ideal, the share of benefits derived from the park-based ecosystem services is also important, particularly where access limitations prevent entry into parks. While determining the share of benefits is beyond the scope of this paper, the study assumes that the benefits are proportional to physical access even when access is limited. A number of demographic and socio-economic variables were considered for identifying those residents most deserving of access to parks, based on various dimensions of privilege and disadvantage (Table 2). Race is associated with privilege in South Africa, but because race is correlated with income, education and employment, these factors have been used as objective measures in this study. Table 2 presents these variables with their operational definitions within the context of this paper and indicates how increasing values of each independent variable should be interpreted with respect to the need-based definition of equity. Groups considered most deserving of better-than-average access to parks were defined as those residing in areas with a higher population density (which often means limited space for private gardens and therefore increases the need for public green space), those earning lower incomes (using minimum wage as a threshold at 3,200 South African rands per month), those with less education and those groups in subplaces with higher unemployment.
Variables used in this study
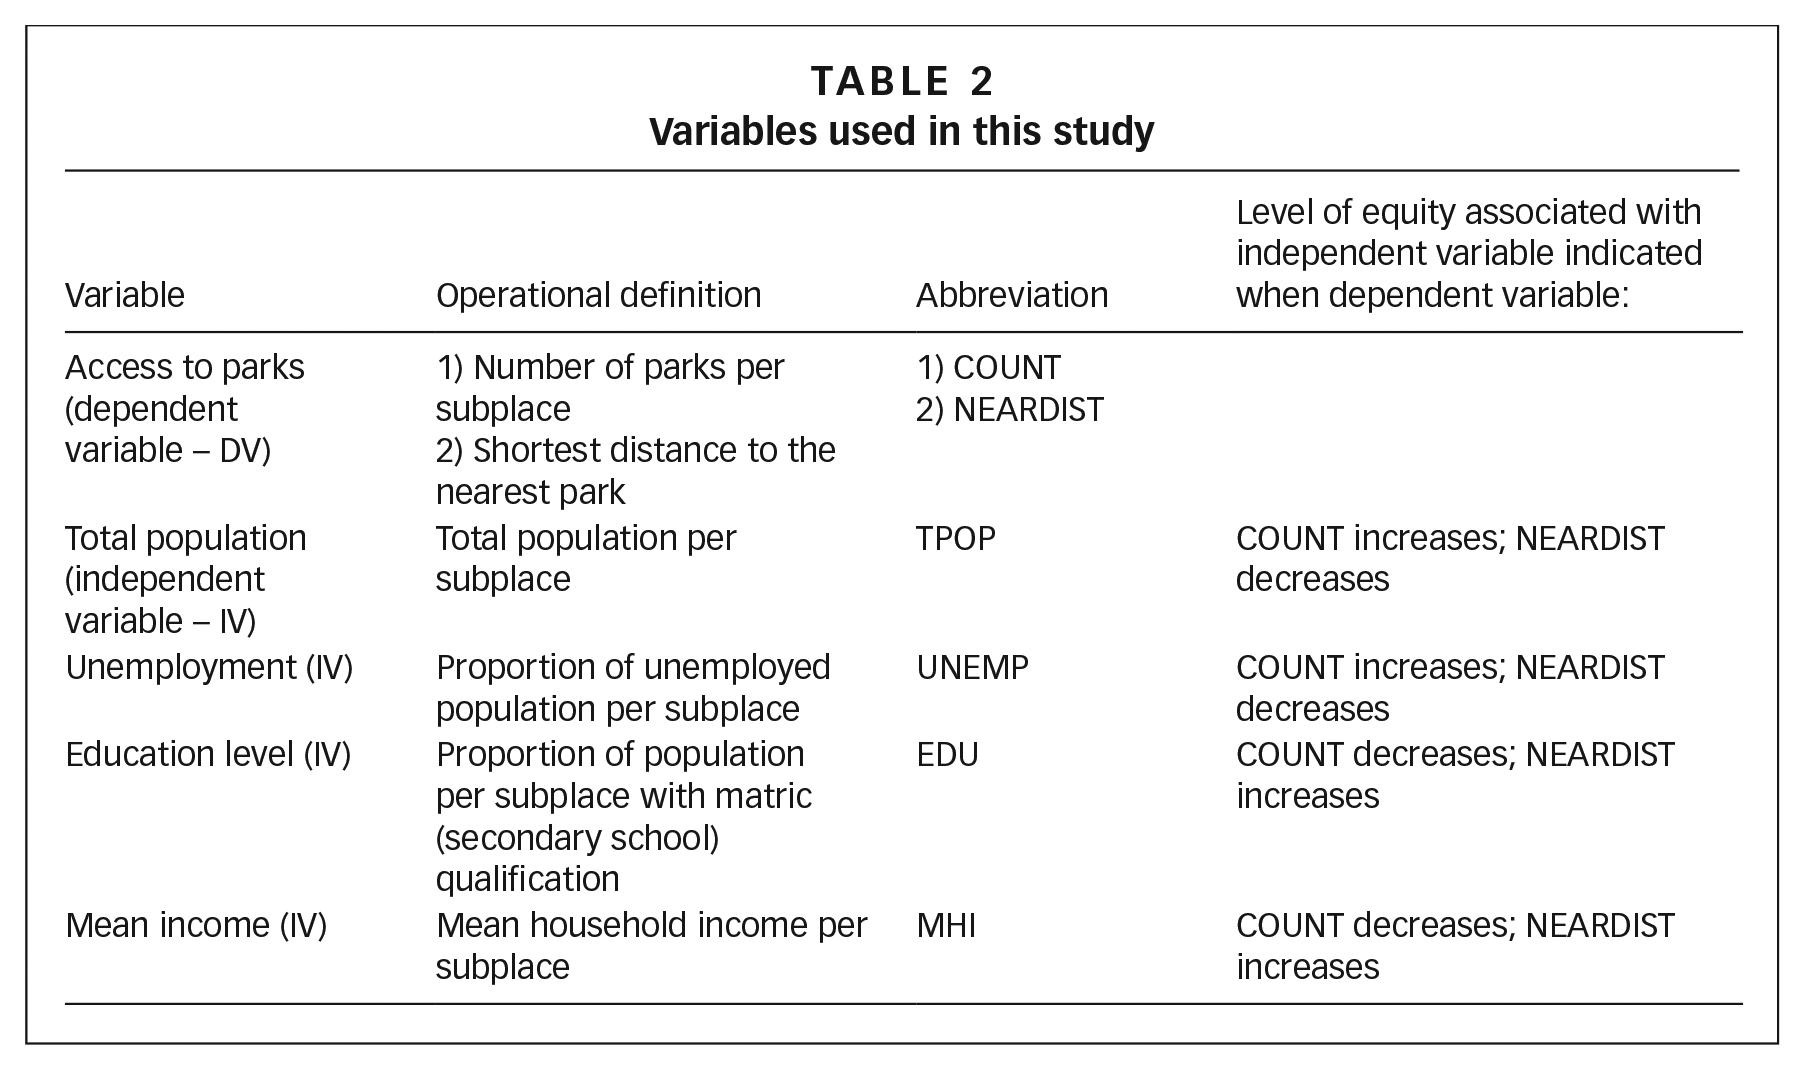
Based on the study’s equity approach, greater equity is assumed when the number (count) of parks increases and the distance to the nearest park decreases with increasing population. In terms of unemployment, greater equity is assumed when the number of parks increases and the distance to the nearest park decreases in subplaces with higher unemployment. For education, greater equity is assumed when the number of parks per subplace decreases and the distance to the nearest park increases in subplaces where a low proportion of the population has a matriculation (or matric) qualification (received on graduating from high school). For mean income, equity is assumed when the number of parks decreases and the distance to the nearest park increases with an increase in mean household income.
To assess these population characteristics spatially per subplace across Johannesburg, we used data from the most recent national census.(69) The parks data are organised into three broad categories: developed parks, undeveloped parks and flagship parks. These are grouped by region and ward, where wards are the smallest administrative area for community-based planning.(70) This study uses subplaces as the geographical unit rather than wards, because wards vary significantly in size and in large wards, uneven population distribution can skew results. The size variations at the subplace level are less exaggerated across Johannesburg. In addition, subplaces were chosen as the geographical unit of study because smaller parks are often developed at the regional and suburb level and are usually more accessible. All spatial data used the Universal Transverse Mercator WGS 1984 35 S projection.
b. Data analysis
Numerous studies, both locally and internationally, use GIS to plan and manage park access. These studies have drawn on various methods to assess park access, including:
a) using service areas derived from a network analysis from the centre of the parks;(71)
b) using buffers of different distances around census areas of varying socio-economic status to determine how many are within or outside park reach;(72)
c) using local spatial autocorrelation statistics to check for similarity clusters of park access;(73) and
d) assessing the relationship between the spatial distribution of the population and park service areas.
In South Africa, a few studies have used GIS to assess park accessibility, using per capita measures(74) and regression analyses,(75) and techniques such as buffers, which work by defining a fixed distance around the edges of parks and using it to identify the proportion of individuals falling within the defined area.
To measure equity in access to amenities, studies have applied multivariate linear regressions using ordinary least squares (OLS). OLS regressions use a predictive model to capture the strength and significance of the relationship between a dependent variable and independent variables in a study.(76) The model tests how well real-world data fit against an idealised, linear relationship between the variables. Two separate OLS regressions were performed in this study to examine the effects of residents’ socio-economic status on:
a) the number of parks accessible within each subplace (container approach, Model 1); and
b) the minimum distance to the nearest park from the centre of each subplace (minimum distance approach, Model 2).
Although such studies are useful in understanding the relationship between socio-economic characteristics and park access, multivariate techniques can be skewed by biases due to spatial effects such as spatial dependence(77) and spatial heterogeneity.(78) This study, therefore, uses a geographically weighted regression (GWR) to get a sense of the spatial equity of park access in relation to socio-economic conditions. Compared to traditional OLS models, which are useful for understanding the relationships among the variables at the global scale,(79) GWR offers two essential benefits: first, it provides smaller and less spatially dependent error terms (residuals) than those from corresponding OLS models; and second, it enables the investigation and capture of spatial variations of variables used in the regression model.(80) Mapping regression diagnostics such as standardised residuals, local r-square (R2) and model variables can play an essential role in exploring how statistical relationships and significance vary over space.
Studies have demonstrated the value of utilising both OLS and GWR to examine the statistical relationship between access to parks, and socio-economic and demographic characteristics.(81) These studies indicate that the OLS model found a weak relationship with lower R2 and higher Akaike Information Criterion (AIC),(82) whereas GWR suggested spatial non-stationarity, indicating disparities in accessibility that vary over space with higher R2 and lower AIC. This paper accordingly uses both OLS and GWR to interrogate park access equity in Johannesburg.
The data analysis in this study was conducted using ArcGIS (Version 10.6) with the Spatial Analyst, Spatial Statistics and Network Analyst extensions. The Near tool, an ArcGIS Network Analyst extension, was employed to calculate the two dependent variables for each subplace in Johannesburg. The Feature to Point tool, in the Conversion extensions, was used to generate centres of each subplace. The Near tool was used to calculate the distance to the nearest park. A spatial join was performed to join the subplaces to the point data with the nearest distance, and the Join tool was also used to count the number of parks per subplace. Next, a multivariate regression analysis using the OLS tool was conducted to investigate the relationship between park access and residents’ socio-economic status, using the variables in Table 2 as input parameters. The GWR tool was then used to explore spatial variations using the same dependent and independent variables used in the OLS model. A Gaussian kernel function with a fixed distance weighting(83) and the AICc (that find an optimal distance or number of neighbours) were applied due to the varying size and shape of subplaces as well as varying density of parks in Johannesburg. The local coefficients of the GWR results were mapped to visually represent the spatially varying relationships among socio-economic variables in Johannesburg.
Three statistical measures were compared to assess whether the OLS or GWR provided a better fit or explanation of the relationship between independent and dependent variables: R2, Akaike Information Criterion – corrected (AICc)(84) and Moran’s I. R2 values indicate how much of the variation in the data is explained by the independent variables, compared to unknown parameters. R2 values range from 0 to 1 and are expressed as percentages. The AICc is helpful for comparing the quality of different statistical models, rather than assessing the absolute quality of a model. Moran’s I assesses spatial autocorrelation, that is, the tendency for co-located or similar sites to have similar characteristics.
IV. Findings
a. Results of OLS models
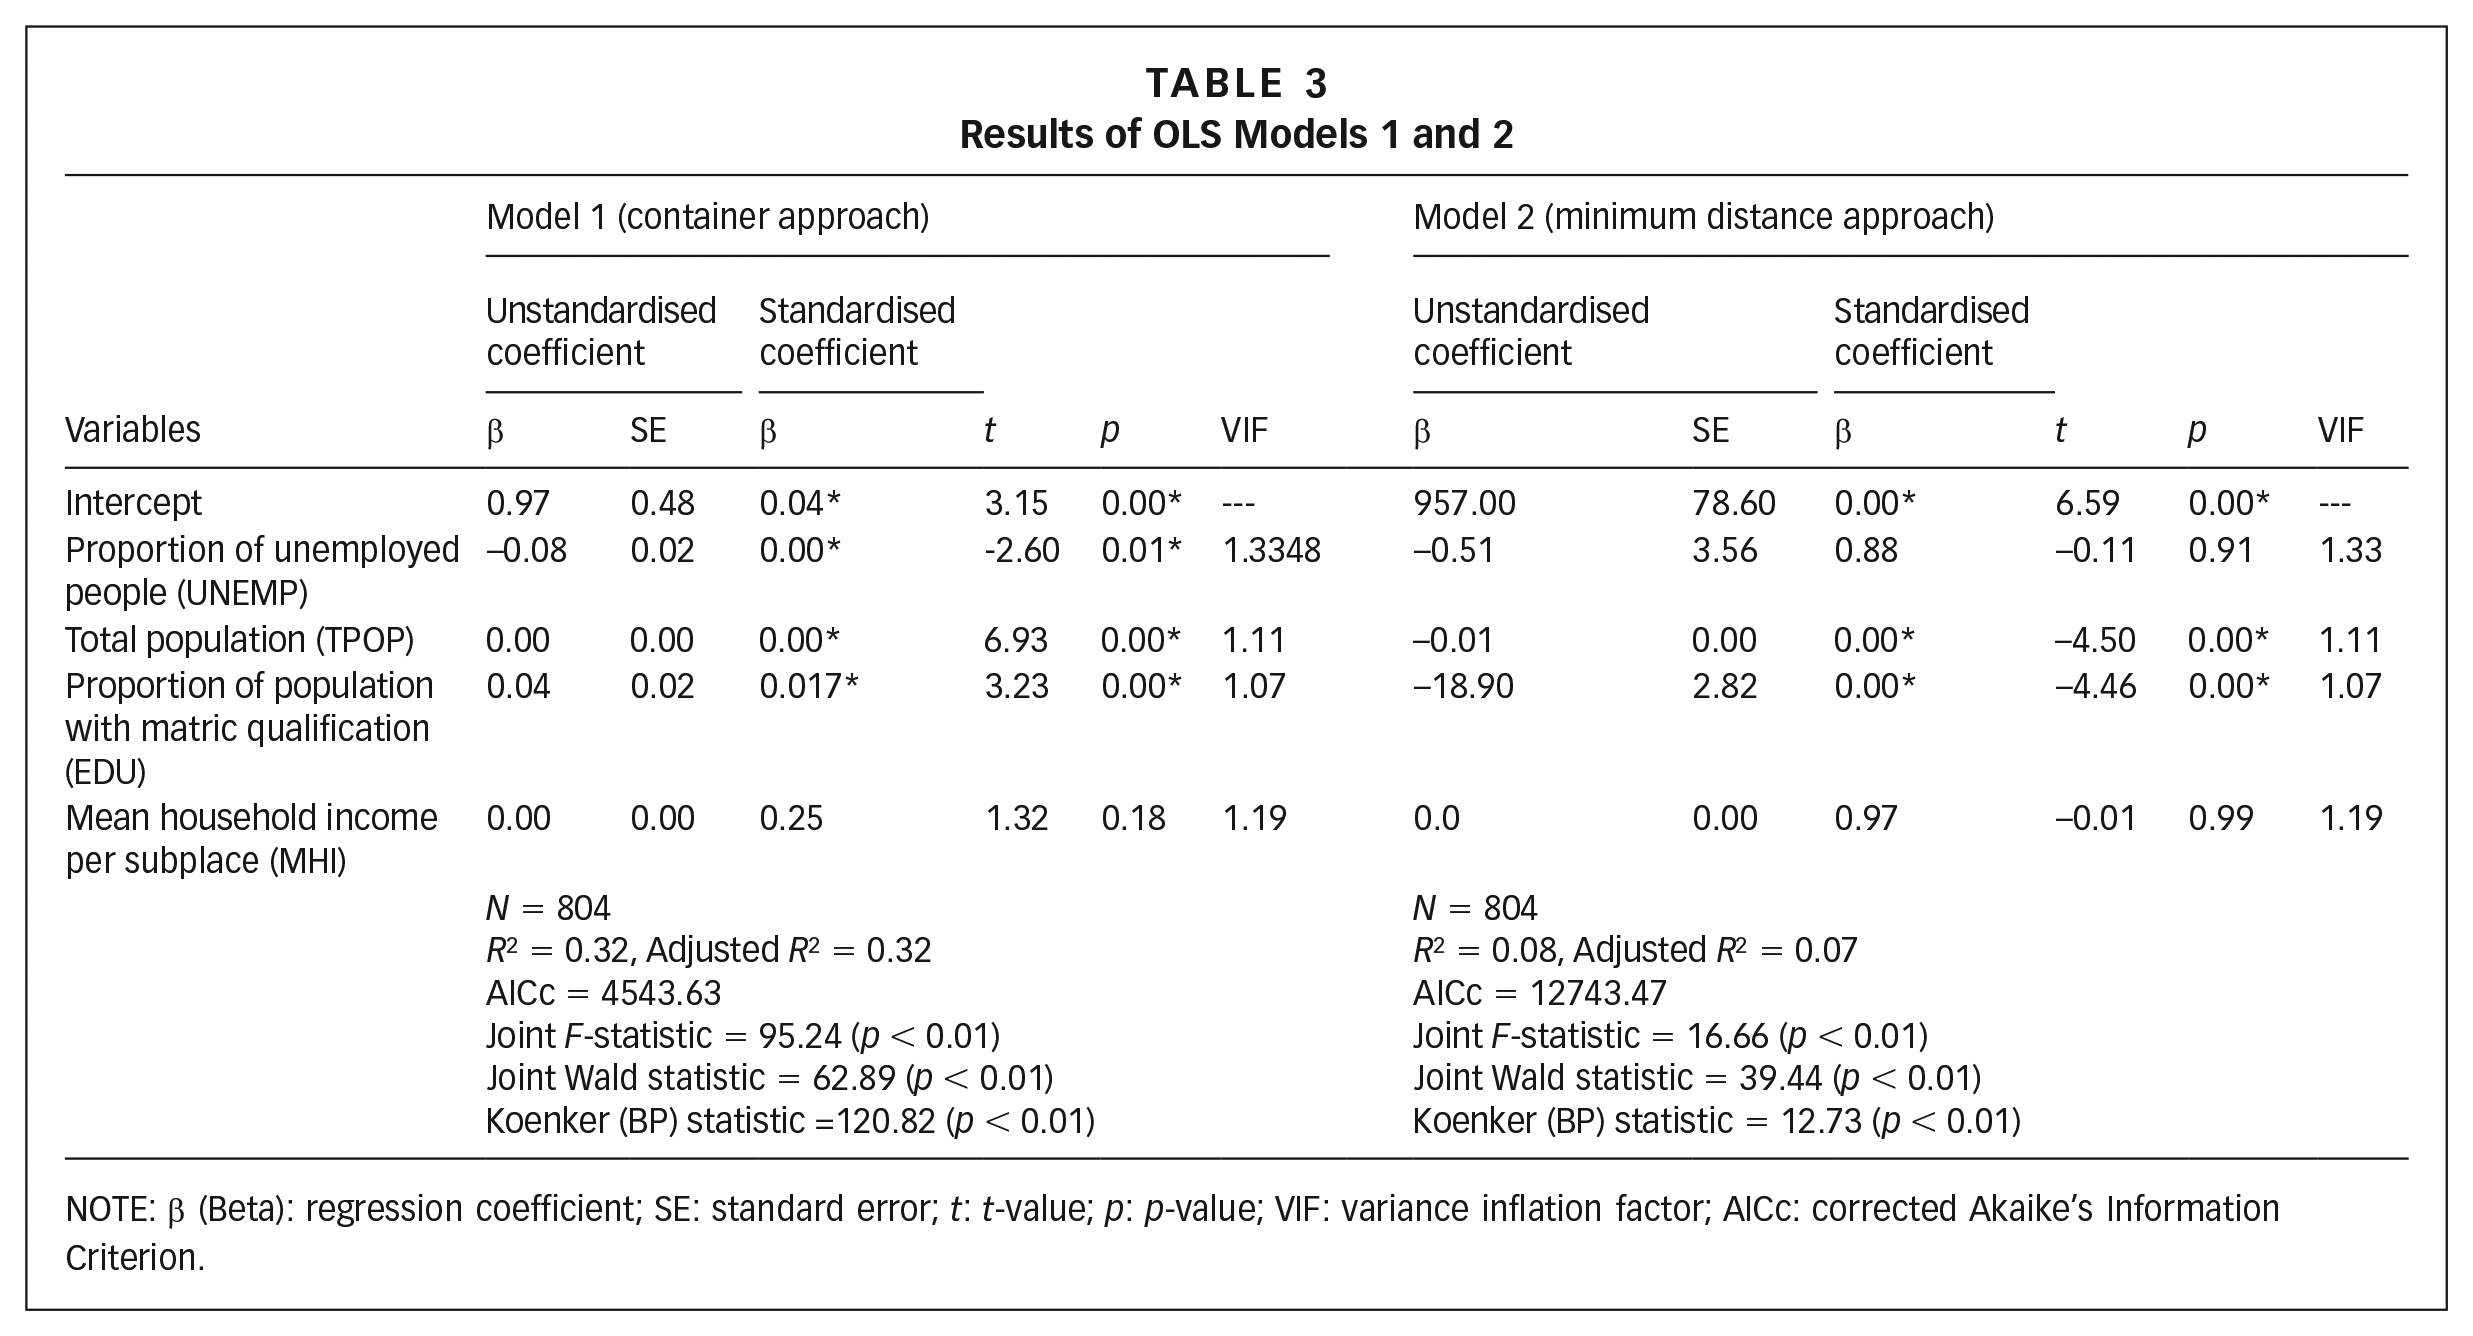
Results of the two OLS models are presented in Table 3. For both Models 1 and 2, the variance inflation factors (VIF) were below 7.5, indicating no redundancy among the independent variables.
Results of OLS Models 1 and 2
NOTE: β (Beta): regression coefficient; SE: standard error; t: t-value; p: p-value; VIF: variance inflation factor; AICc: corrected Akaike’s Information Criterion.
The OLS results for Model 1 show an adjusted R2 of 0.31, indicating that the independent variables explain approximately 31 per cent of the variance in park access equity based on the number of parks per subplace. The AICc result of 4,543.68 implies moderate goodness-of-fit. Three variables have a statistically significant relationship with the number of parks at the 0.01 level or less: total population, proportion of unemployed people and education level. The positive coefficient of the total population indicates that population increases as the number of parks in the subplace increases. This suggests a correlation between high population densities and the number of parks, which means higher proportions of the population have access to parks and therefore there is equitable park access within these subplaces. The results also show a positive correlation between a greater number of parks and education, suggesting that subplaces with a higher proportion of those with a matric education or higher are more likely to have access to parks. There is a negative coefficient in the unemployment variable, indicating that subplaces with a higher proportion of unemployed people have lower access to parks. This finding suggests inequitable park access based on socio-economic characteristics.
The OLS results of Model 2 show an adjusted R2 of 0.07, indicating that the independent variables only explain seven per cent of the variance in park access equity based on the minimum distance to the nearest park. Coupled with the AICc of 12,743.48, this implies that Model 2 has a poor goodness-of-fit compared to Model 1. This suggests that other independent variables, not identified in this study, play a greater role in explaining inequalities in distance to the nearest park. However, two of the four variables (population and education) were statistically significant at the 0.01 level. The results suggest that park access improves as population density increases (indicating a positive equity outcome), while the distance to parks increases as education levels drop (indicating a negative equity outcome). Only these two variables are considered in the discussion of the GWR results and mapped.
b. Results of GWR models
In the GWR models, the adjusted local R2 values varied over the study region from 0.04 to 0.78 (mean = 0.35) for Model 1, showing relatively lower R2 values in the northwestern edges of Johannesburg (near Diepsloot) and higher R2 values in the western parts of the city. The adjusted R2 values ranged between 0.02 to 0.89 (mean = 0.12) for Model 2, showing relatively lower R2 values in the north and higher R2 values south of Johannesburg Central Business District (CBD). In other words, the independent variables provide a better explanation for number of parks (Model 1) than distance to the nearest park (Model 2) in the GWR model, as with the OLS regression. The standard residuals for the GWR model show differences between predicted and observed values, and vary over the study region ranging from −6.16 to 6.97 (mean = 0.02) for Model 1 and −5.38 to 15.62 (mean = 0.07) for Model 2. All condition numbers(85) for Models 1 and 2 were below 30 (max = 21.85), indicating no major issues related to local collinearity among the independent variables.
Table 4 compares the results of the OLS and GWR models. Model 1’s adjusted R2 value increased from 0.32 for the OLS to 0.53 with the GWR, and the AICc decreased from 4,543.62 for the OLS to 4,289.47 with the GWR. For Model 2, the adjusted R2 value increased from 0.07 for the OLS to 0.61 for the GWR, and the AICc decreased from 12,743.47 to 12,091.14 for the OLS and GWR respectively. These results suggest that the OLS model has low explanatory power, potentially due to being inadequately specified or missing key determinants of park access. Local variations in the relationship between access levels and residents’ socio-economic status could also have reduced the explanatory power of the global model.(86) Additionally, Moran’s I of standardised residuals was better for both models with the GWR compared to the OLS. Model 1 showed an improvement from 0.09 in the OLS model (z-score: 10.98, p = 0.56) to 0.00 in the GWR model (z-score: 0.58, p = 0.56), while Model 2 showed an improvement from 0.09 in the OLS model (z-score: 11.66, p = 0.00) to 0.06 in the GWR model (z-score: 6.91, p = 0.00). Both models had positive Moran’s I, indicating spatial autocorrelation; however, the GWR model improved the model performance by reducing the spatial dependence in the residuals. These findings indicate that GWR models provide a significantly better goodness-of-fit than OLS models when assessing the spatial distribution of access to public parks in Johannesburg.
Comparison of results between OLS and GWR (Models 1 and 2).
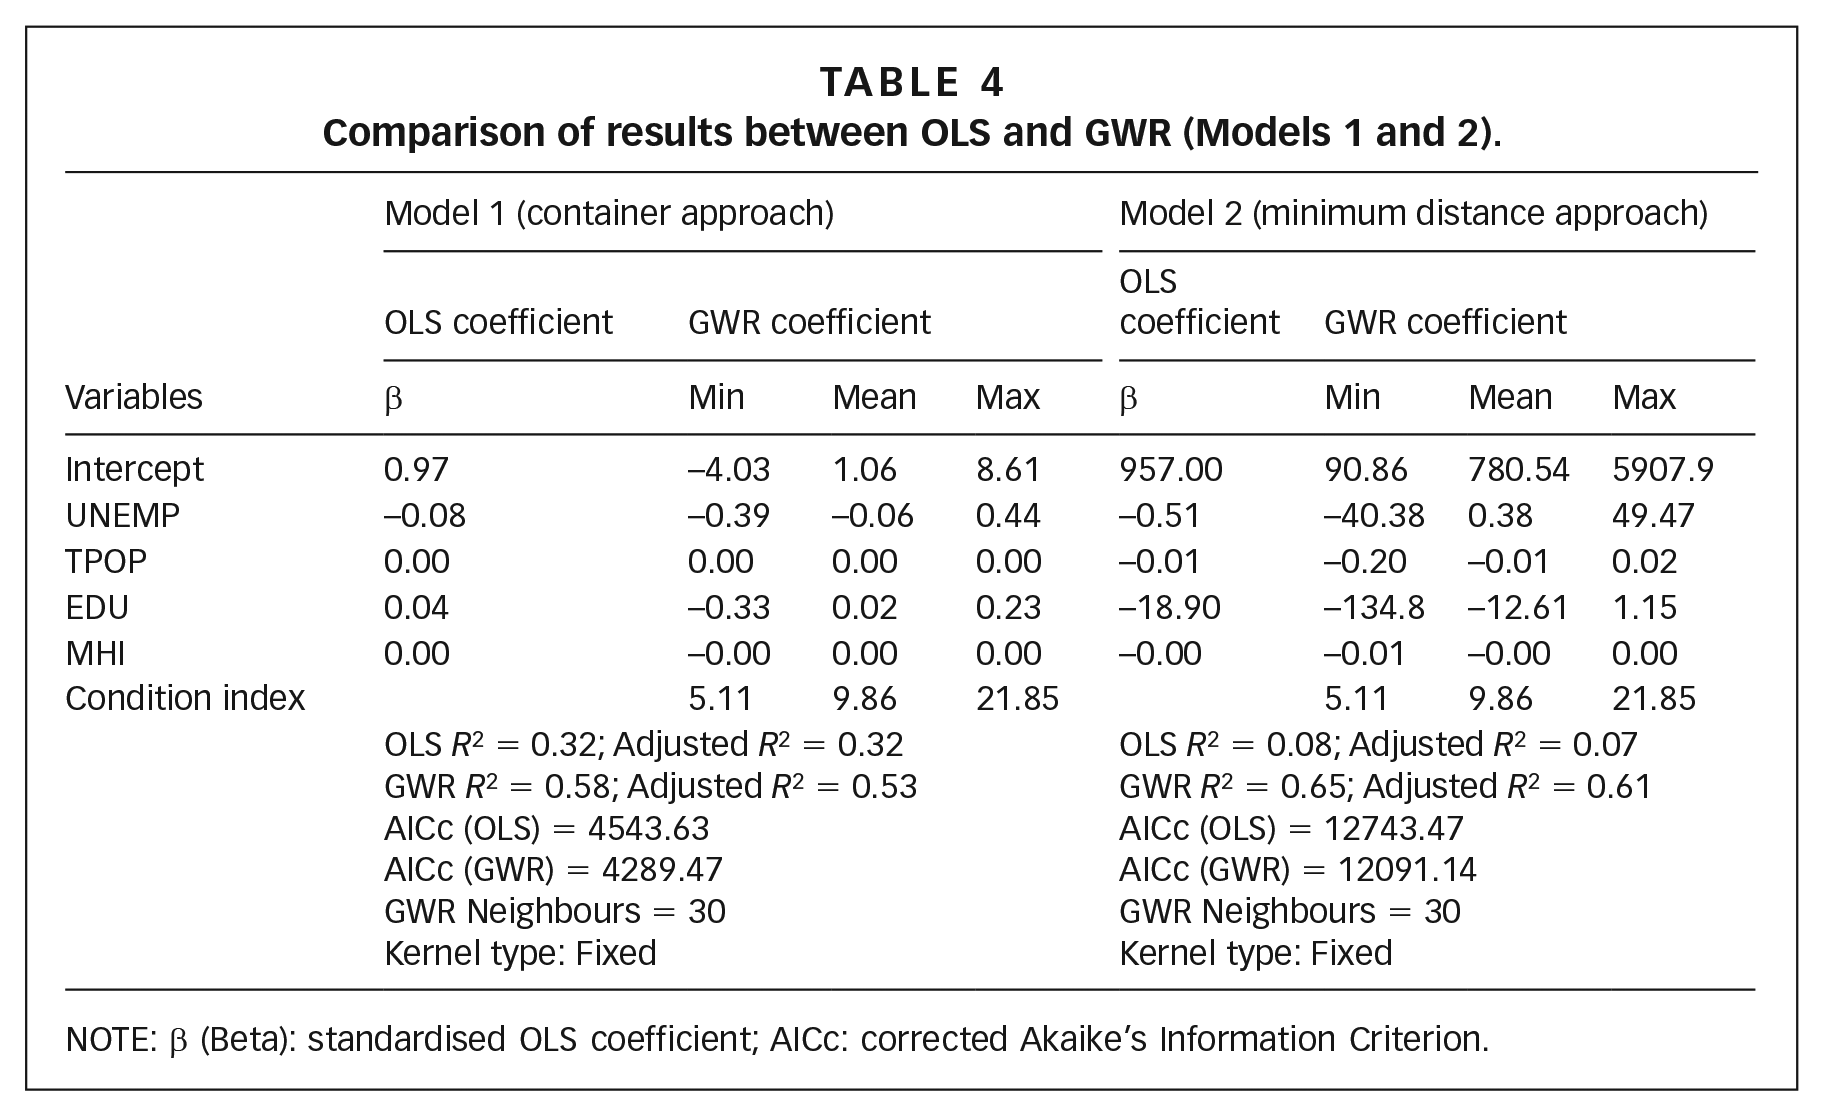
NOTE: β (Beta): standardised OLS coefficient; AICc: corrected Akaike’s Information Criterion.
Although Table 4 suggests spatial variations in the local coefficients and goodness-of-fit in the two GWR models, it does not show how the relationship between access to parks and residents’ socio-economic status varies across the study area. Maps 2 and 3 show the spatial distribution of local coefficients and local R2 values for those independent variables that were statistically significant in the two OLS models. Light colours indicate strong negative correlation and inequitable access, while darker colours indicate strong positive correlation and equitable access. In each model, both positive and negative correlations occur across Johannesburg, indicating that park access equity varies across the city.
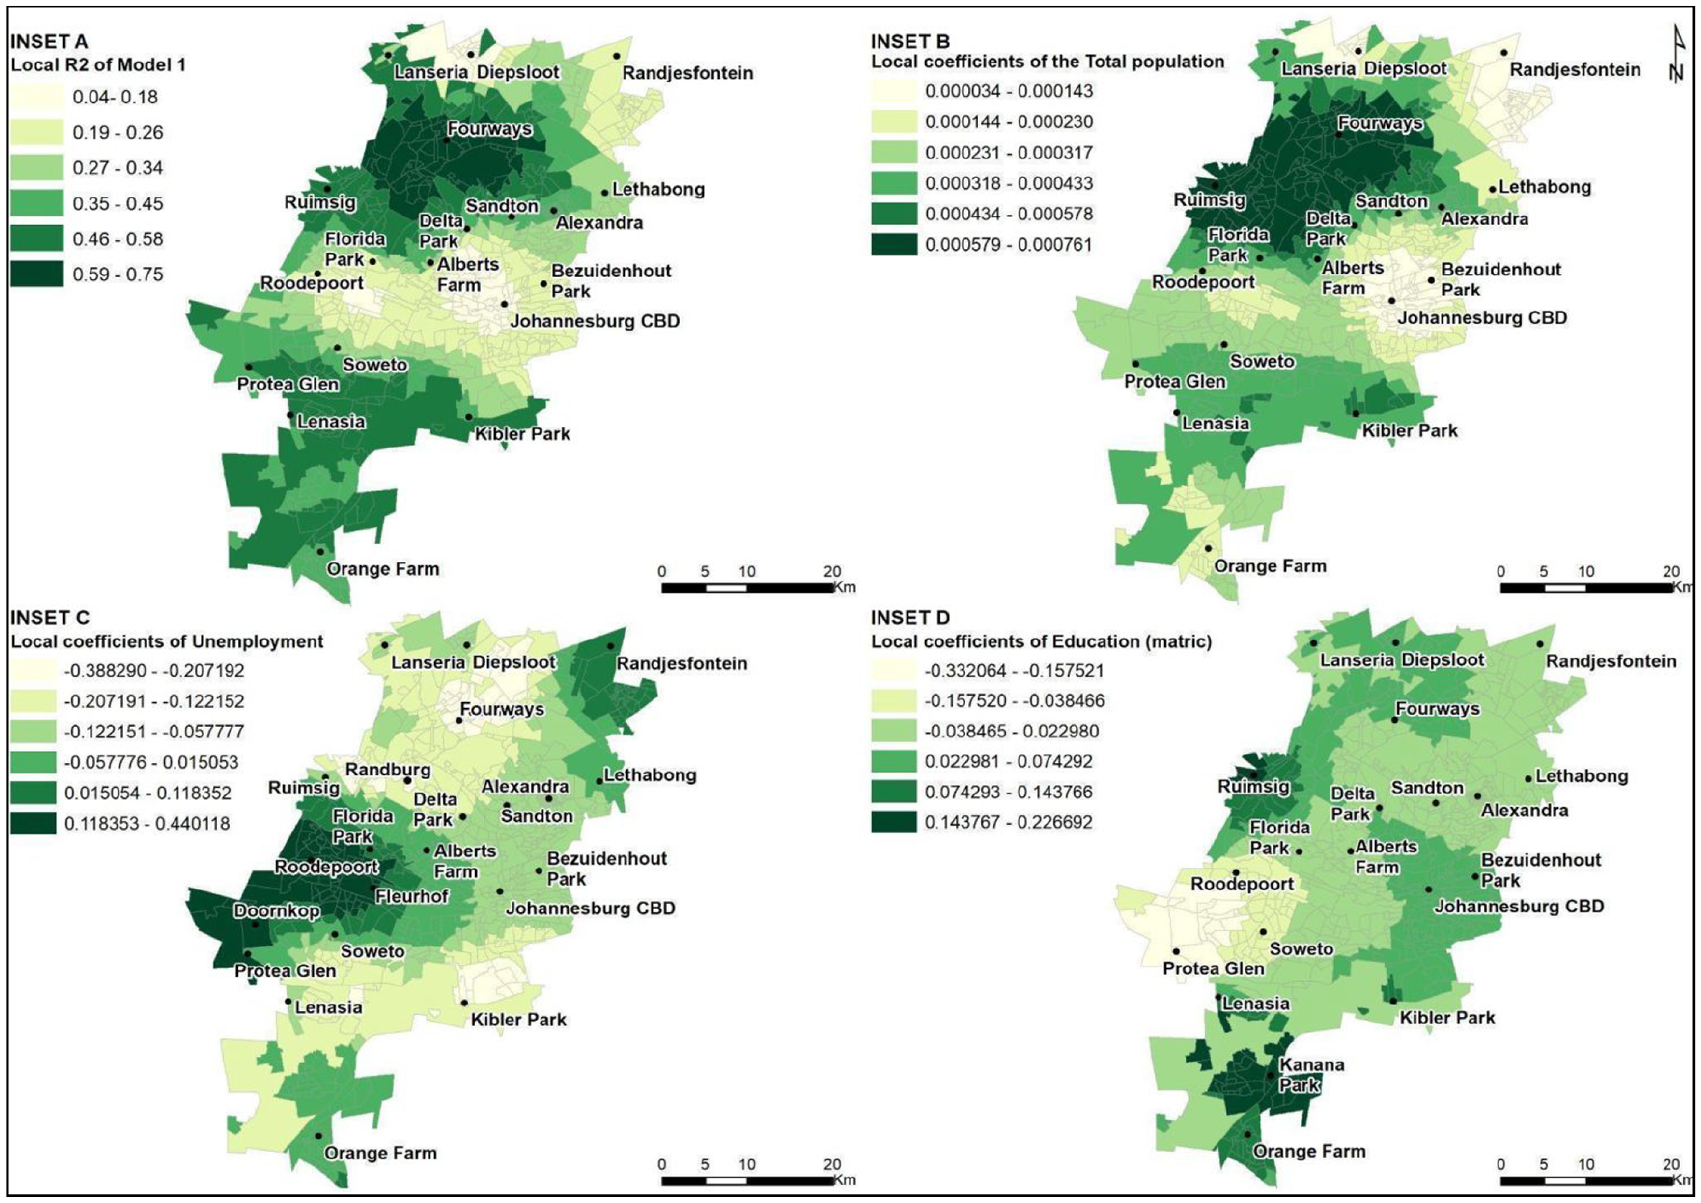
Spatial distribution of Model 1’s statistically significant independent variables
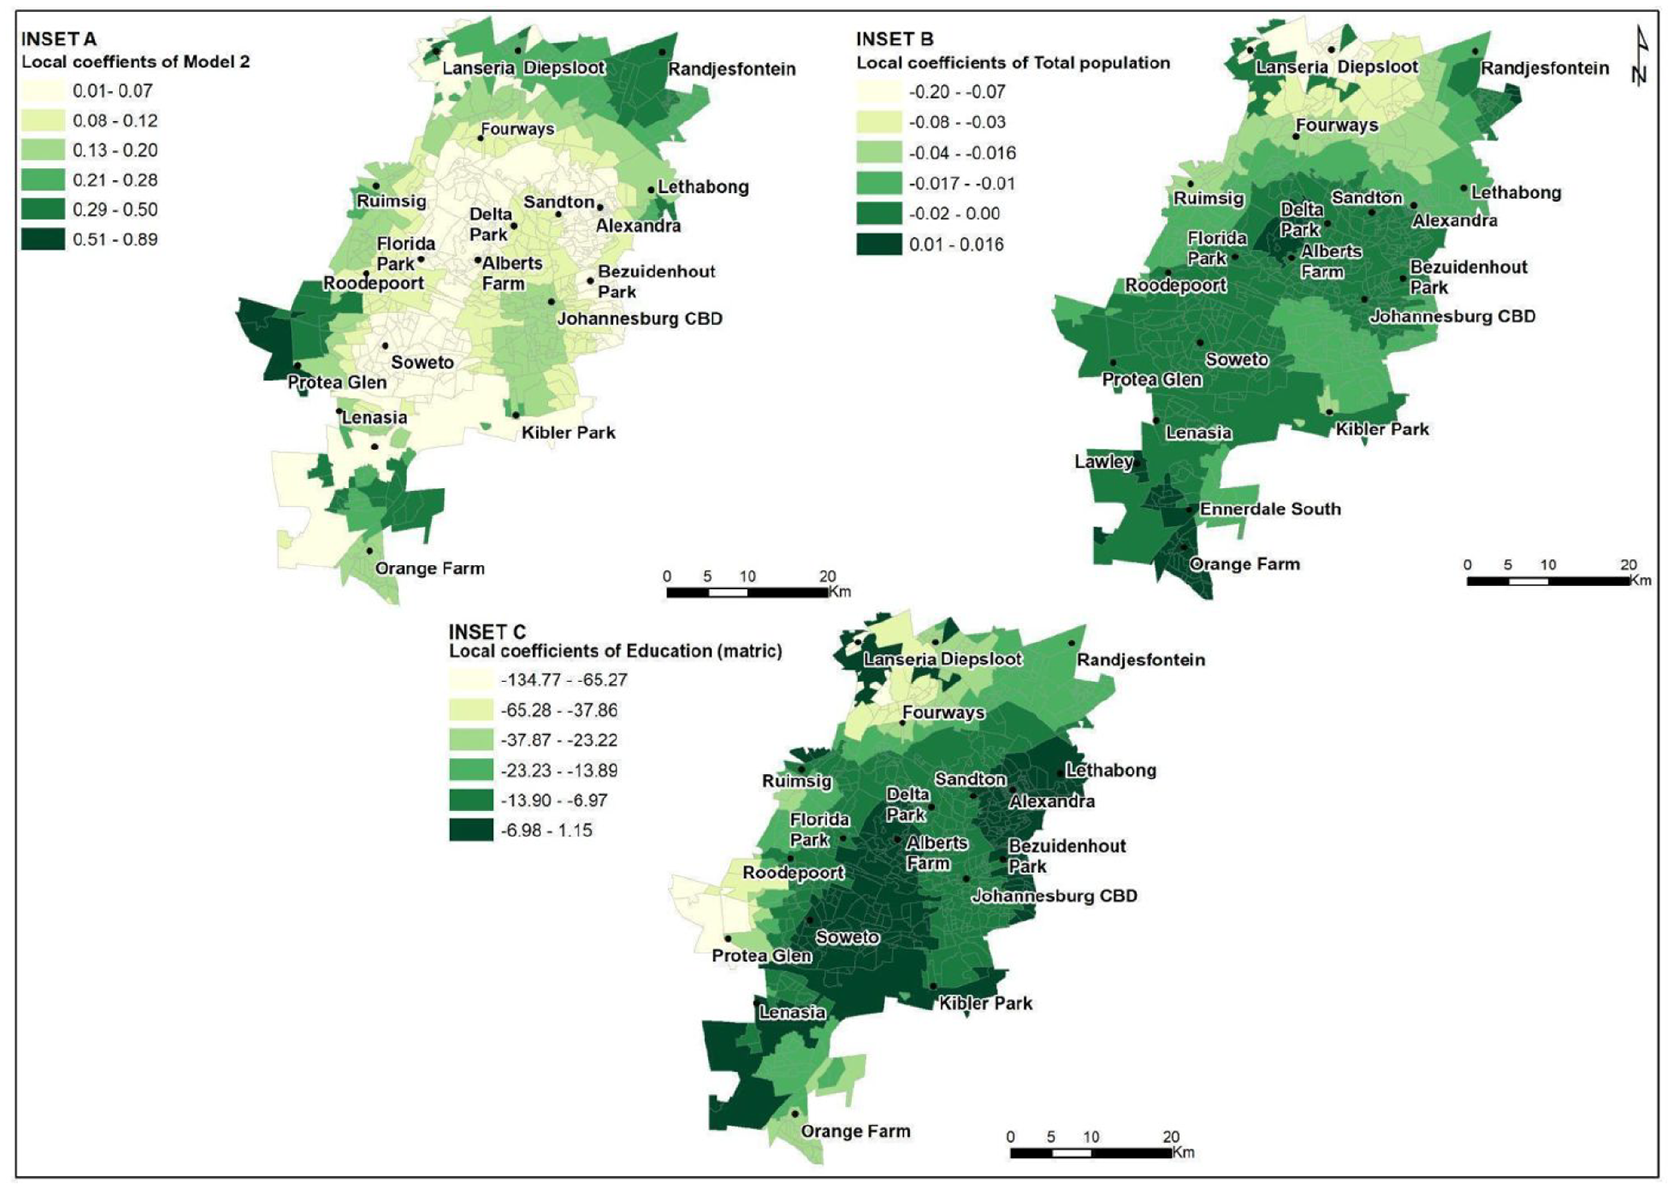
Spatial distribution of Model 2’s statistically significant independent variables
Model 1 assessed park access based on the number of parks within a subplace. The adjusted R2 for Model 1 is 0.53, while the local R2 values vary over the study area (0.04–0.75, mean = 0.35), suggesting that the model explains more of the variance in some pockets of the city than others.
Inset A in Map 2 shows the spatial distribution of the local R2 of Model 1. Model 1 had the best explanatory power across Johannesburg, over 70 per cent.(87) However, in Ruimsig and Sandton the model showed low explanatory power, and as low as eight per cent in Lanseria, indicating the level of access to parks in these parts of Johannesburg is not explained adequately by this set of explanatory variables.
Inset B in Map 2 shows that the total population has a coefficient of 0.00 indicating equitable access in some subplaces. Areas such as Kibler Park, Delta Park and Ruimsig, which all have large parks, show equitable park access, while inequitable access emerges in the Johannesburg CBD, Diepsloot and Randjesfontein where higher population concentrations intersect with fewer parks.
The unemployment independent variable has a positive coefficient of 0.07 (Inset C), indicating equitable access to parks with respect to some subplaces with high park numbers and high unemployment such as Randjesfontein, Doornkop, Fleurhof, Orange Farm, Soweto, Roodepoort, Ruimsig and Florida Park west of Protea Glen. In contrast, a negative coefficient for unemployment is visible around Kibler Park and Delta Park, Sandton, Randburg and Fourways, with lower unemployment and a higher number of parks – indicating inequitable park access. Similarly, inequitable access is also visible in areas characterised by high proportions of unemployment and a lower number of parks, such as Alexandra.
Inset D in Map 2 shows a positive local coefficient for education (0.04), where an increase in the proportion with higher educational levels is paired with an increasing number of parks, and therefore inequitable access to parks. Equitable access is prevalent in Kibler Park, Ruimsig, Lenasia, Kanana Park, Fourways, Johannesburg CBD and Orange Farm, while inequitable access is visible in Soweto, Roodepoort and Protea Glen areas, where access to parks is correlated to education levels.
Model 2 assessed park access based on the shortest distance from the centre of each subplace to the nearest park. For Model 2, the adjusted R2 is 0.61, while the local R2 ranges from 0.02 to 0.89 (mean = 0.12), suggesting that the model explains more of the variance in some pockets of the city than others.
Inset A in Map 3 shows the spatial distribution of the local R2 for Model 2. Model 2 had the best explanatory power, in excess of 80 per cent, in the area west of Protea Glen and low explanatory power (four per cent) in parts of Lanseria and Johannesburg CBD.
Inset B in Map 3 shows a positive coefficient for total population (0.01), indicating inequitable access to parks in some subplaces. Equitable access is visible in Florida Park, Delta Park, Orange Farm, Protea Glen and Soweto – which translates to higher proportions of the population with a shorter distance to the nearest park. In contrast, inequitable access is revealed in Lanseria and the surrounding areas, suggesting that large numbers of people live far from the closest park.
Inset C in Map 3 shows a positive coefficient for education (0.04) across the city, indicating overall inequitable access to parks, where low education levels correlate with longer distances to parks. Equitable access is prevalent in Kibler Park, Ruimsig, Johannesburg CBD and Orange Farm. Inequitable access is visible in Protea Glen where higher education correlates with shorter distances to the nearest park. Conversely, areas west of Protea Glen and in the north around Diepsloot not only have lower education levels but also longer distances to the nearest park.
V. Discussion and Implications
Poor park access is an environmental justice issue for cities, where limited access deepens existing disadvantages faced by poor and marginalised groups.(88) Given South Africa’s context, the population distribution, mean household income, employment and education levels are important for identifying areas of socio-economic disadvantage that may need better access to local parks. This study has assumed that a high count of parks or shorter distances to parks in areas with higher populations, high unemployment, low education and low income implies more equitable access to parks. Proximity and access for socio-economically disadvantaged groups mean proportionally better access to the benefits and ecosystem services derived from parks, which can help alleviate some of the negative implications of urban development by improving urban environments and quality of life, particularly in underserved areas.(89)
The results reveal a complex relationship between different interpretations of park access and various socio-economic considerations. The statistical analysis reveals the significance of different variables on park access equity in Johannesburg, as measured by the number of parks and distance to parks. Overall, OLS R2 values present relatively low explanatory power compared to the GWR. The GWR models suggested spatially varying relationships between the level of access to parks and socio-economic characteristics, highlighting the intricate patterns of access and equity that cannot be identified using global OLS techniques or traditional access measures, as used in previous park access studies in Johannesburg. These findings are consistent with other equity studies of urban parks, underscoring the importance of spatially sensitive statistical analyses.(90)
Total population, education levels and unemployment are all useful indicators of equity in park access in some of the city’s northern areas (for example, around Ruimsig, Alexandra and Sandton), where high population, high education and low unemployment correlate with good access to parks. These findings imply equitable park access in terms of population density, but inequitable access in terms of unemployment and education: the more advantaged groups in areas such as Sandton have a disproportionately high number of parks relative to other areas. By contrast, areas such as Ruimsig and Randjesfontein with higher unemployment either have fewer parks or are mostly undeveloped parks or flagship parks. The area around Protea Glen reveals inequitable access for both the number of parks and distance to parks based on education. In the southern parts of the city around Orange Farm, the inverse pattern is evident: a low number of parks with high population density, but equitable access in relation to unemployment and education. Interestingly, the results for the south of the city differ between Model 1 and Model 2 – although there are not many parks available for the area’s large population (inequitable access), these areas have good access based on distance (equitable access). The study does not consider the quality of the parks or whether people choose to frequent better-quality parks even though they are not located within the area in which they live.
The study confirms that the equity of park access, and the many influencing factors, are not constant across space. Traditional methods of assessing equitable access and distribution of parks tend to focus on “who gets what”(91) while paying little attention to how spatial and socio-economic factors can interact to compound inequality. Consequently, identifying pockets of disadvantage and deciding how to counter them with improved park access is complex. By using a GWR, this study has identified neighbourhoods with inequitable access to parks, based on particular socio-economic characteristics. It demonstrates that GWR models have the potential to be used in distribution and compensatory equity planning and could be useful for identifying where park investment could help counter existing inequality, particularly in contexts with extreme spatial inequality, such as South Africa, Brazil, or Russia.
The findings from this study show that park access equity manifests differently within a city depending on socio-economic characteristics, and provides a more nuanced understanding of park access equity than previous studies, which took a comparatively simple approach to more equitable distribution of park access in Johannesburg.(92) This study improves on previous studies because it combines important socio-economic factors with park access measures, indicating more precisely where additional green space is needed. However, the selected variables cannot account completely for park access inequality in Johannesburg. Future studies would benefit from considering additional factors such as private versus public ownership, park development status, park quality, and other variables such as transport and historical elements that might influence access to parks.
VI. Conclusion
Parks and other green spaces are vital in providing essential ecosystem services to communities and in making healthier urban environments. Access to parks is recognised globally as necessary in urban contexts, particularly in built-up areas with high population densities where residents do not have private gardens.
Johannesburg not only confronts the need to manage rapid population growth, it also faces the challenge of redressing apartheid-era spatial planning and its inequities. Park provision is essential for supplementing urban infrastructure and providing ecosystem services. Deliberate and equitable planning is critical, and residents can benefit significantly through good distribution and management of parks. This paper has assessed how existing park access correlates with a range of socio-economic disadvantages to enable a better understanding of where investment could have the most strategic impact.
The results show that park access equity is spatially heterogeneous across Johannesburg and across a number of park accessibility measures. Statistical models show that the total population, unemployment and education play an important role in determining park access equity within Johannesburg. Applying spatially sensitive models to this question, as opposed to previous statistical approaches, enables a more nuanced consideration of socio-economic characteristics and their relationship with park access. These granular spatial data are important as city planners decide where to direct park investments. Without careful consideration of these elements, future investment could further entrench existing inequalities rather than secure fair and equitable access to green space for all urban residents.
Footnotes
Funding
The authors received no financial support for the research, authorship, and/or publication of this article.
1.
Boone et al. (2009); ![]() ; Scholsberg (2004).
; Scholsberg (2004).
2.
3.
4.
It should be noted, however, that while the higher property values due to park proximity may be beneficial for established home owners, these costs may act as a barrier for first-time buyers and renters.
8.
21.
Utility-based measures are based on the premise that individuals have the opportunity to make a choice in terms of the facilities they use and that travel impedance is impacted by the desire to get maximum benefits from the particular facilities (Cascetta et al., 2013).
28.
Boone et al. (2009); Race (2020); Scholsberg (2004); ![]() .
.
29.
Nicholls (2001), page 202; ![]() .
.
31.
Scholsberg (2004).
40.
Scholsberg (2004).
41.
Scholsberg (2004).
65.
Developed parks are designed parks with some infrastructure and facilities. Similarly, flagship parks are considered “best and most important” attractions (Weidenfeld, 2010), offering top opportunities for hosting events and functions (Johannesburg City Parks and Zoo, undated). By contrast, undeveloped parks have no park facilities and are at most just open space.
72.
74.
75.
77.
Spatial dependence, also known as spatial autocorrelation, is when there are more similarities or similar characteristics in close proximity (Kim and Nicholls, 2016; Kim and Graefe, 2021).
78.
Refers to the uneven distribution of the relationship between variables across space (Kim and Graefe, 2021).
81.
82.
AIC (Akaike Information Criterion) is a measure of model performance and can be used to compare regression models. Where a bias correction has been applied due to small sample sizes, this is called the AICc (Akaike’s Information Criterion with correction) (Kim and Nicholls, 2016).
85.
The condition index helps diagnose multicollinearity (Kim and Nicholls, 2016; Siordia et al. 2012). In general, condition numbers between 5 and 10 suggest weak dependence, and numbers over 30 suggest moderate or stronger dependence among the independent variables (Charlton and Fotheringham, 2009; Yang et al., 2013). Thus, if the condition numbers are greater than 30, unreliable coefficient estimates could be produced due to the local collinearity (Lee et al., 2017; Yang et al., 2013).
86.
87.
R2 values range from 0 to 1 and are expressed as percentages.