
Abstract
Ecosystem services have continued to dwindle due to human activities, with likely implications for the dependent populations. This paper assesses the relationship between poverty and ecosystem degradation within the peri-urban domain of Obafemi-Owode local government area (LGA) using a range of research methods including satellite imagery analysis to track land-use change, economic valuation of ecosystem services, and surveys to construct a multidimensional poverty index (MPI). The analysis shows that vegetation and wetlands have been replaced with built-up area and savannahs. This has resulted in a net loss in the value of ecosystem services worth US$ 11.3 million, most of which is attributable to the decline in waste-management services provided by peri-urban wetlands. The major activities cited as causing environmental degradation were lumbering and land clearing, which were perceived to be deepening poverty through water contamination, food shortages, loss of farmlands, unemployment, increased erosion, epidemics and dropping out of school.
I. Introduction
The environment has always been a source of benefits to human beings, including for instance food, clothing and shelter.(1) People exploit wetlands, grasslands, forests and shrublands, rivers, ponds, lakes and other ecosystems to access these benefits.(2) Globally, the rate of exploitation of natural resources has become higher and faster than the rate of their replenishment, disrupting the natural balance of these ecosystems.(3) The imbalance in these cycles of resource extraction and restoration constitutes ecosystem degradation, with consequences for the delivery of the primary services rendered by the ecosystems.
Ecosystem degradation can be attributed to activities such as uncontrolled grazing, mining and quarrying, seasonal bush burning, harvesting of firewood, and the discharge of toxins.(4) These processes alter the composition of environmental components such as water, air and soil while also destroying and displacing wildlife.(5) The severity of these activities has overwhelmed the carrying capacity of these ecosystems, resulting in habitat degradation and loss of natural resources.(6)
Some of the effects of ecosystem degradation include (but are not limited to) loss of biological diversity and species extinction, climate change at different scales, acid rain, desertification, pollution, changes in biological productivity, accelerated soil erosion, and destruction of watershed stability.(7) These emerging consequences limit the ability of ecosystems to effectively carry out their natural functions or sustain native species.(8)
One of the attendant effects of ecosystem degradation is the crisis in the well-being of the dependent human population.(9) Ecosystem services are known to play a role in health, livelihoods, and other dimensions of well-being including security and social relations.(10) Furthermore, there is a general assumption that the provision of ecosystem services contributes to alleviating poverty in the less-developed areas of low- and middle-income countries.(11) This is because the availability and use of natural resources can impact on the outcome and pace of development.(12) Hence, it is logical to assume that ecosystem degradation will not only affect human well-being and efforts directed at poverty reduction,(13) but may indeed result in the escalation of poverty.
The widespread effects of ecosystem degradation can be seen at first hand in the peri-urban areas that connect the activities of urban and rural areas.(14) These peri-urban areas cannot be categorically described as either rural or urban.(15) Buxton(16) described them as areas with mixed features, characterised by an unstable blend of attributes that are symptomatic of urban and rural areas but often continually affected by factors emanating from the urban areas. This is a diverse environment made up of productive ecosystems which, in synergy with the predominant socio-economic realities there, result in complicated land-use patterns.(17) This domain suffers multiple imbalances as a consequence of the uncontrolled influx into locations where demand exceeds supply.
The United Nations Fund for Population Activities (UNFPA)(18) projected in 2007 that the population of urban residents in Africa and Asia would double between 2000 and 2030. This prediction is gradually being realised: many African cities have witnessed a huge demographic surge in the last decade.(19) The consequence is the continuous spatial expansion and sprawl of cities into proximate areas, leading to the emergence and proliferation of peri-urban areas which are essentially unplanned settlements where the demographic expansion is accommodated.(20)
Human activities in the peri-urban zone cause continuous modification of landscape features.(21) This is not unexpected. Peri-urban areas are typified by conditions such as pollution, illegal development, the exponential growth of squatter settlements, non-functional waste-management systems, a lack of land-tenure security by residents, the loss of agricultural land and natural resources such as forest and wetlands high in biodiversity, infrastructural deficiencies, and pressure on available land and water resources, all of which is further worsened by a weaker government presence than in urban centres.(22) These conditions undoubtedly contribute to destructive changes to the ecosystems in the peri-urban environment and negatively impact the well-being of the dependent population there.
The examination of poverty within the context of extensive ecosystem degradation in the peri-urban domain is therefore both justifiable and necessary. In addition, community-based appraisals (such as those embarked upon in the peri-urban study area of this research) are valid components of multi-scale assessments like the Millennium Ecosystem Assessment (MEA) which gives scientific data on ecosystem change. The MEA was an assessment procedure which engaged experts between 2001 and 2005 to appraise how ecosystem change affects human well-being. This research examined the multidimensionality of both poverty and ecosystem degradation using interdisciplinary methodologies. The study was embarked upon to:
a) assess the spatial spread of ecosystem degradation within the study area;
b) investigate the unevenness in poverty across peri-urban communities; and
c) examine the link between ecosystem degradation and poverty-related well-being across these peri-urban communities.
II. Study Area
The study area for this research was Obafemi-Owode local government area (LGA). The LGA is situated within Ogun State, Nigeria, and had an estimated population of 334,349 as of 2017. It occupies an area of 104,787 hectares (1,410 square kilometres) (Table 1 and Figure 1). Obafemi-Owode is located in the tropical forest zone and has two distinct climatic seasons: wet and dry. It consists of 1,204 towns and villages and is divided into 12 political wards: Mokoloki, Oba, Ofada, Egbeda, Owode, Kajola, Ajura, Obafemi, Moloko-Asipa, Ajebo, Onidundu and Alapako-Oni.(23) Its headquarters are at Owode-Egba. Population information for recent years is provided in Table 1.
Population information for Obafemi-Owode
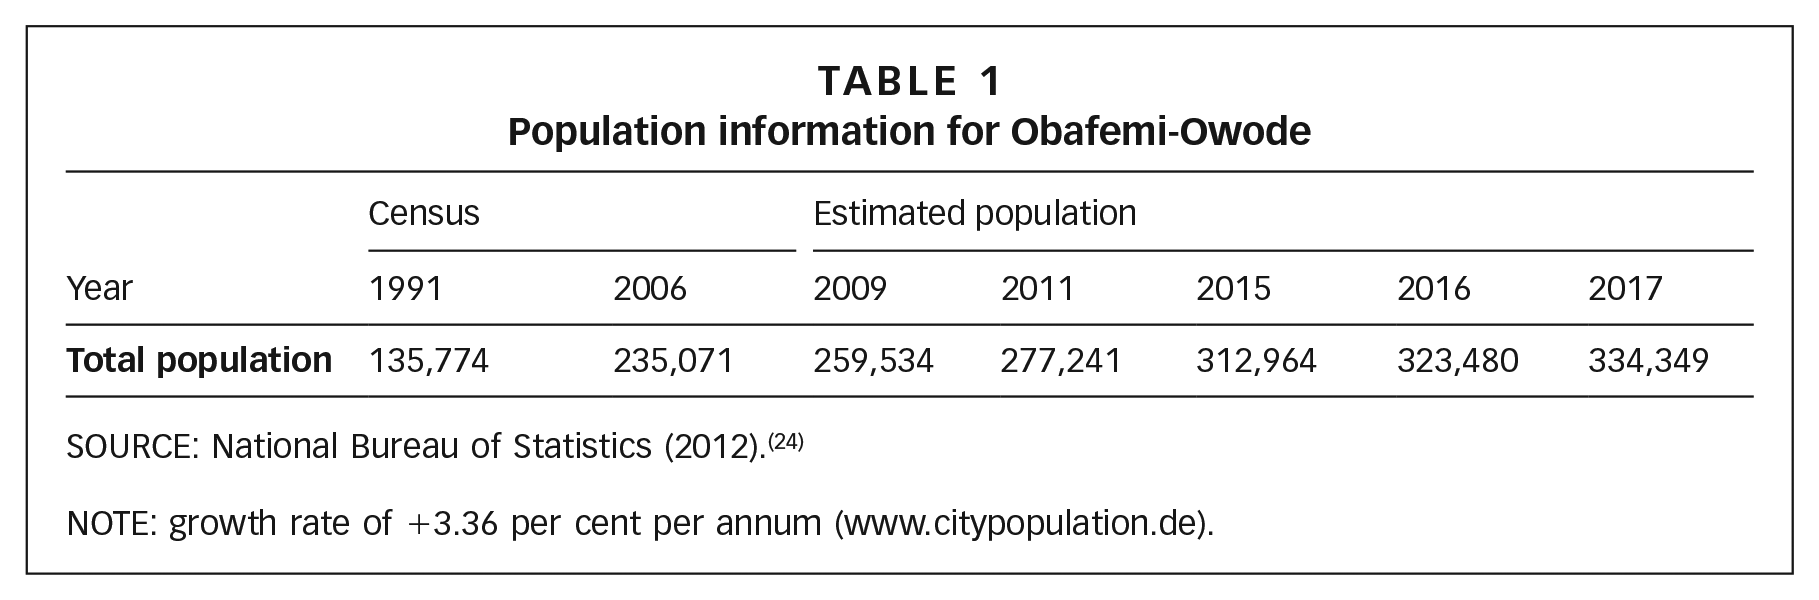
SOURCE: National Bureau of Statistics (2012).(24)
NOTE: growth rate of +3.36 per cent per annum (www.citypopulation.de).
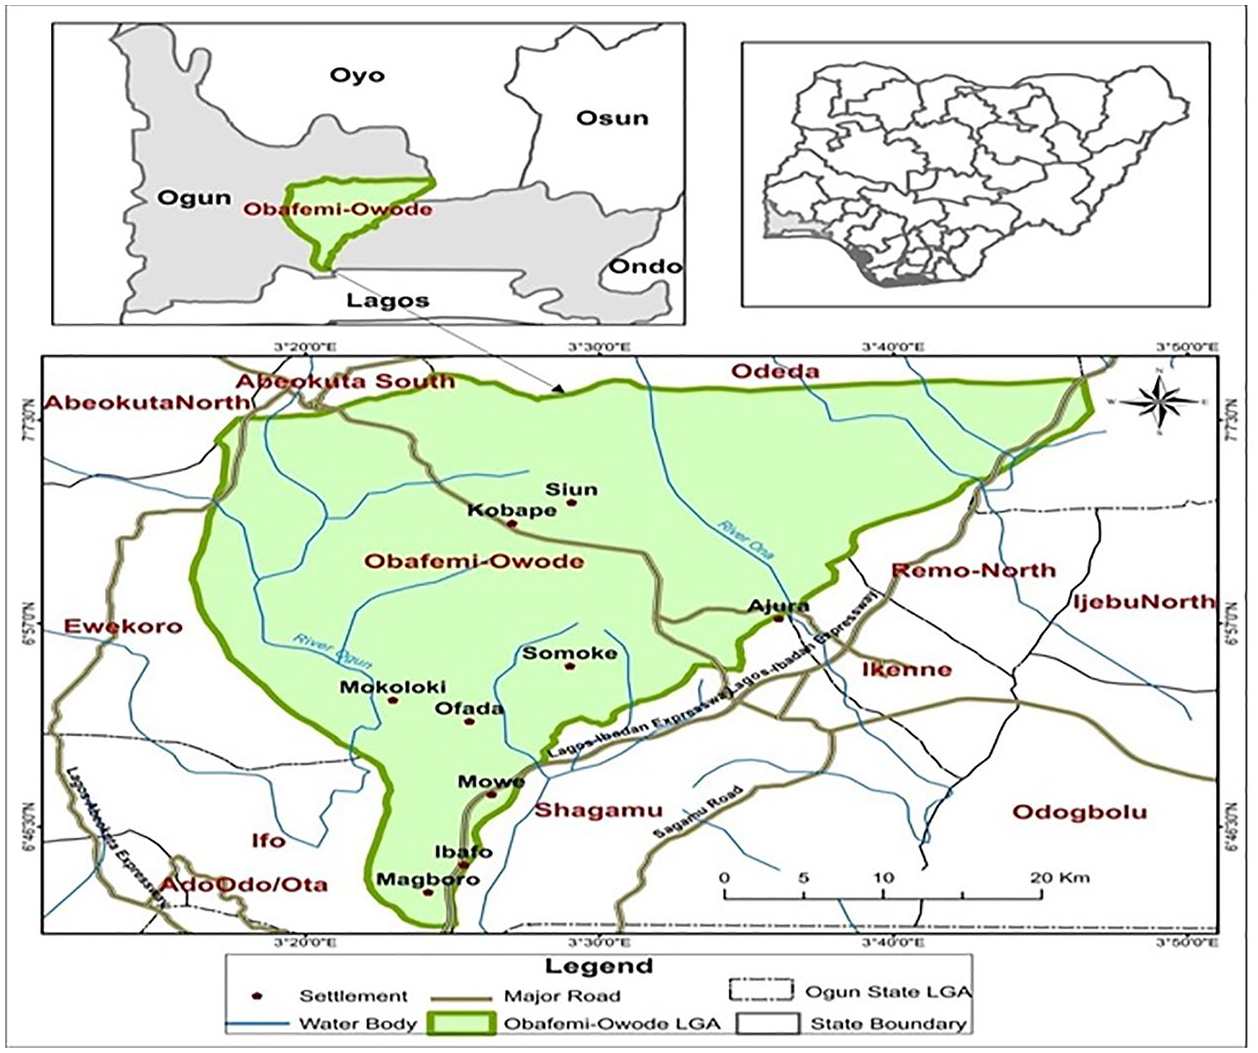
Obafemi-Owode LGA showing selected peri-urban communities
III. Research Methodology
a. Sources of data
This paper is unusual because it combines data and methods from the natural and social sciences. First, the study considers land-use and land-cover change (LULCC). LULCC is defined as the anthropogenic conversion of the Earth’s terrestrial surface around the globe.(25) Fasona et al.(26) also describe it as “the modification or replacement of cover types which represent an index of significant natural and anthropogenic disturbance to ecosystems”. This is because the continuous change of land cover through human activities causes ecosystem instability and environmental changes that may be a threat to the survival of dependent rural communities.(27) LULCC is a useful environmental metric to assess the health of existing ecosystems and the specific activities causing environmentally harmful changes.
LULCC is estimated using Landsat images of Obafemi-Owode LGA for two time periods. Section IIIb explains how the Landsat imagery was acquired and analysed to estimate changes in land use and land cover in the peri-urban areas. Section IIIc explains how the monetary value of these environmental changes was calculated.
Second, this paper evaluates multidimensional poverty in Obafemi-Owode LGA. This approach considers a variety of deprivations beyond low incomes using a multidimensional poverty index (MPI). An MPI involves the construction of a deprivation profile for each person, using a fixed set of indicators that are locally relevant and feasible.(28) The MPI is populated using a structured questionnaire which was deployed during a field survey. The questionnaire has three sections that capture information on each respondent’s socio-economic characteristics, perception of ecosystem degradation and poverty, respectively. The sub-sections in Section IIId explain the design and administration of the questionnaire and introduce the MPI used in this study.
b. Analysis of land-use and land-cover change
Figure 2 summarises the methods used to assess ecosystem degradation for this research.
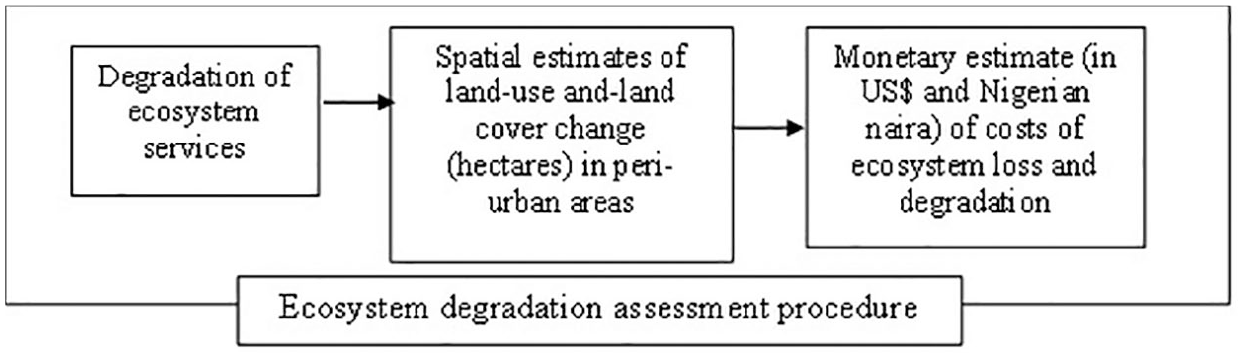
Authors’ ecosystem valuation flow chart
Pre-processing is mandatory in LULC assessments to reduce distortion and cloud introduced into the satellite images as a result of the instability of the acquisition system and platform. The process also establishes that the data acquired are directly affiliated to the biophysical phenomena of interest.(29) These pre-processed data were imported into the ENVI software (GIS) to effect geometric and radiometric corrections, adopting the procedures of Armston et al.(30) and de Vries et al.(31)
Landsat satellites collect data in different electromagnetic frequencies. These wavelength “bands” detect differences among land-cover types such as land or water, vegetation biomass or hard surfaces. In Obafemi-Owode LGA, the six land-cover types (of interest) were built-up areas, vegetation, exposed surfaces, water bodies, savannah and wetland. On Landsat-7, a composite of bands 7 (2.09–2.35 µm), 4 (0.77–0.90 µm) and 2 (0.52–0.60 µm) were used in conjunction with bands 8 (0.50–0.68 µm), 5 (0.85–0.88 µm) and 3 (0.53–0.59 µm) of Landsat-8. This combination enabled easy classification and provided images that looked relatively natural.(32) To groundtruth the classification, 36 field-data points were collected using a Global Positioning System (GPS) unit from the nine communities under focus (4 points per community) and deployed in training and assessing the classifier.
A supervised maximum likelihood classification method was used for the land-use classification. This method assigns each pixel to one of the different land-cover types based on the means and variances across the types. The estimation of spatial loss or gain (in hectares) of each land-cover type within this study involved comparing the amount of land in each category in the years under focus (2007 and 2017).
c. Monetising the costs of ecosystem degradation
In this section, the spatial changes to land-use and land-cover types in the peri-urban areas are subjected to economic valuation. Monetary values are attached to (the loss of) ecosystem services.(33) The non-tradable nature of most ecosystem services (except some provisioning services) makes its importance abstract; monetary valuation helps to highlight and quantify its value to the public. Because biodiversity and adjoining ecosystem services cannot be considered unlimited, accounting for their value to society (or the costs incurred as a consequence of their depletion or degradation) can inform sustainable management.(34)
Although several economic valuation techniques exist, the benefit transfer method was deployed in this research. The benefit transfer involves applying extant information or data originally collected from one site to other sites.(35) In this case, benefit transfer could be described as the transfer of the estimated monetary value of ecosystem services from one region to another, assuming sufficient similarity of site attributes.(36) The popularity of the benefit transfer method in ecosystem service-related research has been attributed to constraints such as the amount of time and budget required for primary data collection.(37)
The robust work of Costanza et al.,(38) which covered 16 global biomes and 17 ecosystem services, was used as the baseline study from which the ecosystem value coefficients were drawn. The ecosystem services and biomes relevant to Obafemi-Owode LGA, and their value coefficient generated by Costanza et al.(39) are available in the supplementary material.
The following formula by Arowolo et al.(40) was deployed in Microsoft Excel to calculate the monetary values of ecosystem services for selected land uses in this research:
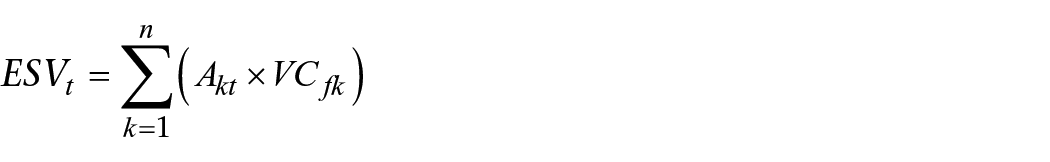
Where
d. Analysis of multidimensional poverty
Design and administration of the field survey
The sampling frame for this research was the household population data for Obafemi-Owode LGA which was 58,422 in 2006.(41) Household population data for Obafemi-Owode LGA were not available at ward level. This figure was used as the baseline data for estimating the necessary sample size using the Krejcie and Morgan table,(42) which gave a sample size of 381.
The 381 questionnaires were issued to the respective wards and communities based on the use of simple proportions and percentages. The settlements’ populations were projected from 2006 to 2018 using the
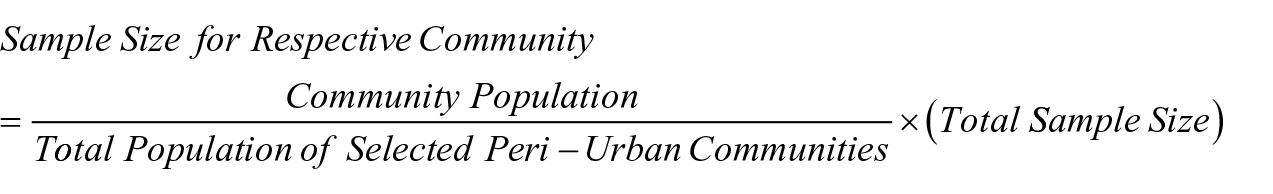
Where “Community Population” refers to the respective peri-urban study areas, “Total Population of the Selected Peri-Urban Communities” is the summation of all the peri-urban areas under consideration, and finally, the total sample size is the size obtained using the Krejcie and Morgan table. The field survey started with a reconnaissance visit to each of the nine communities under focus. This visit took three days; three communities were visited each day between 17 and 19 September 2017. The purpose was to familiarise the communities – especially the traditional authorities – with the research team and to explain the purpose of the research. It also provided the opportunity for field observations such as the land-cover types. Furthermore, the visit also allowed for questionnaire pre-test to determine the strengths and weaknesses of the designed questionnaire. The pre-test pinpoints areas in the questionnaire that needed to be changed by rephrasing a question or removing it completely. It also gives the team a fair idea of the average time required to sample one questionnaire which was found to be between 45 and 60 minutes.
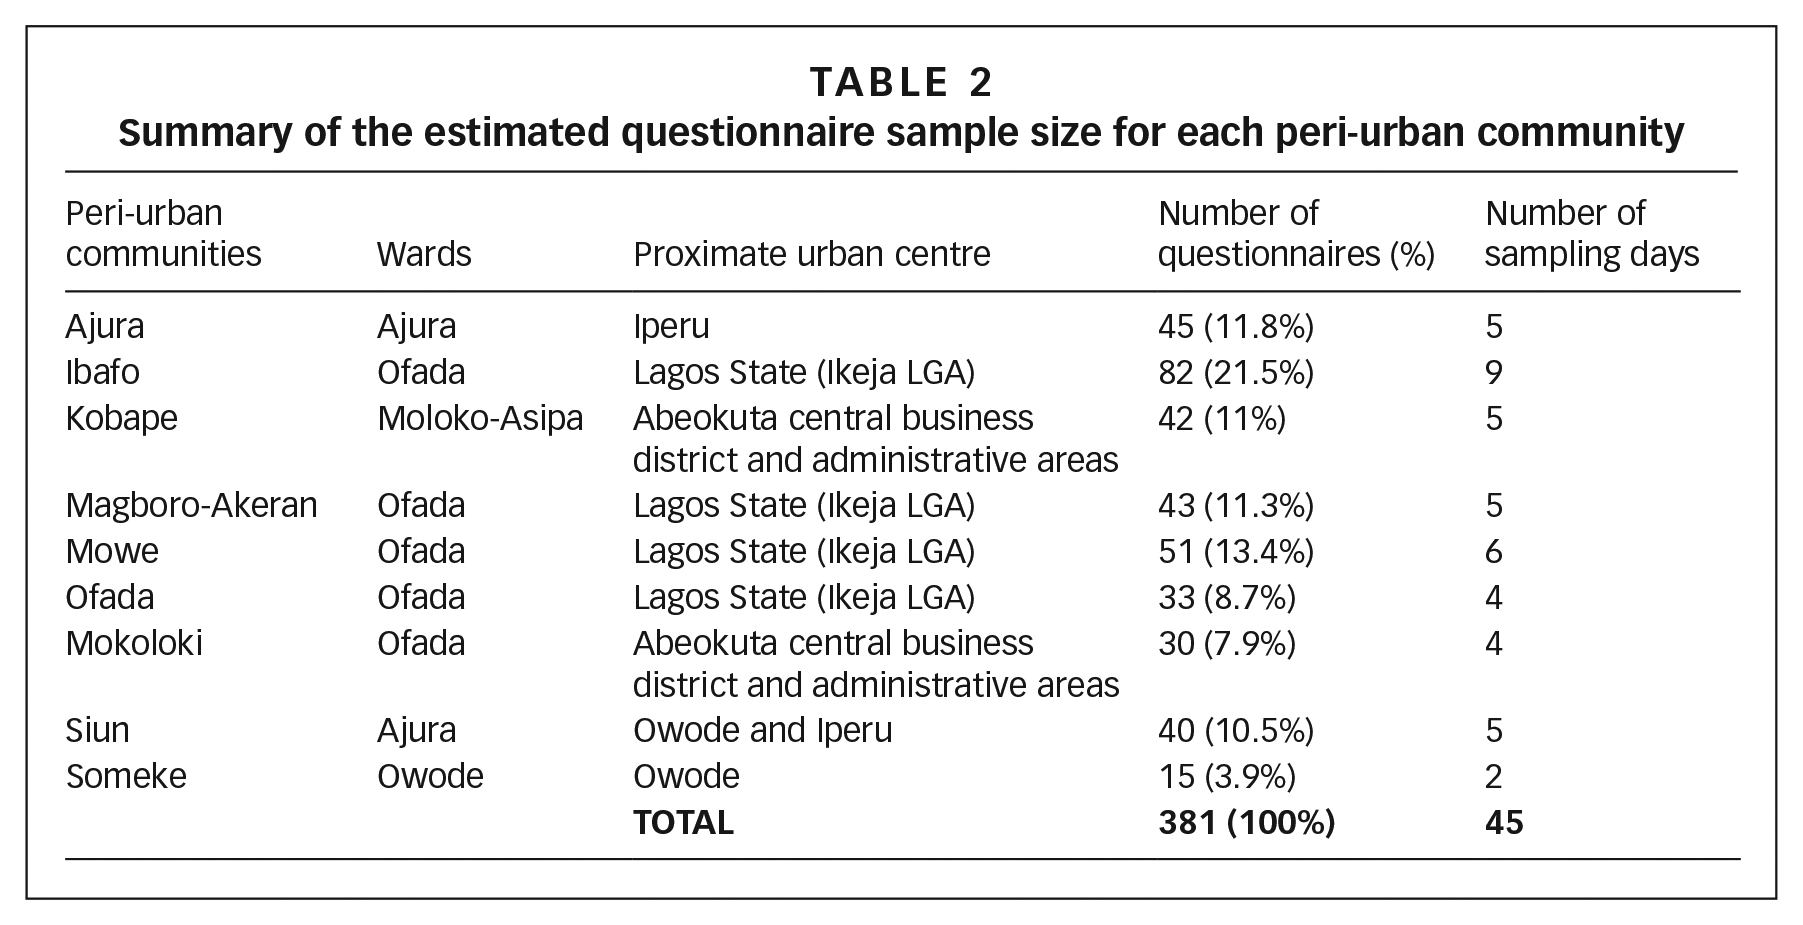
The questionnaire administration was carried out between October and December 2017. A total of nine weeks (45 days) were spent in the field with an average of nine questionnaires completed per day. Sampling was only done on weekdays (Mondays to Fridays). Details of the field survey are provided in Table 2.
Summary of the estimated questionnaire sample size for each peri-urban community
Design of the multidimensional poverty index
The questionnaire was used to calculate the MPI, gauging the areas of deprivation and dimension(s) of poverty. By pinpointing specific types and pockets of deprivation of individuals, families, or communities, an MPI highlights the areas where interventions are required. The MPI has been used by several other works, including Gerlitz et al., Bart et al. and Hanandita and Tampubolon.(44)
According to the UNDP,(45) an MPI is a combination of two important pieces of information, namely:
Headcount ratio (H): The proportion of people in a particular population experiencing several multiple deprivations.(46) It is estimated using:
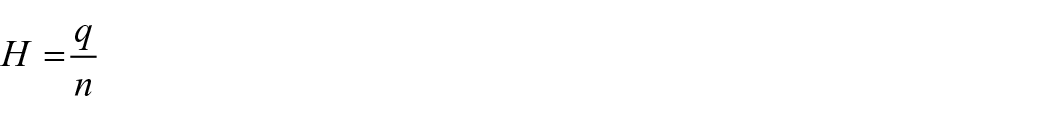
Where q represents the population of people who are poor in multiple dimensions and n is the total population under consideration.
The intensity of deprivation (A): This is the average ratio of measured deprivations experienced by poor people and can be expressed as:
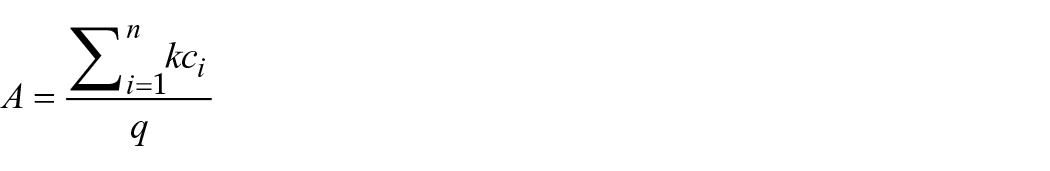
Where
The MPI is the product of both, i.e.
The dimensions and indicators used in this study are shown in Figure 3. Each dimension is weighted equally, and within each dimension each indicator is weighted equally. Full details of the indicators and their weightings are available in the supplementary material.
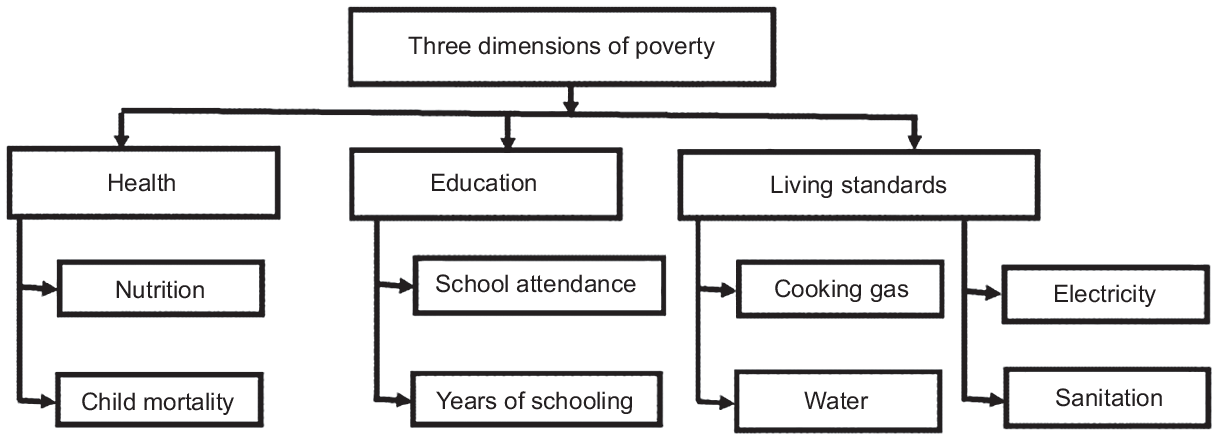
Composition of MPI: dimensions and indicators(47)
Alkire and Santos(48) stated that individual deprivation is depicted by the indicator’s weight. Thus, if the summation of the weighted deprivation is 33 per cent (0.33) or more, then the individual is multidimensionally poor. This explanation is also true for weighing household deprivation as well as community deprivation. Therefore, the summation of the weighted deprivations of the selected indicators across the different dimensions were used as the determinant of community multidimensional poverty in this work.
e. Linking household perception of ecosystem degradation and poverty indicators across the selected peri-urban communities
The ecosystem degradation and poverty nexus was established via descriptive statistics using data procured through the questionnaires administered during the field survey for the research. The participants were asked for their perceptions (opinions) of the drivers of ecosystem degradation (such lumbering and land clearing) in their communities, especially as it affects their well-being. The resulting perceptions data were subsequently discussed to show if any linkages exist or otherwise.
IV. Results And Discussion
a. Land-use and land-cover change in peri-urban Obafemi-Owode
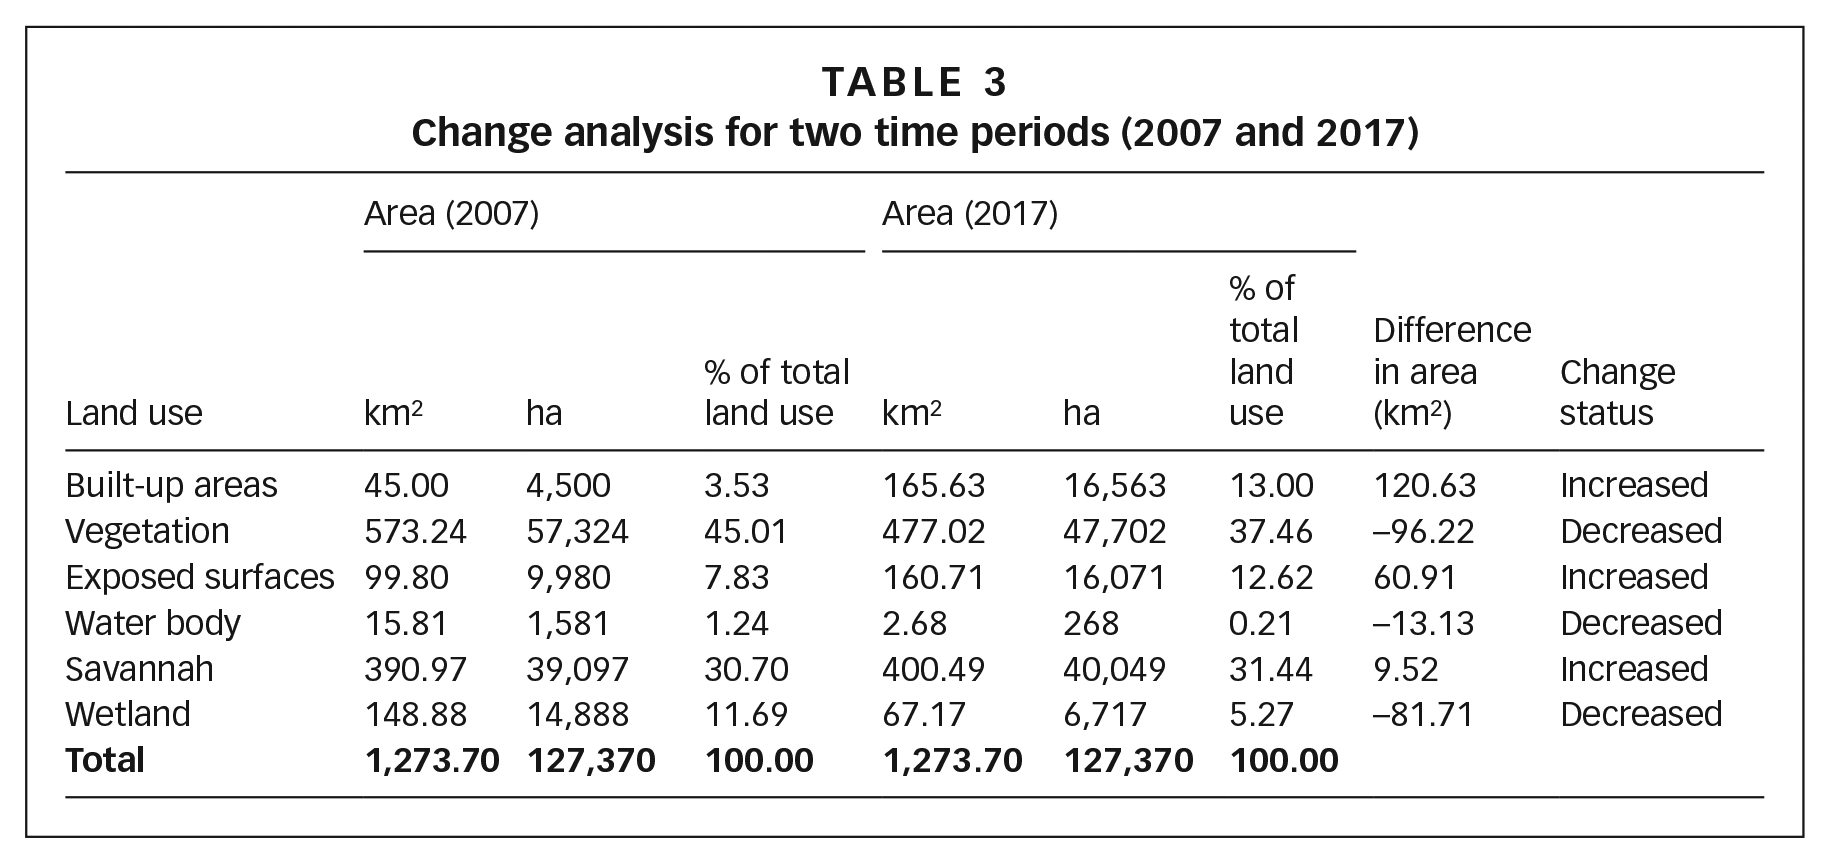
Figures 4 and 5 and Table 3 show the extent of land-use change over 10 years (2007–2017) within the study area. Three types of land use (vegetation, water bodies and wetlands) decreased in spatial extent over the decade, while the other three (built-up areas, exposed surfaces and savannah) increased in size. The rate of change varies from one land use to another. Vegetation has the highest loss in landmass at 16.78 per cent (–9,622 ha), followed by wetland, which lost more than half of its area at 54.88 per cent (–8,171 ha) while water bodies shrank by 83.05 per cent (–1,313 ha). The land-use types that gained from these losses are built-up land use at 268.07 per cent (12,063 ha), exposed surfaces at 61.03 per cent (6,091 ha) and finally savannah, which increased by 2.43 per cent (952 ha).
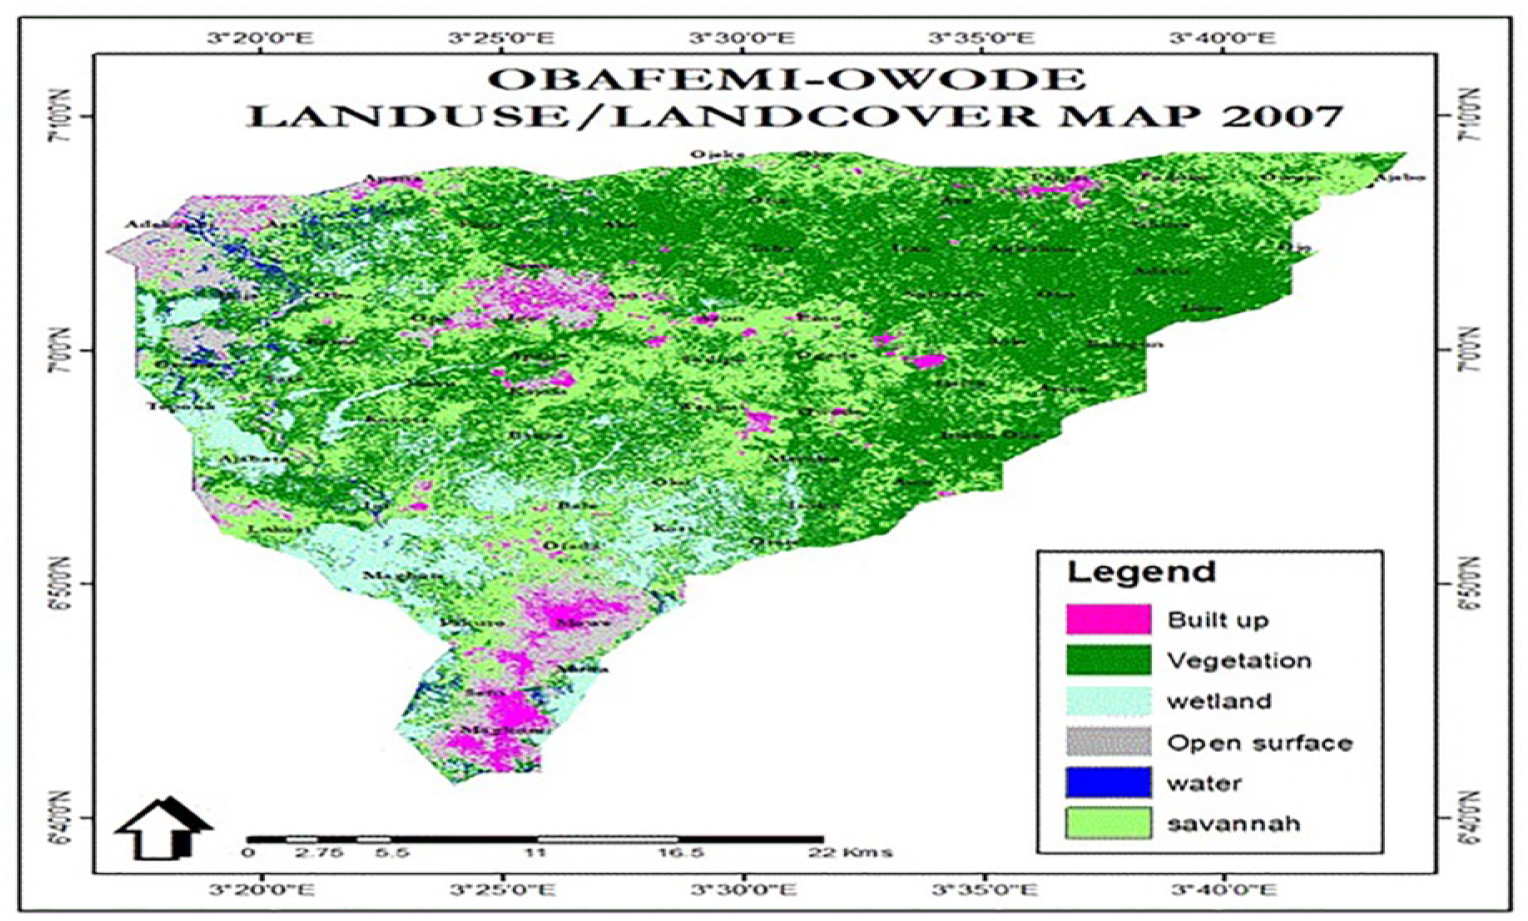
LULC classification map for 2007
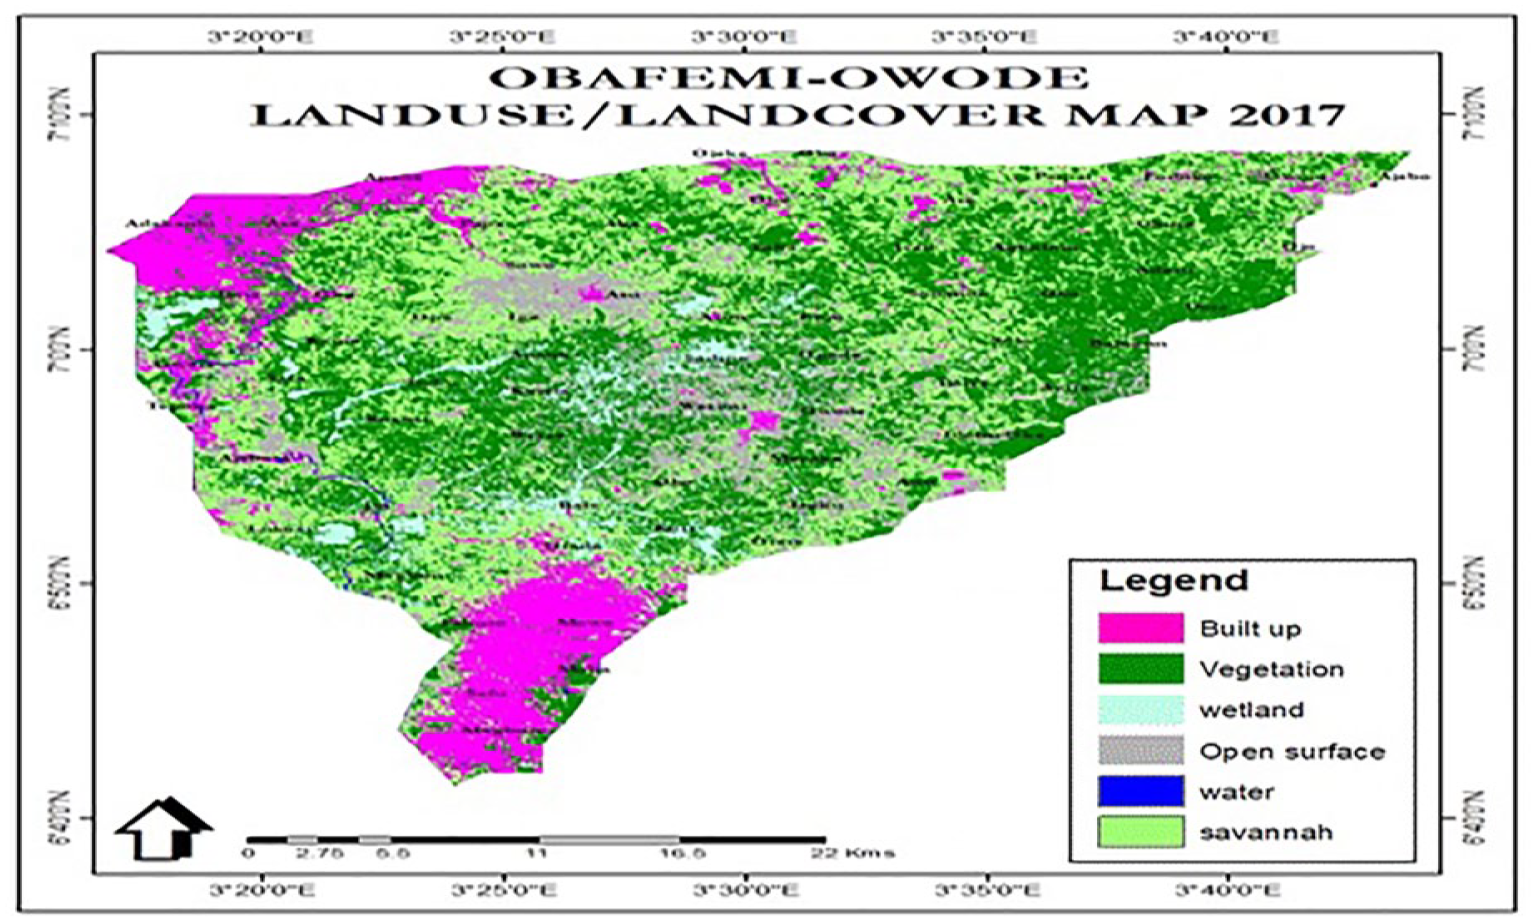
LULC classification map for 2017
Change analysis for two time periods (2007 and 2017)
The value of ecosystem services presented in Table 4 shows that there has been a loss within the local government area between 2007 and 2017. The total value gained by the land uses that increased in area (built-up areas and savannah) was US$ 843,177 while the total loss from the decline of vegetation, water bodies and wetlands (the land uses that decreased in the area) was US$ 12,135,660. Therefore, the net loss from land-use change and ecosystem degradation between 2007 and 2017 is –US$ 11,292,483, which also equates to an ecosystem service loss of US$ 1,129,248.32 per annum.
Ecosystem service value estimates for land use in the study area between 2007 and 2017 (US$)
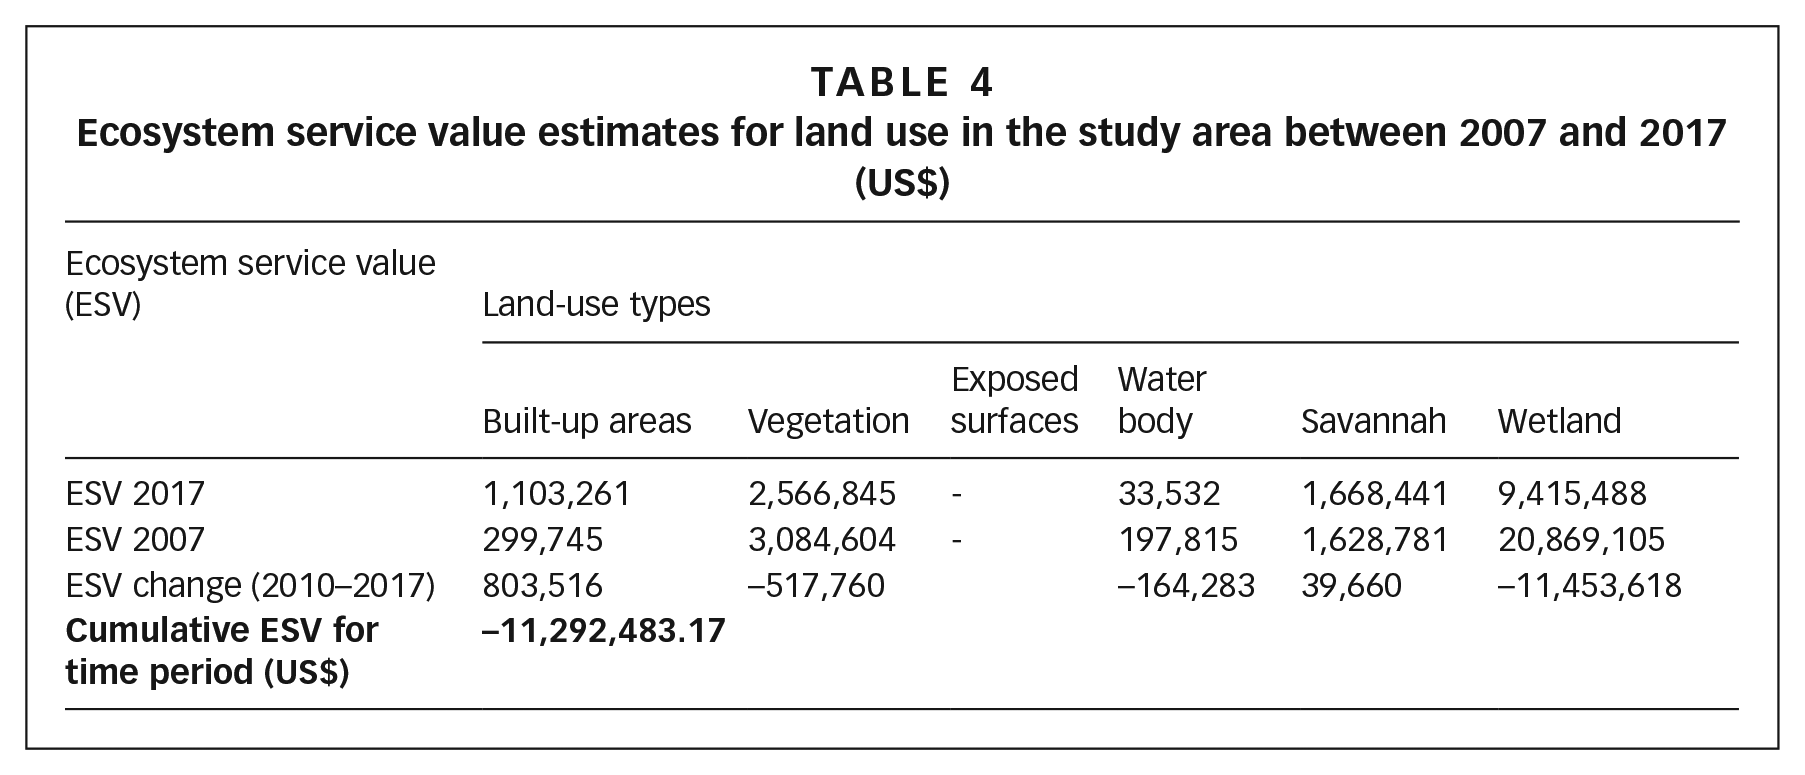
Most of the economic losses associated with land-use change and ecosystem degradation can be attributed to the shrinking wetlands. Between 2007 and 2017, approximately 55 per cent of wetlands were lost. With a cumulative fall in ecosystem service value (ESV) of –US$ 11,453,617.54, this change in wetland size accounted for 94 per cent of the lost value in ecosystem service in the peri-urban areas. These findings suggest that the wetland ecosystem has a very high ESV coefficient, consistent with the academic literature. Wetlands are beneficial because they serve as habitats for aquatic and other wildlife, they improve water quality, protect against shoreline erosion, store floods and provide recreational opportunities.(49) Additionally, wetlands have been credited with the ability to treat wastewater and water pollution because of their capacity to absorb sizable amounts of nutrients and various types of toxic substances.(50)
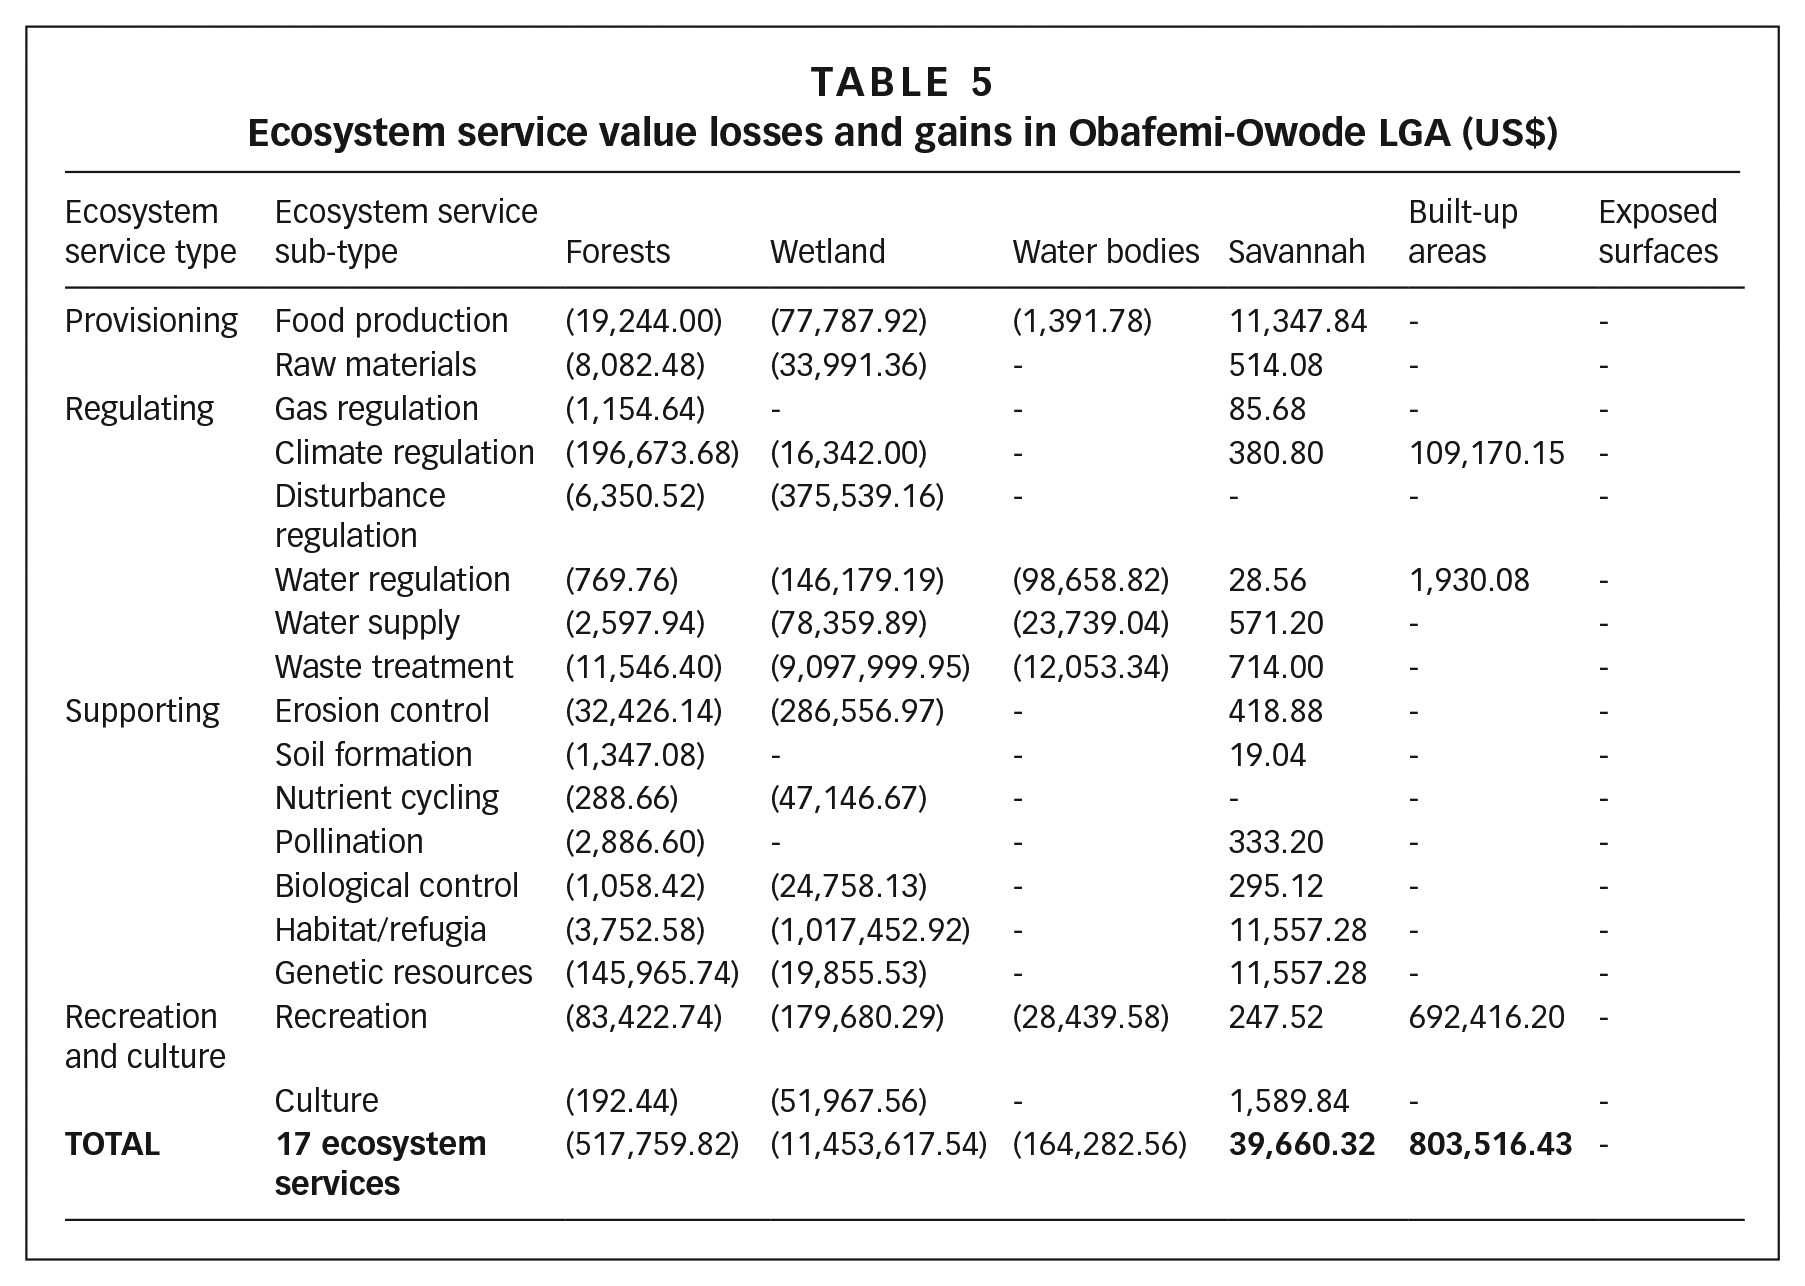
The ESV loss for the forest and water-body land uses over the same period stands at –US$ 517,759.82 and –US$ 164,282.56 – only 5.6 per cent of the total losses. Meanwhile, built-up areas and savannah have gained an estimated ESV of US$ 111,100.3 and US$ 39,660.32 respectively. The value of lost ecosystem services thus massively outstripped the gains from new savannah or urban areas, although it is important to recognise that these provide other services to peri-urban residents. Table 5 gives more information on the distribution of value changes across the 17 ecosystem services and six biomes in the study area.
Ecosystem service value losses and gains in Obafemi-Owode LGA (US$)
It is worth comparing the estimated changes in ESVs in the study area to that of Arowolo et al.(51) which looks at the changing value of ecosystem services across the country. Arowolo et al. reported that a decrease of 4.83 per cent in ESV was estimated for the natural ecosystems (forests, savannahs, wetlands and water bodies) between 2000 and 2010; while an increase of 18.97 per cent was recorded for the anthropogenic (human-made) ecosystems which comprise built-up areas and cultivated land. The key differences are the spatial expansion of the savannah ecosystem at the national scale, which provides valuable provisioning services (especially food production) and the high share of wetlands being lost in the peri-urban Obafemi-Owode compared to national averages, which affects important regulating services such as waste management. The differential can therefore be attributed to the specificity of the peri-urban area, where cultivated land is not increasing significantly and valuable habitats are disappearing. Moreover, although this study uses a uniform monetary value for specific biomes and ecosystem services, it is important to recognise that the provisioning of ecosystem services is stronger in environments with moderate anthropogenic disturbance and jeopardised in the face of severe human disturbance (such as the peri-urban domain).(52)
b. Multidimensional poverty in peri-urban Obafemi-Owode
The data collected on the dimensions and indicators of poverty are presented in Table 6. While 381 questionnaires were provided to households in the community, only 335 units were recovered and used in the data analysis.
Multidimensional poverty indicators in surveyed households
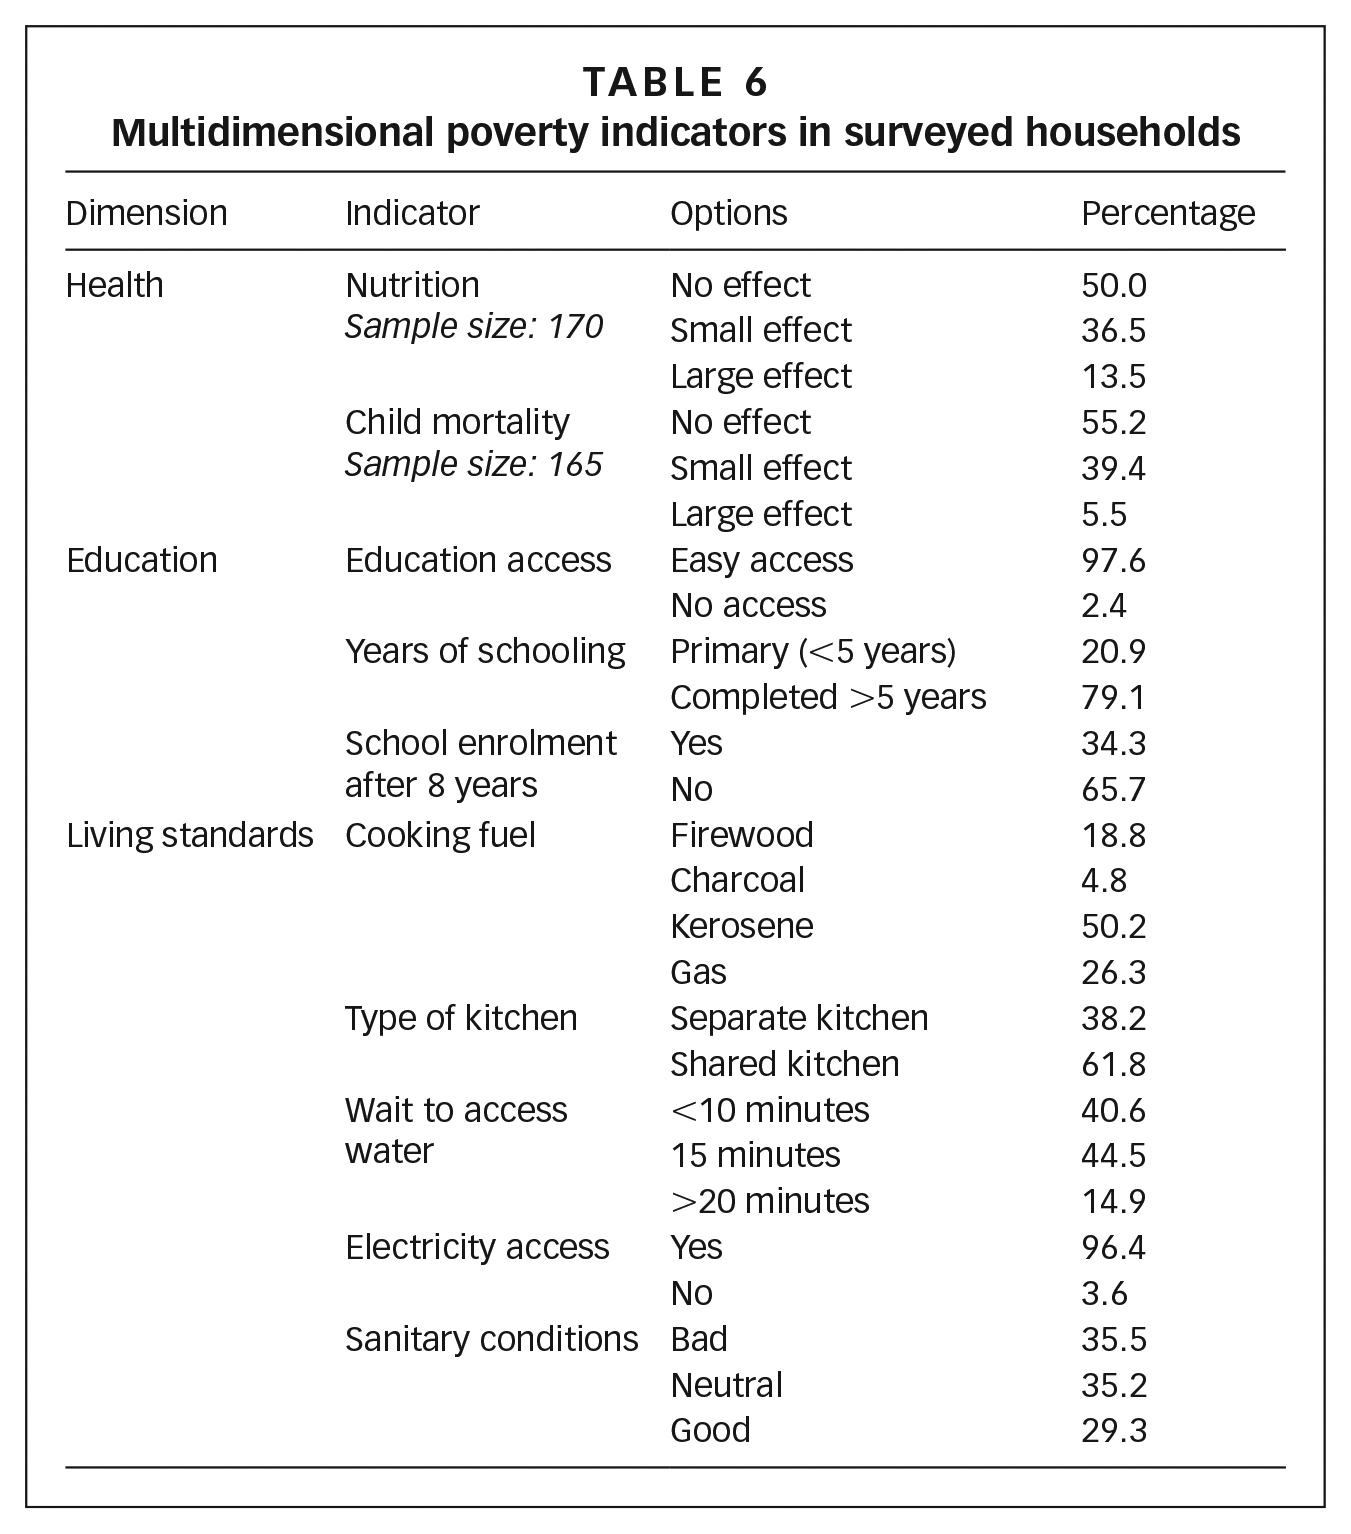
The health indicators have a smaller sample size than other indicators because of missing responses. Alkire and Santos (2014)(53) identified such occurrences as a recurrent problem in household surveys. Where a household did not provide information for its members concerning an indicator, that survey will be excluded from the MPI computation.
The findings on household health suggest that some nutritional challenges and child mortality issues exist, but the intensity or frequency is not severe for most households. Cumulatively, the intensity of occurrence (small or large effect) of the health issues stands at 50 per cent and 44.9 per cent respectively. Nigeria has a national prevalence rate of 32 per cent of malnutrition while the national non-age specific mortality rate is between 3.18 and 3.25 per 1,000 (though for children under five, it is about 13.2 per cent).(54) The only possible explanation for the differential is the adverse conditions in the peri-urban areas where basic amenities are either unavailable or insufficient to effect significant change.
More positively, the responses garnered suggest that access to education is readily available (97.6 per cent). Given ease of access, it is perhaps not surprising that 79.1 per cent of the households in the communities surveyed attained universal basic education (completed five years of schooling or more) while only 20.9 per cent of the members of the households surveyed did not complete primary school.
Accessibility and years of education should be complemented with some level of comfort to make learning fun, interesting and effective. However, schools in the study area – like many in Nigeria – have serious maintenance issues, with school buildings often in a state of disrepair with cracked and broken walls, leaking and broken ceilings, damaged and insufficient furniture, damaged doors and windows, and other related issues.(55) It is also impeded by issues such as a lack of competent teachers, the inadequacy of learning aids, poor school attendance, and other factors.(56) The survey results showed that despite completing five years or more of schooling, many community members could still not read or write. Finally, school enrolment after the age of eight pertains to households with family members who only enrolled in school after their eighth birthday. In the computation of the MPI, such households are considered deprived. The basic reason for this is that primary education in Nigeria usually spans between ages six and 11, meaning elementary school starts at age six.(57) Therefore, a household with a member who is aged between eight and 11 years old and not yet enrolled in school is considered deprived. Findings revealed that 65.7 per cent of the respondents claimed that enrolment in their household is before the age of eight, while 34.3 per cent only enrolled after their eighth birthday. This implies that about 34.3 per cent of the households in the study areas are deprived.
Data gathered on household living standards show that the majority of households cook with kerosene (50.2 per cent), followed by gas (26.3 per cent), while some homes still use firewood (18.8 per cent) and charcoal (4.8 per cent). Furthermore, the most common type of kitchen in the communities surveyed is a shared one (61.8 per cent) with only 38.2 per cent of the respondents having a separate kitchen. The turn-around time for fetching water is typically 15 minutes or less; only 14.9 per cent of the respondents claimed it takes over 20 minutes to fetch water. Access to electricity is very high (96.42 per cent), but the opinion of the respondents on sanitary conditions within their communities is very varied. Based on the results in Tables 7 and 8, this likely reflects differences among peri-urban communities.
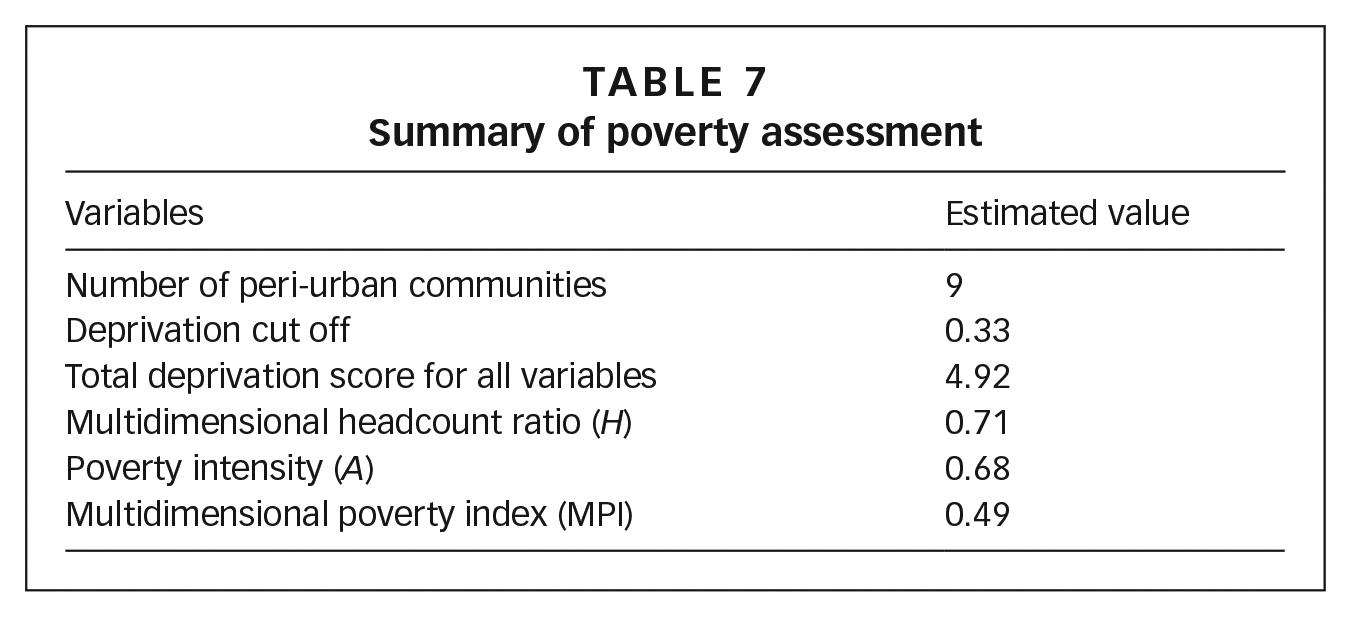
Summary of poverty assessment
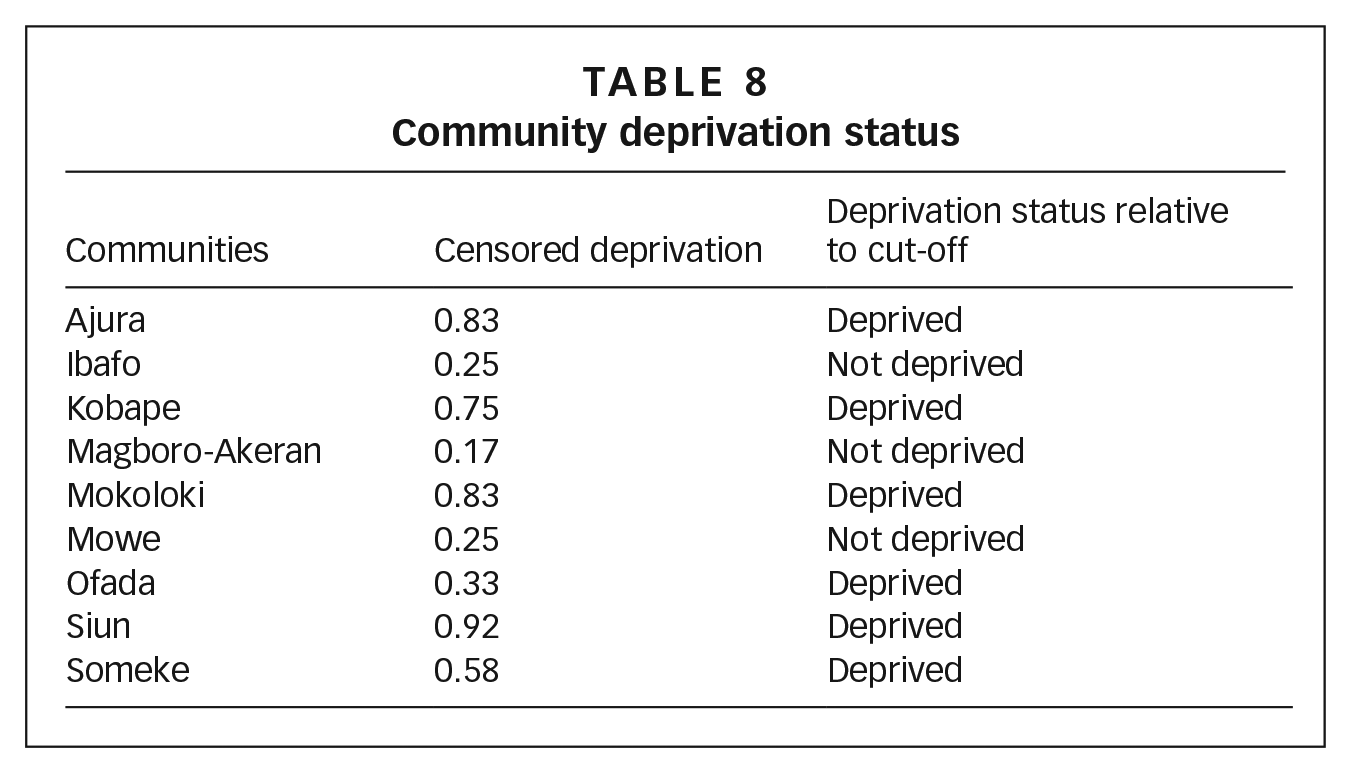
Community deprivation status
As outlined in the methodology, the MPI is constructed by multiplying the headcount ratio (H) – the proportion of people experiencing multiple deprivations – by the intensity of that poverty (A), calculated using the dimensions and indicators above. Table 7 shows the combined deprivation level of households in the nine communities included in the field survey. The headcount (H) means 71 per cent of residents are poor in at least one dimension. Furthermore, the intensity of poverty (A) implies that the average person is at least poor in 68 per cent of the weighted indicators. The MPI coefficient means that the communities are deprived in 49 per cent of the total potential deprivation.
Table 8 shows the censored deprivation coefficient for each community. It reveals that all the peri-urban communities selected (Ajura, Ibafo, Kobape, Magboro-Akeran, Mokoloki, Mowe, Ofada, Siun and Someke) for this survey were deprived in at least one indicator but none is deprived in all indicators. Using the minimum benchmark of 33 per cent as a multidimensional poverty line, this field survey suggests that six out of the nine communities (Ajura, Kobape, Mokoloki, Ofada, Siun and Someke) are deprived.
The 0.49 poverty intensity calculated for these communities points to the prevalence of poverty in these areas. The coefficient is much higher than the MPI coefficient of 0.057 for Ogun State calculated by the Oxford Poverty and Human Development Initiative.(58) It is closer to the estimate of 0.47 calculated by Amao et al.(59) for South West, the region where Ogun State is located. A possible explanation for the high incidence of poverty in the communities can be attributed to the nature of the peri-urban environment. Lower land prices and access to natural resources may enable settlement by lower-income communities who cannot afford to live in urban areas. However, growing populations in these peri-urban areas face infrastructure deficits and place pressure on land, water and natural resources that in turn fuels poverty and ecosystem degradation.(60)
c. Perceptions of the ecosystem degradation and multidimensional poverty nexus
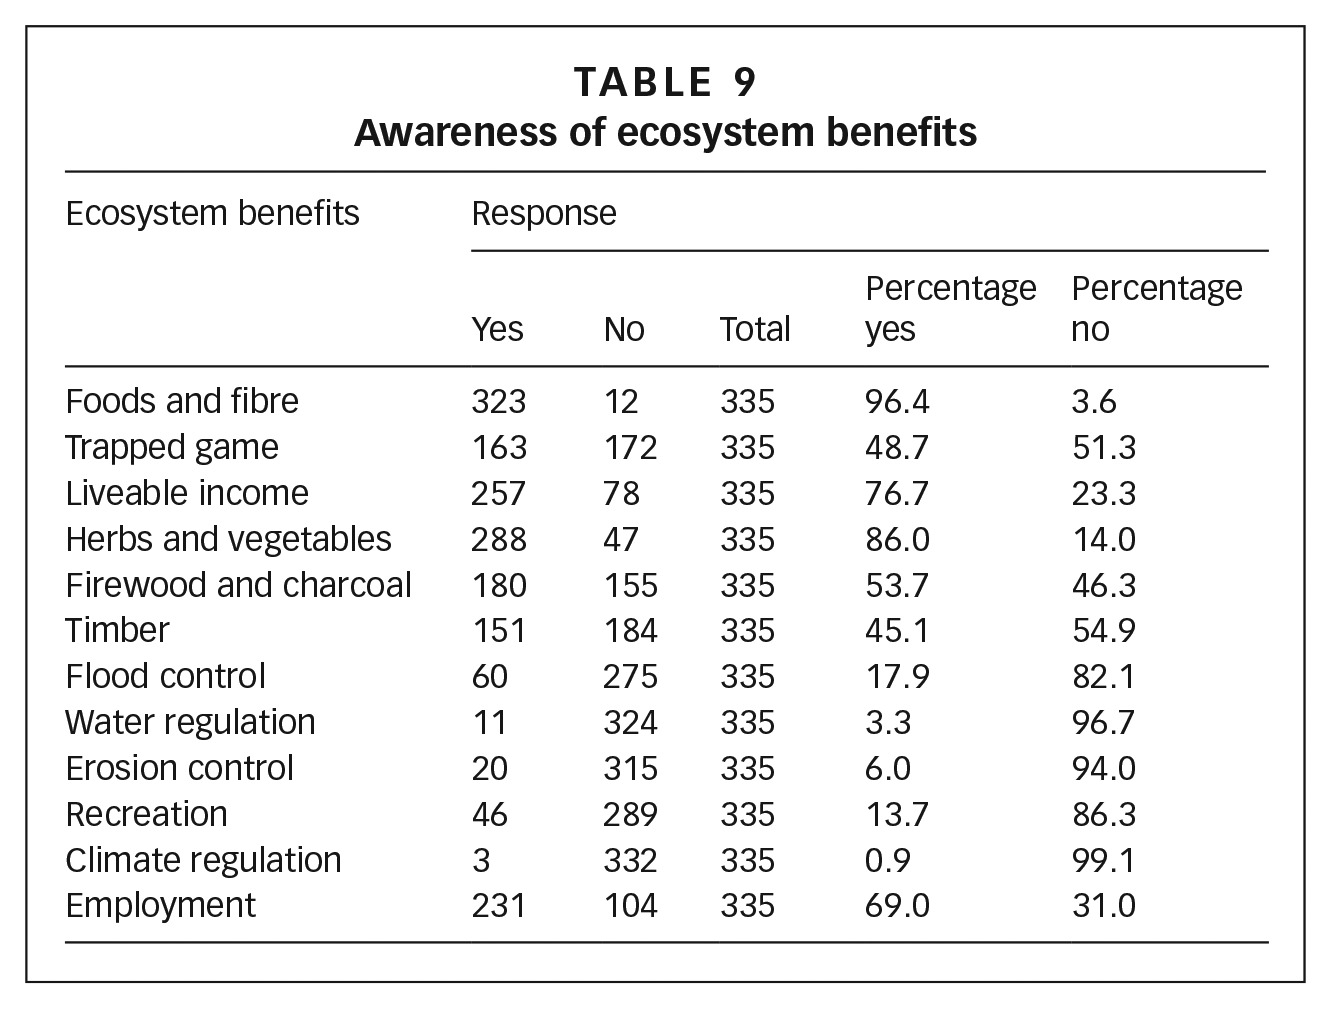
Table 9 shows the level of knowledge the respondents have about local ecosystem services. Respondents were widely aware that ecosystems could provide foods and fibre (96.4 per cent), herbs and vegetables (86 per cent), firewood and charcoal (53.7 per cent), trapped game (48.7 per cent) and timber (45.1 per cent). This awareness aligns with existing research showing that people are more familiar with provisioning ecosystem services.(61) On the other hand, the table revealed that the respondents’ knowledge of the other categories of ecosystem services is limited. For example, a minority recognised benefits like flood control (17.9 per cent), recreation (13.7 per cent), erosion control (6 per cent), water regulation (3.3 per cent) and climate regulation (0.9 per cent).
Awareness of ecosystem benefits
The opinion of the respondents on the changes to ecosystem services across the study area is presented in Figure 6. The figure shows that the majority of the respondents believed the accruable ecosystem benefits are falling due to ecosystem degradation, especially the provision of food, fibre, wood products, meat and income sources. A number also noted the decline of regulating services such as flood management and control of soil erosion.
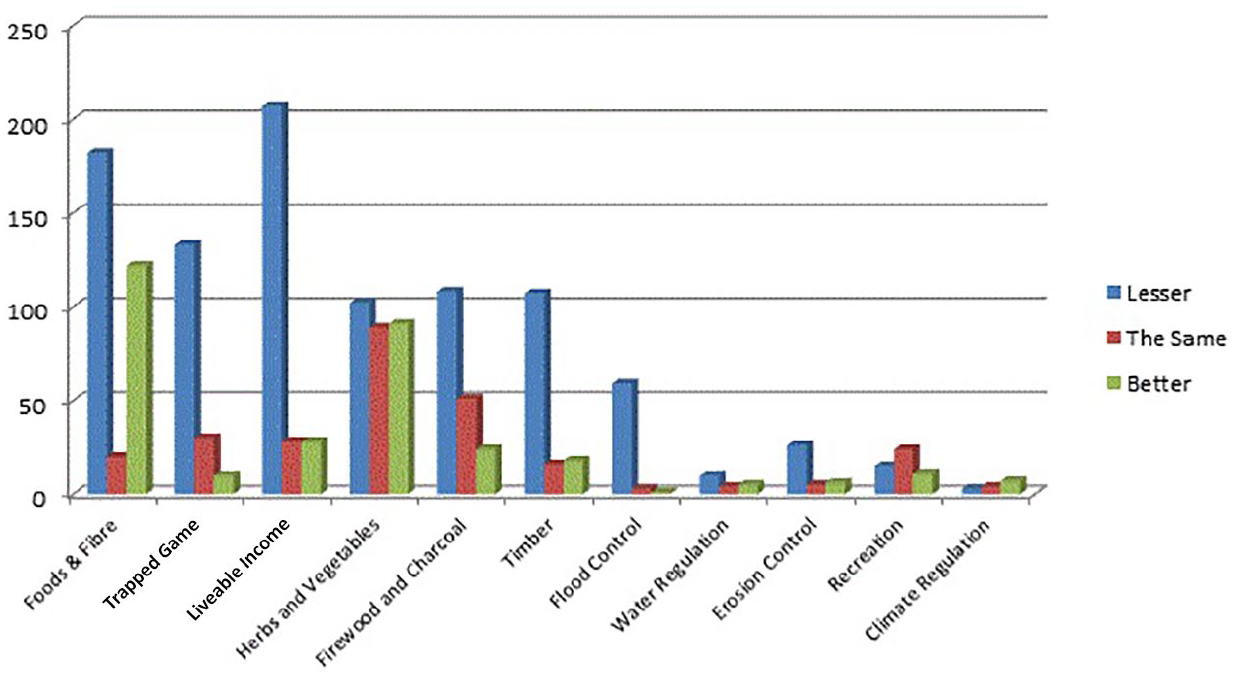
Perception of ecosystem services over time
The perception data gathered from sampled households within the study areas on drivers of ecosystem degradation (lumbering and land clearing) across poverty dimensions are presented in Table 10. These data are discussed in detail in the following sections.
Perception of impacts of ecosystem degradation on human well-being
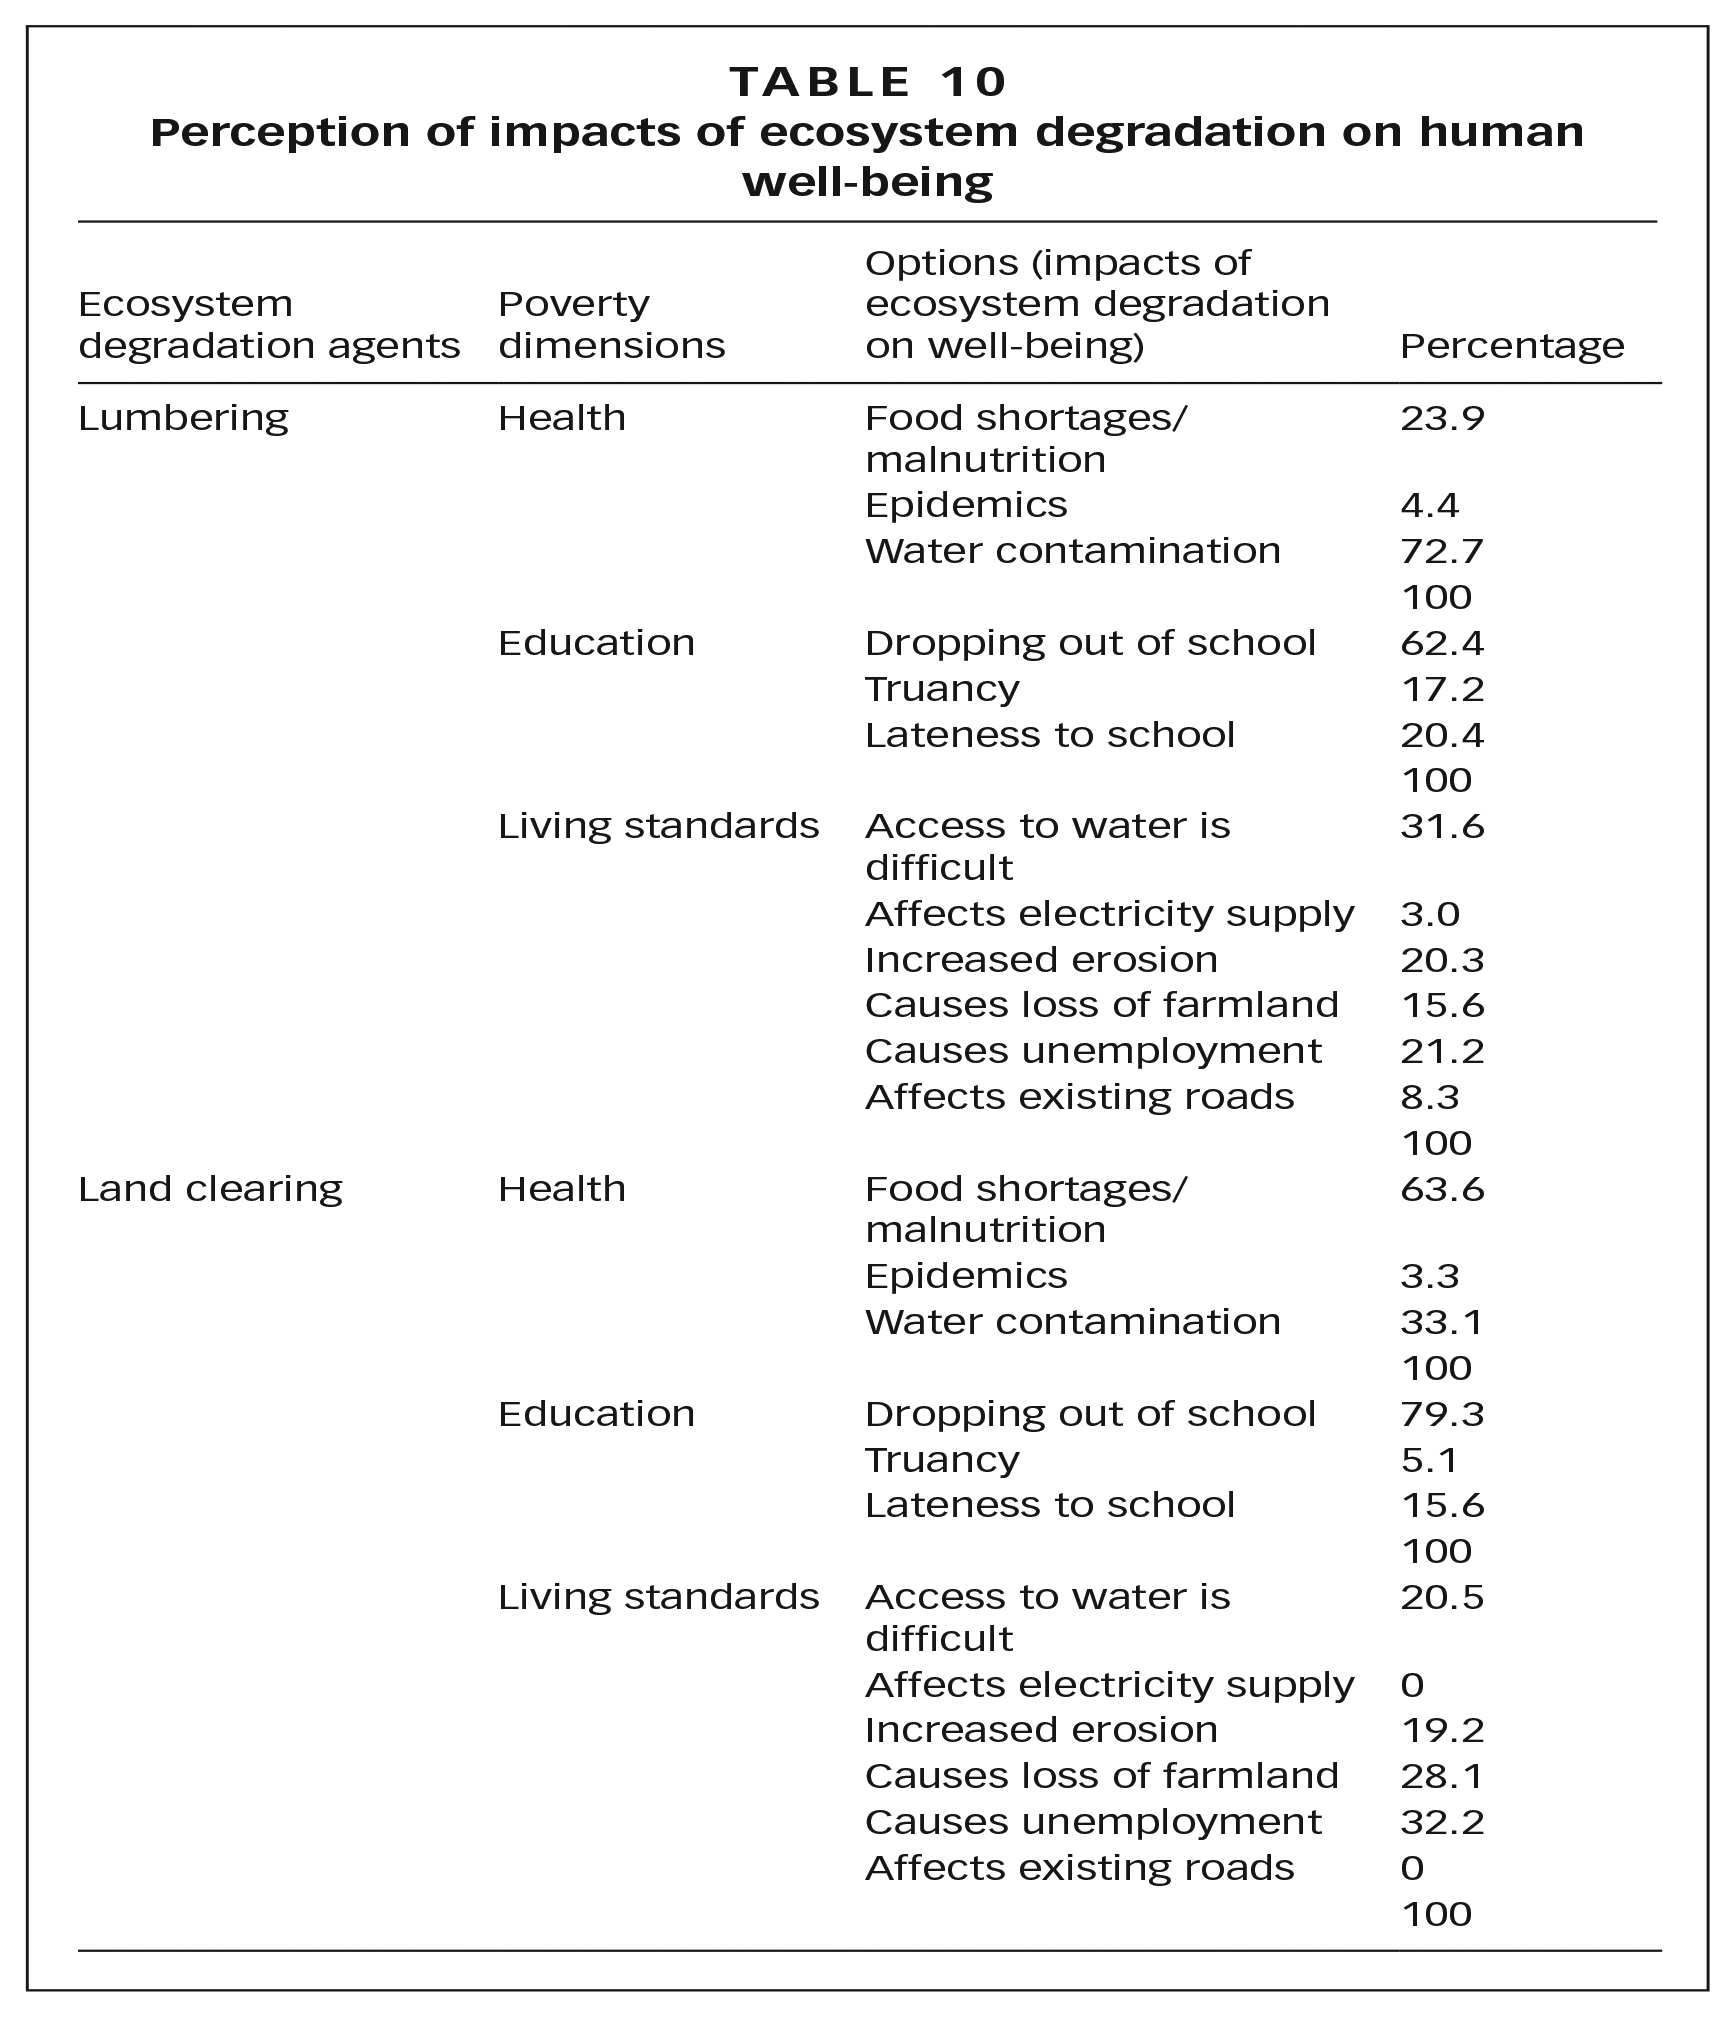
Perception of the impacts of lumbering on well-being
Illegal lumbering (illegal logging) is commonplace in sub-Saharan Africa.(62) Notable cases include Ghana, where about 640,000 cubic metres of timber were illegally harvested in 2005; in Tanzania, approximately half a million hectares of the country’s forests were lost to illegal logging; and in the Democratic Republic of Congo – despite the armed conflict – the country has lost an estimated US$ 3.6 million as a consequence of illegal lumbering.(63) The severity of illegal lumbering is considered to be a function of many factors, which include government corruption, conflict, endemic poverty and property rights usurpation.(64)
Illegal lumbering causes loss of timber, affecting carbon stocks, biodiversity, soil and water resources.(65) Water contamination was cited as the most widely felt impact (72.7 per cent of respondents) of lumbering on the health of the households within the study area (see Table 10). The respondents stated that one of the most common indicators of the occurrence of illegal lumbering within their domain is the observable change in the water quality. Extant literature highlights that forest trees bind the soil, and in the process retain and use water for transpiration.(66) However, the incidence of illegal lumbering implies that water that is normally retained becomes available for streamflow, causing a sizable increase in annual and summer flows.(67) The consequences of this include soil susceptibility to erosion, which may alter the water-quality characteristics due to changes in soil characteristics such as temperature, sediment and dissolved oxygen.(68)
The effect on the soil (soil erosion) also has implications for crop cultivation,(69) causing food shortages (which may lead to household malnutrition), which were reported by 23.9 per cent of respondents. Other consequences of illegal lumbering are the loss of wildlife and disappearance of high forests.(70) Peri-urban residents who are hunters, gatherers, or carpenters/woodworkers stand the risk of unemployment and the loss of a liveable income. An offshoot of such income losses is the impact on education: 62.4 per cent of respondents identified that the loss of income as a consequence of illegal lumbering may mean that children have to drop out of school completely. The survey results found that farmers, hunters, gatherers and carpenters/woodworkers constitute 46.9 per cent of the occupation categories, so any loss of livelihood due to lumbering could lead to an inability to afford education-related expenses (such as school fees or paying for textbooks, notebooks, school uniforms and footwear) or the need for children to leave school to earn an income.
Perception of the impacts of land clearing on well-being
Like illegal lumbering, land clearing is also an environmental problem with local and global impacts. Land clearing is often used to expand urban and peri-urban areas into forest areas and areas of other land uses.(71) According to Reside et al.,(72) the impacts of land clearing go beyond the site where the clearing was done. It is a threat to the environment that causes land degradation, contributes to the loss of biodiversity, causes salinity and declining water quality (through sediment runoffs into water bodies and wetlands) and is a constant threat to coastal marine zones.(73) Furthermore, it generates greenhouse emissions, which makes it a driver of climate change.(74)
According to the interviewed respondents, land clearing has been repeatedly used within and around the study areas to create room for residential land use. The loss of forests and agricultural land may explain why land clearing was cited as a cause of food shortage by 63.6 per cent of respondents in Table 10. The effects of land clearing on employment (32.2 per cent of respondents) and land assets (28.1 per cent) may once again explain the effects on education, with 79.3 per cent citing land clearing as a factor in school dropouts as parents cannot afford education-related costs or children are expected to leave school to work to augment household incomes. These extra responsibilities may also explain lateness to school and truancy.
V. Conclusion and Recommendations
The peri-urban domain is home to a large population of people residing in this environment for a variety of reasons, often tied to their socio-economic capacity. In the absence of adequate planning and infrastructure, environmental degradation has resulted in unquantified losses of ecosystem services that have often added to the hardships they experience. It is important to recognise that responsibility for environmental stewardship needs to be borne collectively across a city and its hinterland, rather than pushed onto marginalised residents living on the urban periphery. More responsible use of renewable natural resources will sustain their productivity, which will in turn aid the reduction of poverty across its many dimensions.
Putting a value on the services provided by an ecosystem can help sensitise people to the need to manage ecosystems more sustainably for current and future generations. This paper examined six land-use and land-cover classes within the Obafemi-Owode local government area of Ogun State. The LULCC analysis revealed that built-up areas and savannahs have increased in area extent (in hectares) and ecosystem service valuation (ESV), while wetlands, vegetation and water bodies have reduced on both counts. The cumulative estimated loss in ESV for the 10-year period (2007–2017) under consideration is –US$ 11,292,483.20. The lopsided nature of the ESV across the different land uses under consideration represents the varied value of the ecosystem services that they render.
Six of the nine communities surveyed in peri-urban Obafemi-Owode LGA were multidimensionally poor. This means that the residents suffer from multiple deprivations across health, education and living standards. The peri-urban residents emphasised that lumbering and land clearing are the main ecosystem-degradation activities in their domain, and identified specific ways that these activities affect their well-being: water contamination, food shortages and less education were the most significant impacts, with the latter attributed to loss of livelihoods and income due to ecosystem degradation.
While more work remains to be done, potential recommendations to policymakers and planners in small Nigerian towns might include:
Infrastructure provision: Communities living in peri-urban areas typically lack access to the infrastructure and services that could reduce their local environmental footprint – for example, sewers, piped water or waste-collection services. Such investments should be cross-subsidised by higher-income households in the city to help safeguard ecosystems and natural resources for the future.
Urban planning and development ideals: A policy review is needed to better inform those in authority as to what domains like the peri-urban areas represent and should be used for. In particular, planners could anticipate urban population growth and demarcate housing plots, provide basic infrastructure and ideally ringfence some space for commercial activities such as markets and peri-urban agriculture. These approaches are holistic and attempt healthier, higher-density urban growth with benefits for peri-urban residents and their local environment.
Education: In many cases, low-income and other marginalised communities living in peri-urban areas do not have alternatives to environmentally destructive behaviours. For example, they need fuel to cook food and cannot afford charcoal, gas or kerosene, so depend on firewood. However, in some cases, behavioural changes could maintain or improve people’s living standards while reducing their environmental footprint – for example, agroforestry practices. Government agencies, NGOs and other actors can provide safety tips and educate communities on productive ways to maintain and use ecosystems. This must be approached as a joint venture to build the trust of communities.
Environmental assessments and monitoring: Improved data on biodiversity, water quality, land cover and other key variables can guide locally specific interventions to protect ecosystems while reducing poverty.
Supplemental Material
sj-pdf-1-eau-10.1177_09562478221080456 – Supplemental material for An assessment of ecosystem degradation and poverty: a case study of Obafemi-Owode local government area, Ogun State, Nigeria
Supplemental material, sj-pdf-1-eau-10.1177_09562478221080456 for An assessment of ecosystem degradation and poverty: a case study of Obafemi-Owode local government area, Ogun State, Nigeria by Amidu Owolabi Ayeni and Adeshina Gbenga Aborisade in Environment & Urbanization
Footnotes
Funding
The authors received no financial support for the research, authorship, and/or publication of this article.
Supplemental Material
Supplemental material for this article is available online.
1.
3.
5.
12.
13.
17.
28.
39.
See reference 38.
47.
56.
See reference 55.
68.
See reference 67.
69.
See reference 67.
References
Supplementary Material
Please find the following supplemental material available below.
For Open Access articles published under a Creative Commons License, all supplemental material carries the same license as the article it is associated with.
For non-Open Access articles published, all supplemental material carries a non-exclusive license, and permission requests for re-use of supplemental material or any part of supplemental material shall be sent directly to the copyright owner as specified in the copyright notice associated with the article.