
Abstract
Studies on the implications of population density on energy consumption in small and medium-sized cities in low- and middle-income countries are limited. This paper estimates and analyses energy consumption, using a diverse set of methods, to compare two medium-sized cities in Thailand with similar urban forms and socioeconomic characteristics but different population densities – namely, the less dense city Chaiyaphum and denser city Roi Et. The results reveal that the annual household electricity consumption per capita of these two cities is similar, showing no implications of density. However, private transport energy consumption per capita in Chaiyaphum is 22 per cent higher, supporting the hypothesis that a less dense city will have higher transport energy consumption. The key factor identified is the greater distance travelled by households located in the peri-urban areas in the less dense city. This has important policy implications for urban planning and urban development practices in Thailand.
I. Introduction
Cities are major consumers of energy and material products, with urban sectors such as industrial, residential and transport sectors as key consumers. According to the UN, around 5 billion people will live in urban areas in 2030.(1) Energy demand from cities will increase in the future, and threats from energy insecurity and climate change are likely to pose tremendous concerns for energy consumption.
Many studies show that energy consumption is affected by urban density. However, these studies have mainly focused on large cities, and on cities in higher-income countries. Cities in lower- and middle-income Asian countries as well as in Africa have different socioeconomic systems, climate and travel behaviour. Countries such as Thailand are heavily reliant on energy for their economic growth, and the population in many secondary medium-sized cities has also been increasing rapidly, leading to more energy consumption. Figures 1 and 2 show energy consumption and population growth trends in medium-sized cities in Thailand.
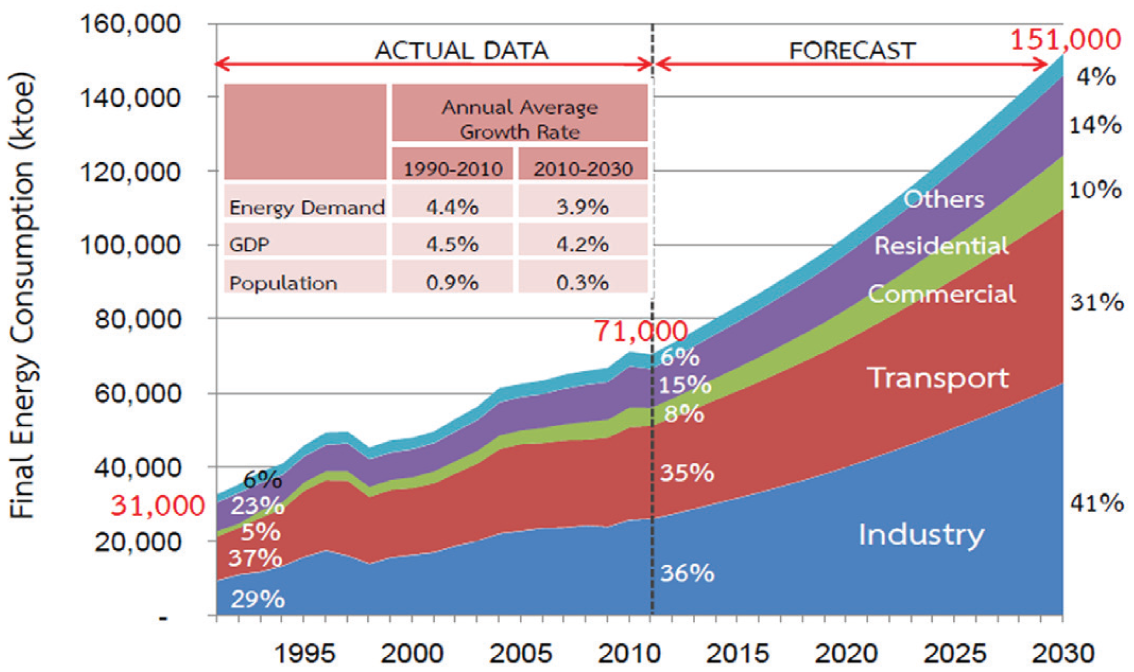
Past and projected energy demand trends in Thailand
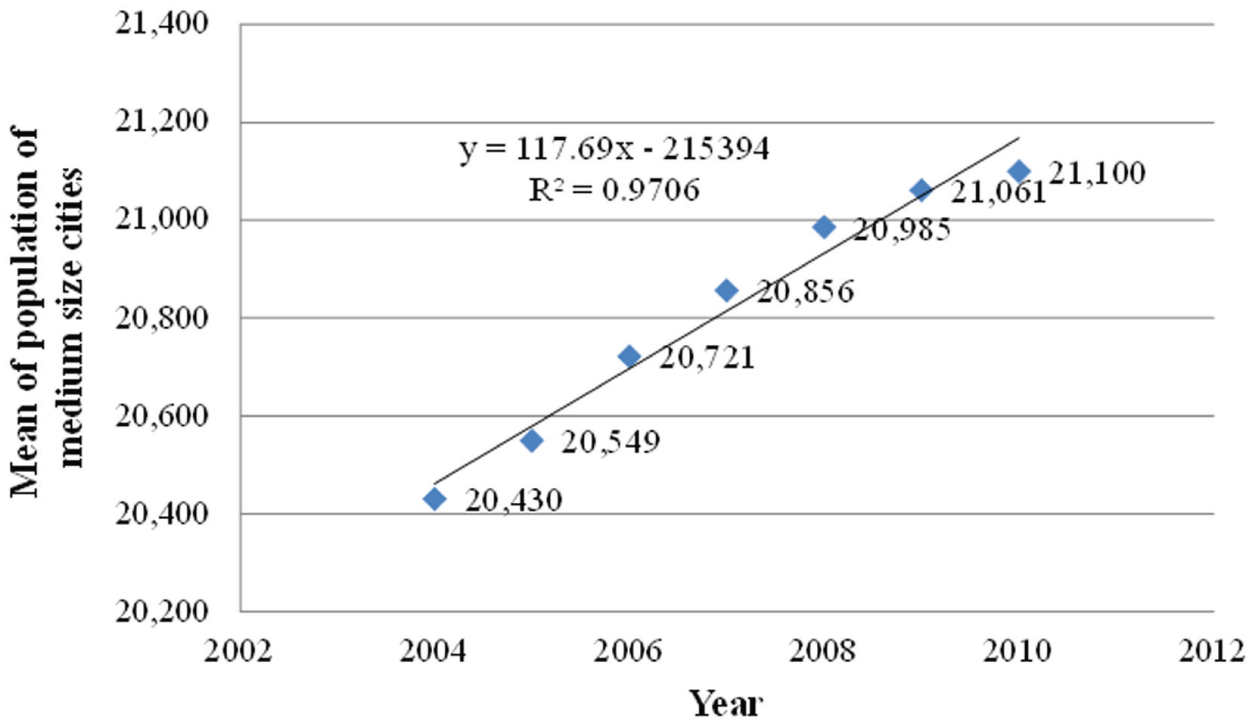
Population growth trend of medium-sized cities in Thailand
To understand the influence of population density on energy consumption, this paper compares the energy consumption of two cities that have different population densities but otherwise similar characteristics. Study areas were selected based on a set of criteria. Statistical analysis was used to compare energy consumption. The indicators were specified to understand factors that affect energy consumption. Finally, from the findings, policy implications are drawn for Thailand’s urban planning and development.
The study focuses on households’ direct energy requirements – namely, electricity consumption and energy for private transport purposes. It does not consider the energy for cooking, as there is no logical linkage between urban density and cooking. While working from home may lead to higher electricity consumption, this is not included as a factor here since this is not a prevalent practice in Thailand, especially in medium-sized cities. The unit of energy used in this study is the megajoule (MJ).
II. Literature Review
Existing research shows that urban population density is directly correlated with energy consumption. A study undertaken in Organisation for Economic Co-operation and Development (OECD) countries concludes that denser cities are cities with lower electricity consumption.(2) In the United Kingdom, reduced fabric heat loss in areas of higher residential density can lead to reduced heating energy use.(3) In Bangkok, the electricity cost per person living in the “urban core” (predominantly terrace houses/townhouses) is higher than in peri-urban areas (predominantly detached houses).(4) However, urban density is only one factor affecting electricity consumption, which can be affected by various socioeconomic factors.(5)
Urban density is one of the key factors that influence transport energy. Newman and Kenworthy used data from 32 cities around the world to show a negative relationship between transport energy consumption and population density, since higher urban density leads to a lower need for motorized transport.(6) In the case of Asian cities such as Bandung, the lowest transport energy consumption is reported in the urban core, which is closer to business areas, while the highest transport energy consumption is in peri-urban areas.(7) However, several other factors in cities affect transport energy consumption, such as settlement size,(8) road network pattern,(9) vehicle type and usage,(10) traffic condition(11) and public transportation usage.
Even though there are many studies on this topic, almost all are based on either mega (population of 10 million+) or large cities in high-income countries. In middle- and low-income countries, socioeconomic contexts are different from those in high-income countries. Further, city comparisons often disregard differences in energy prices, which may lead to different energy consumption behaviour. Moreover, almost all previous studies ignore some key factors that may affect the energy consumption, such as city structure (for instance, whether mono-centric or poly-centric), road network patterns, settlement size and vehicle type of each city. In this context, this research addresses two key questions: (1) What are the differences in energy consumption between denser and less dense medium-sized cities where other conditions are similar? (2) What are the underlying factors that may have contributed to higher energy consumption in medium-sized cities? These gaps and questions are addressed in this research.
III. Methodology
a. Study area selection
Thailand has 1,473 cities. The Municipality Act, 1953 classifies municipalities in Thailand into three categories: city municipalities or nakhon, with a population of more than 50,000; town municipalities or muang, with more than 10,000 up to 50,000; and district municipalities or tumbon, with fewer than 10,000. Previous studies have mostly focused on city municipalities. Yet the number and population of town municipalities have grown rapidly in recent decades, and they are expected to be a key dimension of urbanization in Thailand in the future. The focus of this study is on such town municipalities. In order to find two appropriate medium-sized cities with different densities to conduct case studies for this research, we applied the following selection criteria to a large sample of medium-sized cities in Thailand:
Cities close to Bangkok were discarded since their energy consumption might be affected by commuters who are travelling daily back and forth to Bangkok and its vicinity.
The case study areas could not be industrial or tourist cities since such activities might greatly affect the household energy consumption.
The selected cities had to be in the same region with a similar climate since that might influence household energy consumption.
The cities had to have municipality boundaries that covered the majority of their urban area.
The per capita income had to be similar to eliminate the implications of income.
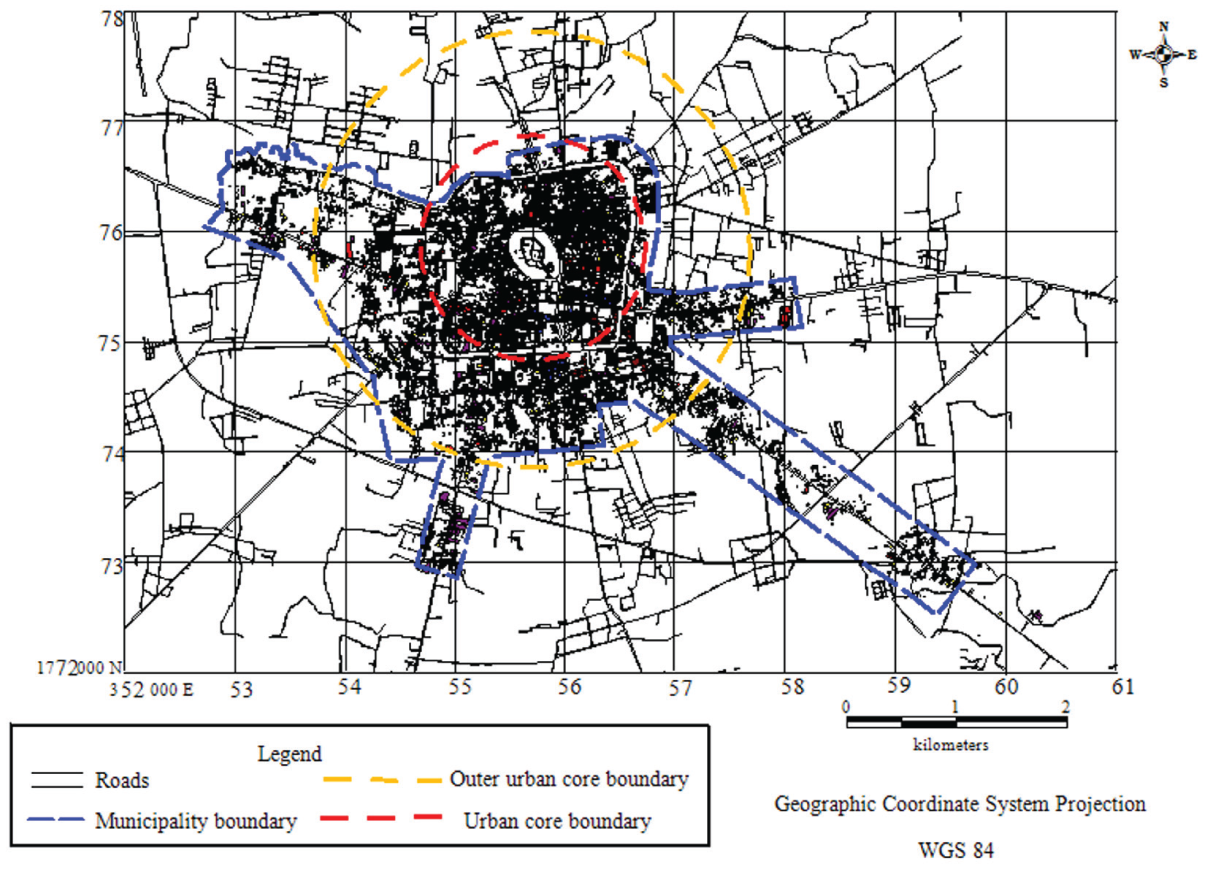
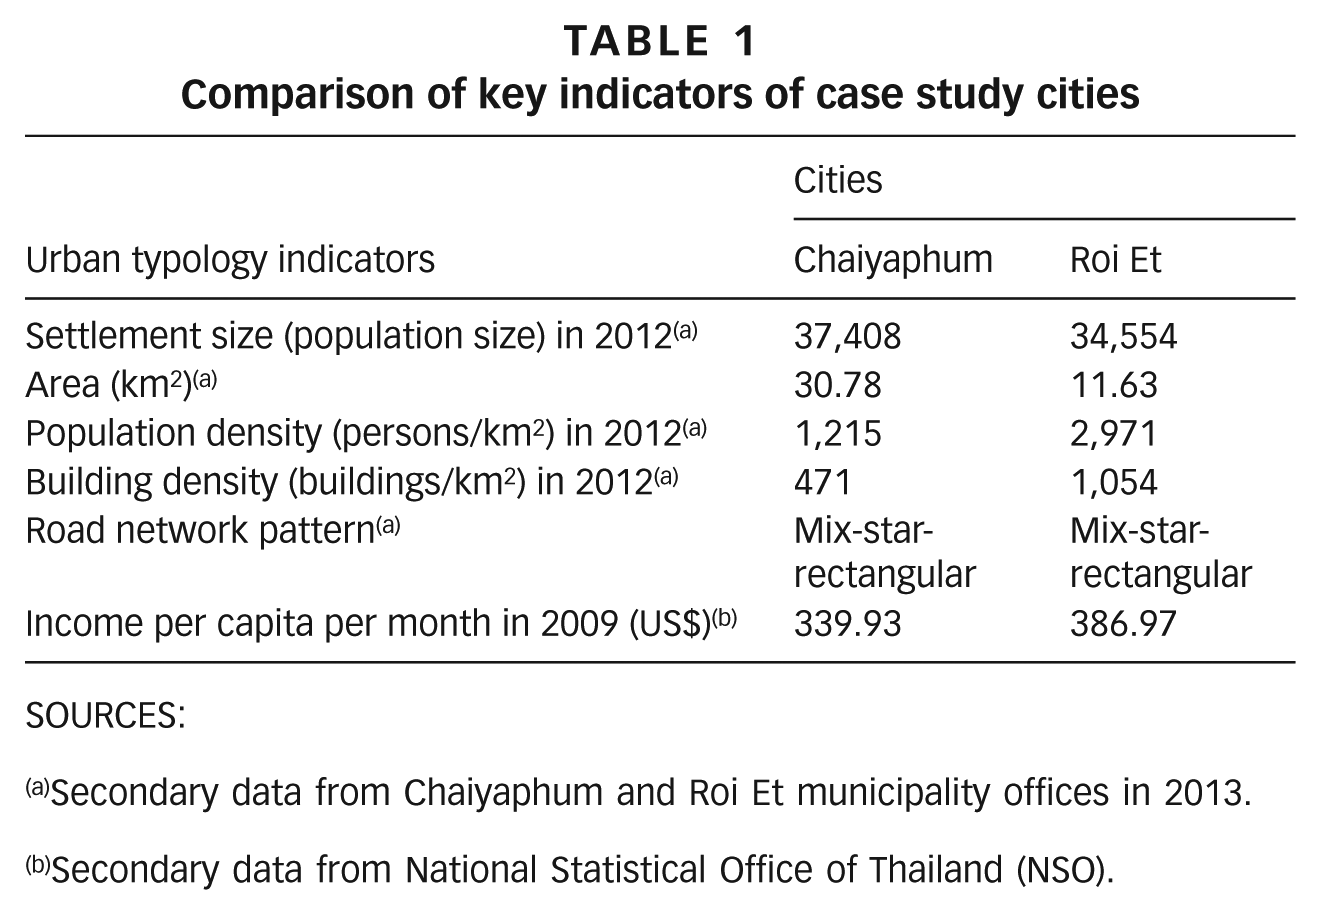
Based on these five criteria, 32 cities were selected from Thailand’s medium-sized cities using cluster analysis. The Chaiyaphum and Roi Et municipality areas were then chosen for this research because of their similarity in road network pattern and population size, but clear difference in population density. The other 30 cities had similar road network patterns but different population sizes, or else were similar in population sizes but had different road network patterns. Maps 1 and 2 are of Chaiyaphum and Roi Et respectively. Table 1 compares key indicators of the two cities.
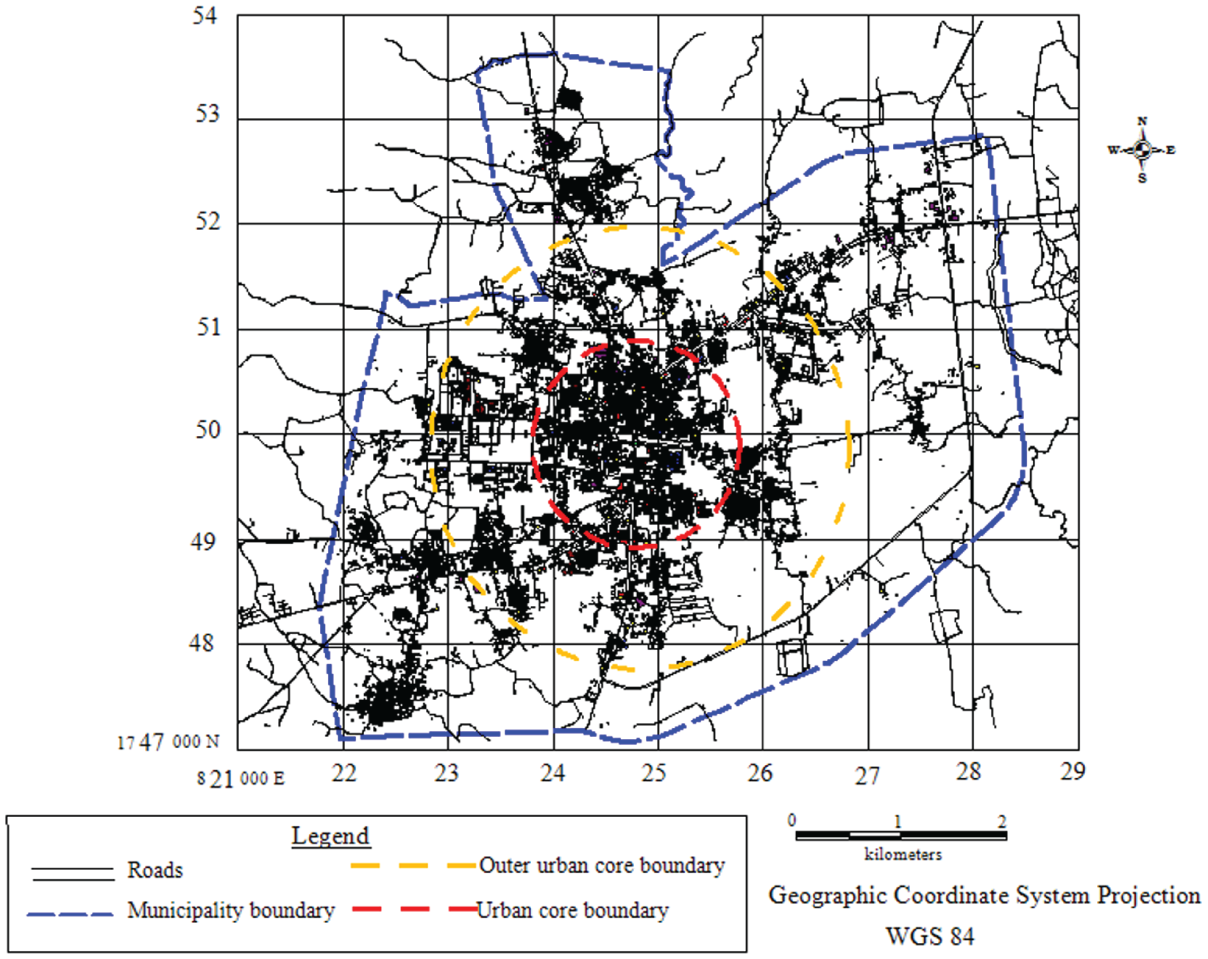
Chaiyaphum city map
Roi Et city map
Comparison of key indicators of case study cities
SOURCES:
Secondary data from Chaiyaphum and Roi Et municipality offices in 2013.
Secondary data from National Statistical Office of Thailand (NSO).
b. Research methodology
The hypothesis to be tested in this study is that the household energy consumption varies with population density in cities. The data were collected through a survey using household questionnaires and other secondary sources in both cities. Households were selected randomly from within purely residential household stock – those households with commercial activities were avoided. This was in order to minimize non-household energy consumption, such as for commercial activities, in the study sample.
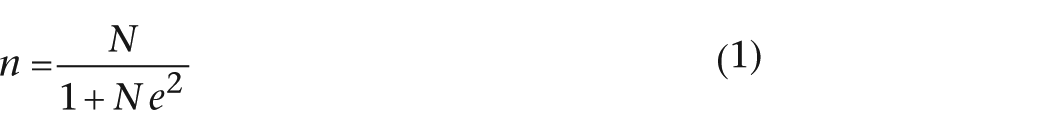
For the survey, the purely residential households were selected based on GIS data obtained from local offices of the Department of Public Works and Town & Country Planning (DPT) in those cities. The GIS data have a specific code for purely residential buildings without possible mixed uses. Based on these data, we estimated the number of purely residential households in Chaiyaphum and Roi Et at 9,869 and 7,436 respectively. Sample sizes were estimated using the Yamane(12) formula, as shown in Equation (1), where n is the sample size, N is the population size, and e is the level of precision.
A 95 per cent confidence level was used, with a 0.05 level of precision. The minimum sample sizes needed were 384 for Chaiyaphum and 380 for Roi Et. In each city, we used samples of 420 households to assure accuracy and account for potential non-response.
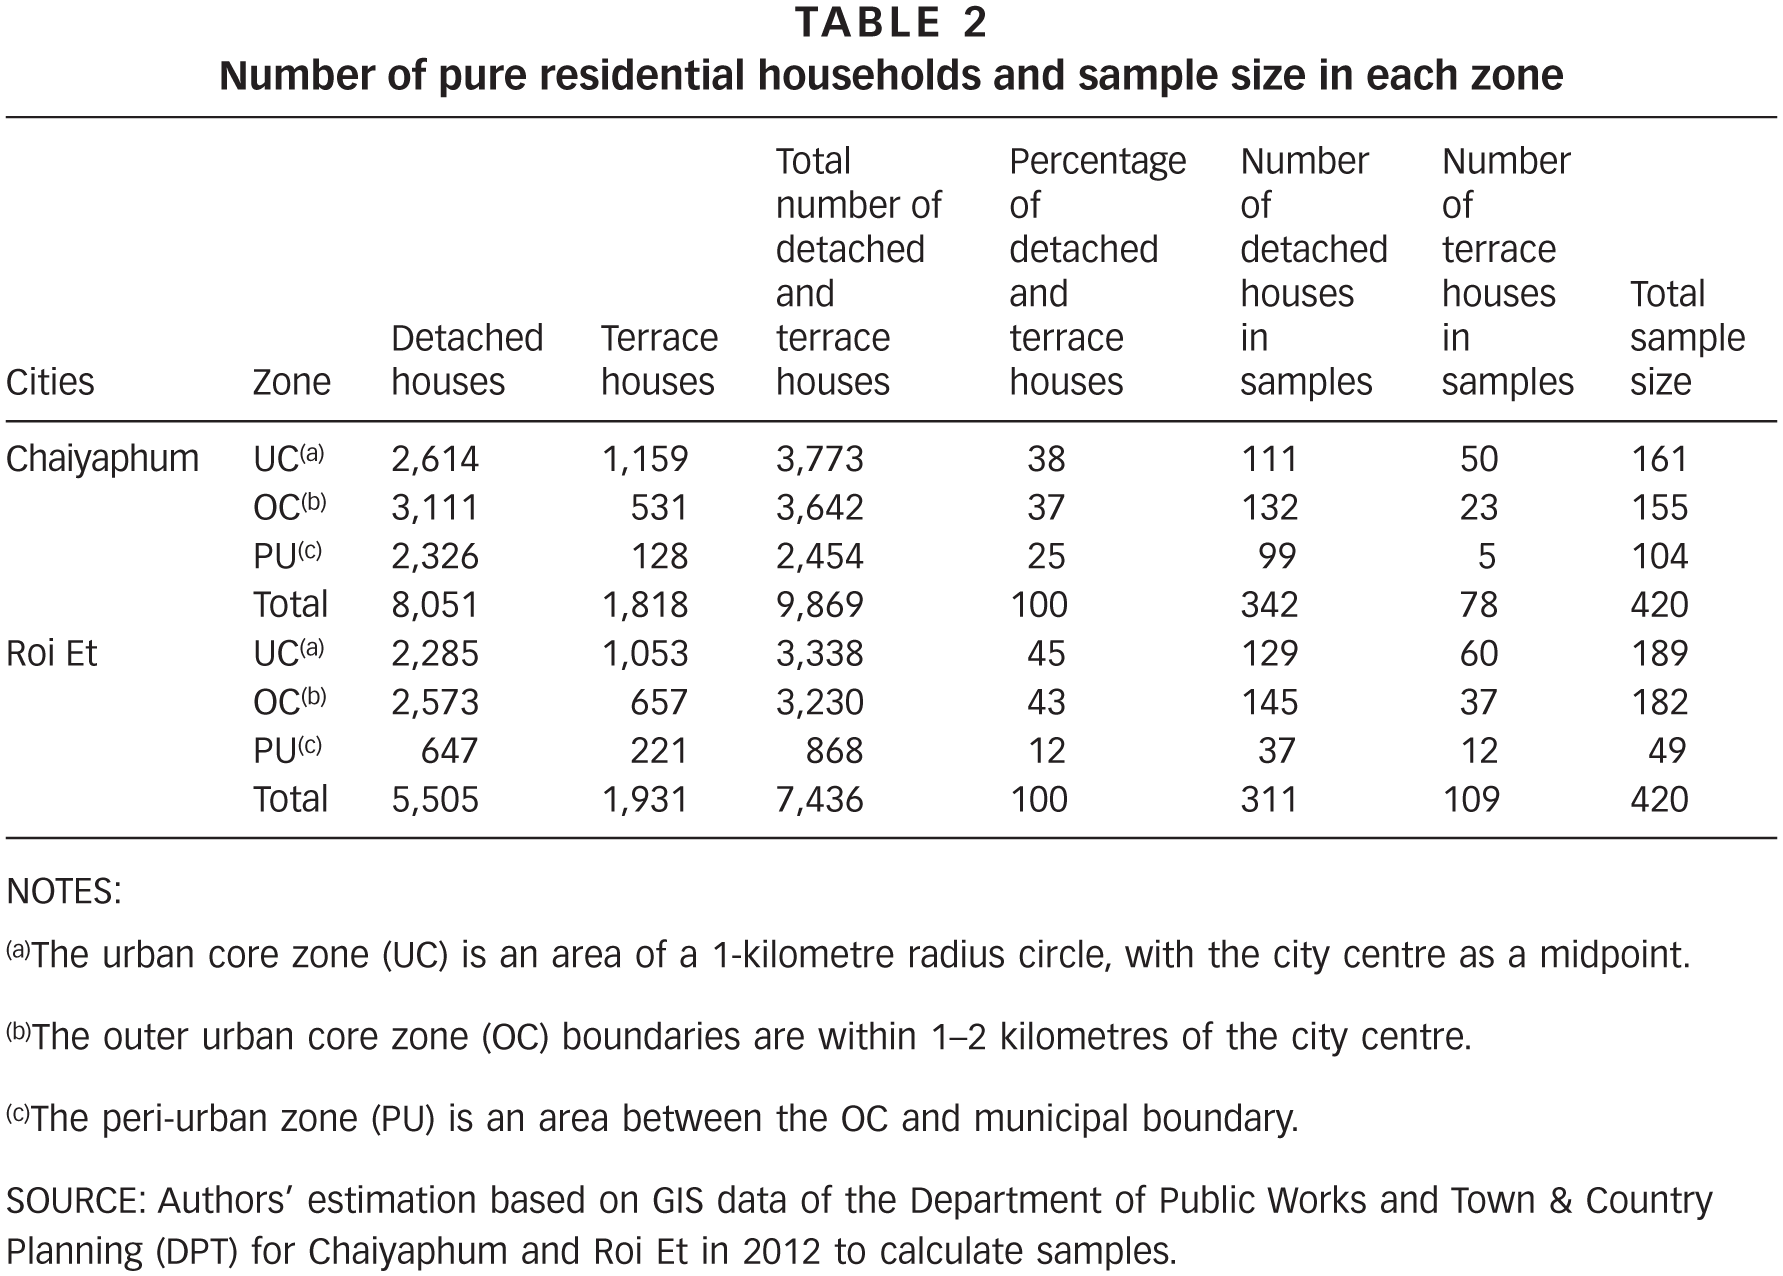
Since the energy consumption of households in the urban core zone (UC), outer urban core zone (OC) and peri-urban zone (PU) could be different, we used the stratified random sampling method to divide the number of sample households proportionally by the different zones.(13) The UC in each case was taken to be a circular area of a 1-kilometre radius, with the city centre as a midpoint. The OC was the area between one and two kilometres of the centre and the PU was the area between the OC and the municipal boundary. Since housing type could affect the electricity consumption patterns, samples were divided into two sets – detached houses and terrace houses, proportionally allocated based on the number of each building type obtained from GIS. The number of purely residential households and the number of households in the survey sample in each zone are shown in Table 2.
Number of pure residential households and sample size in each zone
NOTES:
The urban core zone (UC) is an area of a 1-kilometre radius circle, with the city centre as a midpoint.
The outer urban core zone (OC) boundaries are within 1–2 kilometres of the city centre.
The peri-urban zone (PU) is an area between the OC and municipal boundary.
SOURCE: Authors’ estimation based on GIS data of the Department of Public Works and Town & Country Planning (DPT) for Chaiyaphum and Roi Et in 2012 to calculate samples.
The questionnaire was aimed at obtaining quantitative data on household size, per capita income per month, number and type of vehicles, types of travel destinations, travel distance in kilometres per day (on working days), fuel types, and average fuel cost per month for daily trips within the city limits. The questionnaire also asked about the use (or not) of public transport by households. These data were analysed to estimate transport energy consumption and related aspects.
Annual electricity consumption by households was obtained directly from the local offices of the Provincial Electricity Authority (PEA) in both cities, based on households’ electricity ID numbers obtained during the household survey.
Data related to public transport in cities were obtained from the Department of Land Transport (DLT). Peak hour traffic volume (V; PCU/hr) per road capacity (C; PCU/hr) was obtained from DPT, 2012 GIS maps from DPT, and per capita income per month from the National Statistical Office (NSO). The period of primary data collection was July 2013 to December 2013.
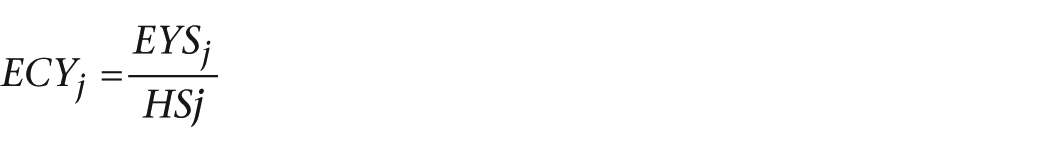
The information from household questionnaires was used to calculate electricity energy consumption and private transport energy on a per capita, per year basis. As mentioned earlier, household electricity consumption per capita per year was estimated for each sample household with data obtained from PEA. The unit of electricity consumption (kWh) was changed to joules per year. Each household within a sample is designated by j. Household electricity consumption per year for each sample household j (EYSj) is divided by the corresponding household size (HSj, from each sample household) to calculate household electricity consumption per capita per year for each sample household. Equation (2) shows household electricity consumption per capita per year of sample household j (ECYj) as:
For estimation of household energy for private transport use, we eliminated the external trips of households away from cities to better capture the effects of urban density on energy. The fuel cost per month of a vehicle i (could be more than one vehicle) for sample j (FCSij) that was obtained from questionnaires was converted to fuel quantity by using prevailing fuel costs (FCij). Then this was converted to energy units using the calorific value of the corresponding fuel type of vehicle i (CVi), obtained from the Department of Alternative Energy Development and Efficiency (DEDE).(14) Equation (3) shows the household energy for private transport per capita per year of sample household j (PTYj) as
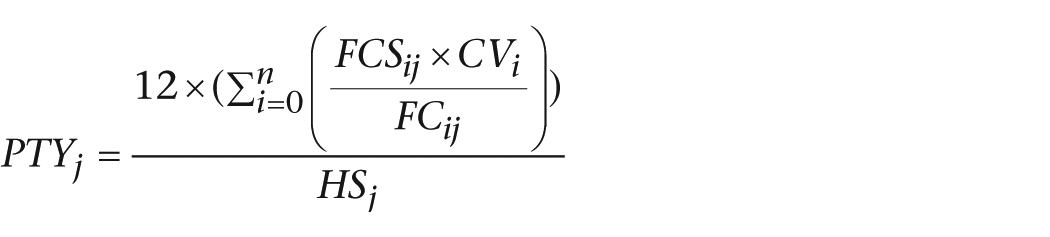
In Equation (3), n is the number of vehicles of sample households.
The mean ECY and PTY of all sample households in the two cities were compared in this study. We used many criteria, as mentioned earlier, to select cities so as to have a minimal effect for variables other than density, including income. Incomes per capita per month in Chaiyaphum and Roi Et were US$ 340 and 387 respectively in 2009, which are quite similar.
However, a number of other intra-urban factors could potentially influence the household transport energy and electricity consumption in these cities. These include house type, household size, extent of public transport usage, vehicle types, travel distances, and level of service (LOS) of roads. Table 3 lists indicators that affect energy consumption in this study.
Socioeconomic, housing and transportation indicators that affect energy consumption in this study
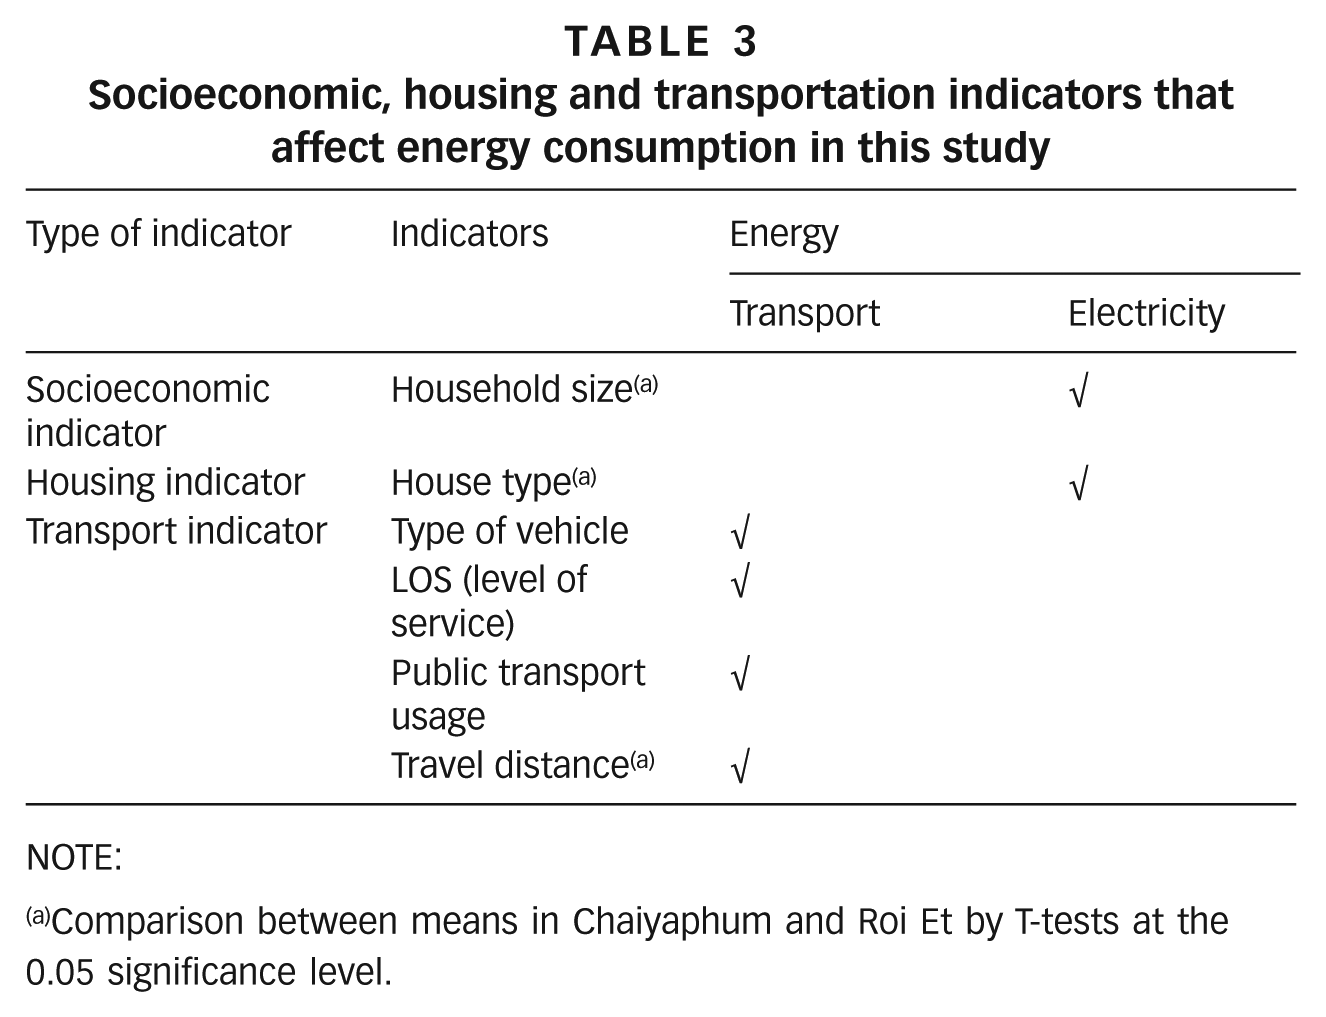
NOTE:
Comparison between means in Chaiyaphum and Roi Et by T-tests at the 0.05 significance level.
LOS affects the quality of traffic conditions. Urban planning in Thailand uses “peak hour traffic volume” per “roadway capacity” ratio (V/C ratio) to represent LOS.(15) The numerical results are represented by letter grades A to F to denote traffic condition. Table 4(16) details the LOS in each range for each letter grade. Table 4 shows the LOS of roads, typical cutoff of V/C, and LOS regime.
LOS of roads, typical cutoff of V/C ratio, and LOS regime
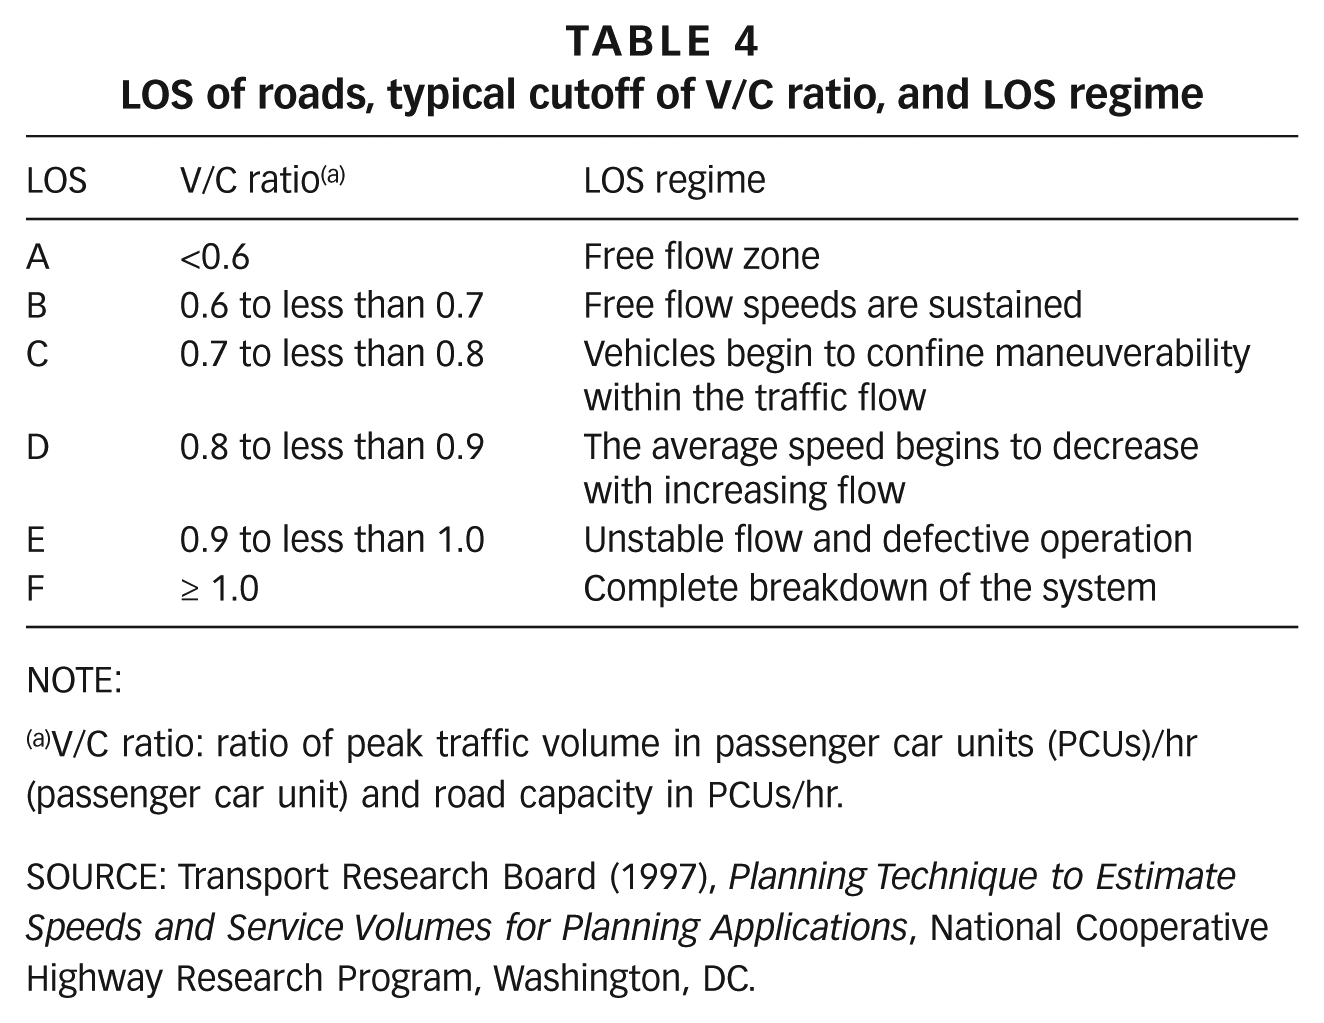
NOTE:
V/C ratio: ratio of peak traffic volume in passenger car units (PCUs)/hr (passenger car unit) and road capacity in PCUs/hr.
SOURCE: Transport Research Board (1997), Planning Technique to Estimate Speeds and Service Volumes for Planning Applications, National Cooperative Highway Research Program, Washington, DC.
In this study, MapInfo Professional 4.5 was used for GIS analysis of DPT data and statistical analysis was done using SPSS Version 20 (statistical package). T-tests, the statistical analysis method that compares the mean of two groups, were used to compare average energy consumption and some of the key indicators of the two cities at 0.05 significance levels.
IV. Results and Discussion
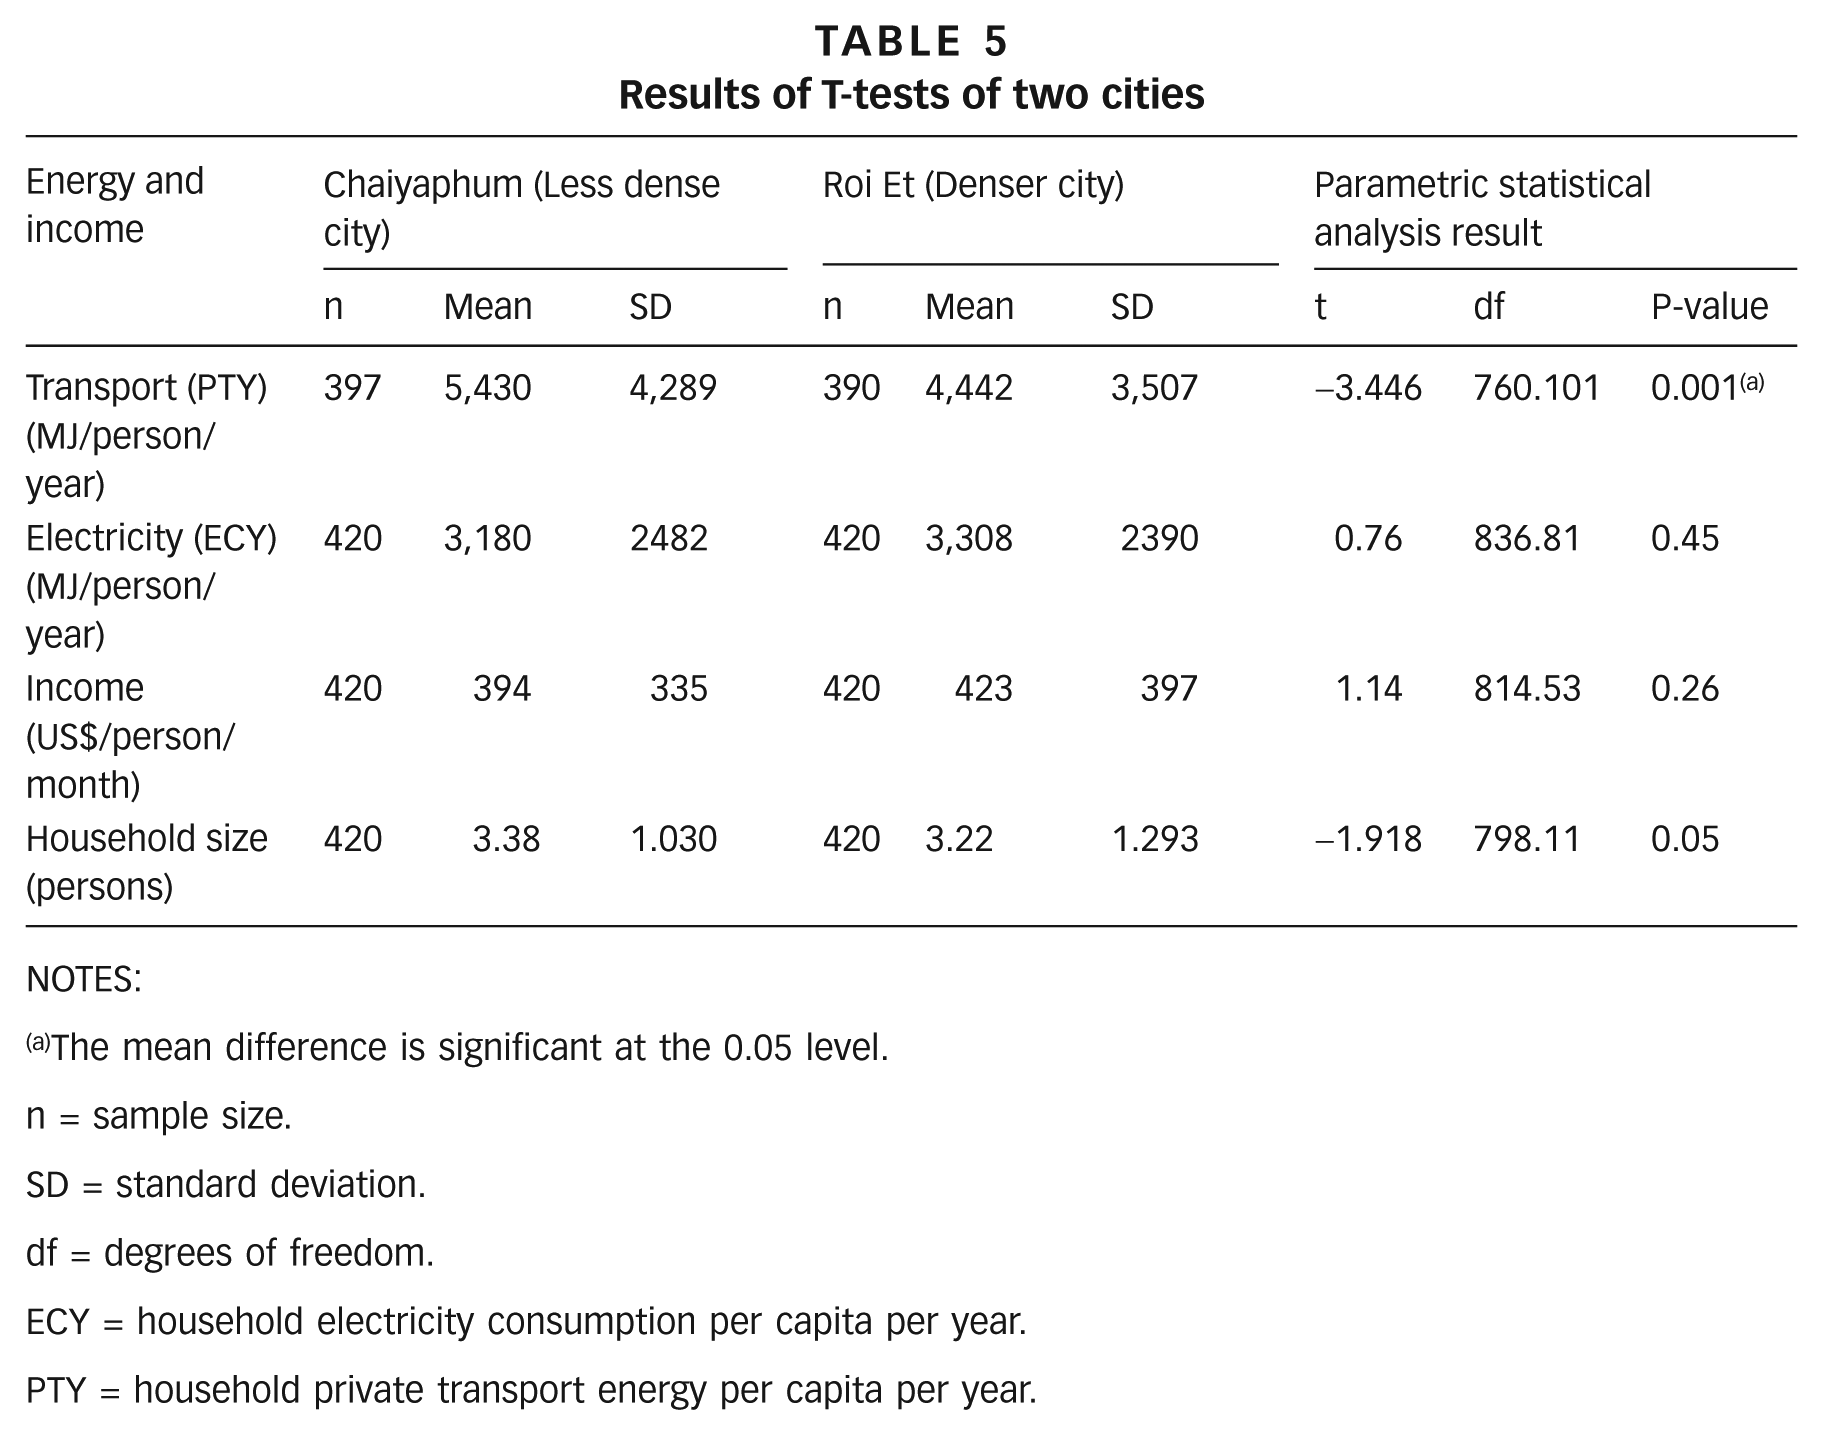
Table 1 shows that the chosen cities in this study have similar per capita incomes, as obtained from published national sources.(17) We further checked the monthly per capita income from our questionnaire, which confirms the national figures. Table 5 shows that income per capita per month of Roi Et and Chaiyaphum is US$ 423 and 394/person/month respectively, and a T-test showed no significant statistical difference. Household electricity consumption and household energy for private transport per capita per year (ECYj and PTYj) were calculated using Equations (2) and (3). T-tests were applied to compare average ECYj for 420 sample households in the two cities. However, for energy analysis of private trips, PTYj, a few households with outbound travel (regular travel beyond the cities) were discarded and the sample size was reduced to 397 for Chaiyaphum and 390 for Roi Et. The results of the T-tests of these two study areas are shown in Table 5.
Results of T-tests of two cities
NOTES:
The mean difference is significant at the 0.05 level.
n = sample size.
SD = standard deviation.
df = degrees of freedom.
ECY = household electricity consumption per capita per year.
PTY = household private transport energy per capita per year.
a. Household electricity consumption per capita per year (ECY)
The estimated mean ECYs of Chaiyaphum and Roi Et are 3,180 and 3,308 MJ per person per year respectively. The results show that ECY of the denser city (Roi Et) is nominally (4 per cent) higher than that of the less dense city (Chaiyaphum), but the mean difference is not significant and is within the acceptable range. We further analysed the differences in household size and the structure of houses in the two cities, which could potentially have affected electricity use. The mean household size of Chaiyaphum (3.38) is slightly higher than in Roi Et (3.22) (Table 5). The result is consistent with the fact that the per capita electricity consumption in a larger household is slightly lower than that of the smaller household, but it is not significantly different.
For implications of house type, data analysis shows that the majority of houses are detached (80 per cent for Chaiyaphum and 73 per cent for Roi Et), followed by terrace houses (18.2 per cent for Chaiyaphum and 26 per cent for Roi Et) (Figures S1 and S2 in the online supplementary material). The mean ECY (MJ per person per year) of terrace houses for these two cities (3,319 Chaiyaphum and 3,352 for Roi Et) is slightly higher than for detached houses (3,179 for Chaiyaphum and 3,292 for Roi Et), but the difference is small (Table S1 in the online supplementary material). Thus, due to these similarities in household size and house type, ECY should have been only nominally affected by these parameters.
b. Household private transport energy per capita per year (PTY)
The estimated mean PTYs of Chaiyaphum and Roi Et are 5,430 and 4,442 MJ/person/year respectively. The results show that PTY of the less dense city, Chaiyaphum (with 1,215 person per km2), is 22 per cent higher than in the denser city, Roi Et (with 2,971 person per km2), where density is 2.4 times greater. We further tested whether a few other factors, which could potentially influence transport energy, were significantly different in these cities, such as structure of vehicles, level of service (LOS) of roads, public transport usage and travel distances. We found little difference in the vehicle types in these cities. Motorcycles contributed 36.5 per cent and 39.5 per cent of vehicle composition (based on the average of recent traffic surveys done at major intersections by DPT) in Chaiyaphum and Roi Et respectively, followed by passenger cars (32.2 per cent and 28.8 per cent). These are similar to the proportions derived from the surveys (motorcycles were 38.7 per cent and 39.9 per cent, and passenger cars are 32.0 per cent and 30.7 per cent for Chaiyaphum and Roi Et respectively) (Figure S3 in the online supplementary material). Based on the similarities in the figures, vehicle type should not meaningfully affect the transport energy consumption in these two cities.
Chaiyaphum does not have local public bus services within the city.(18) Roi Et did have two public bus lines within the city whose fleets were composed of songthaews, small mini-trucks (pickup trucks) with two facing fixed benches;(19) however, their operations closed down due to low profits.(20) The national government tends to prioritize transport development in Bangkok and its surrounding area only.(21) Moreover, the government also had a “first-car policy” that subsidized the purchase of new vehicles for new car owners. This policy made it affordable for medium- to low-income households to buy cars.(22) The other public transport mode in these two cities is non-regular route public transportation using motor-tricycle services, tricycles and motorcycle taxis. From the survey, it was observed that a small percentage (about 10.3 for Chaiyaphum and 11.7 for Roi Et) of sample households in these cities use public transport and therefore any differences would have been minimal in terms of energy consumption.
For LOS, from the database of DPT for Chaiyaphum and Roi Et, the mean V/C ratio of roads in Chaiyaphum is 0.45, while in Roi Et it is 0.38 (Table S2 in the online supplementary material). The LOS of both cities is Level A – in other words, the overall traffic qualities of both cities are good and therefore, their implications for differences in energy consumption would be minimal.
Transport energy consumption is a function of vehicle kilometres travelled (VKT) of a vehicle per day. The radii of UC and OC are 1 kilometre and 2 kilometres from the city centres respectively. From data analysis, it can be seen that the mean VKTs of these two cities in the urban core (UC) and the outer urban core (OC) are not very different. However, the mean VKT between cities shows significant differences for the peri-urban (PU) areas. The mean VKT of passenger cars for the PU in Chaiyaphum is 8.21 kilometres/day, while it is 6.78 for Roi Et, approximately 21 per cent lower than in Chaiyaphum. The mean VKT of mini-trucks of PU in Chaiyaphum is 7.18 kilometres while it is 6.15 kilometres in Roi Et, or about 17 per cent lower than in Chaiyaphum. Similarly, the mean VKT of motorcycles of PU in Chaiyaphum is 6.32 kilometres and in Roi Et 5.58 kilometres, about 13 per cent lower than in Chaiyaphum (Table S3 and Figure S4 in the online supplementary material). This is mainly due to the structural dissimilarities of the two cities, particularly in PU areas.
Maps 1 and 2 show that building density in Roi Et within UC and OC (2 kilometres) is higher, and the majority of buildings, even in PU, are located within 3 kilometres of the city centre. The buildings of the PU in Chaiyaphum, however, are dispersed over larger distances from the city centre. Therefore, travel distances of households that live in the PU in Chaiyaphum are greater than in Roi Et, and this is a key source of higher private transport energy demand. GIS data from DPT in Table 2 also support this result, indicating that the majority of detached and terrace houses in Roi Et are located within UC (45 per cent) and OC (43 per cent), and fewer in PU (12 per cent), while the residential buildings in Chaiyaphum are more dispersed in the UC and OC zones (38 per cent for UC, 37 per cent for OC and 25 per cent for PU).
V. Comparison of Household Energy Consumption with other Cities
Data for ECYs and PTYs for other cities exist primarily for large or mega cities whose characteristics are far different from those of smaller-size cities. Therefore comparison with data from this study is difficult. However, efforts have been made here to make comparisons in order to check whether the results of this study are within a plausible range. Figure 3 shows that the ECYs of Chaiyaphum and Roi Et are about 75 per cent and 78 per cent, respectively, of that for Bangkok. Moreover, they are only about 34 per cent and 36 per cent, respectively, when compared to Tokyo. It makes sense that the ECY of Chaiyaphum and Roi Et should clearly be lower than in Bangkok and Tokyo based on the differences in income per capita.
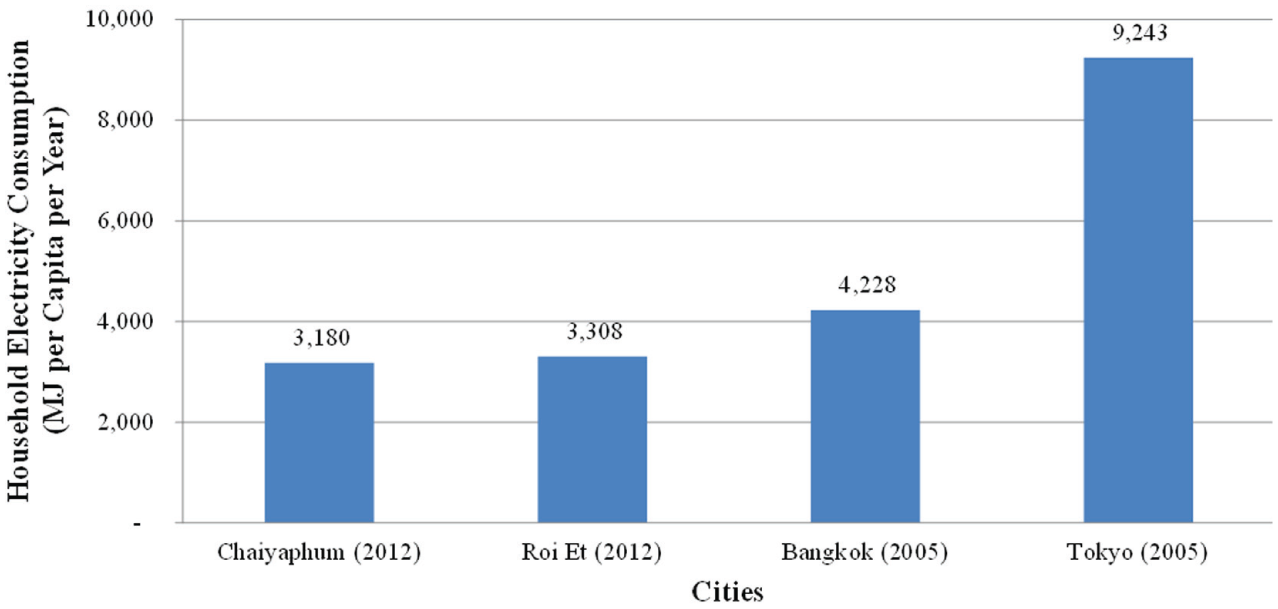
Comparison of ECYs of Chaiyaphum, Roi Et, Bangkok and Tokyo
The PTYs of Chaiyaphum and Roi Et in 2013 are compared with those for Singapore/Hong Kong, European cities, Canadian cities, Australian cities, and US cities in Figure 4, and again are lower owing to their differences in income per capita.
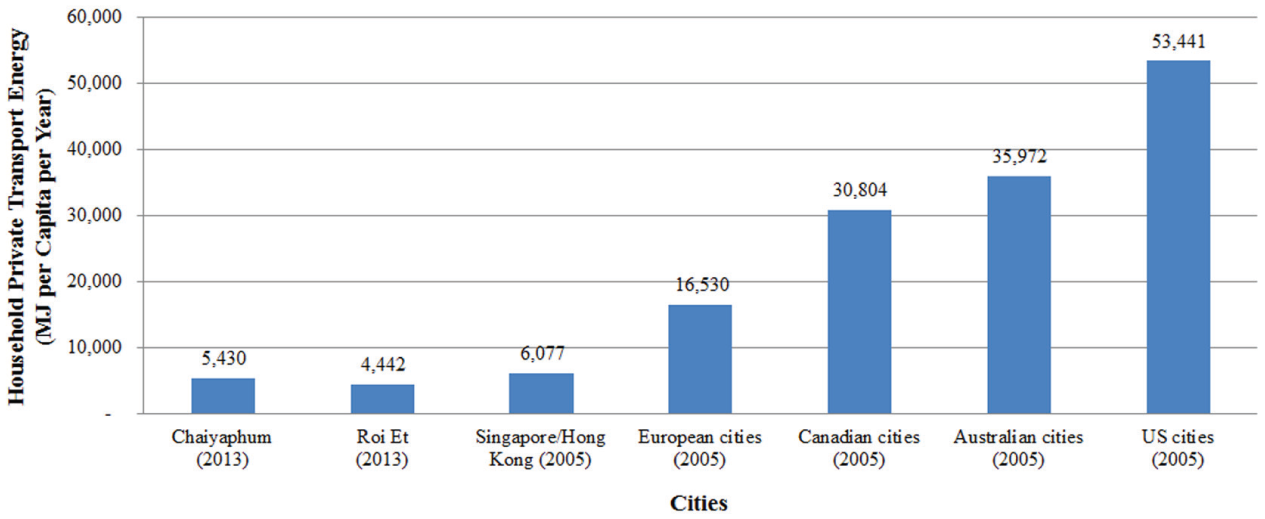
Comparison of PTYs with other cities
Average income per capita per month for Chaiyaphum, Roi Et, Bangkok, the European Union, Hong Kong, Canada, Singapore, the US, Tokyo and Australia is shown in Figure 5.
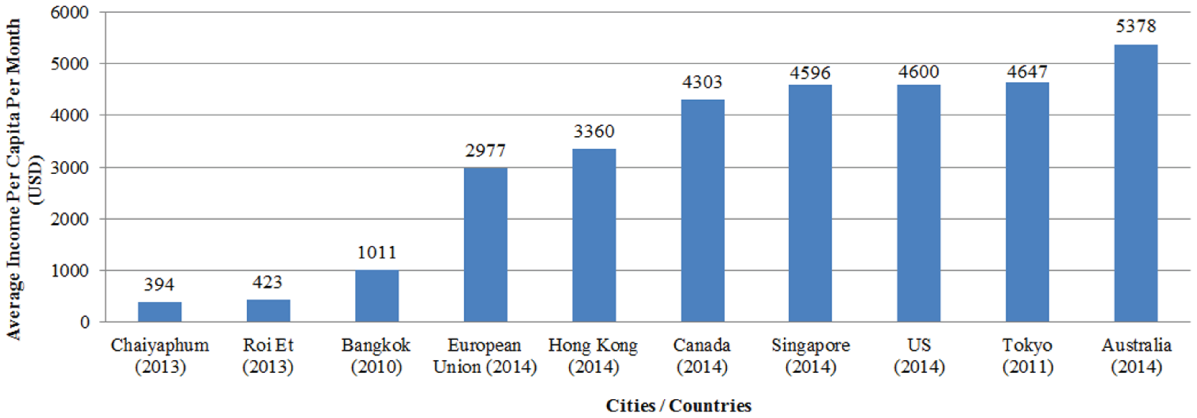
Comparison of average income per capita per month with other areas
VI. Conclusions
In this research, we estimated and compared the energy consumption in two similar medium-sized cities in Thailand with markedly different population densities to understand the effect of density. It was found that the differences are nominal for the per capita household electricity consumption per year between the less dense city Chaiyaphum and the more dense city Roi Et (the population density of Roi Et is 2.44 times that of Chaiyaphum). However, the household private transport energy per capita per year showed a clear difference between these cities, with Roi Et having 21 per cent lower transport energy consumption than Chaiyaphum. We analysed a number of indicators to explain the origin of this difference. The main reason for this was found to be the longer travel distances in peri-urban areas within the municipal boundaries in Chaiyaphum. The average travel distances of passenger cars, mini-trucks and motorcycles in peri-urban areas of Roi Et are lower than those in Chaiyaphum by about 21, 17, and 13 per cent respectively. A few past studies have reported significant effects of urban density on per capita household electricity consumption. However, we could not find much difference in this regard in our case study cities.
Our results add to the available case studies on implications of urban density on energy consumption, and to global knowledge on this topic. There has been little evidence and analysis in this regard for medium and small-sized cities globally. Our results have also important policy implications for Thailand, which is rapidly urbanizing, and where there are dynamic transformations in medium-sized cities. As of yet, urban planners have not considered density issues in relation to public transport and energy, which are further linked to affordable and efficient public transport services as well as to other key policies, namely energy security and climate change mitigation. Policy discussions of urban densification in Thailand have largely centred on Bangkok. This study provides evidence for better transport energy performance of denser medium-sized cities, and we hope it will spur further studies and discussions in Thailand.
Our findings suggest that urban planning and development in Thailand should promote high-density residential projects in the urban core of cities, something that currently receives no support. This could be done through incentives such as land tax exemptions for high-density residential building construction or for brownfield developments. Tools such as land use planning can promote the development of high-density residential buildings and also control urban density in the peri-urban zone through land use control mechanisms. Local governments’ support to urban development projects in urban core areas is possible by investing in such developments. Legal and institutional frameworks are other necessities to encourage this type of development.
Footnotes
1.
UN (2005), World Urbanization Prospects: The 2005 Revision, page 1, available at ![]() .
.
3.
Fabric heat loss is heat loss through the external building envelope such as external walls, windows, roof, etc. See http://www.leedsbeckett.ac.uk/teaching/vsite/low_carbon_housing/resources/heatloss-worksheet.pdf, accessed 15 May 2016; also Steemers, K (2003), “Energy and the city: density, buildings and transport”, Energy and Buildings Vol 35, No 1, pages 3–14.
4.
Kongsin, S (2006), “A guideline for compact city development towards energy saving strategy: A case study on Bangkok metropolis”, Master of urban planning thesis, King Mongkut’s Institute of Technology Ladkrabang, Bangkok, 137 pages.
5.
Wijaya, M E and T Tezuka (2013), “A comparative study of households’ electricity consumption characteristics in Indonesia: A techno-socioeconomic analysis”, Energy for Sustainable Development Vol 16, No 6, pages 596–604.
6.
Newman, P and J Kenworthy (1989), Cities and Automobile Dependence: An International Sourcebook, Gower, 388 pages.
7.
Permana, A S, R Perera and S Kumar (2008), “Understanding energy consumption pattern of households in different urban development forms: A comparative study in Bandung City, Indonesia”, Energy Policy Vol 36, No 11, pages 4287–4297.
8.
9.
Marshall, W and N Garrick (2010), “The effect of street network design on walking and biking”, The 89th Annual Meeting of Transportation Research Board, Washington, DC, 10–14 January.
10.
Howey, D A, R F Martinez-Botas, B Cussons and L Lytton (2009), “Comparative measurements of the energy consumption of 51 electric, hybrid and internal combustion engine vehicles”, Transportation Research Part D: Transport and Environment Vol 16, No 6, pages 459–464.
11.
Barth, M and K Boriboonsomsin (2008), “Real-World Carbon Dioxide Impacts of Traffic Congestion”, Transportation Research Record Vol 2058, pages 163–171, available at ![]() .
.
12.
Yamane, T (1967), Statistics: An Introductory Analysis, Second edition, Happer and Row, New York, 919 pages.
13.
Miah, Md. Abdul Quader (1993), Applied statistics: a course handbook for human settlements planning, Darnsutha Oress Co., Ltd., Bangkok, 384 pages.
14.
15.
DPT (2006), Criteria and standard for comprehensive plan, accessed 2 June 2016, available at ![]() .
.
16.
17.
National Statistical Office (n.d.), Income per capita per month of people in Thailand’s cities, accessed 8 March 2016 at ![]() .
.
18.
Office of Land Transport, Chaiyaphum Province (n.d.), Statistical data of public transportation business in Chaiyaphum City in 2011, accessed 11 January 2015 at http://chaiyaphum.dlt.go.th/index.php?view=article&catid=69%3A2012-07-11-08-27-05&id=200%3A2012-07-11-08-29-17&option=com_content&Itemid=100.
19.
Office of Land Transport, Roi Et Province (n.d.), Statistical data of public transportation business in Roi Et city in 2012, accessed 11 January 2015 at ![]() , accessed 11 January 2015.
, accessed 11 January 2015.
20.
Good Governance Committee, Roi Et Province (2014), “Public transportation in Roi Et progress in 2014”, 9 April, accessed 20 February 2015 at https://www.facebook.com/permalink.php?story_fbid=557296414384739&id=254022724712111.
21.
Fernquest, Jon (2015), “Transportation challenge of 2015: Trains, trains, trains…”, Bangkok Post, 6 January, accessed 20 February 2015 at ![]() .
.
22.
Maierbrugger, Arno (2013), “Thailand’s First-Car Buyer Incentive Scheme A Failure”, Investvine, 2 August, accessed 20 February 2015 at ![]() .
.
References
Supplementary Material
Please find the following supplemental material available below.
For Open Access articles published under a Creative Commons License, all supplemental material carries the same license as the article it is associated with.
For non-Open Access articles published, all supplemental material carries a non-exclusive license, and permission requests for re-use of supplemental material or any part of supplemental material shall be sent directly to the copyright owner as specified in the copyright notice associated with the article.