
Abstract
An empirical analysis of the lived experiences of more than 2,000 households in different Bangalore slums shows how migration patterns, living conditions, livelihood strategies and prospects for the future vary widely across distinct types of slums that were initially identified from satellite images and studied over a 10-year period. Shocks and responses vary in nature and intensity, and coping and accumulative strategies diverge across slum types. More fine-grained policy analyses that recognize this diversity of slum types will help people deal with shocks and increase resilience more effectively.
Keywords
I. Introduction
As slums have continued to expand across Indian cities, official and scholarly attention has grown rapidly in recent years. For the first time, the Census of India 2011 presented separate estimates of the population in slums,(1) and recent reports from other official agencies have also added much-needed knowledge about slums and slum dwellers.(2) Scholarship, which previously focused mostly on rural poverty, has more recently been restoring the balance by looking at poverty in urban slums.
Considerable gaps in knowledge remain, however, with that described below being especially important:
Official agencies also acknowledge only two broad types of slums: officially declared (“notified” or “recognized”) slums, and a second omnibus category that includes all other low-income settlements.(3) Vast differences characterize conditions between slums of different types, and these differences are poorly captured by these gross distinctions. Notified slums differ depending on their age and location. Even larger differences exist within the unwieldy category of non-notified slums, which cover a spectrum of habitations from makeshift tent structures to multi-storeyed concrete buildings. Official definitions focus, however, on poorly constructed temporary structures and inadequate infrastructure.(4) Little is gained (and much is lost) by considering slums as a homogenous category of settlements or even by sticking to the gross distinction between notified and non-notified types. Constructing better subordinate classifications is necessary for developing more useful and cost-effective policy interventions.
These concerns are being addressed by a research project we initiated in 2010 in Bangalore in collaboration with the non-profit agency, Jana Urban Foundation.(7) Comparing high-resolution satellite images over a 10-year period, supported by extensive verification on the ground and detailed household surveys, helped distinguish initially between four types of slums.(8) We present here a comparison between the poorest and the best-off slums.(9)
II. Methodology: Satellite Imagery with Iterative Ground Verification Exercises
Despairing of the poor state of knowledge, particularly regarding slum locations and boundaries, investigators have turned recently to remote-sensing techniques.(10) Our work in Bangalore extends this trend by comparing Google Earth images over a 10-year time horizon to help achieve the following objectives:
identifying low-income settlements and detecting newly formed slums;
tracking changing slum boundaries;
distinguishing types of slums; and
geo-referencing sample households with the intention of re-interviewing them at regular intervals (since addresses within slums are notoriously hard to locate, with street names and street alignments changing frequently).
The decision to explore Google Earth images was taken after an initial round of surveys in 2010 within 14 slum settlements selected at random from among the list of notified slums provided by the Karnataka Slum Development Board (KSDB). These settlements were categorized according to a number of parameters, including years in existence, distance from commercial hubs, poverty ranking as determined by local experts, and social and religious composition. Field investigations were carried out by a local team, several among whom lived within similar slum communities. Every sixth household was selected for interview and only a few refused. Mostly, an adult female was interviewed.(11)
Detailed interviews with 1,481 households in these 14 notified settlements showed that they represented the tip of a vast iceberg, home not so much to the poorest as to a settled lower-middle class, most of whom had lived in Bangalore for multiple generations. These slums are furthest from the official definition, with permanent constructions prevailing and electricity connections and clean drinking water commonly available. Poverty is low compared to the city average (14 per cent as against 26 per cent estimated for urban Karnataka by the officially appointed Tendulkar Committee). In terms of assets, income and prevalence of poverty, notified slum dwellers are near the middle of the city’s socioeconomic spectrum. Nearly every household owns a kerosene or gas stove; 80 per cent own television sets, pressure cookers and electric fans; and two-thirds own mobile phones. Education and home ownership are the highest spending priorities. Nearly all children go to school, most staying on through high school.
But there are other types of slums, where conditions are “slummier” and people are poorer. Blue polygon slums (discussed below) fulfil all the conditions specified in the official definition for enumeration for the Census of India: “A compact area of at least 300 population or about 60–70 households of poorly built congested tenements, in unhygienic environment usually with inadequate infrastructure and lacking in proper sanitary and drinking water facilities.”(12) Intermediate slum types are progressively better off in relation to one or more of these conditions. But since the worse slum types rarely form part of government records or city maps, they are harder to pin down, far less investigate.
Hardly anyone living in the notified slums is newly arrived in Bangalore. In fewer than 10 per cent of interviewed households was the adult male (or female) a first generation migrant; 10 per cent are second generation Bangalore residents; nine per cent are third generation residents; and more than 70 per cent have lived in Bangalore for four or more generations. So where do new migrants go when they come to Bangalore, as so many do year after year? Where do the poorest people live, if not in slums? How does one locate these places? Since existing data sources are of little help, new reliable methods of data collection are needed.
We began our exercise by dividing the area administered by the municipal authority, the Bruhat Bangalore Mahanagara Palike (BBMP),(13) into four equal-sized quadrants on a map of Bangalore drawn on Google Earth(14) and identifying settlements (or polygons) that could then be ground-verified quadrant by quadrant. For most settlements, satellite images start in 2000 although some only have images dating back to 2002 or 2004. The majority have an updated 2011 image but some only have images dating back to 2010. The first year with a satellite image was referred to as the “initial year” and the most recent year as the “final year”, allowing us to measure and compare average changes per year in settlement size, housing stock quality and housing density. Settlements were compared at an altitude of 4,000 feet.
Based on the following initial identification criteria, 279 low-income polygons were identified at the start:
limited space between shelter units;(15)
brown or grey roofs (suggesting weathered and low-quality materials);
a jumbled pattern of units;
a lack of proper roads (roads, if they exist, are brown, narrow and unpaved); and
a lack of shadows next to the shelter units, signifying that they are low to the ground, not multi-storey.
Iterative ground verification exercises improved our ability to accurately identify low-income and very low-income settlements and led us to conclude that the most important criteria for this were small shelter unit size and a lack of space between them. Also useful as supporting criteria were unpaved roads, if visible (however, paved roads are not an indication that a settlement is not low-income); narrow inner roads, if visible;(16) and brown roofs. Before operationalizing these stripped-down criteria, we looked again at satellite images of settlements that we had categorized as “very low-income” side by side with those categorized just as “low-income”. Figures 1A and 1B show an example of each type. On-the-ground verifications of these and other identified low- and very low-income settlements showed that our criteria were reliable in distinguishing between these two types of slums.
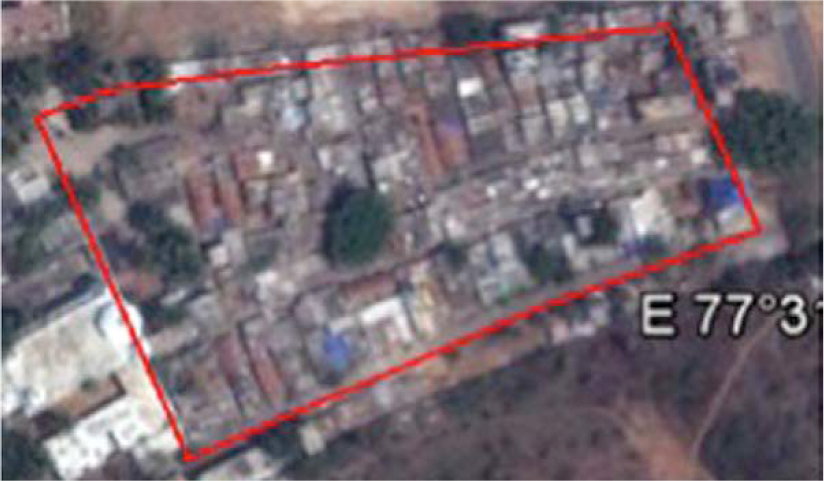
The very low-income settlement of Khata Nagar A (orange polygon)
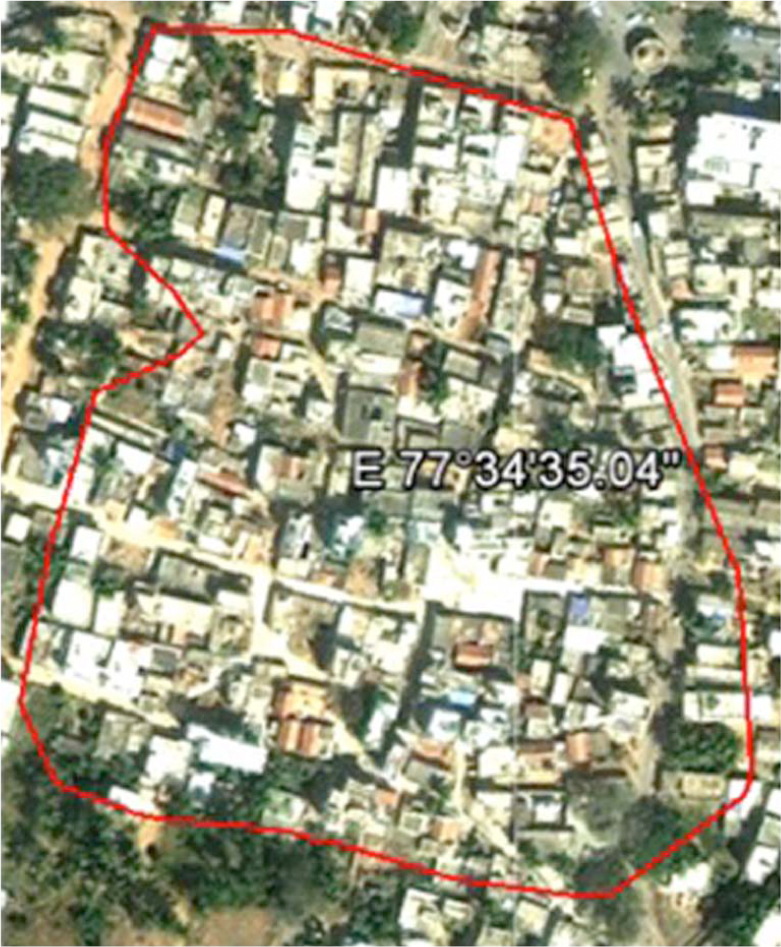
The low-income settlement of Kodigehalli (red polygon)
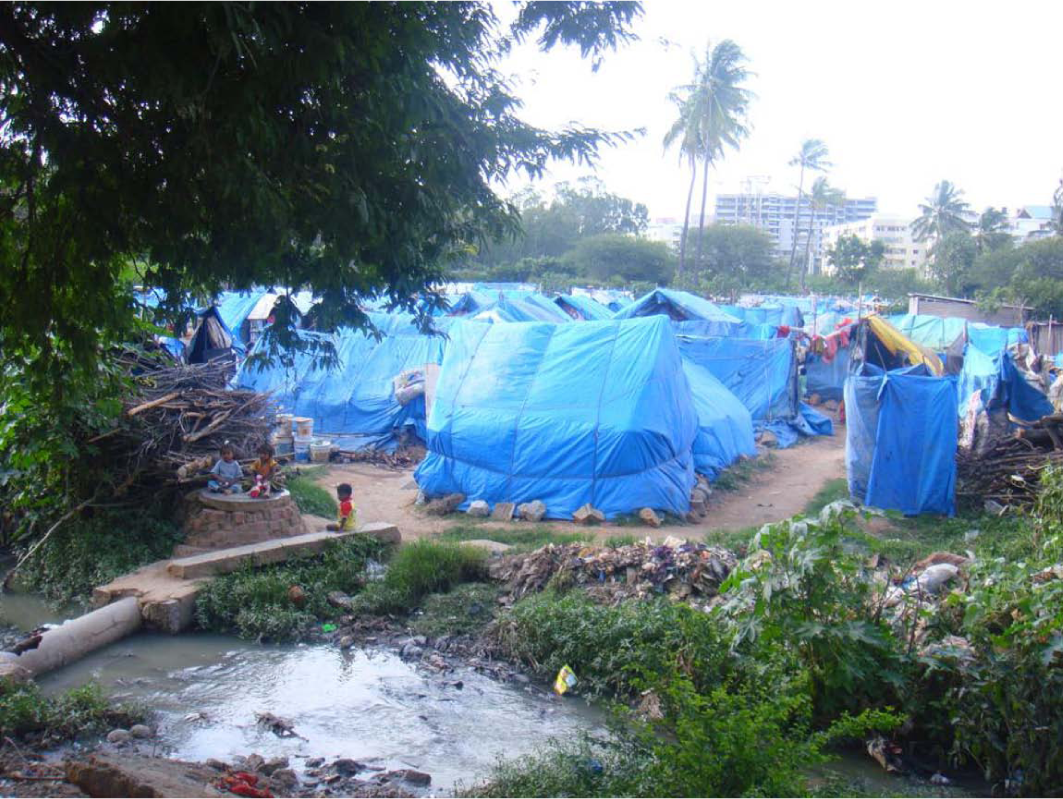
A third and still lower-income category of settlement was identified based on our initial field visits, when we understood that new settlers lived mostly in temporary settlements, in shelters with roofs that generally consisted of blue plastic sheeting (referred to as tarpaulins).(17) Recurrent observations to this effect provided criteria for identifying the poorest settlements. Using the time slider feature on Google Earth, we noticed that these settlements had mostly emerged within the past few years although some had been around for longer, growing in size over the 10-year period observed. The ground-truthed criteria that we used to identify these first generation settlements on satellite images were small shelter unit size, blue roofs and recent establishment or expansion.
Figures 2A, 2B and 2C show examples of this type of settlement, and comparisons of the before and after images indicate the rapid pace at which they come into existence.
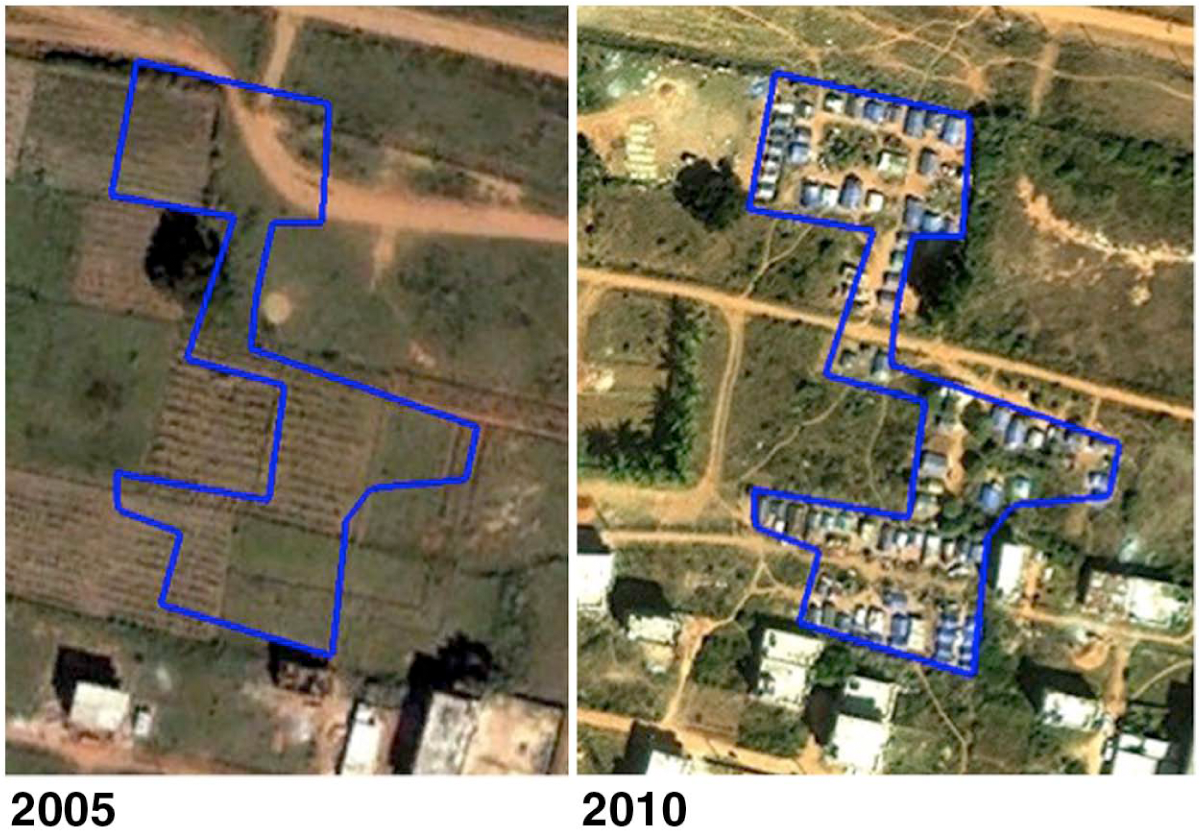
Example of a blue polygon: Quadrant II – Atturu
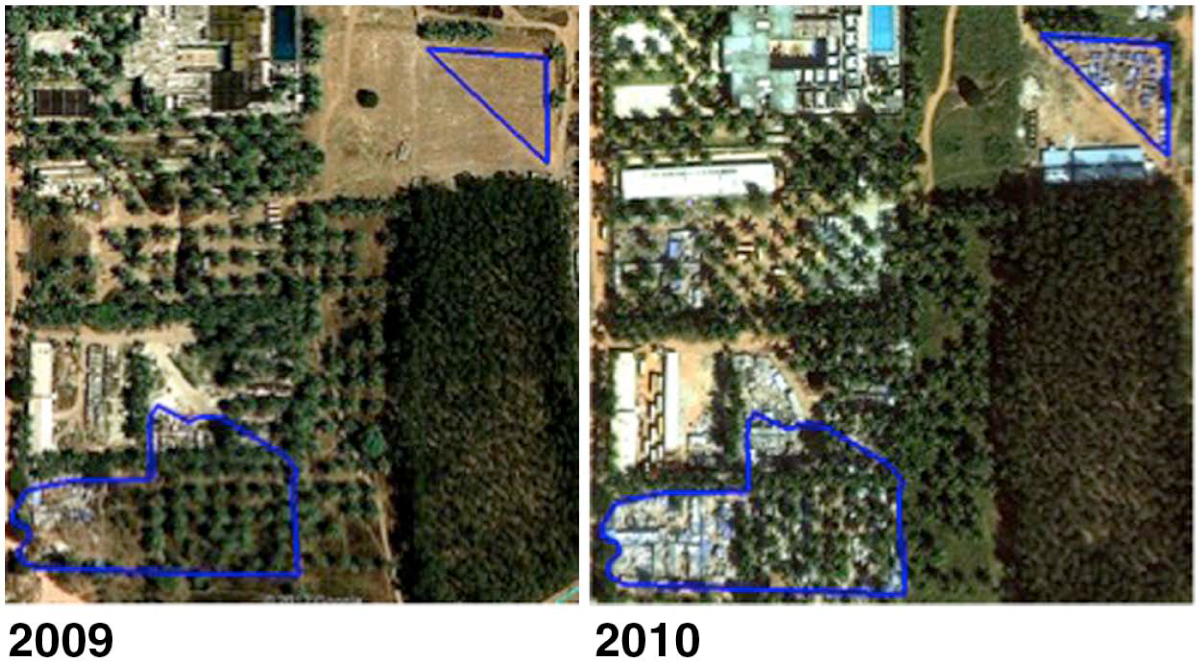
Examples of blue polygons: Quadrant IV – Manjunatha Layout A* and Layout B*. The two polygons expanded into the intervening space to become one large expanse of blue tarpaulins by 2013
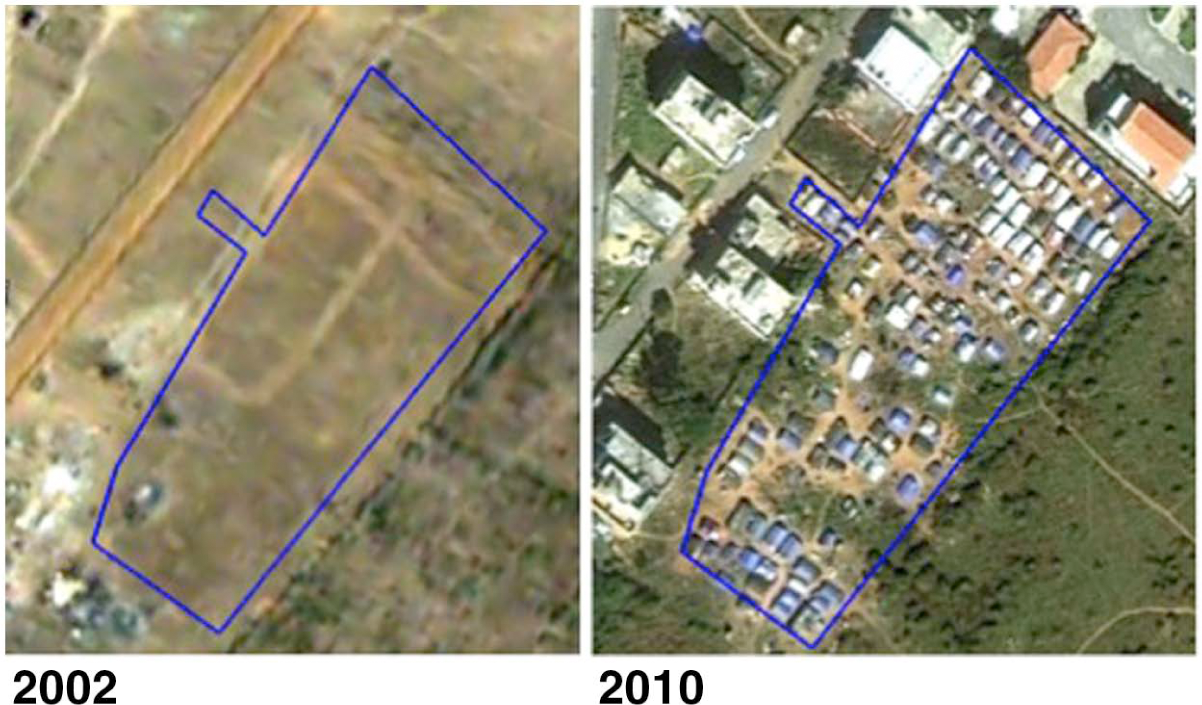
Example of a blue polygon: Quadrant I – Hudi
We identified 61 such settlements in all and ground verification showed these initial identifications to be accurate in the vast majority of cases. Eight settlements no longer exist, either because of relocation or an error in identification, and some newer settlements have likely come into being since the most recent satellite image data. Thus, our methodology is subject to errors of omission, but no false positives were revealed.
In all, three types of slum settlement were discerned through this process: new migrants (blue polygons – Figures 2A/2B/2C); very low-income settlements (orange polygons – Figure 1A); and low-income settlements (red polygons – Figure 1B). Each differs in important respects from the other two, and all differ from notified and recognized slums, the fourth type of settlement.
In the rest of this paper, we present a comparison of the two extremes of this hierarchy – first generation settlements (blue polygons) and fourth generation slums, the notified list of KSDB. Since detailed field surveys have only recently been initiated in the other types of settlements (red and orange), we have little further to say here about them, except to remark that the distinctions detected between them have proved robust in initial field verifications.
We undertook detailed investigations in a randomly selected sample of 18 first generation settlements between August and December 2012, conducting interviews with 631 households – which represented just over half of all households then living within these settlements. Households were selected at random (every second household starting from a common point), although contact with some households proved impossible despite repeat visits. Residents were suspicious of outsiders and appeals to local leaders or the landowners were often necessary to gain entry. However, once initial doubts had been allayed, interviews proceeded with ease and there were hardly any refusals.
III. First Generation Slums: “We are only Here to Settle our Village Debts”
First generation slums – blue polygons – are first generation both in terms of being newly established and in relation to the duration of the residents’ association with Bangalore. They are home to recent migrants from rural areas, mostly from northern Karnataka and the adjoining state of Andhra Pradesh, although a few have come from as far away as West Bengal and Uttar Pradesh. These slum residents retain strong links with their native villages, going back and forth often, with many families split between the two locations. The development of this type of slum is in considerable part a response to diminished and uncertain rural livelihoods. Agrarian crises brought on by droughts and erratic rainfall and the consequent need to pay off accumulated debts are a primary reason for coming to the city.
The typical abode is a 7x7-foot tent erected on land rented from a private owner and shared by families of three to five individuals. Some of these settlements are on construction sites (with residents working as labour), while other sites, pending the granting of building permits, have been let out temporarily to migrants. Occupants pay rent in cash and “under the table” every month, never knowing when they might be evicted; there are certainly no written leases. Monthly rents range from Rs. 200–400 (roughly US$ 3–6 at the time of writing), with more distant migrants paying larger amounts, particularly if their group is small.
These first generation settlements ranged in size from 10 to 150 households, with 70 households on average, and in each settlement most had migrated from the same rural village or adjoining group of villages. About 40 per cent had come to Bangalore between one and five years ago, another 40 per cent between five and 10 years ago, and about 15 per cent more than 10 years ago. Just over half the residents (52 per cent) had been agricultural labourers before coming to the city; another 40 per cent had supplemented farm incomes with other labour; almost 38 per cent of households owned no agricultural land; another one-third owned tiny plots of one to three acres; and only seven per cent owned five or more acres of agricultural land.
The Scheduled Castes (SCs), the former untouchables, formed 11.41 per cent of Bangalore’s urban population according to the 2011 census. However, in the blue polygons, we found a disproportionately large share of residents (72 per cent) belonging to the SCs. In eight of the 18 selected neighbourhoods, SCs constituted 100 per cent of the settlement. Table 1 provides details for all 18 neighbourhoods.
First generation settlements: Scheduled Castes, Scheduled Tribes and non-Hindus
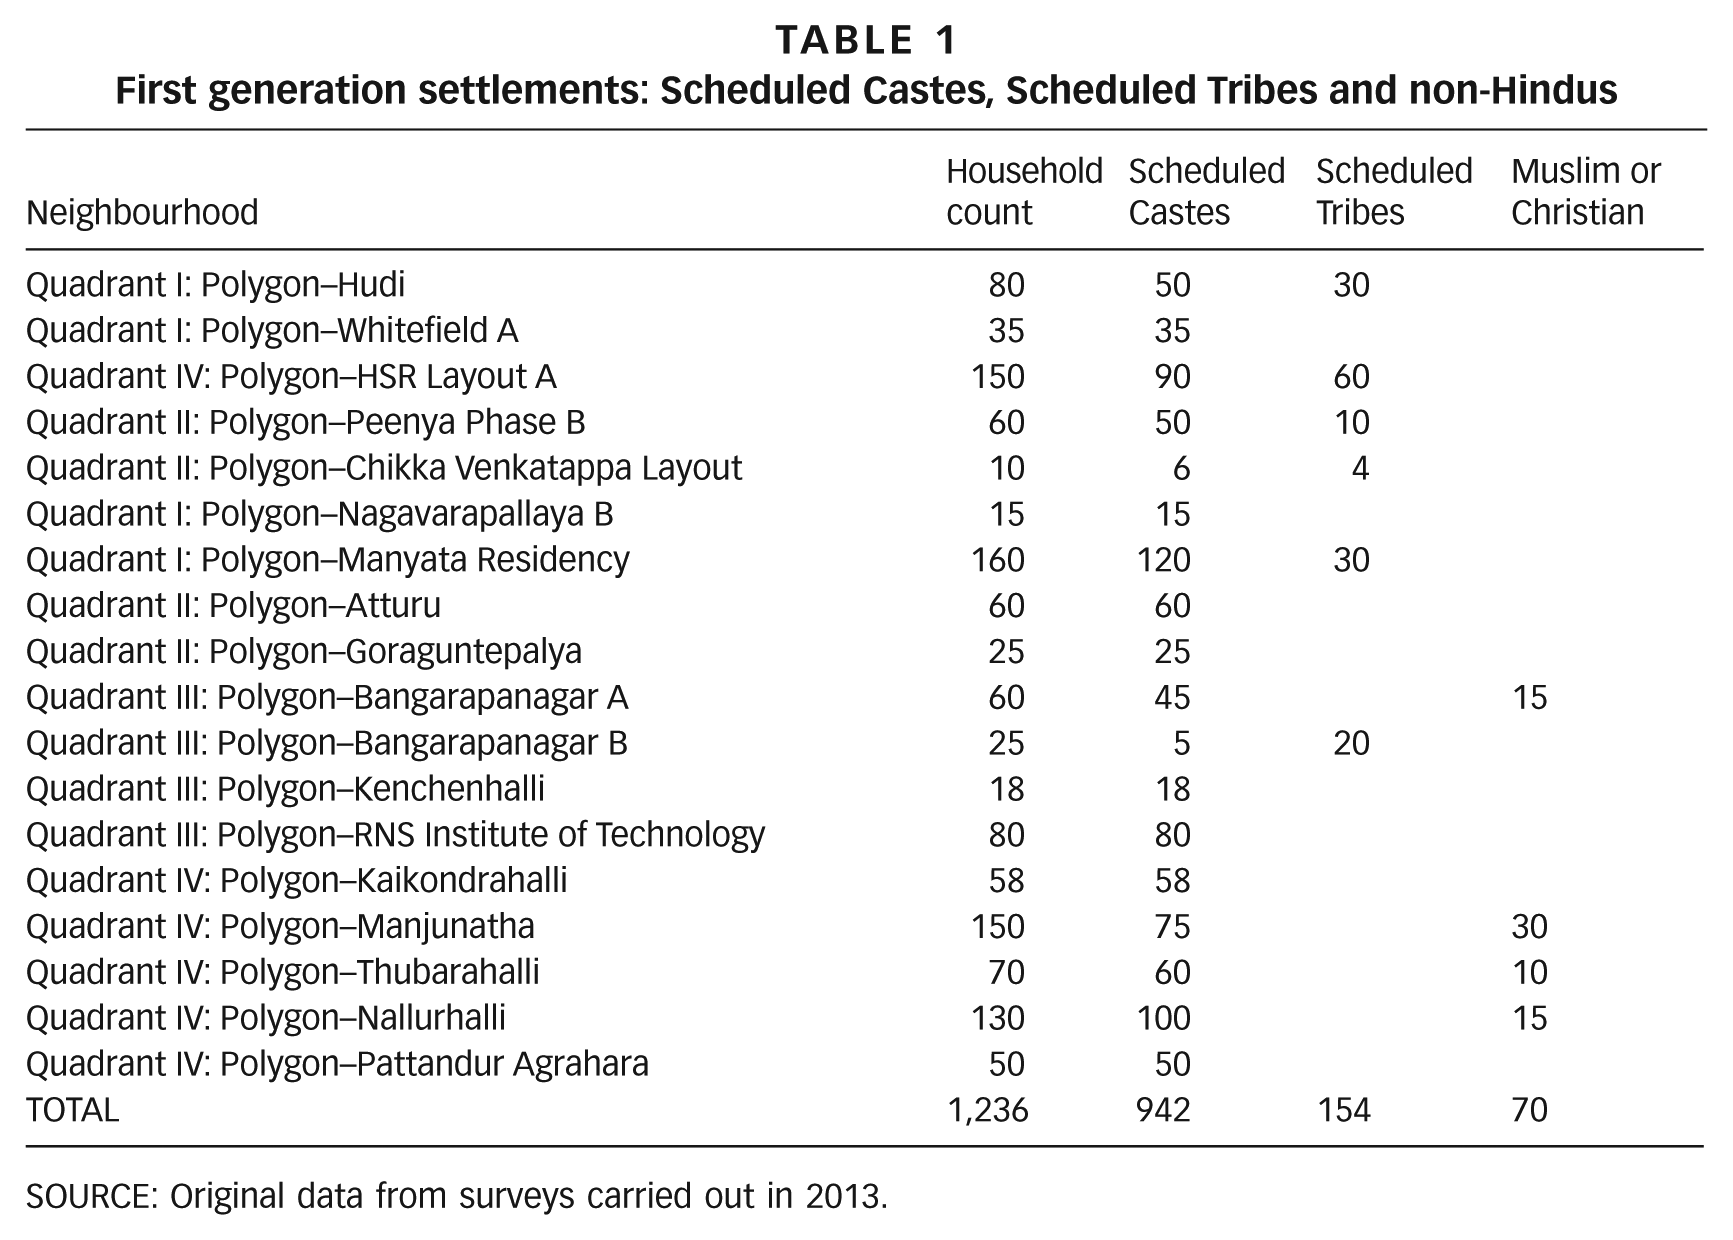
SOURCE: Original data from surveys carried out in 2013.
Caste backgrounds, land holdings and prior occupations all indicate that this group of households represents some of the poorest people in rural India, impelled to move from their native villages by their diminishing prospects. More than 80 per cent cited droughts, debts and the general difficulty in making a living in their native villages as their principal reason for moving to the city.(18) Current occupations and asset holdings confirm this position. About 80 per cent of men and women (and many older children) work on construction sites as irregular, daily waged labour. Men earn on average Rs. 300 a day and women around Rs. 200, even when they do the same kind of work.
Few possessions are evident within their tent dwellings: shabby clothes stored on wooden planks balanced atop brick or earthen supports; three or four battered aluminium cooking vessels; an open wood-burning chulha (fireplace); a cheap mobile phone to stay connected with the family in the village; pictures of Hindu gods and goddesses; one or two plastic containers for storing water.
These blue polygon settlements are mostly unconnected to city services and also poorly connected to livelihood opportunities. None of the 18 settlements are connected to the electricity network. Darkness after sunset, muddy, narrow, twisting and unpaved alleyways and the frequent presence of vicious bands of stray dogs made it imperative that household interviews be completed early, immediately after householders returned from work. There is a handpump in one neighbourhood and a borewell in another but residents of the remaining 16 neighbourhoods purchase their water from mobile tankers or fill up at distant public water points. Garbage removal and security services are unknown. There is a public bus stop within one kilometre of only two settlements; for most, bus stops are more than three kilometres away. The nearest health clinic, government or private, is four kilometres away on average. There are no signs in any neighbourhood of ongoing government, NGO or other outside support.
People here are generally left to cope on their own. They rely only on immediate family or neighbours for support. Only a tiny percentage have been able to call upon employers, community leaders, government officials, political parties, NGOs or any other organized force for help with dealing with everyday or emergency situations.
Prospects for advancement and permanence are severely compromised by visits two or three times a year to their native villages to look after the land and family left behind and to service the debts that originally brought them to Bangalore. Only 32 households (five per cent) had not visited their native villages during the 12 months preceding this survey; another 157 households had made one visit, 229 two visits and the remaining 213 had made three or more visits to their native village in the year preceding the interviews. On average, 2.3 trips, usually costly, were made annually, with a total of 32 days spent in the village. As many as 494 households − 80 per cent – have one or more debts outstanding in their home village, averaging Rs.116,800, with interest ranging between two and four per cent monthly. Most of these loans are from moneylenders, with about one-quarter from family and friends.
Repeatedly, these people informed us that they came to the city mainly to repay the debts that their families had accumulated in the village. Whatever they can save goes into building a better life back in the village. Opportunities for self-improvement in the city are passed by – neither actively pursued nor even visualized as real possibilities. As indicated in Table 2, more than one-quarter of average monthly expenditure goes toward obligations connected with the village, and the average household sends Rs. 1,840 back every month.
Monthly household expenditure in first generation slums
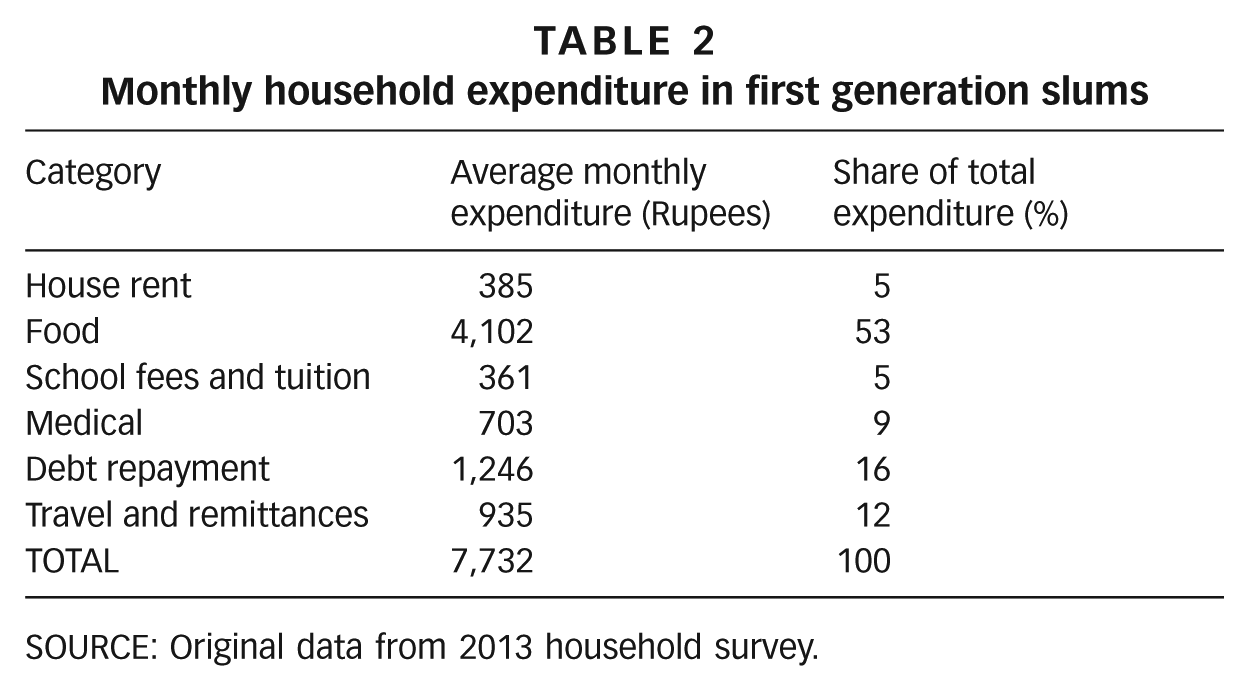
SOURCE: Original data from 2013 household survey.
Only a tiny proportion of the household budget, 4.8 per cent, is spent on education. In fact, no more than 21 per cent of all 631 households spend any amount whatsoever on tuition, fees and other school-related expenditure. Very few children are sent to school. Table 3 shows the distribution of educational attainment by age and gender. Access to education seems to be improving but only very slowly. Meanwhile, the education “threshold” – the point at which educational qualifications make a significant difference to earning potential – has been rising in India.(19)
Level of education in first generation slums
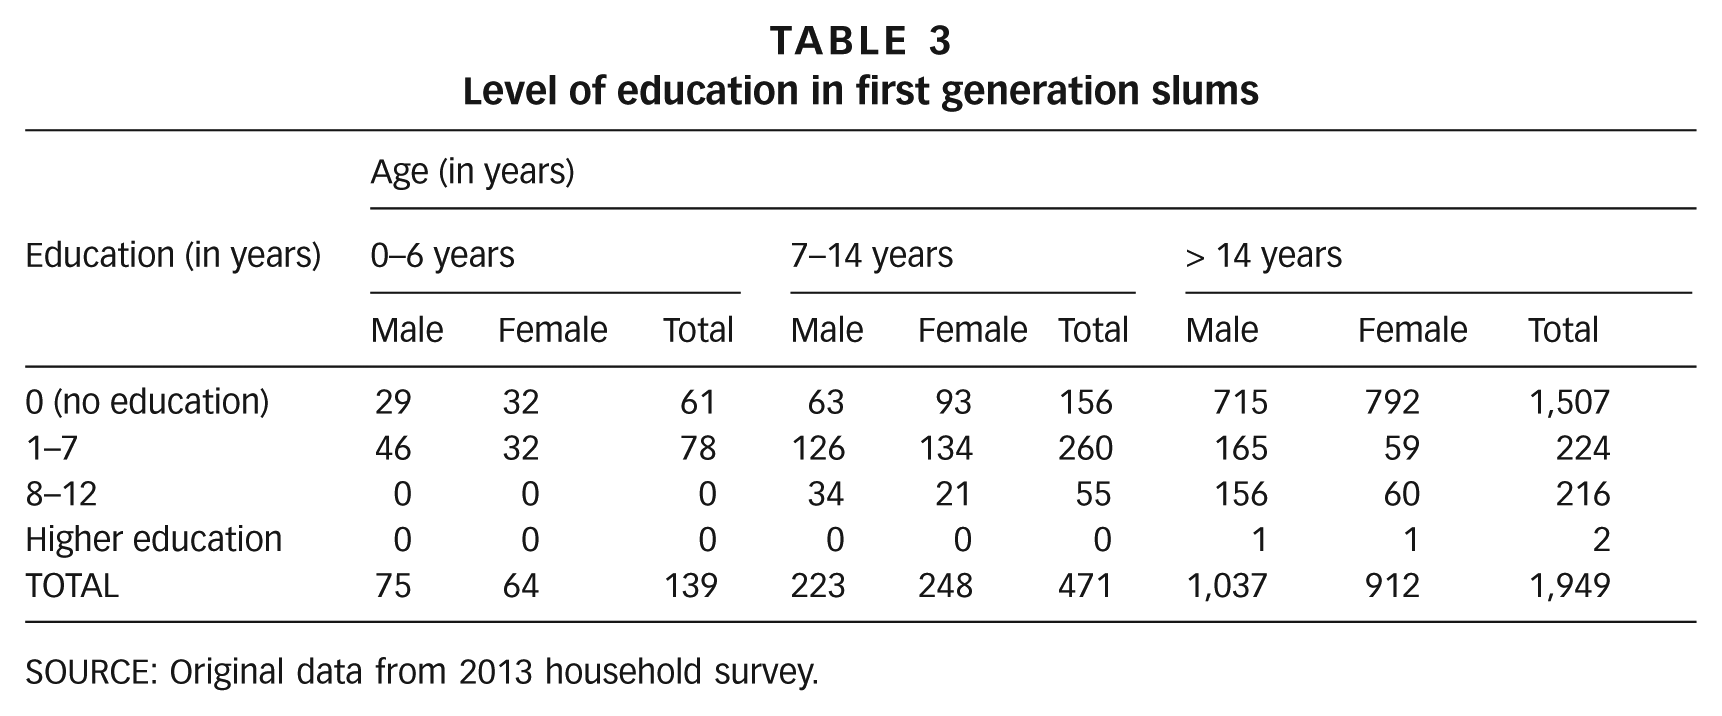
SOURCE: Original data from 2013 household survey.
More than three-quarters (77 per cent) of all household members aged 14 years or older have never been to school. More young people of school-going age are out of school than in while living in the city, and those who do attend do so sporadically, mostly dropping out after only a couple of years. The few who attend school regularly are those who remained behind in the village. Education is conducted in local languages in the schools these children attend, with 75 per cent and 16 per cent, respectively, attending Kannada- and Telugu-medium schools; only four per cent of these households’ children attend English-medium schools. In notified slums, by contrast, most young people go through high school, 60 per cent with an English-medium education, the better to raise career prospects. Economic difficulties and an itinerant life make it hard for blue polygon residents to keep children in school. Lack of official identity papers is a further deterrent. The papers they possess relate to their residence in their native village. Only a small proportion are registered in any way in Bangalore – nine per cent are registered to vote there, six per cent have a Bangalore ration card and only one per cent have a Bangalore-based unique ID (or Aadhar) card. The corresponding percentages holding village identifications are 69 per cent, 65 per cent and 17 per cent, respectively. School enrolment, along with other social services or benefits in the city, becomes virtually impossible where people’s very existence remains unrecognized and unregistered.
Cut off from flows of social assistance as well as flows of information and influence, blue polygon residents eke out a meagre living, surviving from day to day but hardly making progress from year to year. Inter-generational occupational mobility is virtually non-existent. Principal occupations among current male heads of households are very much the same as they were for their fathers and grandfathers, the vast majority of whom also hired themselves out as casual labour, albeit as agricultural and plantation labour.
The small advances they are able to make are often compromised by adverse events. Exposed to risk in two places – in their city tents as well as in their native villages – the lives of first generation slum residents are doubly precarious. Along with droughts and rainfall failures, deaths, marriages and poor health combine to eat deeply into their meagre savings, making further debt necessary in the majority of cases. A total of 447 households (71 per cent) reported experiencing a health incident requiring substantial expenditure (Rs. 30,285, on average) in the preceding year. Over the previous five years, marriage expenses added more than Rs. 100,000 to the outstanding debts of 391 households (62 per cent).
The city livelihood patterns of these people, coupled with meagre or non-existent policy supports, instead of enhancing resilience place a low upper limit upon their prospects. And the threat of eviction is ever present. Yet, because of the lack of alternatives, some of these residents have been in place for 10 years or more and the average age of the settlements is more than 6.5 years.
IV. Comparing First and Fourth Generation Slums
In notified slums, by contrast, residents do not merely survive but build assets and invest in education and skills. Many become part of a lower-middle class, a result of incremental gains won over multiple generations through a series of political gains and official accommodations. As mentioned above, these settlements have been in existence for a long time and most residents trace their association with Bangalore over multiple generations.
Various points of comparison – asset holdings, occupations, aspirations and investments in children’s education, identity cards, vulnerability to natural disasters – indicate how different first generation migrants in blue polygon areas are compared to fourth generation notified slum residents. In one respect, slum residence, no matter what type, has a similar consequence – most slum residents are only poorly connected to the institutions that make the city a source of economic dynamism for other population groups. Lack of information and connection are common themes. In other respects, however, understanding the differences that exist across diverse types of slums and coming to grips with the sources of these differences is critical for effective policy formulation. Photos 1, 2A and 2B provide visual evidence of the contrasts that exist between these two types of slum.
Example of a blue polygon settlement: Quadrant IV – Tigalarpalya
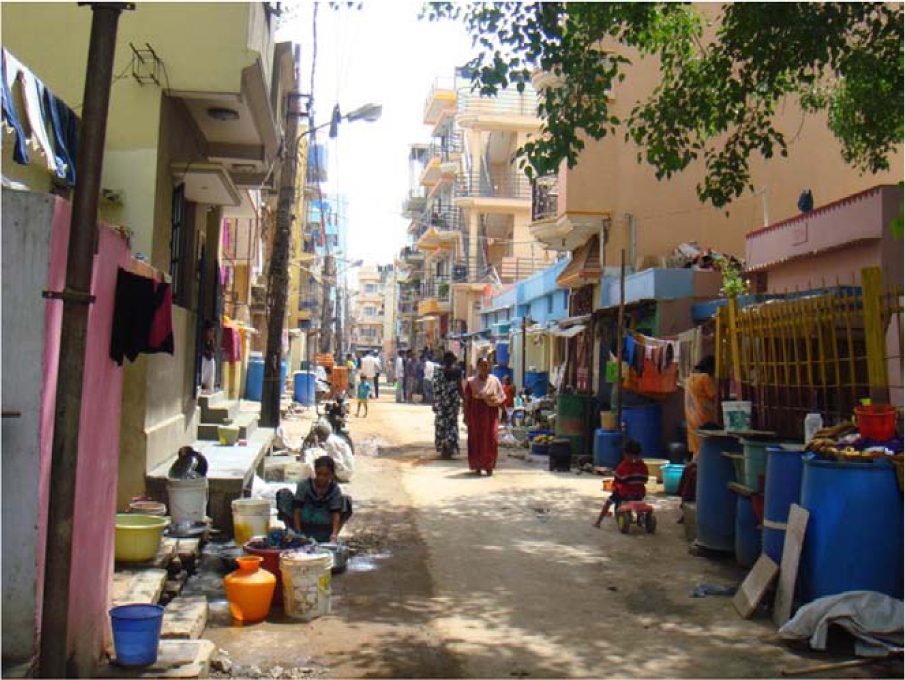
Example of a notified slum: AMM Residency, Siddapura
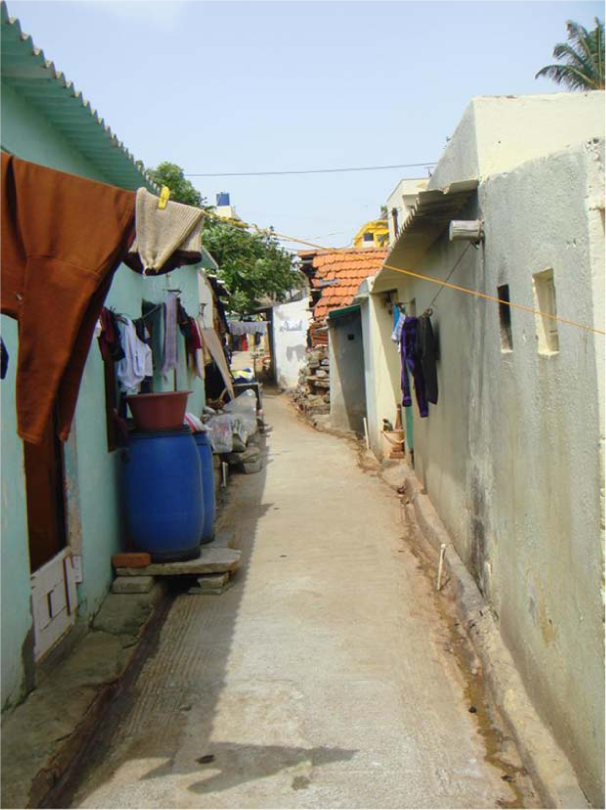
Example of a notified slum: Roopen Agrahara
Hardly any fourth generation residents of notified slums in Bangalore have any ongoing relationship, economic or social, with a rural village. Their asset holdings, like their sources of livelihood, are entirely contained within Bangalore. By contrast, first generation blue polygon residents divide their time and often their families between the city and the village. Table 4 reflects these divided livelihoods, considering both the city asset holdings of blue polygon residents and their combined assets in the city and the native village.
Asset ownership (percentage households owning each type of asset)
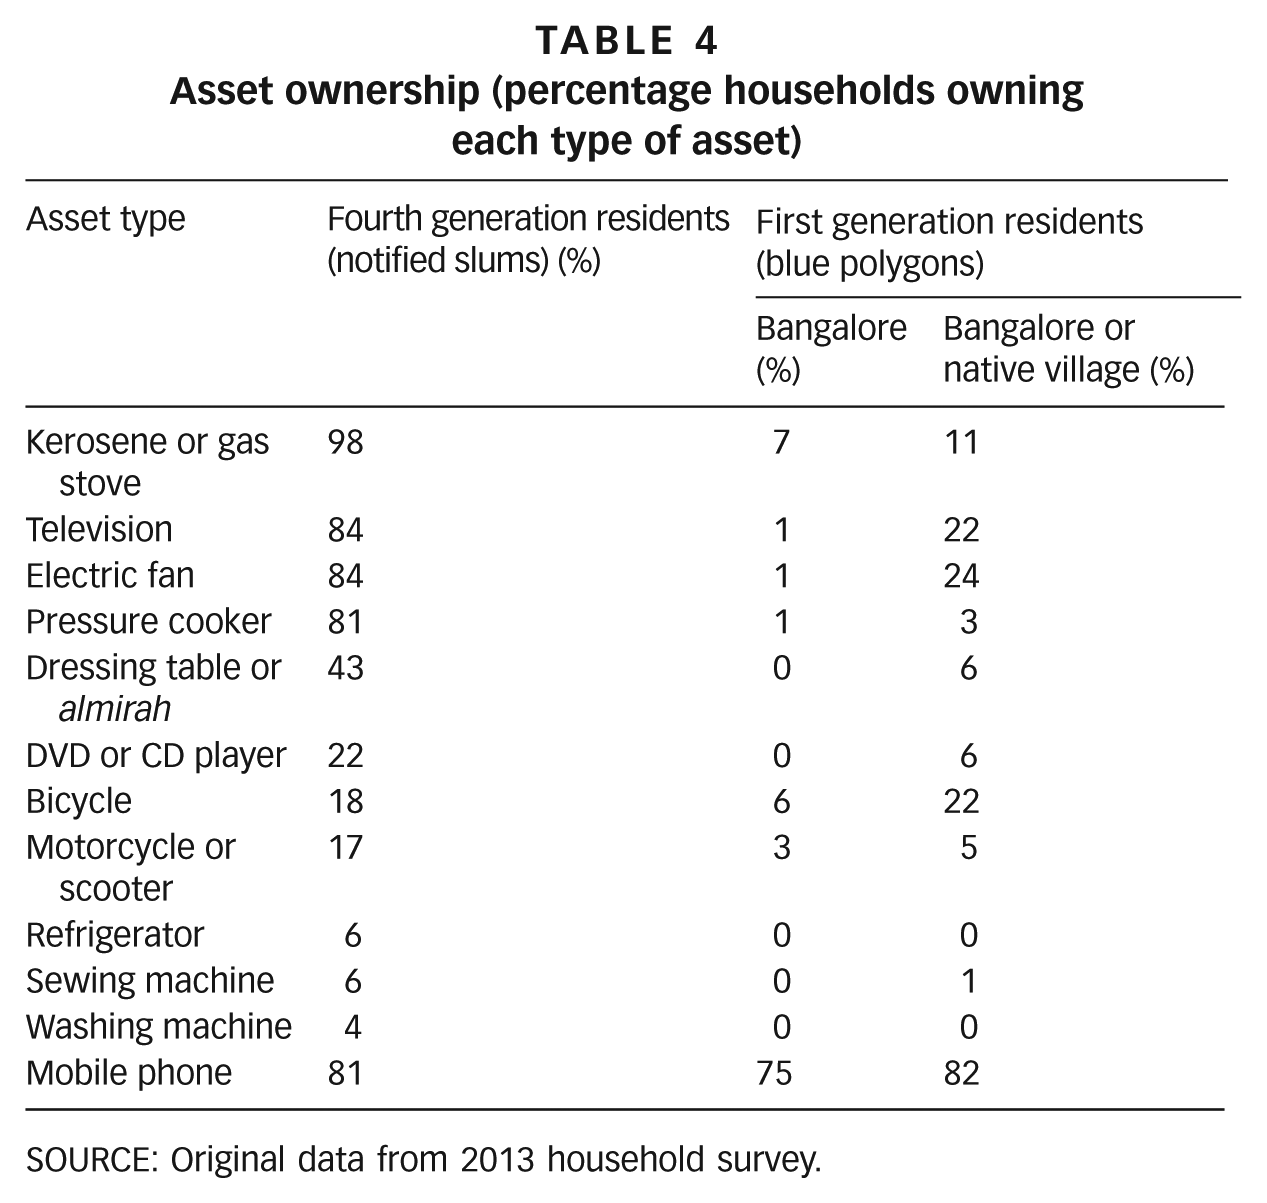
SOURCE: Original data from 2013 household survey.
The asset holdings of fourth generation slum residents dwarf those of first generation migrants; more than 80 per cent possess televisions, electric fans and pressure cookers compared to one per cent or fewer within the blue polygon settlements (although slightly higher if we consider combined city and village assets).
Taking home ownership into account further reinforces the impression that these are different classes of people. More than half the fourth generation residents own their homes and most (85 per cent) have titles to the land and building. By contrast, not one blue polygon resident owns a home in the city. Asset-building among notified slum dwellers takes place incrementally, first with the acquisition of a home and the basic necessities, such as gas or kerosene stoves, pressure cookers and electric fans. TVs are also acquired early on in the process, serving not only as entertainment but also as the primary source of information for many.
Another big difference concerns the nature of domestic fuels used. While nearly all fourth generation households rely upon cooking gas or kerosene, all but one or two blue polygon households collect or buy firewood for their cooking needs.
Differences in principal occupations (males)
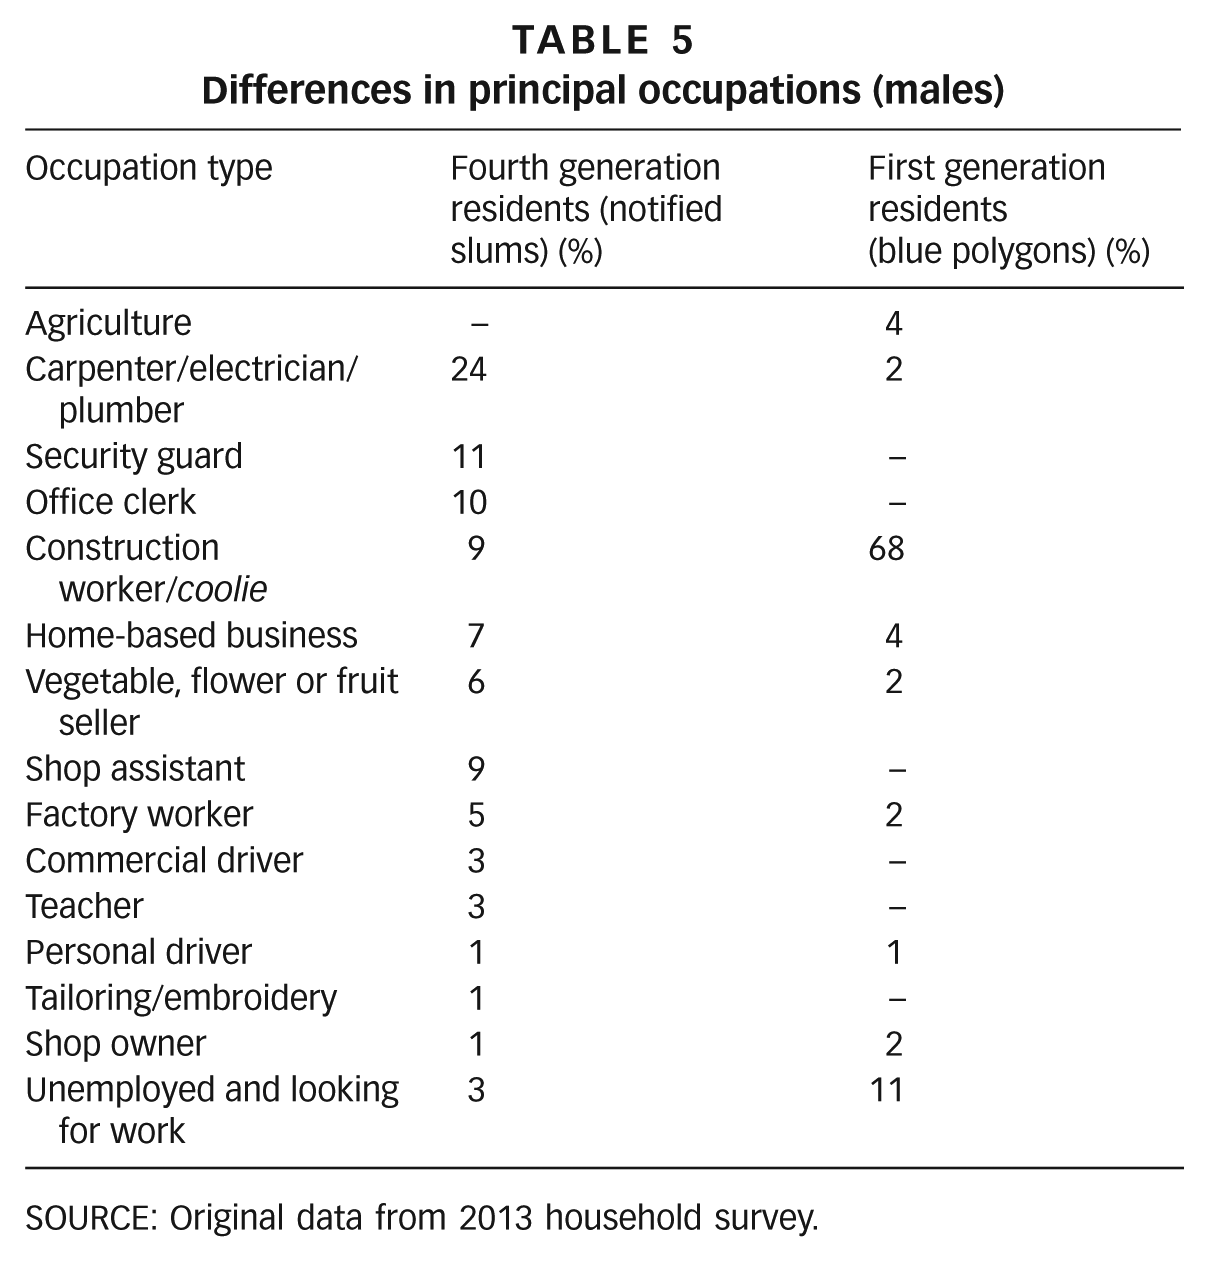
SOURCE: Original data from 2013 household survey.
Informal occupations predominate in both types of slums but earning potentials are vastly different. People’s abilities to invest in their children’s futures also differ considerably.
While first generation residents work predominantly as casual labour in building construction, fourth generation residents are distributed across a variety of occupations. Most are skilled and semi-skilled tradespeople, carpenters, electricians and suchlike. Others are employed as office clerks or security guards. Fewer than 10 per cent are employed in construction activities, the lowest paid and least secure sector of the occupational spectrum.
The range of female occupations (not reported in a separate table for want of space) reflects the differences with males. Most blue polygon women (62 per cent) are employed as casual construction labour compared to only 12 per cent of fourth generation women. Younger fourth generation women have made considerable gains compared to their mothers and grandmothers, going on after high school to work as shop assistants, call centre operators and secretaries in offices. Education has served as a pathway to social mobility, albeit of a limited kind. No notified slum dweller in our sample had become a medical doctor, lawyer, senior government official or MBA – and no young person is currently attending the kind of educational programme that can prepare them for such careers.
Awareness of better career possibilities is far greater among residents of notified slums than among those in blue polygon slums, most of whom were unable to state any particular career aspirations for their daughters and sons. Those who did mostly cited something vague and all-encompassing such as “acquiring education” or “getting a job”. In consequence, social mobility is virtually non-existent among residents of blue polygon slums. Sons and daughters have followed mothers and fathers into low-skilled, low-paid and precarious occupations, working in the village as agricultural labour and in the city as construction labour with no secure or reliable perch.
Migrants, when they first come to the city, are rarely served by any government agency or, for that matter, any NGO. Those who obtained assistance did so mostly from friends and relatives. Fewer than one per cent expected to receive help from any government agency or NGO in their retirement or old age.
Our evidence does not suggest that slum dwellers prefer to remain aloof from public institutions. Given a choice, most of them want to engage actively with public institutions and obtain assistance and advice of different kinds. They want better schools, educational and housing loans on reasonable terms, vocational training, career guidance and infrastructure improvements. But few have actually received assistance in any such ways.
Within notified slums, most residents have voter ID and ration cards – another point of difference with blue polygon residents – and some have safe drinking water supplies, but access to other financial, social and educational facilities remains weak overall. We asked a number of questions about the nature of connections they have made or would wish to make with government and non-government agencies. In each case their responses pointed to impoverished networks and weak institutional connections.
People rely for the most part on their individual social networks, which are poorly endowed with resources and connections and have little capacity to facilitate connections with people who have any real influence, such as doctors, lawyers, elected officials, newspaper reporters, policemen and factory owners. When asked whether they felt able to connect with any of these (and other) people with influence, as many as 70 per cent in notified slums and 95 per cent in blue polygon settlements claimed that they would be unable to connect with even one such individual. Their social networks – the relatives, friends and neighbours whom they can consult on a regular basis – provide them with all the job-related knowledge and professional connections they are generally able to muster. Studies in other slum settlements, in India and elsewhere, show this situation is not peculiar to Bangalore.(22)
V. Conclusions
Urban slum populations have been expanding rapidly in India. Two separate processes, with different internal dynamics and diverse repercussions for policy, have contributed to this growth. One is natural increase – births occurring within slums, outpacing deaths, have resulted in a natural process of population growth. This is most prevalent within longer-established slums and was particularly apparent in our surveys of notified slums. A separate process is playing out, more often at the lower end of the spectrum of slums, bringing first generation migrants into the newest and flimsiest settlements, where poverty, uncertainty, risk and vulnerability are more central in people’s lives and livelihoods and where resilience is much lower than in notified slums. Diminishing economic prospects in agriculture coupled with the lure of growing cities have contributed to this process;(23) so too have factors associated with changing climatic conditions. The largest proportion (81 per cent) of our blue polygon interviewees stated that their principal reason for coming to Bangalore was related to increasing droughts, difficult working conditions and accumulating debts. As climate impacts add further to the precariousness of rural livelihoods, more such settlements can be expected to develop.
Currently organized in a haphazard way, wherever temporary niches are available, the kinds of settlements that currently serve as home in Bangalore to new migrants from distressed villages hardly serve as locations for building a better life. These people live within a restricted sphere with fellow settlers and migrants whose lives are equally devoid of prospects for substantial improvement. They have no official papers in Bangalore and no security of tenure – these settlements are not on local political entrepreneurs’ radars and residents are liable to be evicted, as many of our interviewees have been, with little notice. Given these circumstances, families aim not so much to build a better life in Bangalore as to use the city as a means to pay off the debts contracted in their native villages. Children’s education is given short shrift in the face of more compelling, immediate commitments. Home improvements are not possible once money has been sent back to the village, nor are they even desirable when the threat of eviction is ever present. These situations contrast starkly with those experienced by native-born Bangaloreans living in notified slums. Home ownership and children’s education are their two highest priorities. There is no real threat of eviction for these residents and no need to send remittances elsewhere.
These differences in current lifestyles and future expectations call for different policy support. Notified slum residents will benefit most from support that can help raise social mobility, enabling their children to become not only security guards and shop assistants, as so many have, but also medical doctors, software engineers, business professionals and the like, positions so far achieved by only a few. Notified slum households invest heavily in education but the returns on these investments are currently low.
Blue polygon settlers require very different support. Their basic needs – electricity, clean drinking water, security of person and property, education, secure housing, affordable health care – remain largely unmet or require large expenditures. Lacking identity papers in the city (and not registered as constituents or voters), they have been unable to attract much political patronage or official support. Drives to acknowledge and register their presence in the city will, therefore, have to take precedence, as will policies that establish minimum standards for the most basic services.(24) New forms of school instruction designed specifically for the itinerant nature of migrant families’ lives also need to be explored.
Helping first generation migrants manage the low-level obstacles they face both in the city and in their native villages will open the door to the possibilities of building a better life. Whether this can be done by helping make rural livelihoods more bountiful and reliable, or whether it makes better sense to pin the hopes on cities and deploy public resources in building urban infrastructure is a critical question,(25) one to which we doubt there can be an unambiguous response.
The effort to develop complete slums maps – with clearly marked boundaries and with settlements classified in terms of a clearer typology – must also be taken forward vigorously. Relatively little is known about how slums develop and how, when and if they make the transition from blue polygon to notified status. Our ongoing enquiries show that there is a spectrum of settlements, from blue polygons to long-notified ones. In some cases, huts have been improved incrementally into durable dwellings,(26) but not all homes and settlements have been able to cross crucial transition points. The barriers, which some but not all settlements are able to go beyond, will become better known as research addressing these questions becomes more advanced.
In Bangalore, we are finding that the official typology, which differentiates only between notified and non-notified slums, does not adequately capture the range of existing differences. In some notified slums, individual land rights have been granted; in others, these grants have stalled. In some unrecognized slums, people have voter ID cards, ration cards and electricity connections, while in others (like the blue polygons considered here), they have none of these amenities. Making these finer distinctions is essential for formulating more effective and better-targeted policies. Our ongoing research will develop a finer typology of slums, also uncovering transition points and trajectories.
The methods presented here represent a useful starting point for similar enquiries in other cities. They have proved productive in Bangalore, but how far they will be useful, with and without modifications, in other large and small Indian cities needs to be investigated, something we intend to do in the near future. In Bangalore, at least, the existence of substantial differences between the two types of settlement studied so far shows that treating slums as a homogeneous category can result in serious policy mistakes.(27)
Footnotes
Acknowledgements
Field investigations for this study were in large part supported by the Jana Urban Foundation (JUF), a not-for-profit company, having its registered office at Rajashree Saroja Plaza, No 34/1, Andree Road, Shanthinagar, Bangalore, India. The authors are also grateful for numerous conversations with, and advice and support generously provided by, our colleagues at JUF. An earlier version of this paper was presented at the international workshop on Living in Low-income Urban Settlements in an Era of Climate Change, organized by the Brooks World Poverty Institute and the University of Manchester, UK.
1.
The practice of enumerating slum populations started in the preceding census (2001) but this earlier exercise was confined only to considering slums located within the largest Indian cities.
2.
See, for example, Government of India (2010a), Report of the Committee on Slum Statistics/Census, Ministry of Housing and Urban Poverty Alleviation, Government of India, available at http://www.mhupa.gov.in/W_new/Slum_Report_NBO.pdf; also NSSO (2003), “Conditions of urban slums: salient features, NSS 58th round: July 2002−December 2002”, National Sample Survey Organization, Government of India; and ![]() , “India − urban slums survey, NSS 65th round: July 2008−June 2009”, National Sample Survey Organization, Government of India.
, “India − urban slums survey, NSS 65th round: July 2008−June 2009”, National Sample Survey Organization, Government of India.
3.
We use interchangeably the terms “slum” and “low-income settlement”. Official documents usually use the former term, while academic discourse is divided on appropriate usage. For a more detailed discussion on terminology, see Roy, Manoj, David Hulme and Ferdous Jahan (2013), “Contrasting adaptation responses by squatters and low-income tenants in Khulna, Bangladesh”, Environment and Urbanization Vol 25, No 1, pages 157−176; see especially note 1.
4.
For instance, the Ministry of Housing and Urban Poverty Alleviation, following the definition adopted by the National Sample Survey Organization (NSSO), considers as a slum “… a compact settlement with a collection of poorly built tenements mostly of a temporary nature, crowded together usually with inadequate sanitary and drinking water facilities in unhygienic conditions.”
5.
See Joshi, Pratima, Srinanda Sen and Jane Hobson (2002), “Experiences with surveying and mapping Pune and Sangli slums on a Geographic Information System”, Environment and Urbanization Vol 14, No 2, pages 225−240. The authors provide an example from the Indian city of Pune of a slum settlement that has doubled in size after its boundaries were initially recorded. “The result …”, they suggest, “… is settlements where certain areas have some provision for [municipal] services while others are completely unserviced” (page 227), making for an untenable situation in practice.
6.
Despite these data limitations, some notable investigations, using innovative methods, have examined longitudinal trends; see, for example, Bapat, Meera (2009), “Poverty lines and lives of the poor: underestimation of urban poverty – the case of India”, Poverty Reduction in Urban Areas Series, Working Paper 20, IIED, London, 56 pages; also Bhatia, N and A Chatterjee (2010), “Financial inclusion in slums of Mumbai”, Economic and Political Weekly, 16 October, pages 23−26; Krishna, Anirudh (2013), “Stuck in place: investigating social mobility in 14 Bangalore slums”, Journal of Development Studies Vol 49, No 7, pages 1010−1028; Mitra, Arup (2010), “Migration, livelihood and well-being: evidence from Indian city slums”, Urban Studies Vol 47, No 7, pages 1371−1390; and Ramachandran, H and S V Subramanian (2001), “Slum household characteristics in Bangalore: a comparative analysis, 1973 and 1992”, in H Schenk (editor), Living in India’s Slums: A Case Study of Bangalore, Manohar Publishers, New Delhi, pages 65−88.
7.
8.
The initial breakthroughs on developing this satellite image-based methodology of slum identification were made by Andrew Leon Hanna and Grady Lenkin, students from Duke University, and Rui Shan Foo of the Singapore Management University, each of whom spent several weeks in Bangalore.
9.
Investigations into the two middle categories of slums are still ongoing.
10.
See, for example, Kit, Oleksandr, Matthias Lüdeke and Diana Reckien (2013), “Defining the bull’s eye: satellite imagery-assisted slum population assessment in Hyderabad, India”, Urban Geography Vol 34, No 3, pages 413–424; also Livengood, Avery and Keya Kunte (2012), “Enabling participatory planning with GIS: a case study of settlement mapping in Cuttack, India”, Environment and Urbanization Vol 24, No 1, pages 77–97; and Sudhira, H S, T V Ramachandra and K S Jagadish (2004), “Urban sprawl: metrics, dynamics and modelling using GIS”, International Journal of Applied Earth Observation and Geoinformation Vol 5, pages 29–39.
12.
Government of India (2010b), Census of India 2011, Circular No 8, “Formation and identification of slum blocks for slum demography”, 20 January 2010, page 3, accessed 9 April 2014 at ![]() .
.
13.
A number of official agencies have active roles in making slum policy, including, in addition to BBMC, the Karnataka Slum Development Board (KSDB).
14.
These quadrants were numbered in a counter-clockwise direction starting from the northeast; the “ruler” feature of Google Earth was used to find the mid-points of each line segment and the “line” feature to draw the quadrant boundaries.
15.
We refer to “shelter units” rather than houses because, based on Google Earth satellite images, there is no way of determining how many household units are included within a visible shelter unit.
16.
The reason that “narrow inner roads” serves only as a supporting criterion is because it is so difficult to detect and is in many ways a function of the “lack of space between houses” criterion.
17.
While plastic sheets similar to the blue roofing sheets are available in multiple colours, the blue ones are the least expensive and most commonly available and hence the most extensively used.
18.
It would be useful to establish how many migrants returned to their villages after repaying the debts that originally brought them to the city. We feel that the proportion is low but are unable to confirm this impression since we interviewed only those migrants still living in the city.
19.
Chamarbagwala, Rubiana (2006), “Economic liberalization and wage inequality in India”, World Development Vol 34, No 12, pages 1997–2015; also Sarkar, Sandip and Balwant Singh Mehta (2010), “Income inequality in India: pre- and post-reform periods”, Economic and Political Weekly Vol 45, No 37, pages 45–55.
20.
Household and neighbourhood schedules used for the earlier survey in notified slums are nearly identical to the ones used later for the blue polygon surveys.
21.
Mitlin, Diana and David Satterthwaite (2012), “Editorial: Addressing poverty and inequality; new forms of urban governance in Asia”, Environment and Urbanization Vol 24, No 2, page 396.
22.
Personalized and informal connections also predominate in the slums of Delhi, as documented separately in Jha, S, V Rao and M Woolcock (2007), “Governance in the gullies: democratic responsiveness and leadership in Delhi’s slums”, World Development Vol 35, No 2, pages 230–246 and Mitra, Arup (2006), “Labour market mobility of low-income households”, Economic and Political Weekly, 27 May, pages 2123–2130. Summarizing his evidence, Mitra (page 2126) concludes that “… in accessing the present occupations, informal networks or contacts operating through relatives and other kinship bonds have played a major role … Apart from immediate relatives no other source of contact appears to be of any significance.” Fewer than two per cent of slum dwellers were assisted in their job search by any NGO, and fewer than one per cent took help from a private consultant. Non-institutional means of gaining information and access were used by more than 95 per cent. Studying slum communities in Dhaka, the capital city of Bangladesh, Banks found, similarly, how social networks can matter more than level of education; see Banks, Nicola (2008), “A tale of two wards: political participation and the urban poor in Dhaka city”, Environment and Urbanization Vol 20, No 2, pages 361–376.
23.
Reddy, D N and Srijit Mishra (2009), “Agriculture in the reforms regime”, in D N Reddy and Srijit Mishra (editors), Agrarian Crisis in India, Oxford University Press, New Delhi, pages 3–43.
24.
Subbaraman, Ramnath, Jennifer O’Brien, Tejal Shitole, Shrutika Shitole, Kiran Sawant, David Bloom and Anita Patil-Deshmukh (2012), “Off the map: the health and social implications of being a non-notified slum in India”, Environment and Development Vol 24, pages 643–663.
25.
See, for example, the report of a high-level committee of the Indian government, which begins by assuming that cities “… are the reservoirs of skills, capital and knowledge. They are the centres of innovation and creativity. They are the generators of resources for national and state exchequers. They are also the hopes of millions of migrants from the rural hinterland and smaller settlements. With growth of the services sector and surge of the knowledge economy, the population pressure on cities is bound to escalate.” See reference 2, ![]() .
.
26.
Schenk, H (2001), “Living in Bangalore’s slums”, in H Schenk (editor), Living in India’s Slums: A Case Study of Bangalore, Manohar Publishers, New Delhi, pages 17–37.
27.
A similar point is made in respect of low-income settlements in Bangladesh by Roy, Hulme and Jahan (2013), see reference 3.