
Abstract
The present study investigates the effectiveness of design strategies that induce yielding in the substructure of a single-layer latticed roof. The roof has a span of 28.9 m and a half-open angle of 30°. It is supported by a ductile substructure consisting of buckling-restrained braces (BRBs), and the substructure is designed to initiate yielding under a base shear coefficient of 0.40. The responses are analyzed using artificial earthquake motions corresponding to Chinese and Japanese design acceleration response spectra. The responses demonstrated that the dynamic amplification within the roof is considerably suppressed in comparison with a roof supported by elastic substructures. The negligible variance in the roof responses to the Japanese and Chinese spectra is also illustrated, suggesting the potential for reciprocal applicability of research results.
Keywords
Introduction
A cylindrical latticed shell is one of the spatial structures that arranges members in a net-like pattern over a cylindrical surface, covering a large space without pillars inside. It possesses mechanical characteristics that are resistant to external forces in membrane action with its curvature. Engineers are generally required to exercise cautions in design of the latticed shells to avoid global buckling due to vertical loads. Accordingly, a relatively large safety factor1,2 is adopted for gravity loads, considering the effects of initial imperfections. Furthermore, engineers in countries with high seismic activities are required to suppress responses to severe earthquake motions while evaluating the unique response characteristics, such as the vertical responses to horizontal seismic input.
The buckling load evaluation of the cylindrical latticed roof has been comprehensively presented in the IASS WG8 report, 3 and the earthquake response evaluation has also been recently discussed in the IASS WG8 report. 4 Both provide general and effective design information. Studies on earthquake response have started rather recently compared with the buckling load evaluation. Nevertheless, engineers may find several valuable papers. For example, Yamada 5 applied a continuum shell theory to evaluate the dynamic elastic response of cylindrical latticed shells without substructures. Cedron and Elghazouli 6 discussed a method to express the seismic loads of the cylindrical reticulated shell supported by girder. Khalili et al. 7 also discussed a kind of amplification factor considering its response. However, studies considering the effects of substructures supporting cylindrical shell roofs are few. Takeuchi et al. 8 focused on the effect of the ratio of the natural period of the substructure to that of the roof structure on the responses, providing a response amplification ratio considering the effects of substructures. Most of the studies mentioned thus far have merely considered the elastic responses. The IASS WG 8 report 4 provides minimal discussion on elastic-plastic response nor the effectiveness of energy-absorbing devices to reduce the earthquake responses. The use of energy-absorbing devices in the substructure to improve seismic performance has also been recently studied. Hosozawa and Mizutani, 9 Kato, Nakazawa, 10 and Kato et al.11,12 studied reticular domes using ductile braces, while Fan et al. 13 and Nair et al. 14 examined the effectiveness of viscous dampers. Meanwhile, Xue and Li 15 emphasized the importance of isolation technology in spatial structures. Most of these studies focused on dome-shaped latticed shells, and only a few have investigated the operation of energy-absorbing devices in cylindrical latticed shells.
Considering the aforementioned background, the present research focuses on the cylindrical latticed shell supported by buckling-restrained braces (BRBs) and aims to clarify the extent to which the devices installed in the substructure reduce the responses. Therefore, a model of cylindrical latticed shell is first presented to demonstrate its resistance to gravity loads. Second, the model is analyzed to show the fundamental natural vibration properties. Third, a series of earthquake response analysis is performed to illustrate responses of the cylindrical latticed roof to severe earthquake motions, followed by an analysis of the effectiveness of the BRBs to demonstrate response reduction. For the input earthquake accelerations, artificial earthquake motions are produced on the basis of both codes of Japanese Regulations 16 and Chinese Code, 17 and some comparisons are made to draw common conclusions.
Structure for analysis
Latticed cylindrical roof
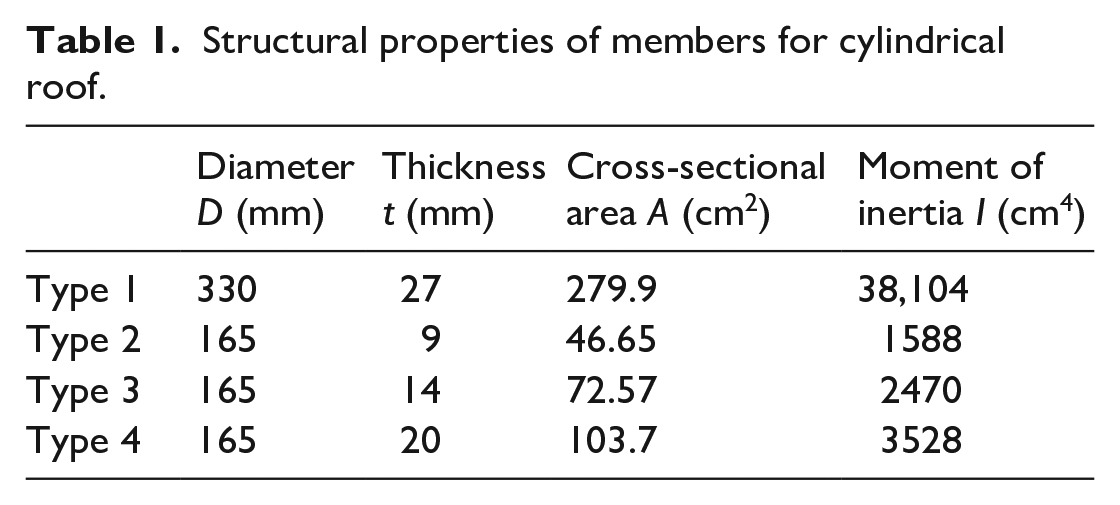
Figure 1 illustrates the configuration of a single-layer cylindrical latticed shell. The geometry of the cylinder has a half-opening angle of ϕ = 30°, a span of LY = 28.9 m in the Y-direction, and a span of LX = 35.0 m in the X-direction. Cylindrical roofs of this kind of moderate size have often been constructed and accumulated as school gymnasiums and public facilities in Japan and have served as evacuation facilities just after earthquakes. The roof of Figure 1 comprises a network of rigidly jointed tubular members arranged in three ways. Young’s modulus E and the yield stress σy of the member is assumed 205,000 and 235 N/mm2, respectively. Four types of cross-sections are assumed. The arrangement of these cross-sections is depicted in Figure 2, and their respective characteristics are itemized in Table 1. The diameter D in Table 1 denotes the average of the diameters of the outer and inner surfaces, suggesting that sectional area A is evaluated as πDt.
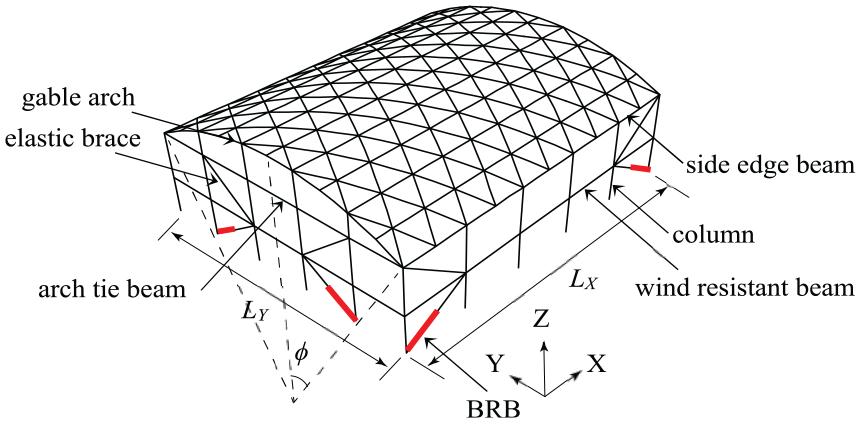
General geometry of structure: the red lines show the position of BRBs.
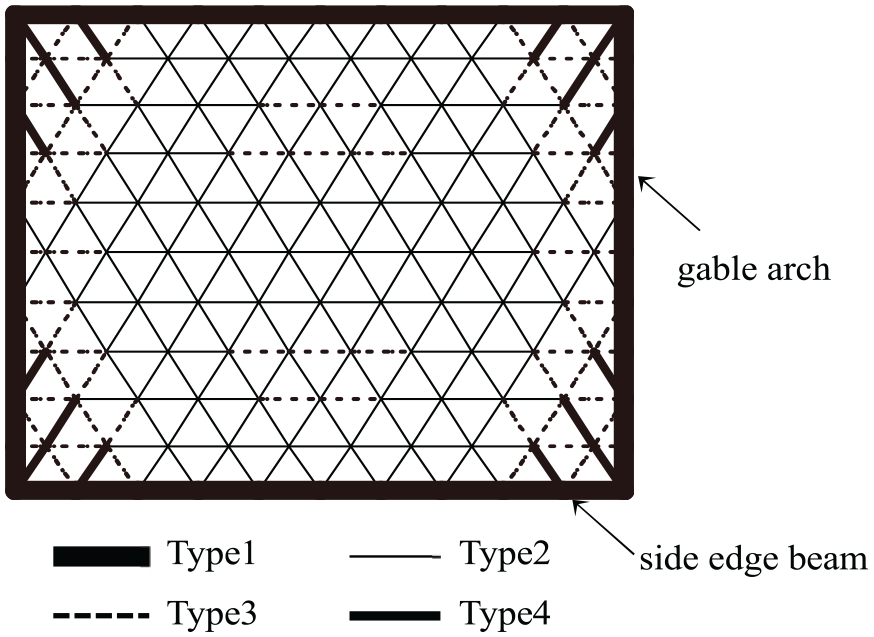
Arrangement of four types of members.
Structural properties of members for cylindrical roof.
Bearing capacity of latticed shell roof under dead load
The present section illustrates the structural performance under the assumed design load, including self-weight and snow load. The dead load of 0.8 kN/m2 is assumed per unit surface for the latticed roof. The total self-weight of the roof is 848 kN. Buckling analysis is performed on roof models without substructure. The support conditions of the roof model are depicted in Figure 3. The roof is supported by walls with small out-of-plane stiffness. The modeling does not restrain the movement of the gable wall in the X-direction and the girder wall in the Y-direction, respectively.
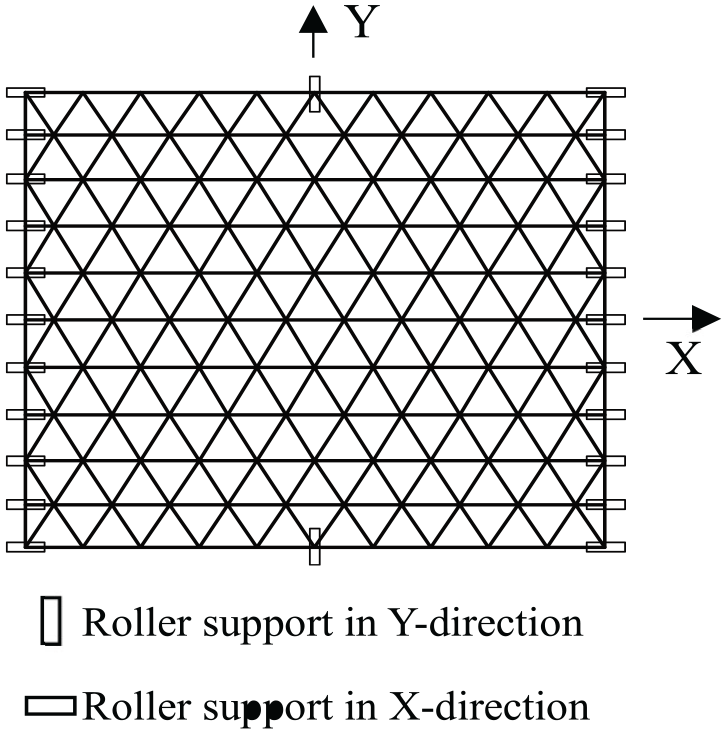
Support conditions for the analysis model of the superstructure without substructure.
A preliminary calculation of linear buckling load is performed on the basis of the presented equation in the IASS WG8 report
3
focusing the members on the central part of the roof. The roof is assumed to comprise Type 2 members in Table 1. Eq. (4.3.14) of the report
3
for a simple supported roof provides the linear buckling load
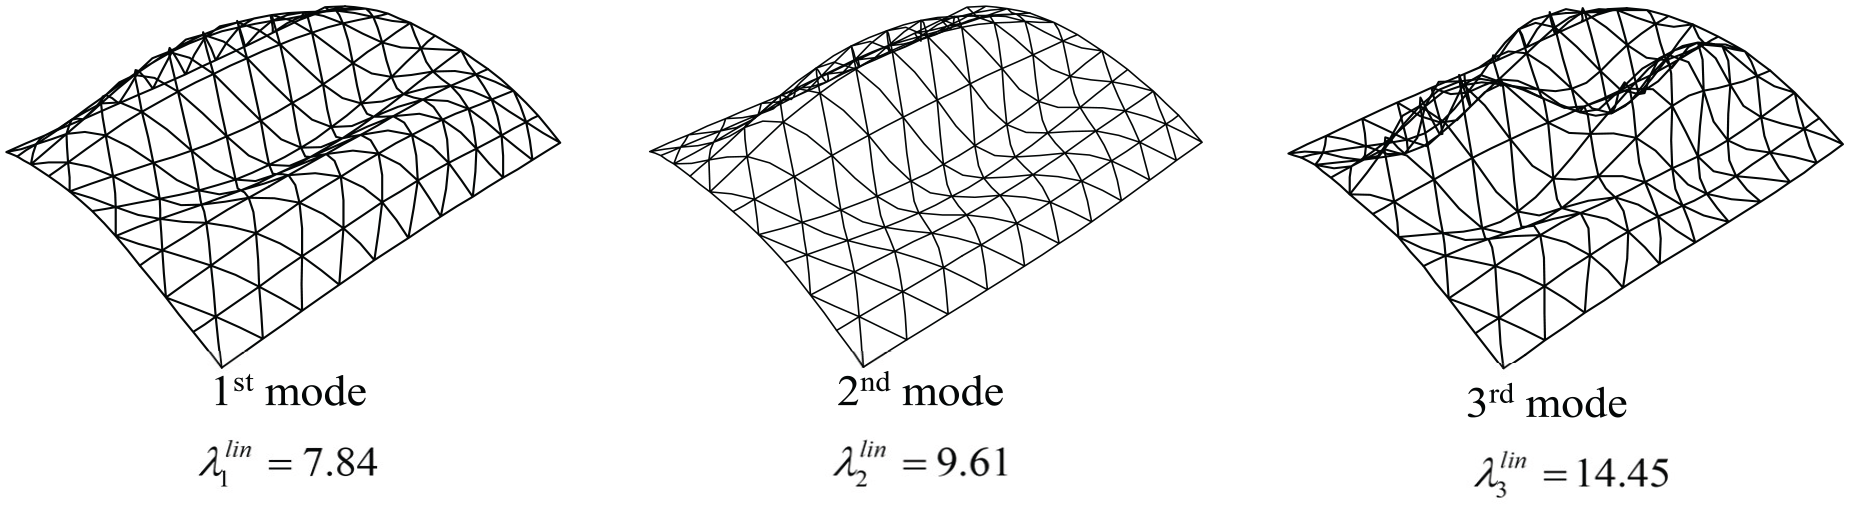
Linear buckling modes.
Shells are sensitive to geometric imperfections. Considering previous studies,1 –3 the present study introduces three different geometrical imperfections, adopting separately the first-, second-, and third-order linear buckling modes. The maximum amplitude of these introduced geometrical imperfections is assumed 20% of the cylindrical shell equivalent thickness,2,3 which is 40.4 mm in the present case. The value of 40.4 mm corresponds to 0.0014 of LY = 28.9 m.
The equilibrium paths based on a geometrically nonlinear buckling analysis provides their elastic buckling load factors λel under self-weight; 5.58, 4.35, and 6.83 in the case of the first, the second, and the third mode imperfection, respectively. The path of elasto-plastic buckling based on geometrically and materially nonlinear analysis considering their imperfections provides the elasto-plastic buckling load factor λel-pl under self-weight: 4.04, 4.24, and 3.64 in the case of the first, the second and the third mode imperfection, respectively. Accordingly, the figure-based illustration is restricted to the third mode imperfection as shown in Figure 5. Thus, the elasto-plastic buckling load is evaluated 2.91 kN/m2 as 3.64 × 0.80 kN/m2.
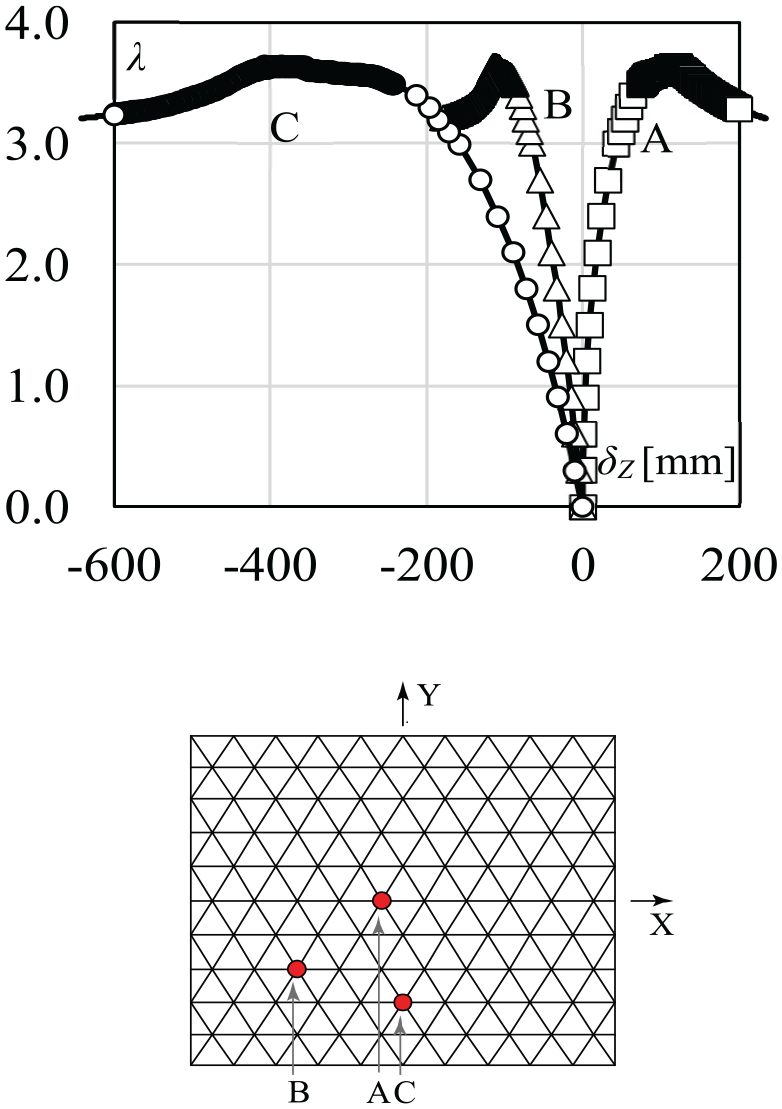
Relation between load coefficient λ and vertical displacement δZ: (a) case of the third linear buckling mode.
Assuming a common city in Japan, excluding north areas located in a region with heavy snowfall, the snow depth and unit volume weight may be assumed to be 30 cm and 2.71 kN/m3, respectively, for a reproduction period of 100 years. The sum of the snow load and the self-weight per unit area is 1.61 kN/m2. Accordingly, the present roof has a nominal safety factor of 1.81 as evaluated 2.91/1.61 under a simultaneous action of self-weight and snow load.
Substructure
The self-weight of the roof is 848 kN as explained in Section 2.2. Considering four side vertical walls, including windows, two side gable walls and the front and rear sides, the weight is assumed 1.00 kN/m2 per unit vertical area. Thus, the total weight of the is 1959.3 kN including the roof and walls. In numerical analysis, to avoid local out-of-plane vibration of the wall surface, the wall mass is placed at the boundary of the cylindrical roof. As a result of this modeling approach, the ratio RM, which represents the equivalent mass of the structure to the weight of the roof (inclusive of the circular segment of the gable wall), is established at 1.96.
The configuration of the substructure is illustrated in Figures1 and 6. The roof is pin-supported by the substructure which comprises two stories. The total height of the one story is 5.00 m, totally 10.00 m measured from the ground to the tie beams for the gable arches. The columns of H-350 × 175 × 7 × 11, totally 20 columns on all peripheries are pinned at both ends. The wind resistant beams of H-350 × 350 × 12 × 19 are arranged horizontal for the webs. The tie beams for the gable arches on two sides are also arranged with H-350 × 350 × 12 × 19. For the steel members of the substructure excluding the plasticized part of BRBs, the Young’s modulus E, and the yield stress σy of the member is assumed 205,000 and 235 N/mm2, respectively. For earthquake resistant components, the buckling-restrained braces (BRBs) are arranged at the first story, where the layer shear forces are the greatest, as illustrated in Figures 1 and 6. Two sets of BRBs are inserted at each gable wall on both sides, and two sets of BRBs are prepared at the front and rear sides. A total of eight sets of BRBs are then applied at the peripheries. For the plasticized part of BRBs, the Young’s modulus E and the yield stress σy of the member is assumed 205,000 and 225 N/mm2, respectively. The present study focusses on the response of the structure under earthquakes in the Y-direction. For a design base shear coefficient, the yield base shear coefficient Cy is assumed to be 0.40 based on a preliminary consideration and also according to a conventional design in Japan. Thus, the assigned base shear is evaluated 783.7 kN as 0.40 × 1959.3 kN.
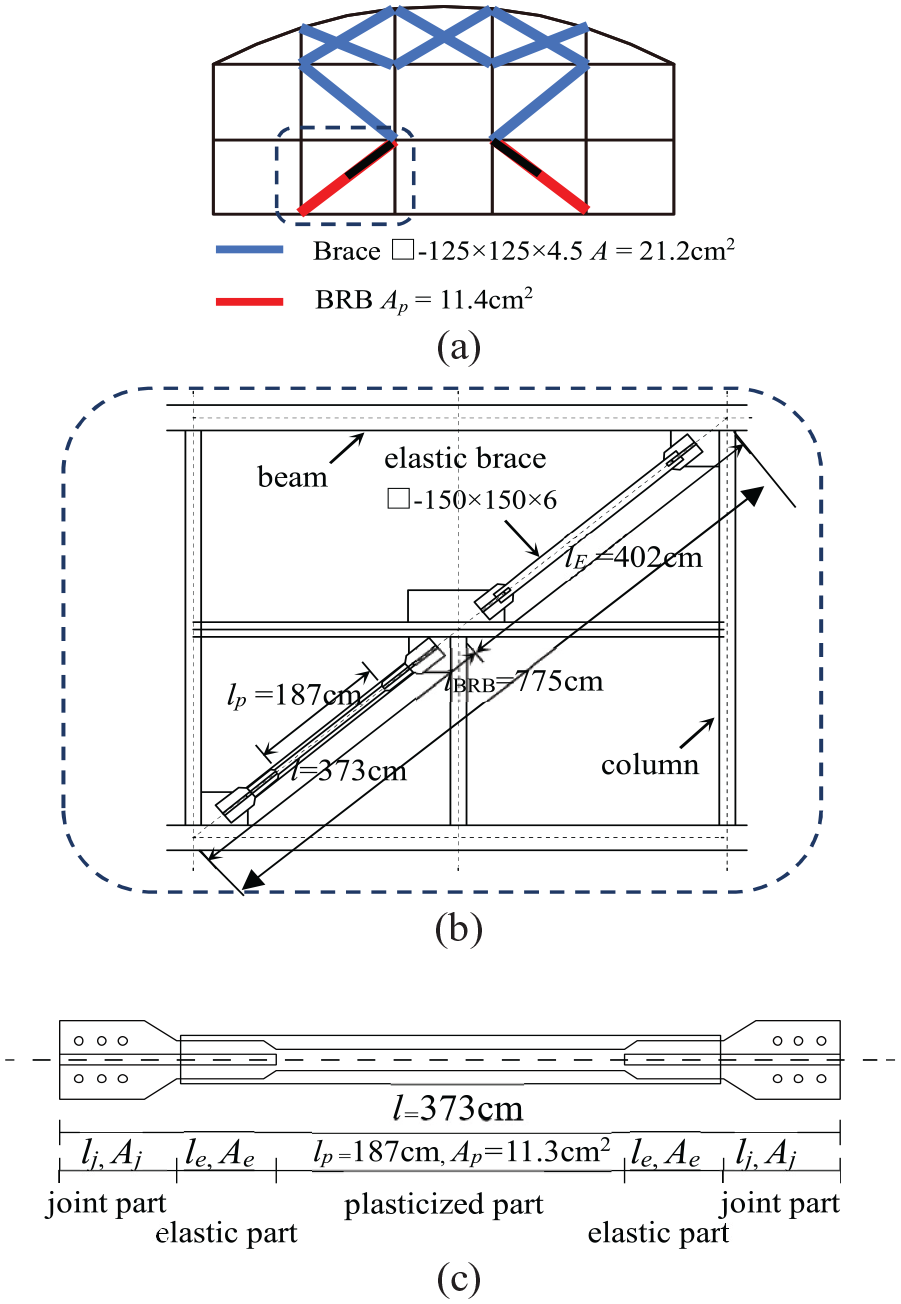
Configuration of substructure: (a) layout of braces and BRBs on gable end, (b) composition of one BRB frame, and (c) BRB.
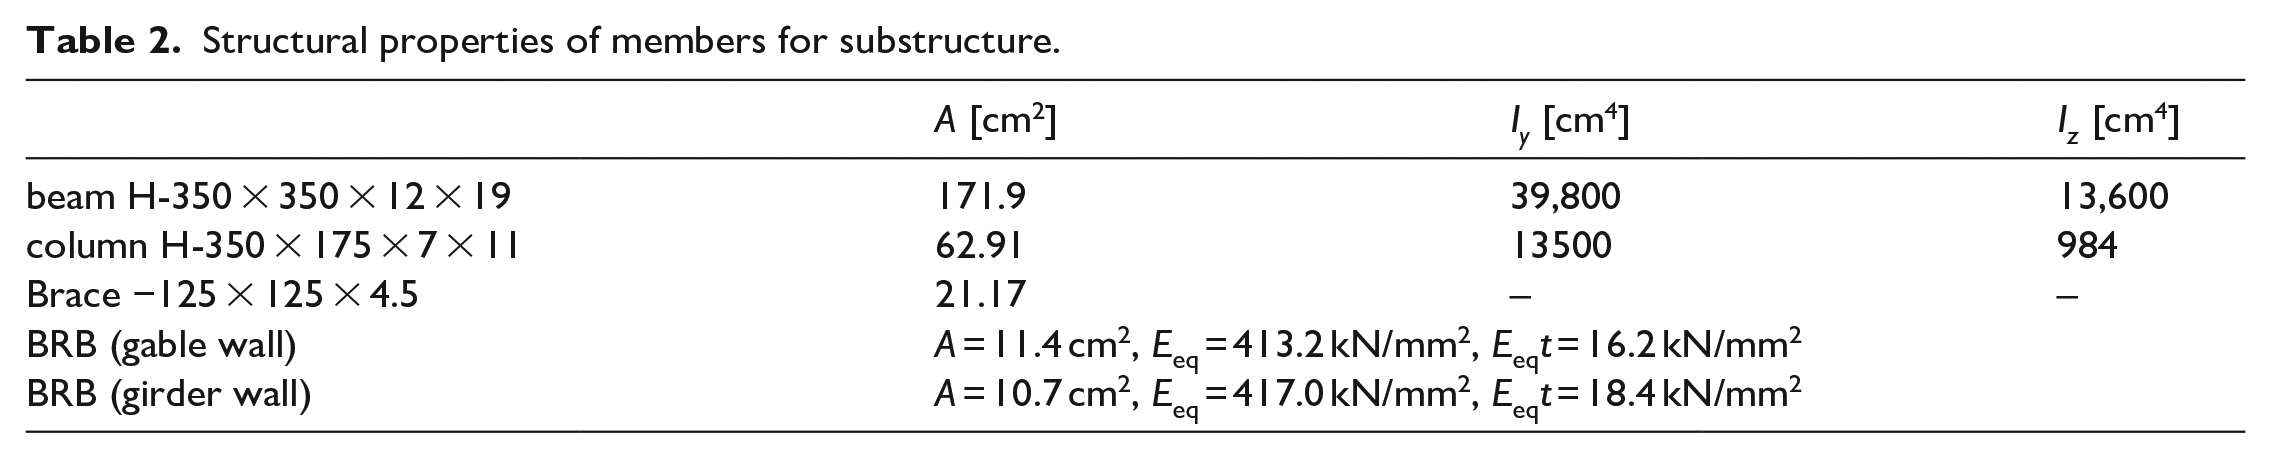
Thus, four sets of BRBs work effectively against input in the Y-direction. The braces for the second story are assumed to behave elastic and remain stable under severe earthquakes, and the each cross section is proportioned as ABR = 33.63 cm2 adopting a rectangular hollow section −125 × 125 × 4.5 as shown in Table 2. The detail for the BRBs presented in Figure 6 shows that their size is rather small for BRBs because the total weight, including the roofs and walls, is light-weighed. The length lBRB between the nodal points of each BRBs is 775 cm, while the plasticized zone length lp is 187 cm. As shown in Table 2, the sectional area of the plasticized zone is 11.4 cm2 and the nominal yield stress is σy = 225 N/mm2, mentioned above according to a Japanese design convention. The BRBs are modeled in numerical analysis as an equivalent single truss element possessing bilinear hysteresis backbone characteristics. The equivalent Young’s modulus of a single truss element with an equivalent length lBRB = 775 cm is Eeq = 413 kN/mm2, which reduces to Eeq(p) = 16.2 kN/mm2 under plasticization. The evaluation details of the equivalent properties are abbreviated herein. Considering the stiffness of the first story BRBs and the second story braces, the horizontal stiffness K1 is determined to be 69.86 kN/mm. This is based on the assumption that the roof behaves as a rigid body and is modeled as an equivalent single degree-of-freedom (SDOF) system. The natural period of an equivalent SDOF system T0 is 0.336 s when the weight is 1959.3 kN. After plasticization, the second modulus K2 is 5.49 kN/mm. Consequently, the secondary stiffness ratio κ = K2/K1 is 0.079. The pushover relationship is shown in Figure 7 with a uniform load in the Y-direction acting on the entire model roof.
Structural properties of members for substructure.
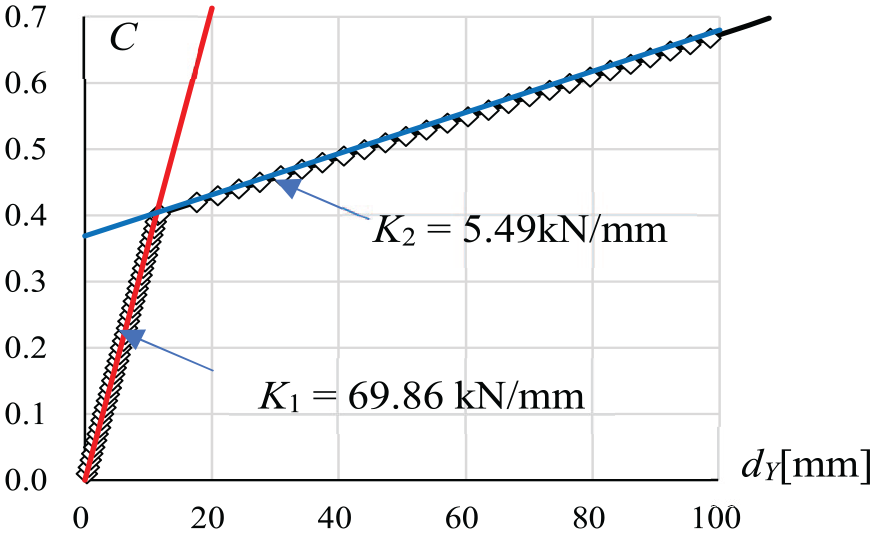
Relationshop between layer shear coefficient C and Y-directional displacement dY at gable roof edge under incremantal Y-Directional uniform load.
Earthquake accelerations applied to response analysis
The present study employs the design regulation of Japan 16 for earthquake response analysis, which specifies two intensity levels: serviceability limit level and ultimate limit level. The intensity of the former is denoted herein by λE = 1.0 and the latter by λE = 5.0; thus, the latter is five times larger in intensity than the former. Under the former level, a structure should be free from any damage to structural elements, including finishing. By contrast, the structure under ultimate limit level is expected to withstand conditions to ensure no loss of human life without collapsing.
For comparison, the present study also examines the cases of responses under the acceleration response spectrum based on the Chinese code (GB50011-2010). Notably, the present study adopts a seismic design spectrum 17 with a Design Seismic Group of group 3, Site Class IV, and Intensity 8.
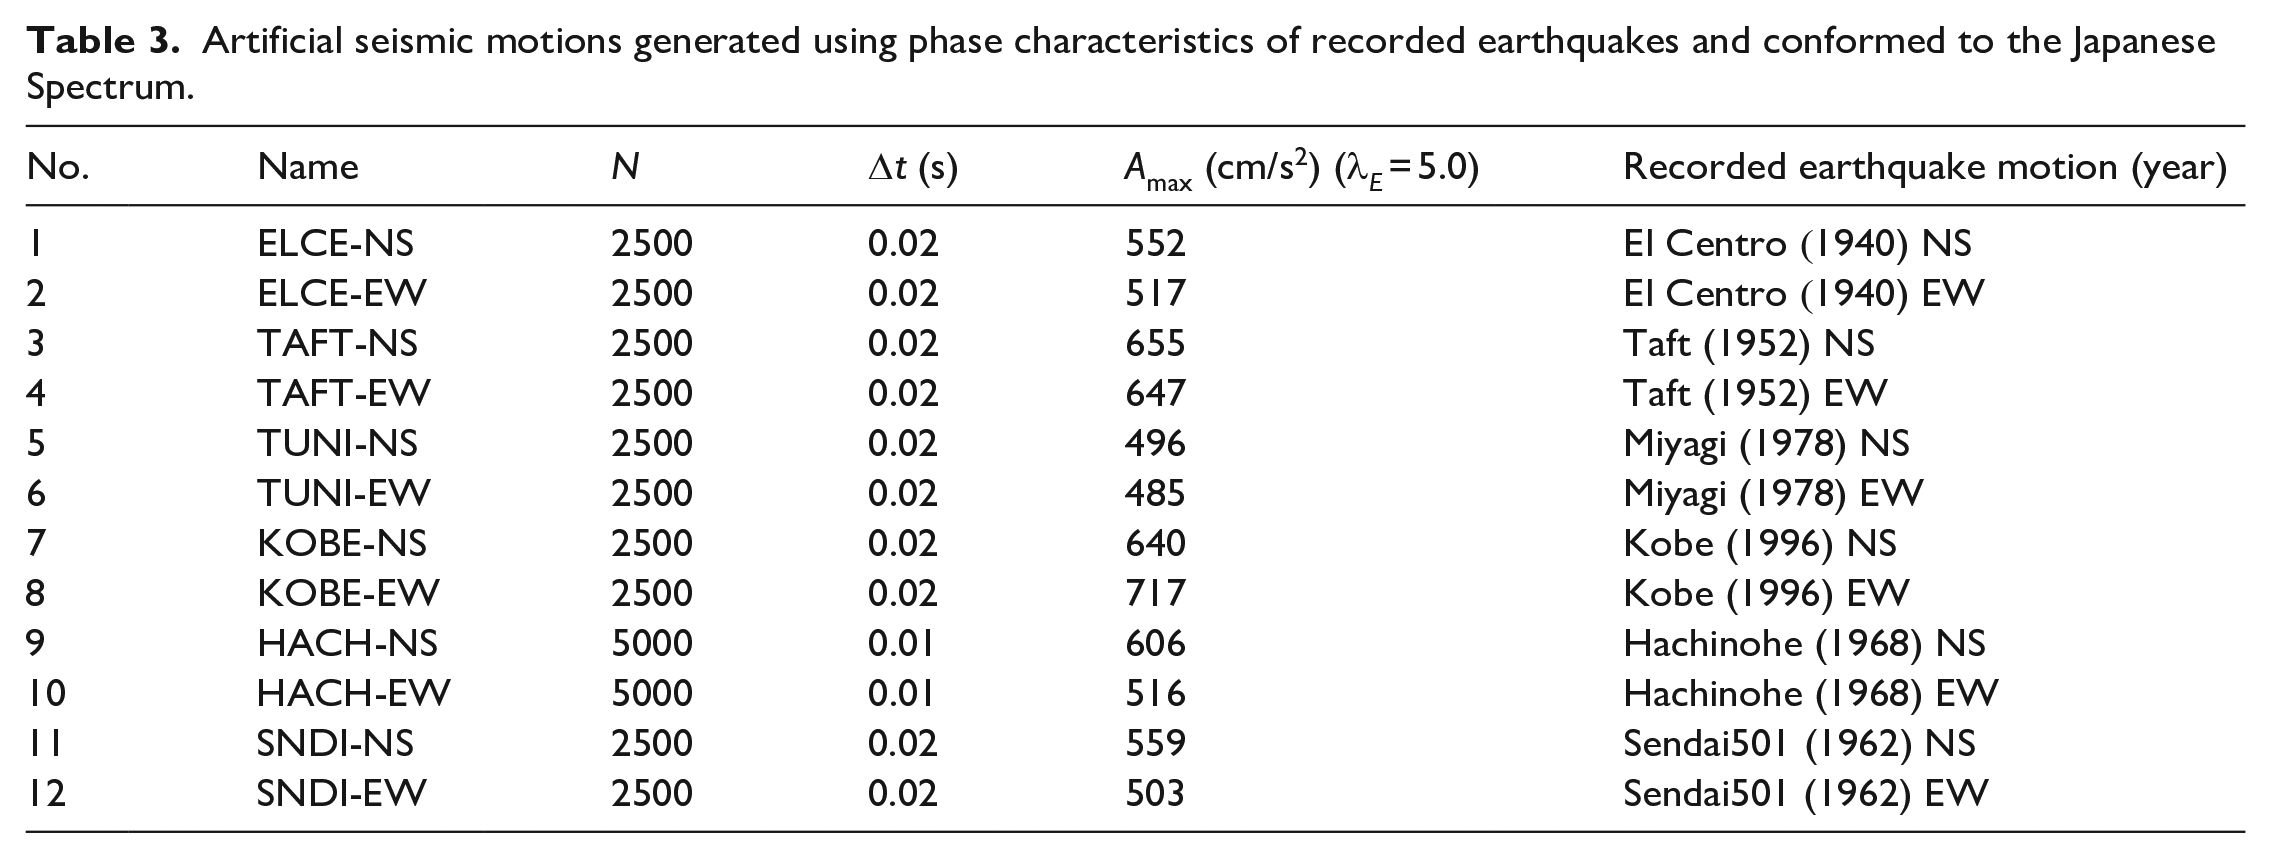
The artificial seismic motions are produced to conform to the design spectra with a damping ratio h = 5% for both cases of Japan’s and China’s codes. These motions utilize the phase characteristics of the 12 recorded earthquake motions shown in Table 3. The table presents the number of data N, data interval Δt, and peak acceleration Amax for each artificial earthquake motion corresponding to a seismic intensity of λE = 5.0. Figure 8 shows the time history waveform of the artificial seismic motion.
Artificial seismic motions generated using phase characteristics of recorded earthquakes and conformed to the Japanese Spectrum.
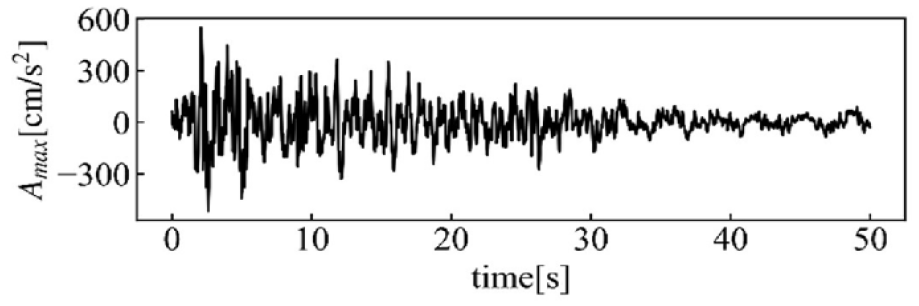
Earthquake motion created to conform to the Japanese design acceleration response spectrum (Phase data: No. 1 in Table 3, λE = 5.0).
Figure 9 compares the safety limit level (λE = 5.0) of seismic design spectra between Japan and China. A Rayleigh damping with h = 2% is applied in the subsequent earthquake response analysis. The interpreted spectra with h = 2% are also shown in the figure. The two spectra have almost the same maximum acceleration, and the range over which the acceleration remains constant is a little broader in the Chinese spectrum than the Japanese code.
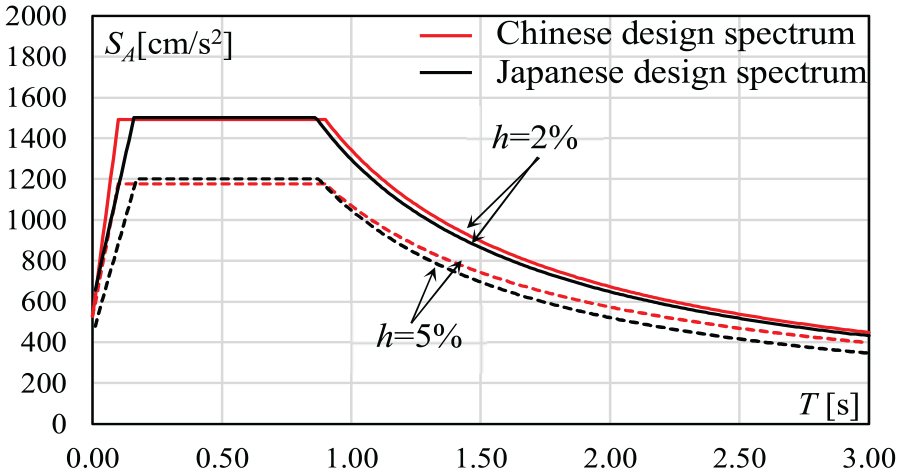
Comparison of design spectrum between Japanese code and Chinese code.
Figures 10 and 11, respectively show the mean and standard deviation of the acceleration response spectra of the 12 seismic waves generated compatible with each design spectrum. The magnitude shown in Figures 10 and 11 is assumed to correspond to λE = 5.0 based on the Japanese scenario. Notably, the serviceability limit level of λE = 1.0 corresponds to 0.2 times the ultimate limit level of λE = 5.0. The aforementioned results fit well for h = 5%, but the artificial seismic waves show a slightly large response for h = 2%. Additionally, the standard deviation for h = 2% in the region with constant acceleration in the spectrum is approximately 200 cm/s², which is around 13% of the average. In the subsequent incremental dynamic analysis (IDA), the seismic intensity is denoted as λE, serving as an indicator of the magnitude of the input seismic motion.
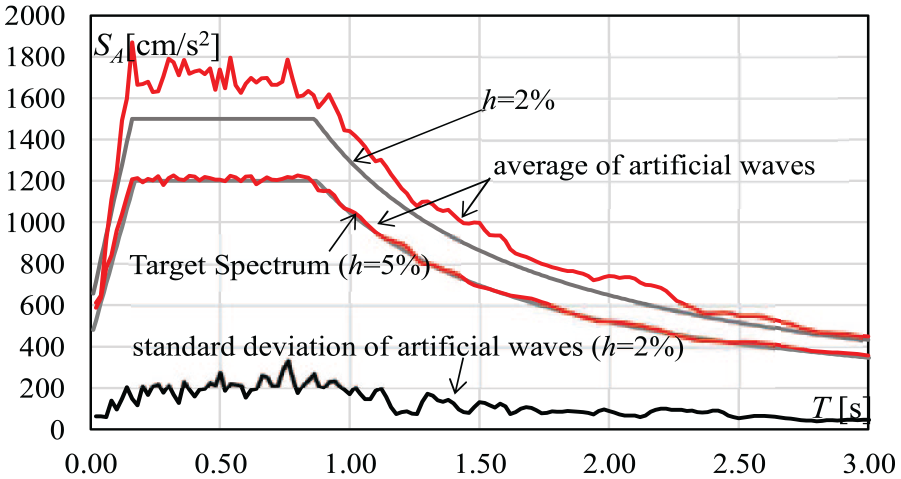
Acceleration response spectra with standard deviation based on Japanese code; average of 12 simulated waves, and assumed to correspond to λE = 5.0 for ultimate limit level.
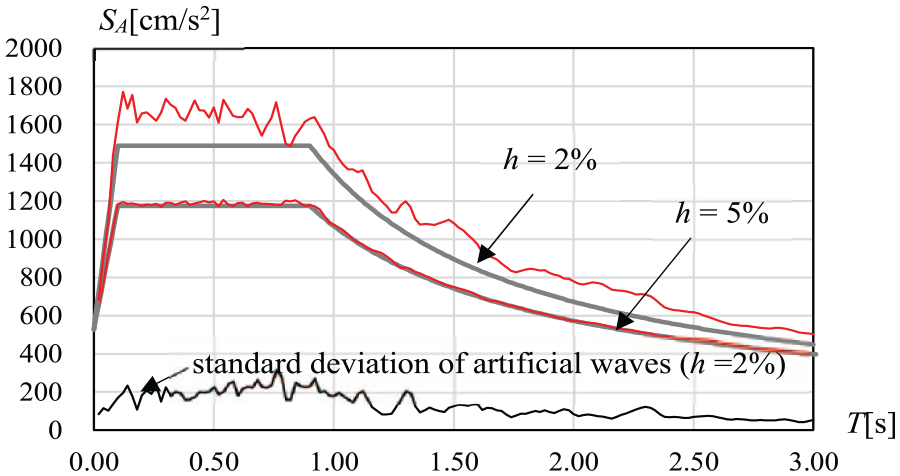
Acceleration response spectra with standard deviation based on Chinese code; average of 12 simulated waves, and assumed to correspond to λE = 5.0 for ultimate limit level.
Eigenvalue analysis
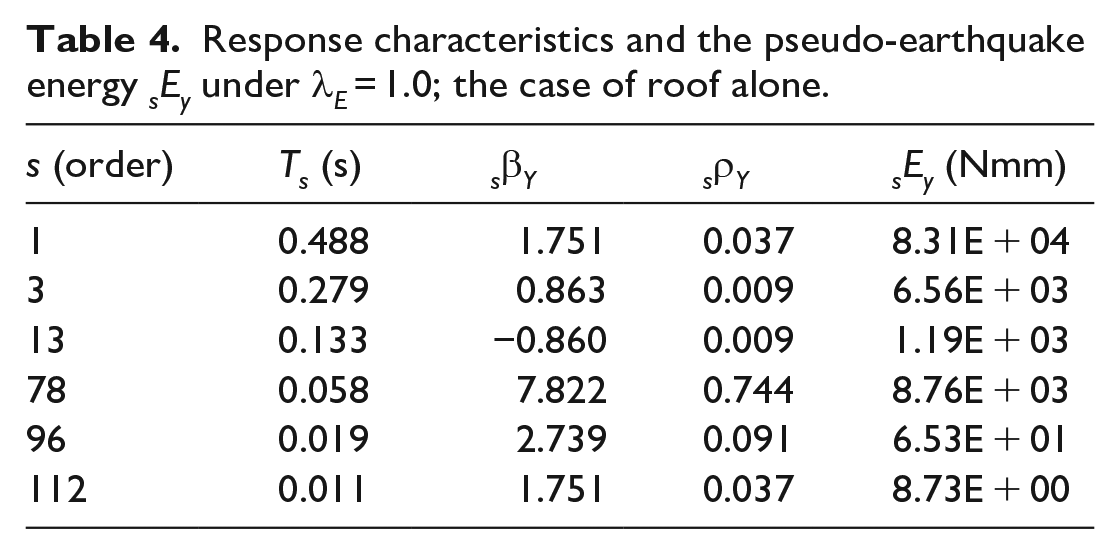
The present section aims to enhance the understanding of the vibrational characteristics of the roof by presenting results of the natural vibration analysis for the superstructure (roof structure) alone as well as for the full model comprising the superstructure and the substructure. Earthquake motions are inputted horizontally in the Y-direction, as mentioned in the former section. Table 4 and Figure 12, respectively present the results of the eigenvalue analysis and the corresponding vibrational modes of the roof structure. The data in Table 4 are arranged in descending order of the natural period, focusing on the selection of the six largest pseudo-earthquake energy based on equation (1). The pseudo-earthquake energy in Table 4 corresponds to earthquake input λE = 1.0.
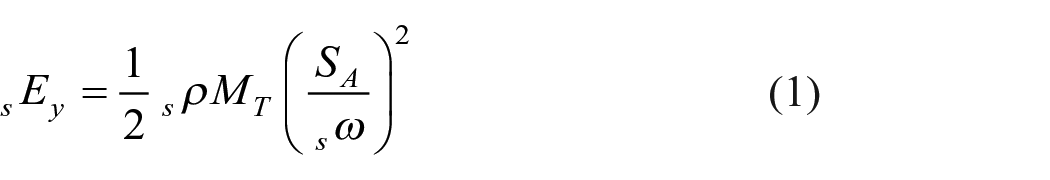
where MT, sρ, sω, and SA denote the total mass of the structure, mass ratio, natural circular frequency of the s-th vibration mode, and the acceleration response spectrum in Japan, respectively.
Response characteristics and the pseudo-earthquake energy sEy under λE = 1.0; the case of roof alone.
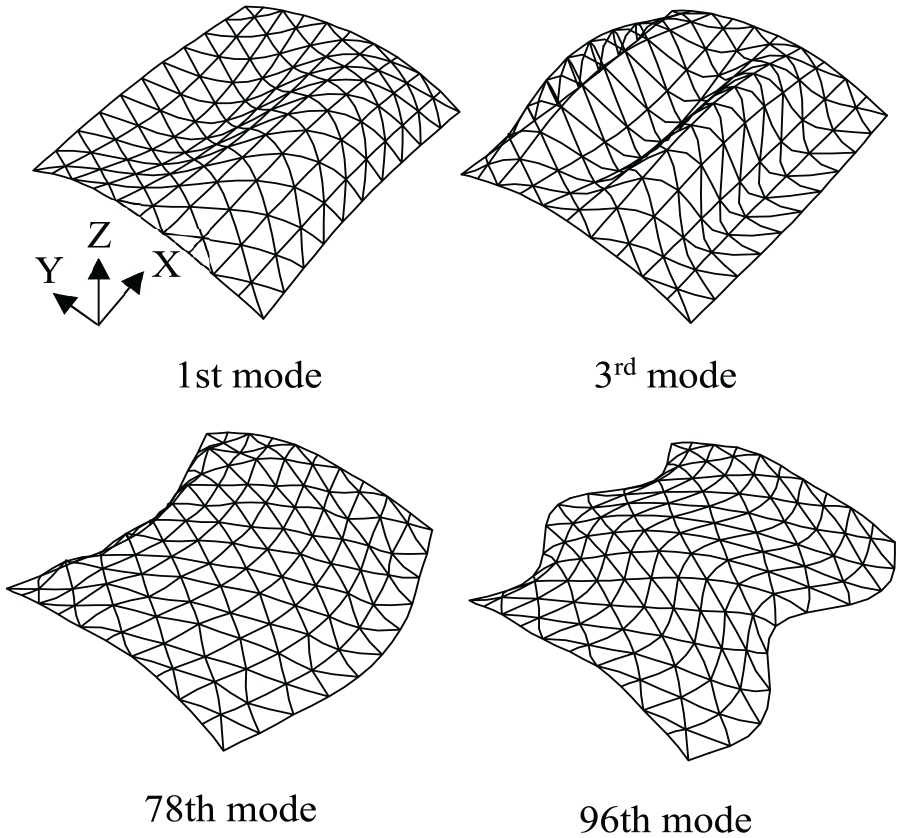
Vibrational modes of superstructure alone with a simple support of Figure 3.
The first and third modes correspond to bending action, while the 78th and 96th modes correspond to sway action. The mode with the largest strain energy is the first mode, and that with the largest effective mass ratio is the 78th mode. The discrepancy between modes with large effective mass ratios and those with large strain energy is commonly observed in single-layer latticed shells with excited numerous modes. 18 Modes with substantial strain energy are essential for stress evaluation; thus, some higher-order modes play a crucial role in the assessment of horizontal earthquake force.
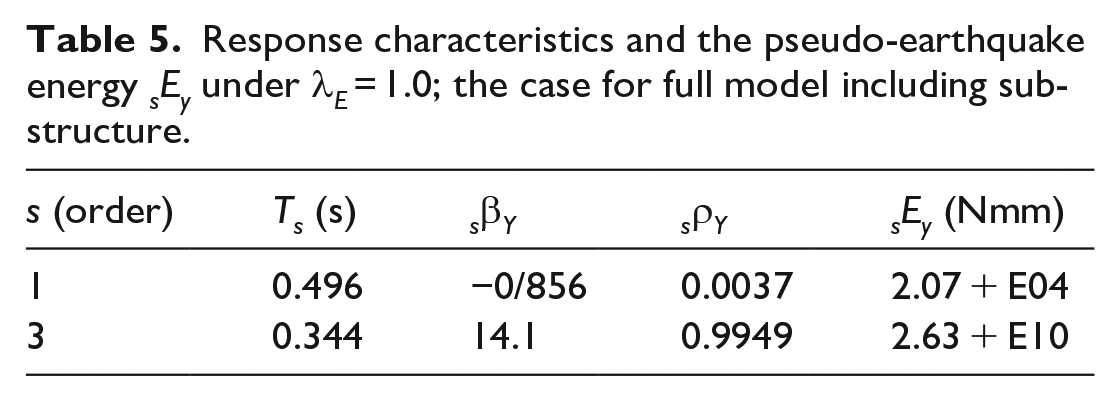
The introduction of a substructure dramatically simplifies the complex eigen-vibrational characteristics of the superstructure. As shown in Figure 13 and Table 5, the first mode involves large vertical oscillations of the superstructure, while the third mode induces a large sway vibrations within the substructure. Moreover, the effective mass ratio of the third mode reaches 99.5%, and the mode becomes dominant in terms of strain energy. The natural period of the third mode T3 = 0.344[s], which roughly corresponds to the natural period T0 = 0.336[s] for an equivalent SDOF system. As discussed in Takeuchi et al., 8 the ratio RT between the T0 and the natural period of the dominant vibration mode of the roof model is an important factor in the response amplification of the roof. In the present model, the value of RT is 0.336/0.488 = 0.69.
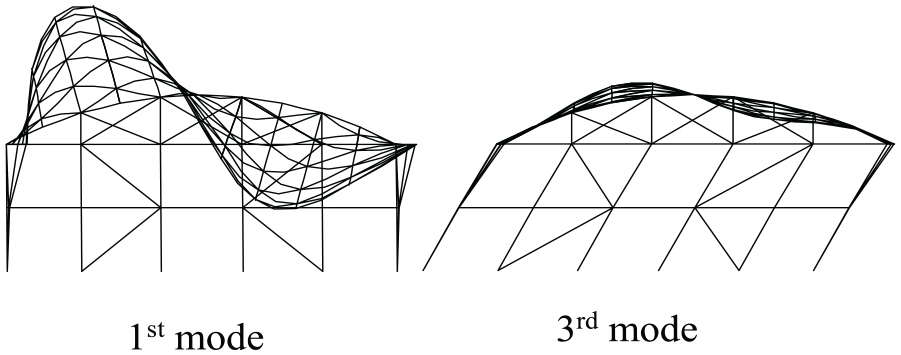
Vibrational modes of full model.
Response characteristics and the pseudo-earthquake energy sEy under λE = 1.0; the case for full model including sub-structure.
Nonlinear response analysis
The present section analyzes the nonlinear response of the full model comprising the roof and the substructure, and discusses on the results. The results are obtained on the IDA. The 12 waves generated in Chapter 3 are applied for the seismic motion; the 12 waves fitting the seismic design spectra Japan and the 12 waves of China. The Newmark-β method (β = 1/4) is employed as the numerical analysis method. The response analysis is repeatedly performed depending on the magnitude of earthquake intensity denoted with λE. The intensity λE is varied to cover the ranges of 1.0, 2.0, 2.5, 3.0, 4.0, 4.5, 5.0, 5.5, and 6.0. Geometric and material nonlinearities are considered in each response analysis with a duration of 50 s just after the dead load of 0.8 kN/m2 is applied. Rayleigh damping is assumed in the analysis, providing h = 2% damping factor at the natural periods, which corresponds to T1 = 0.496 s and T3 = 0.344 s.
Elastic-plastic response of substructure
Figure 14 shows the relationship between the axial strain and force of the BRB. The axial strain is measured for the replaced member with a length lBRB = 775 cm. As mentioned above, two BRBs are placed at each gable, but no significant difference in response is observed between the four BRBs. The responses shown in Figure 14 are obtained in accordance with an artificial earthquake motion fitted to the Japanese design spectrum, and the phase characteristics are those of the El-Centro NS.
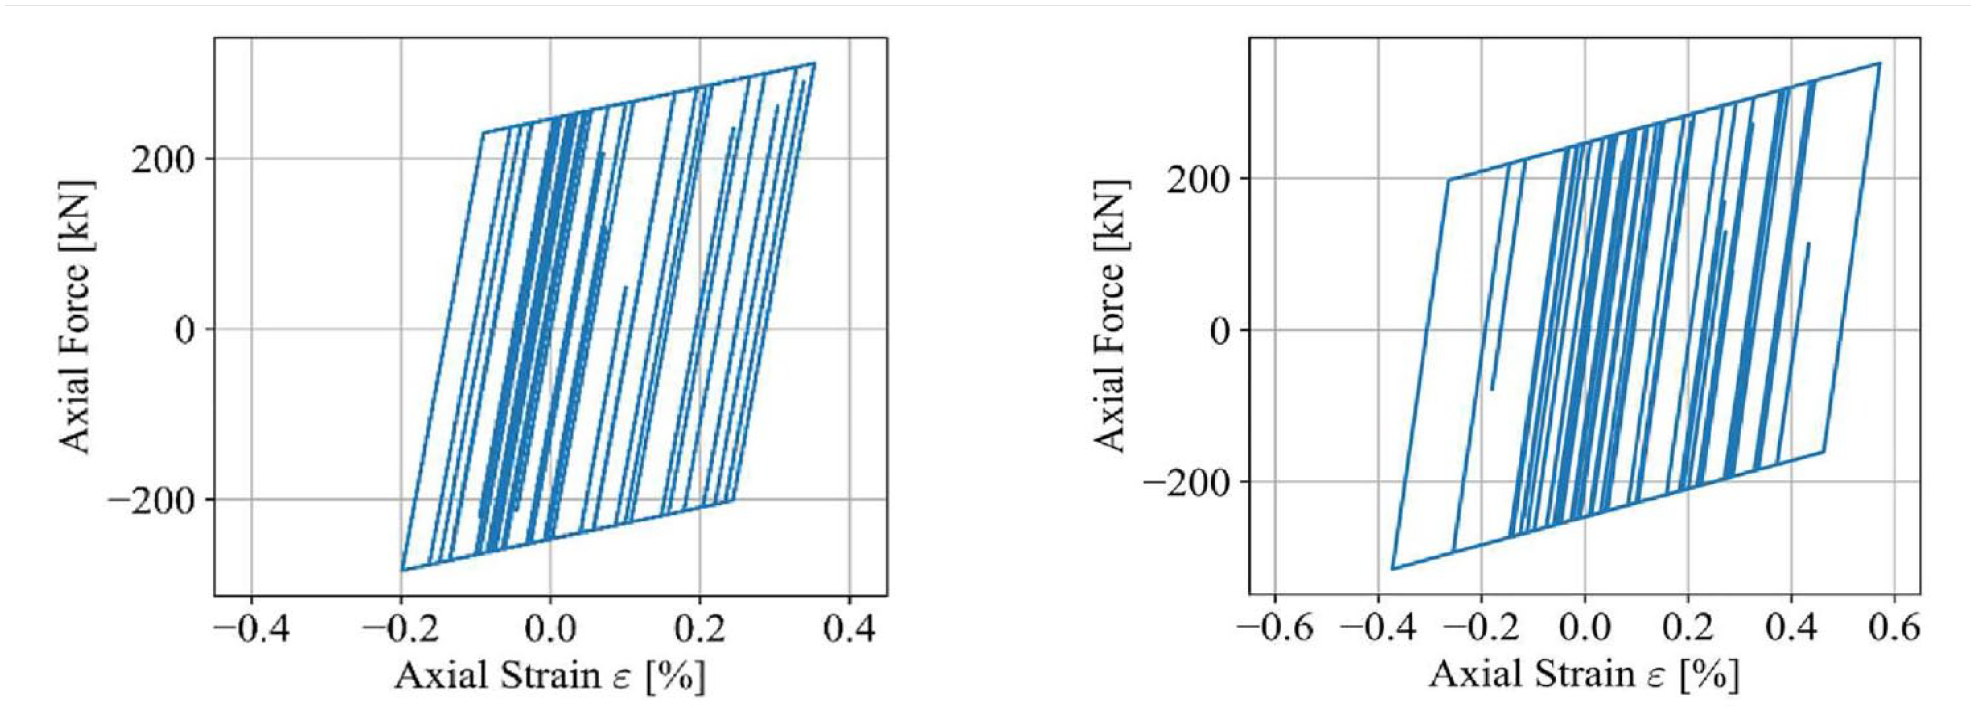
Relationship between axial force and strain of the BRB. left: λE = 5.0, right: λE = 6.0.
Response of the roof and its response reduction effect
Figure 15 illustrates the distribution of displacement and acceleration along the two sections: section A–A′ located in the center of the roof and section D–E, located on the girder of the roof. Notably, these response values are computed as the average of the absolute maximum values derived from the 12 seismic waves for each analysis case. DL in Figure 15 represents the response values to the dead load. The responses of displacement shown in Figure 15 include the the component due to the dead load; thus, the contribution of earthquakes is evaluated by reducing the dead load component. At the quarter point of section A–A′, relatively large displacement and acceleration occur in the vertical direction. In A–A′ section, the displacement and acceleration in the horizontal direction (Y-direction) are nearly constant. The horizontal acceleration and displacement at the center of the girder are slightly greater than those at the ends of the girder (Figure 15(f)), but are generally uniformly distributed. It should be noted that the components due to earthquake motions are judged to be relatively small compared with those due to dead load.
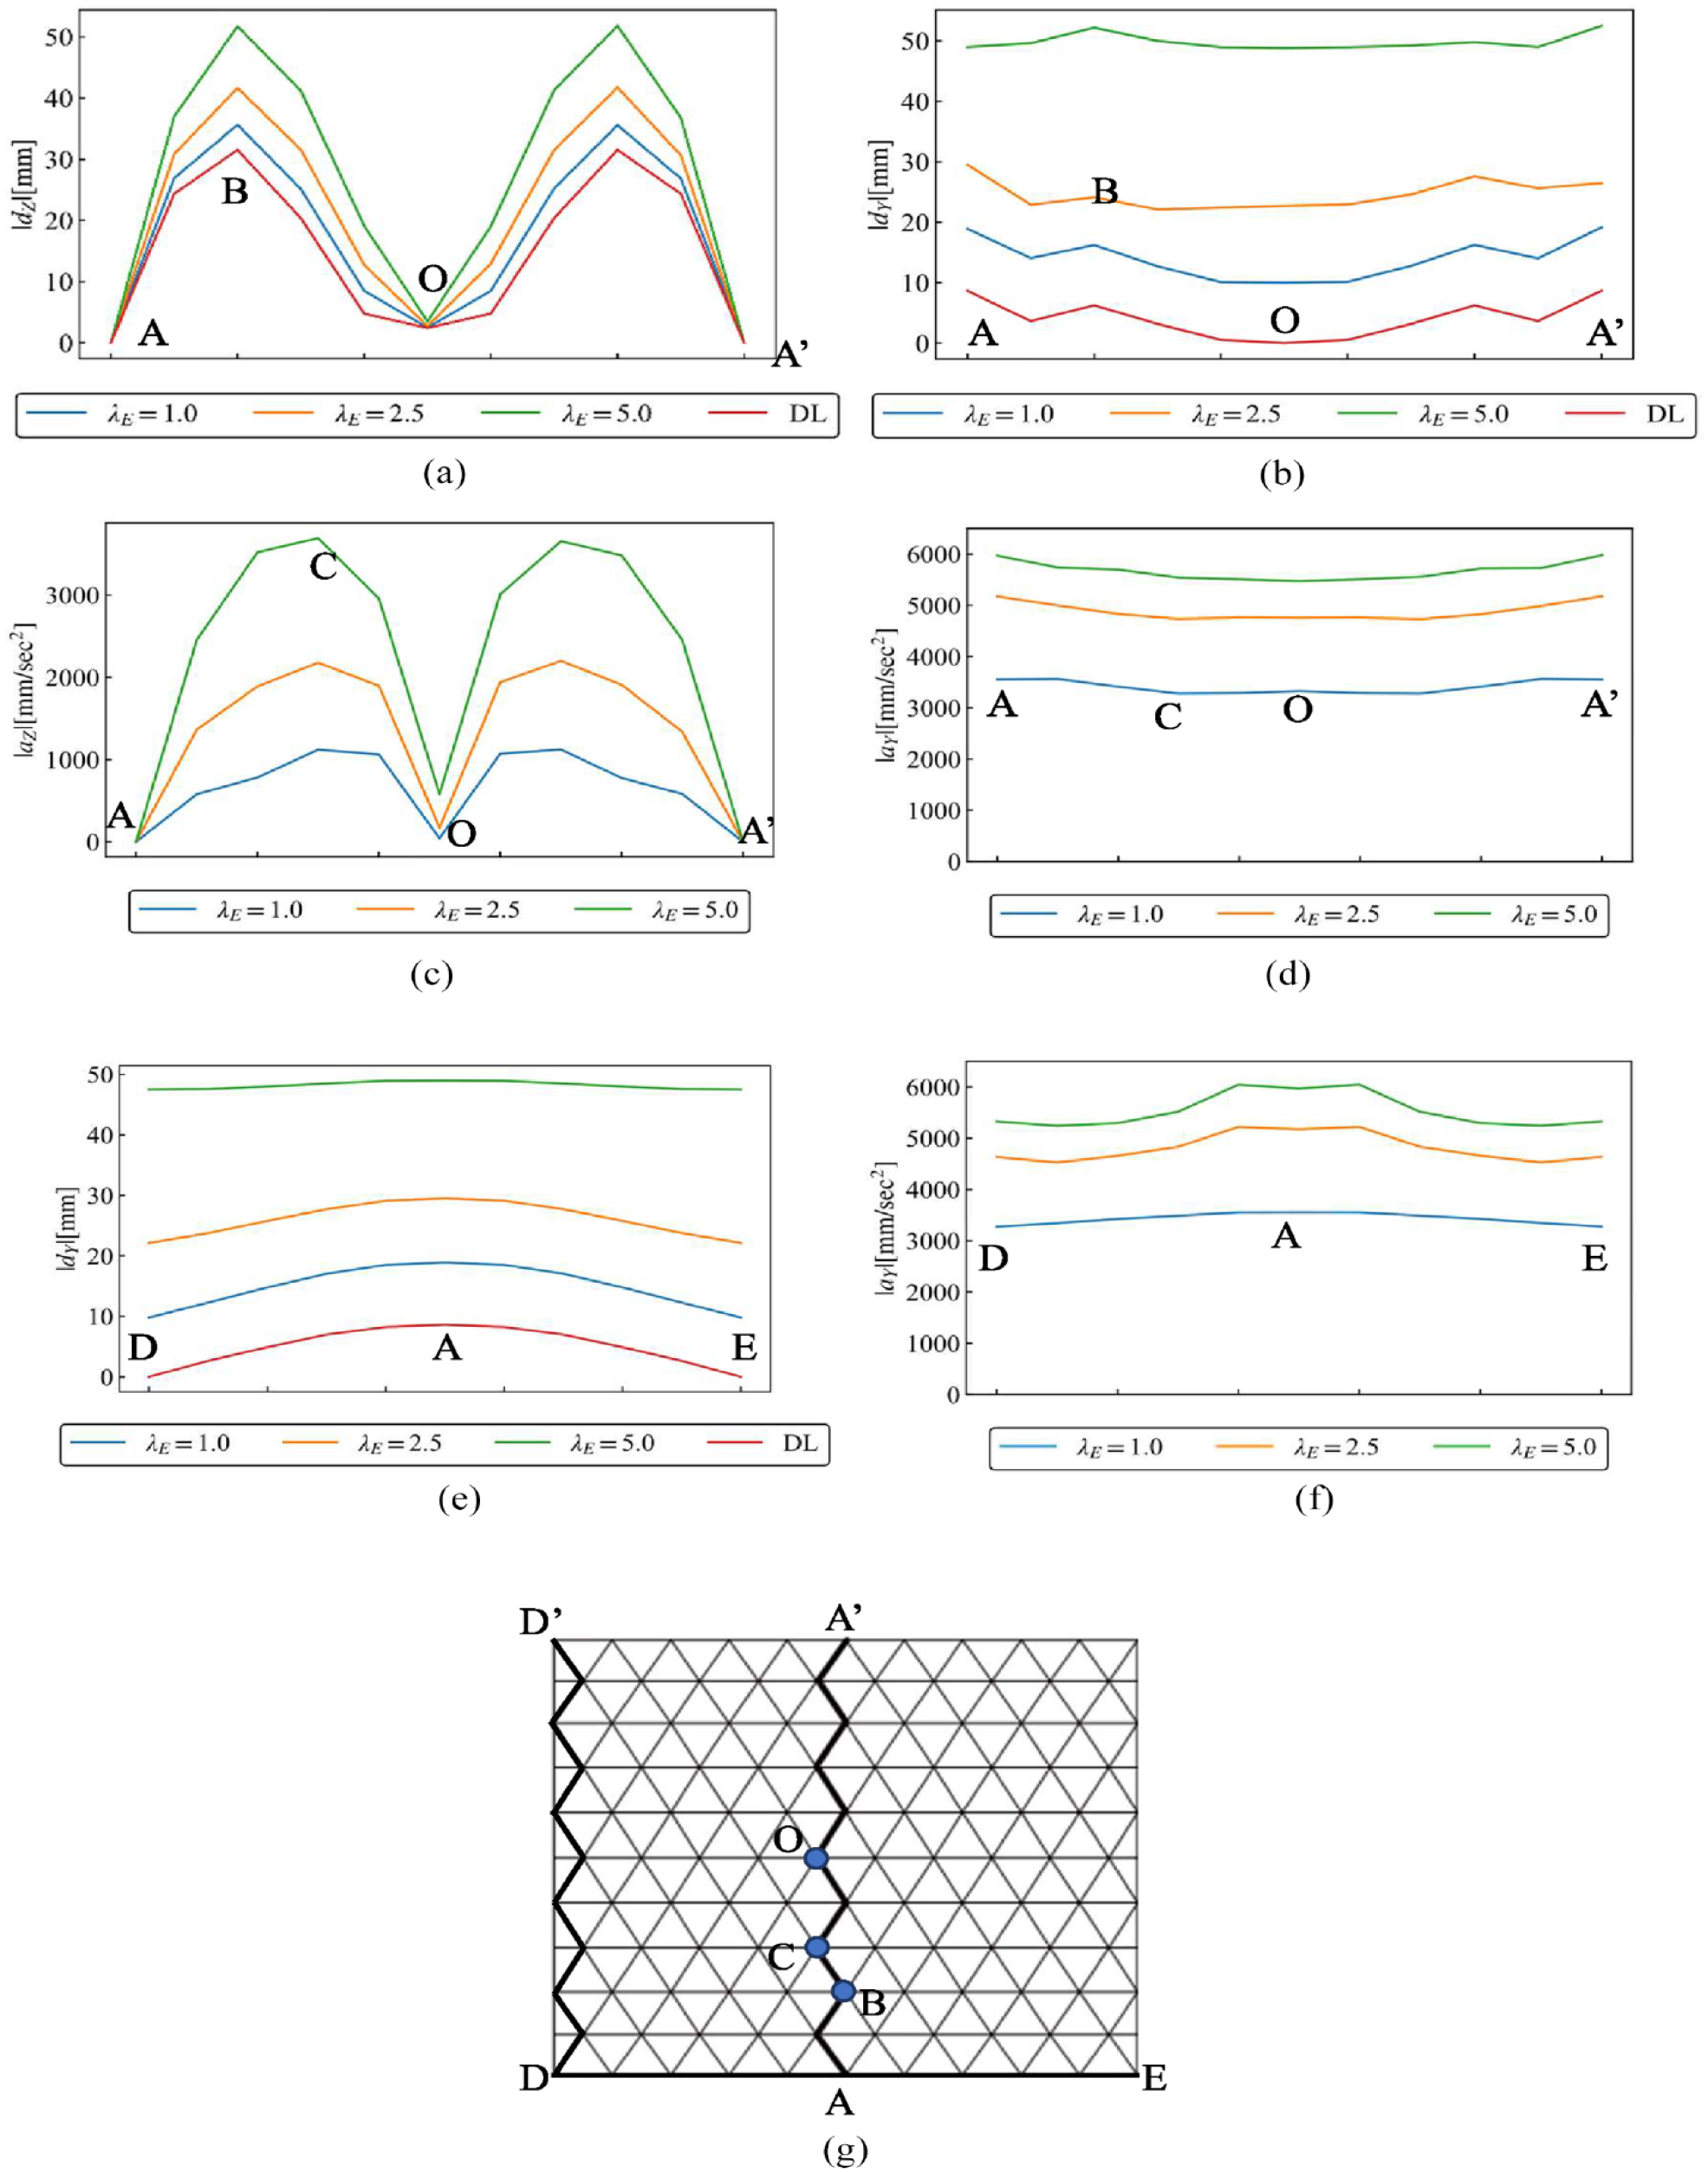
Distributions of response acceleration and displacement for artificial earthquake motion generated to conform to the Japanese design earthquake spectrum: (a) vertical displacements, (b) horizontal displacements, (c) vertical accelerations, (d) horizontal accelerations on A–A′ section, (e) horizontal displacements on D-E section, (f) horizontal accelerations on D-E section, and (g) positions of A–A′ and A–E.
Hereafter, the response reduction rate ξ is introduced as shown in equation (2) to quantify the effects of plasticizing of BRBs. In this equation, R(λE) is the response value after the dead load contribution is deducted.
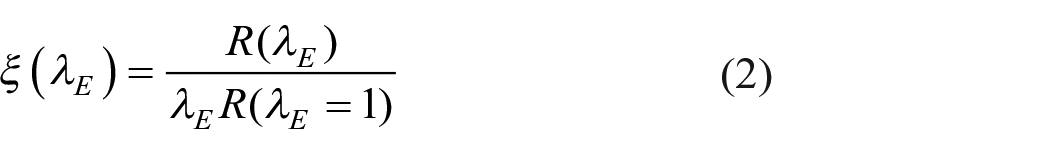
where R(λE) denotes the maximum absolute response for seismic intensity λE . More importantly, the denominator R(λE = 1) corresponds to the case with elastic substructure. Therefore, the response reduction rate quantifies the extent to which the response of the superstructure has decreased due to the plasticization of the BRBs, which is relative to that when the substructure remains elastic for a given seismic intensity.
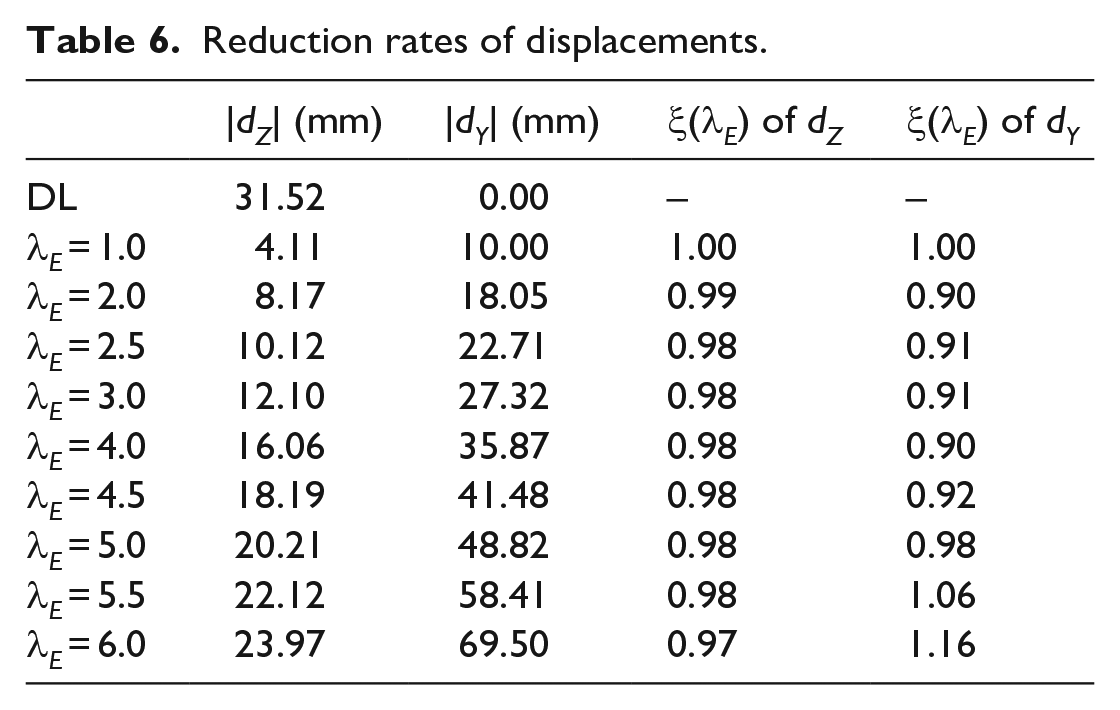
Table 6 presents the values of vertical displacement at point B, horizontal displacement at point O, and the response reduction rates. The locations of points B and O are indicated in Figure 15, where point B is the position with the largest vertical displacement, and point O is the center of the cross-section A–A′. The vertical and horizontal displacements tend to decrease only slightly, despite the substructure undergoes plasticization.
Reduction rates of displacements.
By contrast, Table 7 for the points C and O shows that the acceleration response reduction ratio ξ decreases as λE increases. The location of point C, which is also depicted in Figure 15, is under the largest vertical acceleration. The rapid reduction in acceleration input to the roof is attributed to the plasticization of the substructure. At a seismic intensity λE = 5.0, ξ is 0.66 and 0.33 for vertical and horizontal accelerations, respectively.
Reduction rates of acceleration.
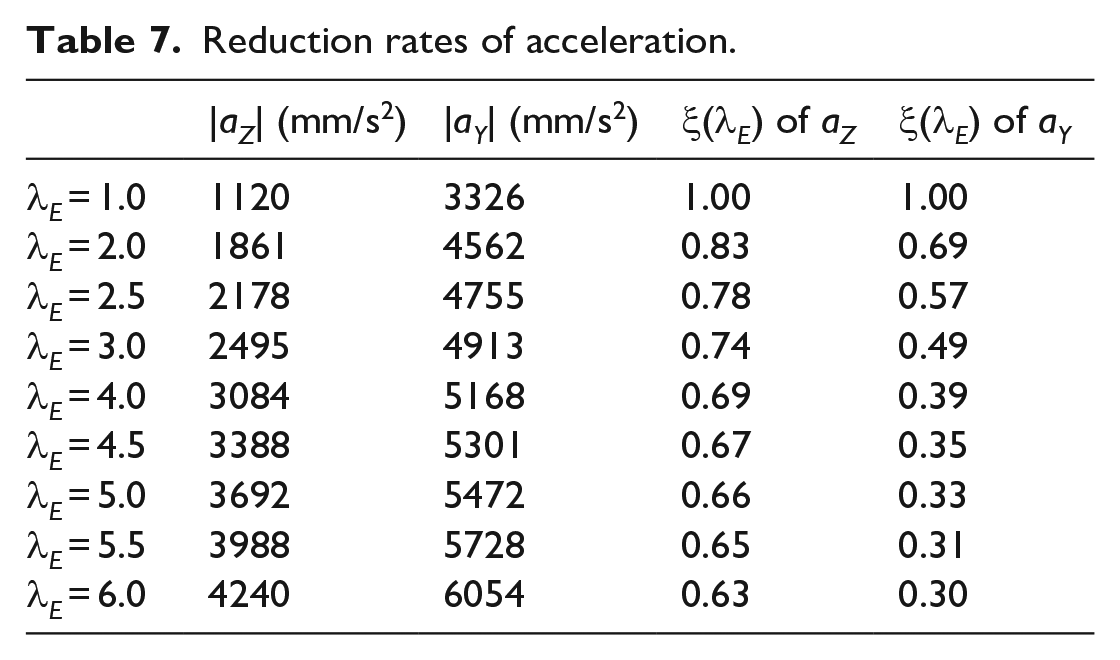
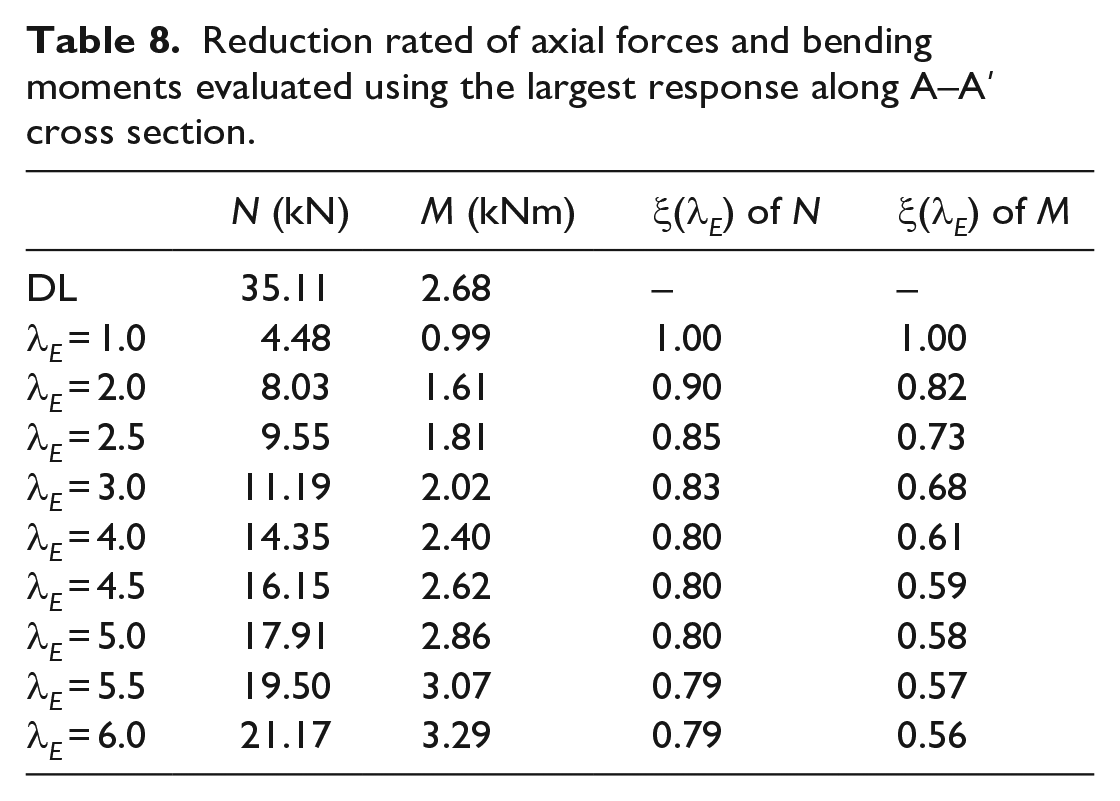
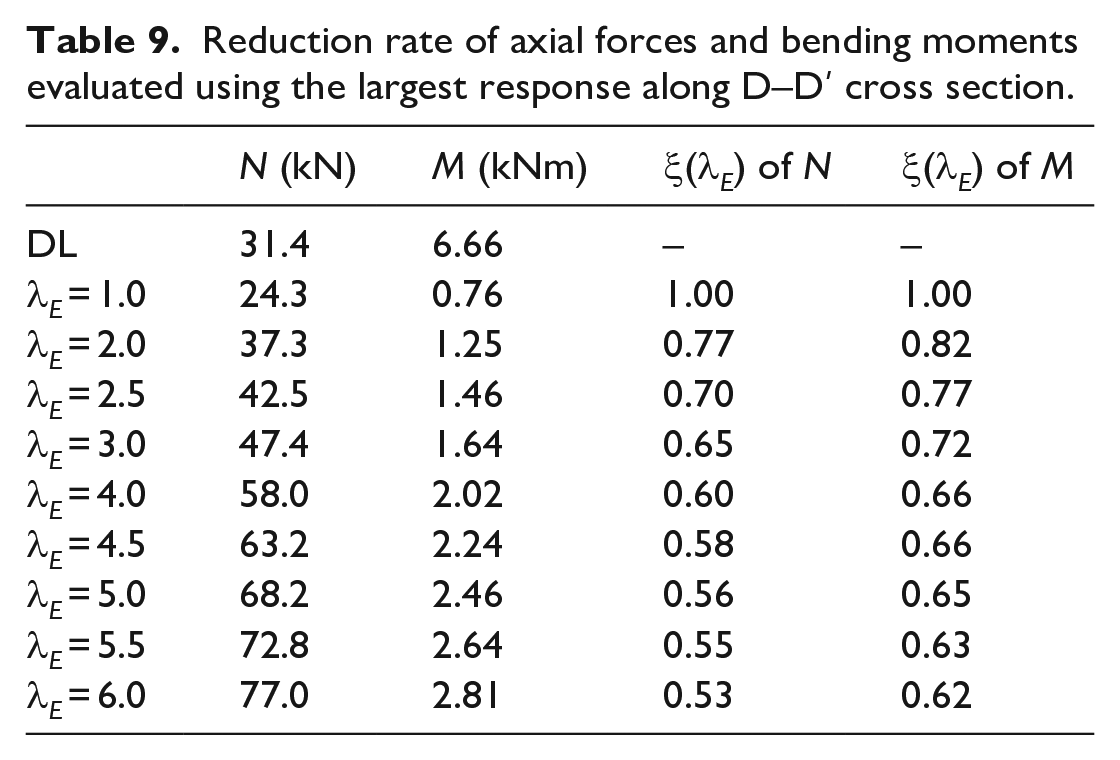
Figure 16 and Table 8 display the stress distributions along section A–A′ section and their reduction ratio, respectively. The values of the bending moment are evaluated as the square root of the sum of the squares of the bending moments My and Mz generated around the y- and z-axes with the x-axis along a member. The larger one of the two bending moments at both ends of one member is represented in the graph and the table. The stresses reduce to approximately 80% for axial forces and 58% for bending moments at λE = 5.0 compared to the elastic substructure without the plasticization of the substructure. Figure 17 and Table 8 show the stress distribution and reduction ratio of the diagonal members connected to the gable wall. The values of the reduction ratio at λE = 5.0 are 56% for axial force and 65% for bending moment, which also shows the suppression of stress response due to plasticization of the substructure (Table 9).
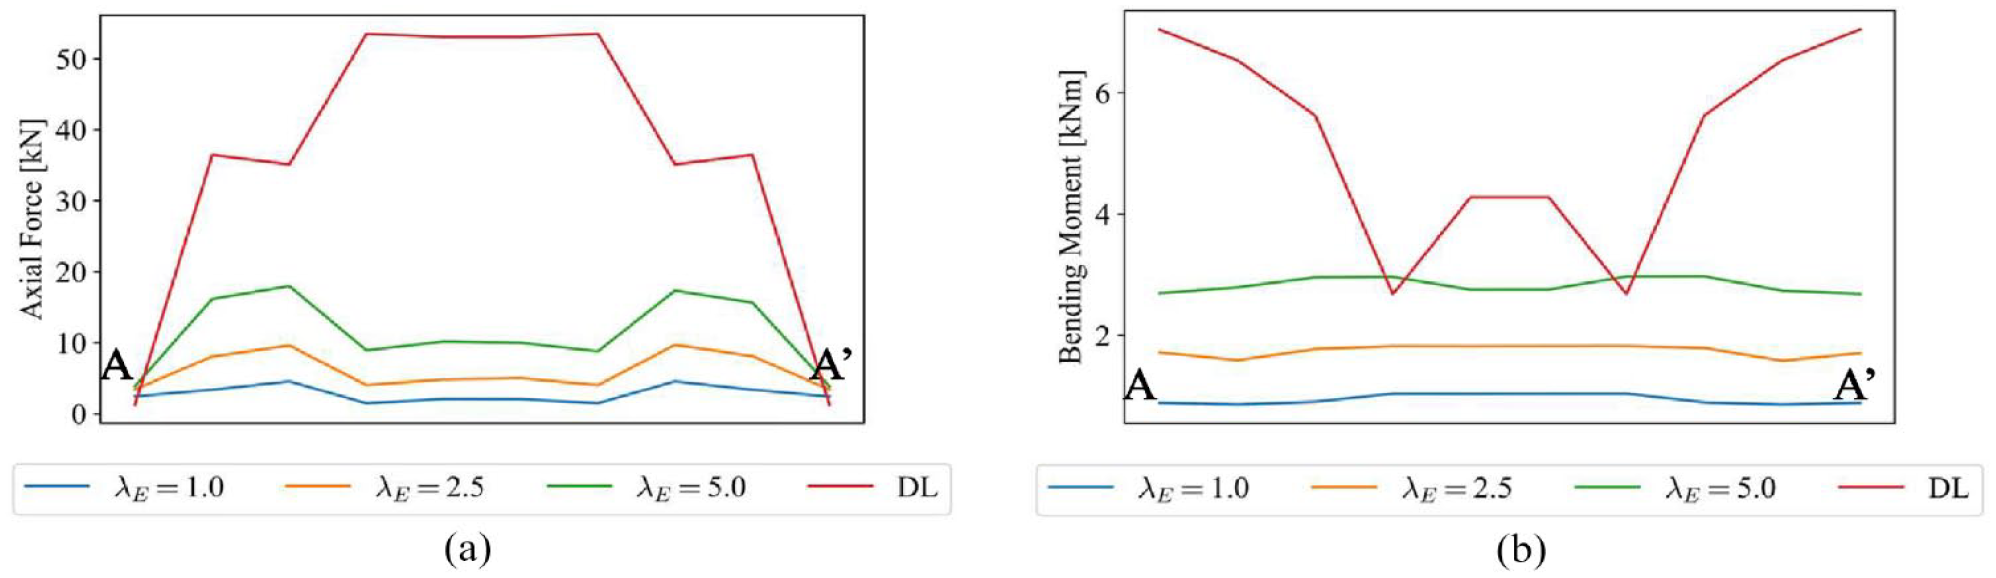
Distributions of maximum stress responses to earthquake motion made to conform to the Japanese seismic design spectrum: (a) axial force responses and (b) bending moment responses.
Reduction rated of axial forces and bending moments evaluated using the largest response along A–A′ cross section.
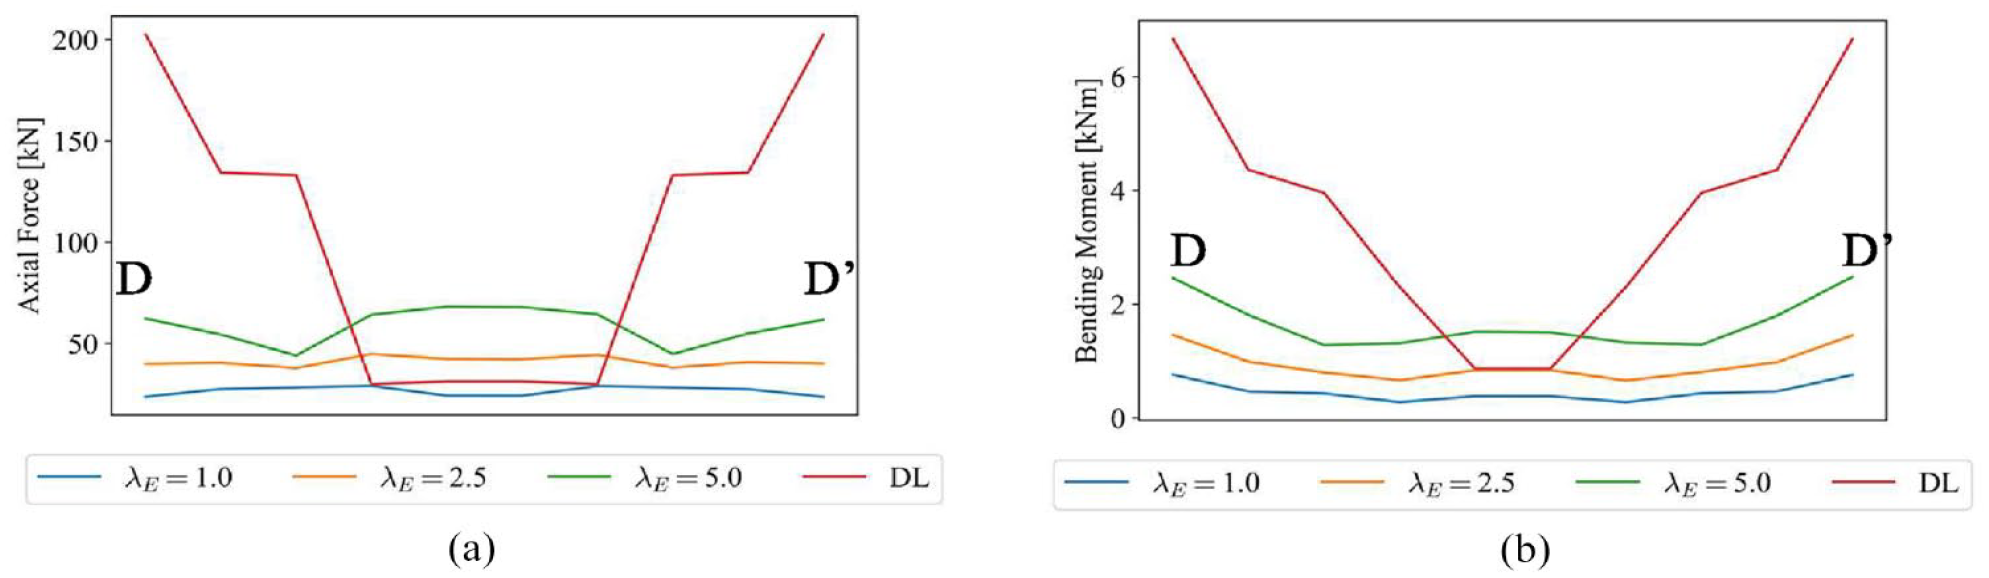
Distributions of maximum stress responses on section D–D′ to earthquake motion made to conform to the Japanese seismic design spectrum: (a) axial force responses and (b) bending moment responses.
Reduction rate of axial forces and bending moments evaluated using the largest response along D–D′ cross section.
As found in Chapter 5, the displacements along section A–A′ are found not to reduce due to the plasticization of BRBs. On the other hand, the plasticization of BRBs is found to raise a large reduction in stresses. This trend differs from that of the placement of BRBs in the dome’s substructure. 12 Since the dominant mode of the shell in this study is a large-sway mode of the substructure (Figure 13), the displacement response increases as the equivalent natural period elongates with the plasticization of the substructure. In addition, the effect of damping increases as the substructure plasticizes, and the seismic motion input to the roof becomes smaller. These dynamic properties vary depending on the ratio of the natural period RT, and the mass ratio RM. 8 Furthermore, the number of dominant vibration modes of a roof structure depends on the roof geometry and span-depth ratio, with cylindrical shells having fewer dominant vibration modes than domes. 18 Findings from this study’s model suggest that strategic plasticization can have a stress-relaxation effect under severe earthquakes. However, the scope of its application and the value of the response reduction ratio should be subject to further analysis based on the dynamic properties of the substructure and the parameters of the cylindrical geometry.
Response evaluation by equivalent linearization method
In many engineering applications, the complexity of nonlinear behavior is often addressed through simplified methods, one of which is the Equivalent Linearization Method (ELM). The ELM provides a means of approximating the nonlinear behavior of a system by transforming it into an equivalent linear system. This section examines the applicability of the ELM in evaluating the response of the cylindrical latticed shells in this study.
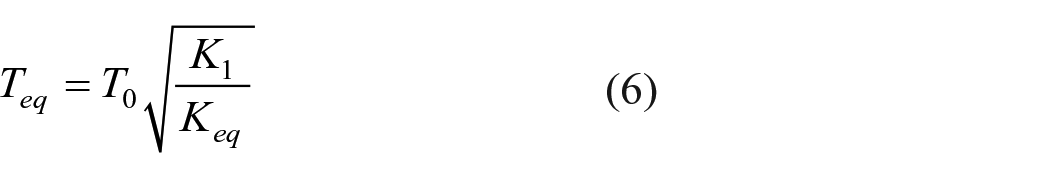
The equivalent stiffness Keq, equivalent damping ratio heq, and the response reduction rate due to damping Dh are calculated using equations (3)–(5) based on the procedure proposed by Kasai et al. 19 The equivalent natural period Teq is calculated by equation (6). Subsequently, the peak response acceleration Aeq and displacement Deq of the equivalent SDOF are computed using Dh. The procedure in equations (3)–(6) is iteratively repeated until the Deq corresponding to λE converges in this study.
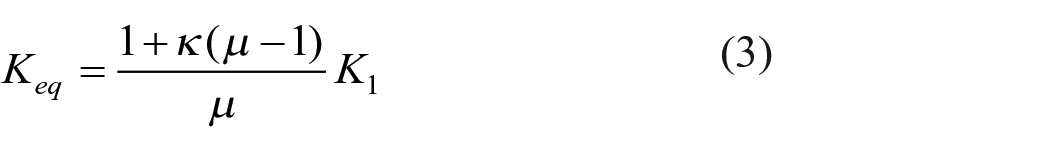
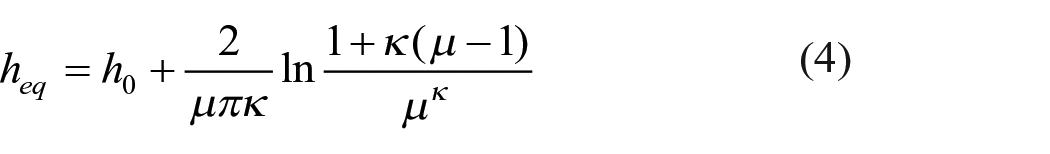
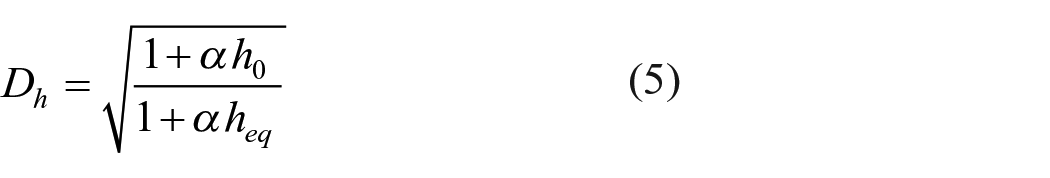
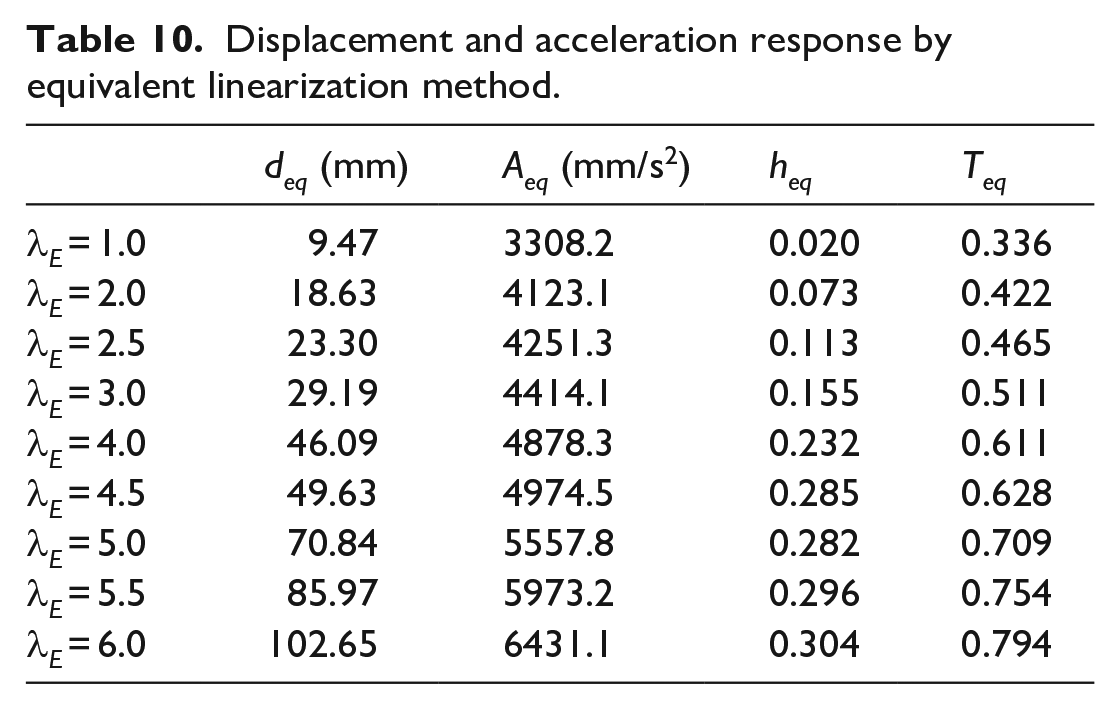
where μ is the ductility ratio and is calculated by dividing the maximum displacement deq by the displacement at yield dy. The coefficient α in equation (5) is a value determined by the seismic motion, and α = 75 is adopted in this study based on preliminary studies. For comparison with the analysis in section 5.2, Table 10 shows the evaluated values of deq, Aeq, Teq, and heq, corresponding to λE.
Displacement and acceleration response by equivalent linearization method.
From Figure 18, the horizontal displacement evaluated by the ELM is comparable to the maximum value obtained from the seismic response analysis using the 12 earthquake motions presented in Section 5.2. Similarly, the evaluated acceleration aligns closely with the average of the 12-wave seismic response analysis.
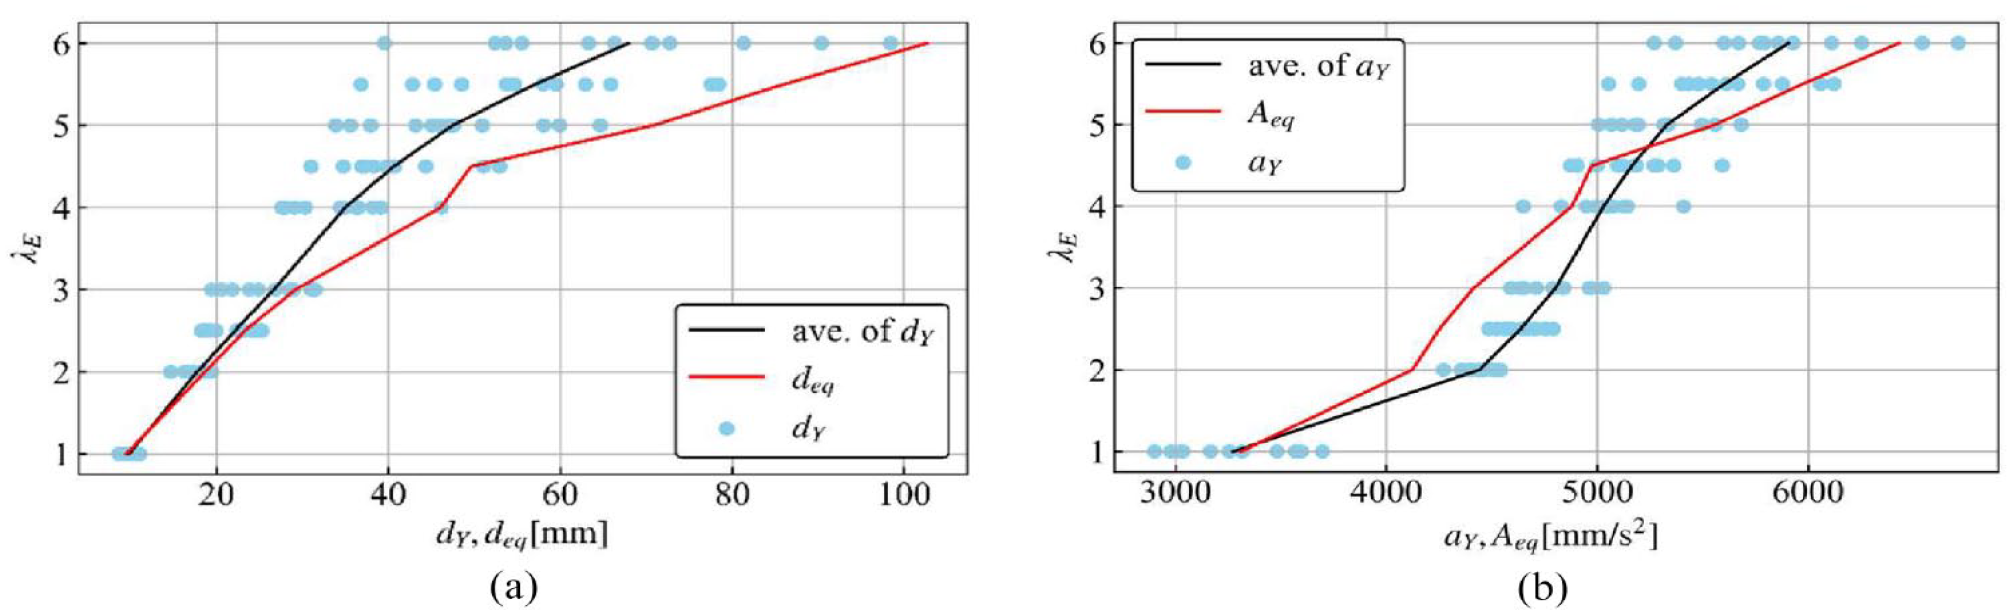
Comparison of response between equivalent linearization method (ELM) and time history response analysis (THA) with 12 seismic motions: (a) horizontal displacement and (b) horizontal acceleration.
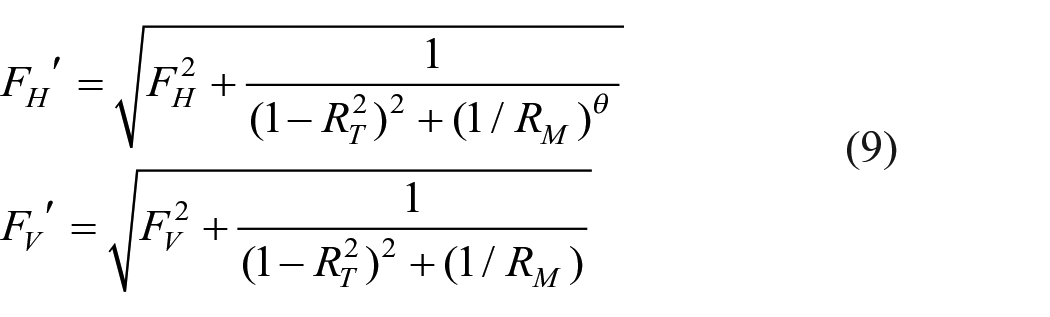
The horizontal and vertical response accelerations of the roof structure (AH, AV) are calculated using equations (7)–(9) as proposed by Takeuchi et al. 8 and Kumagai et al. 20 In AIJ Recommendation for Design of Latticed Shell Roof Structures, 2 the formulas are specified for use with cylindrical shells having a depth-to-span ratio of 1/100 or greater. However, the depth-to-span ratio in the present model is 1/175, which is outside its applicability. Further research is needed to understand the mechanism of response amplification by the substructure of such a single-layered latticed shell.
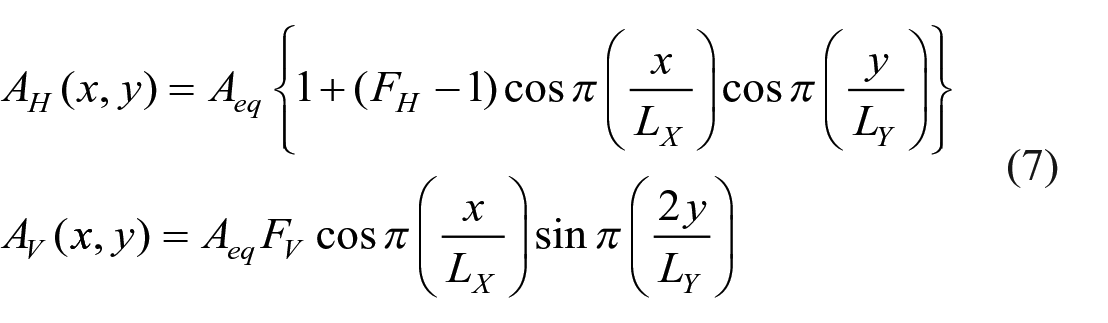
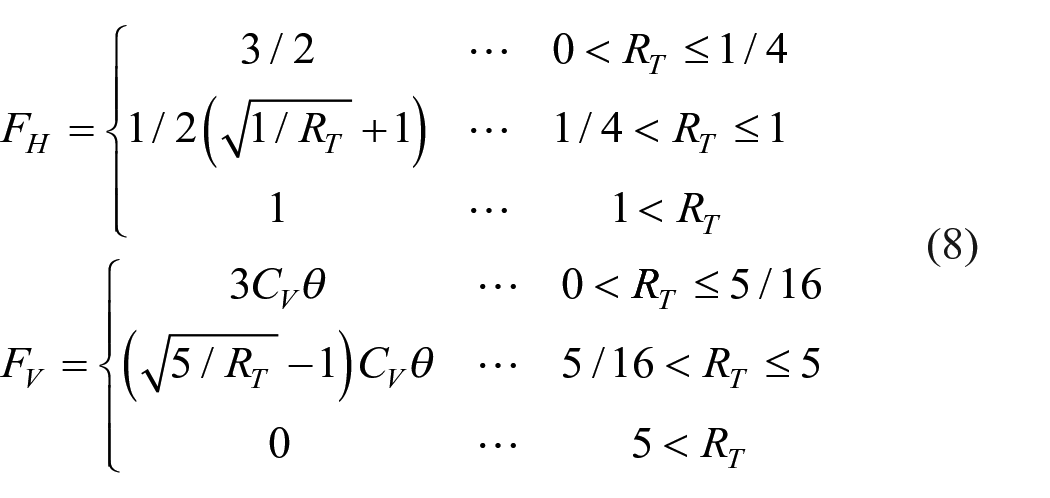
Where CV is 1.33 for cylindrical shells, and θ is half open angle. For RM > 1.2 and RT < 1.5, the following correction equation (9) has been proposed instead of the response amplification factors FH and FV in equation (7), 8 and is also used in this study.
The response acceleration at A–A′ section of the roof, determined using the ELM and equation (7) as depicted in Figure 19, exhibits a higher evaluation than the average value derived from the seismic response analysis. As shown in the third mode diagram in Figure 13, the cylindrical shell has an inverse horizontal component at the top of the roof (leftward in the figure) relative to the horizontal component of the substructure (rightward in the figure). This might lead to a horizontal acceleration distribution that is different from the distribution of large horizontal acceleration at the center of the shell, as shown in equation (7). As mentioned earlier, the depth-to-span ratio of this study is as small as 1/175, and the response amplification of the single-layer latticed cylindrical shell to the dynamic properties of the substructure is an issue for future study. In the case where the substructure follows an early plasticization strategy as in the present study, it is expected from previous studies 20 that the response of the roof structure is strongly influenced by the dynamic properties of the substructure, such as yield layer shear force coefficient Cy and secondary stiffness K2. These are also issues for future study.
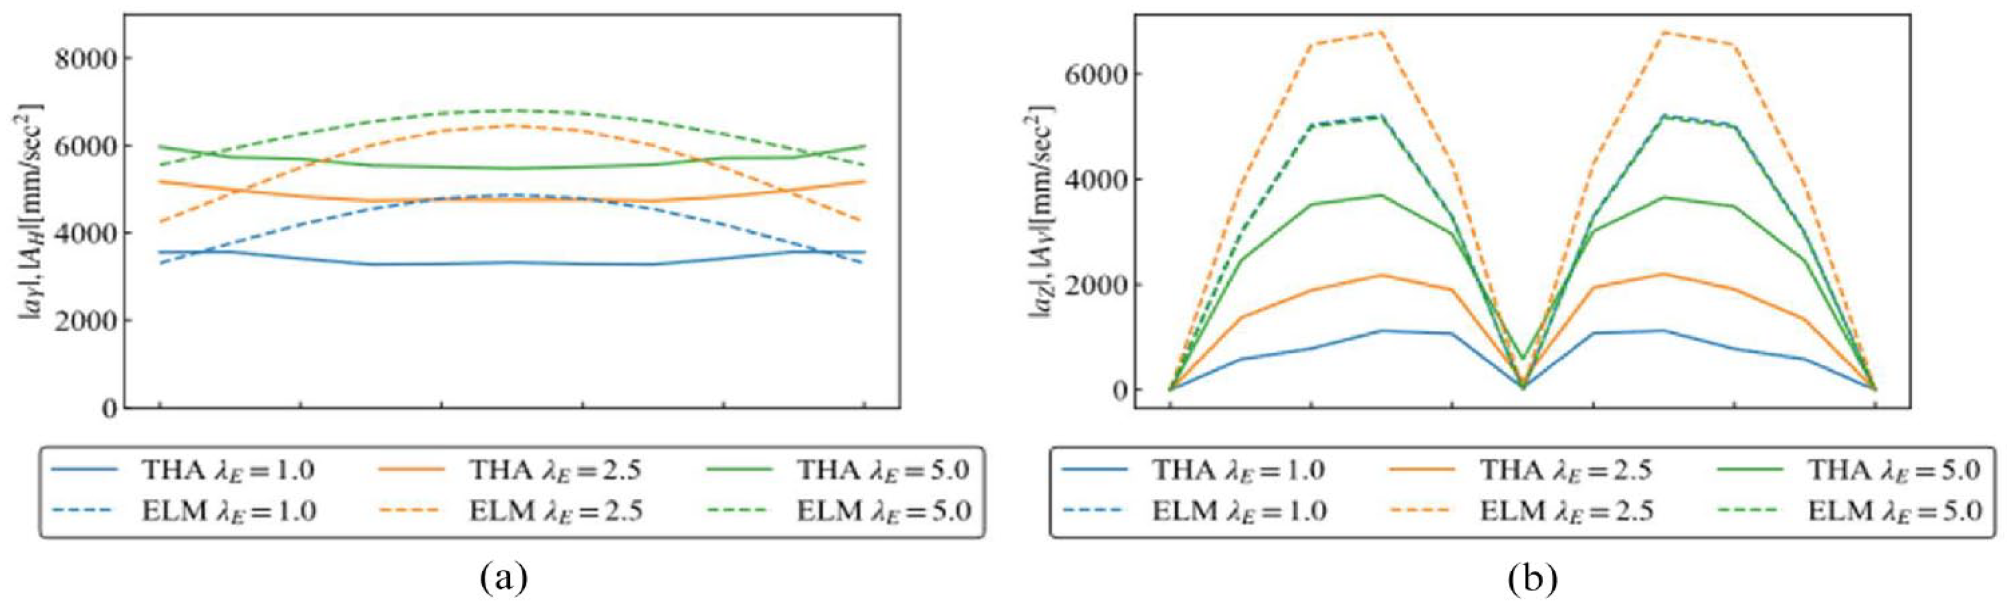
Comparison of the acceleration response of A–A′ section of roof by equivalent linearization method (ELM) and average of time history response analysis (THA) with 12 seismic motions: (a) horizontal acceleration and (b) vertical acceleration.
Comparison of seismic response fitted to Chinese and Japanese seismic Design spectra
A further investigation is extended herein to find a similar tendency of large stress reduction even in the case of the Chinese design spectrum. As anticipated because of the similarity, Figure 9 shows that the presented results are almost similar between the two design response spectra of China and Japan.
Figure 20(a) resembles Figure 15(a) with the vertical displacements, thus showing that displacements reductions are not expected even using BRBs. Figure 20(b) almost resembles Figure 16(a) with axial forces, showing a common trend of the large reduction of axial forces due to BRBs.
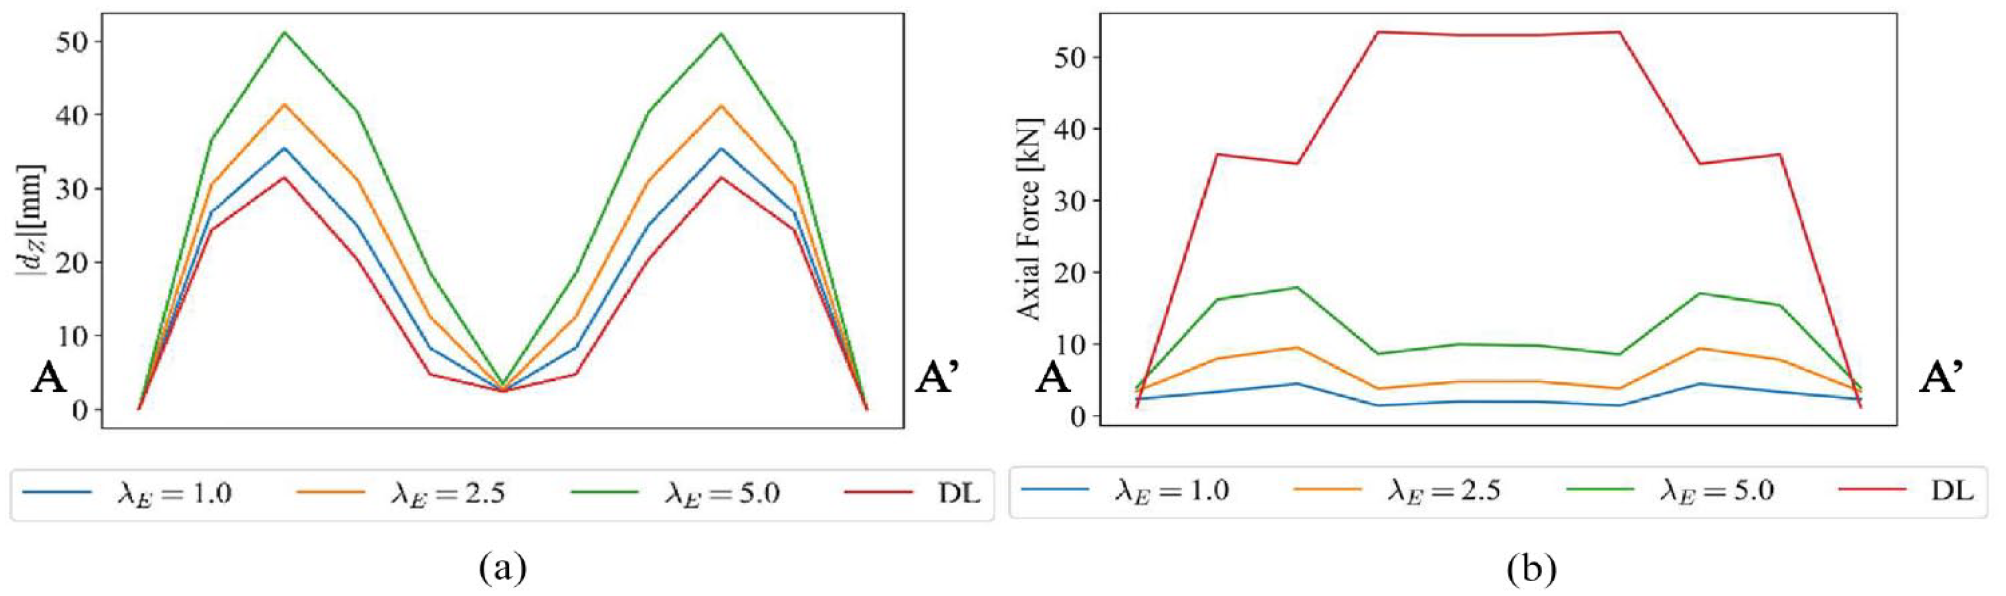
Distributions of maximum response to earthquake motion conforming to the Chinese seismic design spectrum: (a) vertical displacement and (b) axial force.
Details regarding bending moments, horizontal displacements, and accelerations are abbreviated in the present discussions. However, the resemblance of the response results obtained on the basis of both design spectra suggests the effective communication and transfer of research results on the seismic design strategy of spatial structures. The present research would be a trigger to accumulate a considerable amount of exchangeable information between the two countries and promote further mutual utilization of research outcomes.
T The present research also demonstrates that stresses under dead load is more dominant than the stress responses due to the seismic motion of intensity λE = 5. The trend can also be observed for vertical displacements. Thus, the stresses and vertical displacements induced by the self-weight are considered to be dominating factors in structural design. As demonstrated in Chapter 2, the model for the present analysis possesses a strength 3.6 times the dead load and a strength 1.8 times the dead load plus snow load. Hence, the stress induced by the earthquake is relatively small even when subject to seismic intensity λE = 5.0. The sum of the stresses under dead load and the stresses due to earthquakes of λE = 5.0 may be around 1.5 times the dead load. Further discussions may be required, but the present investigation suggests useful information regarding the small possibility of fatal structural damage in latticed cylindrical roofs once such roof is supported by a ductile substructure. Moreover, the possibility of damage can be substantially reduced once BRBs are installed as supporting substructures. According to the Chinese design code 1 for steel latticed shell roofs, which require a safety factor of at least 2.0 under gravity load considering L/300 geometric imperfections, the requirement promises a substantially small probability of damage due to the severest earthquakes, such as the intensity mentioned at the beginning. This suggestion is also applicable to Japanese design conditions.
Concluding remarks
The present paper investigated the elasto-plastic seismic behavior of cylindrical latticed shell supported by BRBs being one of ductile substructures. Several conclusions are drawn on the basis of the findings as follows.
A cylindrical latticed roof of a medium span and a medium rise is first assumed on the basis of a conventional design method in Japan. The member sizes are proportioned under a simultaneous action of dead and snow loads. The nominal safety factor is approximately 3.6 for deal load and 1.8 for dead and snow loads.
Seismic responses were investigated under severest earthquake motions artificially produced on the basis of Chinese and Japanese design codes. The severest intensities of both codes are almost similar in acceleration spectra considering peak accelerations and frequency contents based on the given design spectrum.
The effectiveness of BRBs with a yield base shear coefficient Cy = 0.4 was investigated in the case where these BRBs are installed at the first story. Adoption of BRBs with early plasticization makes it possible to suppress the stress in the latticed roof, compared with the linear braces. On the other hand, a large reduction of displacements is not to be expected even when using BRBs. The values of the reduction ratio due to severest earthquakes are 80% in axial force and 58% in bending moment for the member in the center of the cylinder, and 56% in axial force and 65% in bending moment for the member at the end of cylinder connecting the gable wall.
While the response acceleration of the cylindrical latticed shell demonstrated a significant response reduction due to the plasticization of the BRBs for earthquakes at the safety limit-level—with reductions reaching 66% in the vertical direction and 33% in the horizontal direction compared with the linear braces—it is important to note that these findings are based on a limited model of this study. The half-opening angle of the cylindrical shape, the secondary stiffness of the substructure, and the yield layer shear coefficient should be extensively studied in the future.
The axial forces and bending moments under the dead load are larger and more dominant than those due to the safety limit-level earthquake. Therefore, ensuring an appropriate buckling resistance to the dead load (such as 2.0 as a nominal safety factor) and coupling it to BRBs at substructures may substantially reduce the possibility of structural fatal damage if any exceptional hazardous structural systems were avoided.
The acceleration response spectrum for seismic design (Class 2 ground) in Japan and that in China (Design Seismic Group of group 3, Site Class IV, and Intensity 8) are almost of the same order in spectrum shapes and magnitude. Therefore, the results of this kind of investigations are interchangeable in quality and in quantity.
Footnotes
Acknowledgements
The present authors express their appreciation to Prof. S.D.Xue, Prof. Zinchi Wu, and Prof. Alireza Behnejad for providing an opportunity to contribute a paper to the special issue dedicated to the late Prof. T.T.Lan. Especially, the second author would like to extend his thankful words to Prof. Lan who for a long time had provided his friendship with his long lasted heartily mind.
Declaration of conflicting interests
The author(s) declared no potential conflicts of interest with respect to the research, authorship, and/or publication of this article.
Funding
The author(s) received no financial support for the research, authorship, and/or publication of this article.