
Abstract
Diabetic retinopathy (DR) is a rapidly emerging retinal abnormality worldwide, which can cause significant vision loss by disrupting the vascular structure in the retina. Recently, optical coherence tomography angiography (OCTA) has emerged as an effective imaging tool for diagnosing and monitoring DR. OCTA produces high-quality 3-dimensional images and provides deeper visualization of retinal vessel capillaries and plexuses. The clinical relevance of OCTA in detecting, classifying, and planning therapeutic procedures for DR patients has been highlighted in various studies. Quantitative indicators obtained from OCTA, such as blood vessel segmentation of the retina, foveal avascular zone (FAZ) extraction, retinal blood vessel density, blood velocity, flow rate, capillary vessel pressure, and retinal oxygen extraction, have been identified as crucial hemodynamic features for screening DR using computer-aided systems in artificial intelligence (AI). AI has the potential to assist physicians and ophthalmologists in developing new treatment options. In this review, we explore how OCTA has impacted the future of DR screening and early diagnosis. It also focuses on how analysis methods have evolved over time in clinical trials. The future of OCTA imaging and its continued use in AI-assisted analysis is promising and will undoubtedly enhance the clinical management of DR.
Keywords
Introduction
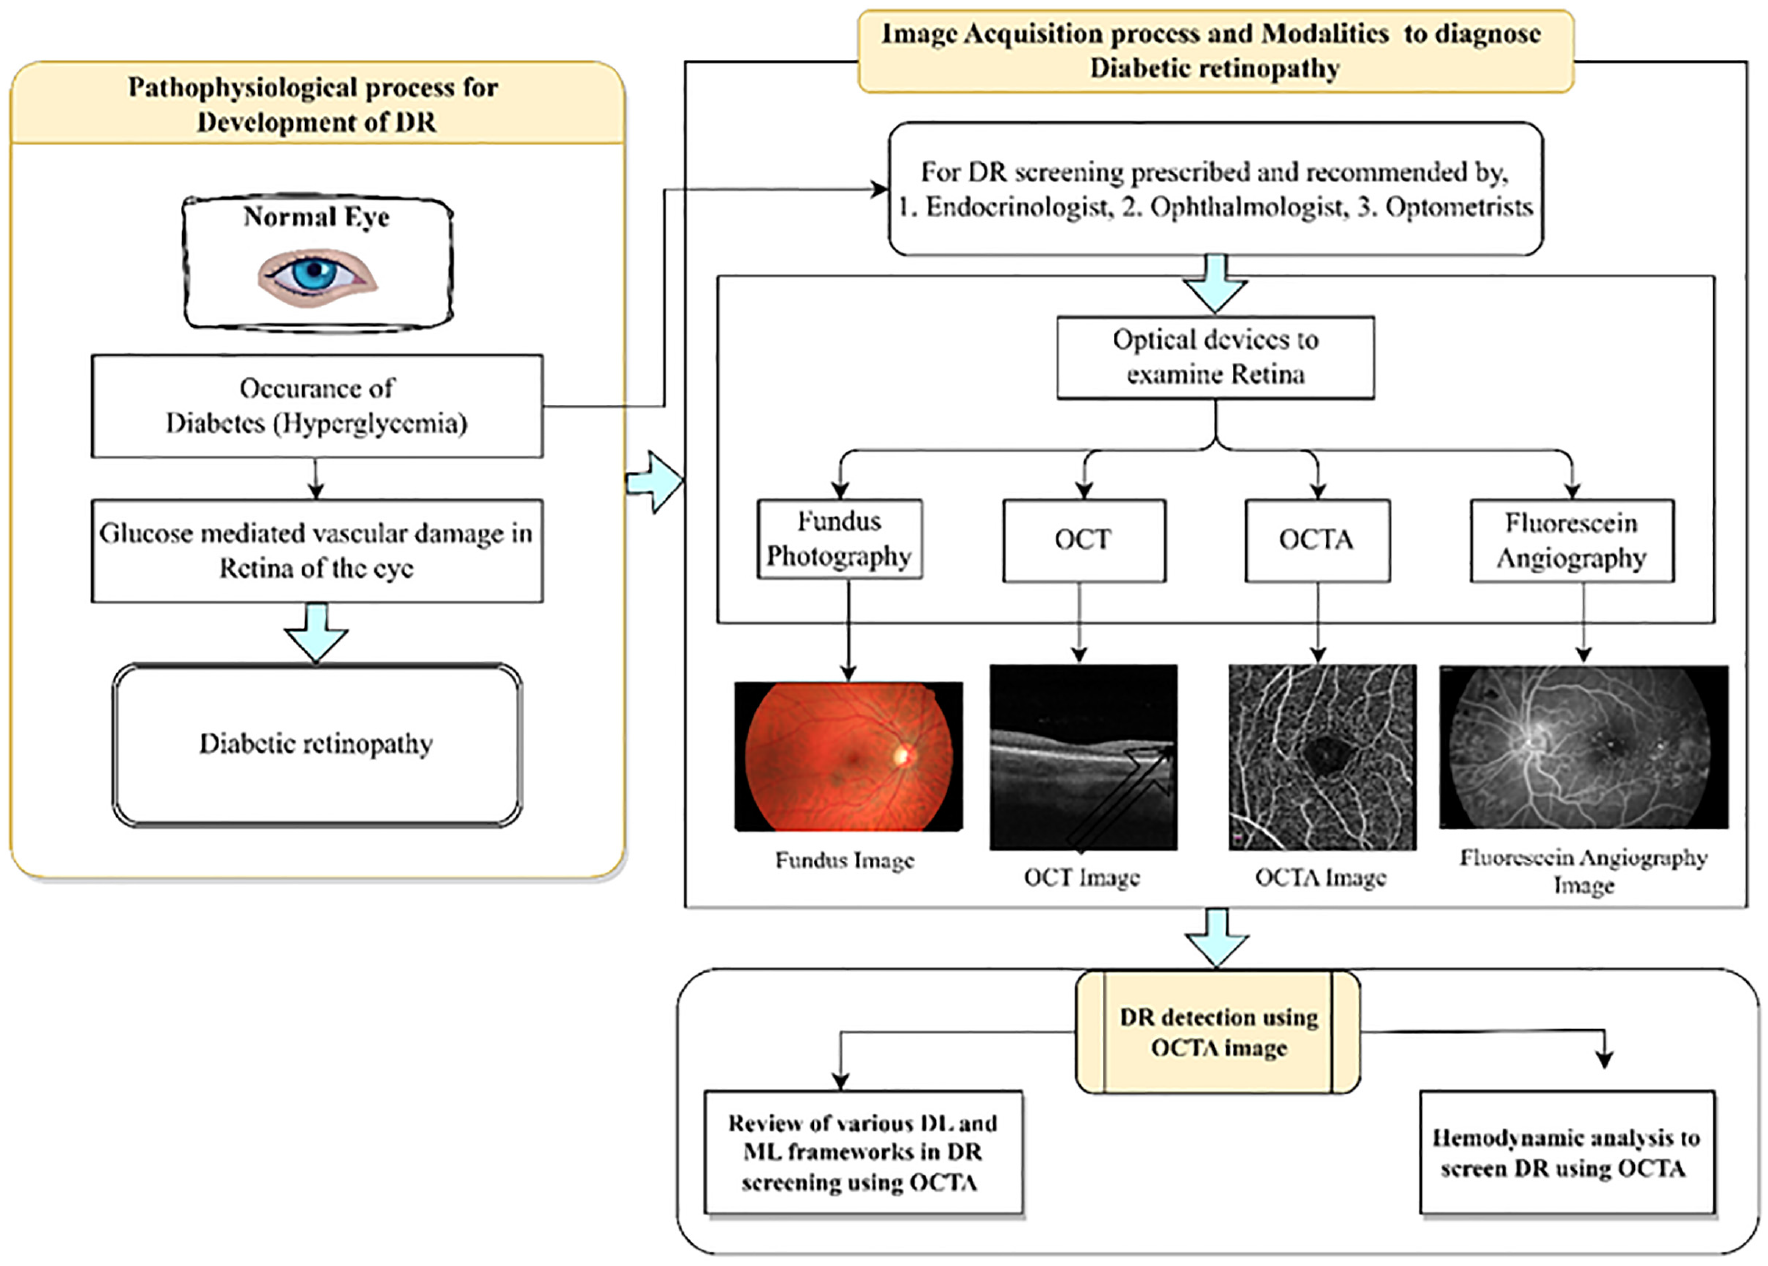
This review article consists of seven sections. Session 1 will introduce how diabetes mellitus impacted the occurrence of DR in a normal eye and available imaging modalities to diagnose DR. Additionally, it describes the prevalence of diabetes and DR globally. Session 2 will explore the importance of OCTA images over other imaging modalities to screen early DR. This review concentrates more on identifying the publicly available OCTA datasets and it is addressed in session 3. The use of AI technology in screening DR with improved accuracy is briefly presented in session 4 and without a doubt, it will improve patient care in ophthalmology. Hemodynamic analysis of retinal vessels is a new area to explore using OCTA reviewed as an important content of this article in session 5. Session 6 follows with a discussion of challenges encountered during the review and future directions of DR evaluation. Finally, the conclusions are discussed.
Diabetes mellitus (DM) is a complex metabolic disorder characterized by hyperglycemia, a physiologically abnormal condition represented by persistently increased blood glucose levels. The persistent and varied symptoms of hyperglycemia include abnormalities in the metabolism of carbohydrates, fats, and proteins. Hyperglycemia is caused by abnormalities in either insulin secretion or insulin action. The pathogenesis of diabetes is complex, and its performance can vary greatly due to its progressive nature 1 Type 2 diabetes, accounting for 90% of all diabetes cases, was once thought to be a disease prevalent in Western countries. But now DM spread globally, and even younger age groups are affected. The increasing prevalence of diabetes is a significant and challenging global health issue that demands urgent attention. 2 According to the International Diabetes Federation (IDF), there are 537 million adults living with diabetes worldwide in 2021, and that number will rise to 783.2 million by 2045. Men and women both had a similar prevalence of diabetes and it was found to be highest amongst the age group of 75–79. It is found that 6.7 million deaths were reported due to diabetics in the year 2021. 3 According to the World Health Organization (WHO), the occurrence of diabetes is rising in low-and middle-income nations at an alarming rate. 4 This upsurge in diabetes can be attributed to the rapid socioeconomic transformations accompanying urbanization and industrialization, alongside additional risk elements including population increase, eating habits, and sedentary behavior. All of these factors collectively caused the diabetes epidemic to spread globally, which is a serious public health issue. 5 The prevalence of diabetes in 2021 and the prediction of diabetes around the world in 2045 are shown in Figure 1.
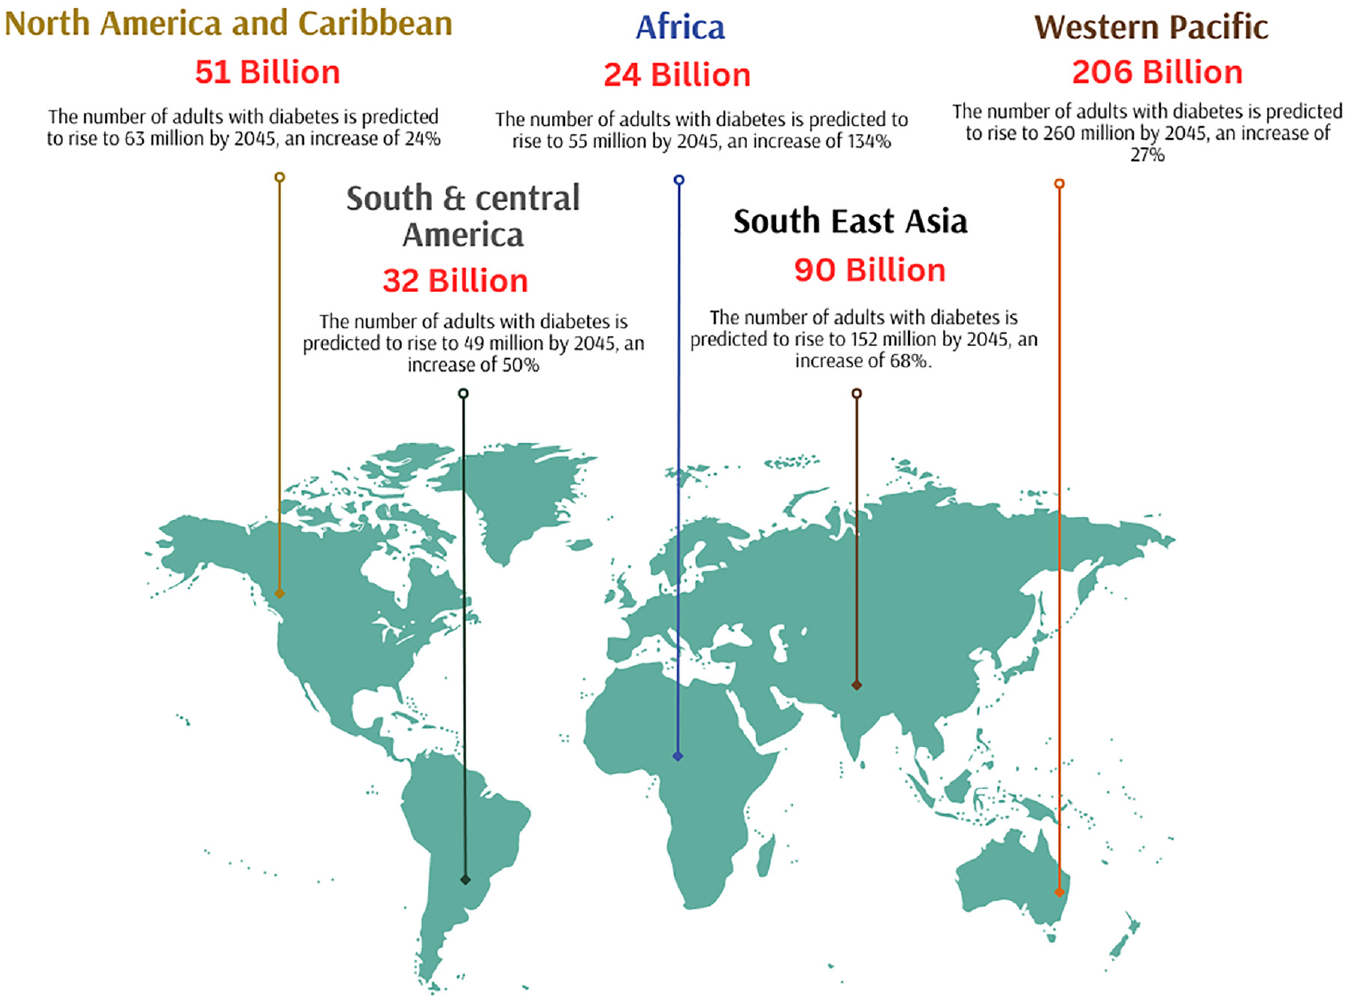
World map showing the prevalence of diabetes around the world in 2021 and the expected rise of diabetes in the year 2045 (According to the findings in the statistics report by IDF Diabetes Atlas 10th edition).
In a recent survey on Noncommunicable Disease (NCD) monitoring, it was found that the occurrence of DM and Impaired Fasting Blood Glucose (IFG), a pre-diabetic condition, in India, was 9.3% and 24.5%, respectively. 6 Back in 2000, it was predicted that India would have nearly 80 million individuals living with DM by 2030. 7 However, with an estimated 77 million people already suffering from diabetes in 2019, the predicted disease burden has arrived almost a decade earlier. By 2045, it is anticipated that 130 million individuals in India will have diabetes. 8 It is also estimated that approximately 57% of adults with diabetes in India remain undiagnosed, which translates to nearly 43.9 million individuals. 9 Due to the increasing global burden of disease, there is an immediate need for enhanced diabetes screening practices. Identifying undiagnosed diabetes is of utmost importance, as failing to do so can lead to adverse outcomes such as increased complications related to diabetics and increased healthcare costs to patients. It is essential to provide timely and appropriate care to individuals with undiagnosed diabetes to prevent negative consequences. 2
Diabetic retinopathy
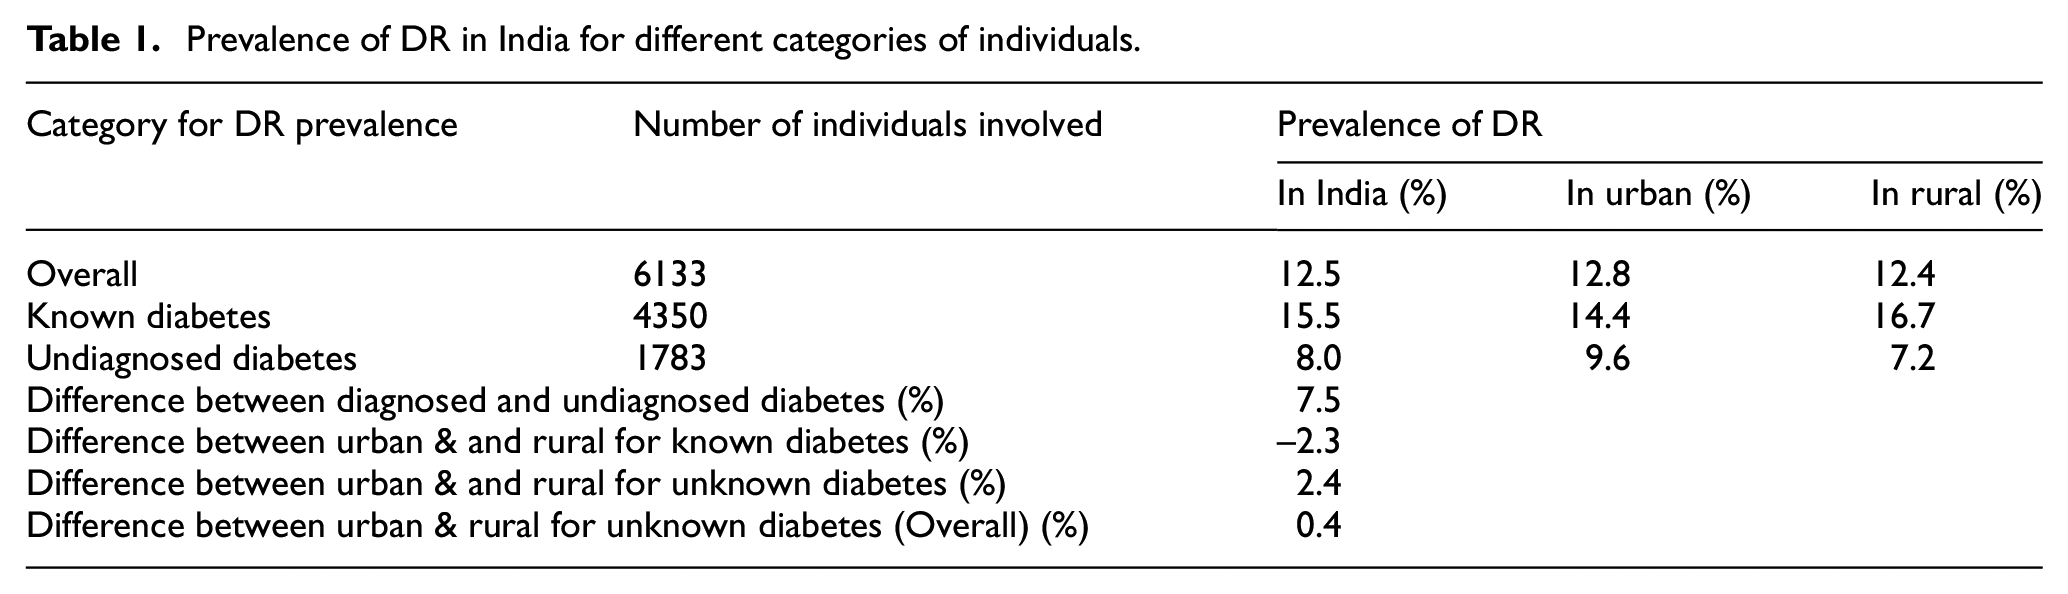
Diabetic retinopathy is a microvascular complication of DM in the eye that can develop without symptoms of vision-threatening diabetic retinopathy (VTDR). 10 In India, the prevalence of VTDR is 4.0%, compared to 12.5% for diabetic retinopathy. Regarding diabetic retinopathy, no appreciable difference was found between residents of urban and rural areas. Diabetic retinopathy was more common in people with known diabetes (15.5%) than in people with undiagnosed diabetes (8.0%). The occurrence of VTDR abnormality in individuals with known DM is almost double (5.3%) that detected in persons with undiagnosed diabetes (2.4%). According to the survey conducted by Raman et al., around 3 million Indians over the age of 40 who have VTDR and DM are at risk of losing their vision (see Table 1). In India, the occurrence of DR disease was analyzed using a survey by including both subjects with known diabetes and persons unaware of diabetes as shown in Table 1. 11 Based on studies conducted to understand DR prevalence worldwide from sources like PubMed, Medline, Web of Science, and Scopus, it is found that the global prevalence of DR disease remains high. According to the survey conducted in 2020 global prevalence of DR is estimated as 22.27% and the number of adults affected with DR is 103.12 million. According to a survey of the estimated population, it is found that the prevalence of Vision-Threatening DR was 6.17%. Among 103.12 million adults affected with DR worldwide, 28.54 million adults develop VTDR. 12 In Figure 2 shows the prevalence of DR worldwide and adults affected with DR were estimated in the global map.
Prevalence of DR in India for different categories of individuals.
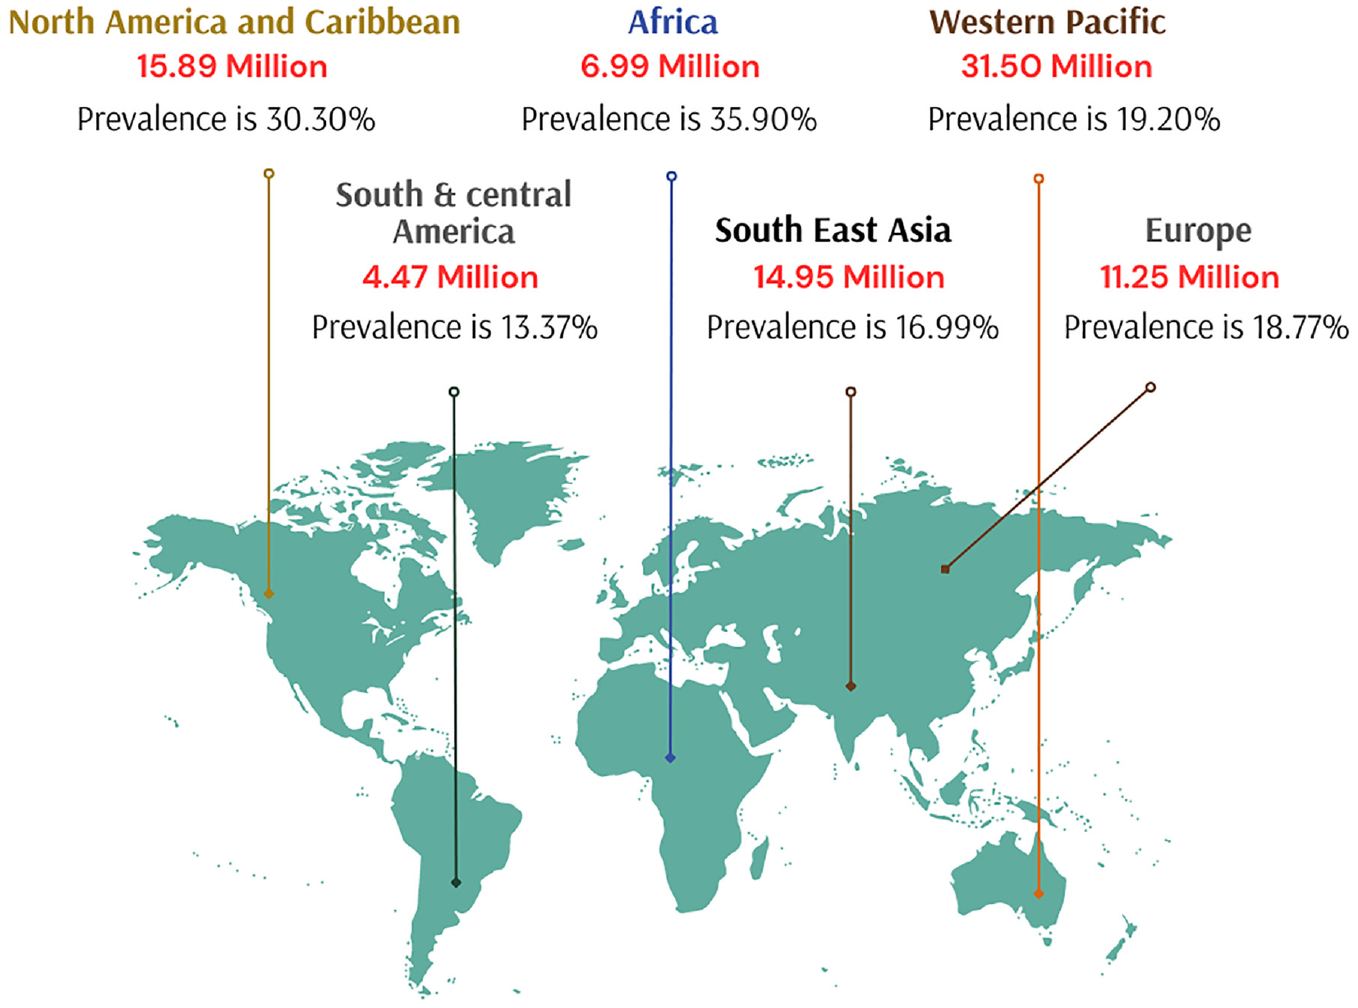
World map displaying the prevalence of diabetic retinopathy and the number of adults affected with DR in millions according to a systematic review and meta-analysis conducted by Teo et al. 12
When the sensitive blood vessels in the retina of persons with diabetes become damaged by high blood sugar it results in DR. It occurs in two stages: non-proliferative (NPDR) and proliferative (PDR). Proliferative indicates an advanced phase of the DR, whereas nonproliferative indicates its initial stages. Intraretinal hemorrhages, microaneurysms, irregularities of the venous caliber, intraretinal microvascular abnormalities (IRMA), lipid exudates, capillary nonperfusion with cotton-wool patches and retinal neovascularization are all characteristics of the NPDR stage. The creation of new blood vessels in the retina that protrude into the retinal space is what propels progression to the PDR stage under the influence of hypoxia and the release of proangiogenic growth factors. If this neovascularization results in vitreous hemorrhage or retinal detachment, it may severely impair vision. 13 Clinically DR development progresses in four stages, Stage 1 is Mild nonproliferative DR: It is the early stage of DR distinguished by small swellings in the retina’s blood vessels. These swollen spots are referred to as microaneurysms. Some of the fluid from these microaneurysms may leak into the retina and cause swelling. Stage 2 is Moderate nonproliferative DR: In this stage, the small vessels that carry blood enlarge even more, obstructing blood supply to the retina and reducing adequate nutrient uptake in the eye. If blood or other fluids accumulate in the macula causes blurring of vision. Stage 3 is Severe nonproliferative DR: This stage is identified by a significant reduction in blood flow to the retina as more blood vessels get obstructed. This stage may result in the development of new blood vessels in the retina in response to the shortage of blood in the eye. Stage 4 is Proliferative DR: This is the last stage of DR development, in the retina, new blood vessels are still developing at this stage. The weak, fragile blood vessels inside the eye are prone to bleeding and form scar tissue inside the eye. Typically, a detached retina causes blurriness, vision failure, and sometimes even total blindness. Even though 2.4% of individuals who are recently detected with diabetes already have significant VTDR at the time of diagnosis, indicating late diagnosis, regular retinal screening tests are essential for diabetics, both diagnosed and undiagnosed, to reduce the risk of visual loss. Implementing a reliable and affordable DR screening system is a promising prospect shortly. Regular retinal examinations and prompt VTDR therapy can greatly decrease the occurrence of blindness due to diabetics.
Imaging modalities to diagnose DR
It is essential to create timely and precise procedures for identifying the disease’s early stages. Early detection enables methods that can spot changes in retinal structure before any symptoms or clinical signals materialize. With the recent advantage of technological growth, more optical imaging modalities are available to perform DR screening, evaluation, diagnosis, and therapy. In ophthalmology, exceptional quality image-producing options are available to screen DR like Fundus camera, Optical Coherence Tomography (OCT), OCTA, and Fluorescein angiography procedures. 14 These optical imaging techniques give more detailed and deeper images of the retina, which allows the ophthalmologist to detect small changes in the retina with high resolution. All the optical images are used in this review article, upon getting prior written permission from the consent authors.
In this review, advances in retinal analysis using artificial intelligence (AI) techniques were studied and related published surveys were considered. A detailed assessment was conducted on OCTA imaging and its clinical application for the diagnosis of DR using various AI techniques. Finally, various machine learning (ML) concepts that have been particularly relevant to the domain were considered and compared with their performance indicators.
Fundus photography
Fundus imaging has been widely used for imaging the retina and in detecting its small changes from fundus images. 15 Fundus imaging uses reflected light to create a 2-D representation of the 3-D retina, projected onto an imaging plane. 16 Despite the usefulness of fundus imaging, there are limitations in its application for DR screening. These include image distortion, eyelash artifacts, low-resolution images, limited ability to view vascular and peripheral structures inside the retina, restricted imaging field of view (FOV), and the need for multiple scans across the macula to obtain appropriate images. 17
Optical coherence tomography (OCT)
OCT is a non-invasive imaging method that produces high-resolution cross-sectional images of the microstructures inside the retina of the eye using low-coherent light interferometry. 18 The fundamental principle behind the working of OCT is based on the estimation of deeper information by measuring the time it takes for backscattered light to reach the device sensor of OCT. Differences in refractive index between tissues cause backscattering, which can be used to differentiate between deeper and more superficial tissues. Since the total thickness of the retina is only 300–500 μm, variations in time of flight are minuscule and it can be measured only using interferometry. 16 However, OCT has some limitations when it comes to DR examination. Firstly, it cannot provide angiographic information, which means it can only acquire structural images from the retina. Secondly, OCT is unable to identify retinal ischemia and pathological features required for therapeutic procedures in patients affected by DR. Moreover, OCT can only provide two-dimensional vascular structures in the top layer of the retina, and deeper blood vessels cannot be visualized for hemodynamic analysis to screen DR. 19 These limitations should be taken into account when interpreting OCT images for DR diagnosis. Despite these limitations, the OCT ID dataset and Messidor-2 dataset from the MEDICMIND portal were used to understand images of normal eyes and persons with diabetic eyes20,21 (Figure 3). The sample fundus and OCT images represent normal eye and DR grades clinically in Figure 3 and are publicly available in the OCTID and MESSIDOR-2 databases.
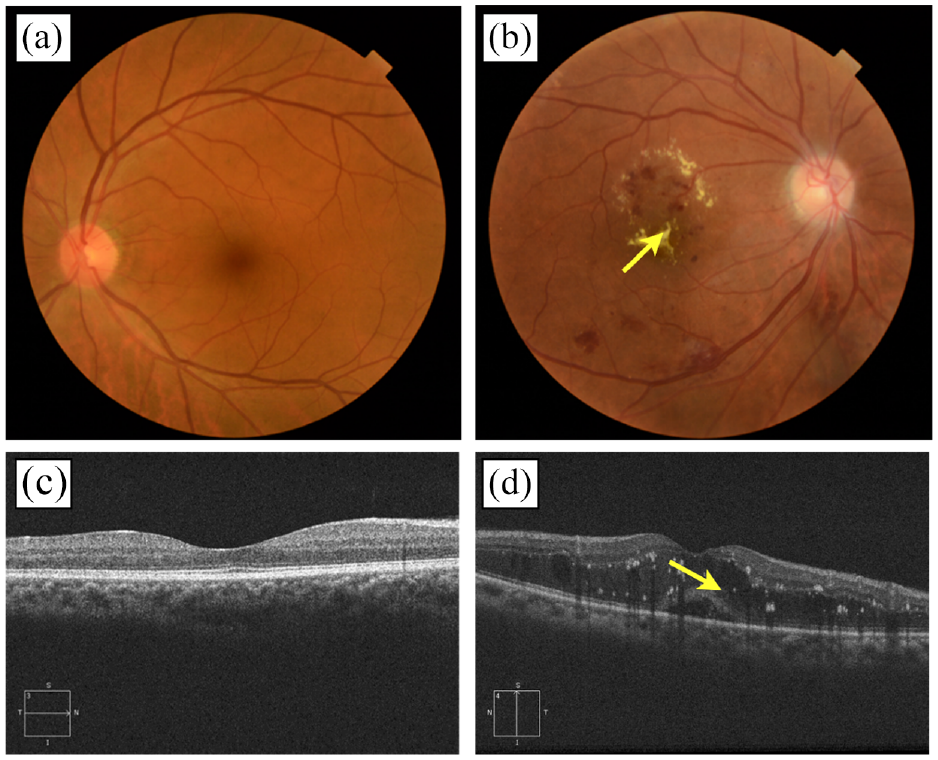
Sample of images in each class of imaging modality (Top row: a, b) Color fundus photograph of (a) normal eye (b) a person diagnosed with DR-cotton wall present at the retinal region. (Bottom row: c, d) Optical Coherence Tomography (OCT) image during horizontal scan shows the (c) non-diabetic eye and (d) white spots in scan revealing the presence of DR.
Fluorescein angiography (FA)
Fluorescein angiographic imaging is a very useful tool for diagnosing the vascular changes in the eye that cause DR. This technique involves using fundus photography with narrow band filters that capture images of the retinal vasculature after the injection of sodium fluorescein, a fluorescent mineral-based dye. 22 FA is currently considered an important optical imaging device with the gold standard for detecting abnormalities early, that are not visible in conventional ophthalmoscopy screening procedures. This imaging modality is used to examine vascular structures in the retina and the study of dynamic circulation. Early diabetic microvascular changes, such as fluorescent dye leakage inside the retina, vessel dilatation, ischemia and microaneurysms, can be detected using FA. 23 FA is particularly useful in finding areas of neovascularization (NV) that are missed during fundoscopy examinations.
However, it has some drawbacks such as its invasive nature, time-consuming, and difficulty in handling. 14 A recent study compared the results of fluorescein angiography and digital color fundus imaging for detecting DR in young patients. 24 However, since it screens vascular leakage, FA remains an essential diagnostic modality for DR screening. According to Kwan et al., FA studies were analyzed among individuals undergone this process, 11,898 fluorescein angiograms were performed for the individuals during the screening process of DR, in which 132 persons negative adverse reactions were reported. 25 However since it screens vascular leakage, this imaging technique remains a crucial diagnostic modality for the screening of DR.
Optical coherence tomography angiography (OCTA)
OCTA is an advanced optical device compared to OCT and works on the same fundamental principle of low-coherence light interferometry. It is also a non-invasive technique. 26 OCTA utilizes the movement of red blood cells (RBC) and generates an image that shows clear blood flow inside the eye. Essentially, two OCT signals are generated from unmovable structural tissue (retina and choroid) and movable RBC cells inside the retinal vessels. Several scans at the same place were conducted and the moving particles can be distinguished from static tissue. The scanning is done in a way that accurately creates a 3D image in all axes based on the differences between the transmitted and reflected light. OCT has undergone significant advancements from Time Domain and Spectral Domain OCT to Swept Source OCT, resulting in improvements in FOV, resolution in image, number of A-scans, depth of tissue penetration, and reduction in motion artifact. In addition to these developments, several other OCT methods have been introduced, such as phase-sensitive OCT, polarization-sensitive OCT, spectroscopic OCT and OCT angiography (OCTA). These techniques correlate both structural and functional information about retinal tissue. 27 OCTA is a vital tool for clinicians in differentiating normal variations in retinal vascular anatomy from pathological changes. By providing high-resolution images of vessel density and structural morphology that are similar to pathological studies, OCTA allows for a more accurate diagnosis of various ocular conditions, including diabetic retinopathy.
The ability of OCTA to see the various retinal vascular layers with high axial resolution is one of its biggest advantages even at deeper levels in the retina and choroid. 28 This level of detail cannot be achieved with previous imaging modalities. Additionally, OCTA can assess hemodynamic parameters such as blood flow in retinal vascular regions, blood vessel density, FAZ morphology, and fluid dynamics changes in the retinal diameter analysis.29–32 Although OCTA has numerous benefits, there are some limitations to its acquisition system. Firstly, flow detection using OCTA requires multiple scans at the same tissue location, which can be time-consuming. Additionally, adequate image interpretation is not incorporated into the device, which can make it challenging for clinicians to analyze the results. Motion artifacts and projection artifacts can also occur during OCTA imaging, potentially affecting the accuracy of the results.33–35 The inability of OCTA to assess the breakdown of the blood-retinal barrier is a significant drawback., which can be detected as leakage of dye molecules during screening of FA. This hyperpermeability is an essential diagnostic modality for diabetic retinopathy as it indicates retinal edema and neovascularization. 36 Another limitation is that OCTA may not detect lesions that have slow flow, such as certain subtypes of microaneurysms and fibrotic neovascularization37–39 This is so because OCTA only detects flow when it exceeds a certain threshold and depends on detecting contrast between successive B-scans. The sample images of retinal optical coherence tomography (OCTA) obtained from the OCTA-500 dataset on a prior request from the author for a non-diabetic eye are shown in Figure 4. A comparison of various multimodal ophthalmic imaging technologies and their relevant publicly available databases was carried out and presented in Table 2.
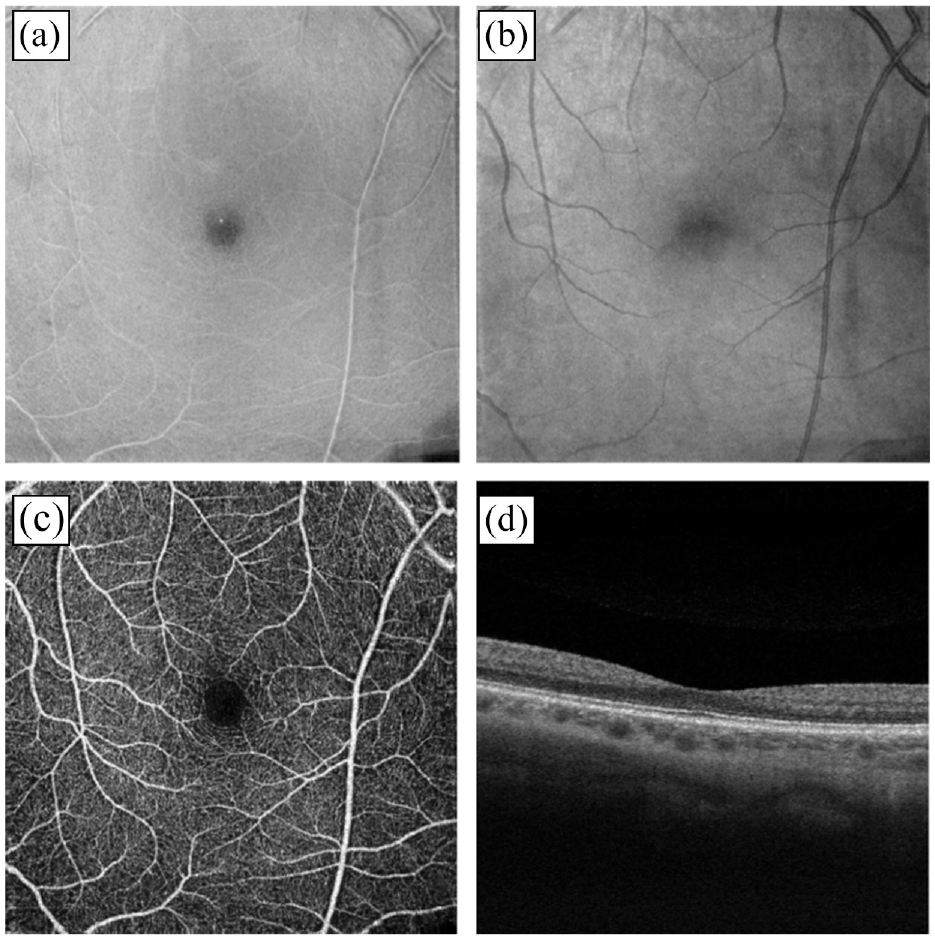
OCTA images of a non-diabetic eye obtained from the OCTA-500 database upon request from the author (a, b) OCTA image of (a) outer plexiform layer of the retina (b) Bruch’s membrane. (c, d) OCTA image during horizontal scan shows the (c) internal limiting membrane of 6 × 6 mm projection (d) B-Scan.
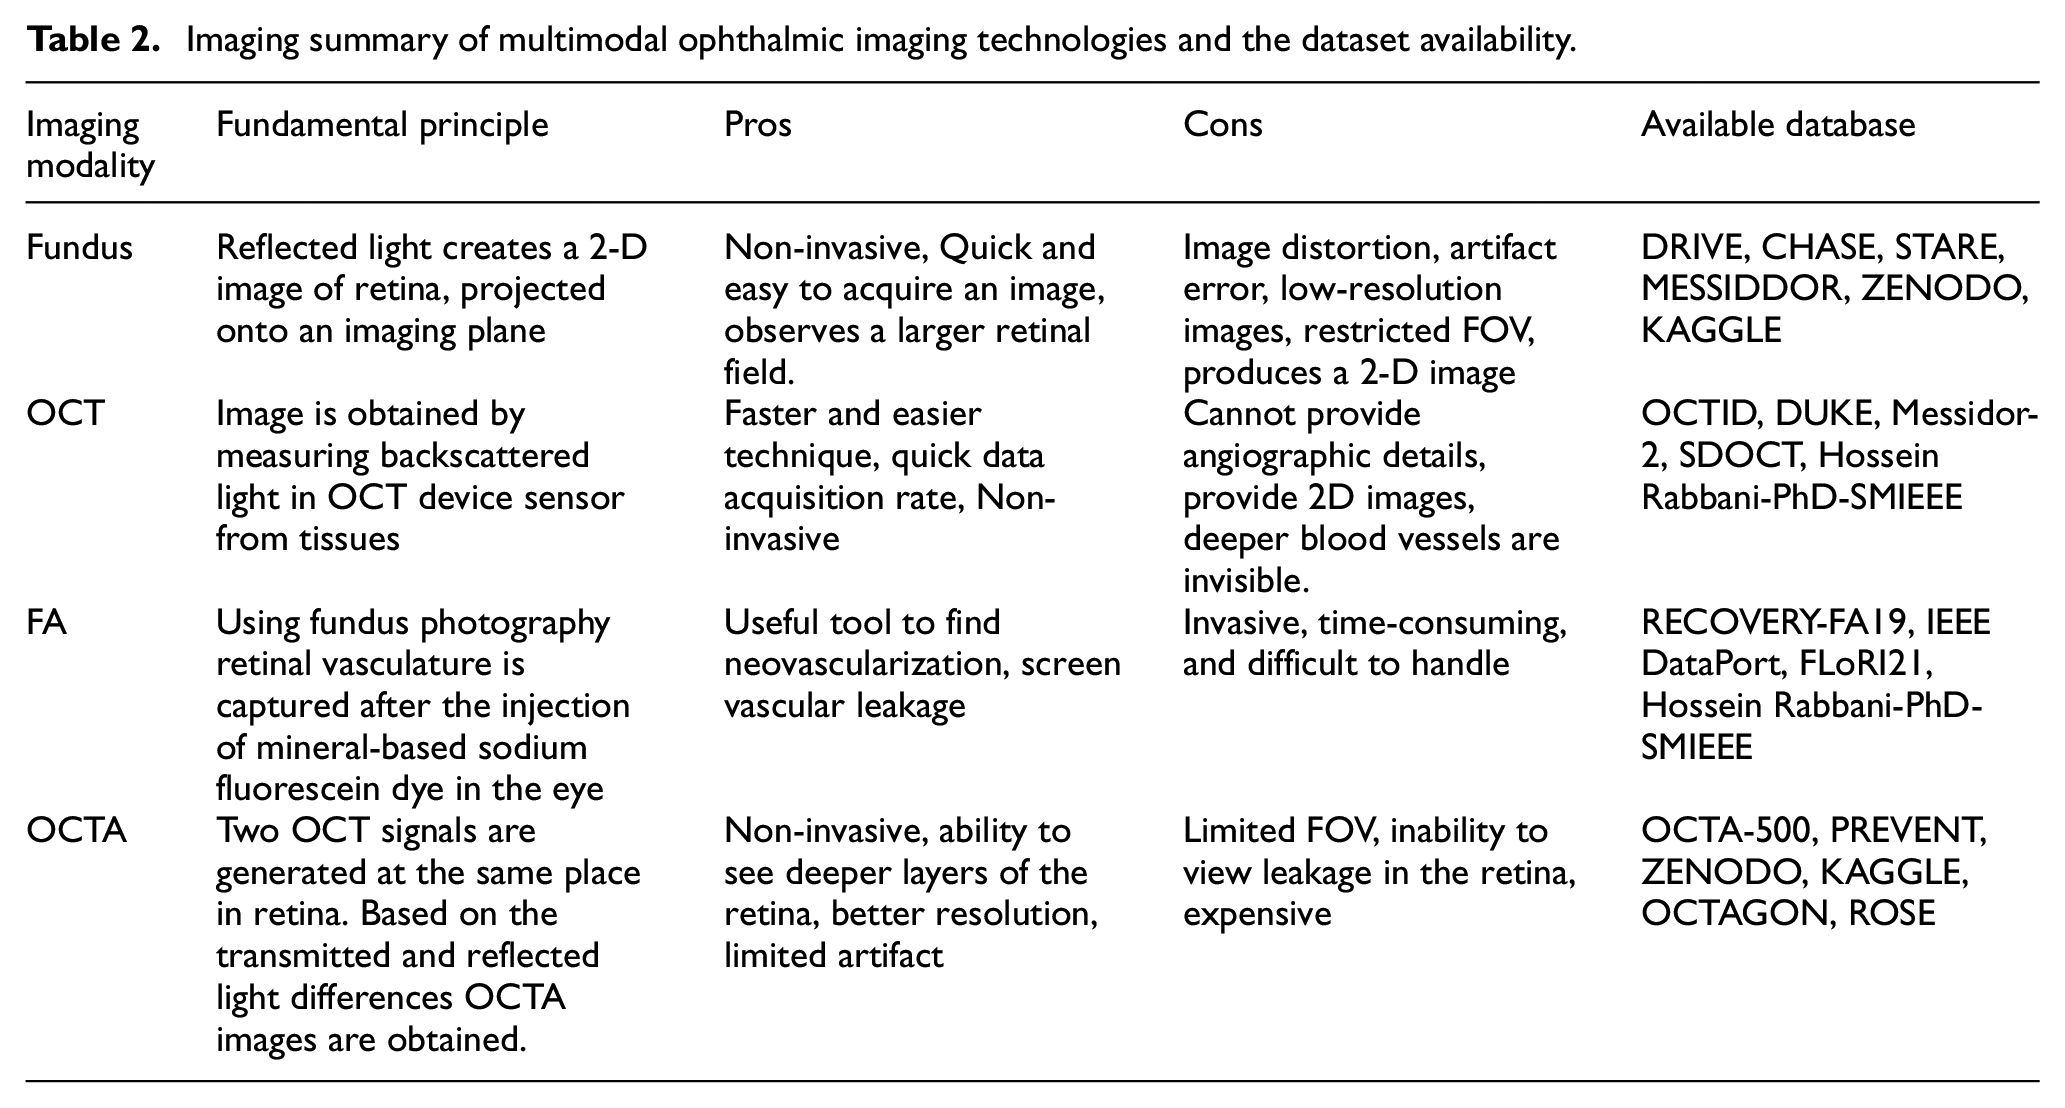
Imaging summary of multimodal ophthalmic imaging technologies and the dataset availability.
Need for OCTA in the diagnosis of diabetic retinopathy
Long-standing undiagnosed diabetes may result in injury to retinal vasculature and blood-retina barrier. Using OCTA, numerous studies and descriptions of common vascular characteristics of DR, such as microaneurysms, neovascularization, and retinal nonperfusion areas, have been considered for the review. 40 In OCTA microaneurysms detection is seen in the superficial and deep vascular plexuses 38 which give similar observations made in histopathological studies. 41 Patients with DR will have more damage on the deep capillary plexus than the superficial plexuses. It is visible in the OCTA internal limiting membrane image (6 × 6 mm) of the person affected with DR (Figure 5). 42 In some subtypes of microaneurysms, the blood flow rate is very slow inside blood vessels of the retina, so the early screening rate of DR may be lesser compared to fluorescein angiography. 36 The sample images of non-diabetic eye and diabetic eye OCTA images obtained from the OCTA-500 database based on the prior request from the author are shown in Figure 5.
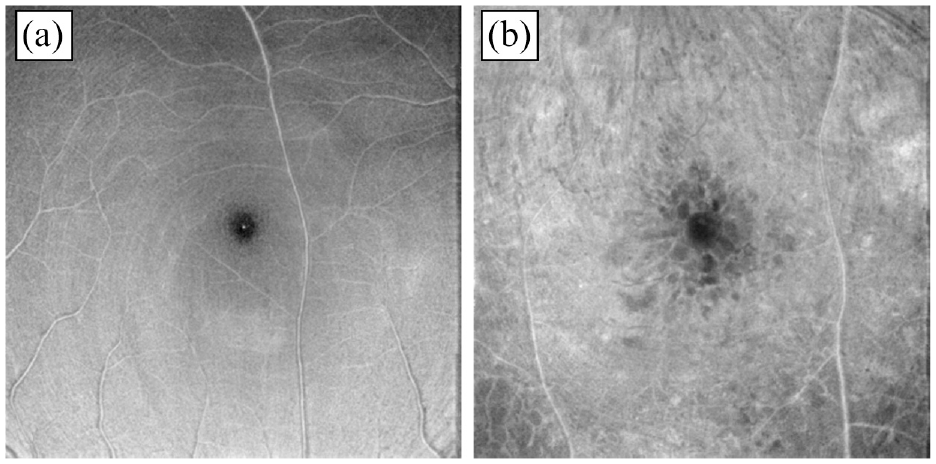
Sample OCTA images from the OCTA-500 database: (a) OCTA internal limiting membrane image of 6 × 6 mm projection for a non-diabetic eye and (b) OCTA image for a person with DR.
Neovascularization (NV) is a vascular feature. When compared to fluorescein angiography, OCTA displays neovascularization detection with more clarity. While OCTA is not able to give clear information on vascular leakage, the morphological evaluation of neovascularization using OCTA can still estimate its activity status. Exuberant vascular proliferation seen on OCTA, which manifests as an irregular proliferation of fine new vessels, has been reported to be a sign of active neovascularization by Ishibazawa et al. 39 OCTA can assist in differentiating between intraretinal microvascular abnormalities, which take place in the same plane as the retinal blood vessels, and retinal neovascularization, which develops anterior to the retinal vessels. The extended activity of NV can also be calculated on OCTA by using hemodynamic analysis such as the area of the vessel and various blood flow indicators. 43 Early detection of retinal neovascularization leads to timely intervention; thereby preventing vision loss.
Foveal Avascular Zone (FAZ) alterations refer to the pivot region of the macula devoid of any vasculature. The patient’s vision is significantly affected by changes to the foveal capillaries’ perfusion. 44 The dimensions of FAZ appear to be larger and the shape looks irregular in the patient with a diabetic eye as compared to a non-diabetic eye in an OCTA image. 45 Gaps in the capillary plexuses are responsible for the irregular shape and vascular anomalies are mostly seen at the level of deep capillary plexus. 46 Macular perfusion and the degree of retinal injury must be determined through evaluation and visual assessment of FAZ.
Peripheral Retinal Nonperfusion lesions have been considered a significant risk factor for the development of DR and serve as a valuable surrogate marker and a potential predictor of proliferative DR. 47 These nonperfusion regions appear as dark patches caused by the loss of capillaries, and they are typically surrounded by larger retinal vessels. By identifying matching areas of nonperfusion within the superficial and deep vascular plexuses, OCTA can provide sharper illustrations of capillary dropout and alterations in the FAZ compared to FA. 36 However, it is necessary to note that nonperfusion areas detected by OCTA may represent various conditions, including capillary occlusion, and complete capillary dropout (i.e. very slow or blood flow absence within the retinal capillaries), and these stages can’t be distinguished based on OCTA imaging alone. 43
The collection of fluid in the macular region as a result of blood vessel leaking is known as Diabetic Macular Edema (DME), which can result in visual loss. This accumulation of fluid can affect the segmentation ability of OCTA, reducing its reliability in detecting DME. 48 Furthermore, areas of decreased flow seen on OCTA images do not necessarily correlate with cystic spaces observed on structural OCT because the fluid can compress the nearby vessels, reducing blood flow below the threshold limits of OCTA. 49 Lee et al., reported that damage to the deep capillary plexus (DCP) is more significant than that of the superficial capillary plexus (SCP) in DME. The extent of DCP damage can be used to predict treatment outcomes in patients with DME. Additionally, Sun et al., 50 identified a reduction in vessel density in the SCP on OCTA image, indicating that quantitative metrics can be used to identify the risk of DME.50
Cotton-wool spots are acute lesions that present as opaque swellings on the retinal surface and can indicate significant vascular injury within the eye. For some patients with retinal ischemia, microaneurysms may exist at the edge of cotton-wool spots. 51 OCTA has been shown to identify areas of retinal nonperfusion in the DCP and SCP that correspond to the decorrelation signal seen in the SCP of cotton-wool spots. 52
OCTA datasets
Literature search strategy
A thorough literature search was conducted using various search engines such as PubMed, ScienceDirect, Scopus, Google Scholar, and IEEE Xplore. It has been perceived that since 2019, the number of articles especially about OCTA images to screen DR has been increasing significantly. The various syntax was entered into a research database to examine various literature searches for each session. The following search word was entered for sessions 1 and 2: “diabetes AND prevalence”“diabetic retinopathy AND prevalence”“imaging modalities to diagnose DR AND Fundus AND OCT AND Fluorescein Angiography AND OCTA” OR “OCTA to screen DR”. Every article found by the search engine has the abstracts and titles examined, and all relevant findings were extracted. Except for DR, the prevalence of other anomalies caused by diabetes was excluded in this study. The Syntax used to examine research papers for session 3 is “OCTA datasets”. The aim of the search was limited to OCTA images for normal eye and images with DR cases. In the process of finding OCTA datasets, published scientific papers available publicly starting in 2019 alone were considered, and OCTA private databases used by various authors were excluded. Except for OCTA datasets, all other imaging modality datasets were excluded from the literature search. In sessions 4 and 5 the keywords used for finding literature search relevant to OCTA images for DR screening are: (“Convolutional” OR “Automated” OR “machine learning” OR “artificial intelligence” OR “deep learning” OR “random forest” OR “support vector machine” OR “U-net” OR “Computer-aided diagnosis”) AND (“Hemodynamic” OR “foveal avascular zone” OR “vessel density” OR “blood flow velocity” OR “Computational analysis”). In this session, the search period was limited to the year 2014 and for AI and hemodynamic studies the most recently published articles after the year 2019 were considered. Studies conducted using imaging modalities other than OCTA were excluded in this section. From the identified search engine 2455 records were found, and 454 articles remain after finding the relevant title and abstract (Duplicate literature removed). After applying exclusion criteria, 110 relevant publications out of 454 articles in the search engine list were taken into consideration for this study.
In recent times, we have witnessed incredible developments in ophthalmological imaging research in ML and deep learning (DL) using publicly available datasets. There has been a continuous improvement in fundus image research using available online datasets, such as CHASE, 53 DRIVE,54,55 and STARE.56,57 Since there are enough fundus and OCT images available on online datasets, we have concentrated more on modern technology in OCTA imaging. This technique is emerging but there are very limited datasets available online, hence it is a major challenge to continue ML-based research with improved accuracy. 58 Various OCTA datasets considered for the study were summarized in Table 3. All the images in datasets are obtained based on the prior request from the corresponding author and few images are available in the public domain with an open-access database.59–65 A recently published online database “OCTA-500,” contains OCTA imaging from 500 subjects and it is very useful in angiography studies as compared to other datasets. Publicly available resources contain segmenting blood vessels of the retina from OCTA images and it is useful for researchers to distinguish and precisely segment the abnormality.66,67 This might help future researchers to analyze their database through OCTA images to detect early DR changes. 68
Summary of available OCTA datasets.
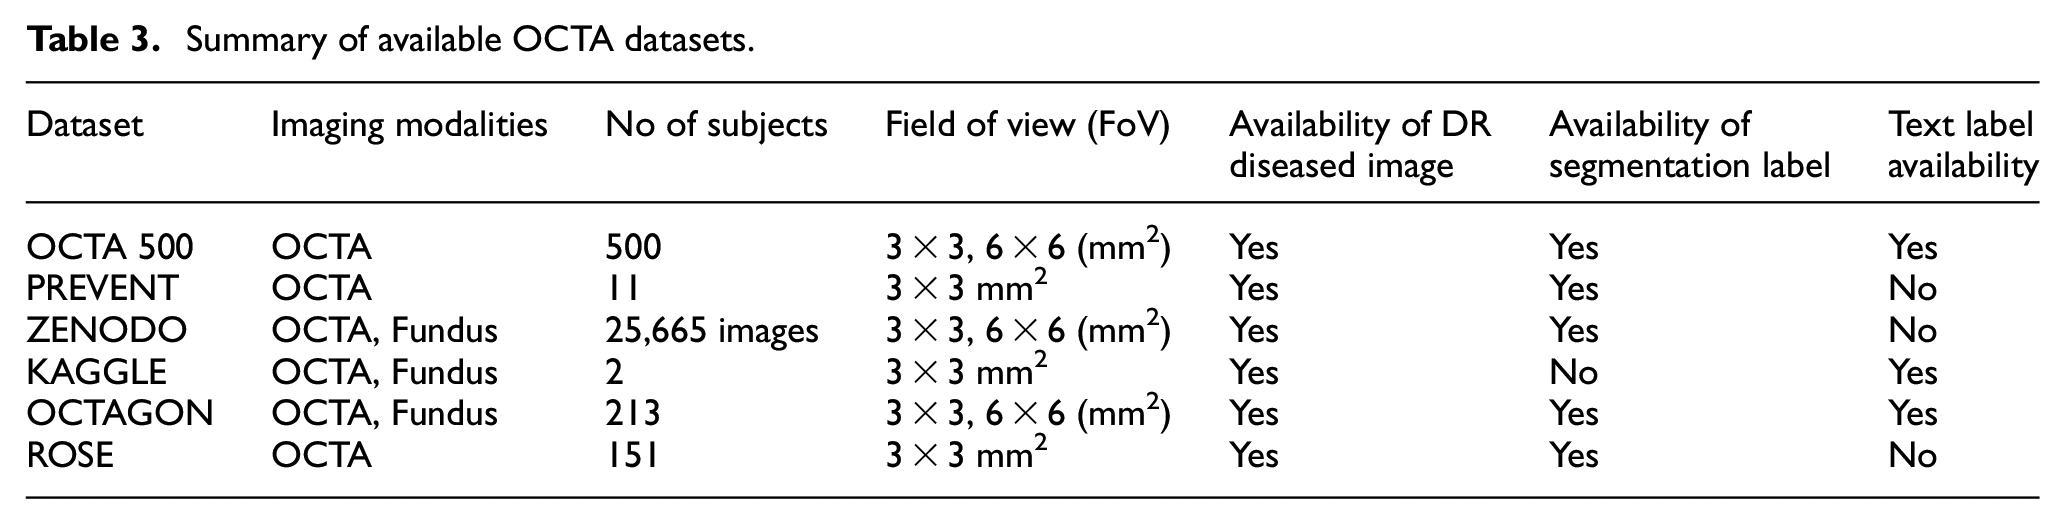
The OCTA has shown encouraging results for obtaining retinal images of small deep capillaries without the need for any contrast agent compared to other imaging techniques. 59 OCTA images have significant value for both clinical diagnosis and academic research proposals. The biggest limitation in carrying out academic research is the limited availability of OCTA image datasets, especially the images with DR changes. The segmentation of the retinal microvasculature by a manual process using the clinical image is a tedious step and time-consuming, so segmentation labels used to classify the images in AI are available in the datasets themselves. 69 Various OCTA datasets are available and subject availability is plotted in Figure 6.
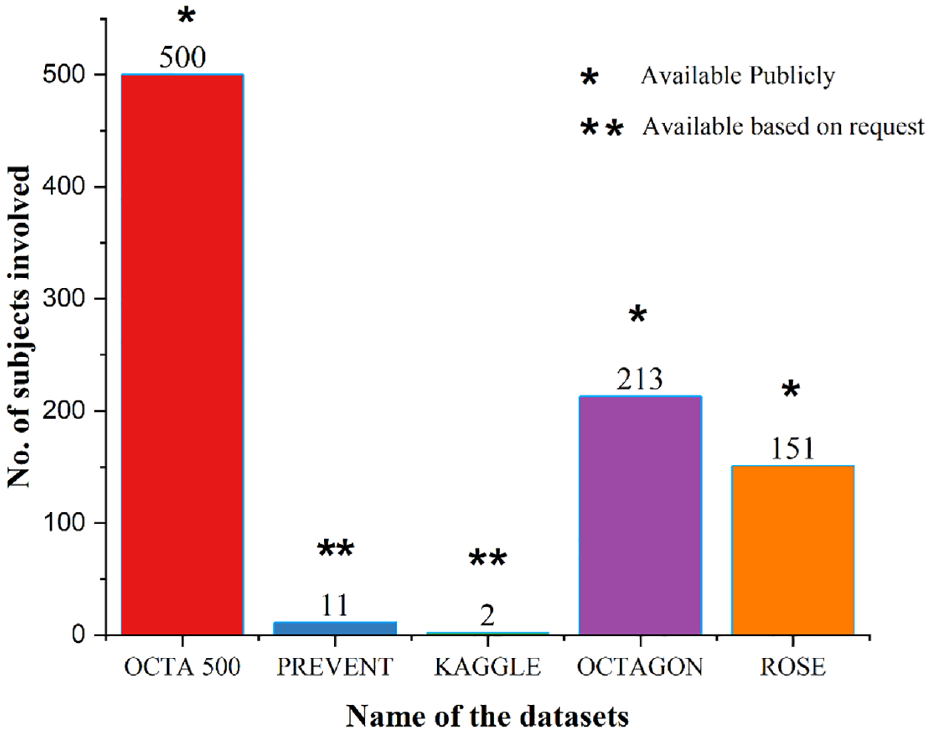
Plot illustrating the various available datasets of OCTA images. In the figure “*” denotes the available datasets publicly and “**” denotes the availability of the dataset based on a request to authors.
Impact of AI to diagnose DR from OCTA image
Analysis of retinal images using optical devices requires an ophthalmologist, which is a time-consuming and expensive task. In recent years, various computer-aided tools have emerged, especially tools using AI to identify the stages of DR. 70 DR detection currently faces several difficulties: developing efficient image processing algorithms to process OCTA images with artifacts, 71 providing precise diagnostic techniques for spotting borderline instances of DR, strong diagnostic performance to segment the retinal blood vessel structures, 67 and lack of hemodynamic analysis in retinal vascular structures. In a clinical setting, AI technologies can eliminate the need for physical grading by clinicians which will save time and energy during screening patients. Most recently, supervised machine learning techniques have been applied to classify DR in OCTA. 72 A supervised machine learning system gains knowledge from the available OCTA dataset, which includes label features and output representation as training data. After performing the machine learning algorithm, the OCTA test image is given as input, the developed ML system predicts the output using the training data as shown in Figure 7. Combining mathematical techniques like fuzzy logic in machine learning algorithms can be a useful tool to make an accurate prediction. Existing ML and DL algorithms that are used for processing medical images like OCTA images are Support Vector Machine (SVM), the Backpropagation neural network (BPNN), and various Convolutional Neural Networks (CNN). Implementation of DL algorithms is increasing among researchers in ophthalmology due to promising findings obtained during screening from the developed model for early and accurate diagnosis of abnormality in the eye. The recent works by various researchers in developing computer-aided systems using AI were analyzed for the classification of various DR conditions.73,74
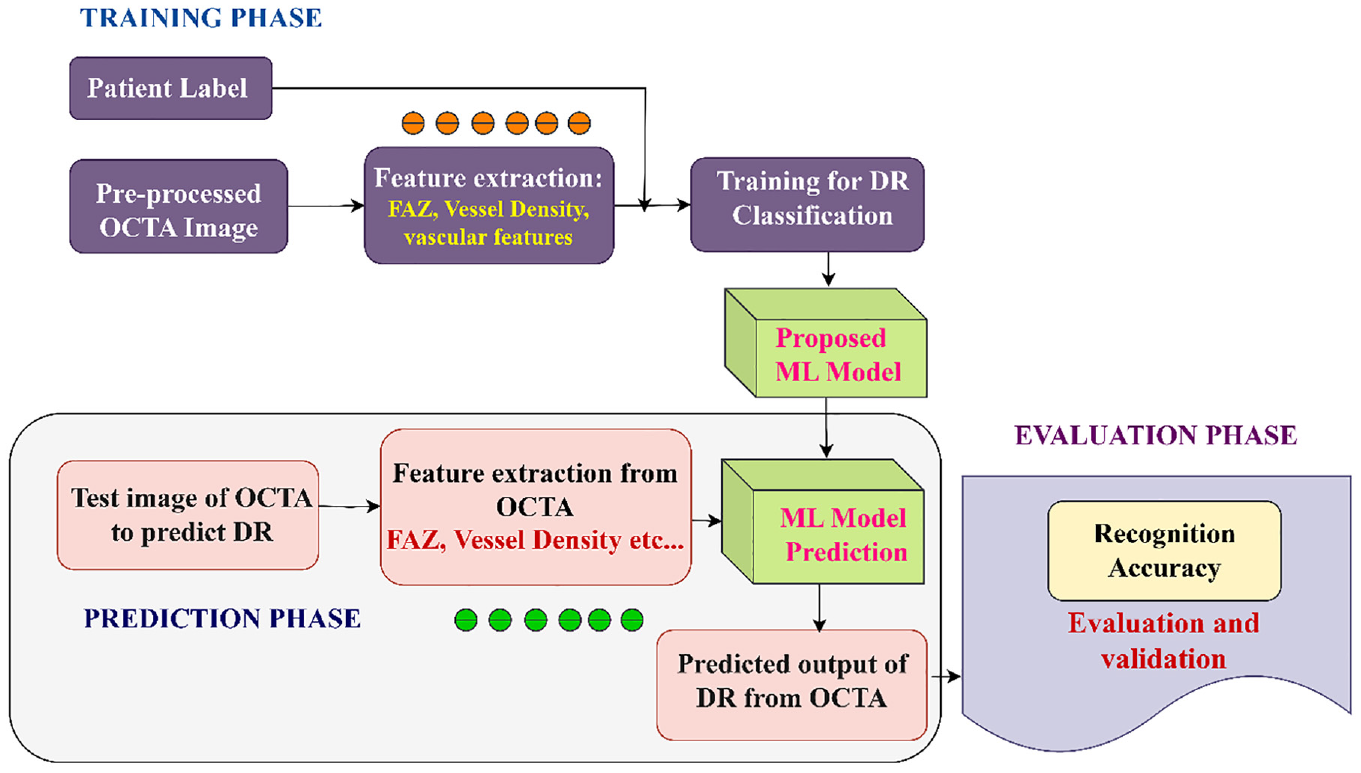
Conventional machine learning approach for disease prediction.
Certain investigations of DL and ML frameworks in DR screening using OCTA
Various ML and DL techniques were implemented and available to diagnose and classify DR automatically using fundus image but few limitations are there in those modeled algorithms as a fundus image is a 2D image where deep blood vessel features are missing, it produces an image with poor resolution so, hemodynamic analysis using ML technique is not possible.75–77 Various DL frameworks and ML algorithms using OCT angiography images for screening and classifying DR were considered for this review.
Ryu et al., implemented an automated classification algorithm to detect and classify DR status using OCTA images using three models for classification: DL-based classification, ML-based classification and expert-level classification by a trained ophthalmologist. It improves the accuracy and robustness of the system. DL-based conventional deep CNN technique for automatic classification of DR stages from OCTA images was used in this study. 78 Using OCTA, a total of 301 subjects’ eyes were enrolled for image acquisition and 3 × 3 mm2 raw OCTA images were obtained. Among them, 51 were found to be normal eyes, 51 were spotted with diabetes without DR, 53 were screened with mild NPDR, 49 had moderate NPDR, 48 had severe NPDR and 49 with proliferative DR. In the review, various ML-based classifiers are used in stage 2 for DR classification and comparative analysis: Multiple Layer Perceptron, Random Forest, SVM and eXtreme Gradient Boost. Among various models, the system preferred the ResNet 101 CNN model classifier in stage 1 and achieved more accuracy with 91%–98%, 86%–97% sensitivity, and 94%–99% specificity compared to the other two results in performance analysis. 77
Inference of machine learning frameworks in DR classification
ML technique is a kind of AI framework that obtains only unbiased training data. Hence, ML is dependent on the training data. Several ML algorithms were used in the identification of DR and its classification and are reviewed with their performance indices. Early identification speeds up the treatment process and can prevent permanent vision loss associated with DR. Artificial Neural Network is a subset of ML techniques mimicking the biological neural network that can automatically classify different DR stages. All five algorithms use OCTA images as input and they created their dataset at their respective ophthalmological centers and those databases are not available in public.
Four layers of the suggested ANN structure for DR classification were proposed by Abdelsalam, seven neurons form the input layer of the ANN network, representing the seven extracted features with two hidden layers. One output layer with three neurons for the three classification stages of DR.75,76 The suggested methodology achieved the highest performance indicators of 97% accuracy. The performance indicators in terms of accuracy, sensitivity and specificity of various ML classification models are plotted in bar chart.58,77 Performance indicators for human expert prediction of DR classification show 33% accuracy, 32% sensitivity, and 86.9% specificity. The results are considered to be very low compared to ML techniques considered for the analysis in this article as shown in Figure 8. The comparisons with hand-crafted K-nearest neighborhood (KNN) based ML models were performed and results are summarized. KNN is one of the first classifiers that researchers can practice by implementing it because of the algorithm’s simplicity and accuracy. The objective of KNN ML framework is to find the nearest neighbor pixel in an image, so that we can assign a class label in that point. Based on the distance measures between different labels the classification is carried out. The k parameter in the k-NN technique specifies how many neighbors will be examined to determine a particular query point’s classification. AI offers accurate information processing and is becoming increasingly popular in the field of functional optical imaging for the diagnosis and screening of early stages of DR. 79
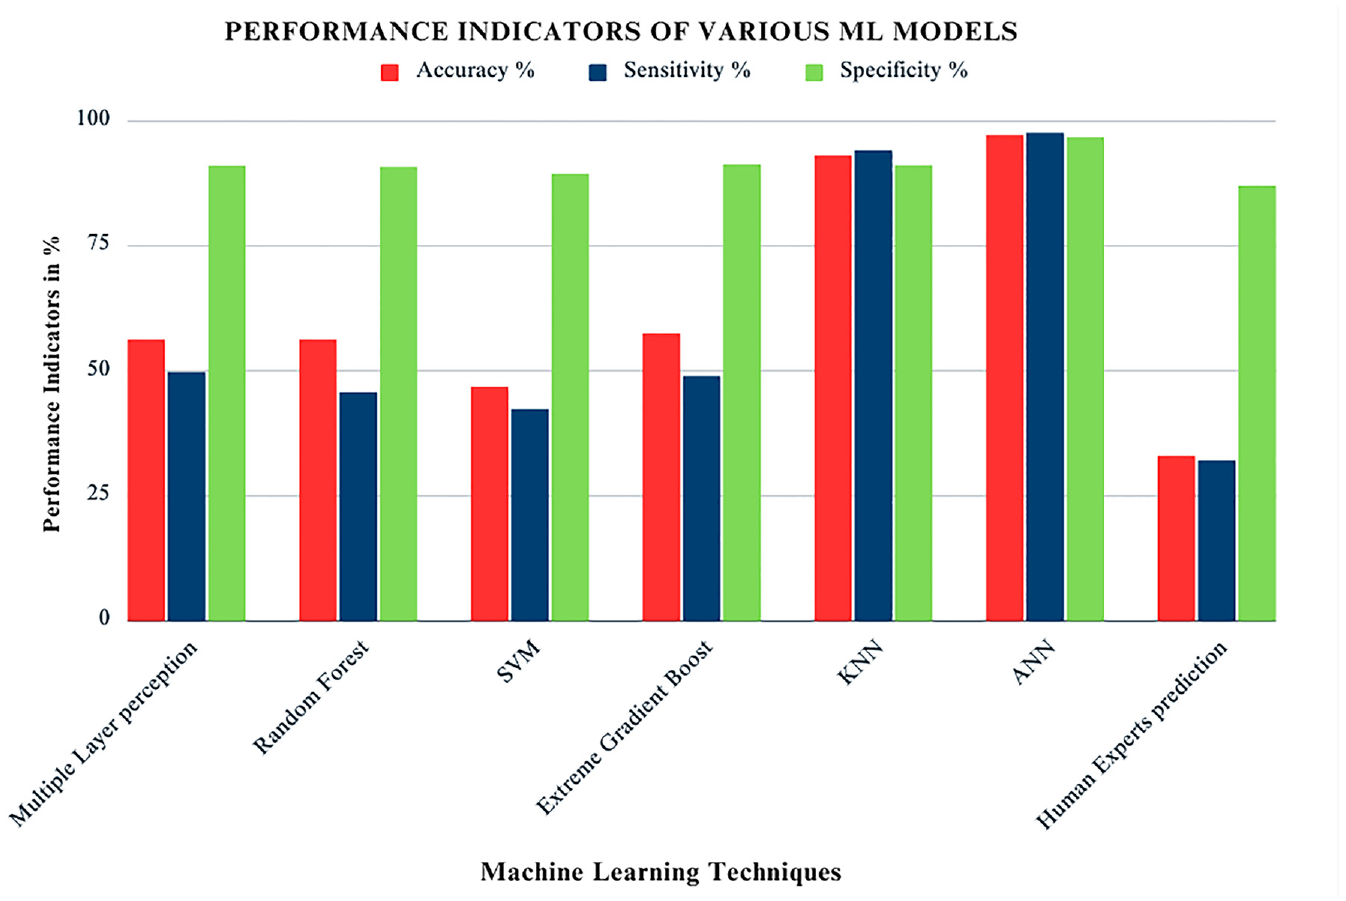
The bar plot shows the performance indicators of various ML framework for the prediction of DR with human experts. Performance indicators considered for this review are accuracy, sensitivity and specificity.
Inference of deep learning frameworks in DR classification
Le et al., proposed an automatic model to diagnose DR by implementing a robust DL-based CNN architecture in a graphical user-friendly interface platform (GUI) to improve its feasibility during clinical diagnosis. Even without using any ML techniques for automatic DR classification, the proposed system outperformed itself using the nine-layer VGG16 CNN network. More image samples from the dataset are required while training an efficient CNN model to improve the system accuracy for a particular classification task. 80 However, the OCTA imaging device has been commercially available recently in 2016 and as the first clinical trial was conducted in 2014,35,81 there are certain limitations in the availability of dataset images which proves to be a major obstacle to the implementation of deep learning algorithms practically. In the DL framework considered for the review, Python 3.7.1 and Keras 2.24 software were used to train and test the proposed CNN classifier. Cross-validation datasets using transfer learning and external datasets were used to validate CNN classifiers. The accuracy in predicting DR and its classification was promising for the proposed system. According to the analyzed performance of classifiers, lower accuracy was revealed in the external dataset compared to the cross-validation dataset. 82 Despite the limited number of OCTA image datasets in the U-net algorithm, the classification of diabetic retinopathy eyes was 95% accurate.74,83
Li et al., developed a DL framework by considering ResNet50 as the basic architecture, consisting of four-stage convolutional frames. The system model is visually analyzed using gradient-weighted class activation mapping. Final classification results are determined from the last convolutional layer of the modified ResNet50. Totally 301 OCTA images were used by the author from the publicly available OCTA-500 dataset to train and test using the cross-validation process. The proposed classification in this study is implemented in three stages of the DL framework: (i) Isolated convolution stage (Basic ResNet50 model), (ii) Concatenated convolution stage, and (iii) Fusion of both convolution stages (Modified ResNet50 system, a proposed framework).
The input for the three classification models is given as vessel segmentation output of OCTA images, and fused images of both OCTA and segmentation. After the classified output is revealed, it is inferred that the framework achieved the highest degree of accuracy (88.1%) using the modified ResNet50 algorithm when the merged input image was given. 83 The comparison was carried out for the modified ResNet50 (proposed model) and the existing model with the same OCTA-500 datasets as the input image. During the implementation of AI in healthcare for disease diagnosis, the highest degree of accuracy is expected from the proposed model. In that aspect, images were given as input through 101 layers of residual blocks in the proposed ResNet101 model by Ryu et al., in which the input and output feature maps from the convolution layers were repeatedly added.78,84 The design layout of the ResNet101 framework for identifying early indicators of DR and its classification is illustrated in Figure 9. To find DR, an end-to-end categorization task was carried out. The OCTA images are passed through 16 model stages as sample stages shown in Figure 9. OCTA features passed into a fully connected layer and the pooling layer to obtain the classified output. The obtained output in the class activation model provides a clear indication of mild to severe DR in both proliferative and non-proliferative stages. Totally 360 OCTA images were used to train the ResNet101 model using the publicly available OCTA-500 dataset and also from the dataset created by Yeungnam University Medical Center. It is inferred that the highest degree of accuracy (95.8%) was achieved in the ResNet101 model. The output of all performance indicators is calculated based on average value of accuracy, sensitivity, and specificity. 83
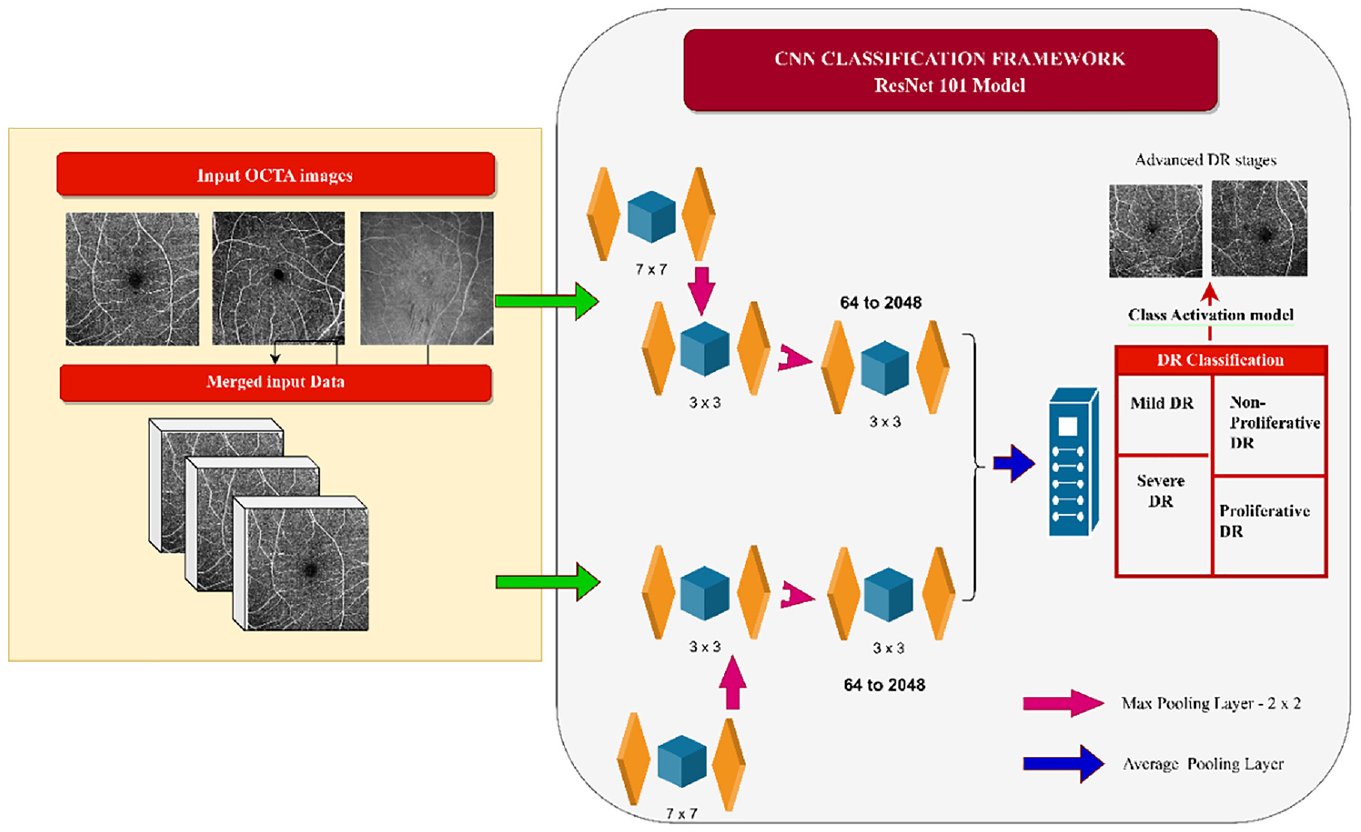
ResNet101 CNN-based classifier for prediction of diabetic retinopathy.
Yasser et al., proposed a novel approach to develop a multi-layered CNN model by building up two successive, fully connected convolutional blocks followed by a max-pooling output layer. This layer converts the fully connected layers activation into a class membership function used for the classification of DR. The proposed Shallow CNN system was trained and tested using 91 different samples, 55 have DR and 36 are non-DR, 80% of the images in the database are used for training, and 20% are for testing. The proposed CNN framework by the author with the shallow technique shows its design and multi-layered structure in Figure 10.
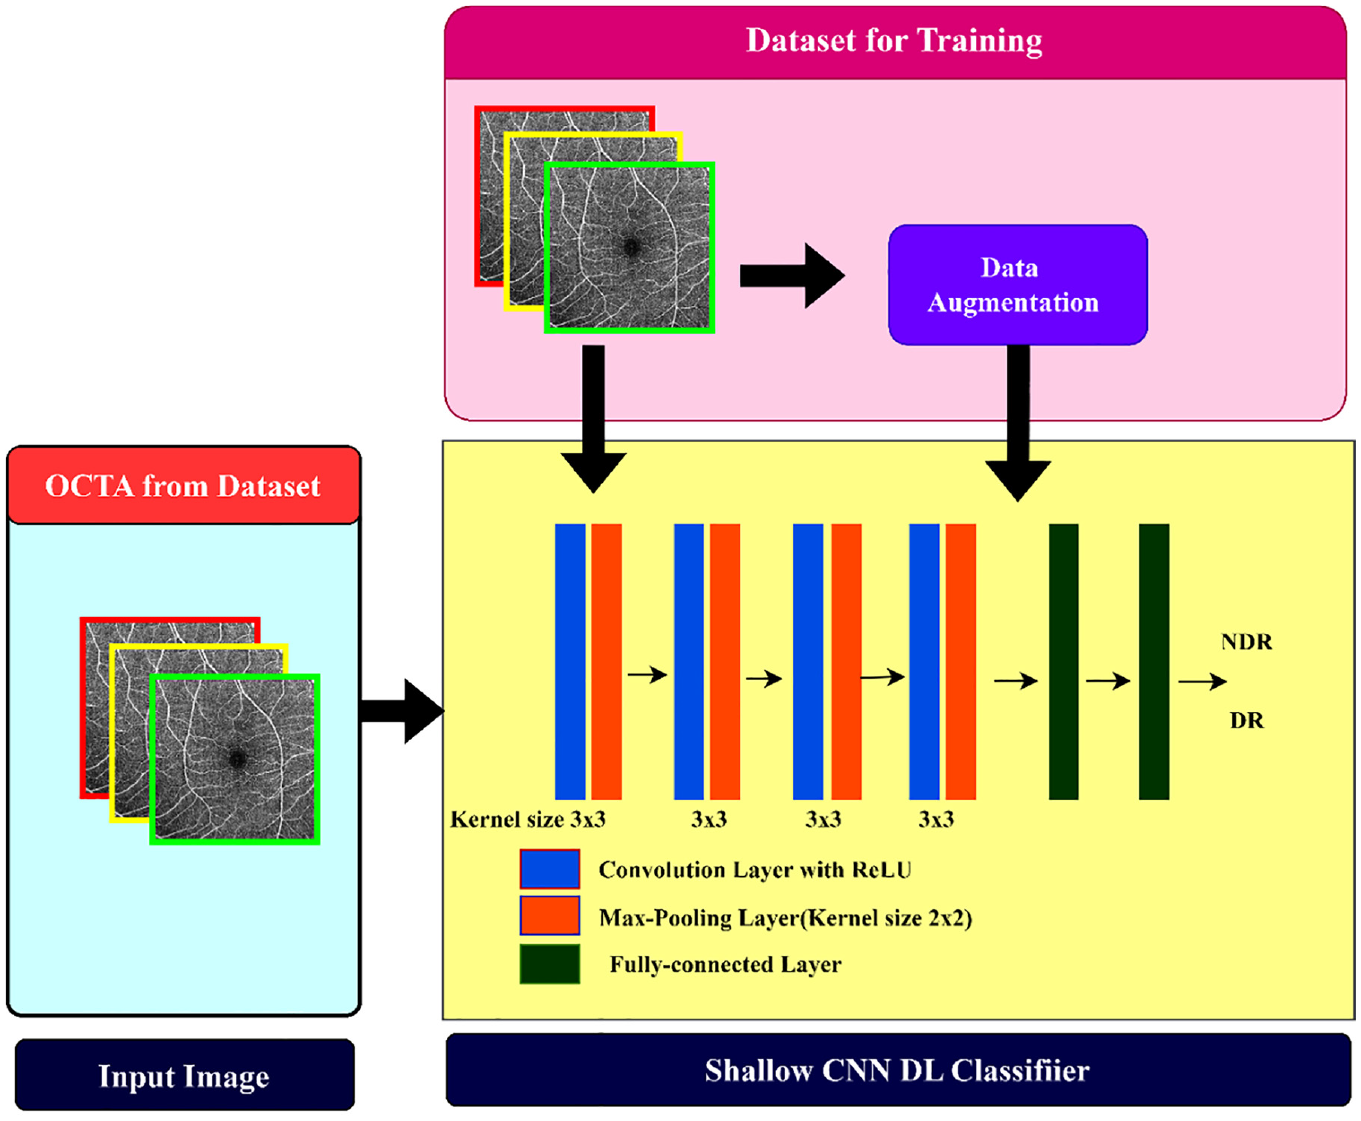
Illustration of shallow CNN framework with multi-layered design for DR classification.
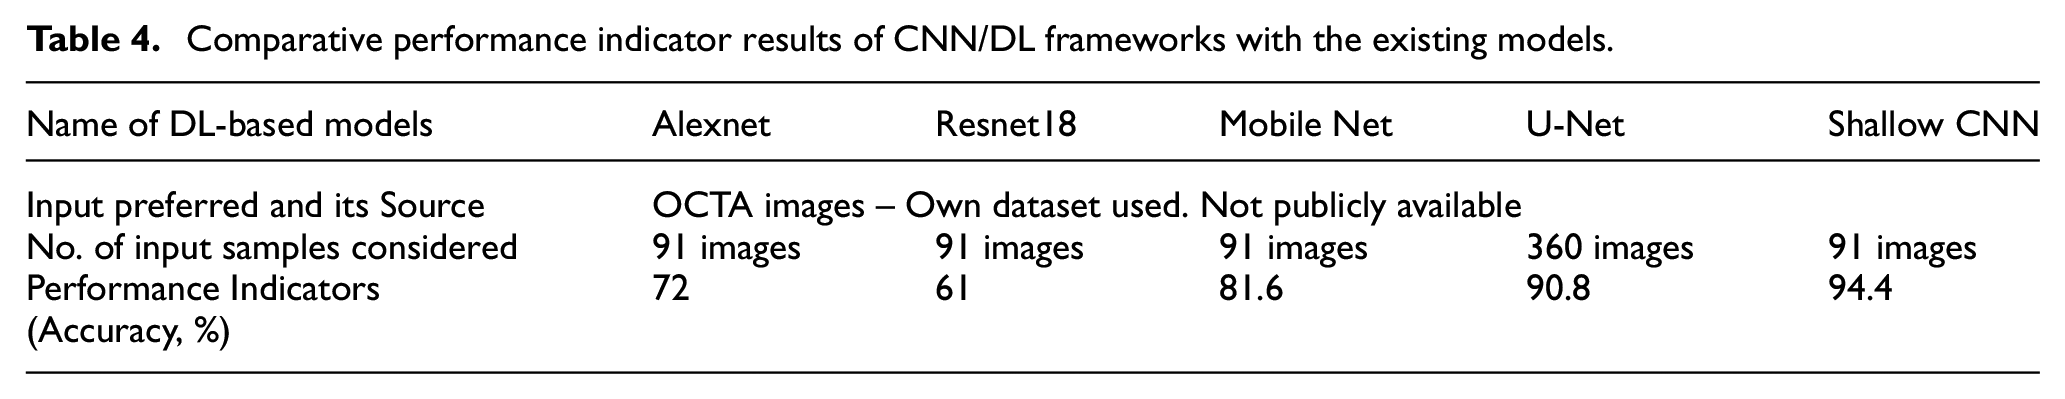
Accuracy, sensitivity, specificity, and F1-score are considered performance indicators for validating the model. According to the review, the proposed CNN framework has the best performance index when compared with other existing systems (Table 4).75,79,85 Overall, the results showed that Shallow CNN has a peak accuracy of 94.4%, sensitivity of 91.7% and specificity of 100% among all other CNN systems that we considered for the review. 74 As a reference to the plotted bar graph in Figure 11, findings from the study suggested that the developed CNN framework surpassed both existing DL techniques and features-based DR detection algorithms. The performance indicator shows the accuracy of classifiers ranging from low to very high. Accuracy ranges below 70% are considered as low, accuracy ranges from 70% to 80% represents medium range, high ranges considered from 90% to 94% and very high range of accuracy are marked when results show >94% from Table 4. Due to the skip connections and additional layers in the growing path of U-Net architecture, it has more parameters so it increases the computational time. The U-Net model uses same OCTA-500 dataset and the performance indicators are tabulated in Table 4. This could increase the chance of the model overfitting, especially when using limited datasets.
Comparative performance indicator results of CNN/DL frameworks with the existing models.
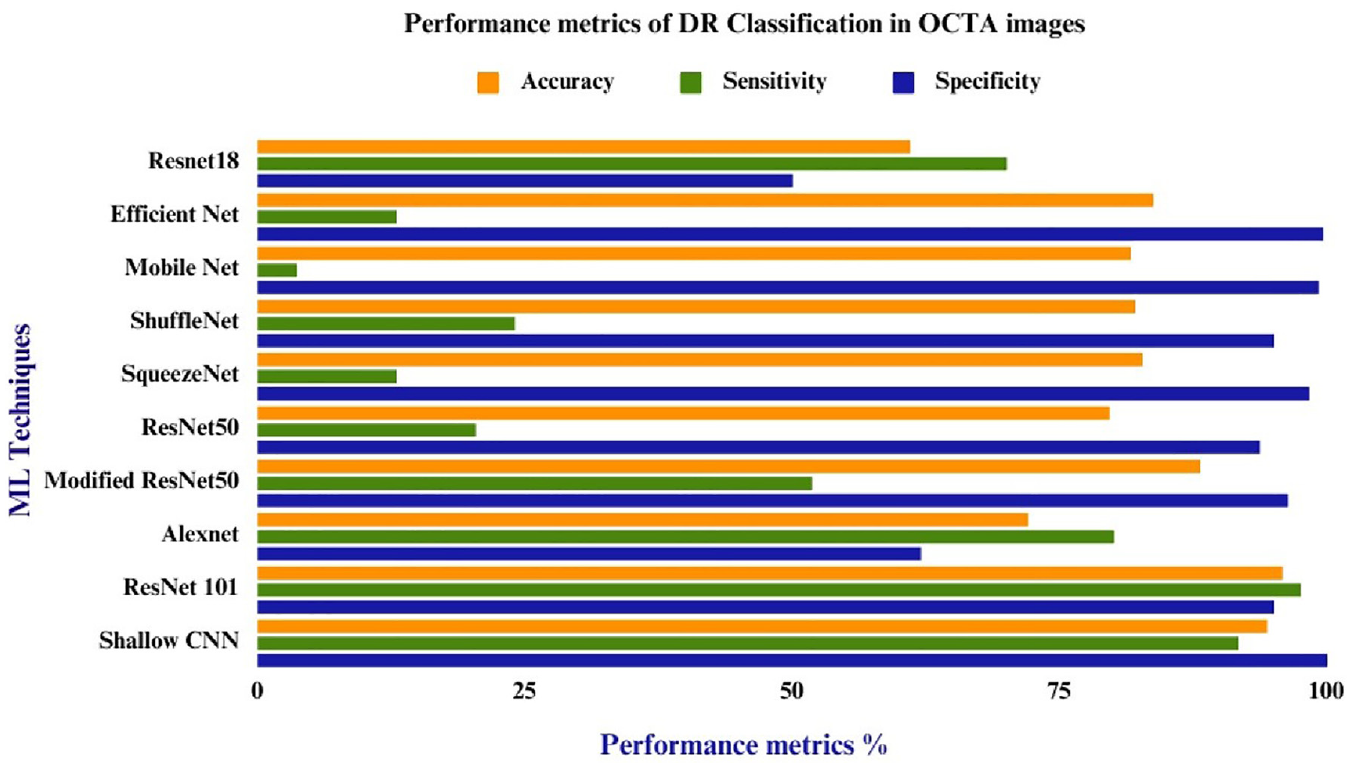
Bar graph illustrating performance indicators of various deep learning classifiers for the prediction of DR. The bar graph in orange color represents accuracy, the solid bar in green color represents the sensitivity of the classifier and the specificity metrics of DL classifiers are mentioned in blue color.
Hemodynamic analysis and vascular feature extraction in OCTA DR images
The review is directed to investigate the hemodynamic changes in the retina and to explore various parameter gradients of the retinal vessels. An important goal of the hemodynamic analysis is to find precise structural changes inside the retina and make decisions in DL and ML models for classifying DR. There are different imaging modalities to acquire images for hemodynamic analysis which include adaptive optics scanning laser ophthalmoscopy, 86 color Doppler ultrasound, 87 adaptive optics retinal camera, laser Doppler velocimetry, Retinal Vessel Analyzer (RVA), 88 and OCTA. We focussed on the use of OCTA images for hemodynamic analysis for diagnosing DR changes. The classification of DR into early-stage DR or non-proliferative DR was achieved by selecting appropriate features related to hemodynamic vascular structure. Seven OCTA image-based quantitative hemodynamic parameters important for classifying DR are FAZ, retinal blood vessel density, retinal blood velocity, blood flow index, capillary vessel pressure, and retinal oxygen extraction. Various DL and ML algorithms considering these quantitative hemodynamic parameters were reviewed in our study for computer-aided screening of DR.
Measuring FAZ in OCTA for DR
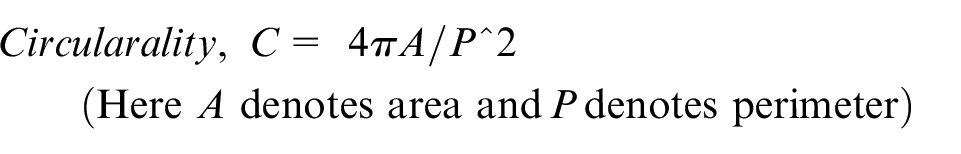
The FAZ is a circular area devoid of blood vessels located in the macula of the eye. AI algorithms measure various parameters of FAZ such as area, perimeter, shape, and circularity to detect diabetic microvascular changes in patients using OCTA images. An enlarged FAZ area is considered a significant indicator of microvascular changes, resulting from the loss of capillaries in surrounding vessels. 89 However, as healthy eyes exhibit a certain degree of heterogeneity in FAZ area (0.071–0.527 mm2), FAZ shape may be a better marker for microvascular changes. 90 Normally, the shape of FAZ is spherical or elliptical, but in the presence of DR-induced innermost capillary obstruction, it becomes irregular, indicating damage. Figure 12 displays the enlarged or irregular FAZ area of superficial vascular structures using the ROSE datasets, provided upon request from author. 91 The circularity ratio of FAZ is calculated using an equation that is implemented using AI techniques in various software like Matlab and Python. The FAZ circularity index, which measures how compact a form is about a circle, was calculated as a function of a shape’s area and perimeter. If the circularity index is zero it represents an abnormal eye and is identified as DR, and if the circularity ratio is one indicates a circular shape and is considered a normal eye. 92 This proposed review aims to identify altered FAZ in OCTA images to diagnose diabetic retinopathy changes at the earliest.
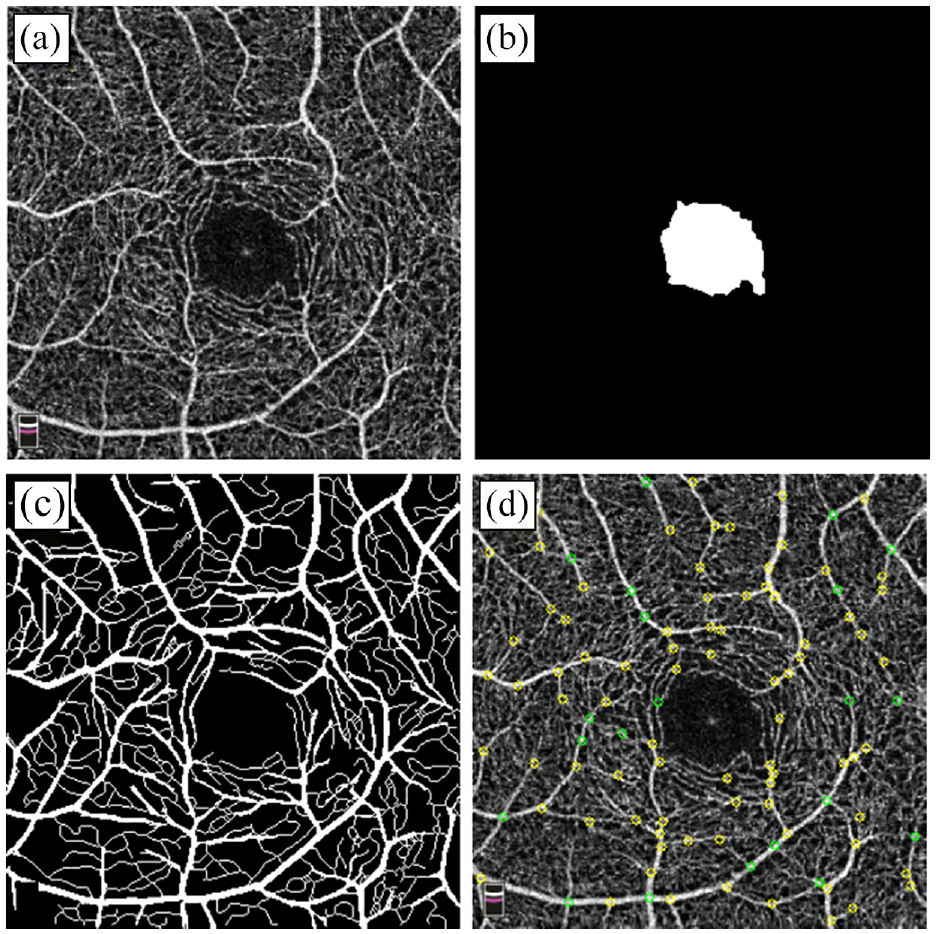
Representation of OCTA image and extracted feature from DR affected person (ROSE dataset): (a) Original OCTA image, (b) segmented FAZ, (c) skeletonized segmented blood vessels, and (d) identified vessel junctions in OCTA.
Retinal vascular density changes in DR
Quantitative analysis of retinal vascular geometry parameters helps to assess the status of the eye. Various parameters for detecting vascular changes in DR include: Vessel density (VD) (retinal microvascular perfusion is indicated by the ratio of blood vessel area to the total measured area), 93 Vessel length density (VLD) indicates the total length of skeletonized vessels in a measurement region per area.; measured in mm/mm2), 94 These changes can be assessed in SCP and DCP conditions. VLD is a more sensitive marker than VD, 95 vessel diameter index (VDI) is calculated as the area engaged by the vascular region of blood from the binarized image over a total length of blood vessels from the skeletonized image, representing the average vessel caliber of blood vessels, 96 retinal vessel tortuosity is defined as the integral of the curvature square along the path of the blood vessel, normalized by the total path length. 97 Diabetics show higher vascular tortuosity as compared to healthy persons, suggesting that vessel tortuosity may be an early sign of vascular injury to the retina. VAD ranges from 0.00 (no perfusion) to 1.00 (fully perfused), which was assessed in both the deep and superficial capillary plexuses. The diagnosis of DR can be possible if there are retinal capillary changes. In individuals with type 2 diabetes and DR, sequential optical scanning during regular appointments helps to detect the early stage of the disease. 98
Oxygen extraction in the retina for detection of Mild DR
Hypoxia is the condition that occurs when the O2 Supply to the blood tissue is not sufficient in quantity to maintain balance among all the body tissues. Hypoxia plays a vital role in the occurrence of DR. The retinal vessels and choroidal vascular region are the two sources of oxygen delivery for retina. 99 Different research scholars have measured hypoxia in diabetes animal models using various methods100,101 but there is conflicting evidence regarding the presence of retinal hypoxia at the beginning of the disease process. Furthermore, none of the investigated animal models develop DR where the human DR exhibits retinal neovascularization, a significant late-stage consequence. 102 Calculating blood flow is a useful tool for finding retinal metabolism or retinal oxygenation. A specially developed bi-directional Doppler optical coherence tomography device and spectroscopic reflectometry are used to calculate oxygen saturation and retinal oxygen extraction. Total retinal oxygen extraction is measured using a mathematical model to determine how much oxygen is taken from the retinal circulation. 103 Measurements of retinal blood flow and retinal oxygen saturation from a recent human investigation revealed lower retinal oxygen extraction in people with type 2 diabetes, however retinal oxygen extraction was not quantified. 104 Another study by Homer et al., to assess retinal oxygen metabolism in patients with type 2 diabetes in comparison to healthy control subjects concluded that retinal blood flow is higher in patients with no DR and mild DR than in healthy subjects and patients with moderate to severe DR. Healthy subjects had the greatest arteriovenous difference in oxygen saturation, which was followed by patients with no DR and moderate to severe DR. 105 According to the study, capillary dropout and capillary non-perfusion, which can be seen on an OCTA scan, can cause a reduction in oxygen delivery to the retinal tissues, which in turn reduces oxygen extraction. 106
Computational fluid dynamics (CFD) of retinal blood vessels
In this proposed review, various non-invasive techniques for the evaluation of computational dynamics around the retina of the eye were analyzed. CFD is used to perform numerical analysis using computer software to calculate required fluid flow parameters inside the blood vessels for diagnosis of DR. OCTA images are obtained to visualize vascular structures inside the retina, during the process of CFD simulation the flow models were designed. Those models provide a 3D view that can be capable of mimicking the same hemodynamic ambiance of the retinal vascular structures. The possible CFD analyses in retinal vessels are blood velocity, 107 perfusion pressure, vessel dimension measurement, shear stress, shear strain, von displacement, inlet and outlet pressure, and blood flow simulation. 108 Among the above CFD, it is found that there are no articles identified with a methodology for measuring shear stress, shear strain, von displacement and accurate pressure measurement.
Various 3D surface reconstruction and hemodynamic fluid analysis software are available commercially for the design and development of the 3D model and performing CFD analysis such as Synopsys Simpleware, MIMICS, Solid Works, Geomagic freeform, COMSOL, ImageJ, HemeLB, and Ansys. The real-time visualization of blood vessels and CFD is a very useful tool during surgical planning and therapeutic procedures. 109 The 3D vessel density measurement and blood velocity can be calculated using the above software and it appeared to be the most sensitive indicator for identifying eyes with DR. So, in actual clinical practice, an ophthalmologist can first obtain a standard OCTA/fundus imaging and then follow it up with a B-mode scan to generate a velocity and blood flow map at the region of interest.107,110 In another investigation, the CFD software HemeLB was used to execute flow simulations. In the analysis, blood flow velocity, wall stress (WS), and capillary perfusion pressure (CPP) were calculated. In the CFD model, velocity output ranges from 0.51 to 0.85 mm/s, WS is in the range of 1.67 Pascalto 2.71 Pa and CPP ranges from 3.67 to 6.92 mmHg. Statistically, it doesn’t provide a significant difference between DR and control eyes because of the small sample size of the study. Therefore, no definitive conclusions can be drawn in terms of blood velocity, WS, or CPP. 107 Future investigations with larger sample image datasets may offer useful CFD analysis to establish a clear indication between early hemodynamic abnormalities and the progression of DR illness.
Challenges and future directions
Most of the studies discussed in this article were limited to a smaller number of individuals. The major challenges of the authors were to find a public OCTA images database for normal and diabetic eyes with the sight-threatening DR category, and they omitted information on more conventional risk factors like the duration of diabetes, blood pressure levels, history of taking diabetic drugs, and the presence of associated diseases of DR patients that could have complicated the hemodynamic changes in the eye. However, the current AI techniques referred to in this article have challenges and limitations, such as the use of fewer datasets and image samples to train the AI models. As a result, the accuracy and sensitivity of classifying DR may be reduced due to inadequate images of different DR stages. In the future, it is essential to take the initiative to make more datasets accessible to the public domain, which can lead to the development of more research proposals for screening diseases using computer-aided systems. Vascular alterations and other hemodynamic studies in blood vessels using OCTA images may one day serve as a therapeutically useful biomarker for the early detection of DR. But the challenge for a researcher is to convert OCTA images into 3D models before it hemodynamically analyzed using software like ANSYS. Only a few research articles have addressed the 3D modeling of OCTA images, so it is considered to be a big challenge because of the unavailability of a stack of images from OCTA devices. Also the hemodynamic study need more than two commercial softwares to perform the analysis, this process is considered to be too expensive. So, there are a lot of scopes to carry out research in those areas.
Conclusions
The article discusses the use of computer-based diagnosis systems using OCTA images for detecting early signs of Diabetic Retinopathy (DR). The study surveyed various articles and reviewed OCTA datasets with specific DR disorders, highlighting their availability in the public domain. The article also analyzes and tabulates the implementation of AI for DR classification. The use of Deep Learning (DL) in screening DR can significantly reduce the time clinicians spend identifying abnormalities manually. AI has the potential to assist physicians and ophthalmologists in developing new treatment options by evaluating the performance of the DL/ML framework. To enhance the capabilities of the new paradigm, it is recommended to incorporate various AI architectures, such as ResNet and DenseNet, for automatic categorization and diagnosis of diabetic retinopathy. Additionally, the review includes a discussion on hemodynamic studies in OCTA images to understand the pathophysiology and progression of DR. By leveraging such techniques, it is possible to develop more accurate and efficient diagnostic systems that can assist clinicians in identifying and treating DR in a timely and effective manner.
Footnotes
Author contributions
KP carried out the conceptualization and initial study of the manuscript, and helped in preparing the original draft and editing. VJ contributed to the conceptualization, writing the technical part of the manuscript, and editing. MB and AS helped to prepare the original draft, helped in writing the manuscript, verified the clinical section of the manuscript, and helped in analyzing the pathophysiology of DR images. SM helped in writing the manuscript and verified the clinical part of this review. All authors helped to bring the final version of the manuscript.
Declaration of conflicting interests
The author(s) declared no potential conflicts of interest with respect to the research, authorship, and/or publication of this article.
Funding
The author(s) received no financial support for the research, authorship, and/or publication of this article.