
Abstract
Electrogastrography (EGG) is a novel diagnostic modality for assessing the gastrointestinal tract (GI) that generates spontaneous electrical activity and monitors gastric motility. The aim of this study was to compare patients with functional dyspepsia (FD) and diabetic gastroparesis (D-GP) with healthy controls (CT) to use established findings on abnormalities of gastric motility based on EGG characteristics. In this study, 50 patients with FD, 50 D-GP patients, and 50 CT subjects were studied to compare EGG with discrete wavelet transform models (DWT) to extract signal characteristics using a variety of different qualitative and quantitative metrics from pre-prandial and postprandial states. As a result, higher statistically significant (p < 0.05*) were found in the DWT models based on power spectral density (PSD) analysis in both states. We also present that the correlations between EGG metrics and the presence of FD, D-GP, and CT symptoms were inconsistent. This paper represents that EGG assessments of FD and D-GP patients differ from healthy controls in terms of abnormalities of gastric motility. Additionally, we demonstrate that diverse datasets showed adequate gastric motility responses to a meal. We anticipate that our method will provide a comprehensive understanding of gastric motility disorders for better treatment and monitoring in both clinical and research settings. In conclusion, we present potential future opportunities for precise gastrointestinal electrophysiological disorders.
Keywords
Introduction
The most common sensorimotor disorders affecting the upper gastrointestinal tract are gastroparesis and functional dyspepsia 1 The clinical presentation and treatment of diabetic gastroparesis (D-GP) and functional dyspepsia (FD) overlap with commonly known disorders of the stomach associated with abdominal discomfort, epigastric pain, postprandial fullness, nausea, and cyclic vomiting.1,2 The prevalence of FD and D-GP in the general population is usually confused worldwide due to the similarities and weak correlation of symptoms.3,4 The current clinical methods for identifying FD and D-GP syndromes are the so-called Roma protocol, nuclear scintigraphy, abdominal ultrasonography (USG), single-photon emission computed tomography (SPECT), nonimaging assessment, and esophagogastroduodenoscopy (EGD), which are invasive and expensive.5,6 Therefore, most gastroenterologists and radiologists are interested in identifying gastric mechanisms to evaluate FD and D-GP patients.4,7 Because of the evaluation of patients with complex gastric muscle anatomy, the noninvasive technique of electrogastrography (EGG), which does not diagnose specific diseases but provides information about the irregular myoelectric activity of the stomach in various functional gastric disorders, has been widely used in research.8,9 However, the major limitations of the EGG technique are accessibility, specialized data acquisition, signal processing, feature extraction, placement of surface electrodes on the abdominal skin, and visual inspection required to detect large artifacts.10,11
Since signal processing of EGG data is considered essential for the analysis of the electrogastrogram, several traditional signal processing methods such as Fast Fourier Transform (FFT)-based spectral analysis and Short-Time Fourier Transform (STFT) have been developed with limited success.12,13 Recently, the wavelet transform, which is based on functions that can be fully scaled and modulated, has gained acceptance among advanced signal processing techniques. In this analysis, the wavelet coefficients represent the signal features, so they provide a different perspective when analyzing EGG.14–17 Moreover, this approach has been used to detect noise and suppress artifacts associated with stimulation in EGG signals.11,18 More recently, Deep Convolutional Neural Network Approach (CNN), Logistic Regression (LG), Support Vector Machine (SVM), and K Nearest Neighbor (KNN) Machine Learning (ML) algorithms have been successfully used to classify normal and abnormal slow gastric waves in the electrogastrogram with high accuracy.19,20 In this study we successfully estimate the EGG signals accuracy using artificial neural networks (ANN) algorithms. The second step of the EGG analysis evaluates how well the features obtained in the first step distinguish the different diagnoses. For the statistical analysis, the most common one-way method ANOVA was used to determine the correlations between the features extracted in the first step.3,10
The aim of our study was to compare functional dyspepsia (FD) and diabetic gastroparesis (D-GP) patients with healthy control subjects (CT) in terms of EGG signals. Therefore, the discrete wavelet transform (DWT) was used to extract frequency features from EGG signals. For feature extraction, large-scale features were analyzed based on DWT such as minimum, maximum, mean, median, and sum values of each approximation and detail coefficients. Then, the Welch PSD of each coefficient signals, features such as minimum, maximum, mean, median, and sum values were also analyzed to extract the best features in terms of pre-prandial and postprandial condition. Additionally, we aim to provide the correlations between EGG metrics and the presence of FD, D-GP and CT symptoms abdominal discomforts, epigastric pain, early fullness, heartburn, and vomiting.
The rest of the article is organized as follows: In the “Materials and Methods” section, the experimental setup is described, and details are given on the specifications of the equipment used to record the data sets from FD, D-GP, and CT, as well as on the preprocessing and evaluation of data quality. Besides, introduce the overall DWT method of EGG signals are presented. In the Results section, the different use cases of the EGG data set with the DWT and Welch PSD methods are described using the main features min, max, mean, median, sum values of each approximation, and detail coefficients in the pre-prandial and postprandial conditions. In the discussion section, the efficiency of EGG signal processing, adaptability, and interpretability of DWT methods are demonstrated. In addition, the effectiveness of EGG in different patient groups is examined and questioned. Finally, in the conclusion, future plans are discussed and some concluding remarks are made.
Materials and methods
Participants’ information and inclusion
All steps related to the medical part and recording of EGG signals were prospectively studied by a gastroenterologist and a radiologist after approval by the ethics committee. Patients with functional dyspepsia, diabetes mellitus, and healthy control group were included in the study. Demographic characteristics were documented after physical examination. Body mass index (BMI) was calculated in all subjects. All the participants fasted after midnight, and their blood samples were obtained the next morning. The blood samples were tested for glucose, BUN, urea, creatinine, sodium, potassium, calcium, AST, ALT, ALP, GGT, LDH, HbA1c, TSH, FT4, and complete blood count. Abdominal ultrasonography (USG) was performed. Video esophagogastroduodenoscopy (EGD) was performed by an experienced gastroenterologist (AD) under conscious sedation following an 8-h fasting period and intravenous midazolam injection. The presence of focal lesions, esophagitis, gastric or duodenal ulcerations, erosions, and malignancy were investigated. Patients with gastric ulcers, gastroesophageal reflux, heart disease, major gastric surgery, pregnancy, chronic obstructive pulmonary disease (COPD), hepatic syndromes, metabolic disorders, neurological syndromes, chronic lung disease, cancer treatment, and taking medications that affect the regular gastrointestinal system were excluded from the study. Patients who met the Rome III criteria were included in the FD group.4,17 Upper EGD included esophageal appearance and characteristics, gastric ulcers, and gastric cancer. Abdominal USG and gastric emptying scintigraphy were performed to rule out organic diseases. A total of 12 subjects were excluded from the FD group and 50 subjects were recruited for the final analysis. D-GP is more common in patients with type 1 diabetes mellitus, especially if they have poor glycemic control after 10 years. Therefore, gastric emptying scintigraphy was performed by a nuclear medicine physician. Although patients with D-GP have a history of almost 10 months, no delayed gastric emptying was mentioned in the scintigraphy reports; these were excluded. A total of 8 subjects were excluded from the D-GP groups and 50 subjects were recruited for the final study. Fifty healthy volunteers without any disease or clinical complaints and with a history of gastric dysrhythmic symptoms (nausea and abdominal pain and early feeling of fullness) were included in the control group. None of the subjects from CT were taking medications that could affect gastrointestinal motility. Similar laboratory tests, USG and EGD were performed, and only the subjects with all test results in the normal range were included in the CT. All participants gave written informed consent to participate in the study. Ethical approval for the conduct of this study was obtained from the ethics committee of our University. All procedures were in accordance with the ethical standards of the Human Experimentation Committee of our institution and the Declaration of Helsinki.
The EGG: Recording, pre-processing, and data quality assessment
All subjects EGG signals recorded with the Food and Drug Administration (FDA) licensed 3CPM device (Towson, Maryland) and filtered with the EGG software analysis system (EGGSAS) program. EGG device was designed to investigate the actual depth of electrogastrography and the ability to diagnose various neurological disorders related to the digestive system in the uniform environment of the classical water stress testing protocol. In addition, a breathing belt was placed around the upper chest to record respiratory movements and classify various artifacts in the EGG signals.5,8 The acquired signals were digitally recorded in supine position and stored at a sampling frequency of 4 Hz. Amplifiers were used because of the relatively weak gastric signal acquired by the cutaneous electrodes (200–500 lV). In addition, low (0.016 Hz) and high (0.3 Hz) bandpass filters were used to eliminate baseline drift and artifact sources such as the heart, small intestine, and some colonic frequencies. In this study, the duration of signal recording was 30 min of pre-prandial conditions, 10 min of rest for the selected test meal (two slices of toast with a fried egg and 330 ml of cherry juice), and 60 min of postprandial condition. Patients and the control group had given their informed consent before participating in this study (Figure 1). Computer analysis of EGG records in patients and healthy participants, from data acquisition to data analysis along with associated MATLAB code.
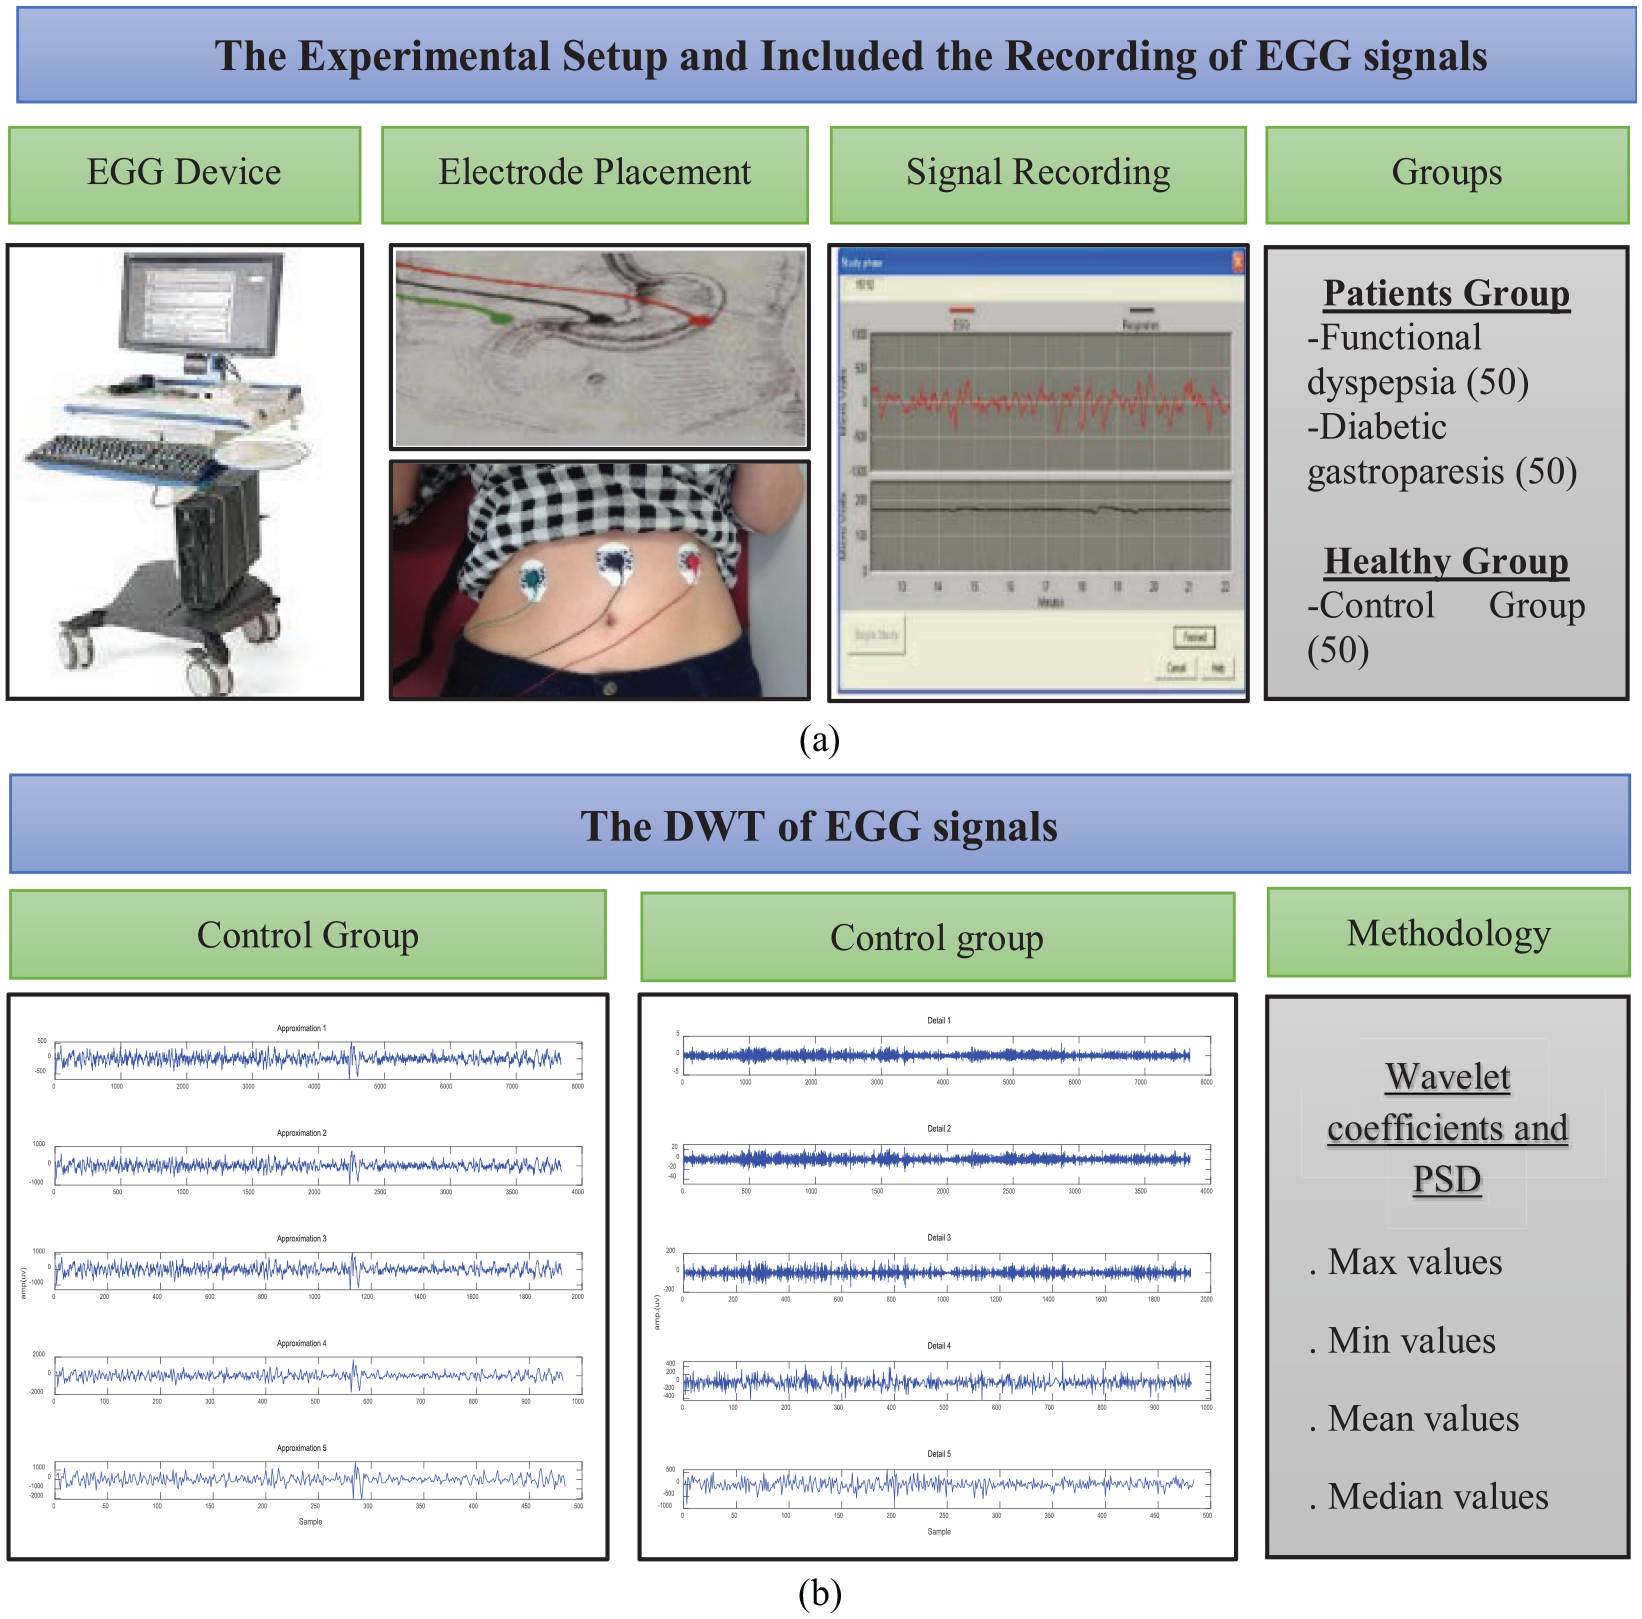
Overview of EGG architecture and interpretability. (a) Experimental setup. EGG instrument and interpretation of EGG recordings. Placement of surface electrodes on abdominal skin. All signal recordings for the EGG portion of the data set are performed in a quiet room to minimize extraneous electrical signals. Visual inspection required to detect large artifacts. This study was performed on a total of 150 female subjects. (b) Computer analysis of EGG recording. Five detail signals (D1, D2, D3, D4, and D5) and five approximate signals (A1, A2, A3, A4, and A5) were reconstructed from the coefficient matrices. EGG For feature extraction, the maximum, minimum, mean, median, sum, and PSD of the significant approximation and detail coefficients were calculated for each of the EGG signals in the pre-prandial and postprandial conditions.
The DWT of EGG signals
The wavelet transform provides a powerful alternative for the analysis of non-stationary biological signals because it uses windows based on functions that can be fully scaled and modulated, referred to as multi-resolution analysis.9,18 The wavelet transform can be divided into the continuous wavelet transform (CWT) and the discrete wavelet transform (DWT).21,22 The discrete wavelet transform (DWT) was mainly developed for non-stationary signals because it incorporates the concept of scaling into the transform, which provides better time-frequency resolution. Moreover, DWT analyzes the signal in different frequency bands with different resolutions by decomposing the signal into coarse approximation and detail coefficients.11,23
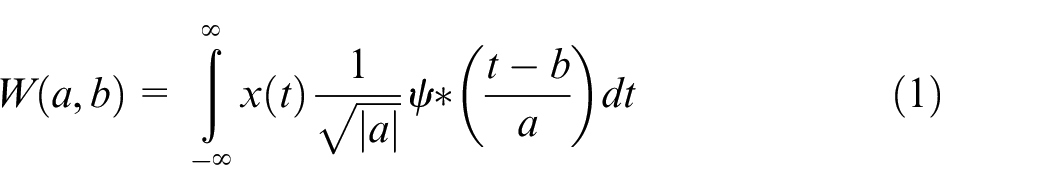
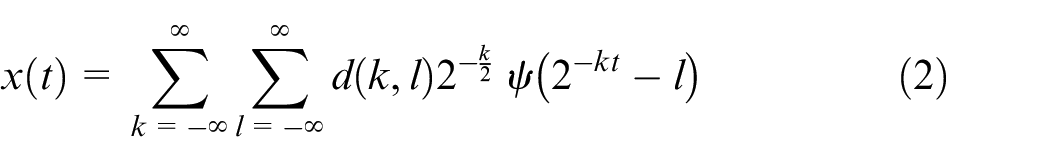
The equation for CWT (equation (1)): b: translation of the function over x(t), “ψ”: wavelet function, *: the complex conjugation operation, “1”/√(|“a”|): a normalization factor confirming the energy for all values of a. But the main problem of CWT, it is highly redundant and provides oversampling of the main waveform, so more coefficients are generated. In this situation, DWT is more suitable because it produces non-redundant and bilateral transformations. The equation for DWT (equation (2)): k is correlated with a = 2k, b is correlated with l equal to b = 2kl, d (k,l): a sampling of w(a,b) on k: discrete point and “ψ”: wavelet function,
In this study, the original signal EGG was decomposed with Daubechies wavelets (“db3”) up to the fifth level, which was found to be the optimal wavelet. Five detail signals (D1–D5) and five approximate signals (A1–A5) were reconstructed from the coefficient matrices. The horizontal axis shows the number of samples and the vertical axis shows the normalized amplitude (Figure 2).
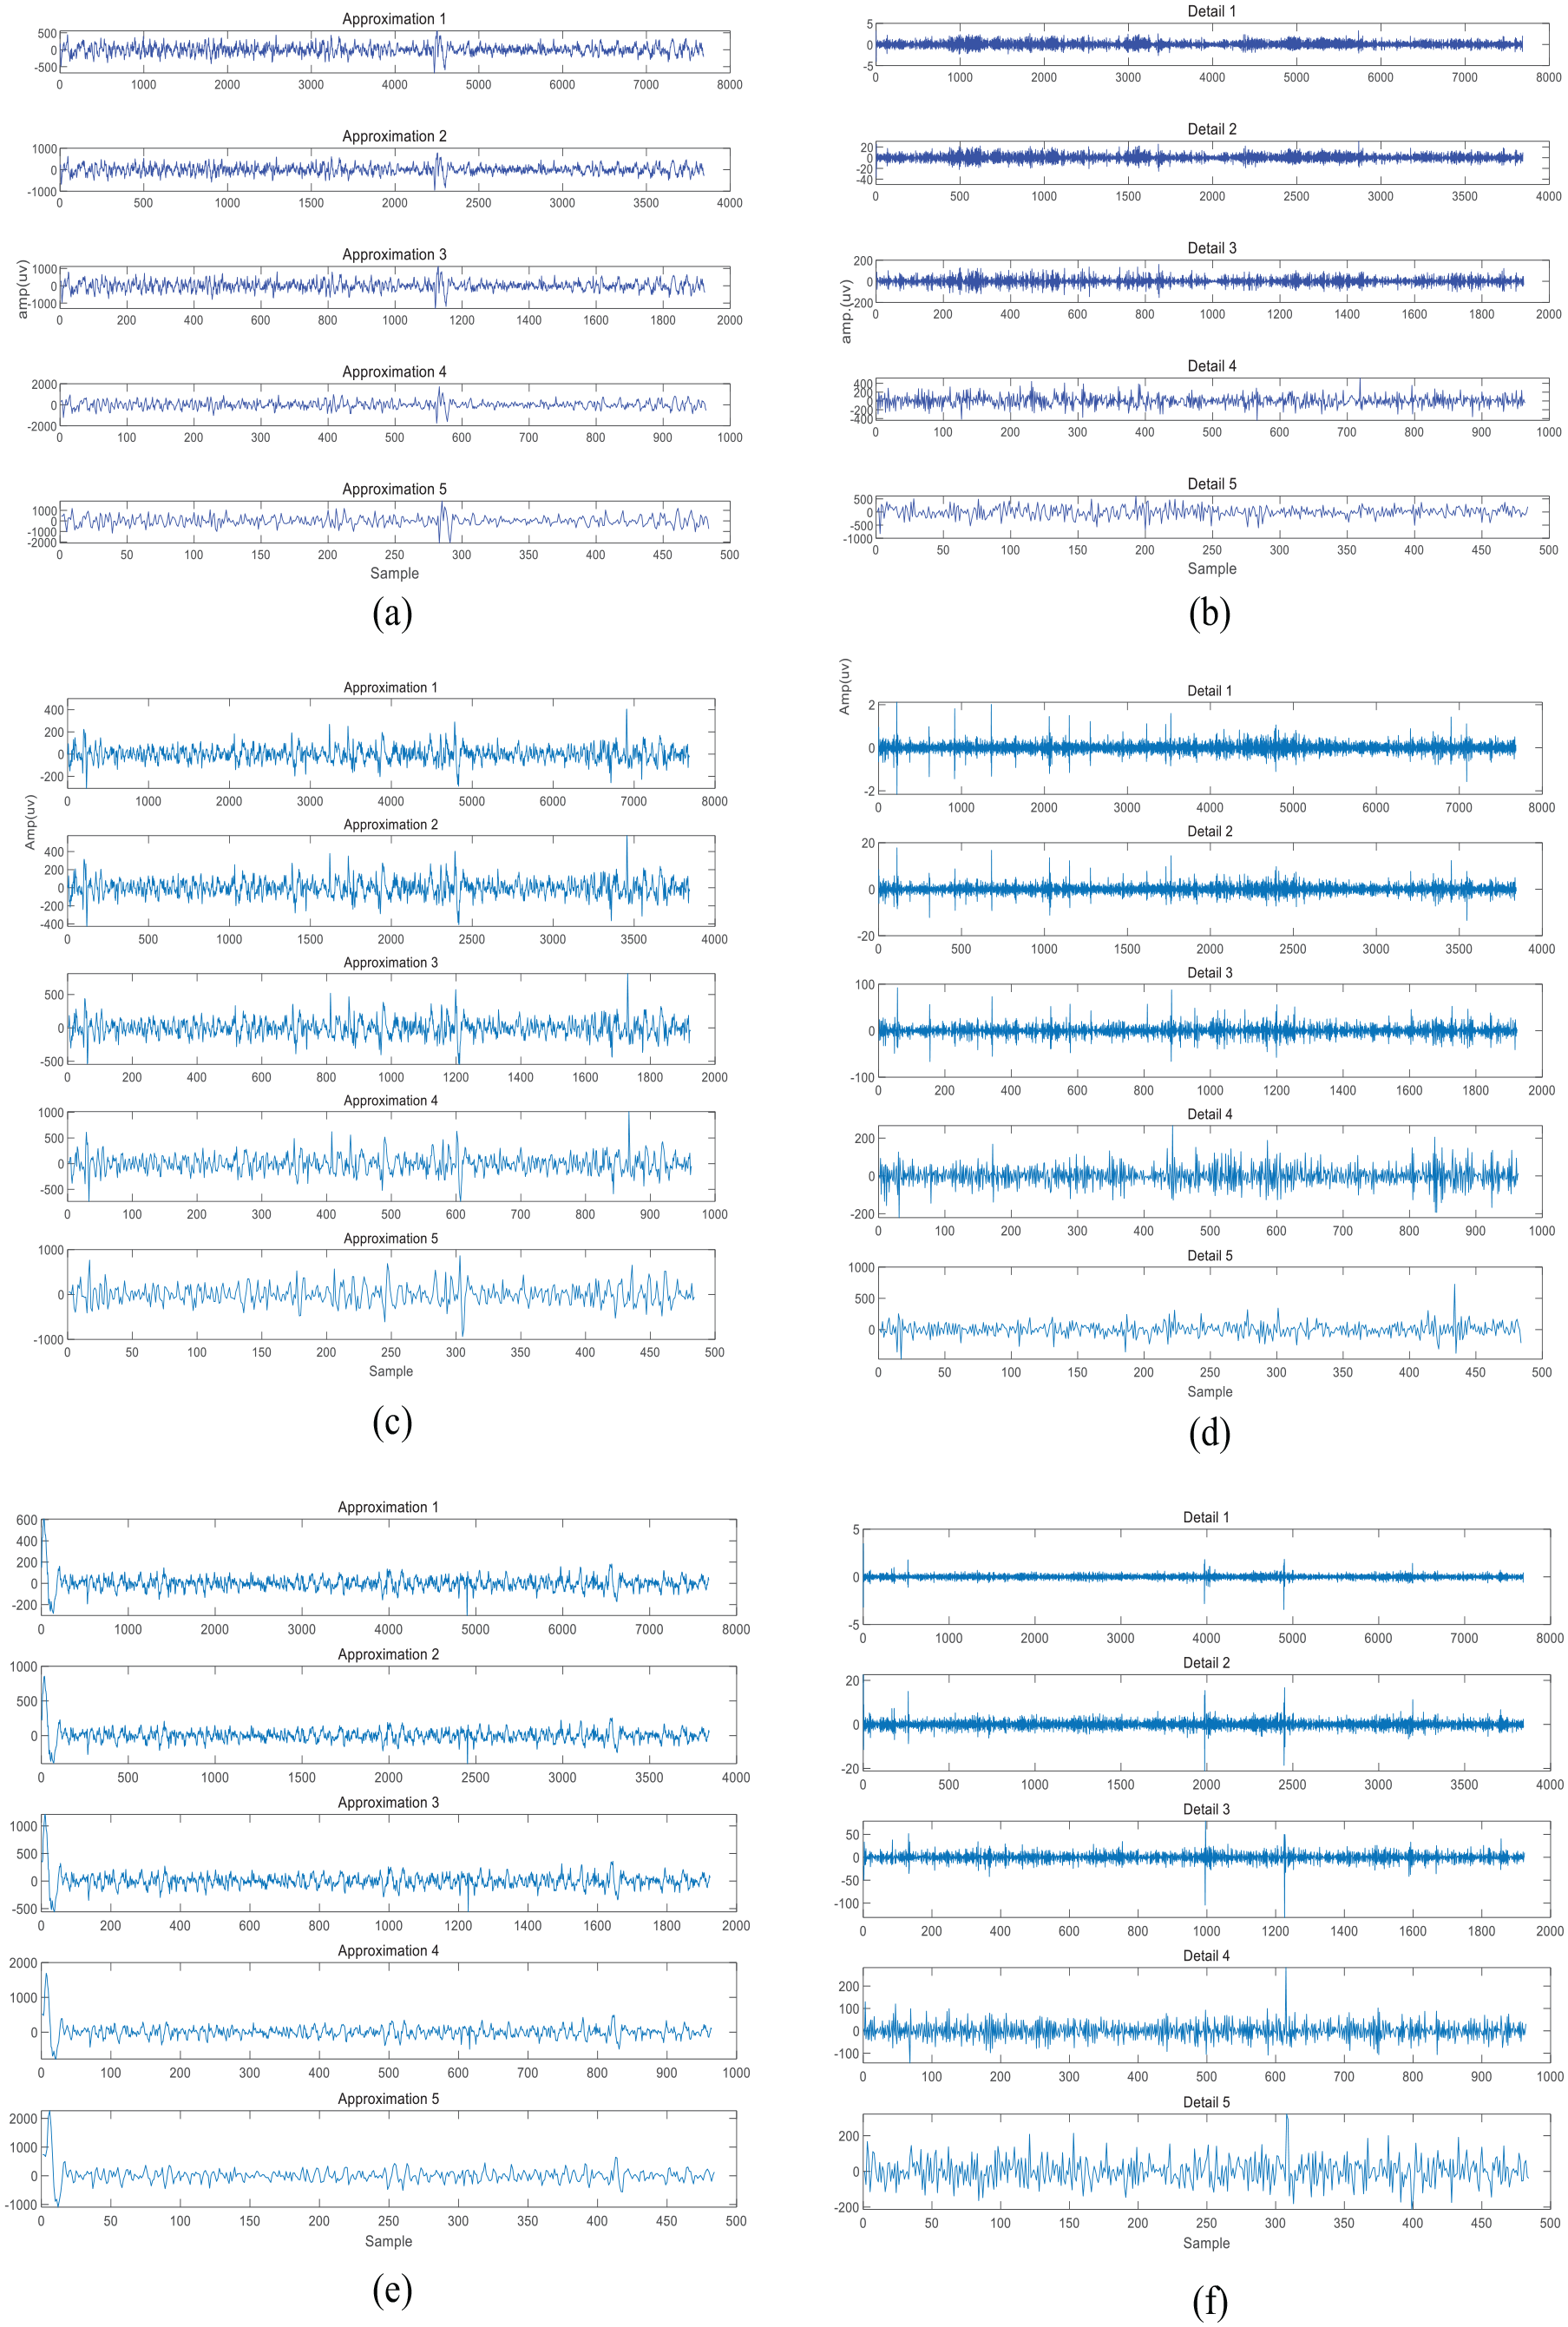
Electrogastrographic parameters that yielded the best results of participants from the FD, D-GP, and CT groups (a) approximation coefficients of the signal from EGG in a CT subject. (b) Detail coefficients of the signal from EGG in a CT subject. (c) Approximation coefficients of the signal from EGG in an FD subject. (d) Detail coefficients of the EGG signal in an FD subject. (e) Approximation coefficients of the EGG signal from a D-GP subject. (f) Detail coefficients of the EGG signal from a D-GP subject.
Then, different approximation and detail coefficients were calculated for each of these signals. The maximum values for each of these approximation (A1–A5) and detail (D1–D5) coefficients were calculated and referred to as max values. The minimum values of each of these approximation (A1–A5) and detail coefficients (D1–D5) were calculated and referred as Min values. The mean values of each of these approximate values (A1–A5) and detailed coefficient signals (D1–D5) were calculated and referred to as mean values. The median values of each of these approximate (A1–A5) and detailed coefficient (D1–D5) signals were calculated and referred to as median values. The area under the curve of each approximate (A1–A5) and detailed coefficient (D1–D5) was calculated and referred to as summed values. For discrete signals such as these, the area is obtained by summing the individual discrete values.
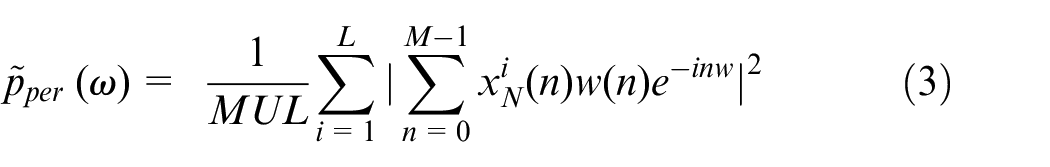
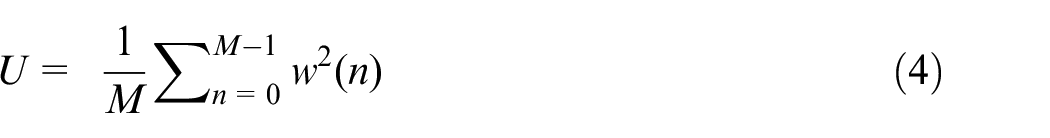
Then, the power spectral density (PSD) for each DWT set of approximation (A1–A5) and detail coefficient signals (D1–D5) was calculated using Welch’s method.22,24 The Welch method can be expressed as follows: Where U are the power standardization factors, x_N^i are the number of I segments of the signal length, a total of L units with M overlays, and w (n) are the Hamming window functions of length M. The Welch method for evaluating the PSD parameters was as follows: The data were divided into eight segments; the Hamming window was applied to each. Possibly 128 samples were used for overlap and an FFT was performed for 256 points. The horizontal axis shows the frequency, and the vertical axis shows the amplitude of the power spectral density (Figure 3). Then, the Welch PSD of each coefficient signal was calculated as minimum, maximum, mean, median, and sum. Finally, all parameters of the FD, D-GP, and CT groups were statistically compared using a one-way comparison ANOVA, with the significance level set at p < 0.05. In addition, the accuracy of the EGG signal was estimated by ANN using the Alyuda Neuro Intelligence program (Alyuda Corp.). Five different learning algorithms were used for comparison, as they are the most common approaches: Batch-Back Propagation (BBP), Quick Propagation (QP), Conjugate Gradient Descent (CGD), Quick Back Propagation (QBP), and Levenberg-Marquardt (LM) training algorithms in the multilayer networks used in the training phase. All signal processing and statistical analyzes were computed using MATLAB software (Math Works Inc., Natick, MA, USA).
Electrogastrographic parameters that yielded the best results of participants from the FD, D-GP, and CT groups. (a) PSD signals of the approximation coefficients computed from the EGG signal of a CT subject (b) PSD signals of the detail coefficients computed from the EGG signal of CT subject. (c) PSD signals of the approximation coefficients computed from the EGG signal of a FD subject. (d) PSD signals of detail coefficients computed from the EGG signal of a FD subject. (e) PSD signals of approximation coefficients computed from the EGG signal of a D-GP subject. (f) PSD signals of detail coefficients computed from the EGG signal of a D-GP subject.
Results
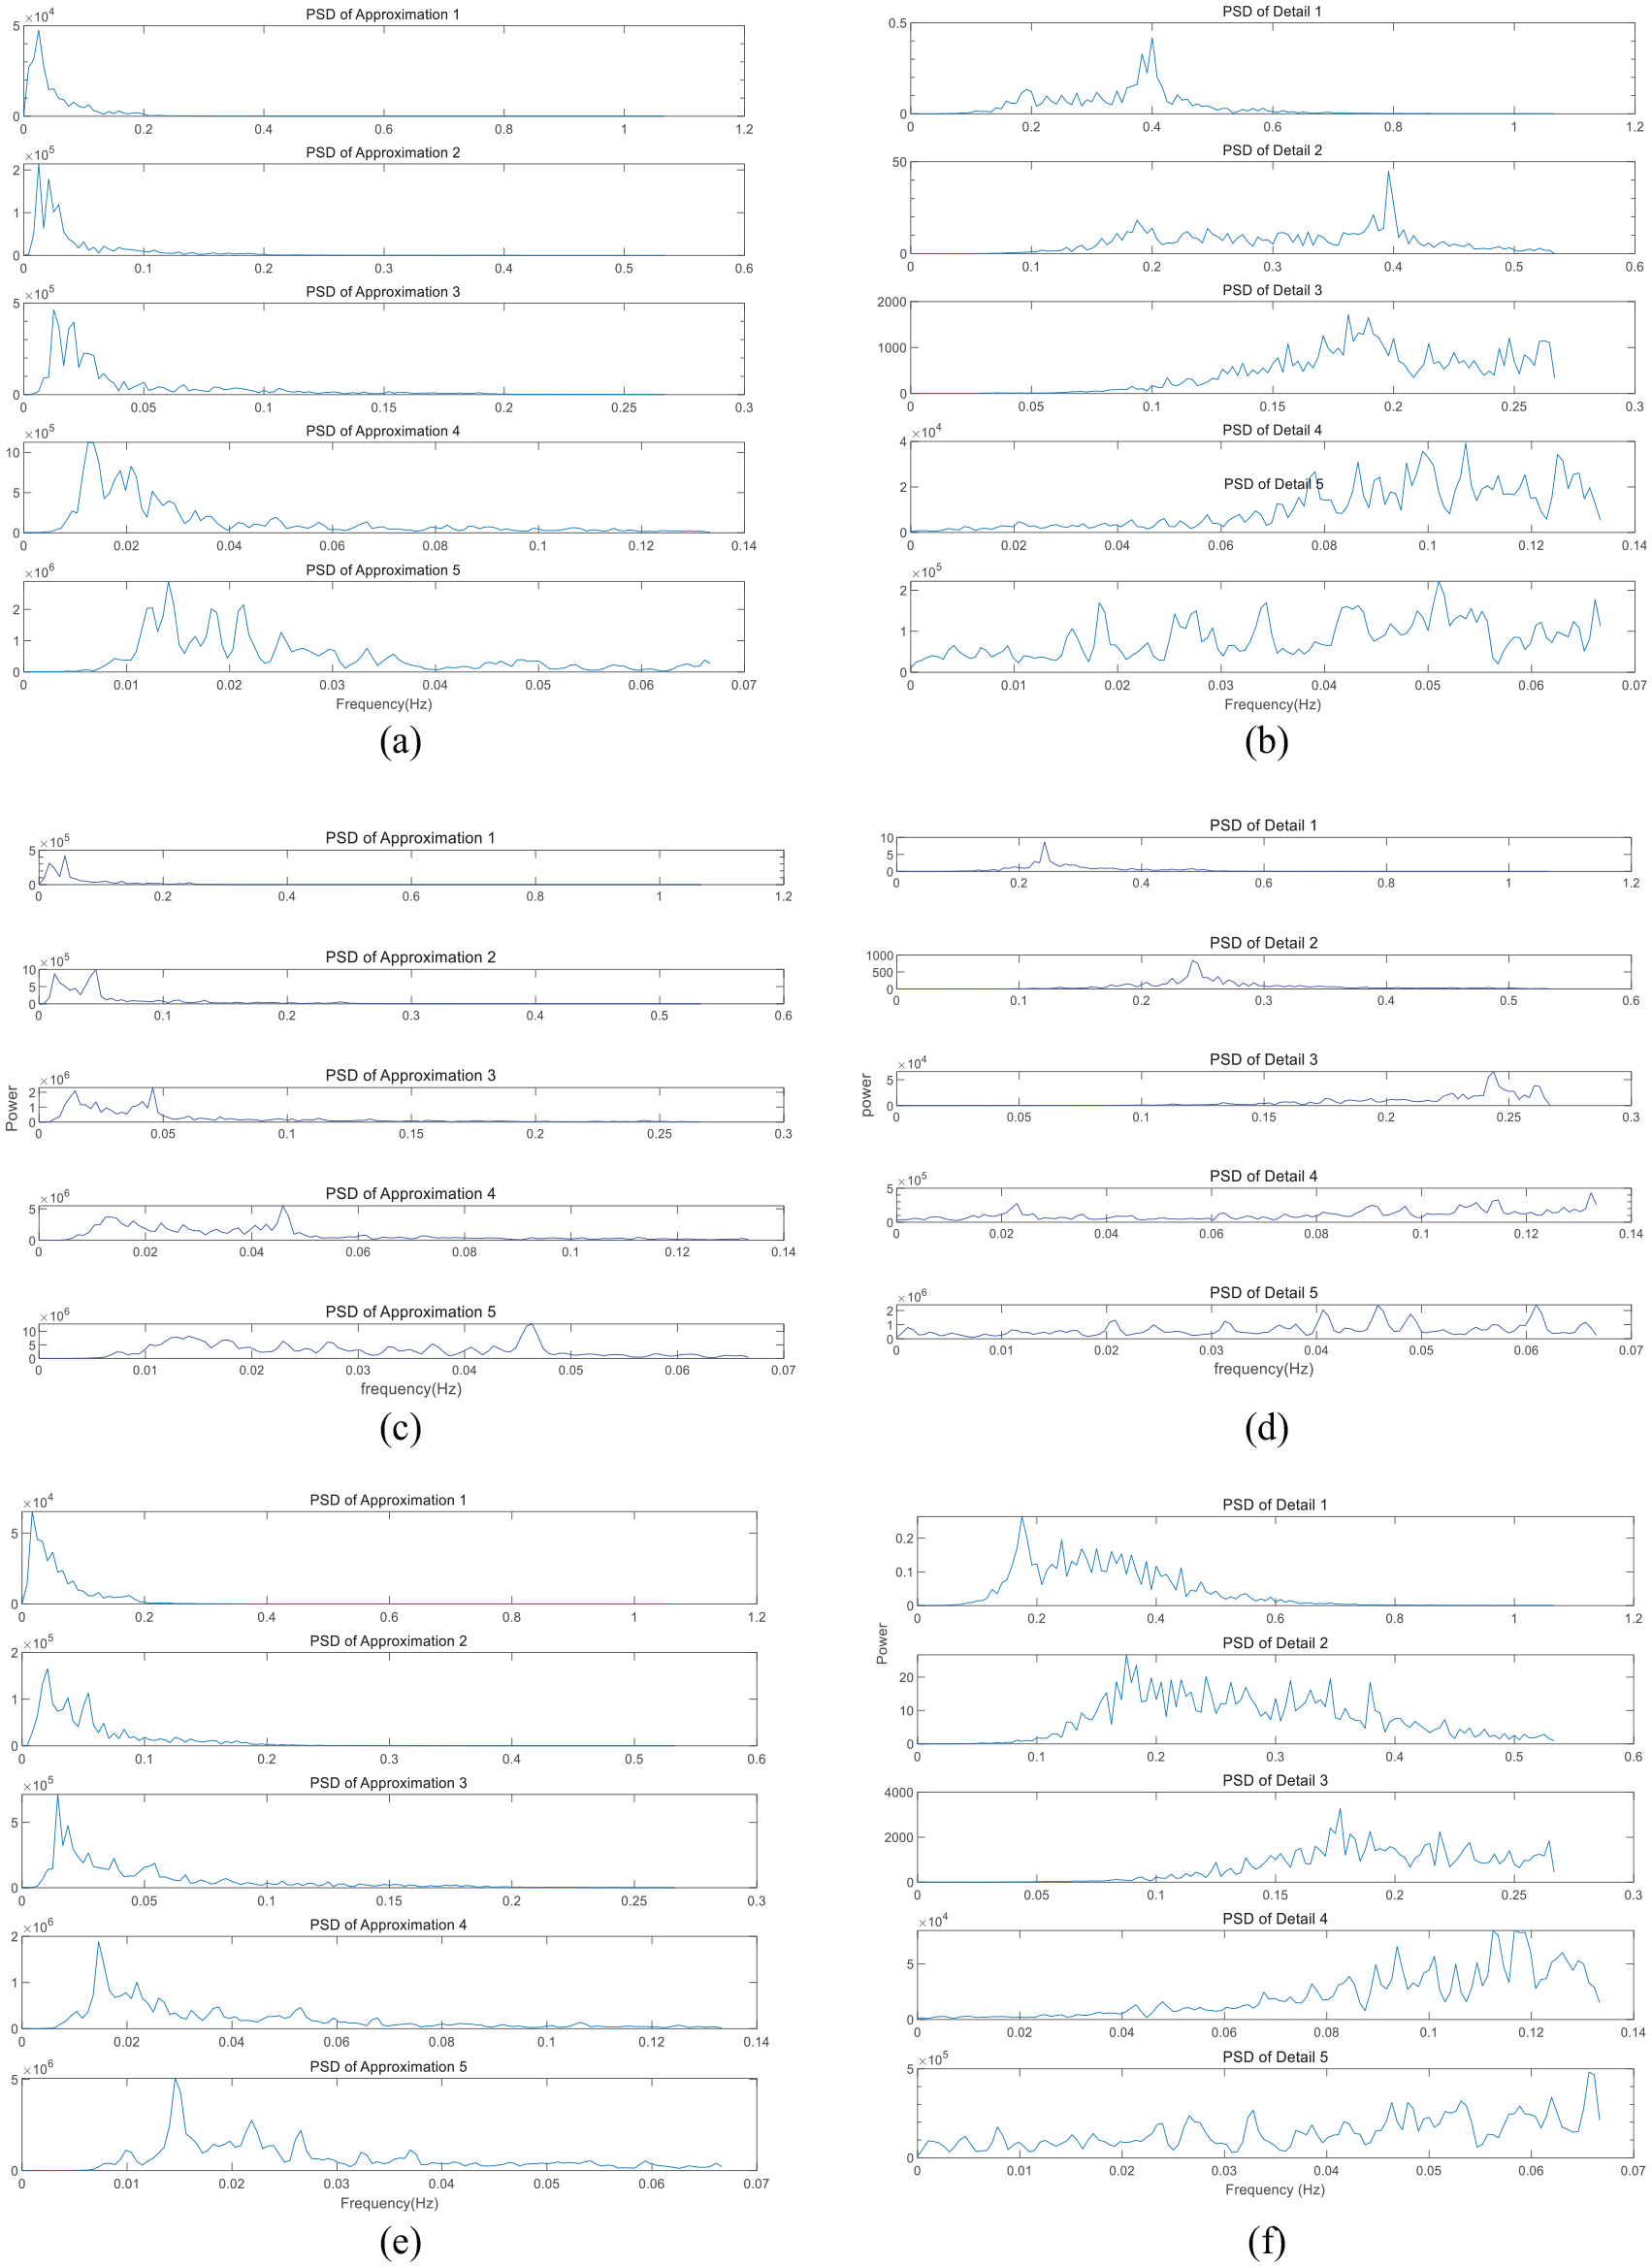
This study was performed on a total of 150 female subjects. Demographic characteristics and blood test parameters of three groups were analyzed simultaneously. Only glucose level (p = 0.04*) was statistically significant between the three groups (Table 1). In addition, no significant differences were found between EGG and the presence of FD, D-GP, and CT symptoms such as abdominal discomfort, epigastric pain, early fullness, heartburn, and vomiting. In both the pre-prandial and postprandial periods, EGG signals were decomposed to the fifth level using Daubechies wavelets. A total of five sets of DWT, detail (D1–D5) and approximation coefficients (A1–A5) were obtained. Then, the PSD values of each DWT coefficient (A1–A5, D1–D5) max, min, mean, median, and sum were recalculated for each group. In the ANN model, the values of A1, A2, A3, A4, A5, D1, D2, D3, D4, and D5 obtained from the subjects were used as input. In total, our ANN model has 10 inputs and 1 output value. In increasing the number of hidden layer neurons we use to find the best network model, the exhaustive search method is used. Each of the 50 network structures tested was run 10 times and the inverse test error rate was used as the suitability criterion for our model. Accuracy indicates whether or not the model correctly classified the instances. In addition to accuracy, sensitivity indicates the percentage of positive instances correctly classified, while specificity indicates how well negative instances are predicted by the model.19,20 The statistical results for the percentage accuracy (AC), specificity (SP), and sensitivity (SE) of all five different models are given respectively: QP (AC: 77%, SP: 39%, SE: 75%), CGD (AC: 76%, SP: 48%, SE: 71%), LM (AC: 81%, SP: 47%, SE: 71%), QBP (AC: 72%, SP: 25%, SE: 81%), and BBP (AC: 76%, SP: 40%, SE: 96%). Finally, ANOVA was used to evaluate the differences in EGG data between groups D-GP, FD, and CT.
The demographic and basic characteristics of groups FD, D-GP, and CT. The intensification of symptoms in each of the studied groups (Total N = 150).
The pre-prandial
According to the results of the pre-prandial condition, groups FD, D-GP, and CT showed a lower incidence of statistically significant values, Max p values : [D1(0.012), D3(0.033), and D4(0.003)], Min p values [A1(0.005), A2(0.012), A3(0.004), A5(0.002), and D5(0.014)], Moreover, the values of median and sum coefficients have no statistically significant difference. In addition, there are controversial results were shown in PSD values higher incidence of statistically significant, Max p values :[A2(0.038), A4(0.046), D1(0.014), D3(0.047), and D4(0.018)], Min p values: [A1(0.008), A3(0.043), A5(0.007), D2(0.038), and D4(0.01)], Mean p values: [A2(0.043), A3(0.045), D1(0.020), D2(0.018), and D5(0.024)], Median p values: [A2(0.013), A3(0.012), A4(0.028), D2(0.015), and D5(0.022)], and sum of p values: [A1(0.043), D1(0.020), D2(0.018), and D4(0.022)] (Table 2).
The comparison between the CT, FD, and D-GP groups with respect to ANOVA test at pre-prandial condition.
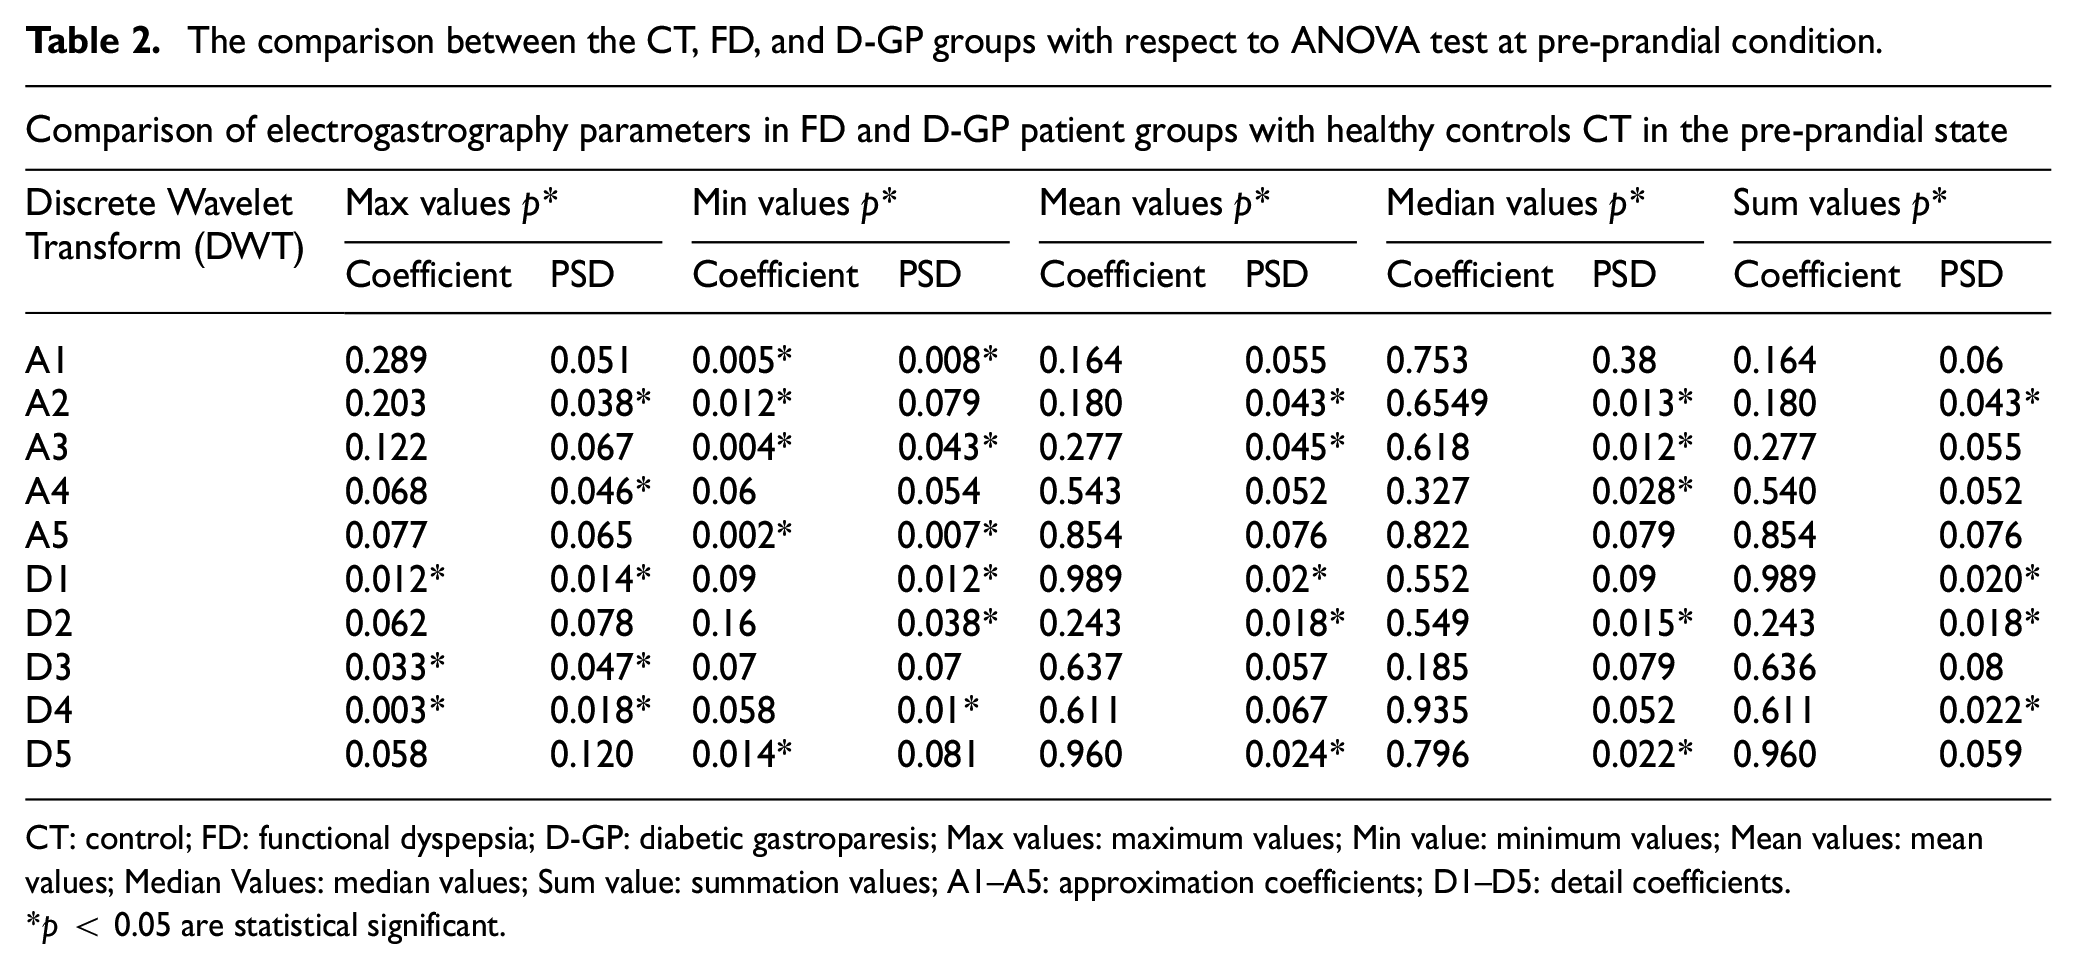
CT: control; FD: functional dyspepsia; D-GP: diabetic gastroparesis; Max values: maximum values; Min value: minimum values; Mean values: mean values; Median Values: median values; Sum value: summation values; A1–A5: approximation coefficients; D1–D5: detail coefficients.
p < 0.05 are statistical significant.
The postprandial
According to the results of postprandial condition, groups FD, D-GP, and CT showed a lower incidence of statistically significant maximum p values: [A1(0.044), A3(0.046), A4(0.038), A5(0.043), D3(0.040), D4(0.006), and D5(0.041)], Min p values: [A1(0.009), A2(0.008), A3(0.005), A4(0.004), A5(0.005), D4(0.014), and D5(0.01)], and Mean p values: [D2(0.031)]. The median and sum values also showed no statistically significant difference. Moreover, PSD values showed controversial results, all coefficients of Max, Min, Mean, Median, and Sum values showed higher occurrence of statistically significant values (p < 0.05; Table 3).
The comparison between the CT, FD, and D-GP groups with respect to ANOVA test at postprandial condition.
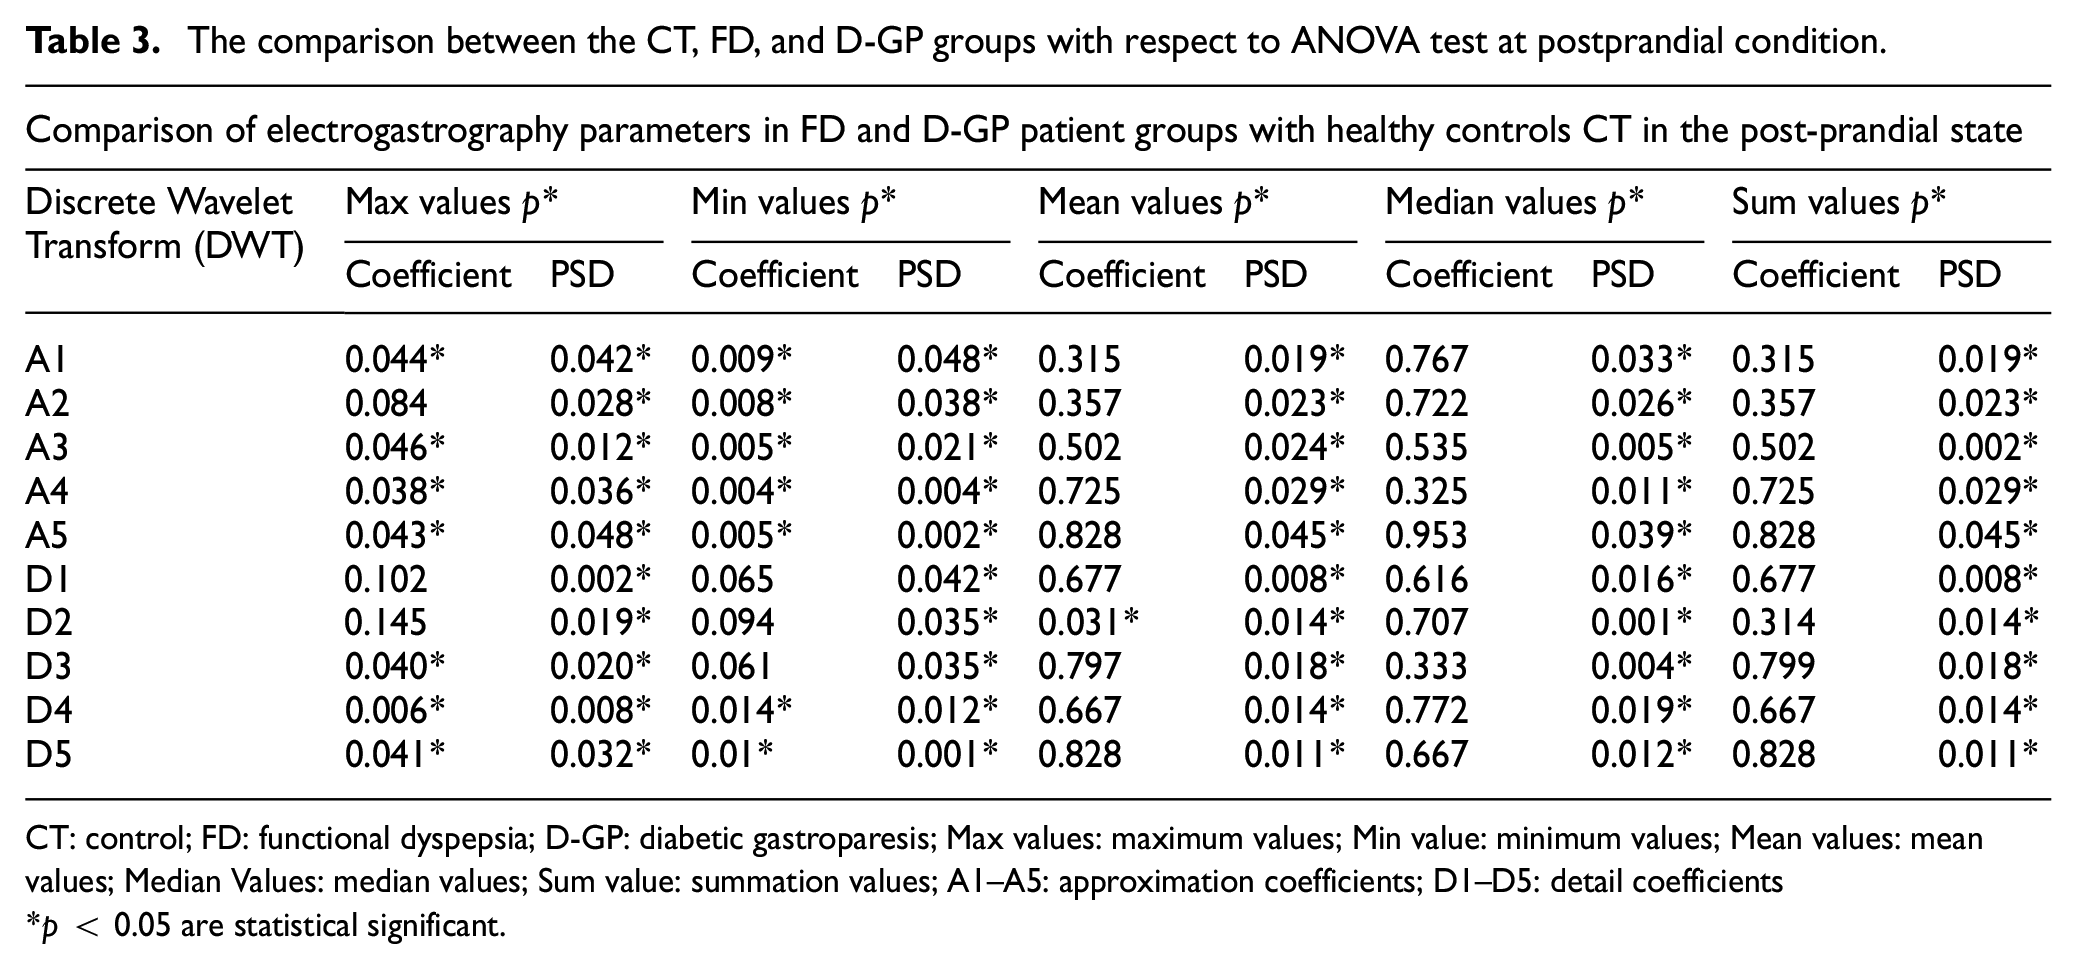
CT: control; FD: functional dyspepsia; D-GP: diabetic gastroparesis; Max values: maximum values; Min value: minimum values; Mean values: mean values; Median Values: median values; Sum value: summation values; A1–A5: approximation coefficients; D1–D5: detail coefficients
p < 0.05 are statistical significant.
Discussion
Functional dyspepsia (FD) and diabetic gastroparesis (D-GP) are common gastrointestinal disorders with multiple underlying pathogenetic mechanisms. Because of the lack of knowledge about the specific mechanism leading to FD and D-GP, researchers often use indirect internal measurements or surface methods EGG. Cutaneous electrogastrography has not yet been able to identify the exact diseases, but it also attempts to correlate the changes observed in various unexplained gastric diseases with the gastric electrical rhythm and the effect of drugs on the gastrointestinal tract. In the literature, EGG has been sporadically studied in cancer patients,2,25 brain death or coma patients, 26 gastroparesis patients,9,13,27 functional dyspepsia patients,4,17 children with CNS patients, 28 electrical gastric activity in premature and newborn infants, 29 and pregnant women with vomiting and nausea. 30 In this study, the disorders of gastric myoelectric activity in patients with FD and D-GP were analyzed.
The role of gastric myoelectric mechanisms and delayed gastric emptying has not yet been clearly defined. Although physiological abnormalities were well documented in these studies, their association with symptoms was not clearly defined. 12 However, studies using manometer and EGG in FD and D-GP patients have reported that antral hypomotility, electrical activity changes and delayed gastric emptying are important mechanisms.12,13 The absence of fundal relaxation increases intragastric pressure and causes the displacement of nutrients from the proximal end to the distal end. This leads to antral excessive distension and leads to the development of upper abdominal discomfort, distention, and nausea.12,25 In addition, increased sensitivity to gastric distension due to visceral hyperalgesia also plays a role in the development of these symptoms. 25 Causes of delayed gastric emptying in FD and D-GP patients may be gastric hypomotility and uncoordinated gastric contractions due to irregular gastric slow waves, as well as insufficient increase in the amplitude of postprandial gastric slow waves. Such factors can be evaluated by gastric myoelectric activity.12,13,25 Treatment regimens should primarily target the underlying pathophysiology. 29 Prokinetic agents have been shown to improve EGG abnormalities in patients with gastroparesis.27,31 Therefore, EGG results may be helpful in treatment selection in some cases.
Despite the improvements that electrogastrography has undergone in the last 20 years, there are still some limitations. The multifaceted dynamic nature of EGG signals, such as time-frequency analysis, test meal, electrode position, recording duration, and biomagnetic field pattern recognition, could be combined to obtain an accurate diagnostic result. Since the focus of this study is on the feature selection mechanisms, to evaluate the diagnostic protocol of EGG analysis, a methodology to decompose the EGG signals into the DWT coefficients and the PSD of the DWT coefficients on the D-GP, FD, and control groups is performed, and large-scale features such as min, max, mean, median, and sum values of each coefficient are also calculated. In addition, there are many issues regarding the selected wavelet for EGG signal analysis. Therefore, in recent years, researchers have used the discrete wavelet transform (DWT) for EGG signal analysis because it overcomes the problem of segmenting the signals.11,22,32 The most important part of wavelet analysis is the appropriate selection of wavelets and the number of decomposition stages for the extraction of EGG features. Several authors have worked with different wavelet analysis, for example, Barroso-Alvarado et al. 18 used db4 wavelet analysis for the EGG signal, Nagendra et al. 33 presented a summary of specific wavelet techniques, namely CWT, DWT, Stationary WT and Fractional WT. Many other studies applied “db3” for EGG signals to detect gastric arrhythmias,9,11,22 Chacón et al. 17 used fourth order Daubechies wavelet coefficients to evaluate signals from healthy and dyspepsia patients EGG, Sobral Cintra et al. 32 showed that fitting a wavelet for EGG signals found with the standard “db3” to the fifth level wavelet provided the optimal parameterization values. In this study, “db3” was found to be the optimal wavelet for EGG signals at the fifth level and our results are partially consistent with other studies. The above results prove that calculating the signal energy of different data sets in the postprandial state based on PSD, detail and approximation coefficients are higher occurrence of statistically significant values (p < 0.05) than pre-prandial state. Thus, we can demonstrate that adequate gastric motility responds to the meal. In addition, different ANN algorithms were used in this study and the results show that the LM algorithm provides the highest accuracy of 81% in classifying the EGG signals. Agrusa et al. 20 used a CNN network to discriminate normal and abnormal slow gastric wave patterns from EGG data with 90% accuracy. Liang et al. 34 used clustering for feature extraction, an accuracy of 83.33%, and an SVM algorithm to detect delayed gastric emptying from EGG with an accuracy of 88.2%. Nanivadekar et al. 35 predicted vomiting and gastrointestinal status in ferrets and achieved an accuracy of 84.69% and 88.57% using the KNN and SVM algorithms, respectively. All of the above studies classified two classes of signals and distinguished between normal (normogastric) and abnormal (bradygastric or tachygastric) EGG signals.
Conclusions and future works
We propose here a complete procedure for recording and analyzing the EGG of FD, D-GP, and CT subjects in a moderate pre-prandial and postprandial state to identify the frequency and regularity of gastric rhythm over time so that it can be attributed with confidence to the stomach. Our joint methodology has shown that EGG assessments of FD and D-GP patients differ from healthy controls in terms of gastric motility abnormalities. We demonstrate that our datasets showed adequate gastric motility responses to a meal and the correlations between EGG metrics and the presence of FD, D-GP symptoms were inconsistent. We believe that future research and consumer medical devices that combine evaluation of EGG with other physiological channels will provide more meaningful information on gastric motility disorders for better treatment and monitoring of gastrointestinal diseases.
Footnotes
Acknowledgements
Abdullah Al Kafee and Yusuf Kayar are especially grateful to the Scientific and Technological Research Council of Turkey (TÜBİTAK) for the International Scholarship for Outstanding Researchers. We would like to thank Prof. Dr. Mehmet Aydin from Bezmialem Vakif University Hospital, Department of Nuclear Medicine for his support.
Declaration of conflicting interests
The author(s) declared no potential conflicts of interest with respect to the research, authorship, and/or publication of this article.
Funding
The author(s) disclosed receipt of the following financial support for the research, authorship, and/or publication of this article: This study was funded by The Scientific & Technological Research Council of Turkey (TÜBİTAK) Grant No. 113E605.
Ethical approval
All procedures performed in studies involving human participants conformed to the ethical standards of the institutional and/or national research committee and the 1964 Declaration of Helsinki and its subsequent amendments or comparable ethical standards. Ethical approval for the conduct of the study was obtained from the Ethics Committee of Bezmialem Vakif University, Faculty of Medicine (ethics approval number: 71306642/050-01-04/31). This article does not include studies with animals performed by any of the authors.