
Abstract
A digital-twin based three-tiered system is proposed to prioritise patients for urgent intensive care and ventilator support. The deep learning methods are used to build patient-specific digital-twins to identify and prioritise critical cases amongst severe pneumonia patients. The three-tiered strategy is proposed to generate severity indices to: (1) identify urgent cases, (2) assign critical care and mechanical ventilation, and (3) discontinue mechanical ventilation and critical care at the optimal time. The severity indices calculated in the present study are the probability of death and the probability of requiring mechanical ventilation. These enable the generation of patient prioritisation lists and facilitates the smooth flow of patients in and out of Intensive Therapy Units (ITUs). The proposed digital-twin is built on pre-trained deep learning models using data from more than 1895 pneumonia patients. The severity indices calculated in the present study are assessed using the standard benchmark of Area Under Receiving Operating Characteristic Curve (AUROC). The results indicate that the ITU and mechanical ventilation can be prioritised correctly to an AUROC value as high as 0.89. This model may be employed in its current form to COVID-19 patients, but transfer learning with COVID-19 patient data will improve the predictions. The digital-twin model developed and tested is available via accompanying Supplemental material.
Introduction
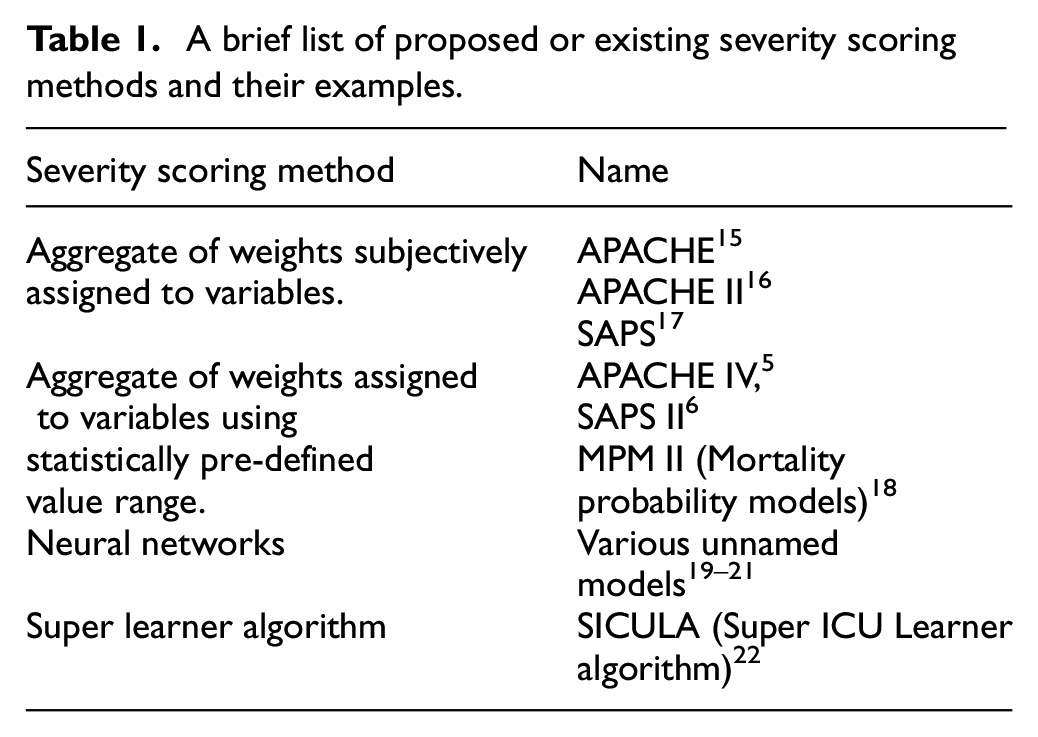
The COVID-19 pandemic 1 has put an unprecedented stress on the already strained healthcare infrastructure.2,3 This situation has forced the healthcare providers to prioritise patients in critical need to access Intensive Therapy Units (ITU) and mechanical ventilation. Some of the currently used scoring systems for patient prioritisation include SOFA (Sepsis-related Organ Failure Assessment), 4 APACHE (Acute Physiology and Chronic Health Evaluation), 5 and SAPS II (simplified acute physiology score). 6 These systems (see Table 1) have been validated over time for analysis of intensive care treatments.7–10 In recent past, several works have been published on severity scoring using neural networks and other machine learning algorithms.11–13 Majority of these algorithms were trained on large ITU datasets to calculate severity scores, covering a wide range of diseases and medical conditions. Such systems, though valuable during normal times, may not be sufficiently specific to address the current pandemic. In the case of COVID-19 (and in other similar forms of influenza), more precise and dynamically evolving system may be necessary to address the sudden increase in severity and the need for mechanical ventilation. With more mutations of the virus being identified over time, 14 an evolving knowledge of the disease severity of each virus variant has become extremely important. A robust and dynamically adaptable model that takes into account the progression of severity over the course of care, which may be different for different variants of the disease, is therefore urgently needed.
A brief list of proposed or existing severity scoring methods and their examples.
A human digital-twin is one such model, widely used in other areas,23–25 which is a digital replica of a human system or sub-system. This replica is a personalised digital representation, in terms of structure or functioning or both, of an individual or patient’s system. It can provide real-time feedback on how a patient’s health is likely to vary based on their current known condition using periodic input data from the patient’s vitals (such as heart rate, respiration rate). The severity scores calculated by these digital replicas (models), personalised to every patient using the individual’s vitals and other readings, can form the basis for prioritising potential pneumonia patients for ITU and mechanical ventilation.
The three-tiered strategy of identify, assign and discontinue, as shown in Figure 1, is employed in the present work to produce a patient priority list. The three-tiers are: (1) identify urgent cases amongst those awaiting care, (2) assign mechanical ventilation to critical cases amongst patients receiving care, and (3) discontinue mechanical ventilations and other care at the optimal time, thereby freeing-up vital resources. In the present work, each of these steps are enabled by artificial neural network models, a type of artificial intelligence system, that are well established for complex diagnosis with unprecedented levels of accuracy.26–29 These methods require significant amount of data for training and testing. However, acquiring, de-identifying and indexing huge amounts of COVID-19 patient data from ITU is currently challenging. Hence, to expedite progress, a transfer learning 30 approach is adopted. In such approaches, artificial neural networks are trained using large amounts of data from similar backgrounds to that of COVID-19. The trained model can be bolstered, known as transfer learning, with smaller amounts of COVID-19 data, when available, to improve accuracy. Since the background data used here is from pneumonia patients, the model proposed should be representative of severe COVID-19 patients. All the artificial neural networks used in the three tiers of Figure 1 together forms an individual patient’s digital-twin system.
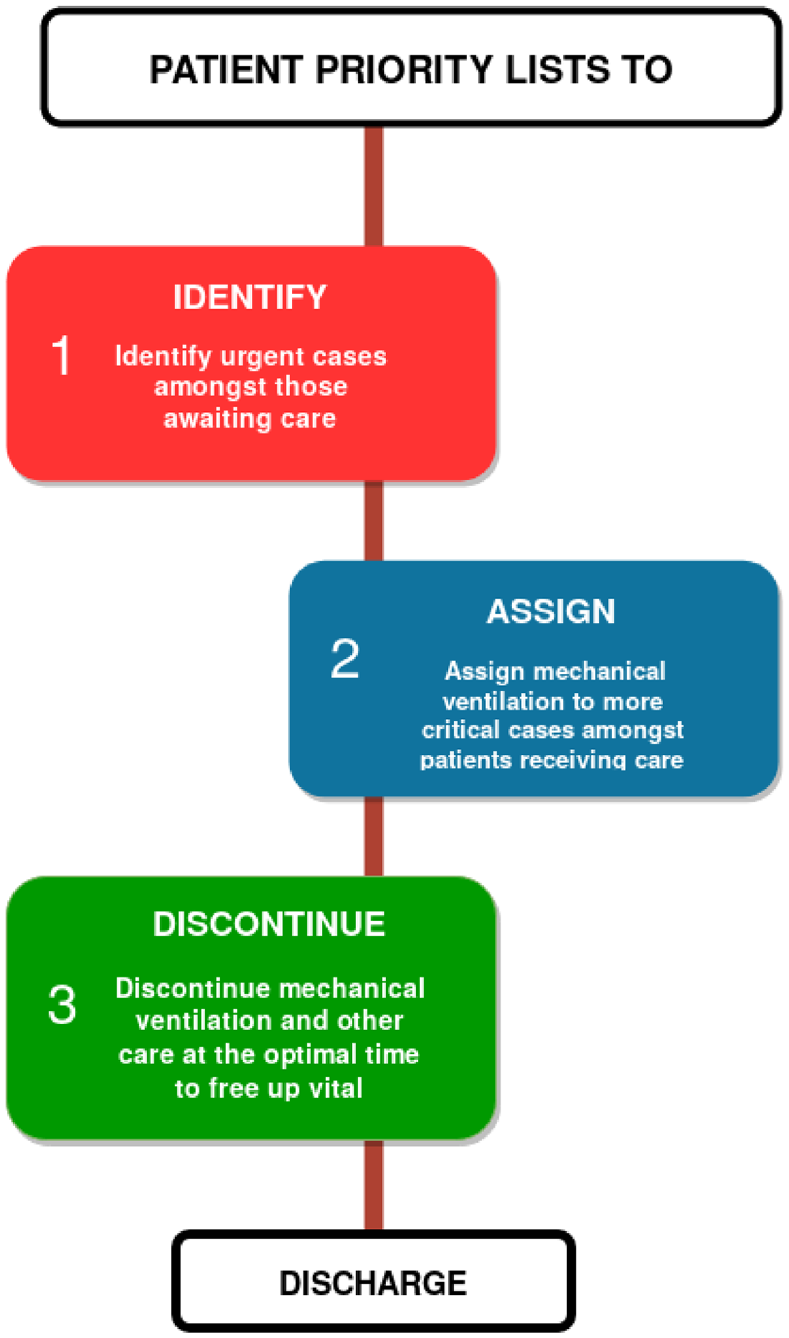
Three tiered patient prioritisation strategy to reduce mortality rate in intensive care units.
Methodology
An interconnected system, comprising multiple independent neural networks, designed to assist a concerted decision making process, is proposed. Independent severity indices are calculated at the three tiers shown in Figure 1 to assist in identifying cases that are severe but with a high chance of survivability. The indices used in each of the tiers are as follows (see Figure 1):
(i) Tier 1, Patients awaiting intensive care – (a) Difference between probabilities of death with and without mechanical ventilation support and (b) Probability of requiring mechanical ventilation.
(ii) Tier 2, Intensive care inpatients awaiting mechanical ventilation support – (a) Probability of death (based on data from continuous monitoring of vitals), (b) Probability of requiring mechanical ventilation support (based on data from continuous monitoring of vitals), and (c) Severity indices used in Tier 1.
(iii) Tier 3, Discontinuation of mechanical ventilation support amongst inpatients – (a) Probability of requiring mechanical ventilation support (based on data from continuous monitoring of vitals) and (b) Probability of death (with consideration of mechanical ventilation data).
Within each tier, based on probabilities calculated, thresholds can be set by the ITU professionals for decision making. Independent severity score thresholds can be set within each tier to allow situations in which different stages of ITU care may be needed at different healthcare units or settings (Example – A patient moving from one hospital to another).
Data selection and pre-processing
Primary sources of data used in this work are from MIMIC-III22,31 and eICU Collaborative Research Database v2.0,32,33 obtained from PhysioNet. 34 MIMIC III is a publicly-available database comprising de-identified health-related data associated with approximately 60,000 admissions of patients who stayed in critical care units of the Beth Israel Deaconess Medical Centre between 2001 and 2012. eICU Collaborative Research Database v2.0 is multi-centre database comprising de-identified health data associated with over 200,000 admissions to ITUs across the United States between 2014 and 2015 (see Table 2). Both of these databases consist of various vital sign measurements, de-identified information on patient stay, diagnosis information, records of medical procedures carried out, drugs administered, and various other intensive care information.
Baseline characteristics of subset selected from eICU Collaborative Research Database v2.0.
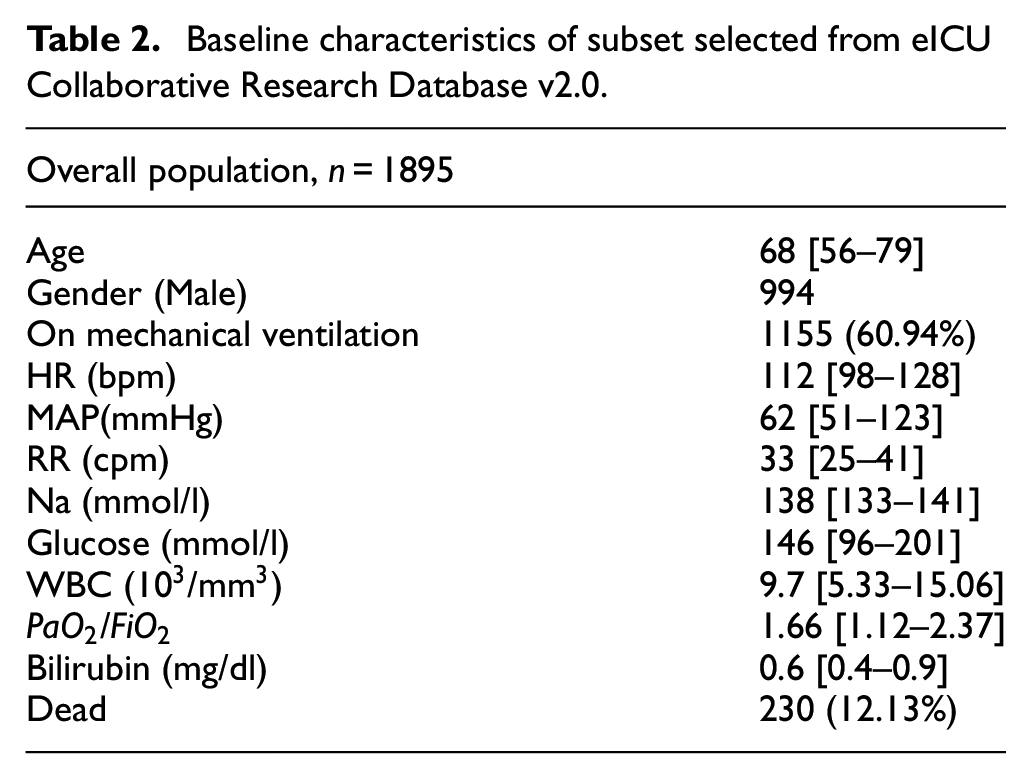
Since severe COVID-19 patients suffer from pneumonia, 35 the selection and aggregation of data here is based on critical symptom of pneumonia. Therefore, various subsets of MIMIC-III and eICU databases with pneumonia are chosen for training. All patient data with missing vital information are ignored. The subsets chosen are:
Pneumonia Mortality subset – Patients who suffered from any form of pneumonia. This subset included both survived and died cases at the time of discharge.
Pneumonia Ventilator subset – This consists of all survived patients at the time of discharge, but suffered from some form of pneumonia.
In the case of MIMIC-III database, a total of 493 ITU stays of pneumonia patients were considered. Patient data with available matching and admissible quality waveform data (collected from MIMIC-III matched waveform subset) were considered. Out of which, 211 (42.79%) stays required mechanical ventilation and 95 (19.26%) stays resulted in death.
Neural networks and architecture
The proposed three-tiered system is constructed primarily using multiple independent neural networks. However, the type of neural networks used can be classified into two categories, Multilayer Perceptron (MLP) and Recurrent Neural Networks (RNN). Artificial neural networks may be used to perform functions such as classification and prediction. MLP models use a series of cascaded non-linear transformations of weighted coefficients, as shown in Figure 2(a), to perform these functions. The MLPs typically accept discrete values as inputs. In the case of patient data, some examples of discrete inputs are patient gender, blood glucose level, and sodium levels. These input values can be used to calculate the probability of death and the probability of a patient requiring mechanical ventilation.
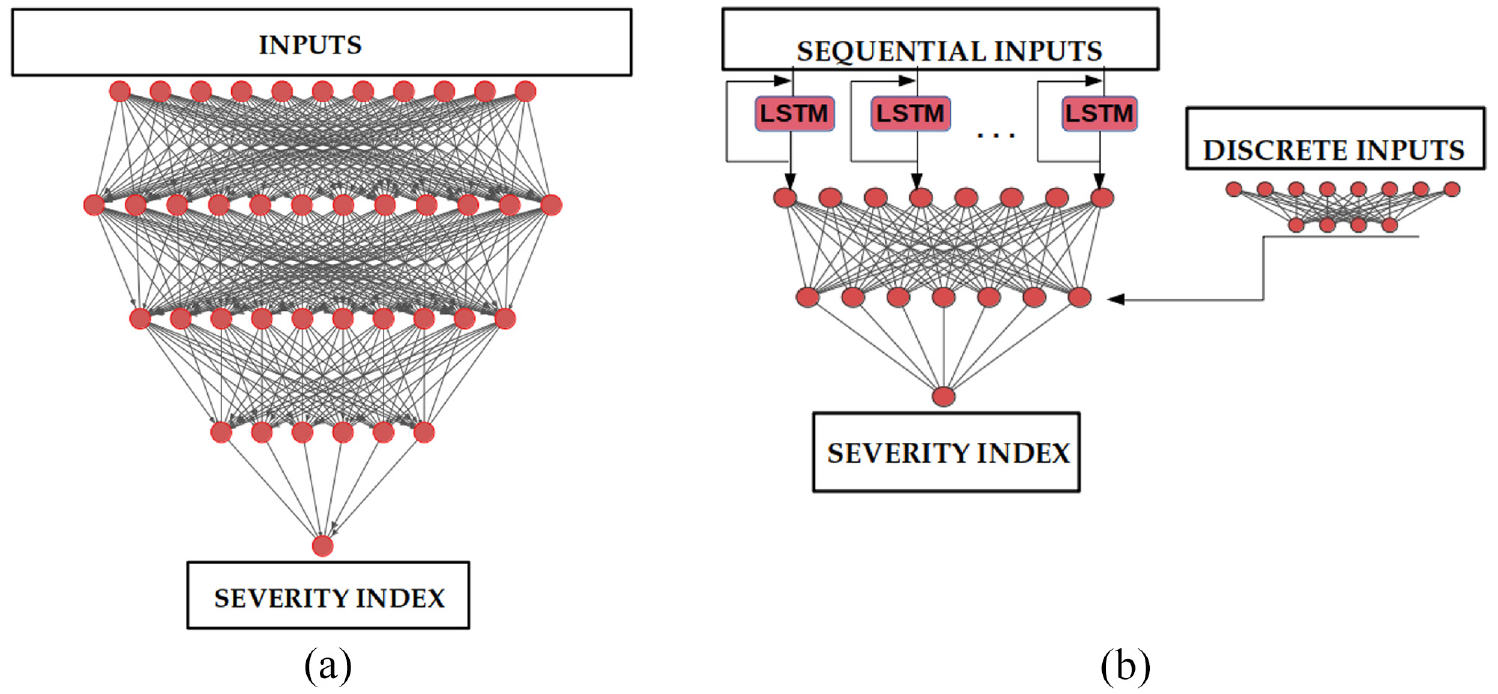
Multilayer Perceptron (MLP) and Recurrent Neural Networks (RNN) for calculating severity indices: (a) MLP and(b) RNN.
An RNN, a type of neural network, is capable of handling time series or other sequential input and/or output data. In ITU, waveforms (time series) of body vitals measured are examples of sequential input. A special type of RNN is a Long Short-Term Memory (LSTM) cell.36–38 In order to predict or classify patients, LSTM cells are designed to ‘retain’ and/or ‘forget’ parts of input data sequence(s). These abilities make them the appropriate choice of neural networks to calculate severity indices and assess patient criticality continuously or at regular time intervals. The RNN based models used in the present work use a combination of sequential and discrete value inputs. As seen in Figure 2(b), a combination of LSTM cell layer and additional MLP model is used to predict severity index of interest using fully connected neural layers. All models were built using Tensorflow library, 39 using Keras 40 library, on Python.
The MLP Models consisted of three dense hidden layers. These layers are non-linearly activated using either Rectified Linear Unit (ReLU) functions. Depending on the severity index to be predicted, the input layer consisted of 21–22 input parameters. As the final value being predicted in these models is a single value between 0 and 1, an output layer with single neurone and sigmoid activation is used. Detailed architecture of MLP models and training parameters are provided in Supplemental Appendix A.
In the case of RNN based models, sequential input data was processed by a network model with single or double LSTM layer(s). These layers use input arrays with eight input parameters. Discrete inputs are processed by an independent network model with a 21–26 input parameters, depending on the severity index. The outputs of these networks are then merged and fed to final model activated with ‘ReLU’ functions. Similar to the MLP models, the final model has an output neurone with sigmoid activation. Dropouts and activity regularisers, were used in these models to avoid over-fitting. A detailed description of RNN based model architectures and training parameters have been provided in the Supplemental Appendix B.
The discrete input data was standardised within a similar range. All MLP models were trained and cross-validated on data subsets chosen from eICU Collaborative Research Database v2.0. All RNN based models were trained on the MIMIC-III database, owing to the waveform datasets available in them. Datasets were split into training (80%) and testing dataset (20%). Cross-validation of models were carried out on the training to tune the hyper parameters and analyse model performance using K-fold method, for which the training dataset was divided into 10-folds.
Tier 1-“Identify”: Identification of ill patients amongst those awaiting intensive care
Since this class of patients are not monitored continuously, data obtained within 24 h of hospital admission is used. A subsystem of two MLP models were trained on a subset containing pneumonia patient data from eICU Collaborative Research Database v2.0 database. One was used to predict the probability of death, and the other for calculating the probability of requiring mechanical ventilation.
The first model was trained on ‘Pneumonia mortality subset’, consisting of 1895 patients and the second model was trained on ‘Pneumonia ventilator subset’, consisting of 1665 patients. The 20 input fields chosen for the first MLP are age, gender, ventilation status (a binary value), intubation status (a binary value), dialysis status (a binary value), heart rate, respiration rate, Glasgow coma scale, white blood cells (WBC) count, blood glucose levels, partial pressure of oxygen in arterial blood (
Using the predicted severity indices, a patient priority list may be generated to admit patients with more urgent need for care into ITU. Since mechanical ventilation is the indication of severity in COVID-19 patients, probability of requiring mechanical ventilation is the primary severity index in preparing such a list. The patients with similar probabilities of requiring ventilation are prioritised using difference between probabilities of death, with and without ventilation. The probability of death with mechanical ventilation may also be used to further refine the prioritisation list. The prioritised patients in Tier1 may be admitted to the ITU and the prioritisation list may be further refined in Tier 2 for providing mechanical ventilation.
Tier 2-“Assign”: Identifying and providing mechanical ventilation support amongst intensive care patients
The patients selected from Tier 1 to go into ITU can now be continuously monitored. However, with limited number of mechanical ventilators it becomes a necessity to provide this support to the more urgent cases. To identify urgent cases amongst the inpatients in an ITU, a continuous monitoring based severity index is required. The primary severity indices used here are probability of requiring mechanical ventilation support (based on continuous monitoring) and probability of death (based on continuous monitoring). The RNN based model shown in Figure 2(b) is used to predict these severity indices. The sequential (continuous) inputs used here are heart rate, pulse, systolic and diastolic blood pressures, respiration rate, and spot oxygen saturation (
Tier 3-“Discontinue”: Identifying patients who can discontinue mechanical ventilation support
The patients identified in Tier 2 to receive mechanical ventilation can now undergo continuous monitoring to decide when to discontinue treatment. The probability of requiring mechanical ventilation support (based on continuous monitoring of patient) and probability of death (considering continuous ventilation support) are used as the indices to safely remove the mechanical ventilation support. The RNN used in Tier 2 with similar inputs is continued here to observe the probability of still requiring mechanical ventilation support. The patients with probability of requiring mechanical ventilation lower than a set threshold may be removed from the ventilator support. To reduce the risk of false negatives, probability of death is also monitored in this tier. An additional RNN based model is trained to take ventilator settings along with the inputs used in Tier 2 to predict probability of death. The additional input fields include positive end-expiratory pressure (PEEP), required
Results and discussion
All three tiers discussed in the previous section together form the digital-twin of a patient. A total of five independently trained neural network models take the measured patient vitals and provide various severity indices as output. All models in the present work are designed with ease of use in mind. Many healthcare units lack the state of the art IOT (Internet of Things) based health monitoring systems or face issues with platform compatibility. Manual inputting of data, including time dependent sequential inputs, would be necessary in units where electronic recording capabilities are unavailable. Thus, all inputs are designed to allow manual intervention (see Supplemental Information). The MLP models are designed to take, the most severe value for each input field, within a 24 h period. All RNN based models require two types of inputs, discrete input fields once every 24 h period, that are most severe, and all sequential input fields such as heart rate,
Performance measures
All models, performing classification to calculate probabilities, are evaluated using the Area Under Receiving Operating Characteristic Curve (AUROC), reported with corresponding 95% confidence interval. Receiving Operating Characteristic (ROC)42,43 curve is a probability curve. Performance is measured using the AUROC. It represents the degree of separability between classes. In the context of the present work, this separability represents the difference between severe and not so severe cases, for each severity index. Higher AUROC represents better performance. The parameters used to estimate AUROC are true and false positive rates. The graphs representing ROC are plotted for false positive rate (one-specificity) versus true positive rate (sensitivity). At AUROC of 0.5, the model loses its discrimination capacity to distinguish between classes. It is represented by a dashed diagonal line in the figures below for reference.
Tier 1-“Identify”
Here, two MLP models are used to predict the probability of death and the probability of requiring mechanical ventilation using patient vital data, measured over a period of 24 h. The AUROC obtained over the total dataset are respectively shown in Figure 3(a) and (b). An AUROC of 0.89 (95% CI: 0.88–0.91) is obtained for the probability of death and 0.84 (95% CI: 0.82–0.86) is obtained for the probability of requiring mechanical ventilation. Cross-validated accuracy scores of 0.86 (SD: ±0.005) and 0.70 (SD: ±0.055), respectively, were obtained in these models on the training dataset. Furthermore, an accuracy score of 0.88 and 0.72 over the testing dataset. Figure 3(a) also shows APACHE IV score with a predicted probability of death with an AUROC of 0.72. Thus, the proposed approach appears to be a substantially better predictor. The model shows that the probability of death and the probability of requiring ventilation with respectively 86% and 85% chances of accurate prediction. From the data computed, a patient prioritisation list for ITU admission may be created by calculating
Difference in probabilities of death with and without mechanical ventilation.
Probability of death with mechanical ventilation.
Probability of requiring mechanical ventilation support.
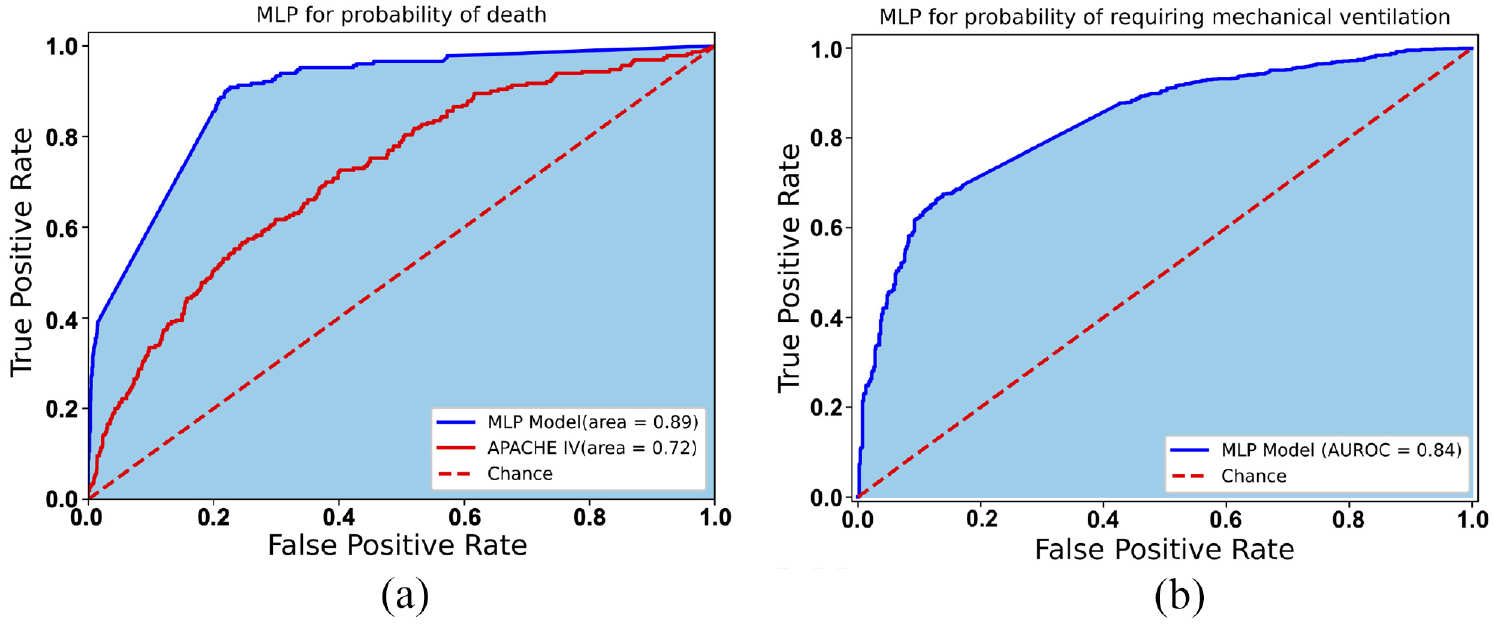
AUROC (shaded area) curve for MLP models used to predict the probability of death and the probability of requiring mechanical ventilation support: (a) probability of death and (b) probability of requiring mechanical ventilation.
Tier 2-“Assign”
The inpatients within ITUs, whose vitals are continuously monitored, can be assessed for severity of lung disease periodically using the RNN model. As seen in Figure 4(a), an AUROC of 0.86 (95% CI: 0.81–0.90) is obtained from the model for the probability of death, over the entire dataset. The probability of requiring mechanical ventilation is calculated with an AUROC of 0.83 (95% CI: 0.79–0.86) as shown in Figure 4(b). These models obtained a cross validated accuracy scores of 0.73 (SD: ±0.04) and 0.74 (SD: ±0.12) respectively. Furthermore, accuracy scores of 0.82 and 0.71 respectively were obtained over the testing dataset. This indicates that with continuous or regular inputs of measured vitals (heart rate, respiration rate,
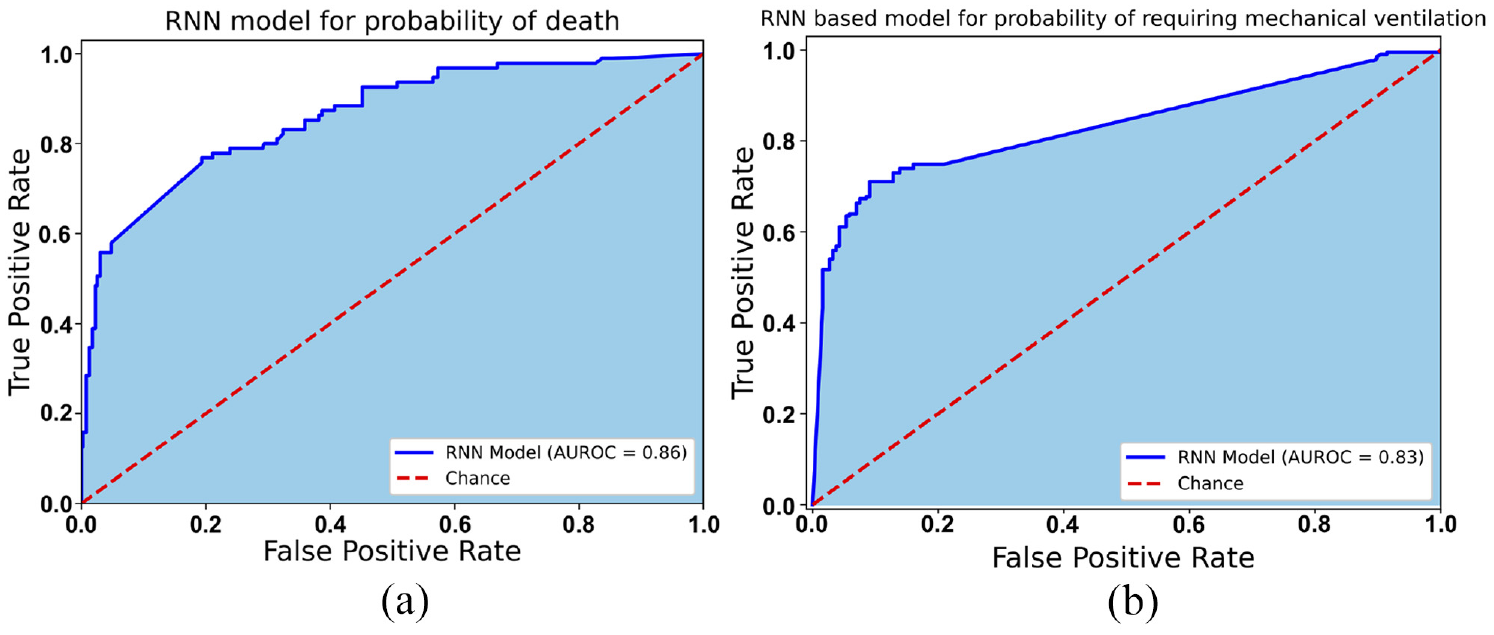
AUROC (shaded area) curve for RNN based model results of the probability of death for patients and the probability of requiring mechanical ventilation support: (a) probability of death and (b) probability of requiring mechanical ventilation.
Tier 3-“Discontinue”
For patients in ITU an approach for the probability of death must be calculated by including the mechanical ventilation. Unlike the RNN based model used in Tier 2, the model here includes mechanical ventilator settings along with the other inputs to calculate the probability of death. As seen in Figure 5, the model performed classification with an AUROC of 0.89 (95% CI: 0.85–0.93) over the entire dataset. This model obtained a cross validated accuracy score of 0.81 (SD: ±0.025) and testing accuracy score of 0.80. This severity index is required to support the probability of still requiring mechanical ventilation support. A combined analysis of probability of requiring mechanical ventilation support and death is necessary to reduce the chances of erroneous decisions of early removal of support. If both indices are substantially low, the mechanical ventilation may be discontinued.
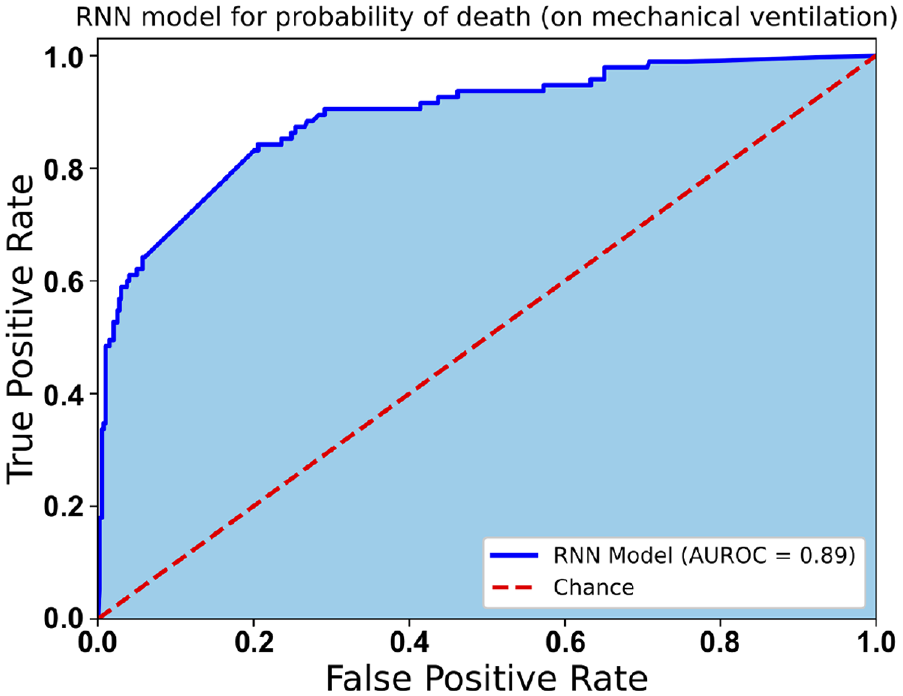
ROC curve for RNN based model used to predict probability of death for patients in Tier Three.
Conclusions
The digital-twin system proposed in the present study to construct a subject-specific digital twin appears to provide better results than existing scoring methods. Although the data used to train the models is for non-COVID-19 patients with pneumonia, the similarity of the data to COVID-19 patients appears to be strong. Thus, the proposed digital-twin can be used as a starting point to further refine the scoring system. Overall, the accuracy of prediction is excellent with a minimum AUROC of 0.8 in all cases. By adapting transfer learning on emerging COVID-19 data, this accuracy may be substantially enhanced for severe COVID-19 patients.
Supplementary material provided with this manuscript makes the code open to everyone to download and train on additional data. With further refinement by the community and our own research group, we believe that the model will serve the healthcare community to deal not only with the COVID-19 pandemic but any future influenza patient prioritisation.
Supplemental Material
sj-zip-1-pih-10.1177_09544119221123431 – Supplemental material for An AI based digital-twin for prioritising pneumonia patient treatment
Supplemental material, sj-zip-1-pih-10.1177_09544119221123431 for An AI based digital-twin for prioritising pneumonia patient treatment by Neeraj Kavan Chakshu and Perumal Nithiarasu in Proceedings of the Institution of Mechanical Engineers, Part H: Journal of Engineering in Medicine
Footnotes
Appendix A: MLP models
The neural network architecture of the MLP models used in Tier one and the parameters employed during training are presented in this section. Table A describes the training parameters used along with the activation functions employed. Figure A1 are graphical representations of the two models used in the first tier.
In Figure A1, L1 (
The performance of the model is shown in Figure A2. This figure shows the loss seen over epochs, averaged over 10-folds, during training. The convergence of training and validation losses confirm an optimal fitting of the model. Figure A3 shows the calibration curve for the three models, showing close to a perfect calibration.
Appendix B: RNN based models
The neural network architecture of the MLP models used in tiers 2 and 3, and the parameters employed during training are presented in this section. Table B describes the training parameters used along with the activations functions employed. Figures B1 and B2 are graphical representations of the three RNN models used in the tiers 2 and 3.
The performance of the model is shown in Figure B3. This figure shows the loss seen over epochs, averaged over 10-folds, during training. The convergence of training and validation losses confirm an optimal fitting of the model. Figure B4 shows the calibration curves for the three models, showing close to a perfect calibration.
In Figures B1 and B2, all dropout layers have 30% dropout except for the RNN model used in predicting probability of requiring mechanical ventilation in which the dropout is 50%. All weights were initialised, during training, with Glorot Normal function.
Declaration of conflicting interests
The author(s) declared no potential conflicts of interest with respect to the research, authorship, and/or publication of this article.
Funding
The author(s) disclosed receipt of the following financial support for the research, authorship, and/or publication of this article: The second author acknowledges partial support from Ser Cymru III - Tackling Covid 19 fund, Welsh Government Project number 095.
Supplemental material
Supplemental material for this article is available online.
References
Supplementary Material
Please find the following supplemental material available below.
For Open Access articles published under a Creative Commons License, all supplemental material carries the same license as the article it is associated with.
For non-Open Access articles published, all supplemental material carries a non-exclusive license, and permission requests for re-use of supplemental material or any part of supplemental material shall be sent directly to the copyright owner as specified in the copyright notice associated with the article.